addressing child hunger and obesity in indian country ... · addressing child hunger and obesity in...
TRANSCRIPT

Addressing Child Hunger and Obesity in Indian Country: Report to Congress
Final Report
January 12, 2012
Anne Gordon Vanessa Oddo
Contract Number:AG-3198-K-11-0055
Mathematica Reference Number: 06964.308
Submitted to: Office of Research and Evaluation Food and Nutrition Service 3010 Park Center Drive Alexandria VA, 22302 Project Officer: Dennis Ranalli
Submitted by: Mathematica Policy Research P.O. Box 2393 Princeton, NJ 08543-2393 Telephone: (609) 799-3535 Facsimile : (609) 799-0005 Project Director: Liz Potamites
Addressing Child Hunger and Obesity in Indian Country: Report to Congress
Final Report
January 12, 2012
Anne Gordon Vanessa Oddo

Indian Children and USDA Programs Mathematica Policy Research
iii
CONTENTS
EXECUTIVE SUMMARY ....................................................................................................... vi
I INTRODUCTION ...................................................................................................................... 1
II HUNGER AND NUTRITION-RELATED HEALTH PROBLEMS AMONG AMERICAN INDIANS .............................................................................................................. 5
A. Food Insecurity ................................................................................................................... 5 B. Overweight and Obesity ..................................................................................................... 6
1. Overweight and Obesity Among AI/ANs Nationally ................................................. 6 2. Factors Associated with Overweight and Obesity ...................................................... 9
C. Type II Diabetes ................................................................................................................ 12
1. Type II Diabetes Among American Indians and Alaska Natives
Nationally .................................................................................................................. 12 2. Type II Diabetes Among AI/ANs from Specific Tribal Areas ................................. 12 3. Factors Associated with Diabetes ............................................................................. 15
III FEDERAL FOOD ASSISTANCE PROGRAMS SERVING AMERICAN
INDIAN CHILDREN IN INDIAN COUNTRY ...................................................................... 17
A. Overview ........................................................................................................................... 17 B. Food Distribution Program on Indian Reservations ......................................................... 17 C. Supplemental Nutrition Assistance Program .................................................................... 19 D. Special Supplemental Nutrition Program for Women, Infants, and Children .................. 19 E. Child Nutrition Programs .................................................................................................. 21
IV OPPORTUNITIES FOR IMPROVED SERVICES UNDER THE HEALTHY, HUNGER-FREE KIDS ACT AND RELATED INITIATIVES .............................................. 22
A. Healthier Meal Options ..................................................................................................... 22 B. Increased Access to Food Assistance ............................................................................... 22 C. Let’s Move! in Indian Country ......................................................................................... 23

Indian Children and USDA Programs Mathematica Policy Research
iv
CONTENTS (CONTINUED)
REFERENCES ........................................................................................................................................... 24
APPENDIX A: DEFINING THE TARGET POPULATION .................................................................... 30
APPENDIX B: FOOD SECURITY MEASURES ..................................................................................... 32
APPENDIX C: OVERWEIGHT AND OBESITY MEASURES FOR CHILDREN ................................. 33

Indian Children and USDA Programs Mathematica Policy Research
v
TABLES
I.1 Characteristics of the American Indian and Alaska Native Population in the United States, 2010 ..................................................................................................................... 2
I.2 Characteristics of American Indians and Alaska Natives in 2000, Overall and in Indian Country ............................................................................................................................ 4
II.1 Food Insecurity Among American Indians and Alaska Natives ................................................. 6
II.2 Prevalence of Obesity Among American Indians and Alaska Natives in the United States ........................................................................................................................................... 8
II.3 Prevalence of Obesity Among American Indians in Specific Tribal Areas ............................. 11
II.4 Prevalence of Diabetes Among American Indians and Alaska Natives in the United States ............................................................................................................................. 13
II.5 Prevalence of Diabetes Among American Indians in Specific Tribal Areas ............................ 16
III.1 Characteristics of Federal Food Assistance Programs .............................................................. 18
III.2 American Indians and Alaska Natives Participating in WIC Programs Sponsored by Indian Tribal Organizations ................................................................................................. 20
C.1 Definitions of Overweight and Obese Terminology ................................................................. 33
C.2 Changes in Terminology ........................................................................................................... 33
FIGURES
I.1 Residence of AI/AN Population ................................................................................................. 3
II.1 Locations of Food Deserts and American Indian Reservations in the Contiguous United States ............................................................................................................................... 7
II.2 Prevalence of Type II Diabetes Among Youth Age 10-19 (per 1,000) .................................... 13
Indian Children and USDA Programs Mathematica Policy Research
vi
EXECUTIVE SUMMARY
American Indian (AI) and Alaska Native (AN) children have approximately twice the levels of food insecurity, obesity, and Type II diabetes, relative to the averages for all U.S. children of similar ages. Those living on or near reservations or other tribal lands (often referred to as Indian Country) have historically been particularly disadvantaged. Section 141 of the Healthy, Hunger-Free Kids Act of 2010 (HHFKA) requires that the Department of Agriculture (USDA) provide a report to Congress on USDA programs that serve AI children living in Indian Country and may reduce these risks. This report describes how USDA nutrition programs serve children in Indian Country and how provisions of HHFKA and other recent initiatives might improve those services.
The major USDA programs that serve children and families in Indian Country include the National School Lunch Program (NSLP); the Supplemental Nutrition Assistance Program (SNAP); the Special Supplemental Nutrition Program for Women, Infants, and Children (WIC); the Food Distribution Program on Indian Reservations (FDPIR); the Child and Adult Care Food Program (CACFP); and the Summer Food Service Program (SFSP). NSLP offers lunches free or at a reduced price to school children from low-income families. SNAP offers food assistance to low-income households in the form of debit cards that can be used to purchase food items at authorized retailers. WIC provides food packages to pregnant and postpartum women, infants, and children up to age 5 to meet their special nutritional needs as well as nutrition education, breastfeeding promotion and support, and referrals to health care and social service providers. The FDPIR provides USDA food packages to low-income AIs/ANs living in Indian Country who do not participate in SNAP. CACFP provides reimbursement for meals served to low-income children in child care settings. SFSP offers meals to children when schools are out. WIC and FDPIR are frequently administered by tribes themselves, whereas NSLP, SNAP, CACFP, and SFSP are administered by the States in which the reservations are located.
Based on data from the March 2009 Current Population Survey, the NSLP has the widest reach; about 550,000 children identified as AI/AN alone received free or reduced-price school lunches in an average month in 2008, and 328,000 children who identified as AI/AN and white. SNAP also serves a large number of AI/AN individuals; for example, it served 540,000 people who identified as AI/AN alone and 260,000 who identified as AI/AN and white in an average month in 2008. During an average month in 2008, WIC served approximately 126,000 individuals identified as AI/AN alone, and 85,000 who identified as AI/AN and white. FDPIR, which is available only to households living in Indian Country, served about 80,000 individuals per month in fiscal year 2011, based on administrative data. Specific data on the number of AI/AN children served in CACFP and SFSP are unavailable.
Several provisions of HHFKA would help USDA improve the nutritional quality of meals served to children in Indian Country or increase access to program benefits. The law required updating nutrition standards for USDA-subsidized meals in schools and child care settings. The USDA proposed rule for nutrition standards and menu planning in the NSLP and School Breakfast Program would be an important step in reducing risk of obesity and type II diabetes; for example, the new standards include restrictions on the fat content of milk and requirements to increase offerings of fruits, vegetables, and whole grains. The new law will also improve access to school meals by allowing schools in low-income areas more options for serving free meals to all students without requiring parent applications, which could improve food security among

Indian Children and USDA Programs Mathematica Policy Research
vii
children on reservations. USDA is one of the agencies sponsoring Let’s Move! In Indian Country, a public/private initiative to provide technical assistance and social marketing materials to parents, schools, and communities in Indian Country to encourage healthy eating and physical activity.

Indian Children and USDA Programs Mathematica Policy Research
I. INTRODUCTION
American Indians living on reservations or in other tribal areas (Indian Country) are among the most disadvantaged populations in the United States. The Healthy, Hunger-Free Kids Act of 2010 (HHFKA), section 141, requires the Department of Agriculture (USDA) to report to Congress on the ways that Federal nutrition programs can help overcome child hunger and nutrition problems on Indian reservations. To meet this requirement, this report addresses three questions:
1. What is the level of food insecurity, obesity, and Type II diabetes1 among American Indian children living in Indian Country?2
2. What is the scope and reach of Federal nutrition programs in Indian Country?
3. How can the HHFKA improve food security and reduce obesity and diabetes risk among American Indian children living in Indian Country?
Before addressing these issues, we briefly describe the population of American Indians (AIs) as a whole and those living in Indian Country. We define AIs, in general, as those who report American Indian as their race in the U.S. Census or other national surveys and are not Alaska Natives (ANs).3 In some instances, however, we report data on AIs and ANs together, as that is all that is available, and ANs are less than 10 percent of the combined group. Whenever not stated otherwise, we use those reporting AI or AN as their only race.
AI/ANs make up about 1 percent4 of the total U.S. population (U.S. Census Bureau 2011d). Compared with the U.S. population as a whole, AI/ANs are a relatively young population, with approximately one-third younger than 20 years old (see Table I.1). Among those older than 25, 23 percent have less than a high school diploma, 31 percent have as their highest level of education a high school diploma or the equivalent, and 46 percent have some postsecondary education, compared with 14 percent, 29 percent, and 57 percent, respectively, in the U.S. population as a whole. AI/AN households are larger than those of the general U.S. population (3.01 versus 2.58 people per household) and have higher poverty rates. More than 24 percent of AI/AN households were below the Federal poverty line in 2010, compared with 15 percent of the U.S. population (the highest since 1993). Additionally, 24 percent of AI/AN households received Supplemental Nutrition Assistance Program (SNAP; formerly Food Stamp) benefits in 2010, whereas 13 percent of the U.S. population received SNAP benefits (Table I.1).
1 Type II diabetes is non–insulin-dependent diabetes and the most common form of diabetes. Type I diabetes
is insulin-dependent diabetes and typically begins in childhood (American Diabetes Association 2000). 2 See Appendix A for specific definitions used for Indian Country; most data are based on the Census
definition of American Indian areas. 3 Appendix A describes variations in racial categories across data sets and issues in comparing them. 4 Total population for those reporting their race as AI/AN alone is 2,932,248 (0.9 percent of the U.S.
population) and the total population for AI/AN in combination with one or more other races is 5,220,579 (1.7 percent of the U.S. population).

Table I.1. Characteristics of the American Indian and Alaska Native Population in the United States, 2010
2
AI/AN Alone Black or African American Alone White Alone
Hispanic or Latino (All Races) U.S. Total Population
N % N % N % N % N %
Total Populationa 2,932,248 100 38,929,319 100 223,553,265 100 50,477,594 100 308,745,538 100
Percentage of U.S. Populationa 0.9
12.6 72.4 16.3 100
Population by Agea < 5 years 244,615 8.3 2,902,590 7.5 12,795,675 5.7 5,114,488 10.1 20,201,362 6.5 5–9 years 243,259 8.3 2,882,597 7.4 13,293,799 5.9 4,790,771 9.5 20,348,657 6.6 10–14 years 245,049 8.4 3,034,266 7.8 13,737,332 6.1 4,525,242 9.0 20,677,194 6.7 15–19 years 263,805 9.0 3,448,051 8.9 14,620,638 6.5 4,532,155 9.0 22,040,343 7.1 ≥ 20 years 1,935,520 66.0 28,088,003 72.2 169,105,821 75.6 31,514,938 62.4 225,477,982 73.1
Educational Attainmentb Less than 9th grade 134,144 8.9 1,243,847 5.3 7,804,932 5.0 6,148,937 22.5 12,461,624 6.1 9th to 12th grade, no diploma 207,091 13.8
3,010,139 12.8 11,492,936 7.3 4,172,326 15.3 16,955,981 8.3
High school diploma or equivalent 461,653 30.7
7,458,620 31.7 45,587,413 29.0 7,224,578 26.5 58,222,345 28.5
Some college, no degree 384,512 25.5 5,852,043 24.9 33,715,436 21.4 4,708,625 17.2 43,513,542 21.3 Associate’s degree 114,905 7.6 1,752,795 7.4 12,348,730 7.8 1,497,794 5.5 15,525,958 7.6 Bachelor’s degree 133,579 8.9 2,747,713 11.7 29,268,752 18.6 2,431,354 8.9 36,159,141 17.7 Graduate degree 67,644 4.5 1,465,489 6.2 17,219,003 10.9 1,130,382 4.1 21,246,049 10.4
Number of Householdsa 939,707 32.0 14,129,983 36.3 89,754,352 40.1 13,461,366 26.7 116,716,292 37.8
Average Household Sizea 3.01 NA 2.63 NA 2.46 NA 3.52 NA 2.58 NA
Population Below Poverty Level in Past 12 monthsb 701,213 28.4
10,099,631 27.1 27,951,752 12.5 12,306,535 24.8 46,215,956 15.3
Households with Income Below Poverty Level in Past 12 monthsb 132,017 23.7
2,030,834 23.3 5,112,925 8.7 2,300,703 22.2 8,598,062 11.3
Households Received Food Stamps/SNAP in the Past 12 Monthsb 197,932 24.3
3,587,600 26.1 8,295,458 9.3 2,741,108 20.7 14,535,659 12.7
Notes: Data presented are for American Indians and Alaska Natives (AI/ANs) alone (0.9 percent of U.S. population); the total population for AI/ANs in combination with one or more races is 5,220,579 (1.7 percent) (U.S. Census Bureau 2011d). Among those in combination, a small percentage (7.3 percent) live in Indian Country (U.S. Census Bureau 2011b). Among AI/ANs alone, 34 percent live in Indian Country. Similarly, data presented for Blacks or African Americans and whites are for those who identified as a single race. Educational attainment is for those 25 years and older. Household participation in SNAP as reported by FNS administrative data was considerably higher in FY 2010 (18,618,436); SNAP participation is underreported in surveys.
a U.S. Census Bureau 2011d; data from U.S. Census 2010. b U.S. Census Bureau 2011a; data from American Community Survey 1-Year Estimates 2010.
NA = not applicable.

Indian Children and USDA Programs Mathematica Policy Research
Most AI/ANs do not live in Indian Country. Of the population that identified as AI/AN alone in the 2010 census, 31 percent lived in Indian Country (U.S. Census Bureau 2010b). This is slightly less than in 2000 (see Figure I.1) (Ogunwole 2006). In 2010, for those who identified as American Indian and Alaska Native in combination with one or more other races, 7 percent lived in Indian Country.
Figure I.1. Residence of AI/AN Population
Sources: U.S. Census Bureau (2011b) for 2010 data; Ogunwole (2006) for 2000 data.
As of the 2000 Census, there were differences in household composition and income between AI/ANs living in and outside of Indian Country (Ogunwole 2006; Table I.2). Cole (2002) reported large differences among Special Supplemental Nutrition Program for Women, Infants, and Children (WIC) enrollees with respect to family size, receipt of public assistance, and income.5 For example, among AIs living in Indian Country, 24 percent had a family size of six or more, compared with 10 percent of AIs living off reservations. In addition, Cole (2002) notes higher rates of poverty among WIC participants on reservations than among those living off reservations, using 1998 data. Ogunwole (2006) corroborates these patterns for AI/ANs as a whole, noting larger family sizes and higher poverty levels in Indian Country (Table I.2).
American Indians also have higher levels of health problems than other Americans. This report details the extent of hunger, obesity, and Type II diabetes among children in Indian Country and discusses the Federal nutrition assistance programs that serve them. We use the most recent available statistics and, when possible, include comparable statistics on other groups
3
5 Because data on the characteristics of AI/ANs in Indian Country from the 2010 Census are not yet available,
we rely on older data for these comparisons.

Indian Children and USDA Programs Mathematica Policy Research
4
to frame the scope of the problem for this population. In addition, we briefly report on current Federal initiatives and potential positive impacts of implementation of HHFKA in Indian Country.
Table I.2. Characteristics of American Indians and Alaska Natives in 2000, Overall and in Indian Country
American Indians and Alaska Natives Overall
American Indians in Indian Countrya
Percentage Percentage
Percentage of U.S. Total Population 0.87 NR
Distribution of AI/ANs by Area of Residence 64.1b
33.5
Median Age 28.5 25.2
Educational Attainment Less than high school graduate 29.1 33.1
High school graduate 29.2 32.2
Some college or associate’s degree 30.2 26.5 Bachelor’s degree or more 11.5 8.1
Family Households 73.2c 78.5c
Average Household Size 3.06 3.35
Poverty Rate 25.7d NR
Sources: Ogunwole 2006; data from U.S. Census 2000.
Notes: Data presented are for those reporting American Indian or Alaska Native race (AI/ANs) alone. The total population for AI/ANs alone was 2,447,989 (0.9 percent of the total U.S. population); the number of AI/ANs in combination with one or more races is 4,315, 865 (1.5 percent of the total U.S. population) (Ogunwole 2006). Educational attainment as reported is for those aged 25 years and older.
aIndian Country refers to American Indian areas that include American Indian reservations and/or off-reservation trust lands (Federal), Oklahoma tribal statistical areas, tribal designated statistical areas, American Indian reservations (State), and State-designated American Indian statistical areas.
bPercentage of AI/ANs residing outside tribal areas. cPercentage of family households. dPercentage of specified group in poverty determined for individuals under 15 years. NR = not reported.

Indian Children and USDA Programs Mathematica Policy Research
5
II. HUNGER AND NUTRITION-RELATED HEALTH PROBLEMS AMONG AMERICAN INDIANS
This chapter reviews the problems of food insecurity, overweight and obesity, and Type II diabetes among children in Indian Country.
A. Food Insecurity
High levels of poverty and unemployment, low education levels, and the relative isolation of many reservations make American Indians particularly vulnerable to food insecurity, which is defined as uncertain or limited access to enough food for an active healthy life because of a lack of money or resources (Coleman-Jensen et al. 2011). Approximately 24 percent of American Indians in the United States live below the poverty line (U.S. Census Bureau 2011a) and in some reservations, such as the Pine Ridge Reservation in South Dakota, more than half of the people live in poverty (Institute of Medicine [IOM] 2011).
AI/AN-only households are much more likely than other households to be food insecure—the most recent available data (Current Population Survey [CPS] 2006–2008) indicated that 23 percent of AI/AN households (nearly one in four) were food insecure versus 15 percent of all U.S. households in 2008 (Table II.1).6 An earlier study by Gundersen (2008), which pooled data from the 2001 to 2004 CPS, found that, among households with children, nearly twice as many AI/AN households were food insecure than among non-AI/AN households with children (28 versus 16 percent). However, when comparing households with incomes less than 185 percent of poverty, the disparity was less pronounced (42 versus 35 percent). Gundersen found there were similar disparities between AI/AN households with children and other households with children when assessing very low food security (the lowest level, involving some household members cutting the size of meals or skipping meals) or food insecurity among children (worry about food or lack of food for children in the household) (Table II.1).
In Indian Country, access to food can be a challenge. Many reservations have significant food deserts, which are defined as low-income communities without ready access to healthy and affordable food (Ver Ploeg et al. 2009). Isolated settlements create logistical and cost challenges, limiting people’s ability to access affordable nutritious food because they live far from a large grocery store and do not have easy access to transportation (see Figure II.1). However, data on food insecurity specific to American Indians living in Indian Country are not currently available. Gundersen (2008), in his multivariate analysis of factors affecting food insecurity using the 2001–2004 CPS supplements, found that American Indian households with children in rural areas (as a proxy for locations in Indian Country) were no more likely to be food insecure than those in metropolitan areas. However, rural residence was positively associated with food insecurity for American Indian households without children. In addition, American Indians had significantly higher levels of food insecurity than the rest of the population, even after controlling for a wide range of demographic and socioeconomic characteristics.
6 Appendix B describes the food security scale and subscales and their interpretation.

Indian Children and USDA Programs Mathematica Policy Research
6
Table II.1. Food Insecurity Among American Indians and Alaska Natives
Low Food Security
Very Low Food Security
Total Food Insecure
Data Source Year(s) Scale Used Households AI/AN
Non-AI/AN AI/AN
Non- AI/AN AI/AN
Non-AI/AN
Current Population Surveya
2006–2008
House-hold
All Households NR NR 23% 15%
Current Population Survey b
2001–2004
House-hold
Households with Children
20.9% 11.9% 7.1% 3.8% 28.0% 15.7%
Current Population Survey b
2001–2004
House-hold
Households w/Children: Income < 185% Poverty
30.0% 25.8% 11.7% 9.0% 41.7% 34.8%
Current Population Survey b
2001–2004
Child Households with Children
29.7% 16.6%
Current Population Survey b
2001–2004
Child Households w/Children: Income < 185% Poverty
43.1% 36.1%
Sources: Data from the Current Population Survey, 2006–2008, are from U.S. Census Bureau and Bureau of Labor Statistics 2008. Data from the Current Population Survey, 2001–2004, are from Gundersen 2008.
Notes: Differences between populations were statistically significant. Sample sizes were not reported. a Comparison group is all U.S. households. Data on AI/ANs is for AI/ANs only. b In 2001–2002, the Current Population Survey measured race using a one-choice question; in 2003–2004 it measured race using a question that allowed multiple answers. In 2003–2004, all households reporting AI/AN as a race, including those who also selected other races, were included in Gundersen’s analysis.
NR = not reported.
B. Overweight and Obesity
1. Overweight and Obesity Among AI/ANs Nationally
The increasing prevalence of overweight and obesity among children in the United States is well documented (Anderson and Whitaker 2009; Centers for Disease Control and Prevention 2009; Wang and Beydoun 2007). Overweight and obesity have also increased dramatically among AI/AN children. Strauss (2010) reports an 11.5 percent increase in prevalence of overweight from 1999 to 2008 (from 36.4 percent in 1999 to 40.6 percent in 2008) among AI/AN 0- to 5-year-olds surveyed in the Pediatric Nutrition Surveillance System (PedNSS). Strauss also reports a 17.4 percent increase in obesity among this sample. Current estimates suggest that overweight and obesity affects one-third to one-half of AI/AN children (Table II.2).

Indian Children and USDA Programs Mathematica Policy Research
Figure II.1. Locations of Food Deserts and American Indian Reservations in the Contiguous United States
Source: Food desert by Census tract: US Department of Agriculture, Economic Research Service http://www.usda.gov/wps/portal/usda/usdahome. Map was created at http://ims2.missouri. edu/tool/maps/default.aspx.
Note: Orange shading indicates food deserts; green shading indicates reservation borders; brown indicates overlap.
7

Indian Children and USDA Programs Mathematica Policy Research
Table II.2. Prevalence of Obesity Among American Indians and Alaska Natives in the United States
Living in Indian
Country Age Range
Total AI/ANs in sample
BMI ≥ 85th Percentile
BMI 85th to < 95th Percentile
BMI ≥ 95th Percentile
8
Data Source Year % % %
WIC Participant Characteristicsa 1998 X 2 years 9,742
21.4
WIC Participant Characteristicsa 1998
X 3 years 9,114
15.9
WIC Participant Characteristicsa 1998 X 4 years 7,236
14.1
WIC Participant Characteristicsb 2008 2–5 years 419,919 35.4 17.6
Indian Health Service Clinical Reporting Systemc 2008 X 2–5 years NR 45.0
25.0
Pediatric Nutrition Surveillance Systemd 2010 2–5 years 35,604
20.1 21.1
Early Childhood Longitudinal Program, Birth Cohorte 2005 4 years 650
31.2
Indian Health Service Clinical Reporting Systemc 2008 X 6–11 years NR 49.0
31.0
Indian Health Service Clinical Reporting Systemc 2008 X 12–19 years NR 51.0
31.0
National Health Interview Surveyf 2009 ≥ 18 years 1,856
34.0 32.5
Notes: Percentages from the National Health Interview Survey are BMI for overweight (34.0%) and obese (32.5%) adults, which are defined by specific cutoffs, not percentiles. a Cole 2002; data from WIC Participant Characteristics Data 1998. b Conner et al. 2002; data from WIC Participant Characteristics Data 2008. c Strauss 2010; data from Indian Health Service Clinical Reporting System 2008. d CDC 2010b; data from Pediatric Nutrition Surveillance System 2010. e Anderson and Whitaker 2009; data from Early Childhood Longitudinal Program, Birth Cohort 2005. f Pleis, Disraeli, and McGregor 2010; data from National Health Interview Survey 2009. BMI = body mass index; NR = not reported; WIC = Special Supplemental Nutrition Program for Women, Infants, and Children.

Indian Children and USDA Programs Mathematica Policy Research
9
Nationally representative data on AI/AN children in Indian Country are limited. Existing infrastructure that collects and aggregates body mass index (BMI) data primarily includes the Indian Health Services’ (IHS) Clinical Reporting System, the PedNSS, and the WIC program. However, age-specific obesity prevalence rates are not available from the IHS, which is the only source specific to those living on or near reservations. PedNSS and WIC data include only or mostly low-income families. Anderson and Whitaker (2009) present nationally representative data on AI/AN children from the Early Childhood Longitudinal Study, Birth Cohort, but their data are only for 4-year-olds.
Although the precise developmental period for overweight and obesity is not clear, obesity in AI/AN children typically begins in early childhood (Thomas and Cook 2005), with disparities between AI/ANs and other races/ethnicities established by adolescence (Gordon-Larsen et al. 2003). This is consistent with obesity prevalence as reported in the 2010 PedNSS, a surveillance system that monitors low-income infants, children, and women. Approximately 20 percent of AI/AN children sampled were overweight, and an additional 21 percent were obese. In comparison, 16 percent of the total PedNSS population were overweight and another 14 percent were obese. Similar prevalence rates were reported among another low-income AI/AN population, WIC participants, in a study by Cole (2002) that compared the characteristics of American Indian WIC participants in and out of Indian Country. In this sample, American Indians living in Indian Country were considerably more obese than those not living in Indian Country. Among WIC children living in Indian Country, 21.4 percent of 2-year-olds; 15.9 percent of 3-year-olds; and 14.1 percent of 4-year-olds were obese. Comparatively, obesity was less prevalent for AI/AN children not living in Indian Country; 16.2 percent of 2-year-olds; 11.6 percent of 3-year-olds; and 10.0 percent of 4-year-olds were obese.
More recent data (2008) estimate that 20 percent of AI/AN children 2 to 4 years old participating in WIC are obese (Harper 2011). For those AI/AN children (aged 2 to 4 years) living in areas served by Indian Tribal Organizations (ITOs), obesity prevalence increases to 22 percent (Harper 2011). Prevalence of obesity among AI/AN children aged 12 to 19 years was at least 30 percent in 2008 (Strauss 2010).
Although AI/ANs are not a homogeneous group, obesity rates among specific tribes are similar, regardless of ancestry. Among children of all ages, obesity prevalence was at least 20 percent for the various tribal areas covered in special studies (Table II.3).
2. Factors Associated with Overweight and Obesity
The determinants of overweight and obesity in the United States are complex, but the trend of increasing overweight and obesity among American Indians and Alaska Natives, as well as the Nation at large, is associated with environments that promote increased food intake and decreased activity (Strauss 2010; Halpern 2007). Historically, the AI/AN diet was higher in complex carbohydrates and lower in fat than current diets and primarily made up of homegrown foods (Halpern 2007). However, there has been a shift in Indian Country, whereby American Indians are eating less traditional food and more food that is commercially prepared and processed, a trend also reported among the U.S. population as a whole. This dietary shift was summarized in a review of reservation-based studies by Story and colleagues (2003) who reported that in the 1990s, dietary fat intake among American Indians was at the high end of or above the currently recommended 25 to 35 percent of total calories, ranging from 31 to 47 percent. AI/ANs have also shifted from a subsistence lifestyle to a lifestyle that involves less

Indian Children and USDA Programs Mathematica Policy Research
10
physical activity (Mendlein et al. 1997). Research has found low physical activity levels among those AI/ANs living on or near reservations (Mendlein et al. 1997; Yurgalevitch et al. 1998).

Indian Children and USDA Programs Mathematica Policy Research
Table II.3. Prevalence of Obesity Among American Indians in Specific Tribal Areas 11
BMI ≥ 85th Percentile
BMI 85 to < 95th
Percentile BMI ≥95th Percentile
Data Source Year(s) Tribal Area Age Range Total AI/ANs
in Sample %
% %
Pediatric Nutrition Surveillance Systema
2009
Cheyenne River Sioux (SD) 2–4 years
NR 15–20
Pediatric Nutrition Surveillance Systema
2009
Intertribal Council of Arizona 2–4 years
NR > 20
Pediatric Nutrition Surveillance Systema
2009
Navajo Nation (AZ, NM, UT)
2–4 years
NR 15–20
Pediatric Nutrition Surveillance Systema
2009
Rosebud Sioux (SD) 2–4 years
NR > 20
Pediatric Nutrition Surveillance Systema
2009
Standing Rock Sioux (ND) 2–4 years
NR > 20
Pediatric Nutrition Surveillance Systema
2009
Three Affiliated Tribes (ND) 2–4 years
NR > 20
Pathways Studyb 1997– 2000
White Mountain Apache, San Carlos Apache, Navajo, Sicangu Lakota, Oglala Lakota, Tohono O’odham, Gila River Indian Community
7.6 years
1,704 48.9 28.6
Gila River Indian Surveyc 2003 Gila River Indian Community (AZ): Pima and Tohono O’odham Indians
11.3 years
4,857 28.7
Notes: The Gila River Indian survey was a longitudinal study.
a CDC 2009; data from Pediatric Nutrition Surveillance System 2009. b Caballero et al. 2003; data from Pathways Study 1997–2000. c Franks et al. 2010; data from Gila River Indian Survey 2003.
BMI = body mass index; NR = not reported.

Indian Children and USDA Programs
12
Socioeconomic factors may also play a role in the development of childhood obesity among AI/ANs. While the circumstances of each tribe are unique, most AI/ANs have experienced severe economic and housing problems (Hillabrant et al. 2001). Unemployment and poverty have been at high levels in the majority of American Indian communities. Kumanyika and Grier (2006) suggest that higher rates of obesity among AI/ANs may result from socioeconomic influences such as reduced access to space for physical activity and targeted advertising and marketing of energy-dense foods. In addition, lack of access to stores with a variety of healthy food options may contribute to obesity as well as food insecurity (IOM 2011; Zenk et al. 2005). Likewise, the higher cost of nutrient-dense foods may be associated with higher rates of obesity among AI/ANs (Richards and Patterson 2006).
C. Type II Diabetes
1. Type II Diabetes Among American Indians and Alaska Natives Nationally
As with overweight and obesity, AI/ANs are disproportionately affected by diabetes, with some estimates suggesting that AI/ANs are 2.3 times more likely to have diabetes than are individuals in the U.S. general population (Acton et al. 2003; Indian Health Service 2009). Furthermore, approximately 16.5 percent of the total AI/AN adult population served by the IHS have been diagnosed with diabetes, which is twice the diagnosed rate among non-Hispanic whites in the United States (Harper et al. 2008). Although Type II diabetes has traditionally been a health concern among adults, its prevalence among children has increased in the American Indian community, a finding consistent with increases in obesity (Ríos Burrows 1998). The SEARCH study sought to assess the diabetes burden among U.S. children less than 20 years of age; this population-based observational study of physician diagnosed diabetes collected data from six centers (in CA, CO, HI, OH, SC, and WA) and estimated the prevalence of Type II diabetes to be 0.03 per 1,000 among AI children aged 0–9 years. Comparatively, prevalence of Type II diabetes among all groups surveyed (aged 0–9 years) was 0.01 per 1,000. Among AI children aged 10–19 years, prevalence of Type II diabetes was 1.74 per 1,000, whereas the prevalence among all groups surveyed was notably lower (see Figure II.2). For Type I and Type II diabetes, prevalence was 0.23 per 1,000 among AI children aged 0–9 years and 2.28 per 1,000 among AI children aged 10–19 years. Analogous to obesity, diabetes prevalence among children may be higher among adolescents and those living on or near reservations, as described in Table II.4.
2. Type II Diabetes Among AI/ANs from Specific Tribal Areas
There is convincing evidence that prevalence of Type II diabetes among Pima Indians is higher than among other AI tribes (Knowler et al. 1990; Savage et al. 1979)—it is the highest recorded prevalence of diabetes worldwide (Knowler et al. 1978). In one study, prevalence among Pima Indians was 22.3 per 1,000 for 10- to 14-year-olds and 50.9 per 1,000 for 15- to 19-year-olds (Dabelea et al. 1998). Dabelea and colleagues (1998) reported that this was a large increase from when this population was first surveyed from 1967 to 1976. Because of these historical data, this study is a more reliable indicator of increasing prevalence than can be obtained in cross-sectional data.

Indian Children and USDA Programs
Figure II.2 Prevalence of Type II Diabetes Among Youth Age 10-19 (per 1,000)
0.19
1.05
0.48 0.54
1.74
0.42
0
0.2
0.4
0.6
0.8
1
1.2
1.4
1.6
1.8
2
Table II.4. Prevalence of Diabetes Among American Indians and Alaska Natives in the United States
Data Source Year(s)
Living in Indian
Country Age Range Type of Diabetes
Total AI/ANs in Sample
Prevalence per 1,000
SEARCH for Diabetes Youth Studya 2001 0–9 years Type II 66,617 0.03
SEARCH for Diabetes Youth Studya 2001
10–19 years Type II 72,387 1.74
Indian Health Service Clinical Reporting Systemb 1998 X < 15 years NS 7,736 1.23
Indian Health Service Clinical Reporting Systemc 2004 X < 15 years NS NR 2.2
Indian Health Service Clinical Reporting Systemb 1998 X 15–19 years NS 7,736 5.42
Indian Health Service Clinical Reporting Systemc 2004 X 15–19 years NS NR 7.4
Behavioral Risk Factor Surveillance Surveyd 2007 18–34 years NS 1,320 28.0
National Health Interview Surveye 2008 ≥ 18 years NS 1,856 93.8
Notes: Prevalence reported for the SEARCH study was American Indians only. Type of diabetes refers to Type I and Type II diabetes; Type I diabetes is insulin-dependent diabetes and typically begins in childhood, and Type II diabetes is non-insulin-dependent diabetes (American Diabetes Association 2000).
a SEARCH for Diabetes in Youth Study Group 2006; data from SEARCH Survey 2001. b Acton et al. 2002; data from Indian Health Service Clinical Reporting System (outpatient) data 1998. c Acton et al. 2006; data from Indian Health Service Clinical Reporting System (ambulatory patient-care) data, 1994–2004. d Roberts et al. 2009; data from Behavioral Risk Factor Surveillance Survey 2007. e Pleis, Ward, and Lucas 2010; data from National Health Interview Survey 2008.
NR = not reported; NS = not specified.
13

Indian Children and USDA Programs
14
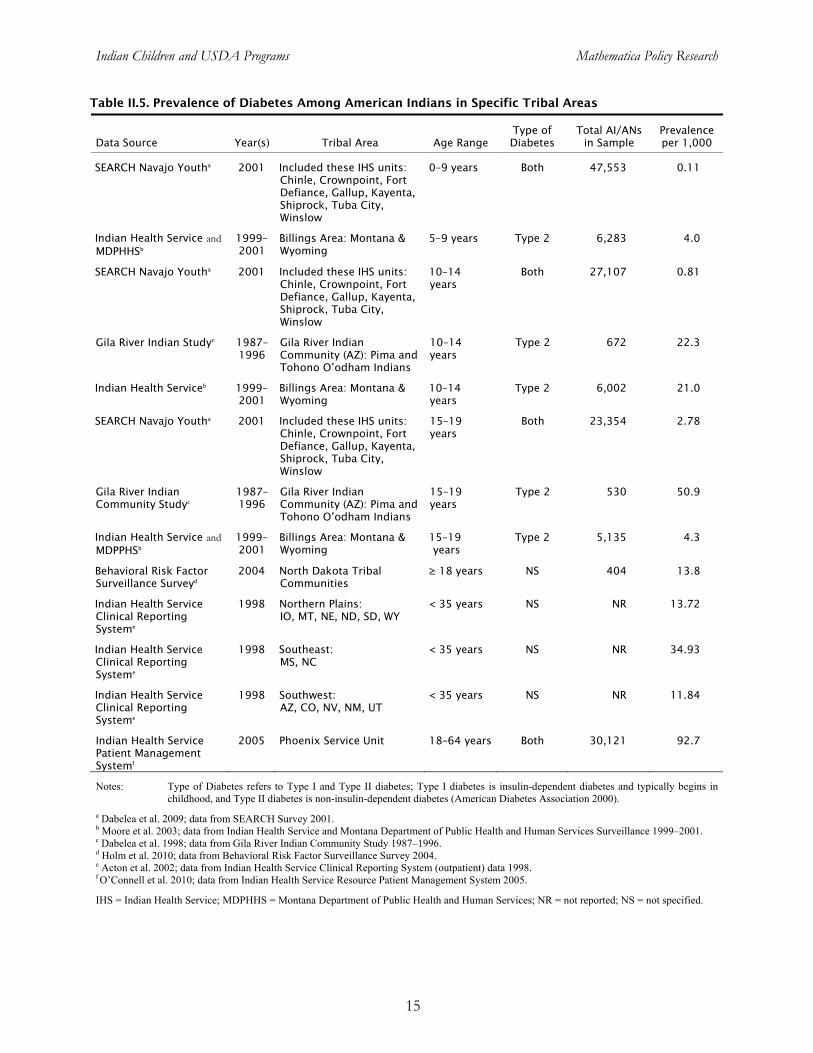
Although reported prevalence is lower among other tribes, Moore and colleagues (2003) reported results (consistent with the national trend) that Type II diabetes is more prevalent than Type I diabetes among AI/AN youth. More specifically, Moore and colleagues (2003) found that the prevalence of Type II diabetes was nearly two times higher than Type I diabetes among American Indian youth in Montana and Wyoming. As detailed in Table II.5, diabetes prevalence varies widely across tribal areas.
3. Factors Associated with Diabetes
Diabetes imposes increased health risks among AI/AN youth, such as accelerated development of cardiovascular diseases, renal disease, and loss of visual acuity, all of which contribute to excess morbidity and mortality (Story et al. 2003). Akin to obesity, the increasing prevalence has been attributed to lifestyle changes in diet and physical activity (Weir and Lipscombe 2004). Among youth with Type II diabetes, an estimated 50 to 90 percent have a BMI ≥ 85th percentile for age (American Diabetes Association 2000). Among the SEARCH study sample, the prevalence of obesity among AI youth with Type II diabetes was 79.4 percent. Obesity prevalence was only 12.5 percent among youth with Type I diabetes (Liu et al. 2010). Other risk factors for Type II diabetes include family history, hypertension, and dyslipidemia7 (Rao, Disraeli, and McGregor 2004).
Exposure to diabetes in utero and low birthweight increase risk in AI/AN children (Dabelea et al. 1998). As in the population overall, AI/AN children with Type II diabetes are more likely to be adolescents (i.e., 10–19 years) and female (Fagot-Campagna and Ríos Burrows 1999; Harwell et al. 2001; Moore et al. 2003).
7 Dyslipidemia is defined as an abnormal amount of lipids (e.g., cholesterol and/or fat) in the blood.
Indian Children and USDA Programs Mathematica Policy Research
15
Table II.5. Prevalence of Diabetes Among American Indians in Specific Tribal Areas
Data Source Year(s) Tribal Area Age Range Type of Diabetes
Total AI/ANs in Sample
Prevalence per 1,000
SEARCH Navajo Youtha 2001 Included these IHS units:
Chinle, Crownpoint, Fort Defiance, Gallup, Kayenta, Shiprock, Tuba City, Winslow
0–9 years Both 47,553 0.11
Indian Health Service and MDPHHSb
1999–2001
Billings Area: Montana & Wyoming
5–9 years Type 2 6,283 4.0
SEARCH Navajo Youtha 2001 Included these IHS units: Chinle, Crownpoint, Fort Defiance, Gallup, Kayenta, Shiprock, Tuba City, Winslow
10–14 years
Both 27,107 0.81
Gila River Indian Studyc 1987–1996
Gila River Indian Community (AZ): Pima and Tohono O’odham Indians
10–14 years
Type 2 672 22.3
Indian Health Serviceb 1999–2001
Billings Area: Montana & Wyoming
10–14 years
Type 2 6,002 21.0
SEARCH Navajo Youtha 2001 Included these IHS units: Chinle, Crownpoint, Fort Defiance, Gallup, Kayenta, Shiprock, Tuba City, Winslow
15–19 years
Both 23,354 2.78
Gila River Indian Community Studyc
1987–1996
Gila River Indian Community (AZ): Pima and Tohono O’odham Indians
15–19 years
Type 2 530 50.9
Indian Health Service and MDPPHSb
1999–2001
Billings Area: Montana & Wyoming
15–19 years
Type 2 5,135 4.3
Behavioral Risk Factor Surveillance Surveyd
2004 North Dakota Tribal Communities
≥ 18 years NS 404 13.8
Indian Health Service Clinical Reporting Systeme
1998 Northern Plains: IO, MT, NE, ND, SD, WY
< 35 years NS NR 13.72
Indian Health Service Clinical Reporting Systeme
1998 Southeast: MS, NC
< 35 years NS NR 34.93
Indian Health Service Clinical Reporting Systeme
1998 Southwest: AZ, CO, NV, NM, UT
< 35 years NS NR 11.84
Indian Health Service Patient Management Systemf
2005 Phoenix Service Unit 18–64 years Both 30,121 92.7
Notes: Type of Diabetes refers to Type I and Type II diabetes; Type I diabetes is insulin-dependent diabetes and typically begins in childhood, and Type II diabetes is non-insulin-dependent diabetes (American Diabetes Association 2000).
a Dabelea et al. 2009; data from SEARCH Survey 2001. b Moore et al. 2003; data from Indian Health Service and Montana Department of Public Health and Human Services Surveillance 1999–2001. c Dabelea et al. 1998; data from Gila River Indian Community Study 1987–1996. d Holm et al. 2010; data from Behavioral Risk Factor Surveillance Survey 2004. e Acton et al. 2002; data from Indian Health Service Clinical Reporting System (outpatient) data 1998. f O’Connell et al. 2010; data from Indian Health Service Resource Patient Management System 2005.
IHS = Indian Health Service; MDPHHS = Montana Department of Public Health and Human Services; NR = not reported; NS = not specified.

Indian Children and USDA Programs Mathematica Policy Research
16
III. FEDERAL FOOD ASSISTANCE PROGRAMS SERVING AMERICAN INDIAN CHILDREN IN INDIAN COUNTRY
A. Overview
FNS has a long history of providing low-income children and families better access to food through its food assistance programs and related nutrition education efforts. In the last decade, FNS food assistance programs have focused on both increasing participation among eligible families and updating program benefits and services to reflect advances in nutritional science as well as the increasing epidemic of childhood obesity.
Given their high levels of poverty, many American Indians/Alaskan Natives (AI/ANs) living in Indian Country are eligible to participate in FNS programs. To reach this population, FNS works in partnership with Indian Tribal Organizations (ITOs) and State agencies to provide funding to cover the food benefits and administrative costs for AI/ANs that reside in Indian Country. This chapter reviews the major FNS programs that serve AI/AN families with children in Indian Country.8 Four major programs are the core of the food safety net—the Food Distribution Program on Indian Reservations (FDPIR), SNAP, WIC, and the National School Lunch Program (NSLP). They comprise an important part of the Federal government’s efforts to alleviate food insecurity, obesity, and risk for Type II diabetes and its complications among children in Indian County. This chapter describes participation by AI/ANs and benefits and services offered by these four key programs and briefly summarizes information on other child nutrition programs.
B. Food Distribution Program on Indian Reservations
FDPIR provides USDA foods to low-income AI/AN households living on or near Indian reservations as an alternative to SNAP, because SNAP offices or authorized food stores are sometimes not easily accessible to such households. In 2011, members of 276 tribes receive benefits under the FDPIR through 100 ITOs and five State agencies. The USDA purchases and ships FDPIR foods to the ITOs and State agencies. These agencies then arrange their distribution to eligible households. Households are certified based on income and resource standards set by the Federal government, and must be recertified at least every 12 months, with the exception of elderly and disabled households, which may be certified for up to 24 months. Although households may not participate in FDPIR and SNAP in the same month, FDPIR households are often eligible to participate in other food assistance programs such as WIC or the NSLP (Harper et al. 2008). The size of FDPIR programs varies; approximately half of local FDPIR programs serve fewer than 250 households per month, with nearly all of the remaining programs serving between 250 and 1,200 households per month. Five programs serve more than 1,200 households per month.
8 FNS permits ITOs to serve as State agencies for FDPIR and WIC. Other programs are operated through the
States, but an ITO may be a local site or sponsor sites.

Indian Children and USDA Programs Mathematica Policy Research
17
In 2011, FDPIR had an estimated 77,641 participants (Table III.1). Participation was lower than in the previous two years, perhaps reflecting changes in SNAP program benefits implemented in 2009 (and discussed below). Usher et al. (1990) reported that over half of the FDPIR participating households contained children. Most households were headed by two parents. Nearly 10 percent of participating households did not have any income, with 33 percent of households reporting a gross income of no more than 50 percent of the poverty level. This population also heavily relied on home food production and other FNS programs to meet their dietary needs. In the 1990 study, 70 percent of households participated in the NSLP, 44 percent in the School Breakfast Program (SBP), and 17 percent in the WIC program. Although this information is quite dated, it indicates the program has historically served a very disadvantaged population.9
Table III.1. Characteristics of Federal Food Assistance Programs
FDPIRa, SNAP WIC NSLP
Average Participation by Individuals FY 2011b
77,641 44,570,892 8,951,459 31,806,334 FY 2010 84,577 40,301,878 9,175,020 31,746,677 FY 2009 95,369 33,489,975 9,121,779 31,311,514 FY 2008 90,153 28,222,630 8,704,510 31,015,756
Average Participation for Individual American Indians or Alaska Natives Only (2008) 35,356 541,246 126,184 549,577
Average Participation for Individuals Reporting Two Races: White and American Indian or Alaska Native (2008)c 623 262,069 84,730 328,263
Average Cost of Benefit Per Person (2008) $55.38d $102.19 $43.41 NA Sources: USDA, FNS 2011b; data from FNS Program Administrative data 2008–2011; for average participation by individuals
and average cost of benefit per person. Trippe and Schechter 2010; data from Current Population Survey 2009; for average participation for individual American Indians or Alaska Natives only (2008) and average participation for individuals reporting two races: white and American Indian or Alaska Native (2008).
Notes: All participation rates are “per month” averages, except for the NSLP which are “per day.” FDPIR specifically targets households living on Indian reservations and American Indian households residing in approved areas near reservations or in Oklahoma.
a FDPIR average participation based on National Databank data. b Fiscal Year 2011 data exclude September 2011 data, thus average is for 11 months (October 2010 through August 2011). c Participation for American Indians and Alaska Natives in 2008 is from the March 2009 Current Population Survey. d FDPIR Average Cost of Benefit Per Month (2008) based on FY 2010 Budget Explanatory Notes. The total monthly food package cost does not reflect retail value of the average monthly food package. For FY 2009, the food package had retail value estimated at $78.44 per month (USDA FNS 2011b). NA = not applicable; NR = not reported.
9 FNS recently awarded a three-year contract for The Study of the Food Distribution Program on Indian
Reservations (FDPIR): 2013. The study will determine the demographic profile of households and individuals that currently participate and provide descriptive information on key aspects of FDPIR operations through case record analyses and interviews with participating households and staff.
Indian Children and USDA Programs Mathematica Policy Research
18
USDA has improved the nutritional quality of foods delivered through FDPIR in the last decade (Harper et al. 2008). Consistent with the Dietary Guidelines for Americans, 2010, the program focuses on reducing added sugars, sodium, and fat. The FDPIR food package now offers leaner meat, more fresh fruits and vegetables, whole grain foods, and low-fat milk. It no longer offers items such as butter that are high in saturated fat. On average, the FDPIR food package meets many of the nutritional needs of participating household members. As delivered, the food package provides protein, total fat, essential fatty acids, and carbohydrates at levels that fall within acceptable ranges under the Dietary Reference Intakes. Individuals consuming only the FDPIR foods in the quantities provided would achieve a Healthy Eating Index 2005 score of 81 out of 100. In comparison, the general U.S. population has an estimated score of 58 (Harper et al. 2008).10
C. Supplemental Nutrition Assistance Program
SNAP is a cornerstone of the Nation’s safety net. Eligible participants have a gross income of 130 percent of poverty or less. After various deductions for items such as shelter and countable resources, net income must be no more than 100 percent of poverty. Typically, able-bodied adults without dependents between 18 and 50 years of age can get SNAP benefits only for 3 months in a 36-month period if they do not work, search for work, or participate in a workfare or employment and training program.
As the largest food assistance program in the United States, SNAP has played a critical role in feeding the U.S. population during the recession. In FY 2011, SNAP served approximately 44.5 million participants per month. AI/ANs in 2008 accounted for nearly 2 percent of all participants in the program and received an estimated $55 million in benefits, making SNAP the largest nutrition program for AI/ANs (Table III.1). Based on data from the March 2009 CPS, about 541,000 SNAP participants reported being AI/AN only and an additional 262,000 SNAP participants reported being AI/AN and another race (Trippe and Schechter 2010; Table III.1).
D. Special Supplemental Nutrition Program for Women, Infants, and Children
The Special Supplemental Nutrition Program for Women, Infants, and Children (WIC) provides a variety of services to promote the health and nutrition of low-income pregnant, breastfeeding, and nonbreastfeeding postpartum women; infants from birth to age 1; and children from 1 to 5 who are at risk for nutritional deficiencies. WIC provides supplemental food packages that are targeted to meet their special nutritional needs and nutrition services, which include nutrition education, breastfeeding promotion and support, and referrals to health care providers. WIC participants receive supplemental food in the form of vouchers (paper food instruments or electronic benefit transfer cards) that allow them to obtain specific types of food at authorized stores. WIC participants receive a “prescription” for foods that meet the unique nutritional requirements for women (pregnant, breastfeeding, and postpartum), infants, and children.
10 The Healthy Eating Index is a measure of how well population groups adhere to the Dietary Guidelines for
Americans. A score of 100 indicates full adherence to recommended intakes of foods and nutrients.

Indian Children and USDA Programs Mathematica Policy Research
19
Since 2008, WIC has had approximately 9 million participants nationally (Table III.1), among whom were 126,000 reporting their race as AI/AN alone and 85,000 AI/ANs who also said they were white (Table III.1). WIC PC 2008 indicates that as of April 2008, approximatly 44,000 AI/AN participants received services from WIC programs operated by ITOs as State agencies. Furthermore, 24,461 American Indians enrolled in WIC were children served by ITO WIC agencies.11 FNS administrative data for FY 2011 indicate that on average, 1,813 AI/AN participants participated per month in each ITO WIC agency, with enrollment at the 34 ITO State agencies ranging from 90 to 11,998 (Table III.2).
Table III.2. American Indians and Alaska Natives Participating in WIC Programs Sponsored by Indian Tribal Organizations
FY 2010 FY 2011
Average Range Median Average Range Median
Average Monthly Participation 1,847 90– 11,998
647 1,813 75– 11,939
643
Average Participation of Women 384 13– 2,496
135 400 15– 2,580
133
Average Participation of Children (Age 1–4)
1,037 46– 6,951
372 1,102 47– 6,909
379
Average Participation of Infants 426 16– 2,658
141 418 14– 2,478
137
Average Monthly Food Cost Per Person (All Categories)
$46.34 $32.96–$74.91
$42.50 $47.90 $34.69–S71.45
$44.03
Source: USDA, Food and Nutrition Service 2011b; Monthly Participation Data, FY 2010–2011.
Note: Ranges indicate the range in the caseloads across ITOs. Averages are across all months in FY 2010, 11 months in FY 2011. Averages are unweighted and are based on the 34 ITOs that administer WIC as State agencies. Per-person cost estimates are total dollars divided by number of participants.
In order to address concerns about childhood obesity and advances in nutritional science, WIC food packages were updated in 2009 to offer more nutrient-dense foods on the basis of recommendations from an Institute of Medicine panel (IOM 2005). The new food packages are aligned more closely with current nutrition science and infant feeding guidelines of the American Academy of Pediatrics. These new food packages provide participants with a variety of foods and notably include fruits and vegetables and whole grains. WIC State agencies and ITOs also have more flexibility to prescribe food packages to accommodate the cultural food preferences of participants. For example, soft corn or whole wheat tortillas are now an allowable option in place of whole wheat bread. In addition, the new packages provide improved incentives for the establishment of successful, long-term breastfeeding by varying the packages among women who are fully formula feeding their infants as compared to those who are partially or fully breastfeeding.
11 WIC PC 2008 tabulation provided by Ed Harper at FNS, personal communication, December 5, 2011.

Indian Children and USDA Programs Mathematica Policy Research
20
Since 2004, State and ITO WIC programs have received Federal grants for peer-counseling programs to promote breastfeeding; in 2010, funding for peer-counseling programs increased from $15 million to $50 million per year. Peer counselors are experienced mothers who have breastfed and who are trained, supervised, and compensated according to FNS guidelines. Peer counselors talk by telephone or meet with WIC mothers who are breastfeeding and seek support or help with breastfeeding questions or concerns (Collins et al. 2010). All of the State and ITO WIC agencies have received peer counseling funding.
E. Child Nutrition Programs
Most schools on reservations participate in the NSLP, including Bureau of Indian Education schools and local schools; the SBP may be less available. Finegold et al. (2005) reported that an issue with SBP is that long bus rides do not always leave time for schools to serve breakfast to students before classes start. Participation in the Child and Adult Care Food Program (CACFP) appears to be largely among Head Start Centers, which are required to offer the program, but some Boys & Girls Clubs or recreation programs also offer it, based on sponsor lists from selected States in the West, Southwest, and Mountain/Plains regions with large reservations. The Summer Food Service Program, which provides free meals to children in low-income areas in the summer, also is available on reservations in several of these States, most frequently at school sites.
One way in which access to meals is facilitated for Indian children is that children whose
families receive FDPIR, SNAP, or TANF benefits are categorically eligible for free meals at schools and at day care centers and homes participating in NSLP and CACFP, respectively, without the need to provide income information. Both the NSLP and CACFP also provide reimbursement for after-school snacks and CACFP now provides reimbursement in all States for a full afterschool meal, most often supper. However, there are little data to indicate how frequently these benefits or the Fresh Fruit and Vegetable Program are offered in Indian Country.

Indian Children and USDA Programs Mathematica Policy Research
21
IV. OPPORTUNITIES FOR IMPROVED SERVICES UNDER THE HEALTHY, HUNGER-FREE KIDS ACT AND RELATED INITIATIVES
Recent policy changes and initiatives in the Federal nutrition assistance programs have focused on healthier meal options, easier access for those in need, and support for broader lifestyle interventions at the family, school, or community level to reduce or prevent food insecurity, obesity, Type II diabetes, and associated long-term health problems. USDA is in the process of implementing the changes included in HHFKA. These changes have the potential for enhancing the ability of USDA nutrition programs to serve children and their families in Indian Country. USDA also participates in comprehensive, cross-agency collaborations to prevent or reduce child obesity, most notably First Lady Michelle Obama’s Let’s Move! in Indian Country, which was introduced in May 2011 as part of the larger national Let’s Move! initiative.12 This chapter reviews the potential for positive changes from provisions of HHFKA and from the Let’s Move! program.
A. Healthier Meal Options
HHFKA requires implementation of revised meal patterns for NSLP and SBP meals and requires regular updating of CACFP meal patterns as well. FNS policy is to make meals served in both programs consistent with the most recent Dietary Guidelines for Americans. A proposed rule has been published with new standards and meal patterns for NSLP and SBP meals (Federal Register January 13, 2011); the law also calls for proposed rules for CACFP meal patterns to be issued within 18 months of passage. These meal patterns will make school meals and CACFP meals healthier and thus may help mitigate obesity and diabetes risk among AI children living on reservations. School districts that comply with the new school meal regulations are eligible for higher reimbursement rates from USDA (six cents per meal) beginning in fall 2012. HHFKA also requires schools and day care providers to serve only fat-free (skim) and low-fat (1 percent) milk and requires that children have access to potable water.
B. Increased Access to Food Assistance
Several provisions of the HHFKA have the potential to increase access to school meals and other food assistance programs for American Indian children in Indian Country. Schools in high-poverty areas will have new ways to qualify for universal free school meals, including community eligibility (in which schools with over 40 percent of students directly certified can offer all meals free, and claim free meals based on the number of directly certified students times 1.6). In addition, the law says USDA may pilot or implement use of the American Community Survey poverty data rather than school meal applications as a way to establish eligibility for universal free school meals. USDA has also been expanding direct certification for school meals (based on matching student lists with records of other assistance programs, including SNAP and FDPIR) without parents needing to complete an application. The HHFKA includes bonuses as incentives for States with high direct certification rates, and a phaseout of the letter method of direct certification, which required parents to sign and return a letter indicating their child was
12 More information on Let’s Move! in Indian Country can be found at http://www.letsmove.gov/indiancountry.
Indian Children and USDA Programs Mathematica Policy Research
22
eligible for free meals. Parents who do still need to apply for free or reduced-price meals can no longer be required to provide their Social Security number, just the last four digits. All of these provisions make access to the school meal programs easier.
Previously, after-school programs in 14 States could be reimbursed through CACFP for serving after-school meals to at-risk children. HHFKA extended this option to programs in all States. To be eligible, these programs must be located in low-income areas, offer after-school enrichment or educational activities (other than team sports), and provide snacks and/or meals free to all participants.
C. Let’s Move! in Indian Country
Although not specifically part of HHFKA, Let’s Move! is a public/private initiative led by First Lady Michelle Obama, with the goal of ending the epidemic of child obesity in a generation. USDA is one of the Federal agencies sponsoring Let’s Move! The program is intended to improve coordination at the levels of the family, the school (or child care center), and the community in making changes in eating and physical fitness behaviors, particularly among children. Let’s Move! in Indian Country (started in May 2011) is targeting American Indians in Indian Country. The Web site (noted above) has social marketing and technical assistance materials. Some materials have been tailored for American Indians, while others are for a general audience. One emphasis in the materials is on expanding access to Federal food programs on reservations; for example, the site urges parents to work with schools to establish the SBP if it is not already offered and to participate in the HealthierUS School Challenge, a USDA program that supports and recognizes schools that achieve standards for healthy school meals and a healthy school environment (Department of the Interior 2011).

Indian Children and USDA Programs Mathematica Policy Research
REFERENCES
Acton, K., N. Ríos Burrows, L. Geiss., and T. Thompson. “Diabetes Prevalence Among American Indians and Alaska Natives and the Overall Population—United States, 1994–2002.” MMWR, vol. 52, no. 30, 2003, p. 702.
Acton, K., N. Ríos Burrows, K. Moore, L. Querec, L. Geiss, and M. Engelgau. “Trends in Diabetes Prevalence Among American Indian and Alaska Native Children, Adolescents, and Young Adults.” American Journal of Public Health, vol. 92, no. 9, 2002, p. 1485.
Acton, K., N. Ríos Burrows, J. Wang, and L. Geiss. “Diabetes Prevalence Among American Indians and Alaska Natives and the Overall Population—United States, 1994–2002.” MMWR, vol. 55, no. 44, 2006, p. 1201.
American Diabetes Association. “Type 2 Diabetes in Children and Adolescents.” Diabetes Care, vol. 23, 2000, p. 381.
Anderson, S., and R. Whitaker. “Prevalence of Obesity Among US Preschool Children in Different Racial and Ethnic Groups.” Archives of Pediatrics and Adolescent Medicine, vol. 163, no. 4, 2009, p. 344.
Bickel, G., M. Nord, C. Price, W. Hamilton, and J. Cook “Guide to Measuring Household Food Security, Revised 2000.” U.S. Department of Agriculture, Economic Research Service. Washington DC: USDA 2000.
Brown, B., C. Noonan, B. Bentley, K. Conway, M. Corcoran, K. FourStar, S. Gress, and S. Wagner. “Acanthosis Nigricans Among Northern Plains American Indian Children.” The Journal of School Nursing, vol. 26, no. 6, 2010, p. 450.
Caballero, B., J. Himes, T. Lohman, S. M. Davis, J. Stevens, M. Evans, S. Going, and J. Pablo. “Body Composition and Overweight Prevalence in 1704 Schoolchildren from 7 American Indian Communities.” The American Journal of Clinical Nutrition, vol. 78, no. 2, 2003, p. 308.
Centers for Disease Control and Prevention. “State Prevalence Among Low-Income Children Aged 2 to 4 Years.” Pediatric Nutrition Surveillance System, 2009. Available at http://www.cdc.gov/obesity/childhood/data.html. Accessed November 10, 2011.
———. “Prevalence of Overweight, Infants and Children Less Than 2 years of Age, Growth Charts.” 2010a. Available at http://www.cdc.gov/growthcharts/.
———. “Summary of Trends in Growth and Anemia Indicators by Race/Ethnicity, Table 18 D.” Pediatric Nutrition Surveillance System, 2010b. Accessed at http://www.cdc. gov/pednss/how_to/interpret_data/index.htm.
Cole, N. “Characteristics of Native American WIC Participants, On and Off Reservations.” U.S. Department of Agriculture, Food and Nutrition Service, Office of Analysis, Nutrition and Evaluation. Nutrition Assistance Program Report Series, WIC-02-NAM. Alexandria, VA: USDA Food and Nutrition Service, 2002.
23

Indian Children and USDA Programs Mathematica Policy Research
Coleman-Jensen, Alisha, Mark Nord, Margaret Andrews, and Steven Carlson. “Household Food Security in the United States: 2010.” Economic Research Report No. ERR-125. Washington, DC: USDA Economic Research Service, September 2011.
Collins, A., C. Dun Rappaport, N. Burstein. “WIC Breastfeeding Peer Counseling Study, Final Implementation Report” U.S. Department of Agriculture, Food and Nutrition Service, Office of Research and Analysis, WIC-10-BPC, Alexandria, VA: USDA, June 2010.
Conner, P., S. Bartlet, M. Mendelson, K. Condon, and J. Sutcliffe. “WIC Participant and Program Characteristics 2008.” U.S. Department of Agriculture, Food and Nutrition Service, Office of Research and Analysis, WIC-08-PC. Alexandria, VA: USDA Food and Nutrition Service, 2010.
Dabelea, D., J. DeGroat, C. Sorrelman, M. Glass, C. Percy, C. Avery, D. Hu, R. D’Agostino, J. Beyer, and G. Imperatore. “Diabetes in Navajo Youth.” Diabetes Care, vol. 32, supplement no. 2, 2009, p. S141.
Dabelea, D., R. Hanson, P. Bennett, J. Roumain, W. Knowler, and D. Pettitt. “Increasing Prevalence of Type II Diabetes in American Indian Children.” Diabetologia, vol. 41, no. 8, 1998, pp. 904–910.
Economic Research Service. “Food Security in the United States.” Accessed at http://www. ers.usda.gov/briefing/Foodsecurity/, November 19, 2011.
Fagot-Campagna, A., and N. Ríos Burrows. “The Public Health Epidemiology of Type 2 Diabetes in Children and Adolescents: A Case Study of American Indian Adolescents in the Southwestern United States.” Clinica Chimica Acta, vol. 286, no. 1–2, 1999, pp. 81–95.
Finegold, K., N. Pindus, L. Wherry, S. Nelson, T. Triplett, and R. Capps. “Background Report on the Use and Impact of Food Assistance Programs on Indian Reservations.” Economic Research Service, Food and Nutrition Assistance Research Program, no. CCR-4. Washington, DC: USDA Economic Research Service, January 2005.
Franks, P., R. Hanson, W. Knowler, M. Sievers, P. Bennett, and H. Looker. “Childhood Obesity, Other Cardiovascular Risk Factors, and Premature Death.” New England Journal of Medicine, vol. 362, no. 6, 2010, pp. 485–493.
Gordon-Larsen, P., L. Adair, and B. Popkin. “The Relationship of Ethnicity, Socioeconomic Factors, and Overweight in US Adolescents.” Obesity, vol. 11, no. 1, 2003, pp. 121–129.
Gundersen, C. “Measuring the Extent, Depth, and Severity of Food Insecurity: An Application to American Indians in the USA.” Journal of Population Economics, vol. 21, no. 1, 2008, pp. 191–215.
Halpern P. “Obesity and American Indians/Alaska Natives.” Report submitted to the U.S. Department of Health and Human Services, Office of the Assistant Secretary for Planning and Evaluation. Washington, DC: DHHS OASPE, April 2007.
24

Indian Children and USDA Programs Mathematica Policy Research
Harper, E. “WIC Participant Characteristics, 2008.” Personal Communication, December 5, 2011.
Harper, E., R. Orbeta, L. Southworth, K. Meade, R. Cleveland, S. Gordon, M. Buckley, and J. Hirschman. “FDPIR Food Package Nutritional Quality: Report to Congress.” U.S. Department of Agriculture, Food and Nutrition Service, Office of Research and Analysis, Special Nutrition Programs Report FD-08-FDPIR. Alexandria, VA: USDA November 2008.
Harwell, T., J. McDowall, K. Moore, A. Fagot-Campagna, S. Helgerson, and D. Gohdes. “Establishing Surveillance for Diabetes in American Indian Youth.” Diabetes Care, vol. 24, no. 6, 2001, p. 1029.
Hillabrant, W., M. Rhoades Jr., N. Pindus, and J. Trutko. “The Evaluation of the Tribal Welfare-to-Work Grants Program: Initial Implementation Findings.” Princeton, NJ: Mathematica Policy Research, Inc., 2001.
Holm, J., N. Vogeltanz-Holm, D. Poltavski, and L. McDonald. “Assessing Health Status, Behavioral Risks, and Health Disparities in American Indians Living on the Northern Plains of the U.S.” Public Health Reports, vol. 125, no. 1, 2010, pp. 68–78.
Indian Health Service. “Special Diabetes Program for Indians: 2007 Report to Congress.” 2009.
Institute of Medicine. “WIC Food Packages: Time for a Change” Washington, DC: The National Academies Press, 2005.
———. “Hunger and Obesity: Understanding a Food Insecurity Paradigm: Workshop Summary.” Washington, DC: The National Academies Press, 2011.
Knowler, W., P. Bennett, R. Hamman, and M. Miller. “Diabetes Incidence and Prevalence in Pima Indians: A 19-Fold Greater Incidence than in Rochester, Minnesota.” American Journal of Epidemiology, vol. 108, no. 6, 1978, p. 497.
Knowler, W., D. Pettitt, M. Saad, and P. Bennett. “Diabetes Mellitus in the Pima Indians: Incidence, Risk Factors and Pathogenesis.” Diabetes/Metabolism Reviews, vol. 6, no. 1, 1990, pp. 1–27.
Kumanyika, S., and S. Grier. “Targeting Interventions for Ethnic Minority and Low-Income Populations.” The Future of Children, 2006, pp. 187–207.
Liu, L., J. Lawrence, C. Davis, A. Liese, D. Pettitt, C. Pihoker, D. Dabelea, R. Hamman, B. Waitzfelder, and H. Kahn. “Prevalence of Overweight and Obesity in Youth with Diabetes in USA: The SEARCH for Diabetes in Youth Study.” Pediatric Diabetes, vol. 11, no. 1, 2010, pp. 4–11.
Mendlein, J., D. Freedman, D. Peter, B. Allen, C. Percy, C. Ballew, A. Mokdad, and L. White. “Risk Factors for Coronary Heart Disease Among Navajo Indians: Findings from the Navajo Health and Nutrition Survey.” The Journal of Nutrition, vol. 127, no. 10, 1997, p. 2099S.
25

Indian Children and USDA Programs Mathematica Policy Research
Moore, K., T. Harwell, J. McDowall, S. Helgerson, and D. Gohdes. “Three-Year Prevalence and Incidence of Diabetes Among American Indian Youth in Montana and Wyoming, 1999 to 2001.” The Journal of Pediatrics, vol. 143, no. 3, 2003, pp. 368–371.
Nord, M., and M. Prell. “Food Security Improved Following the 2009 ARRA Increase in SNAP Benefits”. Economic Research Report, no. ERR-116, 2011.
O’Connell, J., R. Yi, C. Wilson, S. Manson, and K. Acton. “Racial Disparities in Health Status: A Comparison of the Morbidity Among American Indian and U.S. Adults with Diabetes.” Diabetes Care, vol. 33, no. 7, 2010, pp. 1463–1470.
Ogden, C., and K. Flegal. “Changes in Terminology for Childhood Overweight and Obesity: National Health Statistics.” National Health Statistics Reports; No 25. Hyattsville, MD: National Center for Health Statistics, 2010.
Ogden, C. M. Carroll, L. Curtin, M. Lamb, K. Flegal. “Prevalence of High Body Mass Index in US Children and Adolescents, 2007-2008.” JAMA, 2010, vol. 303, no. 3, pp. 242-249.
Ogunwole, S. “We the People: American Indians and Alaska Natives in the United States.” Census 2000 Special Reports, 2006.
Pleis J., B. Ward, and J. Lucas. “Summary Health Statistics for U.S. Adults: National Health Interview Survey 2009.” National Center for Health Statistics, Vital and Health Statistics, vol. 10, no. 249, 2010.
Rao, S., P. Disraeli, and T. McGregor. “Impaired Glucose Tolerance and Impaired Fasting Glucose.” American Family Physician, vol. 69, no. 8, 2004, pp. 1961–1968.
Richards, T., and P. Patterson. “Native American Obesity: An Economic Model of the ‘Thrifty Gene’ Theory.” American Journal of Agricultural Economics, vol. 88, no. 3, 2006, p. 542.
Ríos Burrows, N., K. Acton, L. Geiss, and K. Venkat Narayan. “Trends in Diabetes Prevalence in American Indians and Alaska Natives: An Increasing Burden among Younger People.” Diabetes, vol. 47, no. suppl 1, 1998, pp. A187.
Ríos Burrows, N., L. Geiss, M. Engelgau, and K. Acton. “Prevalence of Diabetes Among Native Americans and Alaska Natives, 1990–1997: An Increasing Burden.” Diabetes Care, vol. 23, no. 12, 2000, p. 1786.
Roberts, H., R. Jiles, A. Mokdad, G. Beckles, and N. Ríos-Burrows. “Trend Analysis of Diagnosed Diabetes Prevalence Among American Indian/Alaska Native Young
Adults—United States, 1994–2007.” Ethnicity & Disease, vol. 19, no. 3, 2009, pp. 276–279.
Savage, P., P. Bennett, R. Senter, and M. Miller. “High Prevalence of Diabetes in Young Pima Indians: Evidence of Phenotypic Variation in a Genetically Isolated Population.” Diabetes, vol. 28, no. 10, 1979, p. 937.
26

Indian Children and USDA Programs Mathematica Policy Research
SEARCH for Diabetes in Youth Study Group (A. Liese, R. D’Agostino Jr., R. Hamman, P. Kilgo, J. Lawrence, L. Liu, B. Loots, B. Linder, S. Marcovina, B. Rodriguez, D. Standiford, and D. Williams). “The Burden of Diabetes Mellitus Among US Youth: Prevalence Estimates from the SEARCH for Diabetes in Youth Study.” Pediatrics, vol. 118, no. 4, 2006, pp. 1510–1518.
Story, M., J. Stevens, J. Himes, E. Stone, B. Holy Rock, B. Ethelbah, and S. Davis. “Obesity in American-Indian Children: Prevalence, Consequences, and Prevention.” Preventive Medicine, vol. 37, 2003, pp. S3–S12.
Strauss, K. “Evidence-Based Public Health Responses to the Overweight Crisis in American Indian and Alaska Native Communities.” The IHS Primary Care Provider, vol. 35, no. 6, 2010, pp. 116–122.
Thomas, S., and D. Cook. “Breastfeeding Duration and Prevalence of Overweight Among 4- to 5-Year Olds.” The IHS Primary Care Provider, vol. 30, no. 4, 2005.
Trippe, C., and B. Schechter. “Individuals by Race and Receipt of Food Assistance, 2008.” Memorandum submitted to Bob Dalrymple and Jenny Genser, Office of Research and Evaluation, USDA Food and Nutrition Service. Washington, DC: Mathematica Policy Research, September 1, 2010.
U.S. Census Bureau. “American Community Survey 1-year Estimates.” American FactFinder, 2011a. Available at http://factfinder2.census.gov/faces/nav/jsf/pages/index.xhtml, 2011a. Accessed November 10, 2011.
U.S. Census Bureau. “American Indian and Alaska Native Map.” Census Redistricting Data (Public Law 94-171) Summary File, Table P1 and 2010 Census Summary File, 2011b. Available at http://www.census.gov/geo/www/maps/aian2010_wall_map/aian_wall_ map.html. Accessed November 19, 2011.
———. “U.S. Census 2000.” American FactFinder, 2011c. Available at http://fact finder2.census.gov/faces/nav/jsf/pages/index.xhtml. Accessed November 10, 2011.
———. “U.S. Census 2010.” American FactFinder, 2011d. Available at http://fact finder2.census.gov/faces/nav/jsf/pages/index.xhtml. Accessed November 10, 2011.
U.S. Census Bureau and Bureau of Labor Statistics. “Current Population Survey: Food Security Supplement, Three Year Averages.” Healthy People 2010 Database, Objective: 19–18. —October 2011. Available at http://wonder.cdc.gov. Accessed November 7, 2011.
U.S. Department of Agriculture. “Food and Nutrition Service Program Data.” Alexandria, VA: USDA Food and Nutrition Service, November 2011a. Available at http://www.fns. usda.gov/fns/data.htm. Accessed November 10, 2011.
———. “Food and Nutrition Service: Monthly Data, Agency Level, Participation and Food Cost by Category per Person.” Alexandria, VA: USDA Food and Nutrition Service, November 2011b. Available at http://www.fns.usda.gov/pd/wicmain. htm. Accessed November 10, 2011.
27

Indian Children and USDA Programs Mathematica Policy Research
28
U.S. Department of the Interior. “Healthy Schools.” 2011. Available at http://www.doi.gov/letsmove/indiancountry/eathealthy/Healthy-Schools.cfm. Accessed November 14, 2011.
Usher, C., D. Shanklin, and J. Wildfire. “Evaluation of the Food Distribution Program on Indian Reservations.” Alexandria, VA: U.S. Department of Agriculture, Food and Nutrition Service, 1990.
Ver Ploeg M., V. Breneman, T. Farrigan, K. Hamrick, D. Hopkins, P.Kaufman, B. Lin, M. Nord, T. Smith, R. Williams, K. Kinnison, C. Olander, A. Singh, and E. Tuckermanty. “Access to Affordable and Nutritious Food: Measuring and Understanding Food Deserts and Their Consequences.” Economic Research Service, no. AP-036. Washington, DC: USDA Economic Research Service, 2009.
Wang, Y., and M. Beydoun. “The Obesity Epidemic in the United States—Gender, Age, Socioeconomic, Racial/Ethnic, and Geographic Characteristics: A Systematic Review and Meta-Regression Analysis.” Epidemiologic Reviews, vol. 29, no. 1, 2007.
Weir, E., and L. Lipscombe. “Metabolic Syndrome: Waist Not Want Not.” Canadian Medical Association Journal, vol. 170, no. 9, 2004, p. 1390.
Yurgalevitch, S., A. Kriska, T. Welty, O. Go, D. Robbins, and B. Howard. “Physical Activity and Lipids and Lipoproteins in American Indians Ages 45–74.” Medicine & Science in Sports & Exercise, vol. 30, no. 4, 1998.
Zenk, S. N., A. J. Schulz, B. A. Israel, S. A. James, S. Bao, and M. L. Wilson. “Neighborhood racial composition, neighborhood poverty, and the spatial accessibility of supermarkets in metropolitan Detroit.” American Journal of Public Health. vol 95, no.4, 2005, pp. 660-667.

Indian Children and USDA Programs Mathematica Policy Research
APPENDIX A
DEFINING THE TARGET POPULATION
Because American Indians are a small proportion (less than 2 percent) of the Nation’s population, detailed data on the characteristics of American Indians are largely derived from the decennial Census or from combining several years of the American Community Survey (a continuing survey that replaced the Census long form). In 2000, the Census began allowing respondents to report multiple races, which led to a large jump in the numbers reporting themselves as American Indians or Alaska Natives. In Census 2010, 44 percent of those who checked they were AI/AN also checked another race, most often white (U.S Census Bureau 2011b). The Current Population Survey, a national survey of the demographic and labor force characteristics of U.S. households, began to allow multiple race responses in 2003 (Gundersen 2008); again, race data from before and after this change are not comparable.
Administrative data sources on American Indians use other approaches. The IHS eligible population includes all persons living on reservations and those living nearby who can document they are members of a recognized tribe. The IHS, a Federal agency, maintains a database of all those who use its services and publishes selected aggregate statistics from these data; it provides the data as well to academic programs focused on American Indians for research purposes, but, for privacy reasons, does not make public-use versions available.
The Special Supplemental Nutrition Program for Women, Infants, and Children Participant Characteristics Study (WIC PC), sponsored by USDA’s Food and Nutrition Service, collects administrative data on a census of all WIC participants every two years. WIC’s target population includes low-income pregnant women, postpartum mothers (breastfeeding mothers for up to a year after birth; nonbreastfeeding mothers for up to six months), and children younger than 5 years old. Nonetheless, it provides a large body of information on disadvantaged Indian families both on and off reservations (Cole 2002).
The WIC PC system switched from a combined race/ethnicity variable to one that asked separate race and ethnicity questions for WIC PC 2006. To implement this change, Hispanic participants had to indicate a race for the first time; large numbers were coded as AI/AN, particularly in California, leading to a major jump in the number of AI/AN WIC participants in WIC PC data (Conner et al. 2010).
Although section 141 of the HHFKA, in calling for this report, referred to American Indians “on reservations,” we use a slightly broader group in this report—those in “Indian Country.” As specified in law (U.S. Code, Title 18, Part 1, Chapter 53, Section 1151, for example), the term Indian Country refers to reservations and other tribal lands; this is what the Census Bureau refers to as “American Indian areas.” American Indian areas include American Indian reservations and/or off-reservation trust lands (Federal), Oklahoma tribal statistical areas, tribal designated statistical areas, American Indian reservations (State), and State-designated American Indian statistical areas. We use the term Indian Country for American Indian areas in this report.
29

Indian Children and USDA Programs Mathematica Policy Research
30
There are two data sources where the populations considered are “on or near reservations,” which are slightly different than the definition of Indian Country just described. The first is the IHS’s data on enrolled participants, described above. The second is the Cole (2002) study of American Indian WIC Participants “on or near reservations.” Cole (2002), in her study of WIC participants on and off reservations, mapped the distance between the local WIC agency serving each participant and the nearest reservation, and defined “on or near reservations” as WIC participants served by WIC local agencies that included all or part of a reservation in their service area or were located within 20 miles of a reservation. In the main text of this report, these two definitions are also referred to as Indian Country.

Indian Children and USDA Programs Mathematica Policy Research
APPENDIX B
FOOD SECURITY MEASURES
Food security is assessed using an 18-item survey developed by USDA (Bickel et al. 2000; Economic Research Service 2011). Data are collected annually from a nationally representative sample of about 50,000 households in the December supplement to the CPS.13 Estimates for AI/AN households combine samples from at least three successive years of the CPS to obtain an adequate sample size. Households with children in which the household head responds affirmatively to 3 or more questions are considered food insecure; these households in turn are divided into two groups: households who respond affirmatively to 3 to 5 questions are said to have low food security, while households where the head responds affirmatively to 6 or more of the 18 questions are said to have very low food security. More specifically, households are said to have very low food security if one or more members cut the size of meals or skipped meals because they could not afford to buy food.
Eight of the 18 questions only apply in households with children less than 18 years old. A scale based on just these eight questions is known as the children’s food security scale, although it is also a household-level measure. Households who respond affirmatively to two or more of the eight child-related questions are said to have food insecurity among children, while those who respond affirmatively to five or more are said to have very low food security among children.14
13 Data are collected both for an annual reference period and a 30-day reference period. All figures
discussed here are for the annual reference period. 14 A scale based on the 10 questions that are asked of all households is sometimes used—these questions
are known as the “adult” scale, or a measure of food insecurity among adults in the household. Gundersen (2008) also presents some results for this scale.
31

Indian Children and USDA Programs Mathematica Policy Research
APPENDIX C
OVERWEIGHT AND OBESITY MEASURES FOR CHILDREN
Overweight and obesity are both labels for ranges of weight that are greater than what is considered healthy for a given height, as these ranges have been shown to increase the likelihood of health problems such as diabetes and cardiovascular disease. Body mass index (BMI) was the indicator used to assess overweight and obesity in the data presented in this report.
BMI-for-age and gender are used to assess weight among children 2 to 19 years of age (Ogden and Flegal 2010). BMI is a weight-for-height index defined as weight in kilograms divided by the square of height in meters. BMI is plotted on the CDC BMI-for-age growth charts to obtain a percentile ranking, which indicates a child’s BMI relative to other children throughout the U.S. (the reference population). BMI-for-age weight-status categories and the corresponding percentiles are shown in Table C.1. For children ages 2–19, overweight is defined as 85th to less than the 95th percentile among the same age and gender. For this age group, obese is defined as greater than or equal to the 95th percentile among the same age and gender (Ogden and Flegal 2010). Notably, excess weight in infants (0–11 months) and toddlers (1 to < 2 years) is assessed using recumbent length instead of height. For this youngest age group, overweight is defined as weight at or above the 95th percentile of the sex-specific 2000 CDC weight-for-recumbent-length growth charts, which are independent of age (CDC 2010a).
It is critical to note that the definitions of the terms overweight and obese have changed in the last decade (Table C.2). Prior to 2007, overweight was defined as a BMI at or above the 95th percentile of a specified reference population and the designation of ‘‘at risk for overweight’’ was used for BMI values that were between the 85th and the 95th percentiles of BMI for age (Ogden and Flegal 2010). The American Medical Association expert committee proposed changes to the terminology to more effectively convey the seriousness and medical nature of excess weight for children above the 95th percentile.
Table C.1. Definitions of Overweight and Obese Terminology
Age BMI Measure Used Current Definition of Overweight Current Definition of
Obese
0–11 months
weight-for-recumbent length
≥ 95th percentile NA
1 to < 2 years
weight-for-recumbent length
≥ 95th percentile NA
2–19 years weight-for-height 85th to < 95th percentile ≥ 95th percentile
Table C.2. Changes in Terminology
BMI Index for 2- to 19-Year-Olds 1994 Terminology 2007 Terminology
5th to < 85th percentile Healthy Weight Healthy Weight
85th to < 95th percentile At Risk for Overweight Overweight
≥ 95th percentile Overweight Obese
32

www.mathematica-mpr.com
Improving public well-being by conducting high-quality, objective research and surveys
Princeton, NJ ■ Ann Arbor, MI ■ Cambridge, MA ■ Chicago, IL ■ Oakland, CA ■ Washington, DC
Mathematica® is a registered trademark of Mathematica Policy Research