additional monitoring at abraham lincoln elementary school ... · 9/17/13 1 sat initiative:...
TRANSCRIPT


9/17/13
1
SAT Initiative: Additional Monitoring at Abraham Lincoln Elementary School (East Chicago, IN)
This document describes the analysis of follow up air monitoring and other data collected under EPA’s initiative to assess potentially elevated air toxics levels at some of our nation’s schools. The document has been prepared for technical audiences (e.g., risk assessors, meteorologists) and their management. It is intended to describe the technical analysis of data collected for this school in clear, but generally technical, terms. A summary of this analysis is presented on the page focused on this school on EPA’s website (www.epa.gov/schoolair).
I. Executive Summary
Air monitoring had been conducted at Abraham Lincoln Elementary School and the East Chicago Water Plant as part of the EPA initiative to monitor specific air toxics in the outdoor air around priority schools.
This school was selected for additional monitoring based on elevated ambient concentrations of manganese in air outside the school monitored during the initial phase. See the initial report for additional information (http://www.epa.gov/schoolair/pdfs/AbrahamLinTechReport.pdf). In addition to the initial school site, the East Chicago Water Plant was selected for additional monitoring due to its closer proximity to the source.
The additional air monitoring was performed from September 5, 2010, to April 3, 2011, for manganese and other metals in particulate matter less than 10 microns (PM10) at Abraham Lincoln Elementary School and at a second monitoring site, the East Chicago Water Plant, which is closer to the source.
Measured levels of manganese (PM10) and the associated longer-term concentration estimate were slightly elevated in the first round of monitoring, consistent with historical data from the area. The elevated level of manganese (PM10) indicated a potential for greater concern in areas closer to the source, particularly as the nearby source operations were depressed from usual operating conditions during the first round of air monitoring. It was determined that additional data, particularly at locations closer to the source, would assist in further characterizing potential exposure in the area.
The second round of monitoring indicates that the longer-term concentration estimate for manganese (PM10) are near levels of potential concern for long-term continuous exposure at the East Chicago Water Plant monitoring location, a site closer to the source than the Abraham Lincoln Elementary School.
The second round of monitoring indicates that the longer-term concentration estimate for manganese (PM10) are below levels of concern at the Abraham Lincoln Elementary School.
The Indiana Department of Environmental Management (IDEM) is aware of these monitored values, which are consistent with historical values in this area, and will continue to oversee industrial facilities in the area through air permitting and other programs.
R5 currently has an ongoing enforcement case with the source.

9/17/13
2
II. Background on this Initiative As part of the follow-up to the EPA initiative to implement Administrator Lisa Jackson’s commitment to assess potentially elevated air toxics levels at some of our nation’s schools, EPA and state and local air pollution control agencies continued to monitor specific (key) air toxics in the outdoor air around priority schools. (http://www.epa.gov/schoolair/schools.html).
For information about the initial monitoring for Abraham Lincoln Elementary, please go to http://www.epa.gov/schoolair/AbrahamLinInfo.html.
The schools selected for additional monitoring were chosen based on monitored concentrations in the first round of sampling that were above levels of concern, warranting additional insight into the air quality surrounding the school and in the community. Monitors were placed at these locations for approximately 7 months and air samples were taken on at least 30 different days during that time. The samples were analyzed for specific air toxics identified for air monitoring at the school and surrounding community based on the initial round of sampling.
These monitoring results and other information collected at the school and water plant during this follow-up allowed us to:
assess specific air toxics levels occurring at these sites and associated estimates of longer-term concentrations in light of health risk-based criteria for long-term exposures,
better understand, in many cases, potential contributions from nearby sources to key air toxics concentrations at the schools,
consider what next steps might be appropriate to better understand and address air toxics at the school, and
improve the information and methods we will use in the future (e.g., NATA) for estimating air toxics concentrations in communities across the U.S.
Assessment of air quality under this additional monitoring initiative is specific to the elevated air toxics identified during the initial monitoring. This additional monitoring initiative is being implemented in addition to ongoing state, local, and national air quality monitoring and assessment activities, including those focused on criteria pollutants (e.g., ozone and particulate matter) or existing, more extensive, air toxics programs. Several technical documents prepared for this project provide further details on aspects of monitoring and data interpretation and are available on the EPA website (e.g., www.epa.gov/schoolair/techinfo.html). The full titles of these documents are provided here:
School Air Toxics Ambient Monitoring Plan Quality Assurance Project Plan For the EPA School Air Toxics Monitoring Program Schools Air Toxics Monitoring Activity (2009), Uses of Health Effects Information in
Evaluating Sample Results Information on health effects of air toxics being monitored1 and educational materials describing risk concepts2 are also available from EPA’s website. 1 For example, http://www.epa.gov/schoolair/pollutants.html, http://www.epa.gov/ttn/fera/risk_atoxic.html.

9/17/13
3
III. Basis for Selecting this School and the Air Monitoring Conducted This school was selected for additional monitoring after the initial monitoring identified concentrations of pollutants above levels of concern. The operational status of industry at the time and the possible impacts on the community were also taken into consideration. Based on this information, an additional site at the water plant was selected to monitor an area closer to the source. (Figure 1) Additional monitoring commenced at this school on September 5, 2010, and continued through April 3, 2011; monitoring commenced at the water plant on September 5, 2010, and continued through April 3, 2011. During this period, 32 valid samples of airborne particles were collected at the school, and 35 valid samples of airborne particles were collected at the water plant using a PM10 sampler3. The samples were analyzed for manganese (the key pollutant at this school) and for a small standardized set of additional metals that are routinely included in the analytical methods for the key pollutant. All sampling methodologies are described in EPA’s schools air toxics monitoring plan (http://www.epa.gov/schoolair/techinfo.html).4
IV. Monitoring Results and Analysis
A. Background for the SAT Analysis
Please see the initial report (http://www.epa.gov/schoolair/pdfs/AbrahamLinTechReport.pdf) for the background information on the SAT Analysis.
B. Chemical Concentrations Using the analysis approach described in the initial monitoring report (http://www.epa.gov/schoolair/pdfs/AbrahamLinTechReport.pdf), we analyzed the chemical concentration data for the key pollutant, manganese (Table 1 and Figure 2), with regard to the areas of interest identified below.
2 For example, http://www.epa.gov/ttn/atw/3_90_022.html, http://www.epa.gov/ttn/atw/3_90_024.html. 3 In general, this sampler collects airborne particles with a diameter of 10 microns or smaller. 4 IDEM staff operated the monitors and sent the sample filters to the analytical laboratory under contract to EPA.

9/17/13
4
Manganese, key pollutant:
Do the monitoring data indicate influence from a nearby source?
The monitoring data include several manganese (PM10) concentrations that are higher than concentrations commonly observed in other locations nationally.5
The monitor sited closer to the source (water plant) showed higher concentrations of manganese than the school that was farther downwind.
Do the monitoring data indicate elevated levels that pose significant long-term health concerns?
The longer-term concentration estimate for manganese at the water plant is above and the school is just below the long-term comparison level for continuous, long-term exposures (Table 1).6
The long-term comparison level is a continuous exposure concentration (24 hours a day, all year, over a lifetime) associated with little risk of adverse effect; it is not an exposure concentration at which effects have been observed or are predicted to occur.7
As manganese has not been found to be carcinogenic, it has no cancer-based comparison level.8
5 For example, 30 of the 32 valid samples taken at the water plant and 29 of the 35 valid samples taken at the school (Table 2) were higher than 75 percent of samples collected at the National Air Toxics Trends Stations (NATTS) from 2004-2008 (Appendix A). Because these NATTS sites are generally sited so as to not be influenced by specific nearby sources, EPA is using the 75th percentile point of concentrations at these sites as a benchmark of indicating potential influence from a source nearby to the school. 6 The upper end of the interval is nearly 1.4 times the mean of the monitoring data at the water plant and 1.3 times the mean of the monitoring data at the school. It is 60% higher than the long-term noncancer-based comparison level at the water plant and 1% below the long-term noncancer-based comparison at the school. 7 The manganese comparison level is EPA’s RfC (50 ng/m3). Manganese air concentrations at which health effects have been documented are higher than the RfC (http://www.epa.gov/ttn/atw/hlthef/manganes.html#conversion). EPA recognizes that ATSDR recently revised its chronic inhalation MRL for manganese (300 ng/m3; http://www.atsdr.cdc.gov/toxguides/toxguide-151.pdf) but maintains the hierarchy of toxicity values in which IRIS values are given first priority. The hierarchy and data analysis methods are described in the document Schools Air Toxics Monitoring Activity (2009), Uses of Health Effects Information in Evaluating Sample Results. 8 www.epa.gov/iris
The key finding drawn from the information on chemical concentrations and the considerations discussed below include:
The air sampling data collected at the water plant for manganese indicate influence from a nearby source, and the related longer-term concentration estimate is above the long-term comparison level for continuous, long-term exposures. This comparison level is a continuous exposure concentration associated with little risk of adverse effect; it is an exposure concentration appreciably below levels at which effects have been observed. The elevated levels at this location, however, indicate a potential concern for the community near the source.

9/17/13
5
Additionally, we did not identify any concerns regarding short-term exposures as each individual measurement is below the individual sample screening level for manganese (which is based on consideration of exposure all day, every day over a period ranging from a couple of weeks to longer for some pollutants).11
Multiple Pollutants:
Do the data collected for the air toxics monitored indicate the potential for other monitored pollutants to be present at levels that in combination with the key pollutant levels indicate an increased potential for cumulative impacts of significant concern (e.g., that might warrant further investigation)?
The data collected for the key and other air toxics and the associated longer-term concentration estimates do not pose significant concerns for cumulative health risk from these pollutants (Appendix B and C)9.
C. Wind and Other Meteorological Data Please see the initial report (http://www.epa.gov/schoolair/pdfs/AbrahamLinTechReport.pdf) for background on the wind and other meteorological data. The meteorological station operated by IDEM, located 2.5 WSW of the school and 3.0 miles WSW from the water plant collected wind speed and wind direction measurements beginning on September 5, 2010, and ending on April 3, 2011. The meteorological data collected on sampling days are presented in Figures 2 and Table 2. The nearest NWS station is at Lansing Municipal Airport in Lansing, IL. This station is approximately 8.7 miles SW of the school and 9.2 miles SW of the water plant. Measurements taken at that station include wind, temperature, and precipitation. Measurements taken during the second round are representative of meteorological data taken during 2002-2007.Wind speed and direction data collected at the Lansing Municipal Airport NWS station have been summarized in Table 2 and Appendix D.
9 We note that this initiative is focused on investigation for a school-specific set of key pollutants indicated by previous analyses (and a small set of others for which measurements are obtained in the same analysis). Combined impacts of pollutants or stressors other than those monitored in this project is a broader area of consideration in other EPA activities. General information on additional air pollutants is available at http://www.epa.gov/air/airpollutants.html.

9/17/13
6
What is the direction of the key source of manganese emissions in relation to the monitoring locations? The nearby industrial facility emitting the key pollutant into the air (described in
section III above) lies less than one mile north of the school and the water plant. Using the property boundaries of the full facility (in lieu of information regarding the
location of specific sources of emissions at the facility), we have identified an approximate range of wind directions to use in considering the potential influence of this facility on air concentrations at the school.
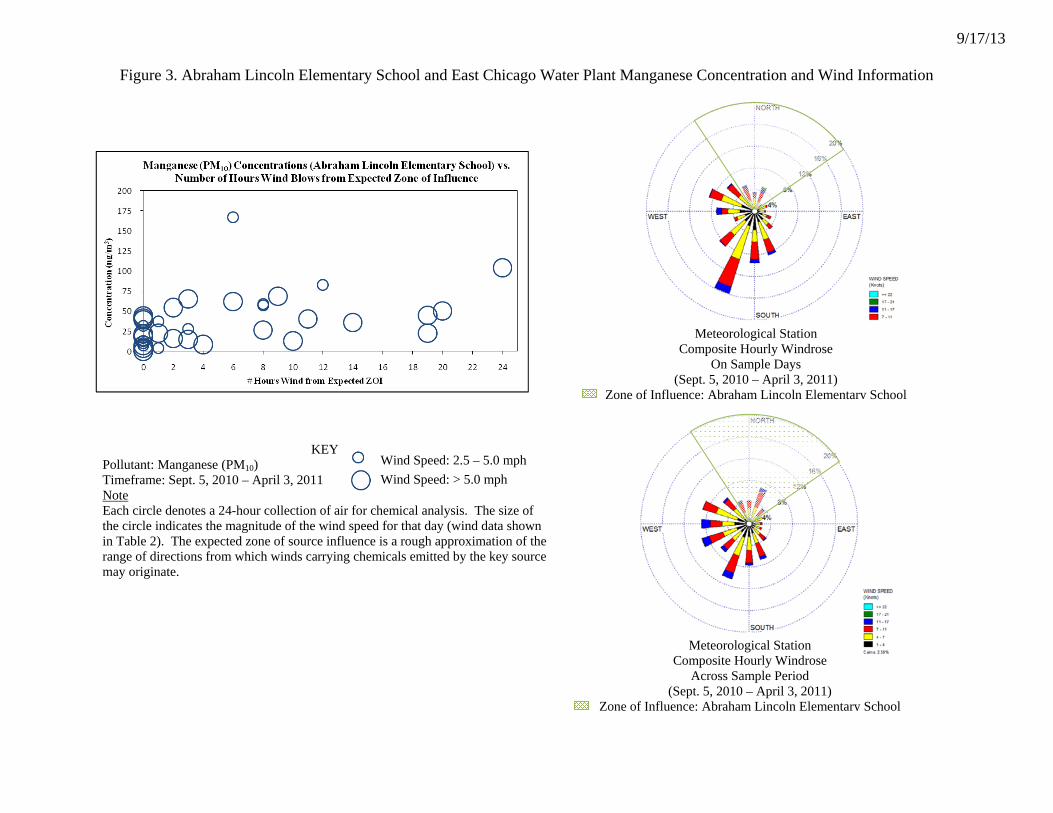
This general range of wind directions, from approximately 325 to 56 degrees, is referred to here as the expected zone of source influence (ZOI) for the Abraham Lincoln Elementary School monitor.
This general range of wind directions, from approximately 304 to 56 degrees, is referred to here as the expected zone of source influence (ZOI) for the East Chicago Water Plant monitor.
On days the air samples were collected, how often did wind come from direction of the
key source? For the water plant, there were 20 out of 32 sampling days and for the school there
were 18 out of 35 sampling days in which the on-site wind data had a portion of the winds from the corresponding ZOI. (Figures 2, Table 2).
How do wind patterns on the air monitoring days compare to those across the complete
monitoring period and what might be expected over the longer term at the monitoring site locations? Wind patterns across the air monitoring days appear similar to those observed over
the record of on-site meteorological data during the sampling period, particularly with regard to the expected ZOI.
Key findings drawn from this information and the considerations discussed below include:
Both the sampling results and the wind data indicate that some of the air samples were collected on days when the nearby key source was contributing to conditions at the school location.
The wind patterns across sampling dates are similar to those observed across the full
record of on-site meteorological data, with respect to the expected zone of source influence.
Our ability to provide a confident characterization of the wind flow patterns over the
long-term is somewhat limited; the NWS station at Lansing Municipal Airport during the sampling timeframe appears to represent the specific wind flow patterns at the school location.
The wind pattern at the NWS station during the sampling period is similar to the
historical long-term wind flow pattern at that same NWS station. Therefore, the 7-month sampling period may be representative of year-round wind patterns.

9/17/13
7
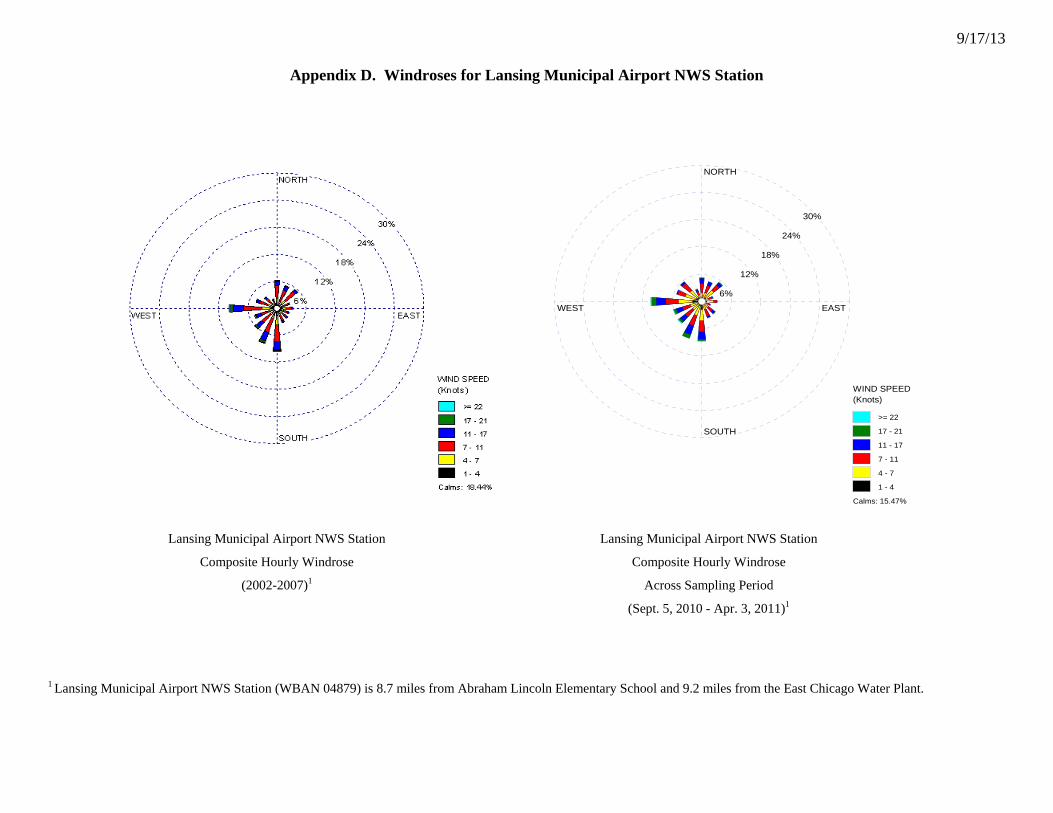
Wind patterns at the nearest NWS station (at Lansing Municipal Airport) during the monitoring period are similar to those recorded at the NWS station over the long-term (2002-2007 period; Appendix D), supporting the idea that regional meteorological patterns in the area during the monitoring period were consistent with long-term patterns. There is some uncertainty as to whether the general wind patterns at the school location or water plant for longer periods would be similar to the general wind patterns at the Lansing Municipal Airport (see below).
How do wind patterns at the school site compare to those at the Lansing Municipal
Airport NWS station, particularly with regard to prevalent wind directions and the direction of the key source? During the sampling period for which data are available both at the meteorological
station and at the reference NWS station (approximately 7 months), prevalent winds at the meteorological station and the NWS site are from the southwest. The windroses for the two sites during the sampling period (Figure 3 and Appendix D) show some similarities in wind flow patterns.
Are there other meteorological patterns that may influence the measured concentrations
at the school monitoring site? No, we did not observe other meteorological patterns that may influence the
measured concentrations at the school or water plant monitoring site.
V. Key Source Information
Was the source operating as usual during the monitoring period? The nearby source of the key pollutant has an operating permit issued by IDEM that
includes operating requirements.10 Information about the nearby source indicates that the facility had no significant
change in production during the monitoring period.
VI. Integrated Summary and Next Steps
A. Summary of Key Findings 1. Do the data collected at these locations indicate an elevated level of concern, as
implied by information that led to identifying this school for monitoring? Measured levels of manganese (PM10) continue to be slightly elevated. This
elevated level of manganese indicates a potential concern in areas closer to the source
2. Are there indications, e.g., from the meteorological or other data, that the sample set may not be indicative of longer-term air concentrations? Would we expect higher (or lower) concentrations at other times of year?
10 Operating permits, which are issued to air pollution sources under the Clean Air Act, are described at: http://www.epa.gov/air/oaqps/permits.

9/17/13
8
The data we have collected appear to reflect air concentrations during the entire monitoring period, with no indications that the sampling day conditions were inconsistent with conditions overall during this period.
Among the data collected for this site, we have none that would indicate generally higher (or lower) concentrations during other times of year. The wind flow patterns at the nearest NWS station during the sampling period appear to be representative of long-term wind flow at that station. The lack of long-term meteorological data at the school location limits our ability to confidently predict longer-term wind patterns at the school (which might provide further evidence relevant to concentrations during other times).
B. Next Steps for Key Pollutants
1. The Indiana Department of Environmental Management (IDEM) will continue to oversee industrial facilities in the area through air permits and other programs.
2. R5 currently has an ongoing enforcement case with the source.
VII. Figures and Tables
A. Tables
1. Abraham Lincoln Elementary School and East Chicago Water Plant – Key Pollutant Analysis.
2. Abraham Lincoln Elementary School and East Chicago Water Plant Key Pollutant Concentrations and Meteorological Data
B. Figures
1. Abraham Lincoln Elementary School and East Chicago Water Plant Map with Meteorological Sites
2. Abraham Lincoln Elementary School and East Chicago Water Plant – Key Pollutant (Manganese (PM10)) Analysis
3. Abraham Lincoln Elementary School and East Chicago Water Plant (East Chicago, IN) Manganese (PM10)
VIII. Appendices
A. National Air Toxics Trends Stations Measurements (2004-2008).
B. Analysis of Other (Non-Key) Air Toxics Monitored and Multiple-Pollutant Considerations.
Table B-1. Abraham Lincoln Elementary School and East Chicago Water Plant – Other Monitored Pollutant Analysis
C. Abraham Lincoln Elementary School and East Chicago Water Plant Pollutant Concentrations.
D. Windroses for Lansing Municipal Airport NWS Station

9/17/13
Table 1. Abraham Lincoln Elementary School and East Chicago Water Plant – Key Pollutant Analysis
Parameter Site Name Units Mean of
Measurements
95% Confidence Interval on the
Mean
Long-term Comparison Levela
Cancer-Basedb Noncancer-Basedc
Manganese (PM10)
East Chicago Water Plant
ng/m3 59.72d 36.79 - 82.65 NA 50
Abraham Lincoln Elementary School
ng/m3 38.21e 26.93 - 49.49
ng/m3 nanograms per cubic meter
NA not applicable a Details regarding these values are in the technical report, Schools Air Toxics Monitoring Activity (2009) Uses of Health Effects Information.
b Air toxics for which the upper 95% confidence limit on the mean concentration is above this level will be fully discussed in the text and may be considered a priority for potential follow-up activities, if indicated in light of the full set of information available for the site. Findings of the upper 95% confidence limit below 1% of the comparison level (i.e., where the upper 95% confidence limit is below the corresponding 1-in-1-million cancer risk based concentration) are generally considered a low priority for follow-up activity. Situations where the summary statistics for a pollutant are below this comparison level but above 1% of this level are fully discussed in the text of the report.
c Air toxics for which the upper 95% confidence limit on the mean concentration are near or below the noncancer-based comparison level are generally of low concern and will generally be considered a low priority for follow-up activity. Pollutants for which the 95% confidence limits extend appreciably above the noncancer-based comparison level are fully discussed in the school-specific report and may be considered a priority for follow-up activity, if indicated in light of the full set of information available for the site.
d The mean of measurements for manganese (PM10) is the average of all sample results, which include 32 detections that ranged from 4.13 to 200 ng/m3.
e The mean of measurements for manganese (PM10) is the average of all sample results, which include 35 detections that ranged from 3.53 to 167 ng/m3.

9/17/13
Table 2. Abraham Lincoln Elementary School and East Chicago Water Plant Key Pollutant Concentrations and Meteorological Data
Parameter Units
9/5/
2010
9/11
/201
0
9/17
/201
0
9/23
/201
0
9/29
/201
0
10/5
/201
0
10/1
1/20
10
10/1
7/20
10
10/2
3/20
10
10/2
9/20
10
11/4
/201
0
11/1
0/20
10
East Chicago Water Plant
Manganese (PM10) ng/m3 18.7 -- -- -- 103 113 130 200 28.9 52.8 307 74.6
% Hours w/Wind Direction from Expected ZOIa % 0.0 8.3 4.2 0.0 12.5 25.0 33.3 50.0 0.0 8.3 100.0 0.0
Abraham Lincoln Elementary School
Manganese (PM10) ng/m3 7.49 15.8 37.3 17.9 27.9 167 59 82.6 21.3 54.4 104 31.7
% Hours w/Wind Direction from Expected ZOIa % 0.0 0.0 0.0 0.0 12.5 25.0 29.2 50.0 0.0 4.2 66.7 0.0
Wind Speed (avg. of hourly winds) mph 4.6 5.4 3.2 10.0 2.9 1.8 3.2 3.9 9.0 5.8 10.5 4.6
Wind Direction (avg. of unitized vector)b deg. 202.7 192.4 203.7 194.3 207.1 292.1 268.8 12.4 192.5 236.7 343.2 152.2
% of Hours with Speed below 2 knots % 33.3 12.5 41.7 0.0 54.2 58.3 33.3 29.2 0.0 0.0 0.0 25.0
Lansing Municipal Airport NWS Station
Daily Average Temperature °F 60.8 65.5 62.2 74.3 58.9 49.5 66.3 55.1 57.7 41.1 44.9 54.8
Daily Precipitation inches 0.00 0.20 0.00 0.00 0.00 0.00 0.00 0.00 0.19 0.00 0.19 0.00
All precipitation and temperature data were from the Lansing Municipal Airport NWS Station. a Based on count of hours for which vector wind direction is from expected zone of influence. b Wind direction for each day is represented by values derived by scalar averaging of hourly estimates that were produced (by wind instrumentation's logger) as unitized vectors
(specified as degrees from due north).
-- No sample was conducted for this pollutant on this day or the result was invalidated.

9/17/13
Table 2. Abraham Lincoln Elementary School and East Chicago Water Plant Key Pollutant Concentrations and Meteorological Data
Parameter Units
11/1
6/20
10
11/2
2/20
10
11/2
8/20
10
12/4
/201
0
12/1
0/20
10
12/1
6/20
10
12/2
2/20
10
12/2
8/20
10
1/3/
2011
1/9/
2011
1/15
/201
1
1/21
/201
1
East Chicago Water Plant
Manganese (PM10) ng/m3 55.1 10.4 11.7 37.5 17.7 51.1 61.8 7.84 17.8 25 28.7 50.4
% Hours w/Wind Direction from Expected ZOIa % 33.3 0.0 0.0 45.8 0.0 0.0 58.3 0.0 0.0 0.0 41.7 12.5
Abraham Lincoln Elementary School
Manganese (PM10) ng/m3 57.4 44.2 3.53 40.2 39.2 12.6 35.7 -- 7.1 9.77 12.7 65.3
% Hours w/Wind Direction from Expected ZOIa % 33.3 0.0 0.0 25.0 0.0 0.0 41.7 0.0 0.0 0.0 0.0 0.0
Wind Speed (avg. of hourly winds) mph 4.7 11.7 8.2 6.3 7.1 4.2 7.8 7.2 6.8 3.1 8.2 6.9
Wind Direction (avg. of unitized vector)b deg. 58.9 205.8 165.2 55.9 204.1 206.2 317.4 206.0 209.9 231.8 289.7 269.3
% of Hours with Speed below 2 knots % 12.5 0.0 0.0 0.0 0.0 8.3 0.0 0.0 0.0 25.0 0.0 0.0
Lansing Municipal Airport NWS Station
Daily Average Temperature °F 40.1 61.6 30.5 30.0 30.1 22.0 29.2 19.2 26.4 18.8 25.0 8.1
Daily Precipitation inches 0.00 0.88 0.00 0.07 0.01 0.00 0.00 0.00 0.00 0.00 0.00 0.00
All precipitation and temperature data were from the Lansing Municipal Airport NWS Station.
a Based on count of hours for which vector wind direction is from expected zone of influence. b Wind direction for each day is represented by values derived by scalar averaging of hourly estimates that were produced (by wind instrumentation's logger) as unitized vectors
(specified as degrees from due north).
-- No sample was conducted for this pollutant on this day or the result was invalidated.

9/17/13
Table 2. Abraham Lincoln Elementary School and East Chicago Water Plant Key Pollutant Concentrations and Meteorological Data
Parameter Units
1/27
/201
1
2/2/
2011
2/8/
2011
2/14
/201
1
2/20
/201
1
2/26
/201
1
3/4/
2011
3/10
/201
1
3/16
/201
1
3/22
/201
1
3/28
/201
1
4/3/
2011
East Chicago Water Plant
Manganese (PM10) ng/m3 10.3 18 60.8 51.9 10.4 4.13 67 142 36.6 -- 30.8 76
% Hours w/Wind Direction from Expected ZOIa % 4.2 79.2 25.0 37.5 16.7 4.2 33.3 79.2 0.0 12.5 83.3 0.0
Abraham Lincoln Elementary School
Manganese (PM10) ng/m3 22.6 22.4 61.9 68.6 8.34 3.71 26.4 44.6 18.5 14.6 50.3 41.2
% Hours w/Wind Direction from Expected ZOIa % 0.0 62.5 12.5 33.3 16.7 4.2 33.3 45.8 0.0 12.5 83.3 0.0
Wind Speed (avg. of hourly winds) mph 7.2 12.7 8.0 9.0 8.6 4.5 7.6 8.1 5.7 8.8 9.0 12.0
Wind Direction (avg. of unitized vector)b deg. 244.7 337.2 291.9 341.3 106.2 205.4 178.7 319.4 216.5 78.7 38.2 170.5
% of Hours with Speed below 2 knots % 0.0 0.0 0.0 8.3 0.0 16.7 0.0 0.0 4.2 0.0 0.0 0.0
Lansing Municipal Airport NWS Station
Daily Average Temperature °F 21.9 22.6 18.9 40.8 32.4 30.8 46.6 35.9 43.8 43.1 31.2 51.8
Daily Precipitation inches 0.00 0.02 0.01 0.00 0.44 0.00 0.00 0.00 0.00 0.33 0.00 0.00
All precipitation and temperature data were from the Lansing Municipal Airport NWS Station.
a Based on count of hours for which vector wind direction is from expected zone of influence. b Wind direction for each day is represented by values derived by scalar averaging of hourly estimates that were produced (by wind instrumentation's logger) as unitized vectors
(specified as degrees from due north).
-- No sample was conducted for this pollutant on this day or the result was invalidated.

9/17/13
Figure 1. Abraham Lincoln Elementary School and East Chicago Water Plant Map with Meteorological Sites

9/17/13
Figure 2. Abraham Lincoln Elementary School and East Chicago Water Plant – Key Pollutant Analysis (Manganese (PM10)) Analysis
a Air toxics for which the upper 95% confidence limit on the mean concentration are near or below the noncancer-based comparison level are generally of low concern and will
generally be considered a low priority for follow-up activity. Pollutants for which the 95% confidence limits extend appreciably above the noncancer-based comparison level are fully discussed in the school-specific report and may be considered a priority for follow-up activity, if indicated in light of the full set of information available for the site.
0
25
50
75
100C
once
ntr
atio
n (
ng/
m3)
Manganese (PM10)a
Long-term noncancer-based comparison levela: 50 ng/m3
Lower 95% Confidence Level on the Mean: 36.79
Average: 59.72 ng/m3
Upper 95% Confidence Level on the Mean: 82.65
Upper 95% Confidence Level on the Mean: 49.49
Average: 38.21 ng/m3
Lower 95% Confidence Level on the Mean: 26.93
East Chicago Water Plant
Abraham Lincoln Elementary School
9/17/13
Figure 3. Abraham Lincoln Elementary School and East Chicago Water Plant Manganese Concentration and Wind Information
Meteorological Station Composite Hourly Windrose
On Sample Days (Sept. 5, 2010 – April 3, 2011)
Zone of Influence: Abraham Lincoln Elementary School
KEY Pollutant: Manganese (PM10) Timeframe: Sept. 5, 2010 – April 3, 2011 Note Each circle denotes a 24-hour collection of air for chemical analysis. The size of the circle indicates the magnitude of the wind speed for that day (wind data shown in Table 2). The expected zone of source influence is a rough approximation of the range of directions from which winds carrying chemicals emitted by the key source may originate.
Meteorological Station Composite Hourly Windrose
Across Sample Period (Sept. 5, 2010 – April 3, 2011)
Zone of Influence: Abraham Lincoln Elementary School
Wind Speed: 2.5 – 5.0 mph
Wind Speed: > 5.0 mph

9/17/13
Figure 3. Abraham Lincoln Elementary School and East Chicago Water Plant Manganese Concentration and Wind Information
Meteorological Station Composite Hourly Windrose
On Sample Days (Sept. 5, 2010 – April 3, 2011)
Zone of Influence: East Chicago Water Plant
Meteorological Station Composite Hourly Windrose
Across Sample Period (Sept. 5, 2010 – April 3, 2011)
Zone of Influence: East Chicago Water Plant
KEY Pollutant: Manganese (PM10) Timeframe: Sept. 5, 2010 – April 3, 2011 Note Each circle denotes a 24-hour collection of air for chemical analysis. The size of the circle indicates the magnitude of the wind speed for that day (wind data shown in Table 2). The expected zone of source influence is a rough approximation of the range of directions from which winds carrying chemicals emitted by the key source may originate.
Wind Speed: 2.5 – 5.0 mph
Wind Speed: > 5.0 mph

9/17/13
Appendix A. National Air Toxics Trends Stations Measurements (2004 – 2008)a
Pollutant Units # Samples Analyzed
% Detections
MaximumArithmetic
Meanb Geometric
Mean 5th
Percentile25th
Percentile50th
Percentile75th
Percentile95th
Percentile
Antimony (PM10) ng/m3 2,372 94% 43.30 1.71 1.21 ND 0.60 1.13 2.17 4.33
Arsenic (PM10) ng/m3 5,076 86% 47.70 0.93 0.70 ND 0.29 0.56 1.02 2.89
Beryllium (PM10) ng/m3 4,771 64% 1.97 0.05 0.02 ND ND <0.01 0.02 0.50
Cadmium (PM10) ng/m3 4,793 85% 15.30 0.27 0.17 ND 0.05 0.13 0.29 0.94
Chromium (PM10) ng/m3 5,094 92% 172.06 2.71 1.66 ND 0.93 1.98 2.85 7.10
Cobalt (PM10) ng/m3 2,614 91% 20.30 0.28 0.18 ND 0.08 0.15 0.27 1.00
Manganese (PM10) ng/m3 4,793 99% 734.00 10.39 5.20 <0.01 2.41 4.49 9.96 33.78
Mercury (PM10) ng/m3 1,167 81% 2.07 0.07 0.04 ND 0.01 0.02 0.06 0.32
Nickel (PM10) ng/m3 4,815 90% 110.10 2.05 1.49 ND 0.74 1.44 2.50 5.74
Selenium (PM10) ng/m3 2,382 96% 13.00 1.10 0.53 <0.01 0.24 0.53 1.07 5.50
Acetonitrile µg/m3 1,804 69% 542.30 3.55 0.72 ND ND 0.27 0.76 8.60
Acrylonitrile µg/m3 3,673 31% 5.51 0.06 0.10 ND ND ND 0.03 0.33
Benzene µg/m3 6,313 94% 10.19 1.03 0.84 ND 0.48 0.80 1.31 2.81
Bromomethane µg/m3 5,376 61% 120.76 0.11 0.05 ND ND 0.03 0.05 0.12
Butadiene, 1,3- µg/m3 6,427 67% 15.55 0.10 0.09 ND ND 0.05 0.13 0.38
Carbon disulfide µg/m3 1,925 91% 46.71 2.32 0.25 ND 0.03 0.09 0.96 12.65
Carbon tetrachloride µg/m3 6,218 86% 1.76 0.52 0.58 ND 0.47 0.57 0.65 0.87
Chloro-1,3-butadiene, 2- µg/m3 2,341 11% 0.17 <0.01 0.03 ND ND ND ND 0.02
Chlorobenzene µg/m3 5,763 30% 1.10 0.02 0.04 ND ND ND 0.01 0.11
Chloroethane µg/m3 4,625 37% 0.58 0.02 0.04 ND ND ND 0.03 0.08
Chloroform µg/m3 6,432 73% 48.05 0.17 0.14 ND ND 0.10 0.17 0.61
Chloromethane µg/m3 5,573 95% 19.70 1.17 1.20 ND 1.03 1.18 1.36 1.68
Chlorotoluene, alpha- µg/m3 3,046 9% 2.49 0.01 0.05 ND ND ND ND 0.05
Dibromoethane, 1,2- µg/m3 5,646 19% 4.15 0.01 0.05 ND ND ND ND 0.05
Dichlorobenzene, p- µg/m3 5,409 60% 13.65 0.19 0.16 ND ND ND 0.18 0.90
Dichloroethane, 1,1- µg/m3 5,670 16% 0.36 0.01 0.02 ND ND ND ND 0.02
Dichloroethylene, 1,1- µg/m3 5,480 19% 0.44 0.01 0.02 ND ND ND ND 0.04
Dichloropropane,1,2- µg/m3 6,225 17% 1.80 0.01 0.03 ND ND ND ND 0.04

9/17/13
Appendix A. National Air Toxics Trends Stations Measurements (2004 – 2008)a
Pollutant Units # Samples Analyzed
% Detections
MaximumArithmetic
Meanb Geometric
Mean 5th
Percentile25th
Percentile50th
Percentile75th
Percentile95th
Percentile
Dichloropropylene, Cis -1,3- µg/m3 4,705 18% 0.80 0.01 0.05 ND ND ND ND 0.11
Dichloropropylene, Trans -1,3- µg/m3 4,678 18% 1.13 0.02 0.05 ND ND ND ND 0.11
Ethyl acrylate µg/m3 1,917 1% 0.08 <0.01 0.04 ND ND ND ND ND
Ethylbenzene µg/m3 6,120 84% 8.84 0.42 0.32 ND 0.10 0.29 0.53 1.33
Ethylene dichloride µg/m3 6,143 38% 4.49 0.03 0.05 ND ND ND 0.04 0.09
Hexachloro-1,3-butadiene µg/m3 3,727 20% 0.97 0.03 0.10 ND ND ND 0.00b
0.18
Methyl methacrylate µg/m3 1,917 9% 14.05 0.13 0.49 ND ND ND 0.00b
0.53
Methyl tert-butyl ether µg/m3 4,370 41% 20.50 0.28 0.12 ND ND ND 0.04 1.53
Methyl-2-pentanone, 4- µg/m3 2,936 60% 2.95 0.11 0.09 ND ND 0.02 0.12 0.49
Methylene chloride µg/m3 6,206 82% 214.67 0.59 0.34 ND 0.14 0.28 0.49 1.35
Styrene µg/m3 6,080 70% 27.22 0.16 0.11 ND ND 0.05 0.16 0.60
Tetrachloroethane, 1,1,2,2- µg/m3 5,952 20% 2.47 0.02 0.04 ND ND ND ND 0.07
Tetrachloroethylene µg/m3 6,423 71% 42.12 0.28 0.20 ND ND 0.13 0.27 0.88
Toluene µg/m3 5,947 95% 482.53 2.46 1.54 0.01 0.70 1.51 3.05 7.42
Tribromomethane µg/m3 2,946 4% 1.18 0.01 0.16 ND ND ND ND ND
Trichlorobenzene, 1,2,4- µg/m3 4,301 21% 45.27 0.07 0.10 ND ND ND ND 0.16
Trichloroethane, 1,1,1- µg/m3 5,944 73% 3.17 0.09 0.10 ND ND 0.08 0.11 0.20
Trichloroethane,1,1,2- µg/m3 5,210 19% 5.89 0.01 0.04 ND ND ND ND 0.05
Trichloroethylene µg/m3 6,410 46% 6.50 0.05 0.07 ND ND ND 0.05 0.22
Vinyl chloride µg/m3 6,284 18% 1.61 0.01 0.02 ND ND ND ND 0.03
Xylene, m/p- µg/m3 4,260 90% 21.41 1.12 0.71 ND 0.26 0.69 1.43 3.65
Xylene, o- µg/m3 6,108 83% 9.21 0.41 0.30 ND 0.09 0.24 0.52 1.39
Acenaphthene (total tsp & vapor) ng/m3 69 93% 9.48 2.36 1.94 ND 1.24 1.99 3.03 5.10
Acenaphthylene (total tsp & vapor) ng/m3 69 52% 8.41 0.79 0.74 ND ND 0.09 0.80 4.38
Anthracene (total tsp & vapor) ng/m3 1,102 47% 50.20 0.37 0.43 ND ND ND 0.39 1.48
Benzo(a)anthracene (total tsp & vapor) ng/m3 1,122 73% 2.56 0.10 0.07 ND ND 0.04 0.10 0.35
Benzo(a)pyrene (total tsp & vapor) ng/m3 1,111 58% 2.64 0.09 0.09 ND ND 0.03 0.10 0.34
Benzo[B]Fluoranthene ng/m3 1,110 86% 4.63 0.19 0.13 ND 0.04 0.10 0.21 0.67

9/17/13
Appendix A. National Air Toxics Trends Stations Measurements (2004 – 2008)a
Pollutant Units # Samples Analyzed
% Detections
MaximumArithmetic
Meanb Geometric
Mean 5th
Percentile25th
Percentile50th
Percentile75th
Percentile95th
Percentile
Benzo[E]Pyrene(Tsp) ng/m3 1,121 72% 2.29 0.11 0.09 ND ND 0.05 0.13 0.38
Benzo[G,H,I]Perylene ng/m3 69 86% 0.75 0.12 0.09 ND 0.04 0.07 0.12 0.46
Benzo[K]Fluoranthene ng/m3 1,122 67% 1.28 0.05 0.05 ND ND 0.02 0.06 0.20
Chrysene (total tsp & vapor) ng/m3 1,117 92% 3.85 0.22 0.15 ND 0.07 0.13 0.25 0.70
Dibenzo[A,H]Anthracene ng/m3 69 4% 0.08 <0.01 0.08 ND ND ND ND ND
Fluoranthene (total tsp & vapor) ng/m3 69 96% 3.04 1.46 1.16 ND 0.96 1.42 1.95 2.86
Fluorene, 9-H (total tsp & vapor) ng/m3 1,112 99% 117.00 4.72 3.21 <0.01 1.84 3.00 5.24 13.84
Indeno[1,2,3-Cd]Pyrene ng/m3 69 51% 0.55 0.06 0.08 ND ND 0.02 0.07 0.30
Naphthalene (total tsp & vapor) ng/m3 1,099 100% 0.54 0.08 0.05 <0.01 0.03 0.06 0.10 0.20
Perylene (total tsp & vapor) ng/m3 1,128 18% 0.46 0.01 0.04 ND ND ND ND 0.06
Phenanthrene (total tsp & vapor) ng/m3 1,116 100% 197.00 10.55 6.25 ND 3.37 6.01 12.00 33.23
Pyrene (total tsp & vapor) ng/m3 1,115 99% 58.80 1.37 0.84 <0.01 0.46 0.87 1.54 4.46
Key Pollutant
ND No results of this chemical were registered by the laboratory analytical equipment. a The summary statistics in this table represent the range of actual daily HAP measurement values taken at NATTS sites from 2004 through 2008. These data were extracted
from AQS in summer 2008 and 2009. During the time period of interest, there were 28 sites measuring VOCs, carbonyls, metals, and hexavalent chromium. We note that some sites did not sample for particular pollutant types during the initial year of the NATTS Program, which was 2004. Most of the monitoring stations in the NATTS network are located such that they are not expected to be impacted by single industrial sources. The concentrations typically measured at NATTS sites can thus provide a comparison point useful to considering whether concentrations measured at a school are likely to have been influenced by a significant nearby industrial source, or are more likely to be attributable to emissions from many small sources or to transported pollution from another area. For example, concentrations at a school above the 75th percentile may suggest that a nearby industrial source is affecting air quality at the school.
b In calculations involving non-detects (ND), a value of zero is used.

B-1
Appendix B. Analysis of Other (Non-Key) Air Toxics Monitored and Multiple-pollutant Considerations.
At each school in this National SAT Initiative, monitoring has been targeted to get information on a limited set of key hazardous air pollutants (HAPs).11 These pollutants are the primary focus of the monitoring activities at a school and a priority for us based on our emissions, modeling and other information. In analyzing air samples for these key pollutants, we have also obtained results for some other pollutants that are routinely included with the same test method. Our consideration of the data collected for these additional HAPs is described in the first section below. In addition to evaluating monitoring results for individual pollutants, we also considered the potential for cumulative impacts from multiple pollutants as described in the second section below (See Table B-1).
Other Air Toxics (HAPs)
Do the monitoring data indicate elevated levels of any other air toxics or hazardous air pollutant (HAPs) that pose significant long-term health concerns?
Longer-term concentration estimates for the other HAPs monitored remained below their long-term comparison levels.
For pollutants with cancer-based comparison levels, longer-term concentration estimates for all but one of these (chromium) are more than tenfold lower.
Additionally, each individual measurement for these pollutants is below the individual sample (short-term) screening level developed for considering potential short-term exposures for that pollutant.12
Multiple Pollutants As described in the main body of the report and background materials, this initiative and the associated analyses are focused on an investigation of key pollutants for each school that were identified by previous analyses. This focused design does not provide for the consideration of combined impacts of pollutants or stressors other than those monitored in this project. Broader analyses and those involving other pollutants may be the focus of other EPA activities.13 In our consideration of the potential for impacts from key pollutants at the monitored schools, we have also considered the potential for other monitored pollutants to be present at levels that in combination with the key pollutant levels contribute to an increased potential for cumulative
11 Section 112(b) of the Clean Air Act identifies 189 hazardous air pollutants, three of which have subsequently been removed from this list. These pollutants are the focus of regulatory actions involving stationary sources described by CAA section 112 and are distinguished from the six pollutants for which criteria and national ambient air quality standards (NAAQS) are developed as described in section 108. 12 The individual sample screening levels and their use is summarized on the website and described in detail in Schools Air Toxics Monitoring Activity (2009), Uses of Health Effects Information in Evaluating Sample Results. 13 General information on additional air pollutants is available at http://www.epa.gov/air/airpollutants.html.

9/17/13
B-2
impacts. This was done in cases where estimates of longer-term concentrations for any non-key HAPs are within an order of magnitude of their comparison levels even if these pollutant levels fall below the comparison levels. This analysis is summarized below.
Do the data collected for the air toxics monitored indicate the potential for other monitored pollutants to be present at levels that in combination with the key pollutant levels indicate an increased potential for cumulative impacts of significant concern (e.g., that might warrant further investigation)?
The data collected for the key and other air toxics and the associated longer-term concentration estimates does not pose a concern for cumulative health risk from these pollutants.
In addition to the key pollutant manganese, the only other HAP monitored whose longer-term concentration estimates are more than ten percent of their lowest comparison level is chromium.
The lowest comparison level for chromium (conservatively based on the most toxic form of chromium, hexavalent chromium)14 is based on carcinogenic risk to the respiratory system; in addition, hexavalent chromium is commonly a small fraction of the total chromium reported. These factors (different toxic effects; likely small fraction of hexavalent chromium) reduce cumulative risk concerns for chromium and manganese.
14 The noncancer-based comparison level for chromium is much higher than the cancer-based level and is based on risk of other effects posed to the respiratory system by hexavalent chromium in particulate form.

9/17/13
Table B-1. Abraham Lincoln Elementary School and East Chicago Water Plant – Other Monitored Pollutant Analysis
Site Name Parameter Units Mean of
Measurementsa
95% Confidence Interval on the
Mean
Long-term Comparison Levelb
Cancer-Basedc
Noncancer-Basedd
East Chicago Water Plant
Non-Key HAPS with mean greater than 10% of the lowest comparison level
Chromium (PM10) ng/m3 5.46 4.90 - 6.03 8.3e 100e
Non-Key HAPS with mean lower than 10% of the lowest comparison level
Antimony (PM10) ng/m3 2.07 0.95 - 3.20 NA 200
Arsenic (PM10) ng/m3 1.35 0.99 - 1.70 23 15
Beryllium (PM10) ng/m3 0.02 0.02 - 0.03f 42 20
Cadmium (PM10) ng/m3 0.32 0.22 - 0.41 56 10
Cobalt (PM10) ng/m3 0.12 0.09 - 0.16 NA 100
Mercury (PM10) ng/m3 0.07 0.03 - 0.11g NA 300i
Nickel (PM10) ng/m3 1.48 0.51 - 2.44 420 90
Selenium (PM10) ng/m3 1.37 1.04 - 1.69 NA 20,000
Abraham Lincoln
Elementary School
Non-Key HAPS with mean greater than 10% of the lowest comparison level
Chromium (PM10) ng/m3 5.02 4.58 - 5.46 8.3e 100e
Non-Key HAPS with mean lower than 10% of the lowest comparison level
Antimony (PM10) ng/m3 1.82 0.92 - 2.73 NA 200
Arsenic (PM10) ng/m3 1.39 0.83 - 1.95 23 15
Beryllium (PM10) ng/m3 0.02 0.01 - 0.02i 42 20
Cadmium (PM10) ng/m3 0.32 0.25 - 0.39 56 10
Cobalt (PM10) ng/m3 0.11 0.08 - 0.14 NA 100
Mercury (PM10) ng/m3 0.09 0.04 - 0.13j NA 300h
Nickel (PM10) ng/m3 0.95 0.73 - 1.17 420 90
Selenium (PM10) ng/m3 1.26 1.02 - 1.51 NA 20,000
ng/m3 nanograms per cubic meter
NA Not applicable
ND No detection of this chemical was registered by the laboratory analytical equipment a Mean of measurements is the average of all sample results which include actual measured values. If no chemical was registered,
then a value of zero is used when calculating the mean b Details regarding these values are in the technical report, Schools Air Toxics Monitoring Activity (2009) Uses of Health Effects
Information in Evaluating Sample Results. c Air toxics for which the upper 95% confidence limit on the mean concentration is above this level will be fully discussed in the
text and may be considered a priority for potential follow-up activities, if indicated in light of the full set of information available for the site. Findings of the upper 95% confidence limit below 1% of the comparison level (i.e., where the upper 95% confidence limit is below the corresponding 1-in-1-million cancer risk based concentration) are generally considered a low priority for follow-up activity. Situations where the summary statistics for a pollutant are below this comparison level but above 1% of this level are fully discussed in the text of the report.
d Air toxics for which the upper 95% confidence limit on the mean concentration are near or below the noncancer-based comparison level are generally of low concern and will generally be considered a low priority for follow-up activity. Pollutants for which the 95% confidence limits extend appreciably above the noncancer-based comparison level are fully discussed in the school-specific

9/17/13
report and may be considered a priority for follow-up activity, if indicated in light of the full set of information available for the site.
e The comparison level is specific to hexavalent chromium (recognized as the most toxic form) which is a fraction of the total chromium reported.
f Beryllium (PM10) was detected in 29 out of 32 samples, ranging from 0.003 to 0.08 ng/m3. The MDL is 0.03 ng/m3. g Mercury (PM10) was detected in 30 out of 32 samples, ranging from 0.0006 to 0.57 ng/m3. The MDL is 0.05 ng/m3. h The comparison level is specific to elemental mercury, which is more readily and completely absorbed into the body than mercury
conveyed on particles (e.g., divalent species) i Beryllium (PM10) was detected in 33 out of 35 samples, ranging from 0.003 to 0.04 ng/m3. The MDL is 0.03 ng/m3. j Mercury (PM10) was detected in 34 out of 35 samples, ranging from 0.003 to 0.65 ng/m3. The MDL is 0.05 ng/m3.

9/17/13
Appendix C. Abraham Lincoln Elementary School and East Chicago Water Plant Pollutant Concentrations
Site Name Parameter Units
9/5/
2010
9/11
/201
0
9/17
/201
0
9/29
/201
0
10/5
/201
0
10/1
1/20
10
10/1
7/20
10
10/2
3/20
10
10/2
9/20
10
11/4
/201
0
11/1
0/20
10
11/1
6/20
10
Sample Screening
Levela
East Chicago Water Plant
Manganese (PM10) ng/m3 18.7 -- -- 103 113 130 200 28.9 52.8 307 74.6 55.1 500
Antimony (PM10) ng/m3 1.47 -- -- 18.5 2.81 3.76 2.43 1.09 1.58 1.13 2.17 2.4 2,000
Arsenic (PM10) ng/m3 3.68 -- -- 5.08 1.61 2.29 2.55 1.3 1.19 1.99 1.34 1.77 150
Beryllium (PM10) ng/m3 0.008 -- -- 0.08 0.03 0.05 0.05 0.02 0.02 0.06 0.05 0.03 20
Cadmium (PM10) ng/m3 0.45 -- -- 0.28 0.44 1.37 0.86 0.24 0.19 0.41 0.26 0.28 30
Chromium (PM10) ng/m3 5.95 -- -- 7.6 8.95 7.59 8.45 4.64 6.31 8.52 6.84 5.4 580b
Cobalt (PM10) ng/m3 0.1 -- -- 0.22 0.39 0.3 0.17 0.15 0.08 0.28 0.2 0.15 100
Mercury (PM10) ng/m3 0.008 -- -- 0.01 0.29 0.04 0.05 0.01 0.17 0.04 0.04 0.06 3,000d
Nickel (PM10) ng/m3 0.75 -- -- 1.31 1.98 1.65 1.37 0.59 0.62 2.46 1.29 1.29 200
Selenium (PM10) ng/m3 0.54 -- -- 0.55 1.06 2.06 1.34 0.78 0.48 2.75 1.32 2.42 20,000
Abraham Lincoln
Elementary School
Manganese (PM10) ng/m3 7.49 15.8 37.3 17.9 27.9 167 59 82.6 21.3 54.4 104 31.7 500
Antimony (PM10) ng/m3 1.2 1.07 1.54 0.92 4.93 2.5 2.78 1.48 1.12 1.65 0.71 2.68 2,000
Arsenic (PM10) ng/m3 3 0.92 1.17 0.62 10.1 1.53 2.2 2.67 1.26 1.09 0.88 1.69 150
Beryllium (PM10) ng/m3 0.003 0.006 0.02 0.01 0.04 0.02 0.02 0.03 0.01 0.006 0.03 0.04 20
Cadmium (PM10) ng/m3 0.46 0.11 0.72 0.12 0.23 0.47 0.91 0.31 0.21 0.5 0.19 0.35 30
Chromium (PM10) ng/m3 3.55 5.19 5.65 3.93 5.35 8.66 6.57 5.94 3.88 6.75 7 6.08 580b
Cobalt (PM10) ng/m3 0.06 0.05 0.11 0.09 0.16 0.45 0.23 0.1 0.13 0.08 0.07 0.2 100
Mercury (PM10) ng/m3 0.009 0.01 0.04 0.02 0.01 0.31 0.03 0.04 0.02 0.22 0.03 0.01 3,000c
Nickel (PM10) ng/m3 1.79 0.61 1.12 1.12 0.96 3.46 1.75 1.94 0.61 0.93 0.84 1.39 200
Selenium (PM10) ng/m3 0.65 1.37 0.67 1.14 0.54 0.99 1.69 0.96 0.76 0.59 1.24 1.89 20,000 Key Pollutant
ng/m3 nanograms per cubic meter
-- No sample was conducted for this pollutant on this day or the sample was invalid.
ND No detection of this chemical was registered by the laboratory analytical equipment. a The individual sample screening levels and their use is summarized on the web site and described in detail in Schools Air Toxics Monitoring Activity (2009), "Uses of Health
Effects Information in Evaluating Sample Results", see http://www.epa.gov/schoolair/pdfs/UsesOfHealthEffectsInfoinEvalSampleResults.pdf. These screening levels are based on consideration of exposure all day, every day over a period ranging up to at least a couple of weeks, and longer for some pollutants.

9/17/13
b The sample screening level are specific to hexavalent chromium (recognized as the most toxic form) which is a fraction of the total chromium reported. c The sample screening level is specific to elemental mercury, which is more readily and completely absorbed into the body than mercury conveyed on particles (e.g., divalent
species).

9/17/13
Appendix C. Abraham Lincoln Elementary School and East Chicago Water Plant Pollutant Concentrations
Site Name Parameter Units
11/2
2/20
10
11/2
8/20
10
12/4
/201
0
12/1
0/20
10
12/1
6/20
10
12/2
2/20
10
12/2
8/20
10
1/3/
2011
1/9/
2011
1/15
/201
1
1/21
/201
1
1/27
/201
1
Sample Screening
Levela
East Chicago Water Plant
Manganese (PM10) ng/m3 10.4 11.7 37.5 17.7 51.1 61.8 7.84 17.8 25 28.7 50.4 10.3 500
Antimony (PM10) ng/m3 0.63 1.15 0.92 1.85 1.55 1.06 2.38 2.09 2.02 1.05 1 0.62 2,000
Arsenic (PM10) ng/m3 0.49 0.85 0.8 1.36 1.55 1.76 0.55 0.82 1.11 0.85 0.57 0.37 150
Beryllium (PM10) ng/m3 0.004 0.003 ND 0.005 0.01 ND ND 0.02 0.01 0.01 0.02 0.008 20
Cadmium (PM10) ng/m3 0.13 0.15 0.18 0.36 0.72 0.31 0.56 0.41 0.34 0.25 0.14 0.13 30
Chromium (PM10) ng/m3 5.21 5.25 5.2 5.49 5.65 5.01 3.85 3.57 4.62 3.23 4.67 4.55 580b
Cobalt (PM10) ng/m3 0.05 0.05 0.04 0.12 0.13 0.11 0.06 0.09 0.11 0.09 0.11 0.05 100
Mercury (PM10) ng/m3 ND ND 0.04 0.05 0.15 0.08 0.02 0.04 0.57 0.14 0.14 0.05 3,000d
Nickel (PM10) ng/m3 1.07 0.62 0.44 0.92 1.62 2.54 2.25 15.7 1 1.04 0.95 0.55 200
Selenium (PM10) ng/m3 0.8 0.94 2.18 1.1 3.6 1.83 0.6 0.49 0.63 1.09 0.61 0.68 20,000
Abraham Lincoln
Elementary School
Manganese (PM10) ng/m3 57.4 44.2 3.53 40.2 39.2 12.6 35.7 7.1 9.77 12.7 65.3 22.6 500
Antimony (PM10) ng/m3 2.47 0.96 1.01 0.98 1.49 1.86 0.8 1.83 16.1 1.18 1.06 0.83 2,000
Arsenic (PM10) ng/m3 1.83 0.71 0.76 0.7 1.5 1.26 1 0.76 0.84 0.97 0.56 0.53 150
Beryllium (PM10) ng/m3 0.03 0.005 ND 0.005 0.008 0.004 ND 0.009 0.01 0.01 0.02 0.004 20
Cadmium (PM10) ng/m3 0.3 0.83 0.15 0.17 0.71 0.33 0.22 0.4 0.34 0.22 0.43 0.21 30
Chromium (PM10) ng/m3 4.43 5.66 4.08 4.17 6.02 4.66 4.78 2.97 3.74 3.43 6.09 5.44 580b
Cobalt (PM10) ng/m3 0.14 0.06 0.03 0.04 0.12 0.1 0.08 0.04 0.07 0.08 0.11 0.05 100
Mercury (PM10) ng/m3 0.07 0.05 ND 0.05 0.13 0.04 0.08 0.03 0.65 0.33 0.2 0.1 3,000c
Nickel (PM10) ng/m3 1.55 0.97 0.87 0.3 1.57 1.02 0.97 0.43 0.63 0.56 1.28 0.71 200
Selenium (PM10) ng/m3 2.54 1.06 0.88 2.64 2.98 1.07 1.42 0.45 0.6 0.7 0.63 1.54 20,000 Key Pollutant
ng/m3 nanograms per cubic meter
-- No sample was conducted for this pollutant on this day or the sample was invalid.
ND No detection of this chemical was registered by the laboratory analytical equipment. a The individual sample screening levels and their use is summarized on the web site and described in detail in Schools Air Toxics Monitoring Activity (2009), "Uses of Health
Effects Information in Evaluating Sample Results", see http://www.epa.gov/schoolair/pdfs/UsesOfHealthEffectsInfoinEvalSampleResults.pdf. These screening levels are based on consideration of exposure all day, every day over a period ranging up to at least a couple of weeks, and longer for some pollutants.

9/17/13
b The sample screening level are specific to hexavalent chromium (recognized as the most toxic form) which is a fraction of the total chromium reported. c The sample screening level is specific to elemental mercury, which is more readily and completely absorbed into the body than mercury conveyed on particles (e.g., divalent
species).

9/17/13
Appendix C. Abraham Lincoln Elementary School and East Chicago Water Plant Pollutant Concentrations
Site Name Parameter Units
2/2/
2011
2/8/
2011
2/14
/201
1
2/20
/201
1
2/26
/201
1
3/4/
2011
3/10
/201
1
3/16
/201
1
3/22
/201
1
3/28
/201
1
4/3/
2011
Sample Screening
Levela
East Chicago Water Plant
Manganese (PM10) ng/m3 18 60.8 51.9 10.4 4.13 67 142 36.6 -- 30.8 76 500
Antimony (PM10) ng/m3 0.11 0.64 0.49 0.77 3.64 1.34 1.94 2.09 -- 0.45 1.26 2,000
Arsenic (PM10) ng/m3 0.37 0.75 0.95 0.59 0.38 1.53 1.4 1.37 -- 0.72 1.14 150
Beryllium (PM10) ng/m3 0.007 0.01 0.02 0.01 0.006 0.04 0.04 0.03 -- 0.03 0.05 20
Cadmium (PM10) ng/m3 0.06 0.15 0.12 0.13 0.09 0.29 0.23 0.29 -- 0.06 0.22 30
Chromium (PM10) ng/m3 3 3.96 6.87 4.51 2.96 4.81 6.02 4.52 -- 6.1 5.57 580b
Cobalt (PM10) ng/m3 0.02 0.06 0.07 0.03 0.03 0.1 0.09 0.18 -- 0.06 0.3 100
Mercury (PM10) ng/m3 0.02 0.11 0.02 0.009 0.01 0.03 0.13 0.03 -- .0006 0.01 3,000d
Nickel (PM10) ng/m3 0.15 0.83 0.52 0.36 0.3 0.67 0.45 0.79 -- 0.09 1.09 200
Selenium (PM10) ng/m3 0.4 3.09 1.22 1.19 1.01 2.62 2.94 2.04 -- 0.34 1.09 20,000
Abraham Lincoln
Elementary School
Manganese (PM10) ng/m3 22.4 61.9 68.6 8.34 3.71 26.4 44.6 18.5 14.6 50.3 41.2 500
Antimony (PM10) ng/m3 0.15 0.68 0.61 0.78 0.89 1.33 1.18 2.79 0.6 0.49 1.21 2,000
Arsenic (PM10) ng/m3 0.42 0.63 1.31 0.69 0.39 1.46 0.89 1.08 0.75 1.54 1.03 150
Beryllium (PM10) ng/m3 0.01 0.01 0.02 0.01 0.004 0.04 0.01 0.02 0.02 0.04 0.04 20
Cadmium (PM10) ng/m3 0.07 0.28 0.17 0.17 0.11 0.22 0.33 0.34 0.2 0.11 0.2 30
Chromium (PM10) ng/m3 3.17 6.49 6.7 4.79 4.52 4.93 5.22 4.24 3.99 4.13 3.59 580b
Cobalt (PM10) ng/m3 0.02 0.18 0.08 0.03 0.02 0.07 0.09 0.14 0.08 0.11 0.32 100
Mercury (PM10) ng/m3 0.04 0.18 0.04 0.02 0.003 0.03 0.25 0.02 0.008 0.01 0.02 3,000c
Nickel (PM10) ng/m3 0.41 0.8 0.87 0.54 0.28 0.37 0.33 0.58 0.27 0.28 1.05 200
Selenium (PM10) ng/m3 0.37 1.84 1.59 1.17 1.01 2.97 0.76 1.86 1.84 0.75 1.1 20,000 Key Pollutant
ng/m3 nanograms per cubic meter
-- No sample was conducted for this pollutant on this day or the sample was invalid.
ND No detection of this chemical was registered by the laboratory analytical equipment.

9/17/13
a The individual sample screening levels and their use is summarized on the web site and described in detail in Schools Air Toxics Monitoring Activity (2009), "Uses of Health Effects Information in Evaluating Sample Results", see http://www.epa.gov/schoolair/pdfs/UsesOfHealthEffectsInfoinEvalSampleResults.pdf. These screening levels are based on consideration of exposure all day, every day over a period ranging up to at least a couple of weeks, and longer for some pollutants.
b The sample screening level are specific to hexavalent chromium (recognized as the most toxic form) which is a fraction of the total chromium reported. c The sample screening level is specific to elemental mercury, which is more readily and completely absorbed into the body than mercury conveyed on particles (e.g., divalent
species).
9/17/13
Appendix D. Windroses for Lansing Municipal Airport NWS Station
1 Lansing Municipal Airport NWS Station (WBAN 04879) is 8.7 miles from Abraham Lincoln Elementary School and 9.2 miles from the East Chicago Water Plant.
NORTH
SOUTH
WEST EAST
6%
12%
18%
24%
30%
WIND SPEED (Knots)
>= 22
17 - 21
11 - 17
7 - 11
4 - 7
1 - 4
Calms: 15.47%
WIND SPEED (Knots)
>= 22
17 - 21
11 - 17
7 - 11
4 - 7
1 - 4
Calms: 15.47%
Lansing Municipal Airport NWS Station
Composite Hourly Windrose
(2002-2007)1
Lansing Municipal Airport NWS Station
Composite Hourly Windrose
Across Sampling Period
(Sept. 5, 2010 - Apr. 3, 2011)1