addition of soybean lipoxygenase to all-purpose flour and
TRANSCRIPT

Addition of Soybean Lipoxygenase to All-Purpose Flour and its Effects on Dough Gluten Strength
and Bread Quality
Erin M. Danielson
Thesis submitted to the faculty of Virginia Polytechnic Institute and State University in partial fulfillment of the requirements for the degree of:
MASTER OF SCIENCE
In
Human Nutrition, Foods and Exercise
William Barbeau, Chair
Frank D. Conforti
Sean O’Keefe
June 1, 2007
Blacksburg, Virginia
Keywords: lipoxygenase, soy flour, gluten, yeast bread
Copyright 2007, Erin M. Danielson

The Effects of Added Soy Lipoxygenase to Wheat Flour on Dough Gluten Strength
and Bread Volume
Erin M. Danielson
ABSTRACT
The goal of this research is to determine the effects of added soybean lipoxygenase
(LOX) on bread dough rheological properties and physical properties of bread loaves
compared to controls, and to determine sensory attributes of bread loaves using
quantitative descriptive analysis (QDA). Protein fractions were obtained through the use
of isoelectric precipitation. The pH 4.8 precipitate was found to yield the greatest LOX
activity when compared with other fractions (p<0.05). The addition of pH 4.8 precipitate
improved rheological properties of bread dough, examined in a farinograph, when
compared to the all-purpose control (p<0.05). Addition of soy flour also increased the
gluten strength of all-purpose flour (p<0.05). The addition of pH 4.8 precipitate to all-
purpose flour did not improve bread loaf volume or texture. Sensory panelists described
pH 4.8 supplemented bread as having firmer crumb when compared with controls
(p<0.05). There were slight color differences among the loaves. The crust and crumb of
bread flour loaves was lighter in color than any other sample. It was concluded that the
addition of pH 4.8 precipitate to all-purpose flour greatly improved the rheological
properties when compared with all-purpose flour alone.
ii

Table of Contents
Abstract………………………………………………………………………… ii
List of Tables…………………………………………………………………… vi
List of Figures………………………………………………………………….. viii
Acknowledgments……………………………………………………………… ix
Chapter 1: Introduction……………………………………………………….. 1
Chapter 2: Review of Literature……………………………………………… 3
2.1: Lipoxygenase……………………………………………………… 3
2.1.1: Soybean Lipoxygenase…………………………………. 3
2.1.2: Soybean Lipoxygenase Isozymes………………………. 4
2.2: Characteristics of Lipoxygenase…………………………………. 5
2.2.1: Thermal Stability of Lipoxygenase……………………. 6
2.3: Wheat……………………………………………………………… 6
2.3.1: Wheat Proteins………………………………………….. 7
2.4: Bread Making, an Overview……………………………………… 11
2.5: Functional Ingredients in Bread Making ……………………….. 11
2.5.1: Flour…………………………………………………….. 12
2.5.2: Yeast…………………………………………………….. 12
2.5.3: Sugar……………………………………………………. 12
2.5.4: Fat……………………………………………………….. 13
2.5.5: Water……………………………………………………. 13
2.5.6: Improvers……………………………………………….. 13
iii

2.6: Bonds……………………………………………………………… 14
2.7: Farinograph Interpretation……………………………………… 15
2.8: Isoelectric Precipitation of Soy Flour…………………………… 16
2.9: Sensory Evaluation: Qualitative Descriptive Analysis (QDA)... 17
Chapter 3: Justification of Research and Objectives………………………… 19
Chapter 4: Materials and Methods……………………………………………. 21
4.1: Determination of Lipoxygenase in Soy Flour…………………… 21
4.2: Gluten Strength Determination………………………………….. 22
4.3: Bread Making…………………………………………………….. 23
4.4: Loaf Volume………………………………………………………. 26
4.5: Color Determination of Bread Loaves…………………………… 26
4.6: Texture Determination of Bread Loaves………………………… 27
4.7: Sensory Analysis…………………………………………………… 27
4.8: Statistical Analysis………………………………………………… 28
Chapter 5: Results……………………………………………………………… 29
5.1: Results of LOX Assay……………………………………………... 29
5.2: Results of Farinograph Trials…………………………………….. 32
5.3: Results of Bread Making Experiments……………………………. 39
5.4: Results of QDA Sensory Evaluation……………………………… 45
Chapter 6: Discussion of Results………………………………………………. 49
6.1: LOX Assay…………………………………………………………. 49
6.2: Farinograph Interpretation……………………………………….. 50
6.3: Physical and Sensory Bread Attributes…………………………... 55
iv

6.4: Flavor of Bread…………………………………………………….. 60
Chapter 7: Conclusions of Research…………………………………………... 62
Chapter 8: References………………………………………………………….. 65
Appendix A: Farinograph Parameters Measured on Different Flour Samples 68
Appendix B: Farinographs of Rheological Studies…………………………… 69
Appendix C: Physical Attributes of Bread Loaves…………………………... 76
Appendix D: Example of QDA Scorecard……………………………………. 77
Appendix E: Definitions and Spectrum of Sensory Attributes for Bread….. 78
Appendix E: Standards (Products) Used for Training Sensory Panel…….... 79
VITA……………………………………………………………………………. 80
v
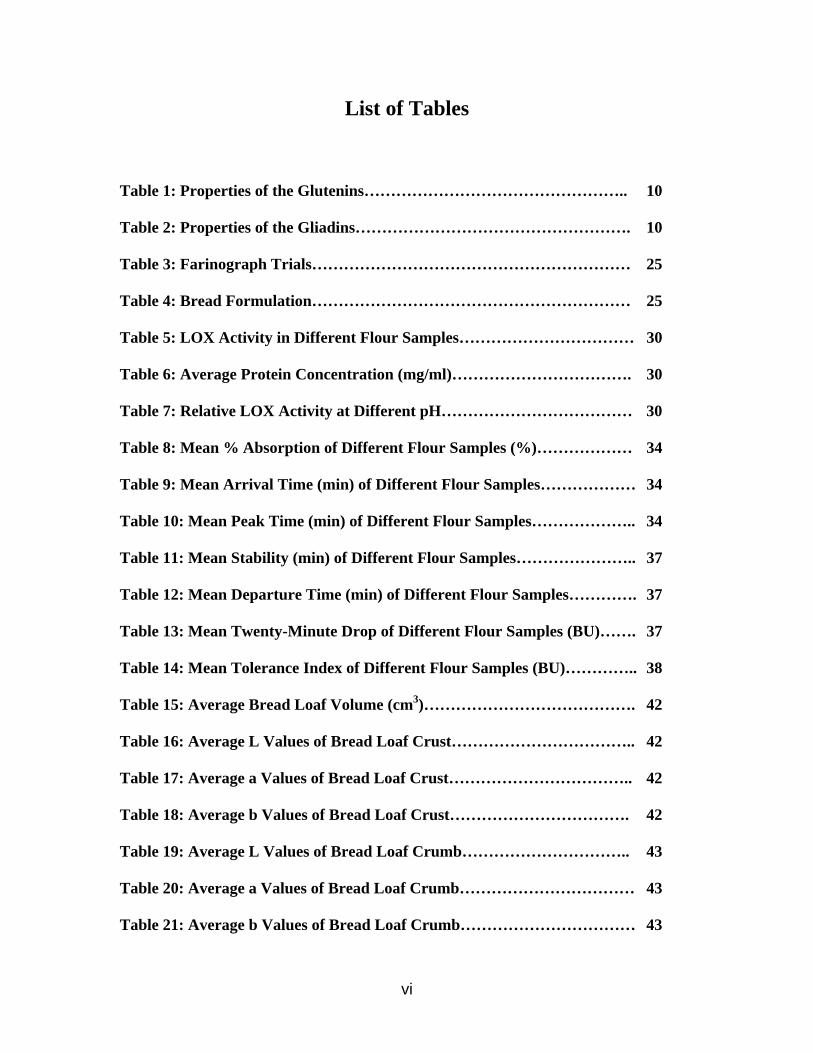
List of Tables
Table 1: Properties of the Glutenins………………………………………….. 10
Table 2: Properties of the Gliadins……………………………………………. 10
Table 3: Farinograph Trials…………………………………………………… 25
Table 4: Bread Formulation…………………………………………………… 25
Table 5: LOX Activity in Different Flour Samples…………………………… 30
Table 6: Average Protein Concentration (mg/ml)……………………………. 30
Table 7: Relative LOX Activity at Different pH……………………………… 30
Table 8: Mean % Absorption of Different Flour Samples (%)……………… 34
Table 9: Mean Arrival Time (min) of Different Flour Samples……………… 34
Table 10: Mean Peak Time (min) of Different Flour Samples……………….. 34
Table 11: Mean Stability (min) of Different Flour Samples………………….. 37
Table 12: Mean Departure Time (min) of Different Flour Samples…………. 37
Table 13: Mean Twenty-Minute Drop of Different Flour Samples (BU)……. 37
Table 14: Mean Tolerance Index of Different Flour Samples (BU)………….. 38
Table 15: Average Bread Loaf Volume (cm3)…………………………………. 42
Table 16: Average L Values of Bread Loaf Crust…………………………….. 42
Table 17: Average a Values of Bread Loaf Crust…………………………….. 42
Table 18: Average b Values of Bread Loaf Crust……………………………. 42
Table 19: Average L Values of Bread Loaf Crumb………………………….. 43
Table 20: Average a Values of Bread Loaf Crumb…………………………… 43
Table 21: Average b Values of Bread Loaf Crumb…………………………… 43
vi

Table 22: Average Texture Values of Bread Loaf Crust……………………… 43
Table 23: Average Texture Values of Bread Loaf Crumb…………………… 44
Table 24: Mean Scores of Bread Attributes from QDA Sensory Analysis (Average of Rep 1 and 2) ………………………………………………………………….. 47
vii

List of Figures
Figure 1: Sensory Spider Plot of Bread Attributes…………………………… 48
Figure 2: Farinograph of All-Purpose Flour (50g) and 63% Water………… 69
Figure 3: Farinograph of Trump’s Bread Flour (50g) and 63% Water……. 70
Figure 4: Farinograph of All-Purpose Flour (47.19g), Soy Flour (2.81g) and 61.8%
Water…………………………………………………………………………… 71
Figure 5: Farinograph of All-Purpose Flour (47.19g), pH 4.8 Precipitate (2.81g) and
62.8% Water…………………………………………………………………… 72
Figure 6: Farinograph of All-Purpose Flour (47.19g), pH 6.4 Precipitate (2.81g) and
62% Water……………………………………………………………………… 73
Figure 7: Farinograph of All-Purpose Flour (50g), Dissolved Lipoxidase (25mg) and
62.2% Water……………………………………………………………………. 74
Figure 8: Farinograph of All-Purpose Flour (47.19g), Soy Flour (2.81g), Esculetin
(15mg) and 62.1% Water……………………………………………………… 75
viii

Acknowledgments
I would like to thank the following people for their help and support during this process:
Dr. William Barbeau for his vision, patience, knowledge and help.
Dr. Sean O’Keefe for his knowledge and help.
Dr. Frank Conforti for his time and support.
Clara Lau for her time, devotion, help and for conducting the QDA sensory analysis.
Sensory Panelists Ellie Stephens, Kara Kolster, Velva Groover, Karen Mundy, Sarah
Budowle, Mary Pat Meaney, Abby Peairs, Elizabeth Abbey for their time and mouths.
Ms. Judy Yan for her help and guidance in the laboratory.
Mr. David Ruggio and the Food Analysis lab in the Department of Biochemistry for
lending their centrifuge.
My friends and family, especially my parents, for their patience, support, love and
shoulders to lean on during this process.
Matthew, for his constant love, support, patience and motivation to be successful.
ix

Chapter 1: Introduction
Wheat flour is the ingredient added in the largest proportion to dough and bread
formulations (Cauvain, 2003b). In particular, wheat flour proteins have special properties
to allow formation of gluten after hydration and during mixing. The mixing process
allows dough aeration and gluten formation, which forms a network to trap air bubbles
for inflation by carbon dioxide gas from yeast fermentation (Cauvain, 2003b). This helps
form the bread structure upon baking. Due to the special properties of wheat proteins,
much research has been dedicated to them (Cauvain, 2003b).
There are three major types of wheat grown in North America, which are divided
into classes of wheat that refer to the season during which the crop is grown (Curtis,
2002). This classification is usually either spring or winter wheat. For winter wheat, the
plant experiences a period of cold winter temperatures (0°- 5°C) (Curtis, 2002). It is
typically planted in the fall season to germinate and develop into young plants that
remain in the vegetative phase during winter and resume growth in early spring (Curtis,
2002). Spring wheat is planted in the spring so that it matures by late summer (Curtis,
2002). There are large differences in grain composition and processing quality among
wheat cultivars within a particular species (Pena, 2002). Almost 95 percent of all the
wheat produced belongs to the Triticum aestivum L species and is better known as hard
or soft wheat, depending on grain hardness (Gill and Friebe, 2002; Pena, 2003). Grain
hardness refers to the resistance the grain opposes to being fractured and to being reduced
to fine whole meal flour or to fine endosperm particles (semolina or refined flour) and is
determined by the way different components are packed in the endosperm cells (Pena,
1

2003). Hard red winter and spring wheat of the Triticum aestivum L species is most often
used in baking bread due to the production of high gluten dough (Pena, 2003).
2

Chapter 2: Review of Literature
2.1 Lipoxygenase
Lipoxygenase (LOX) is an enzyme that catalyzes the oxidation of specific
polyunsaturated fatty acids, which results in the production of conjugated unsaturated
fatty acid hydroperoxides (Liu, 1997; Faubion and Hoseney, 1981; Nicolas et al., 1982;
Wolf and Cowan, 1975). The enzyme is widely distributed in plant tissues, being
particularly abundant in legume seeds (Hildebrand et al., 1991). LOX is a naturally
occurring enzyme in wheat flour (Rakotozafy et al., 1999). This enzyme has been found
to have many functions in bread making. It has been shown that during mixing, LOX
promotes the destruction of free and esterified linoleic and linolenic acids, as well as the
bleaching of carotenoid pigments to give bread a whiter crumb (Nicolas et al., 1982;
Gelinas et al., 1998). In addition, LOX is credited with increasing mixing tolerance and
relaxation times, which results in enhanced loaf volume (Nicolas et al., 1982). However,
according to Rakotozafy et al. (1999), LOX is found to have a loss in activity as mixing
continues. Thus, to overcome this inhibition, lipoxygenase from soybean flour (SLOX)
has been used increasingly over the decades as a dough improver (Rakotozafy et al.,
1999).
2.1.1 Soybean Lipoxygenase
Lipoxygenase is found in several sources including corn, alfalfa, peas, and wheat
(Faubion and Hoseney, 1981). However, soybean seeds were found to be the richest
known source of lipoxygenases (Liu, 1997; Faubion and Hoseney, 1981; Gelinas et al.,
1998). Despite the abundance of LOX enzymes, there are indications that they contribute
3

to the primary cause of the undesirable flavors in soybean products. These flavors are
commonly known as “greeny” or “beany” flavors (Liu, 1997; Gelinas et al., 1998). Due
to the adverse effects (i.e. off-flavors), enzyme active soy flour is only used commercially
up to 0.5% in wheat-based breads (Cumbee et al., 1997; Gelinas et al., 1998).
2.1.2 Soybean Lipoxygenase Isozymes
Four different soybean SLOX isozymes have been isolated and are known as L-1,
L-2, L-3a, and L-3b (Liu 1997; Cumbee et al., 1997; Faubion and Hoseney, 1981). Often
the last two isozymes are so similar in composition and behavior they are considered a
single type, L-3. All of the SLOX isozymes are monomeric proteins with molecular
weights ranging between 94 and 97 kDa and containing one atom of tightly bound
nonheme iron per molecule (Liu, 1997; Hildebrand et al., 1991). L-1 is unique from the
other isozymes in that it is heat stable. Unlike L-2 and L-3, which are not as heat stable,
L-1 has an optimum pH of 9 and prefers anionic substrates, such as linoleic and linolenic
acids, while L-2 and L-3 activity are optimal at neutral pH and these isoenzymes prefer
esterified substrates (Liu, 1997). Research suggests that L-3 is the most abundant
isozyme in mature soybean seeds, followed by L-1 and L-2 (Hildebrand et al., 1991; Liu,
1997).
These isozymes have been isolated and characterized in seeds of commercial
soybean cultivars; however, only a few attempts have been made to isolate the individual
isozymes and determine rheological and baking properties of wheat flours fortified with
them (Cumbee et al., 1997).
4

2.2 Characteristics of Lipoxygenase
As mentioned previously, the lipoxygenase enzyme exists in multiple forms
known as isoenzymes: four in soy, wheat and peas and two in corn (Faubion and
Hoseney, 1981). These different isoenzymes are found to differ in properties such as
optimum pH, bleaching capacity, substrate specificity and products produced. The
enzyme was originally thought to be unique among the oxygenases in that it lacked
prosthetic groups; however, it has since been reported that soybean lipoxygenases contain
one mole of iron per mole of enzyme (Faubion and Hoseney, 1981).
All lipoxygenases have one common feature. They catalyze the oxidation of fatty
acids possessing cis, cis-1-4-pentadiene unsaturated systems (Faubion and Hoseney,
1981; Nicolas et al., 1982). Beyond this fact, there are large differences in enzyme and
substrate solubility. This makes the actual amount of substrate available to the enzyme
uncertain.
One of the oldest known characteristics of the enzyme is the ability to bleach or
decolorize several pigments (Faubion and Hoseney, 1981; Gelinas et al., 1998).
However, this is the least understood characteristic of LOX. It has been found that the
substrates for bleaching vary from carotene, xanthophylls, bixin, chlorophyll, cholesterol,
crocin, lutein and various dyes (Faubion and Hoseney 1981). Despite these known
substrates, there is little information known about the actual mechanism to explain the
bleaching ability of LOX.
5

2.2.1 Thermal Stability of Lipoxygenase
Thermal stability of the different isoenzymes was measured in a study performed
by Nicolas et al (1982). Isozyme stabilities were measured at both ambient temperature
and at 4°C in a phosphate buffer at pH 7 (Nicolas et al., 1982). It was found that active
fractions were very stable at 4°C, but lost half of their activity after 10 days of storage at
laboratory temperature. According to Shiiba et al. (1991), the three major LOX
isoenzymes (L-1, L-2 and L-3) had similar thermal sensitivities, with optimum activity at
approximately 45°C and traces of activity at 65°C.
2.3 Wheat
Wheat is the most widely grown crop in the world (Stolh, 2002). It is grown from
temperate, irrigated to dry and high-rain-fall areas and from warm, humid to dry, cold
environments (Acevedo et al., 2002). This adaptation is attributed to the complex nature
of the plant’s genome. Wheat is divided into different types, including Triticum aestivum
L, which accounts for approximately 90-95 percent of wheat produced in the world
(Pena, 2002). Wheat is utilized mainly as flour, either whole grain or refined (Pena,
2002). It is used for the production of a variety of leavened and flat breads, as well as
other baked products. Another type of wheat, Triticum durum, produces semolina
(coarse flour), which is the main ingredient in pasta making.
The protein content of wheat grain varies between 8 and 17 percent (Pena, 2002).
These differences depend on genetic make-up and external factors associated with the
crop. A unique property of wheat is that it contains insoluble proteins, which react with
water to form a viscoelastic protein mass known as gluten (Pena, 2002). Gluten is a very
6

large complex composed of polymeric and monomeric proteins, known as glutenins and
gliadins. Furthermore, gluten viscoelasticity accounts for a large part of a flour’s dough
strength. Different variations in grain protein content can significantly influence the
gluten strength of wheat varieties (Pena, 2002). Wheat flour contains about the same
amounts of glutenins and gliadins, and an imbalance of the ratio of these may alter its
viscoelastic properties (Pena, 2002).
2.3.1 Wheat Proteins
Wheat contains hundreds of proteins, which contain sequences of amino acids in
specific arrangements to help form their three dimensional structures (Cornell, 2003).
Glutenins and gliadins form the wheat gluten complex, which is about 80 percent protein,
10 percent starch and 5 percent lipids plus other minerals and impurities (Cornell, 2003).
Wheat proteins contribute functional properties in bread.
Glutenins form an extensive three-dimensional network of molecules through
disulfide bonding, hydrogen bonding and hydrophobic interactions (Cornell, 2003).
These properties contribute to the cohesive elasticity of the dough. Gliadin is also an
important component to this network. Gliadins contribute to the viscous nature, or
extensibility, of the dough, while glutenins contribute to the elastic nature of the dough
(Belton, 2003). The proteins in the gluten are denatured (conformational changes)
through heat and changes in pH. One reaction, the Maillard reaction, is typical of the
properties of proteins. This reaction occurs during the baking of bread through the
interaction of flour proteins and sugar, which results in the browning of the crust
(Cornell, 2003).
7

Glutenins are responsible for the elasticity of the gluten complex. The glutenins
have both high molecular weight (HMW) proteins, ranging between 80 and 100 kDa, and
low molecular weight (LMW) proteins ranging between 30 and 40 kDa (Shimoni and
others, 1997). The HMW glutenins are most important, even though they only constitute
12% of the total flour proteins (Belton, 2003). The degree of cross-linking by disulfide
bonds varies in the glutenins, giving these proteins a range of molecular weight. The
glutenins make up about 30-40 percent of the total protein of flour.
The characteristics of the glutenins are summarized in Table 1 (Cornell, 2003).
Differences have been found in the amino acid composition of LMW and HMW proteins
or subunits. LMW subunits are lower in glycine, but higher in valine, isoleucine, leucine
and phenylalanine compared to subunits with HMW (Cornell, 2003). Furthermore, the
intermolecular disulfide bonds involve mostly glutenins and contribute significantly to
the viscoelastic properties of wheat gluten. This involves the oxidation of sulfhydryl
groups to disulfide groups, which is an important reaction during dough formation and
baking (Cornell, 2003). Also, intramolecular disulfide bonds should be noted as
important bonds, which are formed between cysteine side chains in the same protein
molecule.
Gliadins account for about 40-50 percent of the total protein content of wheat and
are termed a-, b-, or w-gliadins in order of their electrophoretic mobility and are all
monomeric (Cornell, 2003). Characteristics of gliadins are outlined in Table 2. It is
found that gliadins have a higher content of proline, which is believed to be responsible
for the b-turns, but yet do not display strong viscoelastic behavior. This indicates that
8

disulfide bonds contribute more significantly than the b-turns to viscoelasticity (Cornell,
2003).
9
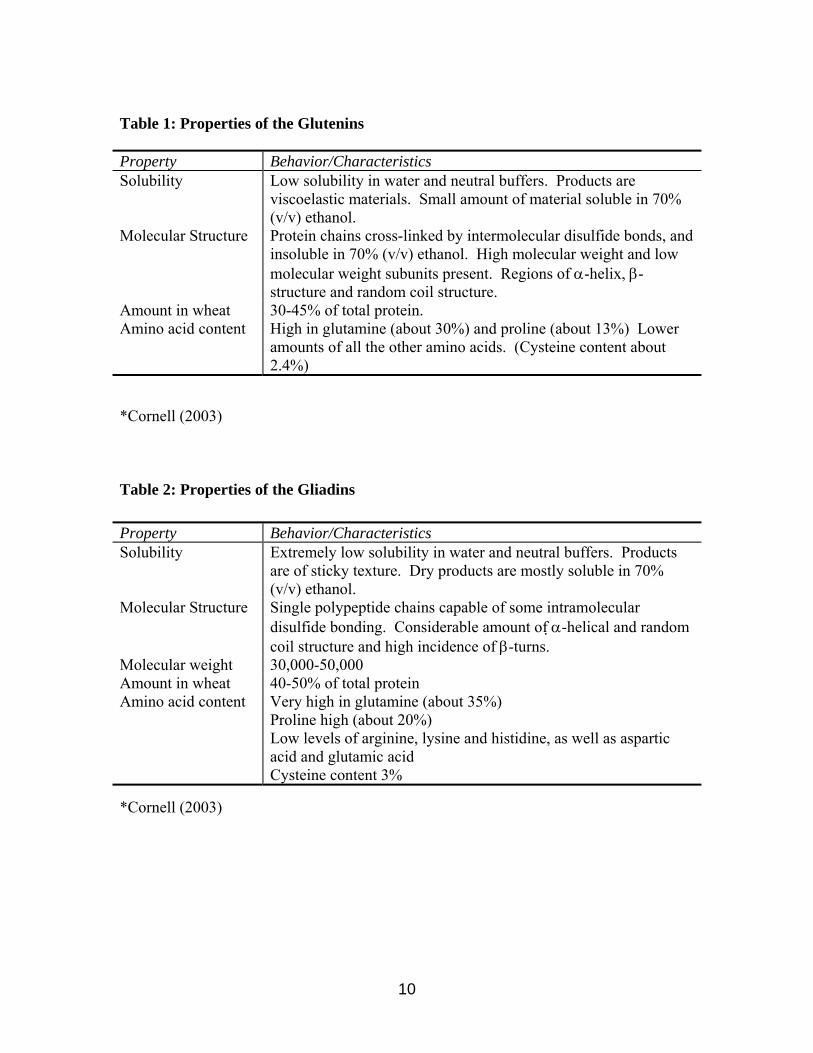
Table 1: Properties of the Glutenins
Property Behavior/Characteristics Solubility Low solubility in water and neutral buffers. Products are
viscoelastic materials. Small amount of material soluble in 70% (v/v) ethanol.
Molecular Structure Protein chains cross-linked by intermolecular disulfide bonds, and insoluble in 70% (v/v) ethanol. High molecular weight and low molecular weight subunits present. Regions of α-helix, β-structure and random coil structure.
Amount in wheat 30-45% of total protein. Amino acid content High in glutamine (about 30%) and proline (about 13%) Lower
amounts of all the other amino acids. (Cysteine content about 2.4%)
*Cornell (2003) Table 2: Properties of the Gliadins
Property Behavior/Characteristics Solubility Extremely low solubility in water and neutral buffers. Products
are of sticky texture. Dry products are mostly soluble in 70% (v/v) ethanol.
Molecular Structure Single polypeptide chains capable of some intramolecular disulfide bonding. Considerable amount of α-helical and random coil structure and high incidence of β-turns.
Molecular weight 30,000-50,000 Amount in wheat 40-50% of total protein Amino acid content Very high in glutamine (about 35%)
Proline high (about 20%) Low levels of arginine, lysine and histidine, as well as aspartic acid and glutamic acid Cysteine content 3%
*Cornell (2003)
10

2.4 Bread Making, an Overview:
There are a wide range of products with an assortment of shapes, sizes, textures,
colors, softness and flavors that can be described by the term “bread” (Cauvain, 2003a).
The character of bread depends on the formation of the gluten network, which traps gas
from yeast fermentation and contributes to the cellular crumb structure. There are many
different bread making processes, but the aim is to convert wheat flour and other
ingredients into a light, aerated and palatable food (Cauvain, 2003a).
The basis of bread making involves the mixing of wheat flour and water, as well
as yeast and salt and other specified ingredients in the appropriate ratios (Cauvain,
2003a). The formation of gluten must also be achieved through the application of energy
during mixing. In addition, there must be an incorporation of air bubbles during mixing.
The dough development is associated with the formation of the gluten, which requires the
hydration of the proteins in the flour, as well as energy input in the form of kneading.
The energy requirement is a significant contributor to the bread making process
(Cauvain, 2003a). However, there is more to dough development than the kneading
process. One of the most important aspects of bread making includes physical changes,
in particular the improvement in the ability to retain carbon dioxide gas. Gas retention
contributes to the loaf volume and crumb structure.
2.5 Functional Ingredients in Bread Making:
Bread quality is determined by the complex interactions of the ingredients used,
as well as their qualities and quantities used in the dough processing method (Cauvain,
2003a).
11

2.5.1 Flour
The formation of gluten is a critical component of bread formation and wheat is
the contributor of the necessary proteins needed for this formation. Thus, a significant
factor that determines final bread quality comes from the wheat and the flour from the
mill (Cauvain, 2003a). The wheat variety, agricultural practices and environmental
contributors determine both the level and quality of the gluten forming proteins. The
protein content of the flour varies, but in general, the higher the protein content in the
wheat, the higher the protein content in the flour produced from it. Usually, the higher
the protein content of a flour, the better its ability to trap and retain carbon dioxide gas,
which allows for a larger and more desirable bread volume (Cauvain, 2003a). In
addition, the protein quality influences the final product quality, and it is often tested by
measuring the rheological properties of the dough.
2.5.2 Yeast
Saccharomyces cerevisiae is baker’s yeast and comes in different forms. The
yeast produces carbon dioxide gas to expand the dough at its different processing stages,
especially during proofing and the early stages of the baking process (Cauvain, 2003a).
2.5.3 Sugar
Since high levels of sugar inhibit yeast activity, even though it is fermentable,
products may have up to 15 percent sugar (Cauvain, 2003a). Sugars provide fermentable
substrate, glucose, for yeast and usually contribute to product sweetness and crust color.
12

2.5.4 Fat
Fat is incorporated to improve the gas retention of dough and subsequently
increase loaf volume and tenderness. The amount of fat used varies according to the type
of flour. Whole meal flours require more fat than white flour, often two or three times
more (Cauvain, 2003a). The typical amount of fat used in bread making ranges from
about 2-6% (McWilliams, 2001). A proportion of fat should remain solid in the dough at
the end of the final proof (Cauvain, 2003a).
2.5.5 Water
The amount of water added affects the properties of dough. If only a small
amount of water is added, then the dough will be firm and produce poor volume and
appearance, which is undesirable. If too much water is added, the dough will be soft and
be difficult to mould and result in poor quality bread. The optimum amount of water is
the maximum quantity that can be incorporated into the dough and still allow it to be
molded to give the bread acceptable quality (Cauvain, 2003a). The amount of water
depends on the flour qualities.
2.5.6 Improvers
A bread improver is an ingredient added to improve the bread making potential of
a flour. Oxidizing agents, such as potassium bromate, ascorbic acid and potassium
iodate, are added to improve gas retention properties of the dough, and their function is
related to cross-linking of proteins (Cauvain, 2003a; Indrani and Rao, 2006). Reducing
13

agents can also be added, such as L-cysteine and potassium metabisulfite, at low levels to
help in molding and shape forming (Indrani and Rao, 2006). Emulsifiers, such as
lecithins, are often added to improve bread quality as well. In addition, full-fat, enzyme-
active soy flour is sometimes used as a functional dough ingredient (Cauvain, 2003a).
This addition has two functions arising from its lipoxygenase enzyme system, which
helps bleach the flour and assists in dough oxidation (Cauvain, 2003a).
2.6 Bonds
During the bread making process, different types of bonds are formed to allow for
protein structure development. These bonds include: hydrogen, hydrophobic, ionic,
disulfide and possibly dityrosine cross-links. The bonds formed in the proteins have a
direct affect on dough formation and bread making quality (Tilley et al., 2001). Upon the
addition of water, dough formation and manipulation, the glutenin will form cross-links
around gliadin to form the gluten complex (McWilliams, 2001). The mixing of the
hydrated protein causes the disruption and breakage of intermolecular secondary protein
bonds and forms new bonds, which results in the development of gluten (McWilliams,
2001). Gluten is an important part of dough formation for bread making.
Both intramolecular and intermolecular disulfide bonds are of particular interest
and importance in bread making. The glutenin cross-links formed during gluten
formation are thought to occur through disulfide interactions. Sulfhydryl-disulfide
interchange reactions involve the breaking and reforming of new disulfide bonds during
dough manipulation. This particular mechanism describes the changes in intermolecular
or intramolecular disulfide bonds. New research shows that there are also dityrosine and
14

isodityrosine cross links involved in gluten formation (Tilley et al., 2001). These cross
links are thought to form between the central domain of glutenin and other glutenin
molecules, while intermolecular disulfide bonds form at the C and N-terminus of glutenin
molecules (Tilley et al., 2001). It is thought that peroxidase contributes to the formation
of dityrosine cross-links and perhaps lipoxygenase plays a role as well. These cross-links
are important for gluten formation because they help form a network around gliadin
proteins.
2.7 Farinograph Interpretation
Farinograph studies are used to measure functional properties of flour, such as
water absorption and to differentiate wheat flours of good and poor baking quality (Ram
et al., 2005). The dough is developed by a pack-squeeze type of gentle kneading and
shearing action in the Farinograph (Ram et al., 2005). Parameters measured include:
arrival time, dough development time, stability, departure time (DEP), twenty-minute
drop (TMD) and mixing tolerance index (MTI).
Arrival time is the time required for the top of the curve to reach the 500 line after
the mixer has been started and is a measurement of the rate at which the water is taken up
by the flour (Shuey et al., 1972). The dough development time is the time to the nearest
half-minute from the first addition of water to the development of the dough’s maximum
consistency before the first indication of weakening (Shuey et al., 1972). This time is
also referred to as peak time. The top of the curve on the graph is nearly flat for several
minutes such that the peak time is determined by taking the mean between the mid-point
15

of the flat portion of the top of the curve and the top of the arch at the bottom of the curve
(Shuey et al., 1972).
Stability is the difference in time between the point where the top of the curve
first intercepts the 500 BU line (arrival time) and the point where the top of the curve
leaves the 500 BU line (departure time). This value gives some indication of the
tolerance to mixing a flour will have (Shuey et al., 1972). Departure time is the time
from the first addition of water until the top of the curve leaves the 500 BU line,
therefore, the longer the departure time, the stronger the gluten in the flour.
The twenty minute drop is the change in the height of the center of the curve at
the peak and the center of the curve 20 minutes after the first addition of water, expressed
to the nearest 5 BU units (Shuey et al., 1972). It gives the rate of breakdown and strength
of a flour such that the higher the value, the weaker the gluten strength of the dough
(Shuey et al., 1972). The tolerance index is the difference in Brabender units from the
top of the curve at the peak to the top of the curve measured 5 minutes after the peak is
reached (Shuey et al., 1972). Flours with good tolerance to mixing have low MTI’s, such
that the higher the MTI value, the weaker the gluten in the flour (Shuey et al., 1972).
2.8 Isoelectric Precipitation of Soy Flour
Isoelectric precipitation is a method used to separate different protein fractions by
adjusting the pH of a dilute buffer containing the sample. It is a way to separate the two
major soybean proteins, the 7S and 11S (Thanh and Shibasaki, 1976). At different pH’s,
certain protein fractions will precipitate out of solution, depending on the isoelectric point
of the particular protein. According to Thanh and Shibasaki (1976), adjusting the pH to
16

4.8 of a dilute tris(hydroxymethyl)aminomethane buffer extract of soybean flour causes
precipitation of the 7S globulin. The pH 4.8 precipitate of soy flour is thought to also
contain the enzyme of interest, lipoxygenase. The 11S globulin is found to precipitate
out of solution at a pH of 6.4. Determination of lipoxygenase activity in the different
protein fractions is done by a spectrophotometric method, which measures the increase in
absorbance at 234 nm (Wu et al., 1997).
2.9 Sensory Evaluation: Quantitative Descriptive Analysis (QDA)
Sensory evaluation is an important aspect of the food industry and food product
development. It comprises a set of techniques for measurement of human response to
foods (Lawless and Heymann, 1998). Sensory evaluation also helps to minimize the
biasing effects of brand identity and consumer perception. Essentially, it attempts to
determine isolate sensory properties of foods and provides important and useful
information to product developers, food scientists and managers about the sensory
characteristics of their products (Lawless and Heymann, 1998).
Quantitative descriptive analysis, QDA, is a sensory method that was developed
by the Tragon Corporation in the mid-1970s to address the problem of quantifying
sensory descriptive data (Gacula, 1997). Trained panelists are a key aspect of the
characterization of the perceived flavor of a food since it is a very difficult task. The
technique involves the training of individuals to identify and quantify the sensory
properties of a food product or ingredient (Stone et al., 1974). The basics of the method
involve the screening of prospective judges, selection of the most discriminating judges
and training (10-20 hrs) of the selected judges (Zook and Wessman, 1977). In addition,
17

the training period involves the development of terminology to describe the appearance,
flavor, and texture of food products.
A QDA graph is constructed to describe the products being tested. A typical
QDA graph consists of lines radiating outward from a central point (Zook and Wessman,
1977). The lines each represent a descriptive term, and the average intensity for that term
is plotted on the line (Zook and Wessman, 1977). Upon analysis, sensory characteristics
of standard products and experimental products are compared to help aid in the
development of a new food product. QDA has been an important tool of sensory
evaluation over the years, especially as a benefit to research and development (Stone et
al., 1980).
18

Chapter 3: Justification of Research and Objectives
Improving the quality of low protein wheat flour is a goal in the baking industry.
Research on dough strengtheners and the advantages of both natural and chemical
improvers must be thoroughly examined. Due to reported potential hazards of chemical
dough conditioners, such as potassium bromate, the baking industry is involved in
determining alternate conditioners (Rakotozafy et al., 1999). Thus, there is a need to
examine the potential benefits of maximum utilization of naturally occurring
strengtheners in wheat, such as oxidoreductases. Oxidoreductases are enzymes that
include lipoxygenase, peroxidase and catalase and are naturally present in wheat flour
(Delcros et al., 1998; Rakotozafy et al., 1999). These enzymes catalyze oxidative
reactions, which are of great importance to the rheological properties of dough
(Rakotozafy et al., 1999). There is supporting research that exogenous, as well as
endogenous, enzymes might help improve the gluten strength of wheat bread (Rakotozafy
et al., 1999).
The goal of this study was to increase the bread making ability of low protein (all-
purpose) flours by adding soybean lipoxygenase to increase gluten formation. The
soybean lipoxygenase was isolated from soy flour. The rheological properties, as well as
bread loaf volume, color and texture, was measured and compared with control loaves
that lack the added enzyme. Significant differences between the experimental and
control loaves were determined through ANOVA and Tukey’s post hoc test. Therefore,
the objectives of this study were:
1. To determine the protein fraction of soy flour with the greatest lipoxygenase
activity via isoelectric precipitation and enzyme assay
19

2. To determine the effects of added soybean lipoxygenase on bread dough
rheological properties and physical properties of bread loaves, such as loaf
volume, color and texture, compared to controls
3. To determine, through QDA, effects on the sensory attributes of bread due to
the addition of soy flour and soy protein fractions
20
Chapter 4: Materials and Methods
4.1 Determination of Lipoxygenase in Soy Flour
The protein fractions of soy flour were separated via isoelectric precipitation at
pH 6.4, 4.8 and 4.1 using a method from Thanh and Shibasaki (1976).
Tris(hydroxymethyl)-aminomethane buffer, at pH 8.0, was mixed with soy flour in the
ratio of 15:1 (w/v). The mixture was allowed to stir overnight at 4°C. Afterward, the
slurry was centrifuged for 40 minutes at 5000 x g in a refrigerated (4°C) Sorvall
centrifuge. The supernatant was then removed and 6N HCl was added drop-wise until a
pH of 6.4 was achieved. The mixture was then centrifuged again using the same
conditions. This procedure was repeated at pH 4.8 and 4.1. This was done sequentially.
The lipoxygenase activity of the supernatant at each pH was determined based on a rapid
spectrophotometric assay according to Wu et al. (1997). This assay measures LOX
activity, using linoleic acid as the substrate, by monitoring the increase in absorbance at
234 nm due to the formation of the conjugated diene (Wu et al., 1997).
Enzyme activity was quantified by multiplying the difference in absorbance
between the substrate with buffer versus the substrate, enzyme and buffer times the
dilution factor of 20. The activity was expressed as a change in absorbance per minute
(DA/min). The activity was then compared with the amount of protein present in the
solution. Protein concentration was determined using the AACC 46-15 method for the
Biuret protein assay with bovine serum albumin as the primary reference standard
(AACC 2000). The final activity was determined by calculating the ratio of average
activity to protein concentration. The fraction with the greatest activity was determined
to contain the greatest amount of LOX enzyme activity.
21

4.2 Gluten Strength Determination
Table 3 shows the different variations of flour and treatments placed in the
farinograph (C.W. Brabender Instruments, South Hackensack, NJ) using AACC method
54-21 constant flour weight procedure for 50 g sample (AACC 2000). Fifty grams of
Wingold H&R (hotel and restaurant) bleached enriched all-purpose flour (Bay State
Milling, Quincy MA), All Trump’s baker’s high gluten bleached enriched brominated
bread flour (General Mills, Minneapolis, MN), all-purpose flour plus Bob’s Red Mill
stone-ground whole grain soybean flour, 35% protein, (Bob’s Red Mill Natural Foods,
Milwaukie, OR), all-purpose flour plus isolated soybean precipitate (both pH 6.4 and pH
4.8) as well as all-purpose flour plus enzyme inhibitor were placed in the farinograph.
The precipitate of the protein fractions that were determined to have the greatest
lipoxygenase activity were freeze-dried in a Virtis freeze dryer (SP Industries, Inc.,
Gardiner, NY) for 72 hours, crushed via mortar and pestle and were then added to all-
purpose flour (2.81 g of precipitate to 47.19 g of flour). The mix of the flour and
precipitate was then placed in the farinograph and allowed to run for at least 20 minutes
or until the curve left the 500 Brabender units (BU) line. Three trials of each sample
were run. These samples were compared with farinograph measurements of all-purpose
flour, Trump’s bread flour and all-purpose flour with soy flour added. In addition,
purified lipoxidase enzyme (from Glycine max soybean, lyophilized, powder obtained
from Biochemika Fluka) was also added to all-purpose flour (25mg) for comparison.
Esculetin (98%, obtained from Aldrich) was added to all-purpose + soy flour as an
enzyme inhibitor (15 mg) to the farinograph, as well.
22

Approximately 62% water was added to 50 g of flour or mixture of flour and
precipitate, such that at the peak time of the initial dough consistency was 500 BU.
Differences in gluten strength between control and experimental loaves were determined
by comparison of arrival time, dough development time, stability, departure time (DEP),
twenty minute drop (TMD) and tolerance index (MTI) of the different samples.
4.3 Bread Making
Bread loaves were baked based on the results of the farinograph experiment. Two
different types of control loaves were included. The negative control consisted entirely
of all-purpose flour (Wingold H&R, Bay State Milling, Quincy, MA), along with tap
water, salt (Morton’s, Rohm and Haas, Chicago, IL), active dry yeast (Fleischmann’s, AB
Mauri Food, Inc., St. Louis, MO), shortening (Crisco, J.M. Smucker Co., Orville, OH)
and granulated sugar. A detailed description of the formulation is listed in Table 4. The
positive control used higher protein quality flour, all Trump’s bread flour (General Mills,
Minneapolis, MN), to replace the all-purpose flour in the formulation. The formulation
used was according to the AACC 10-10 method (AACC 2000). The experimental loaves
were made according to the same method; however, the flour used was in the same ratio
as those used in the farinograph. Soy flour (Bob’s Red Mill Natural Foods, Milwaukie,
OR) and 4.8 precipitate were added to the formulation (see Table 4 for details) to
determine the differences of both physical and sensory attributes of the bread compared
with the controls.
Yeast (10.6 g) was mixed with 40 ml warm water (105°F) and 6 g of sugar and
allowed to sit for 10 minutes. Meanwhile, flour (200 g), shortening (6 g), salt (3 g) and
23

sugar (6 g) were combined in a large mixing bowl. After the yeast was activated, it was
poured into the mixing bowl with 100 ml cold tap water and the Kitchen-Aide mixer
kneaded the dough (dough hook attachment) for 5 minutes. The dough was formed into a
ball and allowed to rise for 52 minutes. It was then rolled out, folded into thirds and
allowed to rise for 24 minutes. Finally, the dough was divided in two parts (weighed
equally) and rolled out again. The dough was folded in thirds, flipped, rolled and folded
in thirds again. These were placed into two pup loaf pans covered and allowed to rise for
33 minutes before being placed in a preheated oven (425°F). The loaves were baked for
23 minutes. They loaves were immediately removed from the pans and were allowed to
cool for 30 minutes before being wrapped in plastic. The loaves were stored for 24 hours
before volume, texture and color was determined. Each batch of dough, which was
divided into two equal parts, yielded two pup loaves and the average of these was used
per trial.
24

Table 3: Farinograph Trials
Trial Flour Additional Treatments 1 All-Purpose Flour (50 g) None 2 Trump’s Bread Flour (50 g) None 3 All-Purpose Flour (47.19 g) Soy Flour (2.81 g) 4 All-Purpose Flour (47.19 g) pH 4.8 Precipitate (2.81 g) 5 All-Purpose Flour (47.19 g) pH 6.4 Precipitate (2.81 g) 6 All-Purpose Flour (50 g) Lipoxidase (25 mg) 7 All-Purpose Flour (47.19 g) Soy Flour (2.81 g) Esculetin (15 mg)
Table 4: Bread Formulation
Bread Sample
All-purpose flour
Bread Flour
Soy Flour
4.8 Precipitate
Yeast Sugar Salt Shortening Water
All-purpose
200 g 0 g 0 g 0 g 10.6 g 6 g 3 g 6 g 140 g
Trump’s Bread flour
0 g 200 g 0 g 0 g 10.6 g 6 g 3 g 6 g 140 g
All-purpose and soy flour
188.76 g 0 g 11.24 g
0 g 10.6 g 6 g 3 g 6 g 140 g
All-purpose flour and pH 4.8 precipitate
188.76 g 0 g 0 g 11.24 g 10.6 g 6 g 3 g 6 g 140 g
25

4.4 Loaf Volume
The loaf volume of the baked breads was determined by rapeseed displacement.
Initially, the empty chamber was filled with rapeseeds and the volume was recorded in
cubic centimeters. The cooled loaves, still wrapped in plastic, were then individually
placed in the chamber. The chamber was then filled again with rapeseeds and the
difference of volume containing the loaves and the empty chamber was calculated and
used as an estimate of the loaf volume. Since each replication of bread making yielded
two small pup loaves, the volumes of these were averaged and only one volume was used
per replication.
4.5 Color Determination of Bread Loaves
Immediately after loaf volume determination, color of both bread crust and crumb
was determined. A Minolta chromameter was used to determine the Hunter L, a, and b
values of the bread. L values indicate black or white (L=0, Black and L=100, White). A
greater L value indicates a lighter sample color. Hunter a values indicate whether the
sample contains red of green hues, depending on if the value is positive or negative,
respectively. Hunter b values describe either yellow or blue values depending on if the
value is positive or negative, respectfully. Crust measurements were taken on the center
of the top of the bread, while crumb measurements were taken from the middle of the
loaf, which was cut in a one-inch thick slice. Each pup loaf had one crust and one crumb
measurement taken and the average of these was used per trial.
26

4.6 Texture Determination of Bread Loaves
Texture was determined in conjunction with color determination. An EZ-Test
Texture Analyzer (Rheology Solutions Pty Ltd., Bacchus Marsh, Victoria) was used. The
bread compression jig probe was used for both crust and crumb. The texture of the crust
was measured on the top, center of the loaf. The probe was allowed to compress into the
bread for 1 cm before it regressed back. The compression cake test was used on the
software. The crumb texture was measured in the center of a 1-inch thick slice of bread
cut from the center of the loaf. Measurements were recorded in grams of force needed to
compress the bread 1 cm. Since each replication of bread making yielded two small pup
loaves, the texture measurements of these were averaged and only one measurement was
used per replication.
4.7 Sensory Analysis
Quantitative descriptive analysis (QDA) was performed to determine if there were
significant differences of certain bread attributes among the treatments (Gacula, 1997;
Stone et al., 1980; Zook and Wessman, 1977). Panelists underwent a two-week training
period before the trials were conducted. During the training period, the panelists’ defined
bread attributes to test. These attributes included: outside color, uniformity of outside
(crust), porosity of inside (crumb), chewiness of inside, toughness of outside, yeastiness,
sourness, and overall flavor (bland versus intense). All-purpose flour loaves, Trump’s
bread flour loaves and 4.8 precipitate supplemented loaves were involved in the sensory
analysis that was performed over the course of two days.
27

Ten panelists between the ages of 20-60 years of age were recruited for QDA.
Two panelists were let go, leaving 8 female panelists for a 10hr, two-week, training
period followed by two 20 minute testing periods. The panelists were to score each
attribute on a horizontal line measuring 15 cm. The left end of the line was marked as
less intensity of the attribute while the right end of the line was marked as more intensity
of the attribute. An example of a scorecard is shown in Appendix D. The scorecard line
scales were not presented all at once. They were separated into 3 groups: 1) color &
uniformity; 2) porosity, chewiness and toughness; and 3) yeasty, sourness and flavor
More intensity of the specific attribute was to be scored further from the left or zero. The
values were measured in centimeters with 0 cm starting at the left end of the line. Greater
values associated with more intensity of each attribute. The spectrum used for each
attribute is presented in Appendix E.
.
4.8 Statistical Analysis
All data were analyzed using JMP IN 5.1 (SAS Institute, Cary NC). One-way
analysis of variance (ANOVA) was initially performed to determine differences between
the control and the treatments. If a significant difference (p<0.05) was determined, a
Post-hoc test, Tukey’s Honestly Significant Difference test (HSD), was performed to
determine which loaves are significantly different from each other.
28

Chapter 5: Results
5.1 Results of LOX Assay
The results of the LOX assay are shown in Table 5. It was determined that the
greatest lipoxygenase activity was obtained in the pH 4.8 precipitate based on the amount
of protein present. As the pH varied, differing amounts of protein were present. A
protein assay was carried out to determine the protein concentrations at different pHs.
The activity of the enzyme at different pHs was compared to the protein concentrations at
each of those pHs.
The LOX activity of all-purpose flour was significantly less than any of the other
samples (p<0.05). The activity of the pH 4.8 precipitate was significantly greater than
the activity of pH 4.1 (p<0.05). Soy flour and pH 8.0 were not significantly different
from each other, which makes sense because protein has not precipitated out of the soy
flour at pH 8.0. Bread flour was found to have a significantly greater LOX activity when
compared with all-purpose flour (p<0.05). However, it was less than soy flour, but this
difference was not significant.
Protein concentrations of soy flour fractions at different pHs were determined
using the Biuret assay. The concentrations were compared to standards made from
bovine serum albumin (BSA) stock solution. A standard curve was produced, and the
linear equation derived from the curve was used to calculate the final protein
concentrations, which are shown in Table 6.
Protein concentrations at different pHs varied. At pH 8.0 the protein
concentration was 34.92 + 4.45 mg/ml, which was significantly greater than any of the
fractions (p<0.05). While the pH 6.4 fraction had a significantly greater protein
29

concentration than both pH 4.8 and 4.1 fractions (p<0.05), neither the 4.8 nor the 4.1
fractions differed from each other. These concentrations were then compared with the
previously calculated LOX activities to determine the activity based on the protein
concentration. Table 7 shows relative LOX activity per mg of protein in each fraction.
These were determined by dividing the average LOX activity and the protein
concentration at the same pH.
All LOX activities per protein concentration were significantly different from
each other (p<0.05). LOX activity at pH 4.8 (0.160) was significantly greater than at any
other pH (p<0.05). The pH 6.4 fraction had the next greatest activity followed by pH 4.1
and finally pH 8.0. The LOX purification at pH 4.8 was much greater than at pH 6.4
(p<0.001) and pH 4.1 (p<0.001). Therefore, the protein fraction obtained at pH 4.8 was
used in the farinograph trials, as well as the bread making and sensory trials, and
compared to the controls. The pH 6.4 precipitate was added in the farinograph trials to
determine its effects on dough rheological properties since it contained the second
greatest enzyme activity.
30

Table 5: LOX Activity in Different Flour Samples
Sample Average LOX Activity (ΔA/min) Soy Flour 2.15 + 0.57a
All-Purpose Flour -0.35 + 0.51c
Trump’s Bread Flour 1.65 + 0.73a,b
pH 8.0 2.37 + 0.93a
pH 6.4 1.95 + 0.30a
pH 4.8 1.75 + 0.43a,b
pH 4.1 0.69 + 0.93b,c
*Means and standard deviations followed by different superscripts are significantly different at the p<0.05 level.
Table 6: Average Protein Concentrations (mg/ml)
Protein Fraction at Different pHs (1:5 dilution factor)
Average Protein Concentration (mg/ml)
pH 8.0 34.92 + 4.45a
pH 6.4 21.16 + 1.93b
pH 4.8 10.95 + 1.96c
pH 4.1 9.73 + 2.07c
*Means and standard deviations followed by different superscripts are significantly different at the p<0.05 level.
Table 7: Relative LOX Activity in Original Extract and Isoelectric Precipitation Fractions Protein Fraction Relative LOX Activity pH 8.0 0.068d
pH 6.4 0.092b
pH 4.8 0.160a
pH 4.1 0.071c
*Means and standard deviations followed by different superscripts are significantly different at the p<0.05 level.
31

5.2 Results of Farinograph Trials
Results of the farinograph trials are presented in Appendix A. The different
parameters determined from the farinograph are shown for each trial performed. A total
of three trials were done for each different sample. One example farinograph from each
of the different samples is shown in Appendix B, Figures 2-8.
The absorption (Table 8), or amount of water added, was found to be significantly
different among the samples (p<0.01). Upon a post hoc statistical analysis, it was
determined that the mean absorption of all-purpose and bread flour samples were not
statistically different from each other; however, the two samples were statistically
different from all other samples (p<0.05). The all-purpose and bread flour samples were
found to have greater percent water absorption than the other samples.
Arrival time (Table 9) of the samples exhibited a similar trend to that of the
absorption percentage. Mean arrival times were determined to be significantly different
(p<0.01). The mean arrival time of both of the control samples were not statistically
different. The mean arrival time was significantly greater for the bread flour samples
compared with other samples (p<0.01). The mean arrival time was greatest for the bread
flour samples and the all-purpose samples with soy flour and inhibitor yielded the
shortest mean arrival time.
The mean peak time (Table 10) was also found to be significantly different among
the different samples of bread (p<0.01). The mean peak time of the bread with soy flour
and inhibitor was significantly greater (11.67 + 0.29 min) than the other samples
(p<0.01). The mean bread flour peak time was not significantly different from that of all-
purpose with added soy flour; however, these two samples were significantly different
32

from the samples with 4.8 and 6.4 precipitate (p<0.001). The mean peak time was
significantly greater in the 4.8 precipitate samples when compared with the 6.4
precipitate samples (p<0.05). The mean peak time of the all-purpose control samples was
significantly lower (1.83 + 0.29) than all other samples, with the exception of the sample
with added lipoxidase (p<0.05).
33

Table 8: Mean % Water Absorption of Different Flour Samples (%)
Flour Sample Mean Absorption (%) All-purpose flour 63.00 + 0.20a
Trump’s Bread flour 63.67 + 0.58a
All-purpose + Soy flour 61.93 + 0.23b
All-purpose + 4.8 precipitate 62.03 + 0.75b
All-purpose + 6.4 precipitate 61.93 + 0.06b
All-purpose + Lipoxidase 62.30 + 0.17b
All-purpose + soy flour + esculetin 62.10 + 0.00b
*Means and standard deviations followed by different superscripts are significantly different at the p<0.05 level.
Table 9: Mean Arrival Time (min) of Different Flour Samples
Flour Sample Mean Arrival Time(min) All-purpose flour 1.17 + 0.29b
Trump’s Bread flour 2.00 + 0.00a
All-purpose + Soy flour 1.17 + 0.14b
All-purpose + 4.8 precipitate 1.25 + 0.25b
All-purpose + 6.4 precipitate 1.08 + 0.14b
All-purpose + Lipoxidase 1.75 + 0.00a
All-purpose + soy flour + esculetin 1.00 + 0.00b
*Means and standard deviations followed by different superscripts are significantly different at the p<0.05 level.
Table 10: Mean Peak Time (min) of Different Flour Samples
Flour Sample Mean Peak Time (min) All-purpose flour 1.83 + 0.29e
Trump’s Bread flour 10.17 + 0.76b
All-purpose + Soy flour 10.67 + 0.29b
All-purpose + 4.8 precipitate 9.83 + 0.29c
All-purpose + 6.4 precipitate 2.00 + 0.00de
All-purpose + Lipoxidase 2.50 + 0.00d
All-purpose + soy flour + esculetin 11.67 + 0.29a
*Means and standard deviations followed by different superscripts are significantly different at the p<0.05 level.

The mean stability time (Table 11) was also found to be significantly different
between the samples (p<0.01). It was found that the mean stability time of the samples
containing pH 6.4 precipitate, lipoxidase, and soy flour plus inhibitor were significantly
lower than all other samples (p<0.05). The mean stability of the bread flour samples and
those containing the pH 4.8 precipitate were not significantly different from each other
(23.67 + 2.31 min and 24.75 + 1.15 min, respectively); however, they were significantly
higher than any other sample (p<0.05). The mean stability time of the all-purpose plus
soy flour samples was not as great as that of the bread flour and 4.8 precipitate
supplemented sample, but it was significantly greater than the all-purpose control
(p=0.004), the sample with pH 6.4 precipitate (p=0.04), the sample with added lipoxidase
(p=0.003), and the sample containing the inhibitor (p=0.003).
The mean departure times are presented in Table 12. The mean departure time of
the samples was found to be significantly different (p<0.01). The mean departure time of
the bread flour samples and the pH 4.8 precipitate supplemented samples were not
statistically different from each other; however, they were significantly higher than the
mean departure time of all other samples (p<0.05). It was found that the all-purpose
samples, pH 6.4 precipitate supplemented samples and lipoxidase supplemented samples
had significantly lower departure times than the samples containing soy flour or the pH
4.8 precipitate (p<0.05).
Table 13 illustrates the mean twenty minute drop (TMD) values. The mean TMD
values (BU) were found to be significantly different between the samples (p<0.01). The
samples containing the pH 4.8 precipitate were found to have a mean TMD of 0 BU,
which was significantly lower than any other sample (p<0.001). This meant that the
35

curve did not leave the 500 BU line after 20 minutes of run time, indicating no
breakdown in the gluten. The all-purpose control samples and then pH 6.4 supplemented
samples had a significantly higher mean TMD than the other samples (p<0.001).
The mean mixing tolerance index (Table 14) was found to be significantly
different among the samples (p<0.01). The mean mixing tolerance index was
significantly lower in the all-purpose control samples when compared with the pH 4.8
precipitate supplemented samples (p<0.001). The all-purpose control samples were not
significantly different from the pH 6.4 precipitate supplemented samples or lipoxidase
supplemented samples. In addition, no significant differences were found between the
bread flour controls and the samples supplemented with soy flour.
36

Table 11: Mean Stability (min) of Different Flour Samples
Flour Sample Mean Stability (min) All-purpose flour 4.17 + 0.29d
Trump’s Bread flour 23.67 + 2.31a
All-purpose + Soy flour 16.67 + 0.52b
All-purpose + 4.8 precipitate 24.75 + 1.15a
All-purpose + 6.4 precipitate 10.25 + 8.29c
All-purpose + Lipoxidase 6.92 + 2.08cd
All-purpose + soy flour + inhibitor 6.67 + 0.29cd
*Means and standard deviations followed by different superscripts are significantly different at the p<0.05 level.
Table 12: Mean Departure Time (min) of Different Flour Samples
Flour Sample Mean Departure Time (min)
All-purpose flour 5.33 + 0.58d
Trump’s Bread flour 25.67 + 2.31a
All-purpose + Soy flour 17.83 + 0.58b
All-purpose + 4.8 precipitate 26.00 + 1.32a
All-purpose + 6.4 precipitate 11.67 + 7.77c
All-purpose + Lipoxidase 8.67 + 2.08c
All-purpose + soy flour + inhibitor 18.33 + 0.29b
*Means and standard deviations followed by different superscripts are significantly different at the p<0.05 level.
Table 13: Mean Twenty Minute Drop (BU) of Different Flour Samples
Flour Sample Mean Twenty Minute Drop (BU)
All-purpose flour 76.67 + 11.55a
Trump’s Bread flour 36.67 + 5.77bc
All-purpose + Soy flour 20.00 + 0.00d
All-purpose + 4.8 precipitate 0.00 + 0.00e
All-purpose + 6.4 precipitate 73.33 + 5.77a
All-purpose + Lipoxidase 43.33 + 5.77b
All-purpose + soy flour + inhibitor 31.67 + 2.87c
*Means and standard deviations followed by different superscripts are significantly different at the p<0.05 level.
37

Table 14: Mean Tolerance Index of Different Flour Samples (BU)
Flour Sample Mean Tolerance Index (BU)
All-purpose flour 60.00 + 10.00a
Trump’s Bread flour 26.67 + 11.55cd
All-purpose + Soy flour 20.00 + 0.00cd
All-purpose + 4.8 precipitate 13.33 + 5.77d
All-purpose + 6.4 precipitate 56.67 + 11.55a
All-purpose + Lipoxidase 46.67 + 11.55b
All-purpose + soy flour + inhibitor 33.33 + 5.77bc
*Means and standard deviations followed by different superscripts are significantly different at the p<0.05 level.
38

5.3 Results of Bread making Experiments
Four different types of bread loaves were baked in the lab. There were two
controls: one type baked with all-purpose flour and the other with Trump’s bread flour.
Two different experimental loaf trials were also done, which included pH 4.8 soy flour
precipitate with all-purpose flour and soy flour with all-purpose flour, in the sample
ratios. Volume (cm3), Hunter L, a, and b values for crust and crumb, as well as crust and
crumb texture were analyzed. Appendix C displays the results of the analyses.
Three trials of each sample were baked and the average data of each trial (one
trial produced two pup loaves, which were averaged) was statistically analyzed. It was
found that the mean volume (cm3), Table 15, of the samples were statistically different
from each other (p<0.001). The mean volume of the bread flour loaves was significantly
greater (745.83 + 7.22 cm3) than the other loaves (p<0.01). Loaf volume of the all-
purpose control and the pH 4.8 supplemented loaves was not significantly different
(629.17 + 7.22 cm3 and 600.00 + 54.49 cm3, respectively; p=0.27). The loaves
containing soy flour were found to be significantly smaller than other loaves (p<0.05),
with the exception of the 4.8 precipitate loaves.
The average L values of the crust color are shown in Table 16. The mean values
were found to be significantly different between the samples (p<0.01). Loaves prepared
with bread flour were found to be significantly lighter in color when compared with the
other loaves (p<0.05). No significant difference was found between the all-purpose
control and the pH 4.8 precipitate loaves (56.13 + 0.65 and 55.57 + 0.45, respectively)
when L values were considered. The loaves prepared with soy flour were found to be
significantly lighter in crust color when compared with the all-purpose controls (p<0.05);
39

however, there was no difference found in crust color when compared with the pH 4.8
precipitate loaves.
The average a values obtained from the crust of the bread loaves are presented in
Table 17. There were no significant differences found between the loaves for the a color
value (p=0.71). In addition, there were no significant differences found between the
loaves for the b color (p=0.14) with the exception of the bread flour control and the pH
4.8 precipitate loaves (p<0.05). Bread flour loaves were found to have a slightly greater
b value when compared with loaves containing the 4.8 precipitate. The average b color
values for the loaf crust are found in Table 18.
The average L values of the crumb color (Table 19) of the loaves were found to
be significantly different (p<0.01). Bread flour loaf crumb was found to be significantly
lighter than any other loaf crumb (p<0.01). All-purpose loaf crumb color was not
significantly different from the crumb color of the soy flour experimental loaves (76.49 +
0.84 and 75.59 + 0.56, respectively). However, the average L values of the crumb color
of both controls were found to be significantly lighter than the pH 4.8 precipitate bread
loaves (p<0.001).
The average a value of crumb color of bread loaves (Table 20) was found to be
significantly different (p<0.001). The average crumb color for loaves with pH 4.8
precipitate was 0.78 + 0.02, which was significantly more positive (red) than any other
loaves (p<0.001). The all-purpose loaves were not significantly different than those with
soy flour added, with respect to the a values for crumb color. Bread flour loaves were
found to be significantly different (p<0.001) than the rest of the loaf samples. The bread
40

flour loaves were found to have negative a values, indicating a slight green hue as
opposed to red.
The average b values of the bread loaf crumb color are found in Table 21. There
was a significant difference between all the loaf samples in terms of b color values
(p<0.001). All average b color values of bread loaf crumb were positive, indicating a
more yellow color. Bread loaves with soy flour were significantly more yellow than the
other samples (p<0.001). Loaves made of bread flour were significantly less yellow than
any other sample (p<0.05). Mean b color values of the all-purpose control and the pH 4.8
precipitate were 19.39 + 0.24 and 19.81 + 0.18, respectively, but were significantly
different (p<0.05).
It was found that there were no significant differences between the crust textures
among the different samples; however, large standard deviations were observed.
Average crust texture values are found in Table 22. There were significant differences in
the crumb texture of the different loaf samples. The average crumb texture values are
found in Table 23. A significant difference in crumb texture was found between the
bread flour loaves and the loaves with added soy flour (p<0.05). The crumb of the loaves
prepared with bread flour was significantly softer than the loaves prepared with soy flour,
but was not found to be different than the other samples. No differences were found
between the all-purpose control and the pH 4.8 precipitate loaf samples with respect to
the crumb texture.
41

Table 15: Average Bread Loaf Volume (cm3) Bread Sample Average Loaf Volume
(cm3) All-purpose flour 629.17 + 7.22b
Trump’s Bread flour 745.83 + 7.22a
All-purpose + Soy flour 562.50 + 25.00c
All-purpose + 4.8 precipitate 600.00 + 54.47bc
*Means and standard deviations followed by different superscripts are significantly different at the p<0.05 level. Table 16: Average L Values of Bread Loaf Crust Bread Sample Average L value All-purpose flour 56.13 + 0.65b
Trump’s Bread flour 58.44 + 1.47a
All-purpose + Soy flour 53.86 + 1.54c
All-purpose + 4.8 precipitate 55.57 + 0.45bc
0=Black; 100=White * Means and standard deviations followed by different superscripts are significantly different at the p<0.05 level. Table 17: Average a Values of Bread Loaf Crust Bread Sample Average a Value All-purpose flour 13.35 + 0.36a
Trump’s Bread flour 13.26 + 1.03a
All-purpose + Soy flour 13.68 + 0.36a
All-purpose + 4.8 precipitate 13.08 + 0.56a
+a=Red; -a=Green *Means and standard deviations followed by different superscripts are significantly different at the p<0.05 level. Table 18: Average b Values of Bread Loaf Crust Bread Sample Average b Value All-purpose flour 29.82 + 0.50ab
Trump’s Bread flour 30.16 + 2.01a
All-purpose + Soy flour 29.51 + 0.31ab
All-purpose + 4.8 precipitate 27.81 + 1.00b
+b=Yellow; -b=Blue *Means and standard deviations followed by different superscripts are significantly different at the p<0.05 level.
42

Table 19: Average L Values of Bread Loaf Crumb Bread Sample Average L Value All-purpose flour 76.49 + 0.84b
Trump’s Bread flour 78.89 + 0.66a
All-purpose + Soy flour 75.59 + 0.56bc
All-purpose + 4.8 precipitate 74.55 + 0.99c
0=Black; 100=White *Means and standard deviations followed by different superscripts are significantly different at the p<0.05 level. Table 20: Average a Values of Bread Loaf Crumb Bread Sample Average a Value All-purpose flour 0.36 + 0.07b
Trump’s Bread flour -0.10 + 0.05c
All-purpose + Soy flour 0.34 + 0.11b
All-purpose + 4.8 precipitate 0.78 + 0.02a
+a=Red; -a=Green *Means and standard deviations followed by different superscripts are significantly different at the p<0.05 level. Table 21: Average b Values of Bread Loaf Crumb Bread Sample Average b Value All-purpose flour 19.39 + 0.24c
Trump’s Bread flour 18.88 + 0.24d
All-purpose + Soy flour 21.26 + 0.17a
All-purpose + 4.8 precipitate 19.81 + 0.18b
+b=Yellow; -b=Blue *Means and standard deviations followed by different superscripts are significantly different at the p<0.05 level. Table 22: Average Texture Values of Bread Loaf Crust Bread Sample Average Texture Value
(g) All-purpose flour 445.94 + 54.33a
Trump’s Bread flour 395.44 + 79.64a
All-purpose + Soy flour 456.48 + 120.7a
All-purpose + 4.8 precipitate 375.25 + 2.14a
*Means and standard deviations followed by different superscripts are significantly different at the p<0.05 level.
43

Table 23: Average Texture Values of Bread Loaf Crumb Bread Sample Average Texture Value
(g) All-purpose flour 223.58 + 30.16ab
Trump’s Bread flour 176.79 + 10.55b
All-purpose + Soy flour 278.51 + 67.76a
All-purpose + 4.8 precipitate 232.65 + 23.79ab
*Means and standard deviations followed by different superscripts are significantly different at the p<0.05 level.
44

5.4 Results of QDA Sensory Evaluation
QDA sensory evaluation was performed to determine differences in different
sensory attributes of bread samples. Appendix E describes the definitions of the sensory
attributes for bread as defined by the trained panelists. Appendix F describes the
standards (products) used for the training sensory panel. The sensory panel was
comprised of 8 students who went through a two-week training period prior to final
evaluations. Final evaluations consisted of two replications each of the bread flour and
all-purpose controls, as well as the 4.8 precipitate treated loaves.
The mean scores of each sensory attribute are shown in Table 24. The number
values equate to the anchors, going from less to more. It was scored on an unstructured
line scale of 15 cm. Therefore, a larger number is consistent with more or stronger
attributes (15 cm = very), whereas a small number is consistent with little or none of the
specific attribute (0 cm = none). Two sensory QDA replications of the loaves were
performed from the same bread sample to compare consistency of the results. These
values were averaged and presented in the data table. Additionally, Figure 1 shows the
different bread treatment samples in a spider plot. This plot shows the differences
between the samples.
According to panelists, all-purpose flour prepared loaves had a significantly
lighter crust color when compared with the bread flour loaves and the experimental
loaves (p=0.0009). However, there was no significant difference in the uniformity of the
crust among all-purpose and bread flour loaves. The samples containing the 4.8
precipitate were found have significantly more unevenness, or marbling, on the outside
crust (p=0.002). There were no significant differences found in the toughness of the crust
45
between the different samples; however, values indicate that the 4.8 precipitate loaves
might have been slightly tougher than the control loaves.
No significant differences in the porosity of the crumb were found among the
groups. Values indicate that the bread flour loaves yielded slightly greater, or more
dense, crumb structures. A significant difference in chewiness was found between the
all-purpose loaves and the 4.8 precipitate loaves (p=0.0063). The 4.8 precipitate loaves
were found to be much firmer when compared with the all-purpose control loaf. The
firmness of the bread flour loaves was not significantly different from the other two
samples.
There was no difference in yeasty taste found among the groups. Differences in
sourness were not found to be significant; however, all-purpose loaves yielded a slightly
greater value, meaning they were found to have a slightly greater sourness taste. There
were no significant differences found in flavor among the three different samples.
46

47
Table 24: Mean Scores of Bread Attributes from QDA Sensory Analysis (Average of Rep 1 and 2) Sample Outside
Color1Uniformity of outside2
Porosity of inside3
Chewiness of inside4
Toughness of outside5
Yeasty6 Sourness7 Flavor8
Bread Flour
3.29a 11.65a 3.93a 5.21ab 3.94a 5.63a 4.89a 3.56a
All-purpose flour
1.93b 10.57a 2.64a 3.62b 3.15a 5.61a 5.63a 3.38a
4.8 Precipitate
3.87a 7.15b 2.72a 6.90a 4.29a 5.63a 4.34a 3.81a
1Degree of darkness (from baking or type of dough) of the crust on side of bread sample (inside bread pan portion); Light (0) Dark (15) 2Degree of evenness of color of crust on side of bread sample; Uneven (0) Even (15) 3Size of air cells/air pockets inside of bread; Large or Airy (0) Small or Dense (15) 4Degree of density of inside of bread; Soft (0) Hard (15) 5Degree of toughness of outside of bread; Soft (0) Hard (15) 6Degree of fermented yeast scent, taste; Less (0) More (15) 7Degree of tanginess, lingering aftertaste; Less (0) More (15) 8Degree of flavor when sample is tasted; Bland (0) Strong (15) *Means followed by different superscripts are significantly different at the p<0.05 level.

48
0
2
4
6
8
10
12
Outside Color
Uniformity of Outside
Porosity of Inside
Chewiness of InsideToughness of Outside
Yeasty
Sourness
Flavor
Bread Flour All-Purpose Flour 4.8 Precipitate
Figure 1: Sensory Spider Plot of Bread Attributes

Chapter 6: Discussion of Results
6.1 LOX Assay
The LOX assay performed was derived from the methods of Wu et al. (1997).
The enzyme was extracted from full-fat soy flour with potassium phosphate. The mixture
was centrifuged, and the supernatant was used in the assay to determine the activity. The
LOX activity was determined based on the increase in absorbance at 234 nm due to a
formation of a conjugated diene (Wu et al, 1997). The activity was monitored at different
pH environments of defatted soy flour to determine the greatest amount of activity. The
protein concentration differed among the different precipitates; therefore, the LOX
activity was compared with the protein concentration at each pH environment.
It was found that a pH of 4.8 yielded the greatest activity when compared with the
other precipitates (p<0.05). According to Thanh and Shibasaki (1976), two major
soybean proteins are the 7S and 11S globulins, which can be fractionated through the
utilization of isoelectric precipitation. Thanh and Shibasaki (1976) successfully
separated the 7S globulin, or beta conglycinin, containing fraction, which is also thought
to contain the lipoxygenase enzyme, via isoelectric precipitation with a Tris buffer and
concentrated HCl. They found that the 11S globulin is collected by centrifugation when
the pH is adjusted to 6.4, whereas the 7S globulin can be separated at a pH of 4.8 (Thanh
and Shibasaki, 1976). Since the 7S fraction contains lipoxygenase, the pH 4.8 precipitate
should have had the greatest LOX activity, which was indeed the case according the
results (see Table 7). The fact that the pH 4.8 precipitate yielded the greatest LOX
activity allowed for it to be the fraction of interest to examine whether or not its addition
49
to all-purpose flour would increase the rheological and physical properties of bread
dough and loaves.
6.2 Farinograph Interpretation
Water absorption is one of the most commonly used parameters of farinographs
(Shuey et al., 1972). It is defined as the amount of water required to center the
farinograph curve on the 500 BU line for a flour-water dough (Shuey et al., 1972). Shuey
et al. (1972) stated that there is an approximate absorption increase of 1.5% for each 1%
increase in the protein content of the flour. Therefore, when there is a greater amount of
protein in flour, there is greater water absorption during dough formation.
It was found that there was no difference in water absorption for the two control
samples (Table 8). These two samples yielded a greater amount of water absorption than
the other samples, which meant more moisture was needed for dough formation.
According to Eliasson and Larsson (1993), the rheological properties of wheat flour
dough are sensitive to water content. Soy flour supplemented flour dough was much
more moist than all-purpose or bread flour because less absorption was needed for the
same effect. It was seen that soy flour absorbs a greater mass of water than the same
quantity of wheat flour (Cauvain and Young, 2006). Soy proteins have been seen to have
greater water retention (Zayas, 1997). Bread flour contains more protein than all-purpose
flour; however the farinograph results did not conclude there was a difference in water
absorption between the two flours. While there was no significant difference found in
water absorption between the bread flour and all-purpose flour, the average absorption of
the bread flour was slightly greater than that of the all-purpose flour.
50

The arrival time (Table 9) is the time required for the top of the curve to reach the
500 line after the mixer has been started and the water has been added (Shuey et al.,
1972). It is a measurement of the rate at which the water is taken up by the flour. In
general, it is found that as protein content increases, more time is needed for gluten
development; therefore, the arrival time also increases (Shuey et al., 1972). This is
consistent with the water absorption of the flours, as well. The arrival times (Table 9) of
the samples were found to exhibit a similar trend to that of the absorption percentages,
which is in accordance with the literature. Bread flour, containing the greatest amount of
protein, was found to have a longer arrival time because more time was needed for gluten
development. It was seen that samples with less protein also had less gluten development
so that they tended to have a shorter arrival time.
The dough development time, also referred to as peak time, is the time that
elapses when the curve is at its highest point. In the case that there is more than one
“peak” observed, the second peak is when that time occurs. Second peaks were observed
in the farinograph with added soy flour (Appendix B, Figure 4), the farinograph with the
added 4.8 precipitate (Appendix B, Figure 5) and the farinograph with added soy flour
plus inhibitor (Figure 8). According to Eliasson and Larsson (1993), the development is
the time it takes to stretch and extend the glutenins; therefore, the more glutenins and the
higher their molecular weight, the longer the development time will be. Longer peak
times should be associated with greater protein content in a flour, meaning the samples
with the longest peak times should be the samples with more protein in comparison,
which was seen. The addition of the soy flour and pH 4.8 precipitate resulted in a longer
peak time, as well as the high protein bread flour. Shuey et al. (1972) mentioned that
51

there was a curvilinear relationship between peak time and the percent water absorption
such that increased absorption usually resulted in an increase in the peak time. This was
only shown to be true with the bread flour sample. It yielded greater water absorption
and a longer peak time. All-purpose flour samples resulted in a very short peak time in
comparison. Soy flour and 4.8 precipitate, when added to all-purpose flour, greatly
improved the peak time when compared with the control sample of all-purpose flour.
The added soy flour and 4.8 precipitate allowed for similar results as the bread flour
samples when peak time was concerned.
Stability is the difference in time between the point where the top of the curve
first intercepts the 500 BU line (arrival time) and the point where the top of the curve
leaves the 500 BU line (departure time) (Shuey et al., 1972). In general, this value gives
some indication of the tolerance to mixing, or strength of the flour and gluten breakdown
a flour will have (Shuey et al., 1972). Bread flour exhibited a significantly greater mean
stability time when compared with the all-purpose controls (p<0.05) (Table 11). The
samples of all-purpose flour with added 4.8 precipitate achieved the greatest mean
stability time (24.75 + 1.15 min). This value was similar to that of the bread flour control
samples (23.67 + 2.31 min). Soy flour was found to have some effect on the stability
when compared to the all-purpose control, but did not have as large of an effect as the 4.8
precipitate did. Adding soy products to all-purpose flour seemed to increase the stability,
unlike the addition of pure lipoxidase. Therefore, it seemed soy products improved the
gluten strength of all-purpose flour; however, the 4.8 precipitate had the greatest effect.
This large effect could be attributed, at least in part, to the LOX enzyme, since it was
52

found to exhibit the most activity at pH 4.8. In a study by Hoseney et al. (1980), soy
flour lipoxygenase was seen to improve the rheological properties of wheat flour dough.
Departure time is the time elapsed from the first addition of the water until the top
of the curve leaves the 500 BU line (Shuey et al., 1972). Essentially, it is the sum of the
arrival time and the mixing stability. Stronger flours will exhibit a longer departure time.
The bread flour samples and the all-purpose with 4.8 precipitate were found to exhibit the
longest departure times, therefore, these two samples were the strongest flours compared
with the other samples. Bread flour and all purpose with 4.8 precipitate did not have
significantly different departure times; however, the sample containing the 4.8 precipitate
had a slightly longer departure time (Table 12). The all-purpose control sample had the
shortest departure time so that it was an extremely weak flour compared with other
samples. This was interesting in that when the all-purpose flour was supplemented with
4.8 precipitate there was a great improvement in the strength of the flour. According to
Rakotozafy et al. (1999), lipoxygenase from soy flour has been used for decades as an
improver in bread making. This effect was seen in the departure time of the farinographs
in the samples containing the all-purpose flour with added 4.8 precipitate. Soy flour also
improved the departure time when compared with the all-purpose control; however this
increase was not as great as the increase with the added precipitate. This could indicate
that the precipitate contains a more concentrated form of the enzyme or that there is
something in soy flour that interferes with the lipoxygenase, or other enzyme, activity.
The twenty minute drop gives the rate of breakdown and strength of a flour
(Shuey et al., 1972). A higher value indicates a weaker flour since it is the change in
height from the center of the curve at the peak and the center of the curve twenty minutes
53

after the first addition of water (Shuey et al., 1972). A large drop would indicate that the
flour has weakened. The all-purpose control and the all-purpose with 6.4 precipitate
yielded the largest values, significantly larger, than the other samples (Table 13). These
samples had almost 50% greater drop than that of the bread flour samples. The samples
with added soy flour were stronger than the bread flour samples since the TMD of these
samples was about 16 BU less than that of the bread flour samples. Interestingly enough,
the samples with added 4.8 precipitate did not yield any drop after 20 minutes. In fact,
according to the farinograph (Figure 5), the samples supplemented with the 4.8
precipitate did not see a drop until the 25-27 minute range. This was also an indication
that 4.8 precipitate has a positive rheological effect when added to all-purpose flour.
The mean mixing tolerance index is the difference in BUs from the top of the
curve at the peak to the top of the curve measured five minutes after the peak has been
reached (Shuey et al., 1972). Flours that have a low mixing tolerance index tend to have
a good tolerance to mixing; whereas, the higher the tolerance index, the weaker the flour
(Shuey et al., 1972). The all-purpose control samples yielded a very large tolerance
index when compared with the other samples; however, when it was supplemented with
4.8 precipitate, the sample yielded the lowest tolerance index (Table 14). Therefore, the
addition of the concentrated precipitate increased the mixing tolerance and improved the
rheological aspects of the all-purpose flour, which is in accordance to Hoseney et al.
(1980). They examined that soy flour lipoxygenase increased the mixing tolerance of
wheat flour dough (Hoseney et al., 1980). The tolerance index of the 4.8 precipitate
samples was much lower than that of the bread flour samples and the samples
supplemented with soy flour, though this difference was not found to be significant,
54

probably due to the large standard deviations. The samples with 6.4 precipitate were not
different from the all-purpose flour samples, indicating that there was really no effect of
adding the 6.4 precipitate.
6.3 Physical and Sensory Bread Attributes
The bread loaves baked with Trump’s bread flour had the greatest loaf volume,
which was significantly greater than the other loaves (Table 15). All-purpose control
loaves were not different from those with added 4.8 precipitate. Therefore, the
precipitate did not seem to have any effect on loaf volume, which contradicts the results
of the rheological studies. In addition, there was no difference in loaf volume between
the 4.8 precipitate loaves and those supplemented with soy flour. Neither soy flour, nor
4.8 precipitate had any effect on loaf volume. An increase in protein content, which
occurred when soy bean lipoxygenase was added to all-purpose flour, should have
allowed for an increase in loaf volume; however, this was not seen, which could have
been due to the inactivation of the enzyme due to heat. In a previous study, no
improvements were seen when lipoxygenase was inactivated by heat (Hoseney et al.,
1980).
The Hunter color scale was used when determining the difference in color
between the bread loaf crust and crumb samples. The L value is an indicator of black and
white. A large L value indicates more whiteness in color in a sample (White is when L =
100). Subsequently, a small L value indicates more black (Black is when L = 0).
Therefore, the darker a sample, the lower the L value and vice versa. Lipoxygenase has
been used for decades as a bleaching agent in bread dough (Gelinas et al., 1998; Hoseney
55

et al., 1980; Nicolas et al., 1982). The enzyme can be attributed to bleaching carotenoid
pigments, which results in a whiter crumb (Gelinas et al., 1998; Nicolas et al., 1982).
Since the addition of soy flour or pH 4.8 precipitate did not result in a significantly
lighter crumb color, the bleaching effect of the added enzyme was not necessarily seen.
Bread flour loaf crusts were significantly lighter than the other samples. The
interaction of proteins and carbohydrates, with the addition of heat, results in the Maillard
reaction, or browning of foods (Hegarty, 1982). This reaction can be attributed to
differences in crust color. Sensory panelists described the all-purpose control loaves as
being significantly lighter in crust color than the other samples (p<0.05) (Table 16, 19).
The panelists did not find differences in the 4.8 precipitate bread and the bread flour
loaves (Table 24). These findings may be inconclusive since the bread in each test was
baked on different days; however, the same oven and temperature was used for each trial.
Hunter a values describe whether the sample contains red or green hues,
depending on if the value is positive or negative, respectively. Hunter b values describe
either yellow or blue values depending on if the value is positive or negative,
respectfully. The difference, or Δa or Δb, in the values is determined by calculating the
difference in the experimental loaf value minus the control loaf values. If the difference
is positive, then the experimental loaf is either redder (when Δa is positive) or yellower
(when Δb is positive) than the control loaves.
For all bread crust samples, there was no difference in a value found. All of the
values were positive; therefore, the bread samples contained a red hue as opposed to a
green hue. When examining the actual mean a values, the all-purpose loaves with added
soy flour were found to have a slightly higher value indicating these samples were redder
56

than the controls. The two control loaves did not have much of a difference in a value.
The all-purpose plus 4.8 precipitate was ever so slightly less red than the other samples.
The two control crust samples were not different from each other when
considering the b values (Table 18). The b values of these samples were also positive
indicating they were yellower rather than bluer. The difference between the controls and
the experimental crust of the loaves is slight, but both experimental loaves had smaller
values. The difference between the experimental loaves and the control loaves were
negative indicating that the experimental loaves were bluer than the control loaves;
however, all samples yielded positive values.
The loaf crumb a values were found to have significant differences (p<0.05)
(Table 20). The all-purpose crumb color was not different from that of the all-purpose
plus soy flour. These values were positive and indicate a redder color rather than greener
color. The Δa value of the all-purpose plus 4.8 precipitate experimental loaf and the all-
purpose control was positive, which indicated that the experimental loaf was redder than
the control loaf. The Δa value between the 4.8 precipitate loaves and the bread flour
control loaf was also positive. Therefore, the experimental loaf crumb was redder than
the control loaf crumb. It should be noted that the bread flour crumb yielded a negative
mean value. This meant that the bread loaf crumb was greener than any other sample.
Average b values of the bread loaf crumb were found to be significantly different
from each other (Table 21). The all-purpose control bread loaf crumb was yellower than
that of the bread flour control loaf crumb. Both experimental loaves were also found to
be yellower than either of the controls. All of the b values of the bread crumb were
positive, indicating that they were all yellower rather than bluer. Differences in the color
57

between the loaves can probably be attributed to the difference in color of the soy flour
versus the all-purpose and bread flour, as well as the color of the 4.8 precipitate.
Crust texture did not differ among the samples, which could have been due to the
large standard deviations of the values. Based on the average values, the all-purpose
control and the all-purpose plus soy flour sample could indicate a slightly tougher texture
because the values were slightly greater than the other samples. A larger texture value
indicates more toughness in that more grams of force were required to compress the
sample 1 cm.
The results of the QDA sensory panel (Table 24) were in accordance with the
results of the texture analyzer in that there were no significant differences in outside
toughness found. The value of the 4.8 precipitate loaves was slightly greater than that of
the other loaves, which indicated that the outside toughness was harder. This was not the
case with the texture analyzer; however, the difference might be attributed to the fact that
there were large standard deviations associated with both the values of texture analysis
and the QDA tests.
Significant differences in crumb texture were observed in the texture analysis
(Table 23). The crumb texture was toughest for the all-purpose plus soy flour loaves,
which was significantly tougher than the crumb of the bread flour control loaves
(p<0.05). The bread flour loaves yielded the softest crumb texture, probably due to the
greater volume of the loaves. The other loaf samples had no significant difference in
crumb texture. The texture values of the crumb were smaller than those of the crust,
which was desired.
58

The crumb texture analysis of the loaves was not in accordance with the QDA
sensory tests. The panelists indicated that the all-purpose control loaves were
significantly more chewy (less firm) than the bread flour control loaves or the loaves with
4.8 precipitate (p<0.05). The panelists indicated that the 4.8 precipitate loaves were
hardest when considering the crumb. The 4.8 loaves were probably harder because the
precipitate increased the strength of the dough, as indicated by the farinograph results.
Porosity of the crumb (Table 24) was also described by the sensory panelists.
Samples were described as either having dense, small sized air cells or large, airy air
cells. Larger air cells would indicate perhaps a greater loaf volume, as well as a softer
crumb texture. Whereas small, dense cells would indicate a harder, dense crumb texture
and smaller loaf volume might correlate. The all-purpose loaves were described as
having large air cells; however, no significant difference was found among the samples.
The all-purpose loaves were fluffier; therefore, the fact that they also had the largest air
cells makes sense. The other samples were found to have more dense cells, which
corresponded with the fact that they were described as harder. Bread flour loaves were
found to have the greatest loaf volume, which did not correspond to their dense, hard
crumb texture and less porous air cells. All-purpose loaves had smaller volumes than the
bread flour loaves, which also did not correspond to the more chewy and airy crumb
structure of the all-purpose flour loaves. The all-purpose with added 4.8 precipitate
loaves did not have large loaf volumes, and these loaves did show indication of a harder,
denser crumb. The porosity of the 4.8 loaves was not found to be as airy as the all-
purpose control loaves, but the 4.8 loaves were seemingly similar to the bread flour
controls when chewiness was considered. This might have indicated that the pH 4.8
59

precipitate had an effect on crumb structure as it was very similar to that of the bread
flour controls.
6.4 Flavor of Bread
QDA sensory analysis included the description of yeastiness, sourness and
general flavor (bland or more intense) of the bread samples (Table 24). Yeastiness was
defined as the degree of fermented yeast smelled and/or tasted. A small value would
indicate less yeastiness versus a large value that would indicate a stronger, more intense
yeastiness of the bread samples. Among the samples, no difference was seen when
considering yeastiness, which was expected since the same amount of yeast was used in
each loaf. The values obtained from the QDA test were basically the same for each
sample; bread flour and all-purpose plus 4.8 were 5.63, while the all-purpose control was
5.61. All samples contained the same amount of yeast, and therefore, no difference in
yeastiness was desired.
Sourness was described as either less (bland) or more intense (sourdough-like)
(Table 24). No significant differences were found among the samples in sourness. All-
purpose loaves indicated a slightly higher value than the other two samples, which meant
panelists thought those loaves (all-purpose) were more sour, but not significantly more
sour. A difference in sourness was not desired because loaves were meant to have no
taste difference.
Finally, the overall intensity of flavor was assessed by panelists. No significant
difference was determined from the tests, which also was desired. Small values were
seen, indicating the bread did not have intense flavor. Loaves were made exactly the
60

same, with the exact same proportions of ingredients, with the exception of the type of
flour. The experimental loaves contained less all-purpose flour and had added soy flour
or precipitate in the same amount; the total amount of all-purpose flour plus either
precipitate or soy flour equaled the proportion of flour used in the control loaves. Since
part of the purpose of the research was to see if adding soy products to bread would affect
the flavor, the fact that no significant difference was seen between the experimental
loaves and the controls was very well desired. Therefore, the addition of 4.8 precipitate
did not seem to have an effect on flavor when added to bread.
61

Chapter 7: Conclusions of Research
There were three research objectives of this study. They included: determining
the protein fraction of soy flour with the greatest lipoxygenase activity, determining
rheological and physical attributes of bread samples, and conducting QDA sensory
analysis of bread samples. It was determined that soy protein fractions at pH 4.8 yielded
the greatest lipoxygenase activity. This made sense because the 7S globulin fraction,
which is thought to contain the enzyme lipoxygenase, precipitates at a pH of 4.8;
therefore, the activity was greatest in that fraction. Since the 4.8 fraction had the greatest
activity, it was utilized in further tests as an experimental adjunct. In addition, soy flour
was also used as an experimental adjunct to examine differences in the protein fraction
and the product as a whole.
The farinograph results indicated that the addition of the 4.8 soy flour precipitate
increased the strength of all-purpose flour. The farinographs of the 4.8 precipitate trials
yielded longer stability times than any other sample, as well as almost no drop after
twenty minutes. The farinograph results indicated that the addition of the 4.8 precipitate
to all-purpose flour yielded similar results of that of the bread flour trials, with even more
strength than the bread flour samples. The addition of the concentrated precipitate
increased the mixing tolerance and improved the rheological aspects of the all-purpose
flour, which is in accordance to Hoseney et al. (1980). Overall, the addition of soy flour
had some effect in increasing the strength of all-purpose flour but not to the same degree
as the added 4.8 precipitate.
Bread flour control loaves had the greatest loaf volume, while the soy flour
supplemented bread had the smallest average loaf volume. The addition of 4.8
62

precipitate to all-purpose bread loaves did not improve the loaf volume. The average
volumes of the all-purpose control breads were greater, but not significantly, than the pH
4.8 precipitate supplemented bread. The color of the crust and crumb of the bread
measured was mostly in accordance with the sensory panel. All-purpose flour bread
loaves had a lighter crust than bread flour loaves; however, differences in crust color
could be attributed to the fact that the different bread loaves were baked separately.
Crumb color, while there were slight differences between the different samples, did not
differ greatly.
Bread loaf texture was measured through the use of a texture analyzer, and
sensory panelists described different bread texture attributes. Both the texture analyzer
and the panelists saw no differences between the samples when the crust texture was
considered. Additionally, panelists found that the all-purpose flour bread loaf crumb was
softer, while the texture analyzer determined that bread flour loaves had the softer crumb.
The addition of 4.8 precipitate to bread did not result in a softer crumb according to the
texture analysis. However, according to the sensory results, panelists found the crumb to
be significantly harder than that of the all-purpose loaves. In other words, the 4.8
precipitate might have caused the crumb of the bread to increase in toughness.
Overall, the addition of pH 4.8 soy flour precipitate obtained through isoelectric
precipitation was seen to have some effects on dough rheological properties and bread
properties. Rheologically, the addition of pH 4.8 precipitate to all-purpose flour
increased the strength of the dough to mimic, at the very least, the strength of bread flour.
Soy flour, as a whole, also had similar effects, but not to the same degree. However, this
increase in strength did not mimic the physical properties that bread flour exhibited.
63

Bread flour loaves were found to have greater volume and a softer crumb. The addition
of pH 4.8 precipitate caused a slight decrease in volume, which translated to a firmer
crumb. Bread flavor among all samples was not found to be affected by the different
treatments. While pH 4.8 precipitate seemed to improve bread rheological properties, no
improvements on the physical aspects of bread were observed. Heat causes proteins to
denature, or undergo conformational changes, which can affect the functionality of the
enzyme (Zayas, 1997). As previously mentioned, the most abundant form of soy bean
lipoxygenase is not heat stable; therefore, it might be assumed that the enzyme was
inactivated due to heat during bread making. In addition, pH plays a role in influencing
physical properties of dough and bread (Eliasson and Larsson, 1993). The pH 4.8
precipitate added to the dough could have contributed to a change (or lowering) in overall
pH, therefore, affecting physical aspects of bread. Heat inactivation of the enzyme or the
lowered pH of the bread due to the added precipitate might have caused there to be no
effect seen. More in-depth research should be performed to confirm these findings as
there are limited publications thus far on the subject matter.
64

Chapter 8: References
1. AACC. 2000. Approved Methods of the AACC. American Association of Cereal Chemists, St. Paul, MN.
2. Acevedo E, Silva P and Silva H. 2002. Wheat growth and physiology. In: Curtis
BC, Rajaram S and Macpherson HG, editors. Bread wheat improvement and production. Rome: Food and Agriculture Organization of the United Nations. p 39-60.
3. Belton PS. 2003. The molecular basis of dough rheology. In: Cauvain SP,
editor. Bread making: Improving quality. Boca Raton: CRC Press. p 273-286.
4. Cauvain S and Young L. 2006. Baked products: science, technology and practice. Oxford: Blackwell Publishing. p 79.
5. Cauvain S. 2003a. Bread making: an overview. In: Cauvain SP, editor. Bread
making: Improving quality. Boca Raton: CRC Press. p 8-26. 6. Cauvain S. 2003b. Introduction. In: Cauvain SP, editor. Bread making:
Improving quality. Boca Raton: CRC Press. p 1-7.
7. Cornell H. 2003. The chemistry and biochemistry of wheat. In: Cauvain SP, editor. Bread making: Improving quality. Boca Raton: CRC Press. p 31-70.
8. Cumbee B, Hildebrand DF and Addo K. 1997. Soybean flour lipoxygenase
isozymes effects on wheat flour dough rheological and bread making properties. J Food Sci 62(2):281-283.
9. Curtis BC. 2002. Wheat in the world. In: Curtis BC, Rajaram S and Macpherson
HG, editors. Bread wheat improvement and production. Rome: Food and Argiculture Organization of the United Nations. p 1-17.
10. Delcros JF, Rakotozafy L, Boussard A, Davidou S, Porte C, Potus J, and Nicolas
J. 1998. Effect of mixing conditions on the behavior of lipoxygenase, peroxidase and catalase in wheat flour doughs. Cereal Chem 75(1): 85-93.
11. Eliasson AC and Larsson K. 1993. Cereals in breadmaking:a molecular colloidal
approach. New York: Marcel Dekker, Inc. p 261-325
12. Faubion JM and Hoseney RC. 1981. Lipoxygenase: Its biochemistry and role in bread making. Cereal Chem 58(3):175-180.
65

13. Gelinas P, Poitras E, McKinnon and Morin A. 1998. Oxido-reductases and lipases as dough-bleaching agents. Cereal Chem 75(6):810-814.
14. Gill BS and Friebe B. 2002. Cytogenetics, phylogeny and evolution of cultivated
wheats. In: Curtis BC, Rajaram S and Macpherson HG, editors. Bread wheat improvement and production. Rome: Food and Argiculture Organization of the United Nations. p 71-82.
15. Gacula MC. 1997. Descriptive sensory analysis methods. In: Gacula MC, editor.
Descriptive sensory analysis in practice. Connecticut: Food & Nutrition Press, Inc. p 5.
16. Hildebrand DF, Versluys RT and Collins GB. 1991. Changes in lipoxygenase
isozyme levels during soybean embryo development. Plant Sci 75:1-8.
17. Hegarity PV. 1982. Influence of food processing on nutritive value of proteins. In: Fox PF and Condon JJ, editors. Food proteins. London: Applied Science Publishers. p 146-147.
18. Hoseney RC, Rao H, Faubion J and Sidhu JS. 1980. Mixograph studies. IV.
The mechanism by which lipoxygenase increases mixing tolerance. Cereal Chem 57(3):163-165.
19. Indrani D and Rao GV. 2006. Effect of additives on rheological characteristics
and quality of wheat flour parotta. J Texture Studies 37:315-338.
20. Lawless HT and Heymann H. 1998. Introduction and overview. In: Lawless and Heymann, editor. Sensory evaluation of food. New York: Chapman and Hall. p 1-26.
21. Liu K. 1997. Soybeans: Chemistry, technology and utilization. New York:
Chapman and Hall. p 25-95 and p 386-87.
22. McWilliams M. 2001. Foods: Experimental Perspectives. Fourth Edition. New Jersey: Prentice-Hall. p 392-96; 421.
23. Nicolas J, Autran M and Drapron R. 1982. Purification and some properties of
wheat germ lipoxygenase. J Sci Food Agric 33:365-72.
24. Pena RJ. 2002. Wheat for bread and other foods. In: Curtis BC, Rajaram S and Macpherson HG, editors. Bread wheat improvement and production. Rome: Food and Argiculture Organization of the United Nations. p 483-91.
25. Rakotozafy L, Mackova B, Delcros JF, Boussard A, Davidou S, Potus J and
Nicolas J. 1999. Effect of adding exogenous oxidative enzymes on the activity of
66

67
37. Zook K and Wessman C. 1977. The selection and use of judges for descriptive panels. Food Tech 8:56-61.
36. Zayas JF. 1997. Functionality of proteins in food. New York: Springer-Verlag. p 8, 34-35, 110.
35. Wu Y, Schwarz PB, Doehlert DC, Dahleen LS and Horsley RD. 1997. Rapid separation and genotypic variability of barley (Hordeum vulgare L.) lipoxygenase isozymes. J Cereal Sci 25:49-56.
34. Wolf WJ and Cowan JC. 1975. Soybeans as a food source. New York: CRC Press. p 35.
33. Tilley KA, Benjamin RE, Bagorogoza KE, Okot-Kotber BM, Prakash O, Kwen H. 2001. Tyrosine cross-links: molecular basis of gluten structure and function. J Agric Food Chem 49:2627-2632.
32. Thanh VH and Shibasaki K. 1976. Major proteins of soybean seeds: A straightforward fractionation and their characterization. J Agric Food Chem 24(6):1117-1121.
31. Stone H, Sidel JL and Bloomquist J. 1980. Quantitative descriptive analysis. Cereal Foods World 25(10):642-644.
30. Stohl M. 2002. Preface. In: Curtis BC, Rajaram S and Macpherson HG, editors. Bread wheat improvement and production. Rome: Food and Argiculture Organization of the United Nations. p vii.
29. Shuey WC, Locken L, and Loska S. 1972. The farinograph handbook. St. Paul: American Association of Cereal Chemists, Inc. p 1-3; 47-48.
28. Shimoni Y, Blechl AE, Anderson OD and Galili G. 1997. A recombinant protein of two high molecular weight glutenins alters gluten polymer formation in transgenic wheat. J Biological Chem 272 (24):15488-15495.
27. Shiiba K, Negishi Y, Okada K and Nagao S. 1991. Purification and characterization of lipoxygenase isozymes from wheat germ. Cereal Chem 68(2):115-122.
26. Ram S, Dawar V, Singh R, and Shoran J. 2005. Application of solvent retention capacity tests for the prediction of mixing properties of wheat flour. J Cereal Sci 42: 261-266.
three endogenous oxidoreductases during mixing of wheat flour dough. Cereal Chem 76(2):213-218.

Appendix A: Farinograph Parameters Measured on Different Flour Samples
Sample Absorption (%) Arrival Time (min) Peak Time (min) Stability (min) Departure Time (min) Twenty Minute Drop (BU)
All-Purpose FlourRep 1 63.00% 1.00 2.00 4.00 5.00 70.00Rep 2 62.80% 1.00 1.50 4.00 5.00 90.00Rep 3 63.20% 1.50 2.00 4.50 6.00 70.00
Trump's Bread FlourRep 1 63.00% 2.00 10.00 21.00 23.00 40.00Rep 2 64.00% 2.00 9.50 25.00 27.00 40.00Rep 3 64.00% 2.00 11.00 25.00 27.00 30.00
All-Purpose + Soy FlourRep 1 61.80% 1.25 11.00 16.25 17.50 20.00Rep 2 61.80% 1.25 10.50 17.25 18.50 20.00Rep 3 62.20% 1.00 10.50 16.50 17.50 20.00
All-Purpose + 4.8 PrecipitateRep 1 62.80% 1.00 9.50 23.50 24.50 0.00Rep 2 62.00% 1.50 10.00 25.00 26.50 0.00Rep 3 61.30% 1.25 10.00 25.75 27.00 0.00
All-Purpose + 6.4 PrecipitateRep 1 61.90% 1.25 2.00 12.75 14.00 70.00Rep 2 61.90% 1.00 2.00 17.00 18.00 80.00Rep 3 62.00% 1.00 2.00 1.00 3.00 70.00
All-Purpose + LipoxidaseRep 1 62.50% 1.75 2.50 6.25 8.00 40.00Rep 2 62.20% 1.75 2.50 5.25 7.00 50.00Rep 3 62.20% 1.75 2.50 9.25 11.00 40.00
All-Purpose + Soy Flour + InhibitorRep 1 62.10% 1.00 11.50 7.00 18.50 30.00Rep 2 62.10% 1.00 12.00 6.50 18.50 30.00Rep 3 62.10% 1.00 11.50 6.50 18.00 35.00
68

Appendix B: Farinographs of Rheological Studies
Figure 2: Farinograph of All-Purpose Flour (50g) and 63% Water
69

Figure 3: Farinograph of Trump’s Bread Flour (50g) and 63% Water
70

Figure 4: Farinograph of All-Purpose Flour (47.19g), Soy Flour (2.81g) and 61.8% Water
71

Figure 5: Farinograph of All-Purpose Flour (47.19g), pH 4.8 Precipitate (2.81g) and 62.8% Water
72

Figure 6: Farinograph of All-Purpose Flour (47.19g), pH 6.4 Precipitate (2.81g) and 62% Water

Figure 7: Farinograph of All-Purpose Flour (50g), Dissolved Lipoxidase (25mg) and 62.2% Water
74

Figure 8: Farinograph of All-Purpose Flour (47.19g), Soy Flour (2.81g), Esculetin (15mg) and 62.1% Water
75

A ll-Pu rpose F lou r Volu m e (cm 3 ) C ru st C olor C ru m b C olor C ru st T extu re (g) C ru m b T extu re (g)L a b L a b
R ep 1 A 6 2 5 5 5 .7 3 + 1 4 .0 4 + 2 9 .0 2 7 6 .5 8 + 0 .3 4 + 1 9 .3 1 4 4 5 .9 2 3 6 2 5 6 .1 0 2 7R ep 1 B 6 5 0 5 5 .7 8 + 1 3 .4 3 + 3 0 .5 5 7 8 .2 8 + 0 .3 1 + 1 9 .1 6 5 0 1 .6 0 0 3 2 4 5 .1 9 1 7A v erag e R ep 1 6 3 7 .5 5 5 .7 6 1 3 .7 4 2 9 .7 9 7 7 .4 3 0 .3 3 1 9 .2 4 4 7 3 .7 6 1 9 5 2 5 0 .6 4 7 2R ep 2 A 6 2 5 5 7 .8 0 + 1 2 .5 5 + 3 0 .2 9 7 5 .5 8 + 0 .2 9 + 1 9 .2 1 5 3 6 .7 2 9 6 2 1 0 .1 1 3 3R ep 2 B 6 2 5 5 5 .9 5 + 1 3 .5 1 + 3 0 .3 8 7 6 .0 7 + 0 .3 4 + 1 9 .3 1 4 2 4 .7 1 3 4 2 4 7 .9 4 4 9A v erag e R ep 2 6 2 5 5 6 .8 8 1 3 .0 3 3 0 .3 4 7 5 .8 3 0 .3 2 1 9 .2 6 4 8 0 .7 2 1 5 2 2 9 .0 2 9 1R ep 3 A 6 2 5 5 5 .9 3 + 1 3 .5 3 + 2 9 .7 4 7 6 .7 0 + 0 .3 5 + 1 9 .3 3 3 7 4 .6 9 6 1 1 7 7 .5 8 4 2R ep 3 B 6 2 5 5 5 .5 8 + 1 3 .0 4 + 2 8 .9 4 7 5 .7 2 + 0 .5 2 + 1 9 .9 9 3 9 1 .9 8 0 4 2 0 4 .5 5 5 8A v erag e R ep 3 6 2 5 5 5 .7 6 1 3 .2 9 2 9 .3 4 7 6 .2 1 0 .4 4 1 9 .6 6 3 8 3 .3 3 8 2 5 1 9 1 .0 7T ru m p's B read Flou r Volu m e (cm 3 ) C ru st C olor C ru m b C olor C ru st T extu re (g) C ru m b T extu re (g)
L a b L a bR ep 1 A 7 5 0 5 9 .7 4 + 1 2 .5 3 + 2 8 .5 3 7 6 .5 1 + 0 .0 1 + 1 8 .3 8 4 7 8 .0 2 8 3 2 0 1 .1 3 9 8R ep 1 B 7 5 0 5 9 .0 7 + 1 2 .8 0 + 2 9 .1 1 8 0 .7 6 -0 .0 8 + 1 9 .2 8 4 7 7 .1 7 8 1 6 8 .0 4 9 9A v erag e R ep 1 7 5 0 5 9 .4 1 1 2 .6 7 2 8 .8 2 7 8 .6 4 -0 .0 4 1 8 .8 3 4 7 7 .6 0 3 1 5 1 8 4 .5 9 4 8 5R ep 2 A 7 7 5 5 5 .8 4 + 1 4 .3 6 + 3 1 .0 5 8 0 .6 5 -0 .0 7 + 1 9 .3 7 3 8 8 .5 6 4 3 1 7 5 .4 4 2 8R ep 2 B 7 2 5 5 7 .6 5 + 1 4 .5 3 + 3 3 .9 0 7 8 .6 3 -0 .2 0 + 1 8 .9 3 3 9 1 .7 2 5 4 1 5 4 .1 3 0 7A v erag e R ep 2 7 5 0 5 6 .7 5 1 4 .4 5 3 2 .4 8 7 9 .6 4 -0 .1 4 1 9 .1 5 3 9 0 .1 4 4 8 5 1 6 4 .7 8 6 7 5R ep 3 A 7 2 5 5 7 .5 5 + 1 3 .5 3 + 3 1 .0 4 7 7 .0 5 -0 .0 8 + 1 8 .6 9 3 1 5 .9 6 0 2 1 6 9 .9 8 7 3R ep 3 B 7 5 0 6 0 .7 8 + 1 1 .8 0 + 2 7 .3 4 7 9 .7 4 -0 .1 5 + 1 8 .6 5 3 2 1 .2 1 1 8 1 9 1 .9 6 2 3A v erag e R ep 3 7 3 7 .5 5 9 .1 6 5 1 2 .6 6 5 2 9 .1 9 7 8 .3 9 5 -0 .1 1 5 1 8 .6 7 3 1 8 .5 8 6 1 8 0 .9 7 4 8A ll-Pu rpose + Soy Flou r Volu m e (cm 3 ) C ru st C olor C ru m b C olor C ru st T extu re (g) C ru m b T extu re (g)
L a b L a bR ep 1 A 5 7 5 5 5 .4 8 + 1 3 .4 5 + 3 0 .3 6 7 4 .7 0 + 0 .4 8 + 2 1 .1 6 5 7 7 .3 1 4 5 3 6 5 .6 2 0 6R ep 1 B 5 5 0 5 2 .6 5 + 1 3 .9 3 + 2 9 .3 2 7 5 .4 2 + 0 .4 0 + 2 1 .0 8 6 1 1 .5 7 7 1 3 4 6 .3 4 7 9A v erag e R ep 1 5 6 2 .5 5 4 .0 7 1 3 .6 9 2 9 .8 4 7 5 .0 6 0 .4 4 2 1 .1 2 5 9 4 .4 4 5 8 3 5 5 .9 8 4 2 5R ep 2 A 6 0 0 5 6 .2 3 + 1 2 .7 0 + 2 8 .9 0 7 6 .1 5 + 0 .1 9 + 2 1 .1 4 3 8 8 .1 5 6 4 2 1 1 .5 9 1 9R ep 2 B 5 7 5 5 4 .3 3 + 1 3 .9 2 + 3 0 .0 5 7 6 .1 9 + 0 .2 5 + 2 1 .2 8 3 5 2 .9 7 6 1 2 4 9 .0 1 5 6A v erag e R ep 2 5 8 7 .5 5 5 .2 8 1 3 .3 1 2 9 .4 8 7 6 .1 7 0 .2 2 2 1 .2 1 3 7 0 .5 6 6 2 5 2 3 0 .3 0 3 7 5R ep 3 A 5 5 0 5 2 .2 6 + 1 4 .2 3 + 3 0 .0 8 7 6 .9 3 + 0 .2 5 + 2 1 .1 0 3 6 7 .0 9 9 2 2 7 6 .2 9 3 1R ep 3 B 5 2 5 5 2 .1 8 + 1 3 .8 5 + 2 8 .3 5 7 4 .1 6 + 0 .4 4 + 2 1 .7 8 4 4 1 .7 4 2 7 2 2 2 .1 9 7A v erag e R ep 3 5 3 7 .5 5 2 .2 2 1 4 .0 4 2 9 .2 1 5 7 5 .5 4 5 0 .3 4 5 2 1 .4 4 4 0 4 .4 2 0 9 5 2 4 9 .2 4 5 0 5A ll-Pu rpose + 4 .8 Precipita te Volu m e (cm 3 ) C ru st C olor C ru m b C olor C ru st T extu re (g) C ru m b T extu re (g)
L a b L a bR ep 1 A 5 5 0 5 6 .4 5 + 1 2 .4 5 + 2 6 .2 3 7 3 .3 1 + 0 .7 5 + 1 9 .2 8 3 8 8 .0 0 3 5 2 3 8 .0 0 2 7R ep 1 B 6 0 0 5 5 .5 3 + 1 2 .5 5 + 2 7 .2 5 7 4 .4 5 + 0 .7 9 + 1 9 .9 3 3 6 5 .6 7 1 6 2 6 3 .4 4 4 6A v erag e R ep 1 5 7 5 5 5 .9 9 1 2 .5 0 2 6 .7 4 7 3 .8 8 0 .7 7 1 9 .6 1 3 7 6 .8 3 7 5 5 2 5 0 .7 2 3 6 5R ep 2 A 5 7 5 5 5 .1 9 + 1 3 .8 5 + 2 9 .1 0 7 4 .0 8 + 0 .7 8 + 2 0 .0 5 3 6 7 .2 5 2 2 2 1 6 .9 4 5 4R ep 2 B 5 5 0 5 4 .9 8 + 1 3 .3 6 + 2 6 .8 2 7 4 .0 7 + 0 .7 6 + 1 9 .8 0 3 8 4 .9 4 4 3 2 6 6 .0 9 5 9A v erag e R ep 2 5 6 2 .5 5 5 .0 9 1 3 .6 1 2 7 .9 6 7 4 .0 8 0 .7 7 1 9 .9 3 3 7 6 .0 9 8 2 5 2 4 1 .5 2 0 6 5R ep 3 A 6 5 0 5 6 .4 0 + 1 2 .4 4 + 2 7 .2 6 7 5 .7 3 + 0 .7 9 + 2 0 .0 6 3 7 1 .8 4 0 9 1 9 3 .0 8 4R ep 3 B 6 7 5 5 4 .8 8 + 1 3 .8 4 + 3 0 .1 7 7 5 .6 3 + 0 .8 1 + 1 9 .7 4 3 7 3 .7 7 8 4 2 1 8 .3 2 2 1A v erag e R ep 3 6 6 2 .5 5 5 .6 4 1 3 .1 4 2 8 .7 1 5 7 5 .6 8 0 .8 1 9 .9 3 7 2 .8 0 9 6 5 2 0 5 .7 0 3 0 5
76
Appendix C: Physical Attributes of Bread Loaves

Appendix D: Example of QDA Scorecard Color of outside Light Dark Uniformity/unevenness of outside Uneven Even Porosity of inside Airy Dense Chewiness of inside Fluffy Firm Toughness of outside Soft Hard Yeasty Less More Sourness Less More Flavor Bland Strong
77

Appendix E: Definitions and Spectrum of Sensory Attributes for Bread Term Definition Color of outside Degree of darkness (from baking or type of dough) of the
crust on side of bread sample (inside bread pan portion) Dark = dark brown coloring Light = light golden coloring
Uniformity of outside Degree of evenness of color of crust on side of bread sample Even = consistent coloring Uneven = speckled, blotchy appearance
Porosity of inside Size of air cells/air pockets inside of bread Dense = small sized air cells Airy = large sized air cells
Chewiness of inside Degree of density of inside of bread Firm = holds shape when force applied to bread Fluffy = squishes down easily when force applied to bread
Toughness of outside Degree of toughness of outside of bread Soft = flexible, stays together even when force applied Hard = crusty, breaks off when force applied
Yeasty Degree of fermented yeast smell More = strong yeast scent, taste Less = little to no yeast scent, taste
Sourness Degree of tanginess, lingering aftertaste More = sour like sourdough bread, has aftertaste Less = no sour flavor, bland
Flavor Degree of flavor when sample is tasted Strong = intense flavor Bland = less flavor
78

Appendix F: Standards (Products) Used for Training Sensory Panel Term Standard or Product Color of outside Light: sourdough rolls
Dark: rye bread Uniformity of outside Uneven: Marbled cake
Even: Commercial sliced white bread Porosity of inside Airy: Commercial sliced white bread
Dense: Angel food cake Chewiness of inside Fluffy: Commercial sliced white bread
Firm: Stone-ground whole wheat bread Toughness of outside Soft: Hawaiian bread
Hard: Crusty French baguette Yeasty Less: Commercial sliced white bread
More: Rising bread, yeast fermented in water Sourness Less: Commercial sliced white bread
More: Sourdough bread Flavor Bland: Commercial sliced white bread
Strong: Rye bread
79

VITA
Erin M. Danielson was raised in Clifton, Virginia by her parents Ralph and
Jackie. She has one brother, Jon. She graduated from Centreville High School in 2000
and began her undergraduate studies at Virginia Tech that fall. She graduated cum laude
in May of 2004 with a B.S. in Human Nutrition, Foods and Exercise. Upon completion
of her undergraduate studies, she made the decision to pursue her Master’s degree right
away. She continued her education at Virginia Tech to earn a M.S. in Human Nutrition,
Foods and Exercise, focusing on Foods. She hopes to pursue a career in the food industry
before considering any more school.
80