addis ababa university college of development …
TRANSCRIPT

ADDIS ABABA UNIVERSITY
COLLEGE OF DEVELOPMENT STUDIES
CENTER FOR FOOD SECURITY STUDIES
AGRICULTURAL TECHNOLOGY ADOPTION, COMMERCIALIZATION AND FOOD
SECURITYLINKAGE: MICRO EVIDENCE FROM BORICHA WEREDA, SIDAMA
ZONESNNPR ETHIOPIA
BY
TAGEL ALEMU TAFESE
JUNE 2018
ADDIS ABABA, ETHIOPIA

i
ADDIS ABABA UNIVERSITY
COLLEGE OF DEVELOPMENT STUDIES
CENTER FOR FOOD SECURITY STUDIES
AGRICULTURAL TECHNOLOGY ADOPTION, COMMERCIALIZATION AND FOOD
SECURITY LINKAGE: MICRO EVIDENCE FROM BORICHA WEREDA, SIDAMA ZONE
SNNPR ETHIOPIA
A THSIS SUBMITTED TO COLLEGE OF DEVELOPMENT STUDIES, CENTER FOR
FOOD SECURITY IN PARTIAL FULFILLMENT OF THE REQUIREMENTS FOR THE
DEGREE OFMASTER OF SCIENCE IN FOOD SECURITY AND DEVELOPMENT
STUDIES
BY
TAGEL ALEMU TAFESE
ADVISOR: SOLOMON TSEHAY (PHD)
JUNE 2018
ADDIS ABABA, ETHIOPIA

ii
Addis Ababa University
College of Development Studies
Center for Food Security Studies
As members of the examining board of the final MSc open defence, we certify that we have read
and evaluated the thesis prepared by TagelAlemu, titled “Agricultural Technology Adoption,
Commercialization and Food Security Linkage: Micro Evidence from BorichaWereda, Sidama
Zone Ethiopia” and recommend that it to be acceptedas fulfilling the thesis requirement for the
degree of Masters of Science in Food Security and Development Studies.
__________________ _______________ ________________
Name of Chairman Signature Date
__________________ _______________ ________________
Name of External Examiner Signature Date
__________________ _______________ ________________
Name of Internal Examiner Signature Date
__________________ _______________ ________________
Name of Advisor Signature Date
__________________ _______________ ________________
Name of the Student Signature Date

iii
DEDICATION
I dedicate this thesis to my beloved wife, Salem Abera. It’s after I met her that good things began
to happen in my life. She deserves my appreciations for her encouragement.

iv
STATEMENT OF THE AUTHOR
First, I declare that this thesis is my work and that all sources of materials used for this thesis
have been duly acknowledged. This thesis has been submitted in partial fulfillment of
therequirements for an advanced MSc degree at the Addis Ababa University, and is deposited at
theUniversity Library to be made available to borrowers under rules of the Library. I
solemnlydeclare that this thesis is not submitted to any other institution anywhere for the award
of anyacademic degree, diploma, or certificate.
Brief quotations from this thesis are allowable without special permission provided that accurate
acknowledgement of source is made. Requests for permission for extended quotation from or
reproduction of this manuscript in whole or in part may be granted by the Head of College of
Development Studies or the Dean of the School of Graduate Studies when in his or her judgment
the proposed use of the material is in the interests of scholarship. In all other instances, however,
permission must be obtained from the author.
Name: TagelAlemuTefese Signature:______________________
Place: Addis Ababa University, Addis Ababa
Date of Submission:____________________

v
ACKNOWLEDGEMENT
First and for most, my special gratitude goes to my advisor Dr. Solomon Tsehay. He inspired the
research idea, helped me to be a man of vision and hard worker, his commitment at each stage on
the thesis and his comments and suggestions were eye opening. Because of him now research has
become an interesting activity in my carrier.
Secondly, I also would like to thank my beloved wifeSalem Abera. Having you in my life is not
regret after all. Thank you for standing with me. And also I would like to thankoffice
ofBorichaWereda Agriculture and Natural Resource Development, and associated kebeles, for
their cooperation and willingness in providing the necessary information. And also, I like to
thank Dr. Abebe Haile, AtoAlazarKirubel, AtoFikaduAlemayehu, AtoEndale, PastorAbebe,
Pastor Mengesha and others, for their invaluable support in all aspect of my life not to mention in
my study.
Most of all, I thank the Lord Jesus Christ for his unfailing love. It is the grace, mercy, charity,
forgiveness, help and kindness of the Lord Jesus Christ that made me still alive, achieve this
success and get the strength to go through all the difficult times.
God bless you all.

vi
Table of Contents
List of Figures viii
List of Tables ix
List of Annex x
Abstract .................................................................................................................................................... xi
1. INTRODUCTION ............................................................................................................................ 1
1.1. Back ground .................................................................................................................................. 1
1.2. Statement of the Problem .............................................................................................................. 2
1.3. Objectives of the Study ................................................................................................................. 4
1.4. Research Questions ....................................................................................................................... 4
1.5. Significance of the Study .............................................................................................................. 5
1.6. Scope and Limitation of the Study ................................................................................................ 5
1.7. Organization of the Study ............................................................................................................. 5
2. REVIEW OF RELATED LITERATURES ...................................................................................... 6
2.1. Review on agricultural technology adoption ................................................................................ 6
2.2. Adoption of technologies to ensure food security ....................................................................... 11
2.3. Review on Agricultural Commercialization ............................................................................... 13
2.4. Review of Food Security............................................................................................................. 17
2.5. Conceptual Framework of the Study .......................................................................................... 20
3. DESCRIPTION OF THE STUDY AREA AND THE RESEARCH METHODS ......................... 21
3.1. Description of the study area ...................................................................................................... 21
3.2. Research design, data sources and process ................................................................................. 25
3.3. Data types and sources ................................................................................................................ 25
3.4. Sampling technique ..................................................................................................................... 25
3.5. Tools of data collection ............................................................................................................... 26
3.6. Techniques of data analysis ........................................................................................................ 26
4. RESULT AND DISCUSSION ....................................................................................................... 36
4.5. Descriptive results ....................................................................................................................... 36
4.6. Econometrics result ..................................................................................................................... 43
5. CONCLUSION AND RECOMMENDATION .............................................................................. 57
5.5. Summary and conclusion ............................................................................................................ 57
5.6. Recommendations ....................................................................................................................... 61
Reference .................................................................................................................................................... 63
APPENDICES ............................................................................................................................................ 69
vii
Abbreviations and Acronyms
ADOCOM
ADOPT
ATA
Adoption and Commercialization
Adoption Only
Agricultural Transformation Agency
BANRD Bureau of Agriculture and Natural Resource Development
CSA Central Statistics Agency
DAs
FAO
FIES
Development Agents
Food And Agriculture Organization
Food Insecurity Experience Scale
GDP Gross Domestic Product
GHI Global Hunger Index
HCI Household Commercialization Index
HDDS
HH
Household Dietary Diversity Score
Household Head
IFAD International Fund for Agricultural Development
IFPRI International Food Policy Research Institute
MoADR Ministry of Agriculture and Rural Development
MoFED Ministry of Finance and Economic Development
NGO Non-governmental Organization
SNNPR Southern Nation Nationality People Region
UNICEF United Nations Children‟s Emergency Fund
USAID United States Agency for International Development
WFP World Food Program
WFS World Food Summit
WHO World Health Organization

viii
List of Figures
Figure1. Conceptual framework of the study 20
Figure 2: Map of study area in Sidama Zone 24
Figure 3: chi-square distribution of household dietary diversity and food insecurity experience in terms of
adoption status 42
Figure 4: Propensity score distribution and common support for propensity score estimation of adopters
and non-adopters 46

ix
List of Tables
Table 1: proportionate sample size of households in Borichawereda 26
Table 2: Distribution of food group in their level of dietary diversity 28
Table 3.A summary of explanatory variables, their measurement and expected sign. 35
Table 4: T-test distribution of variables by technology adoption status 39
Table 5: Chi-square distribution of variables by technology adoption status 41
Table 6: Factors affecting technology adoption 43
Table 7: Impact of adoption over productivity, commercialization, HDDS and food insecurity 46
Table 8: Distribution table for household dietary diversity score (HDDS) 47
Table 9: Distribution table for household food insecurity experience (FIES) 49
Table 10: factors affecting dynamics of adoption and commercialization 52
Table 11: Determinants of commercialization level of households 54

x
List of Appendices
Appendix 1: Survey questionnaire 69
Appendix 2: Key informant interview 74
Appendix 3: Adoption status of households 75
Appendix 4: chisquare distribution of agricultural technology types in the wereda 75
Appendix 5: Cash crops and Food crops grown in the wereda 75
Appendix 6: Chisquare distribution of dietary groups in terms of adoption 76
Appendix 7: Chisquare distribution of food insecurity experience in terms of adoption 76
Appendix 8: Chisquare distribution of household dietary diversity score in terms of adoption 77
Appendix 9: Likelihood ratio of food insecurity experience for ordered logistic model 78
Appendix 10: Multicollinearity of food insecurity experience for ordered logistic model 78
Appendix 11: Likelihood ratio of dietary diversity for ordered logistic regression model 79
Appendix 12: Multicollinearity of dietary diversity score for ordered logistic model 79
Appendix 13: Likelihood ration of commercialization for tobit model 80
Appendix 14: Multicollinearity of commercialization for tobit model 81
Appendix 15: Table of conversion factor to estimate TLU 81
xi
Agricultural Technology Adoption, Commercialization and Food Security Linkage: Micro
Evidence from BorichaWereda, Sidama Zone SNNPR Ethiopia
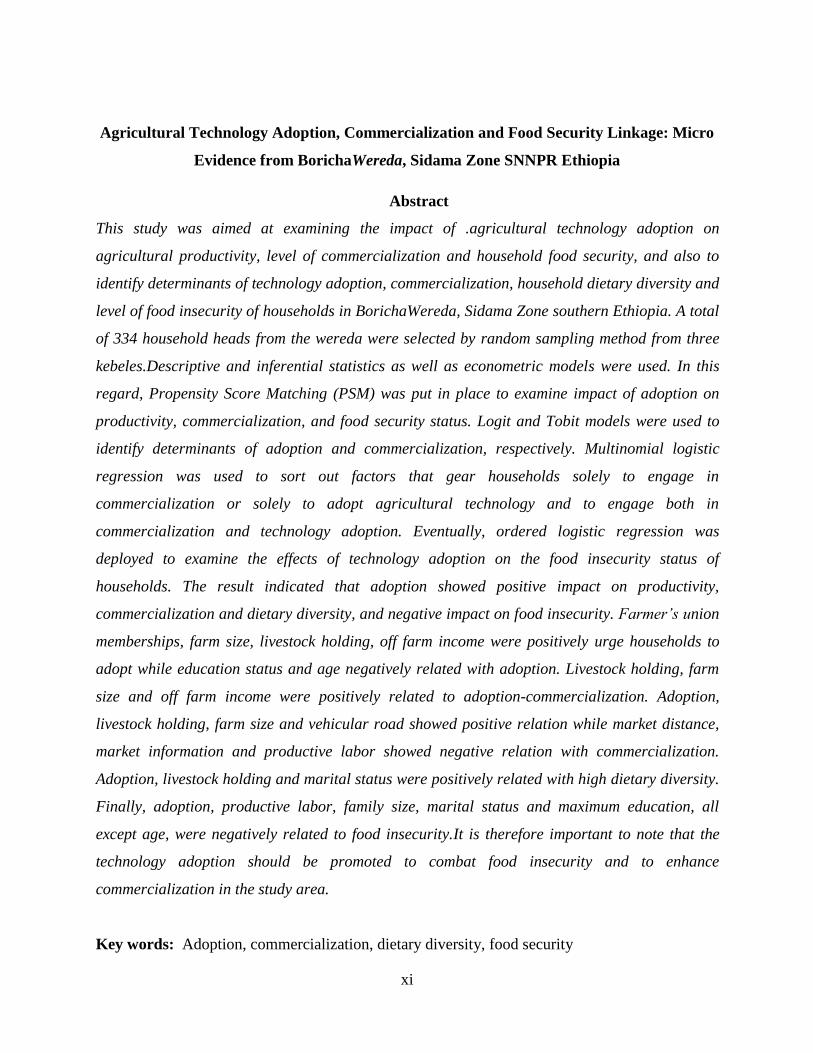
Abstract
This study was aimed at examining the impact of .agricultural technology adoption on
agricultural productivity, level of commercialization and household food security, and also to
identify determinants of technology adoption, commercialization, household dietary diversity and
level of food insecurity of households in BorichaWereda, Sidama Zone southern Ethiopia. A total
of 334 household heads from the wereda were selected by random sampling method from three
kebeles.Descriptive and inferential statistics as well as econometric models were used. In this
regard, Propensity Score Matching (PSM) was put in place to examine impact of adoption on
productivity, commercialization, and food security status. Logit and Tobit models were used to
identify determinants of adoption and commercialization, respectively. Multinomial logistic
regression was used to sort out factors that gear households solely to engage in
commercialization or solely to adopt agricultural technology and to engage both in
commercialization and technology adoption. Eventually, ordered logistic regression was
deployed to examine the effects of technology adoption on the food insecurity status of
households. The result indicated that adoption showed positive impact on productivity,
commercialization and dietary diversity, and negative impact on food insecurity. Farmer’s union
memberships, farm size, livestock holding, off farm income were positively urge households to
adopt while education status and age negatively related with adoption. Livestock holding, farm
size and off farm income were positively related to adoption-commercialization. Adoption,
livestock holding, farm size and vehicular road showed positive relation while market distance,
market information and productive labor showed negative relation with commercialization.
Adoption, livestock holding and marital status were positively related with high dietary diversity.
Finally, adoption, productive labor, family size, marital status and maximum education, all
except age, were negatively related to food insecurity.It is therefore important to note that the
technology adoption should be promoted to combat food insecurity and to enhance
commercialization in the study area.
Key words: Adoption, commercialization, dietary diversity, food security

1
1. INTRODUCTION
1.1. Background
Based on FAO and its associate report number of people in the World affected by severe food
insecurity in the year 2016 is reported to be 688.5 (±27.6) million. The majority of people who
are suffering from severe food insecurity live in Africa put to be 333.2 (±8.6) million. Among
others, the number of food insecure and hungry people living in sub-Saharan Africa is reported
to be 306.7 (±8.3) million (FAO, IFAD, UNICEF, WFP and WHO, 2017).
Based on the above figure around half of severely food insecure people live in Sub-Saharan
Africa. Sub-Saharan Africa region in general is known for its abject poverty, low level of
agricultural productivity, low level of social and economic development, and lack of adequate
infrastructure that promote overall change in development. The majority of the region`s
population, 62.6%, live in rural areas. Of these, more than 70% of the poor depend on
agriculture as their sole means of livelihood (IFAD, 2012). This discloses the incapacitate
condition of agriculture sector in resolving long pertained poverty as a whole and the chronic
challenge of severe food insecurity in particular within the respected region.
And more specifically, being in Sub-Saharan African region, Ethiopian economy is also
dominated by agricultural sector accounting 45% of the national GDP. The economic growth is
often guided by the performance of the agricultural sector, which continues to be the most
dominant aspect of the country‟s economy, accounting for 85% of employment and nearly 90%
of foreign exports (MoADR, 2010).
According to Agricultural Transformation Agency (ATA) (2014) and Ministry of Agriculture
and Rural Development‟s report (MoARD) (2010).the majority of the agriculture sector is made
up of smallholder farmers who own less than two hectares of land productivity and production
are strongly influenced by climatic variability, land degradation, limited household assets, low
levels of farm technologies, lack of employment opportunities, and population pressure.
As a result of the above challenges, the agriculture sector has been short-handed to radically
avoided long stayed country‟s problem of poverty. This is disclosed by many empirical studies
and reports of the concerned institutes. According to Food and Agriculture Organization‟s report

2
(2015) about 52% of the rural population and 36% of the urban population consume under the
minimum recommended daily intake of 2100 calorie per person per day. According to global
hunger index (GHI) report of 2016 reported by International Food Policy Research Institute
(IFPRI) (2017), Ethiopia was ranked 107th
, its hunger index being 33.4%.
Furthermore, empirical studies done in different part of the country associate the current food
insecurity situation with attribute like technology adoption, education status of the household
head, family size, land size, livestock holding, off farm income, and so on (Ramakrishna and
Demeke, 2002; Felekeet al, 2003 and Kidaneet al, 2005). And also, a study by Solomon et al
(2011)and Marteyet al (2012) strengthen the fact that agricultural technology bring about surplus
production as a result it initiate household market participation, and improves household‟s
welfare, particularly food security status.
As to the interest of this research and reports in this regard, in addition to technology adoption
that enhance farm land productivity, the depth and intensity of food insecurity in Ethiopia is
high, as a result of being influenced by poor functioning of marketing systems and other
household and socioeconomic factors (Justus et al, 2015; Ahmed, 2017; Ismael et al, 2017).
Based on the above empirical reports, adopting yield enhancing farm inputs is likely to increase
productivity, as a result it tend to decrease the probability of being food insecure.
This paper focuses on the contribution of agricultural technology adoption and commercializing
of agricultural products as alternative way of improving rural household‟s food security status.
1.2. Statement of the Problem
The Ethiopian economy is heavily depending on small holder farm agriculture. The contribution
of the agricultural sector to gross domestic product (GDP) is the largest( 41%); comprises 85%
of the employment opportunity, generate 90% of the export earnings, and provides 70% of the
country‟s raw material demand of the large and medium scale industries (MoFED, 2012).
Poverty and food insecurity are quite pervasive in Ethiopia particularly in the rural areas. For
instance, according to joint publication report of Ethiopia Central Statistical Agency (CSA) and
the World Food Program (WFP) on Comprehensive Food Security and Vulnerability Analysis
(2014), nationally, 40% of households are food energy deficient, using the threshold of 2,550

3
kilocalories per adult equivalent per day. Furthermore, according to FAO (2015), about 52% of
the rural population and 36% of the urban population consume under the minimum
recommended daily intake of 2100 calorie per person per day. To combat such problems of the
nation, prime attention has been given to the agricultural sector. This ultimately necessitates
adopting technology that ameliorates agricultural productivity.
The role of agriculture is very important in southern regional states where 27% of the total
households is food energy deficient in terms of calorie consumption and has a very low dietary
diversity.This is evidenced by the fact that 47% of SNNPR rural households consume less than
three food groups within 7 days. In this regard, Zelekeet al (2016) revealed in Borichawereda
that the 72.2% of respondents found to be food insecure in terms of food energy consumption.
The research has further enunciated that lack of integrated farming system and low level of
agricultural inputs usage have been considered as the reason for such high precedence of food
insecurity.
Cognizant to the importance of the agricultural sector, different agriculture yield enhancing
measures have been adopted. The main intention of such initiations is to increase the
productivity of farmers thereby increasing their level of commercialization that eventually
improves the nutritional status of households. There are studies that have been conducted so far
on the issues of agricultural technology adoption in rural Ethiopia (Assefa and Gezahegn, 201;
Degnet and Mekibib, 2013; Hailu, 2008; Nega and Senders, 2006 and Solomon et al,2011).
Moreover, impact of technology adoption in enhancing productivity and commercialization has
been reported by many empirical studies. The finding of Solomon et al (2011) also shows that
the average treatment of improved chickpea adoption contributed to farmers‟ chickpea sold
ranges from 16 to 20 percent. Similarly, Marteyet al (2012) in Ghana reported the extent of
maize and Cassava sold by smallholders are 53 and 72 percent, respectively, whereas the total
agricultural commercialization with respect to these two crops is 66 percent. A study by Tigist
(2017) shows the use of high-yielding varieties increases marketable surplus production by 7.4
percent per year, whereas inorganic fertilizer use increases it by 2.3 percent. The multiple
adoption of the two technologies jointly increase the surplus by 6 percent.

4
But no research has been carried out that linked the technology adoption, commercialization and
food security in Ethiopia in general and in Burchaworeda in particular. Therefore, this researcher
will investigate food security situation of the woreda using HDDS to assess their dietary habit as
food security measurement tool rather than calorie consumption. Therefore, the study will try to
find out the inter-relationship between agricultural technology adoption, commercialization and
household dietary habit.
1.3. Objectives of the Study
1.3.1. General objective
The overall objective of the study is to analyze agricultural technology adoption,
commercialization and food security linkage in BorichaWereda, Sidama Zone.
1.3.2. Specific objectives
The study pursued the following specific objectives:
To identify impact of agricultural technology adoption on agricultural
productivity, level of commercialization and household food security status;
To examine determinants of technology adoption, commercialization and both
adoption with commercialization at the same time, household dietary diversity and level
of food insecurity
1.4. Research Questions
The following pertinent research questions are addressed in this study.
Does agricultural technology adoption positively influences agricultural
productivity, commercialization and food security situation of farming households?
What are those demographic and socioeconomic factors that play determining role
in adoption of agricultural technology, commercialization and food security statusamong
farming households?

5
1.5. Significance of the Study
The formulation of this paper can, primarily, be used for academic exercise. The study will give
insight and serve as a document for researchers and students interested in the topic to stimulate
further study in the area. Analysis of inter-linkage among technology adoption,
commercialization and food security can help public policy makers, service providers like
extension workers, and local and international NGOs, and community groups to assess the need
for assistance, judge the effectiveness of existing programs designed to help such households.
Accordingly, the result of the study carried out on households of Borichawereda will support
development practitioners, policy makers and the authorities of the region with a view to
comprehend the problem and design plausible intervention course of action to bring about food
security in the region.
1.6. Scope and Limitation of the Study
The study was conducted to examine inter-linkage among agricultural technology adoption,
commercialization and food security in Borichawereda, Sidama Zone. The study covered only
Borichawereda andthree kebeles among 39 rural kebeles. Moreover, the study dealt with a
limited number of households; appliedhousehold dietary diversity score (HDDS) and Food
insecurity experience scale (FIES) to evaluate food security status of farmers, and dealt with the
kind of technology adopted in the weredawhich are improved seeds and fertilizer. The scope of
this study was limited by time, budget and other resource limitations. Even if the study is
restricted in terms of its coverage, its findings can be used as a springboard for more detailed and
area specific studies.
1.7. Organization of the Study
This report is organized into five chapters. Chapter one introduces and sets out the background
information, statement of the problem, research objectives, research questions, significance,
scope and limitation and organizationof the study; chapter two talks about review of related
literature. Chapter three tries to introduce description of the study area and research methods
which discusses location, demographic and socio-economic profile of the study area; research
design and approach; types and sources of data; sampling techniques and data collection tools;
and techniques of data collection. Chapter four deals with result reporting and the related
discussions.Chapter fivesummarize the finding and suggest few recommendation.

6
2. REVIEW OF RELATED LITERATURES
2.1. Review on Agricultural Technology Adoption
2.1.1. Basic concepts of technology adoption
The concept of technology adoption could be better conceptualized through understanding the
difference between technology adoption and diffusion, which are highly interrelated but distinct
concepts. Technology adoption is measured at one point in time while technology diffusion is the
spread of a new technology across population over time. While explaining the distinction
between these concepts, Rogers (1962) argued that, technology (synonymously used with the
term innovation) is often accompanied by two processes, namely the processes of adoption and
diffusion. Technology is described as an idea, practice, or object that is perceived as new by an
individual or groups of a society. Technology adoption is the use or non-use of a new or
improved technology by an individual or farmer at a given period of time. On the other hand,
technology diffusion is defined as “the process by which a technology is communicated through
certain channels over time among the members of social systems”. It signifies a group of
phenomena, which suggests how technology spreads among users. It takes place at the individual
level and is the mental process that starts when an individual first hears about the technology and
ends to its final adoption or rejection.
2.1.1.1.Components of technology adoption
Rogers (1962) summarized the above definition of technology diffusion using the following four
core elements: The technology that represents the new idea, practice, or object being defused,
Communication channels which represent the way information about the new technology flows
from change agents‟ suppliers (extension, technology suppliers) to final users or farmer, The
time period over which a social system adopts a technology and the social system. Overall, the
technology diffusion process essentially encompasses the adoption process of several individuals
or farmers over time.
Further, another study by Rogers (1995), defined the rate of adoption (speed of adoption) of a
given technology. It is the relative speed with which farmers adopt technology; in this definition
consideration is given to the element of „time‟ in adoption of a given technology to the farmers.

7
2.1.1.2.Stages of technology adoption
Rogers (1962) developed a technology adoption model, generalized the use of it in his book
entitled as “Diffusion of Innovations”. The process of adoption over time is typically illustrated
as a classical normal distribution or bell-curve and use the mean and standard deviation to divide
the normal adopter distribution categories. The model indicates that the first group of people to
use a new product or technology is called innovators, followed by early adopters. Next come the
early and late majority, and the last group to eventually adopt a product are called laggards.
While explaining each of the categories the study by Rogers (1962) defined as:
Innovators: These are the first individuals to adopt a given technology and hence
they are willing to take risks, youngest in age, have the highest social class, have great
financial liquidity, are very social and have closest contact with scientific sources and
interacting with other innovators.
Early adopters: These are those groups of individuals who are typically younger
in age, have a higher social status, have more financial liquidity, advanced education, and
are more socially forward than late adopters, which means more discrete in adoption
choices than innovators.
Early majority: Individuals in this category adopt technology after a varying
degree of time. This time of adoption is significantly longer than the innovators and early
adopters. Early majority tend to be slower in the adoption process, have above average
social status, contact with early adopters, and seldom hold positions of opinion leadership
in a system.
Late majority: Individuals in this category will adopt technology after the average
member of the society. These individuals approach technology with a high degree of
skepticism, and after the majority of society has adopted the technology. Late majority is
typically skeptical about technology, have below average social status, very little
financial lucidity, in contact with others in late majority and the early majority, very little
opinion leadership.
Laggards: Individuals in this category are the last to adopt a technology. Unlike
some of the previous categories, individuals in this category show little to no opinion

8
leadership. These individuals typically have an aversion to change-agents and tend to be
advanced in age. Laggards typically tend to be focused on “traditions”, likely to have
lower social status, lowest financial fluidity, older of all other adopters, in contact with
only family and close friends.
2.1.2. Factors affecting technology adoption
From the extensive review of the literature on technology adoption in developing countries, by
Federet al (1985), the various factors that influence technology adoption can be grouped into the
following three broad categories: factors related to the characteristics of producers; factors
related to the characteristics and relative performance of the technology and institutional factors.
The factors related to the characteristics of producers include: education level, experience in the
activity, age, sex, household size, level of wealth, farm size, labor availability, risk aversion and
capacity to bear risk, etc. The factors related to the characteristics and performance of the
technology include food and economic functions of the product, the perception by individuals of
the characteristics, complexity and performance of the innovation or technology, its availability
and that of complementary inputs, the relative profitability of its adoption compared to substitute
technologies, the period of recovery of investment, the susceptibility of the technology to
environmental hazards, etc.
Similarly, a study by Meinzen-Dick et al (2004) identified assets, vulnerability, and institutions
as the main factors affecting technology adoption. Assets deal with whether farmers have the
requisite physical (material) and abstract possessions (e.g. education) essential for technology
adoption. Lack of assets will limit technology adoption and it is recommended that developing
countries should promote technologies with low asset requirements as they are likely to have
higher adoption rates among poor farmers. Vulnerability factors deal with the impact of
technologies on the level of exposure of farmers to economic, biophysical and social risks.
Institutional factors deal with the extent or degree to which institutions impact on technology
adoption. Institutions include all the services to agricultural development, such as finance,
insurance and information dissemination. They also include facilities and mechanisms that
enhance farmers‟ access to productive inputs and product markets. Institutions also include the
embedded norms, behaviors and practices in society.

9
The institutional factors include availability of credit, the availability and quality of information
on the technologies, accessibility of markets for products and inputs factors, the land tenure
system, and the availability of adequate infrastructure (Danded et al., 2012). These explanatory
indicators vary from study to study based on their contextual applicability and specific local
condition.
The determinants of agricultural technology from the traditional, social, physical, and
economicperspectives are discussed below. The factors are: institutional factor,
technological,economics, financial, physical, human, cultural and householdspecific factors.The
degree to which a potential adopter can try something out on a small scale before adopting it
completely is a major determinant of technology adoption. Farmers who perceive the technology
as being consistent with their needs andcompatible to their environment are likely to adopt such
since they find it as a positive investment. Farmers‟ perception about the performance of the
technologies significantly influences their decision to adopt them (Doss, 2003).
Off-farm income is reported to act as a substitute for borrowed capital in rural economies where
credit markets are either missing or dysfunctional (Yaronet al, 2000).The study done by
Makokha et al (2001) on determinants of fertilizer and manure in maize production
Kiambucounty, Kenya reported high cost of labor and other inputs, unavailability of demanded
packages and untimely delivery as the main constraints to fertilizer adoption. Off farm income
has been shown to have a positive impact on technology adoption. This is because off-farm
income acts as an important strategy for overcoming credit constraints faced by the rural
households in many developing countries (Ahmed, 2004). A key determinant of the adoption of a
new technology is the net gain to the farmer from adoption, inclusive of all costs of using the
new technology (Foster, 2010). High cost of agricultural technology has been reported hindrance
to adoption agricultural technology.
Physical factors such as the farm size play a critical role in adoption process of a new technology
(Mwangi and Kariuki, 2015). Many studies have reported a positive relation between farm size
and adoption of agricultural technology. Farmers with large farm size are likely to adopt a new
technology as they can afford to devote part of their land to try new technology unlike those with
less farm size.

10
Farmers are consumers of the products of agricultural research and their subjective preferences
for characteristics ofnew agricultural technologies affect their adoption decisions (Adesina and
Baidu, 1995).Farmers are also important as sources of technology informationand agents of
technology transfer. The risk preferences of farmersare also important in influencing the
technology adoption decision,especially if capital-intensive technology costs are irreversible.
Farmers need to know the existence of technology, its beneficial, and its usage for them to adopt
it. Acquisition of information about a new technology is another factor that determines adoption
of technology (Karki and Siegfried, 2004). Access to extension services helps to spread
information about new agricultural technology leading to adoption. Farmers are usually informed
about the existence as well as the effective use and benefit of new technology through extension
agents. In fact, the influence of extension agents can counter balance the negative effect of lack
of years of formal education in the overall decision to adopt some technologies (Kuuma, 2005).
Belonging to a social group enhances social capital allowing trust, idea and information
exchange. Farmers within a social group learn the benefits and usage of a new technology from
one another. Uaiene et al. (2011) suggests that social network effects are important for individual
decisions, and that, in the particular context of agricultural innovations, farmers share
information and learn from each other.
Access to credit is found to be very important factor influencing the adoption of agricultural
technology by the smallholders (Lavison, 2013). Credit can facilitate farm households to
purchase the needed agricultural inputs and enhance their capacity to effect long-term. Human
capital of the farmer is assumed to have a significantinfluence on farmers‟ decision to adopt new
technologies (Mwangi and Kariuki, 2015). Most adoption studies have attempted to measure
human capitalinvestment in their farms through the farmer‟s education, age, gender, and
household size. Education of the farmer has been assumed to have apositive influence on
farmers‟ decision to adopt new technology.Education level of a farmer increases his ability to
obtain; processand use information relevant to adoption of a new technology.
Other parts of the social science literature emphasize the role of distance and geography in the
adoption of agricultural technologies. In this case, any significant travel costs involved in the
initial learning about a technology and subsequentlyestablishing it might reduce the likelihood of
that technology‟sadoption.
11
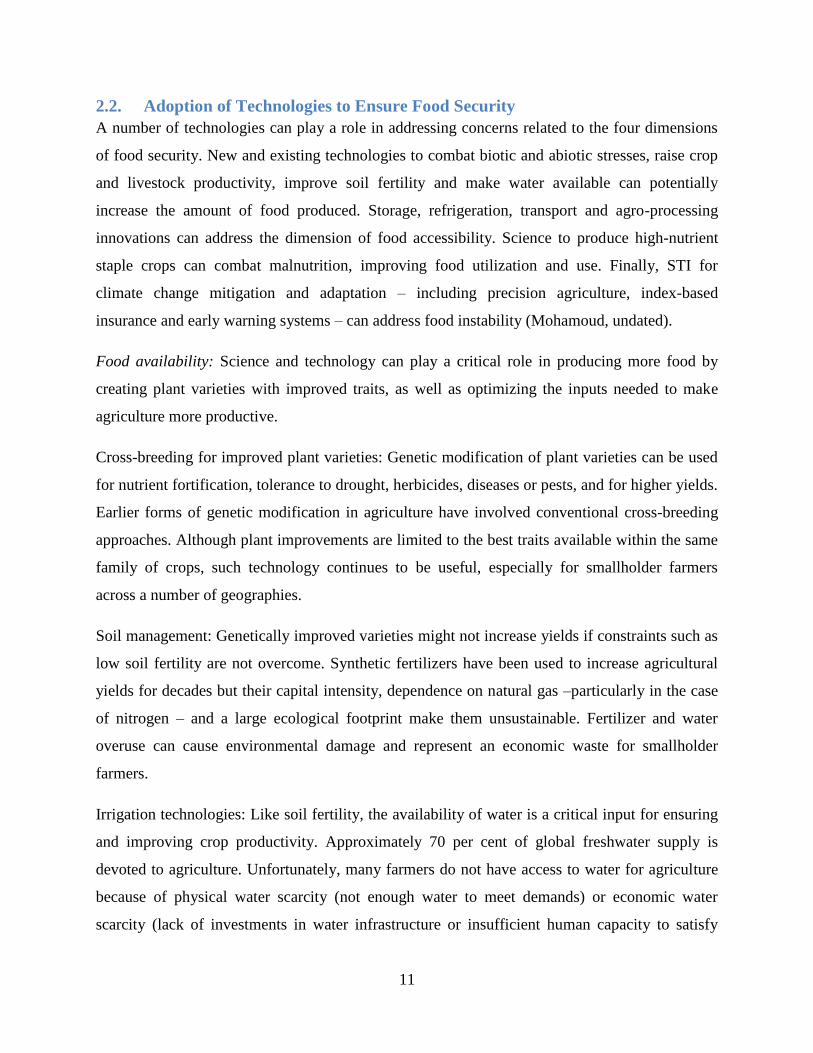
2.2. Adoption of Technologies to Ensure Food Security
A number of technologies can play a role in addressing concerns related to the four dimensions
of food security. New and existing technologies to combat biotic and abiotic stresses, raise crop
and livestock productivity, improve soil fertility and make water available can potentially
increase the amount of food produced. Storage, refrigeration, transport and agro-processing
innovations can address the dimension of food accessibility. Science to produce high-nutrient
staple crops can combat malnutrition, improving food utilization and use. Finally, STI for
climate change mitigation and adaptation – including precision agriculture, index-based
insurance and early warning systems – can address food instability (Mohamoud, undated).
Food availability: Science and technology can play a critical role in producing more food by
creating plant varieties with improved traits, as well as optimizing the inputs needed to make
agriculture more productive.
Cross-breeding for improved plant varieties: Genetic modification of plant varieties can be used
for nutrient fortification, tolerance to drought, herbicides, diseases or pests, and for higher yields.
Earlier forms of genetic modification in agriculture have involved conventional cross-breeding
approaches. Although plant improvements are limited to the best traits available within the same
family of crops, such technology continues to be useful, especially for smallholder farmers
across a number of geographies.
Soil management: Genetically improved varieties might not increase yields if constraints such as
low soil fertility are not overcome. Synthetic fertilizers have been used to increase agricultural
yields for decades but their capital intensity, dependence on natural gas –particularly in the case
of nitrogen – and a large ecological footprint make them unsustainable. Fertilizer and water
overuse can cause environmental damage and represent an economic waste for smallholder
farmers.
Irrigation technologies: Like soil fertility, the availability of water is a critical input for ensuring
and improving crop productivity. Approximately 70 per cent of global freshwater supply is
devoted to agriculture. Unfortunately, many farmers do not have access to water for agriculture
because of physical water scarcity (not enough water to meet demands) or economic water
scarcity (lack of investments in water infrastructure or insufficient human capacity to satisfy

12
water demand), among other factors. In response to such challenges, low-cost and affordable
drills, renewable energy-powered pumps and technologies for desalination and improved water
efficiency can potentially make water more available for food production.
Food access: A key aspect of accessing food is minimizing food losses during production,
storage and transport, and waste of food by retailers and consumers. Such agricultural losses are
attributable to a number of factors, including lack of access to ready markets, adequate storage
facilities, affordable refrigeration and local crop-processing facilities.
Food utilization and use: Science for nutrition. Biofortification – or the breeding of critical
micronutrients and vitamins into staple crops – has emerged as an effective approach to combat
malnutrition, especially in developing countries. To date, the most successful example of vitamin
and micronutrient biofortification is the orange-fleshed sweet potato, developed at the
International Potato Centre.
Food stability: New ways to combat acute and chronic food insecurity. Locally adapted breeding
for drought or heat-tolerant crop varieties, with 40. a focus on underutilized crops, has great
potential to support climate change adaptation in agriculture. In particular, climate change
mitigation and adaptation should focus on information provision and knowledge transfer and
should include social, as well as technical innovations. Many practices, however, deliver both,
and many of the effective adaptation, resilience and mitigation approaches to a changing climate
offer important ecological, agronomic, economic and social co-benefits.
2.2.1. Adoption status of agricultural technologies in Ethiopia
Food insecurity in Ethiopia derives directly from dependence on undiversified livelihoods based
on low-input, low-output rain fed agriculture. Ethiopian farmers do not produce enough food
even in good rainfall years to meet consumption requirements. There is, off course, a trend of
technology adoption, even though, varies factors affect its implementation. A number of studies
examined factors affecting adoption of improved agricultural technologies in crop production.
Most of these studies, however, have tended to have a bias towards measuring the status and
intensity of improved agricultural technologies adoption.

13
The food security and adoption status of agricultural technologies in Ethiopia was generally
hypothesized to be determined by family size, gender of the household head, literacy status,
farming experience, total cultivated land and its allocation to production of staples and cash
crops, irrigation water use, quantity of fertilizer used for crop production, livestock holding in
tropical livestock unite, gross income earned, access to credit, participation in off-farm activities,
distance to major town, nearest road and development station as a proxy for market information
on food and agricultural technologies, transaction cost, and access to government extension
services (Ruel 2002, 2003).
Hailu (2008) demonstrated the impact of improved technology on productivity and found that
low adoption of improved agricultural technologies was attributed to unavailability of
technologies, high cost of required inputs, lack of access to and high interest on credit, and
policies that discourage improved technology adoption such as promotion of state farm.
Assefa and Gezahegn(2010) and Solomon et al (2011) found that age of household head,
educational status, livestock holding, non-farm income, sex, and information access plays
important factors in affecting the decision of farmers to adopt improved technology.
Nega and Senders (2006) showed the positive effect of credit on fertilizer adoption and improved
maize varieties, respectively. Degnet and Mekibib (2013) found that membership to farmer
cooperatives has a strong positive effect on adoption of chemical fertilizer. Yu and Nin-Pratt
(2014) pointed out that extension service, farmer knowledge, farming skills; risk aversion
behavior, household wealth and land fragmentation are important factors in affecting fertilizer
adoption in Ethiopia.
2.3. Review on Agricultural Commercialization
2.3.1. The concept of agricultural commercialization
The welfare gains from market-oriented production arise from specialization that builds on and
creates comparative advantages, potential for large-scale production, and from dynamic
technological, organizational and institutional change effects that arise through the flow of ideas
due to exchange based interactions (Romer 1993, 1994). Commercializing smallholder
agriculture is an indispensable pathway towards economic growth and development for most

14
developing countries relying on the agricultural sector (von Braun 1995; Pingali and Rosegrant
1995; Timmer 1997). In the long-run, subsistence agriculture may not be a viable activity to
ensure sustainable household food security and welfare (Pingali 1997).
Smallholder commercialization also typically leads to an increased diversity of marketed
commodities at a national level and increased specialization at regional and farm levels (Pingali
and Rosegrant 1995; Timmer 1997; Kurosaki 2003). Moreover, commercialization has a linking
power between input and output sides of a market. Demand for modern technologies promotes
the input side of production and facilitates the development and advancement of technological
innovations. In turn, the use of modern technologies can result in higher productivity and
production entering markets.
The concept of agricultural commercialization can be complex, and has contributed to varying
definitions and emphases given in the literature. According to Pingali (1997), agricultural
commercialization is more than marketing agricultural outputs. Pingali argued that agricultural
commercialization is attained when household product choice and input use decisions are made
based on the principles of profit maximization. Moreover, according to von Braun et al. (1994),
commercialization implies increased market transactions to capture the benefits from
specialization. Increased market transactions are more easily attained when there are favorable
policies and institutional arrangements that promote open domestic and international trade
environment and the development of market infrastructure and support services that facilitate
access to existing markets and the opening up of new market opportunities under a secured legal
system.
There is largely a consensus that commercialization has differential impacts on different
socioeconomic groups (wealthy and poor, land owners and landless farm households, women,
and children) under different socio-economic, institutional and policy environments, although the
net impacts are not necessarily or universally positive. However, there are only a few, if any,
who contend the need for commercialization to promote social development and economic
growth. With all the merits and demerits of agricultural commercialization to different clusters of
the society and under different socio-economic and policy situations, this paper tries to
investigate major findings and advancements in literature on this issue. Moreover, it tries to look

15
for potential gaps that warrant further research both in conceptual and methodological aspects
related to agricultural commercialization (Moti et al, 2009).
2.3.2. Determinants of agricultural commercialization
Findings of Martey et al (2012) confirmed assertions in the literature that off-farm income
contributes more to marketed output if off-farm income is reinvested in farm technology.
Consequently, farm outputs falls if non-farm income triggers off-farm diversification. Output
price is an incentive for farm households to supply more output in the market. Assertion in
literature that distance confines rural farmers to perpetual production of low-value and less
perishable commodities, particularly cereals was established. Household heads with higher level
of education are more likely to increase the sales of maize. Education is believed to increase a
household‟s understanding of market dynamics and therefore improve decisions about the
amount of maize sold. Age of the household head is used as a proxy for experience in farming. It
is believed that older household heads have more contacts which allow trading partners to be
discovered at lower cost relative to younger household heads. On the other hand, younger
household heads are more dynamic with regards to adoption of innovations both in terms of
those that enhances productivity and marketing at reduced costs.
According to Kirimi et al (2013) enabling access to affordable production inputs, suitable to
small scale farmers, thus ensures that farmers are not trapped in low productivity–low return
farming activities that lead to food insecurity. The use of productivity enhancing inputs will
improve the ability of smallholder farmers to produce sufficient marketable surplus. Also, it will
be important to strengthen efforts geared toward creating market linkages for the various
agricultural enterprises. Moreover, innovations that enhance households‟ access to land,
education, savings and employment can be instrumental in raising their ability to produce food
and access it from the market, ensuring food security.
Kirui and Njiraini (2013) highlighted determinants of agricultural commercialization (market
participation) by the farm households in Kenya. The study showed that farmer-specific
characteristics (age and gender) farm specific (distance to bank and the number of crop
enterprises grown by the farmer) and capital endowment variables (education level, non-farm as
well as total farm income) influence the commercialization process. Collective action (farmer

16
groups) as well as use of ICT tools (mobile phones) significantly and positively determines
commercialization. The interaction of these two variables with gender show that participation in
collective action as well as use of ICT tools (mobile phones) significantly increases
commercialization of female farmers.
Programs that promote commercialization of smallholder agriculture coupled with improved
infrastructure in terms of roads and market information systems are continuously needed to
facilitate commercialization of farm produce (Justus et al, 2015).
2.3.3. Impacts of agricultural commercialization on food security
Commercialization is often viewed as an avenue to improve household food security due to its
comparative advantages over subsistence production. However, there are arguments for and
against smallholder commercialization as a pathway for ensuring household food security.
Kirimi et al (2013) sought to identify factors that influence household food security for Kenyan
rural smallholder households, and in particular, determine if household commercialization as
defined by household participation in input (fertilizer and seed) and crop output markets affects
food security position. Results showed that household commercialization was associated with a
reduced risk of being in the chronically food poor. Hence, market participation can play a
significant role in reducing food poverty, thus ensuring food security. This suggests that
facilitating the expansion of market participation by smallholder farmers can be critical in
helping households transition out of food poverty.
Malumfashi and Kwara (2013) examined the impact of agricultural commercialization on food
security in Nigeria. The result showed that commercialization enhances food security in the
country.
A study done by Justus et al (2015) showed that commercial oriented farmers have more diverse
diets than non-commercial oriented ones because they can easily purchase other foods to
supplement own production. Commercialization has a robust and positive effect on household
food security. It significantly increases household dietary diversity and reduces the number of
coping strategies adopted during food shortage.

17
Ahmed (2017) investigated the potential impacts of commercialization on smallholder farmers‟
welfare in Bangladesh. The results of the analysis revealed a significant positive relationship
between commercialization and household welfare, with key variables like market access and
internal farming activities positively and significantly contributing to improved household
income and farm outputs. The result further predicted a 16.9% improvement in household
welfare if farmers actively work on commercialized farms with better market access and internal
farm activities.
Ismael et al (2017) investigate the impact of commercialization on rural households‟ food
security in majorcoffee growing districts of south west Ethiopia, Jimma zone. Commercialization
has positive effect on food security level of smallholder farmers. The survey result on the impact
of agricultural commercialization on rural household food security found out that agricultural
commercialization (Crop output market participation) affect the rural households food security in
the study area due to the significance of the crop Commercialization index at 1% probability
level in the Logit model used and it has a positive coefficient of showing a positive relationship
to food security or likelihood of being food secure which is in line with a previous expectation.
This means that the higher the smallholder farmer‟s commercialization, the higher the
probability of being food secure. These specify that those farmers with higher commercialization
index are associated with higher agricultural income suggesting the likely positive effects of
market participation on farmers‟ food purchasing power. Other things being constant, the odds
ratio in favor of being food secure increase by a factor of 1.114 as commercialization increase by
one unit. This result is in agreement with the findings previously.\
2.4. Review of Food Security
During the debates that preceded the World Food Summit (WFS) held in Rome in 1996, it was
established that "There is food security when all people at all times have sufficient physical
andeconomic access to safe and nutritious food to meet their dietary needs including food
preferences, in order to live a healthy and active life"(USAID,2008). Food security is a broad
and complex concept that is determined by agro physical, socio economic and biological factors
(Maxwell and Frankenberger, 1992). According to this definition, food security has three

18
fundamental elements: food availability, food access and food utilization. Household food
insecurity can be distinguished as chronic and transitory.Chronic (permanent) food insecurity is
a continuously inadequate diet resulting from lack of resources to produce or acquire food, while
transitory food insecurity is a temporary decline in the household to access enough food (World
Bank, 1986).
Many empirical studies have been made in Ethiopia. Ramakrishna and Demeke(2002) made an
assessment on food insecurity situation in Ethiopia. Accordingly, cereal production, educational
status of the household head, fertilizer consumption, household size, land size, and livestock
were found to be the most determining factors of household food security. Along with food
availability and entitlement factors, the study suggested that attitudinal variables also influence
food insecurity. A study by Felekeet al. (2003), technology adoption, farming system, farm size,
land quality, household size, off farm income and wealth are considered to be determinants of
food security. Kidaneet al (2005) reported determinants of households‟ food insecurity that farm
land size, ox ownership, fertilizer application, education level of household heads, household
size, and per capita production were found to be significant predictors.
Many food security measurement tools have been developed through time so as to measure food
security status of individuals, households, regions and nations. Among them, HDDS is of recent
formulation in order to measure either individual, households, regions and nations food access
scale to diversified diets. The Household Dietary Diversity Score (HDDS) was developed in
2006 as part of the FANTA II project as an indicator of household food access. Household
dietary diversity can be described as the number of food groups consumed by a household over a
given reference period, and is an important indicator of food security for many reasons. A more
diversified household diet is correlated with caloric and protein adequacy, percentage of protein
from animal sources, and household income. The HDDS indicator provides a glimpse of a
household‟s ability to access food as well as its socioeconomic status (FANTA, 2006).
One of the strength of HDDS is that the standardized questions are simple and can be easily
understood by both enumerators and respondents, and the questions usually take less than 10
minutes per respondent. The standardized questionnaire provided by the 2011 FAO guidelines is
not culture or population specific, so it should be adapted appropriately in adherence with the

19
guidelines before use in a specific context. A drawback of the HDDS is that at the household
level, it does not provide information on the adequacy of consumption for specific nutrients, nor
does it include foods purchased and consumed outside of the home. In addition, the indicator
does not take into account the consumption of fortified foods. Since this indicator uses 24-hour
recall, it does not provide an indication of an individual household‟s habitual diet, but it can
provide an assessment of usual diet at the population level (Hoddinott and Yohannes, 2002).
FAO has been a partner in the development, validation and use of food (in) security scales since
2006 and has had an important role in furthering the research on the Latin American and
Caribbean Food Security Scale (EscalaLatinoamericana y Caribeña de SeguridadAlimentaria -
ELCSA) through financial support for regional conferences on food security measurement and
capacity-building in developing countries regarding validation and use of these tools. Because no
single instrument measures food (in)security in all its dimensions, there has been substantial
research devoted to developing, refining and validating different approaches for measuring the
state of food insecurity. The development of measures of whether people are experiencing food
insecurity because of limited access to food, and if so at what level of severity, constitutes an
important addition to the suite of commonly used food security measures (Ballard, 2013).
Building on the experience of the Latin American scale, the FAO Voices of the Hungry project
(VOH) has developed an experience-based food insecurity scale module called the Food
Insecurity Experience scale (FIES), which is based on a short form of the ELCSA. The FIES will
be used as a common metric for measuring food insecurity at several levels of severity, across
different geographic areas and cultures. Many efforts are going into the search for global
indicators capable of measuring food insecurity in a comparable manner across different parts of
the world, as seen by current discussions on indicators for the post-2015 development agenda.
The FIES has a potentially important role for monitoring food security within this process. It is
particularly well-suited to monitoring systems that meet principles recently identified by the
Committee on World Food Security in the 2012 Global Strategic Framework for Food Security
and Nutrition (Ballard, 2013).

20
2.5. Conceptual Framework of the Study
Both adoption of agricultural technology and commercializationareaffected by factors related to
producer‟s characteristics like sex, age, educational status, household size, off farm income and
labor availability; ownership of assets like farm land, livestock holding and communication tools
such as mobile; and market access and institutional characteristics such as access to credit, union
membership, access to extension service and distance to market (Assefa andGezahegn, 2010;
Solomon et al, 2011;Marteyet al, 2012; and Kirui and Njiraini, 2013). Technology adoption
tends to increase agricultural productivity, and agricultural productivity influence farmers
tendency of market participation or commercialization, and finally, commercialization gives
economic power for the farmers to adopt technology (Nega and Senders, 2006; Hailu, 2008;
Malumfashi and Kwara, 2013; Ahmed, 2017 and Tigist, 2017).Both increament in agricultural
productivity and market participation in turn empower the farming households to buy food as a
result improves dietary diversity (Malumfashi and Kwara, 2013; Magrini and Vigani, 2015 and
Ismael et al, 2017).The details of each schematic description are presented in figure 1.
1.
2.
3.
4.
5.
6.
7.
8.
9.
10.
11.
12.
13.
14.
Figure1. Conceptual framework of the study.
Agricultural
Technology
Adoption
Commercialization
Agricultural
Productivity
Improved
Food
Security
Producer’s characteristics:
o Sex of Household head o Age of Household Head
o Marital status
o Education of Household Head o Household size
o Off farm Income
o Household labor availability
Ownership Assets o Communication tools o Livestock holding in TLU
o Farmland Size
o
Information Access and
Institutional Characteristics
o Farmer Union membership o Visit by extension agents
o Access to market & technology
information
o Adopting neighbor
o Distance to market

21
3. DESCRIPTION OF THE STUDY AREA AND THE RESEARCH METHODS
3.1. Description of the Study Area
3.1.1. Demography and location
The study area, Borichaworeda, is located in Sidama zone about 30 km southwest of Hawassa,
the capital of Southern Nation, Nationality, and People Regional State (SNNPR). Boricha is
located between 6° 52' 10.63'' N longitude and 38° 13' 17.15'' E latitude (Ethio-GIS, 2017). The
Woreda is divided into 39 rural and 4 city kebele administrations. The total population of the
Woreda is 250,260; of which 125,524 are males and 124,736 are females. And also the total
population in terms of household heads is 52, 384; of them 26,102 are male household heads and
26,282are female households(CSA, 2015; BANRD, 2016).
3.1.2. Agriculture in the wereda
The total area of land which is used for cultivation is 32,215 hectare out of which 20,638 hectare
is used for annual crop and 11,577 hectare is utilized for perennial crops. The total area of range
land is 3,231 hectare. The larger portion is conducive for agricultural activities with 77 percent
of plain land topography. The climatic and ecological condition is dry temperate being 78
percent of woreda coverage.
The type of agriculture within the community is mixed-farming, i.e. animal raring and growing
of different crops such as perennial and annual. Perennial plants are coffee, enset, banana,
avocado, pumpkins, etc. Annual crops are maize, barely, sorghum, wheat, haricot bean, broad
bean, potato, sweet potato, teff, etc.“Enset” is the dominant perennial stable food of the
community which serves as food and fodder to animals. It is also drought resistant and has water
retention capacity, especially local variety which is called “medicha”. Among annual crops
maize is a stable crop used for home consumption and cash crop. On average, each individual
farmer owns 0.5ha of cultivable land for production (ERCS, 2008).
Most of the community uses traditional farm tools such as oxen; spade and “Sharika” to plough
their lands. The uses of these farm implements make the community poor in harvesting
production. As a result of this, the productivity and production remains low. In addition to
22
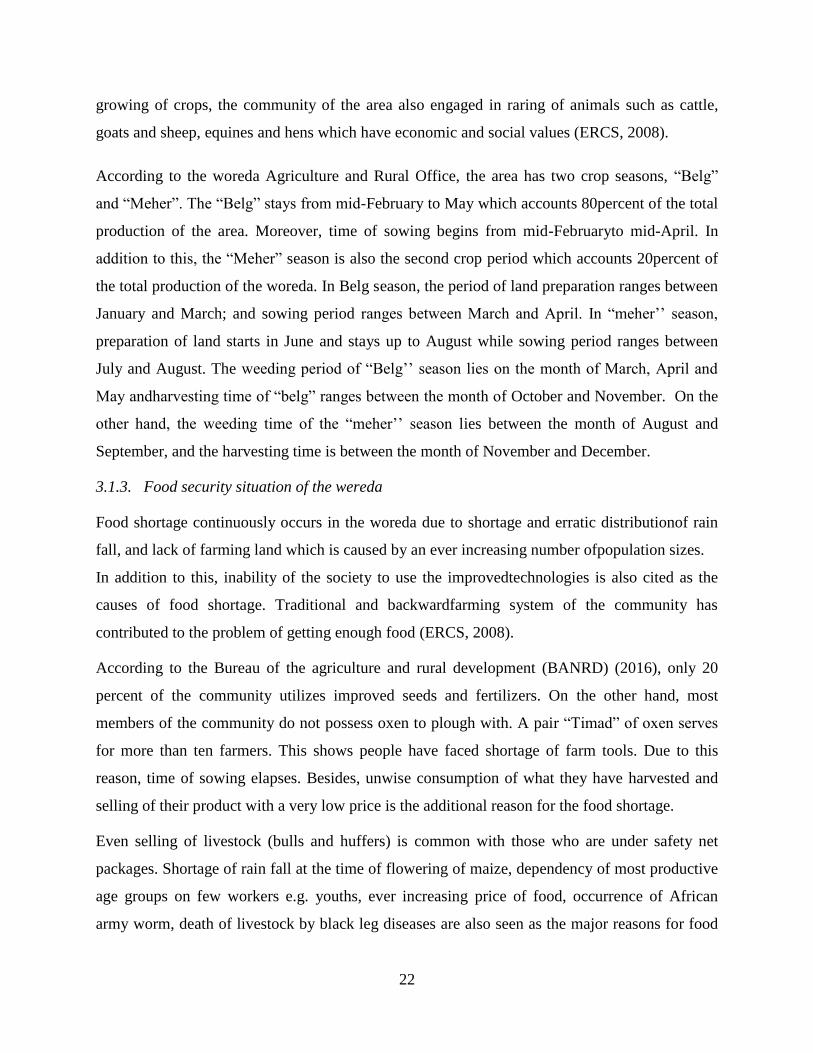
growing of crops, the community of the area also engaged in raring of animals such as cattle,
goats and sheep, equines and hens which have economic and social values (ERCS, 2008).
According to the woreda Agriculture and Rural Office, the area has two crop seasons, “Belg”
and “Meher”. The “Belg” stays from mid-February to May which accounts 80percent of the total
production of the area. Moreover, time of sowing begins from mid-Februaryto mid-April. In
addition to this, the “Meher” season is also the second crop period which accounts 20percent of
the total production of the woreda. In Belg season, the period of land preparation ranges between
January and March; and sowing period ranges between March and April. In “meher‟‟ season,
preparation of land starts in June and stays up to August while sowing period ranges between
July and August. The weeding period of “Belg‟‟ season lies on the month of March, April and
May andharvesting time of “belg” ranges between the month of October and November. On the
other hand, the weeding time of the “meher‟‟ season lies between the month of August and
September, and the harvesting time is between the month of November and December.
3.1.3. Food security situation of the wereda
Food shortage continuously occurs in the woreda due to shortage and erratic distributionof rain
fall, and lack of farming land which is caused by an ever increasing number ofpopulation sizes.
In addition to this, inability of the society to use the improvedtechnologies is also cited as the
causes of food shortage. Traditional and backwardfarming system of the community has
contributed to the problem of getting enough food (ERCS, 2008).
According to the Bureau of the agriculture and rural development (BANRD) (2016), only 20
percent of the community utilizes improved seeds and fertilizers. On the other hand, most
members of the community do not possess oxen to plough with. A pair “Timad” of oxen serves
for more than ten farmers. This shows people have faced shortage of farm tools. Due to this
reason, time of sowing elapses. Besides, unwise consumption of what they have harvested and
selling of their product with a very low price is the additional reason for the food shortage.
Even selling of livestock (bulls and huffers) is common with those who are under safety net
packages. Shortage of rain fall at the time of flowering of maize, dependency of most productive
age groups on few workers e.g. youths, ever increasing price of food, occurrence of African
army worm, death of livestock by black leg diseases are also seen as the major reasons for food

23
shortage.„‟Temch‟‟ has repeatedly destroyed the maize belt as a result of this, the total
production has been reduced by 20 percent. There is also maize dry crop disease which dried the
entire crop at early stage. The production of „‟enset‟‟ has been decreased from time to time as a
result of drought (ERCS, 2008).

24
Figure 2: Map of study area in Sidama Zone (Source: Ethio-GIS 2017)

25
3.2. Research Design, Data Sources and Process
The research design of this research washousehold-based cross sectional research and the
research approach will be quantitative.
3.3. Data types and sources
Both primary and secondary data wasused for this study. Primary data was collected using
household survey. Secondary information from published and unpublished documents and
reports from relevant organization was gathered and incorporated with the primary data.
3.4. Sampling technique
Multi-stage sampling procedure was used in the selection of representative samples. In the first
stage,households who engage in farming activities in Borichawereda, Sidama zone were selected
purposively based on prevalence of food insecurity (Zelekeet al, 2016) and availability of
agricultural technology (BANRD, 2016) in the wereda. In the second stage, out of 39 rural
kebeles under BorichaWereda, randomlythreekebeleswere selected for this study based on simple
random sampling technique. Finally, sample households who engage in farming among the three
kebeleswere selected based on simple random sampling technique. The number of sample
households was determined following Yamane (1967). Proportionate sample size of households
in Borichawereda is presented in Table 1. It was based on requiring estimation of tolerable error
margin at 0.055 allowing 95% confidence level. Hence, the formula is stated below.
( )
Where n is the minimum number of sample size within the range of acceptable error
margin, N is the total number of household heads in thewereda, and eacceptable error
margin (0.055).
( )
Note:The calculated minimum sample size of households is approximately 329. Due to extra
collected questionnaire at hand, and considering importance of their usage as long as it doesn‟t
lower from the standard, five more data were used.
Table 1: proportionate sample size of households in Borichawereda

26
Kebeles Sampling population size Percentage of samples Sample HH
BonoyaChire 12,168 42 140
FulfulaAldada 9,094 32 107
YirbaDuwancho 7,515 26 87
Total 28,777 100 334
Source: own computation result
3.5. Tools of Data Collection
Questionnaire: Close-ended questionnairewas used to gather information about producer‟s
characteristics, technology adoption characteristics, ownership of assets and market access and
institutional characteristics. The questionnaire was compiled by using information derived from
measurements that have also been applied by other researchers, and from key informant
interview carried out by the researcher. HDDS and HFIES questionnairewas used to collect
information about household dietary habit and food insecurity experience, respectively.
Key informant interview:It was performed with government extension officials of
BorichaWeredato gather on ground information apart from literature support. This helped to
collect more information from some key informants on pertinent issues, such as technology, crop
production, commercialization and food security issues, and that was used for closed-ended
questionnaire compilation (Justus, 2015).
3.6. Techniques of Data Analysis
Both descriptive and econometric analysis was employed to examine factors affecting
agricultural technology adoption, commercialization, household dietary diversity and food
insecurity experience of rural households, and also to identify impact of agricultural technology
adoption on the level of productivity, commercialization and food security status of rural
households. STATA 13 was used to analyze the overall statistical data.
3.6.1. Descriptive statistics
Descriptive statistics such as means, percentile and frequency distributions was employed to
characterize sample responds in terms of technology adoption status. Moreover, t-test and chi-
square statics was used to differentiate between adopter and non-adopter specific characteristics.
Household dietary diversity status was identified by using Household Dietary Diversity Score

27
(HDDS). Household status of food insecurity was identified by household food insecurity
experience scale (HFIES)
T-test statistics
Both demographic and socio-economic variables which are continues in nature like age, family
size, educational status, labor availability, livestock holding, farmland size, and so on were tested
by t-test statistics. Equation to compute t-test statistic is a follows (Hamilton, 2013). Where
are mean of the samples; are mean of the population;
are variance
of sample distribution; are number of observation of the two sample; and df =(n1-n2)-2
is degree of freedom for t-statistic
( ) ( )
√
(1)
Chi-square test
The remaining demographic and socio-economic dummy and categorical variables like sex, off-
farm income, adoption, having mobile phone and so onwere tested by chi-square statistics. The
formula to calculate chi-square test as follows (McDonald, 2014). Where (O), observed number
and (E), expected number.
∑( )
(1)
Level of commercialization
This paper employed the household commercialization index (HCI) with modification to
determine household specific level of commercialization (Strasberg et al., 1999). The index
measures the ratio of the gross value of crop sales by household i in year j to the gross value of
all crops produced by the same household i in the same year j expressed as a percentage:
(1)

28
Productivity
In order to measure productivity, a formula of harvested crop yield per hectare forwarded by
Diskin (1999) was adopted.
( )
( ) (1)
Household Dietary Diversity Score (HDDS)
Data for the HDDS indicator were collected by asking the respondent a series of yes or no
questions concerning the food groups consumed by household members. The question format is
presented in the Annex 2 (Swindale and Bilinsky, 2006). The formula to calculate HDDS is as
follows;
( ) ( ) (1)
Table 2: Distribution of food group in their level of dietary diversity
(2)
Source: Adopted from Swindale and Bilinsky( 2006) and Agada (2015)
Household Food Insecurity Experience (HFIES)
Data for HFIES indicator was collected by asking a series of eight yes or no questions about
household‟s experience of food insecurity because of lack of money or other resources. The
completed format is presented in the Annex 2 (Ballared et al, 2013).
3.6.2. Econometric model
Agricultural technology adoption status of householdsis defined as application of varies
technology, particularly for the case of Borichawereda it implies improved seeds and fertilizer, in
order to enhance productivity. Adoption status is a dummy variable that value 1 signified
adopters while 0 representednon-adopters.
Level of HDDS Range of food groups
High HDDS
Medium HDDS
Low HDDS

29
Propensity Score Matching (PSM)
The technology adopters were matched on the basis of probability, or propensity score, to non-
adopters. The propensity is defined as the conditional probability of receiving the treatment
given the pre-treatment variables (Rosenbaum and Rubin, 1983; Heckman, 1997). Let Di denote
a dummy variable such that D equals 1 if household i adopts technology and 0 otherwise, the
propensity score can be defined as;
( ) ( ) ( ) (1)
The logit model was employed to estimate propensity scores. Gujarati (1995) stated that the logit
model estimates the probability of the dependent variable to be 1. The specification of the logit
model in this study is specified as:
.
/ ( ) (2)
Where i is number of observation, P(Di) is the probability that the household adopts a
technology, X’ is explanatory variables indicating demographic and socio-economic attributes of
households, β is a vector of logit index (coefficient), and Ɛ is the stochastic (error or disturbance)
term.
ATT is the difference between the outcome variables of being treated and its counter factual
(outcome variables such as productivity, commercialization, households level of dietary diversity
and level of food insecurity). The average treatment effect on the treated (ATT) is given as;
ATT= E (Y1/D=1)-E (Y0/D=1) (3)
Where E (Y1/D=1) is the adopters before they adopt technologies and it is reasonably be
approximated by the output level of non-adopters during data collection. E (Yo/D=0) = is a
counter factual and is not observed E is mathematical expectation operator. D is dummy variable
that takes the value 1 if the individual is treated 0 otherwise. Now, the outcome of treated and
non- treated individuals might differ leading to selection bias. To clarify the mean outcome of a
program, we can further specify ATT as:

30
* , - , -+ * , - , -+ (4)
Where; E[Y1/D=1]-E[Y0/D=0] is the selection bias which will be equal to zero if the program
was given randomly and at the event where adopter and non-adopters did not differ before the
program implementation. The validity of the result of the PSM method depends on the
satisfactions.
The two assumptions are: Conditional Independence Assumption (CIA): meaning outcomes of
the adopters and non-adopters are independent of the treatment status or after controlling for
observable characteristics. The treatment assignment is “as good as random”, and Common
support condition (CSC): Entails the existence of sufficient overlap in the characteristics of the
treated and untreated units to find adequate matches (common support). Several matching
methods have been developed to match adopters with non-adopters of similar propensity scores.
Asymptotically, all matching methods should yield the same results. However, in practice, there
are trade-offs in terms of bias and efficiency with each method (Caliendo, 2008). Here, nearest
neighbour matching (NNM) was used. The basic approach is to numerically search for
“neighbours” of non-adopters that had a propensity score that is very close to the propensity
score of the adopters(Caliendo, 2008).
Multinomial logistic regression model
The multinomial logistic regression model is the most widely used multivariate approach to
study the dynamics (Baulch, 2011). The content of this section draws extensively in Greene
(2003).
The multinomial logistic regression model is defined as follows:
∑
j=1, …, m (1)
Results 1, 2, 3... m are supposed for y and the explanatory variables are defined as X. It is also
assumed that there are m = 3 results, which are unordered. This property of thecategorical
variable y is typical of multinomial regressions.

31
In the multinomial logistic regression model, a set of coefficients are estimated,
corresponding to each result the following probabilities for each case of the value of the
dependent variable (adoption and commercialization status at the same time):
( ) ( )
( ) ( ) ( ) (2)
( ) ( )
( ) ( ) ( ) (3)
( ) ( )
( ) ( ) ( ) (4)
This model is indeterminate in the sense that there exists more than one solution for
which lead to the same probability for y=1, y=2 y y=3. If a value of 0 is assigned
to , the remaining coefficients and will measure the relative change for y=1. On the
other hand, if , the remaining coefficients and will measure the relative change for
y = 2. The coefficients may differ because they have different interpretations, but the odds of y =
1, 2 and 3 are the same.
Assuming , the equations are as follows:
( )
( ) ( ) (5)
( ) ( )
( ) ( ) (6)
( ) ( )
( ) ( ) (7)
The relative probability (relative risk) of y = 2 relative to the base category is:
( )
( ) ( ) (8)
Assuming that X and ( )
are vectors equal to , and ( )
( )
( ) the relative
risk ratio for change of one unit in is:
( )
( )
( ) ( )
( )
( )
( ) ( )
( )
(9)

32
Then the exponential value of a coefficient is the rate of relative risk explained by the change of
one unit over some variable in particular.
According to Cameron and Trivedi (2005), care must be taken in the interpretation of the
parameters of any nonlinear model, particularly for multinomial models where there is not
necessarily a one to one correspondence between the sign and the probability of the coefficient.
A positive coefficient means that if the independent variable increases the probability of
choosing or falling into one of the categories increases.
{
( )
(10)
According to Escobar et al. (2010), the interpretation of the coefficients of the multinomial
logistic regression model is not immediate, but we must resort to the transformation of these
coefficients in odd ratios or in probabilities. In the case of the multinomial logistic regression
model, the interpretation is further complicated by not having a single model, but as many
models as the number of categories of the dependent variable minus one.
Ordered Logit Regression Model
Ordered logit regression model was used to econometrically identify demographic and socio-
economic factors affecting household level of dietary diversity and food insecurity. The model is
applied to perform analysis of ordinal and categorical variables (Long &Freese, 2003). This
model was selected because, the two dependent variables are categorical and ordinal in nature as
a result they fit to the model.
Suppose that Y is an ordinal dependent variable with (c) categories, and ( ) denotes the
probability that the response on (Y) falls in category (j) or below (i.e., in category 1, 2… or j).
This is called a cumulative probability. It equals the sum of the probabilities in category j and
below:
( ) ( ) ( ( ) ( ) (1)

33
A category(c) and dependent (Y) variable” has cumulative probabilities (c): ( ), (
), …, ( ). The final cumulative probability uses the entire scale; as a consequence,
therefore, ( ) . The order of forming the final cumulative probabilities reflects the
ordering of the dependent variable scale, and those probabilities themselves satisfy:
( ) ( ) ( ) (2)
In an ordered logit model, an underlying probability score for an observation of being in the ith
response category is estimated as a linear function of the independent variables and a set of cut
points. The probability of observing response category i corresponds to the probability that the
estimated linear function, plus random error, is within the range of the cut points estimated for
that response.
( ) = ( )
(3)
It is necessary to estimate the coefficients , along with cut points , where
(i) is the number of possible response categories of the dependent variable. The coefficients and
cut points are estimated using maximum likelihood.
Tobit Regression Model
An econometric model known as Tobit model was used to empirically identify the determinants
of commercialization status of farming households. This model is also recognized as censored
regression model in the sense that a sample in which information on the regressand (dependent
variable) is censored. The Tobit model was selected because commercialization, which is the
dependent variable, is continuous and censored. The value of the dependent variable ranges
between 0 and 1. This made it a more appropriate econometric model for this paper (Maddala,
1983; Gujarati, 2004). The structural equation of the Tobit model is given as:
(1)
e ~ N [0,s]
Denoting Yi as the observed dependent (censored) variable
{
} (3)

34
Where:
Yi = the observed dependent variable, in our case commercialization
= the latent variable (unobserved for values smaller than 0 and greater than 1)
= is a vector of independent variables postulated to influence commercialization.
βi = are parameters associated with the independent variables to be estimated.
εi= Residuals that are independently and identically normally distributed with mean zero and a
common variance.
i= 1, 2,…n ( n is the number of observations).
L = lower limit
U = upper limit

35
3.6.3. Definition of Variables and Hypotheses
Based on the reviewed literatures, some of the common predictors that are expected to influence
technology adoption status of households in the study area are presented in table below.
Table 3.A summary of explanatory variables, their measurement and expected sign.
Description of Variables
Measurement
Expected
Sign on
Adoption
Age of Household Head
Household size
Sex of Household head
Marital status
Education of Household Head
Partners education status
Maximum education status
Off farm Income
Household labor availability
Technology Adoption
Adoption by neighbor
Access to technology information
Mobile usage
Livestock holding
Farmland Size
Annual farm output
Union membership
Access to Extension Service
Annual Market output
Market information
Distance to market
Access to vehicular road
Years
Number of families in the HH
Dummy,1=male,0 = female
Dummy, 1=married, 0=otherwise
Level in number
Level in number
Level in number
Dummy,1=yes,0 = no
In number (age <14, b/n 14&65, >65)
Dummy,1=adopters,0 = non-adopters
Dummy,1=yes,0 = no
Dummy,1=yes,0 = no
Dummy,1=yes, 0= no
TLU
Hectare
Kilograms
Dummy,1=yes,0 = no
Number of contacts/year
Kilograms
Dummy,1=yes,0 = no
Kilometers
Dummy,1=yes,0 = no
+
-
+
+
+
+
+
+
+
+
+
+
+
+
+
+
+
+
+
+
-
+
Source: self-formulated based on extensive review and key informant interview

36
4. RESULT AND DISCUSSION
This chapter discusses both results of descriptive and econometric analysis. Under descriptive
analysis, household head characteristics, technology adoption, commercialization and food
security related variables were scrutinized by either t-test or chi-square. And econometric
analysis was carried out using mlogit, ologit, tobit and propensity score matching (PSM).
4.5. Descriptive results
Out of the total of 334 respondents, 66% of them adopt agricultural technology while 34% of do
not.
4.5.1. T-test distribution of household heads in terms of adoption status
Demographic and socio- economic characteristics of both adopters and non-adopters have been
examined. The result revealed that no significance difference in the mean age, education level,
maximum education attained in the household, family size and visit paid by the agricultural
extension workers (Table 4).
The average age of the sampled household heads was 41.9 years with the minimum and
maximum ages of 22 and 80 years, respectively and also, average age distribution of adopters
and non-adopters were 41.7 and 42.3 years, respectively, with no statistically significant
difference between them. This was further elaborated using three age clusters. The average
number of members whose age less than 14, between 14 and 65 and greater than 65 was 1.7, 3.7
and 1.1, respectively. The majority is found in the cluster whose age is between 14 and 65. Based
on the result mean of members whose age less than 14 and between 14 and 65 show statistical
difference at 5% significant level. This indicates that families having household members whose
age less than 65 years tends to adopt agricultural technology.
The result shows that the average education status of the sampled household heads was 4.2 with
minimum and maximum education level of 0 and Diploma, respectively. Average education
status of adopters and non-adopters were 4.4 and 3.9, respectively with no statistically significant
difference. Similar to this, no significant difference was identified by maximum education status
of household members. The average maximum education was found to be 7.4 with minimum and
maximum level of 0 and BSc degree, respectively. This average between adopters and non-
adopters were 7.6 and 7, respectively.

37
Apart from the above mentioned results, education status of the partner showed statistical
difference between adopters and non-adopters at 5% significant level. The average education
status of the partner among the respondents was 3 with minimum and maximum education level
of 0 and Diploma, respectively, while the average level between adopters and non-adopters were
3.3 and 2.6, respectively. This implies that having educated marriage partner helps to increase
the willingness to adopt agricultural technology.
The average family size of sample respondents was 5.5 with the minimum and maximum size of
2 and 10, respectively and also, average household size distribution of adopters and non-adopters
were 5.4 and 5.6, respectively. Though, family size of non-adopters is greater than adopters,
there is no statistically significant difference in their mean.
The result on the table shows the average livestock holdings of sample respondents was 1.4 with
the minimum and maximum size of 0 and 5.5 TLU, respectively at 1% significant level. This
implies livestock possession has significant impact on technology adoption. And also, average
household livestock holdings distribution of adopters and non-adopters were 1.6 and 1.2,
respectively. Households that adopt technology tend to have livestock holdings higher than non-
adopters.
The average total farm income of sample respondents was 2350.2 birr with the minimum and
maximum size of 0 and 13,800 birr, with no significant difference in their mean. Furthermore,
average of household total farm income distribution of adopters and non-adopters were 2505.1
and 2055.3 birr, respectively. The average annual cash crop income of sample respondents was
1948.3 birr with the minimum and maximum size of 0 and 13,000 birr, with no significant
difference in their mean. Furthermore, average of household total farm income distribution of
adopters and non-adopters were 1923.9 and 1993.1 birr, respectively.
The result further indicated that farmland size shows statistical difference in terms technology
adoption at 1% significant level. The average household farm land size of sample respondents
was 0.5 with the minimum and maximum size of 007 and 2 hectare, respectively. The average
household farm size distribution of adopters and non-adopters were 0.52 and 0.39, respectively.
This implies that households who adopt technology tend to have higher firm size than their
counter part.

38
Agricultural technology adoption has its own impact on productivity, commercialization and
food security status of households. Table 2 indicated that there are mean differences on
productivity and commercialization between agricultural technology adopters and non- adopters.
In both situation, the adopters have higher figures implying that agricultural technology enable
farmers to produce more and tend to engage in higher degree of commercialization. The average
household farm productivity of adopters and non-adopters were 1137.1 kg/ha and 304.4 kg/ha,
respectively. Their difference is really big. In the meantime, the average household‟s level of
commercialization of adopters and non-adopters were 0.19 and 0.04, respectively. The average
sum of HDDS was 6.7 with the minimum and maximum size of 3 and 11. The average sum of
HDDS for adoptersand non-adopterswere 6.9 and 6.3 respectively, with significant difference in
their mean at 1% significant level. The result shows that adopters consume more diversified diet
that non-adopters.
The average number of visits paid by DAs was 4.7 times with the minimum and maximum size
of 0 and 52 times per year, respectively. The average number of visits for adopters and non-
adopters were 4.6 and 4.9 times per year respectively, with no significant difference in their
mean.
Vicinity to market enabled farmers to adopt agricultural technology. This is evidenced by the
fact that adopters on average are 4.9 km away from the nearest market center while the figure for
non-adopters goes as high as 6.7 and their differences is significant at 1%. The interesting result
of the analysis is that those households which have higher land size tend to adopt agricultural
technology. Meanwhile, those households which have higher livestock have less affinity to
agricultural technology adoption. This is basically linked to the fact that those who have higher
livestock tend to spend much of their time on livestock production than agricultural production
(Table 4). The average number of visits paid for adopters and non-adopters were 4.6 and 4.9
times per year respectively, with no significant difference in their mean.
The average sum of HDDS was 6.7 with the minimum and maximum size of 3 and 11. The
average sum of HDDS for adopters and non-adopters were 6.9 and 6.3 respectively, with
significant difference in their mean at 1% significant level. The result shows that adopters
consume more diversified diet that non-adopters.

39
Table 4: T-test distribution of variables by technology adoption status
Variables Mean (Adopters) Mean (Non-adopters) T-value
Age of HH 41.703 42.260 0.673
Household member age less than 14 1.817 1.522 0.018**
Household member age between14 and 65 3.511 3.991 0.015**
Household member age greater than 65 0.069 0.078 0.744
Education status of HH 4.429 3.887 0.142
Partner education status 3.343 2.583 0.043**
Maximum education status 7.603 7.009 0.102
Family size 5.397 5.591 0.351
Livestock holding (TLU) 1.586 1.164 0.000***
Farm size 0.517 0.388 0.001***
Productivity 1137.074 304.393 0.000***
Commercialization 0.191 0.040 0.000***
Visit paid by DAs 4.626 4.930 0.829
Nearest market distance 4.785 6.658 0.004***
Sum of HDDS 6.845 6.296 0.000***
*Significant at the 10% level, ** Significant at the 5% level, *** Significant at the 1% level
Source: Authors‟ estimates based on 2018 survey
The study further carried out chi square tests for dummy and scale variables in a bid to
substantiate possible difference between adopters and non-adopters.
4.5.2. Chi-square distribution of household heads in terms of adoption status
The sample composed of both male and female household heads. Out of 334 sample household
heads, female and male household heads take 11.98% and 88.02%. The majority of households
in the sample are headed by males. Among female headed households, 30% and 70% are
adopters and non-adopters of agricultural technology, respectively, while 70.41% and 29.59%
were adopters and non-adopters, respectively. The result shows significant difference between
the two discrete variables in terms of sex at 1% significant level. It implies that adopters are
dominated by male household heads.
Based on the marital status report of Table 5, out of the total household heads single, married and
widows comprise of 1.5%, 85.33% and 13.17%. The majority of household heads in the in the
sample are headed by married couples followed by widows and singles. All singles were
adopters. About 68.42% and 31.58% of married household heads were adopters and non-
adopters, respectively. And also, about 43.18% and 56.82% of widow household heads were
adopters and non-adopters, respectively. Statistical difference between adopters and non-

40
adopters was observed in terms of marital status at 1% significant level. The result infers that
adopters are dominated by single household heads, followed by marrieds and widows.
Of the total sample of household heads, 67.66% fetched off farm income, while 32.34% did not
have off farm income and the result is significant at 1%. Most of the respondents engage in off
farm activities to earn money. Among those who have off farm income, 75.93% and 24.07%
were found to be adopters and non-adopters, respectively. About 60.62% and 39.38% of those
who confirmed having no off farm income were found to be adopters and non-adopters,
respectively. This shows that adopters fetched were more off farm income than non-adopters.
Household heads who have neighbors adopting technology and those who do not take 64.37%
and 35.63% of the total respondents, respectively. About 80.93% and 19.07% of households with
technology adopting neighbors were found to be adopters and non-adopters, respectively. While
37.82% and 62.18% of households with neighbors who do not adopt technology was found to be
adopters and non-adopters, respectively. This shows that having neighbors who adopt technology
urges households to adopt agricultural technology.
Information about new technology is one variable used to explain technology adoption. About
75.15% and 24.85% of respondents were those who have information about new agricultural
technology and those who do not, respectively. Many of the respondents have information about
agricultural technologies in their community. Among those who have information about any new
agricultural technology, 81.67% and 18.33% were adopters and non-adopters, respectively, while
16.87% and 83.13% of those who do not have information were adopters and non-adopters. The
result indicates that there is significant difference between the two groups adoption status in
terms of new technology information at 1% significant level. This shows that adopters were
dominated by household heads that have information about new agricultural technology in their
local community.
Mobile phone distribution among sample respondents seams fair that about 56.59% of household
heads have cell phone. Among the total respondents who have mobile phone, 74.04% and
25.93% were adopters and non-adopters, respectively. And also about 54.48% and 45.52% of
those who do not have mobile phone were adopters and non-adopters. The result indicates
significant difference in terms of adoption status at 1% significant level. This shows adopters
were dominated by household heads with mobile phone.

41
Farmers‟ union membership is also another factor under consideration. Among the total
respondents, only 6.89% were found to have union membership, and the rest 93.11% do not.
Therefore, the majority do not have union membership. About 82.61% and 17.39% of those who
have union membership were adopters and non-adopters, respectively. And also, about 64.31%
and 35.69% of those who do not have membership were adopters and non-adopters, respectively.
The result indicates significant difference in terms of adoption status at 10% significant level.
This shows adopters were dominated by household heads with union membership.
Table 5: Chi-square distribution of variables by technology adoption status
Variables
Categories
% of
Sample
proportion
Percentage distribution
Chi-square
Adopters
Non-
adopters
Sex of HH Female 11.98 30.00 70.00 0.000***
Male 88.02 70.41 29.59
Marital status of HH
Single 1.50 100.00 0.00
0.001*** Married 85.33 68.42 31.58
Widow 13.17 43.18 56.82
Off farm income No 67.66 60.62 39.38 0.006***
Yes 32.34 75.93 24.07
Neighbor adoption No 35.63 37.82 62.18 0.000***
yes 64.37 80.93 19.07
Technology information No 24.85 16.87 83.13 0.000***
Yes 75.15 81.67 18.33
Mobile phone No 43.41 54.48 45.52 0.000***
Yes 56.59 74.07 25.93
Market information No 26.65 35.96 64.04 0.000***
Yes 73.35 76.33 23.67
Union membership No 93.11 64.31 35.69 0.075*
Yes 6.89 82.61 17.39
Vehicular road No 15.27 11.76 88.24 0.000***
Yes 84.73 75.27 24.73
Source: Field survey 2018
Note: ** and *** indicate the level of significance at 1and 10 percent, respectively.

42
4.5.3. Chi-square distribution of household dietary diversity and food insecurity experience in
terms of adoption status
Out of the total number of respondents who adopt agricultural technology (Figure 3), 91.4%,
7.3% and 0.9% were found to consume high, medium and low diversity food, respectively, while
47.7%, 31.4% and 15.5% were food to be severely, moderately and mildly food insecure
households, respectively. On other hand, out of the total sample respondents who did not adopt
agricultural technology, 71.9%, 21.05% and 7.9% were found to consume high, medium and low
diversity food, respectively, while 50%, 33.3% and 4.4% were food to be severely, moderately
and mildly food insecure households, respectively. According to this result, adoption is related
with high diversity diet and minimal food insecurity experience. Therefore, one can infer that
technology adoption can be taken as effective tool to ensure household food security.
Figure 3: chi-square distribution of household dietary diversity and food insecurity experience in terms of adoption
status (Source: survey result of 2018)
71.9%
21.05%
7.9%
50%
33.3%
4.4%
91.4%
7.3%
0.9%
47.7%
31.4%
15.5%
05
01
00
15
02
00
Non-adopters Adopters
High dietary diversity Midium dietary diversity
low dietary diversity severely food insecure
moderatly food insecure mildly food insecure
Graphs by adoption status of the Household

43
4.6. Econometrics result
4.6.1. Estimating determinants of technology adoption
In order to compute propensity score, logit model has been used. The likelihoodratio of the
model which is chi2(13) =107.23, Prob> chi
2 = 0.0000 and Pseudo R
2 = 0.3363shows that
the independent variables included in the model have been adequately estimated the propensity
scores. In addition to this, goodness-of-fit test were carried out to identify determining factors of
households‟ estimated probability of adopting farm yield enhancing technology, and to examine
whether the model fit to this type of regression or not, respectively. The result shows that the
pearson chi2 (314) = 325, and Prob> chi
2 =0.7015. This signifies that the model is found to be to
carry out the regression analysis.
Table 6: Factors affecting technology adoption
Treated Coef. Std. Err. z Sex of HH 20.206 2499.426 0.01
Age of HH -0.005 0.017 -0.29
Education status of HH -0.088 0.059 -1.49
Family size -0.284 0.109 -2.62***
Marital status -19.219 2499.426 -0.01
Off farm income 0.242 0.367 0.66
Adoption by neighbor 1.229 0.351 3.50***
Technology information 3.225 0.426 7.57 ***
Mobile usage 1.057 0.364 2.91***
Livestock holding 0.665 0.227 2.93***
Farm size 1.7 0.724 2.35*
Union membership 0.668 0.668 1.00
Visit by DA -0.020 0.014 -1.48
*Significant at the 10% level, ** Significant at the 5% level, *** Significant at the 1% level
Source: Authors‟ estimates based on 2018 survey
The result of logistic regression shows that the probability of a farming household being
technology adopter was negatively related to family size at 1% significant level, and positively
related to attributes like neighbor‟s adoption status, technology information, mobile usage and
livestock holding at 1% significant level, and with farm land size at 10% significant level.

44
The above table indicated that a unit increase in neighbor‟s adoption status, technology
information, mobile usage, livestock holding and farm size, increase the probability of adopting
technology compared to non-adopters by 1.23, 3.23, 1.06, 0.67 and 1.7, respectively. Unit
increment in family size, de-escalate the probability of household technology adoption by 0.28.
Based on comparative analysis of this result, probability of adopting technology can be
intensified by assimilating enough awareness about the new technology since technology
information takes the biggest role in this regard.
Many studies have reported a positive relation between information and adoption of agricultural
technology (Bonabana- Wabbi, 2002; Mignounaet al, 2011). It enables farmers to learn the
existence as well as the effective use of technology and this facilitates its adoption. Farmers will
only adopt the technology if they are aware of or have heard about it. Access to information
reduces the uncertainty about a technology‟s performance hence may change individual‟s
assessment from purely subjective to objective over time. This information can be found from
institutes or from a neighbor that adopt technology. Even more, having mobile phone might help
at the process of being informed about what is going on around relatives and in institutions
concerning farming activities. It enables farmers to learn the existence as well as the effective
use of technology and this facilitates its adoption. Bonabana- Wabbi (2002) showed thatfarmers
might only adopt the technology they are aware of or have heard about it , as a result it reduces
the uncertainty about a technology‟s performance hence may change individual‟s assessment
from purely subjective to objective over time.
In conformity with this finding, Hiwot et al (2016) stated that size of livestock owned measured
in TLU will increase the probability of adoption of improved groundnut seed, inorganic
fertilizer, and organic fertilizer in eastern Ethiopia by 0.14. Aman (2014) related the reason with
livestock providing manures as main compost used by farmers for crop production in rural areas
as a result increase in the number of livestock owned would improve the crops productivity and
hence increases the marketable surpluses.
Farm size was one of the attributes where significant impact on technology adoption exhibited.
In support of this finding, many previous studies reported a positive relationship between extent
of farm size and technology adoption. According to Uaiene et al. (2009), farmers with large farm
size are likely to adopt a new technology as they can afford to devote part of their land to try new

45
technology unlike those with less farm size. Another study by Obsisan (2015) a unit increases in
cultivated land was reported to increase adoption level of improved production technology by
0.6345. The reason being land is a base for any economic activity especially in rural and
agricultural sector.
Family size the only factor, in this study, that affected technology adoption negatively that a unit
increment in the size of family reduced the probability of adopting new agricultural technology.
In other empirical findings family size tend to increase technology adoption. The negative
relationship might be that household‟s engagement in off farm activities as a result it avoids
pressure of the need to produce more food for large family size consumption(Obsisan, 2015;
Wabwil, 2016).
4.6.2. Impact of adoption on productivity, commercialization and food security
The logit model results calculated individual propensity scores that were used to match adopters
and non-adopters farm households. The indicators for household food security used in the
analysis were household dietary diversity score and household food insecurity experience scale.
PSM controls for all confounding factors that correlate with both the outcome variables and
adoption status. Before assessing the impacts of adoption, the quality of matches were tested in
order to check for the fulfillment of common support condition and ensure that the distribution of
the variables between the adopters and non-adopters is balanced. The density distribution of
estimated propensity scores for the two groups of farmers is presented in Figure 4. The figure
demonstrates that the condition for common support is fulfilled because of substantial overlap in
the propensity score distributions for the two groups. In addition it also indicates a good
comparability between the adopters and non-adopters.The existence of common support enables
us to compute the impact of technology adoption on selected outcome variables. The result of the
analysis is portrayed in Table 7.

46
Figure 4: Propensity score distribution and common support for propensity score estimation of adopters
and non-adopters
Table7: Impact of adoption over productivity, commercialization, HDDS and food insecurity
Variables Treated Control Difference (ATT)
Productivity 1017.212 304.394 712.819***
commercialization 0.181 0.040 0.141***
HDDS 6.6 6.296 0.304*
Severe food insecurity 0.504 0.626 -0.122* *Significant at the 10% level, ** Significant at the 5% level, *** Significant at the 1% level
Source: Authors‟ estimates based on 2018 survey
The results suggested that adoption has positiveeffect on productivity and commercialization at
1% significant level, and on household dietary diversity at 10% significant level. While it
showed negative relationship with sever food insecurity experience at 10% significant level. The
impact increased productivity, commercialization level and dietary diversity of treated
households by 712.8, 0.14 and 0.3, respectively; while it reduced prevalence of severe food
insecurity of the treated by 0.12.
The result goes in line with previous studies. Abadi (2014) stated that adoption of improved
maize varieties had a robust and positive impact on farmers‟ marketed surplus maize as a result
of magnified productivity scale which leads to the active market participation. Solomon et al
(2011) and Wabwil (2016) confirmed the potential direct role of technology adoption on market
participation among rural households, as higher productivity from improved technology
translates into higher output market integration.
Salazar et al (2015) indicated the same result that smallholders‟ food security and income was
improved through productivity increase triggered by technological adoption as a result of
0 .2 .4 .6 .8 1Propensity Score
Untreated Treated

47
agricultural development program. Tigist (2017) suggested strong relationship between
agricultural technology adoption and farm households‟ well-being. The concept of well-being
implies households having enough financial strength to secure its food both qualitatively and
quantitatively.
4.6.3. Determinants of households dietary diversity score
The other most important issue that should be addressed here is analyzing the effect of
technology adoption on different food insecurity status of households. Since the dependent
variable is ordered in nature, ordered logit model was used to run the regression. The estimated
results of the model of the maximum likelihood, multicollinearity test result and the marginal
effects are tabulated in Appendix 11, Appendix 12 and Table 8, respectively. The dependent
variable was obtained by making use of food security measurement tool called household dietary
diversity score, and the households were organized in to three groups; namely high , medium and
low dietary diversity. A total of 12 explanatory variables were used to compute the econometric
model in order to identify factors that determine household‟s level dietary diversity. Among
those explanatory variables, only marital status, livestock holding and adoption status was found
to have significant relationship with the level of HDDS.
Table8: Distribution table for Household Dietary Diversity Score (HDDS) Variables High HDDS Medium HDDS Low HDDS
Sex of HH -0.043(0 .055) 0.031 (0.039) 0.013 (0.016)
Age of HH 0.001 (0.002) -0.000 (0.001) -0.000 (0 .001)
HH Educ. -0.005 (0.006) 0.003 (0.004) 0.001 (0.002)
Marriage Status 0.174 (0.042)*** -0.123 (0.033)*** -0.051 (0.015)***
Family Size -0.005 (0.010) 0.003 (0.007) 0.001 (0.003)
Off Farm Income 0.010 (0.041) -0.007 (0.029) -0.003 (0.012)
Farm Land -0.061 (0.049) 0.043 (0.035) 0.018 (0.015)
Livestock Holding 0.130 (0.027)*** -0.091 (0.019)*** -0.038 (0.013)***
Adoption Status 0.139 (0.038)*** -0.098 (0.027)*** -0.041 (0 .015)***
Numbers in brackets are standard errors
*Significant at the 10% level, ** Significant at the 5% level, *** Significant at the 1% level
Source: Authors‟ estimates based on 2018 survey
The regression result has revealed that technology adoption was one of the most important factor
that took its place of influence on improvement of household dietary diversity. Previous studies

48
reported positive impact of yield enhancing technologies, like fertilizer, on household food
security status (Misgina, 2014).
According to the estimated result in table, attributes such as marital status of household head,
livestock holding and adoption status showed positive and significant relationship with high
dietary diversity score at 1% significant level. In contrast to the case of high dietary diversity
score, the variables showed negative relationship with medium and low HDDS, still at 1%
significant level.
Being married, adopting technology and a unit increase in TLU of livestock holding increased
the probability of consuming highly diversified diet by 0.17, 0.14 and 0.13, respectively; but it
decreased the probability of consuming medium diversified diet by 0.12, 0.10 and 0.09,
respectively; and it also decreased the probability of consuming low diversity diet by 0.05, 0.04
and 0.04, respectively.
The result indicated that having marriage partner, surely women, reduces consuming low and
medium diversified diet, and promotes high diversity of diet on table. These might be due to the
fact that women involve in food preparation, food selection is therefore expected to be
influenced by women`s knowledge regarding nutritional benefits of different foods and their
power to allocate household family budgets towards high quality foods (Quisumbinget al, 1998).
Previous studies by Rogers, (1996, p. 113) noted that female headed households spent more on
higher-quality, more expensive, and protein-rich foods. Therefore, having women partner in
marriage might be the reason behind high dietary diversity score.
The model result indicated that those who had better livestock ownership measured in
TLU were food secure, in a sense that they consume more diversified diet than their
counterpart. This finding was crystalized by the report of Goshuet al (2013) that household‟s
dietary diversity increased by 0.11 as a result of a unit increase in TLU of livestock possession.
The herd size being a proxy for farmer‟s resource endowment, larger holding increases
household‟s income level and this in turn could be used to purchase diversified items of food
from market (Misgina, 2014).

49
4.6.4. Determinants of household food insecurity experience scale
The estimated results of the ologit model of the maximum likelihood, multicollinearity test result
and the marginal effects are tabulated in Appendix 9, Appendix 10 and Table 9, respectively.
The dependent variable was derived by making use of food security measurement tool called
Household Food Insecurity Experience Scale, and the households were organized in to three
groups; namely severely, moderately and mildly food insecure households. A total of 12
explanatory variables were used to compute the econometric model in order to identify factors
that determine household‟s level of food insecurity.
Table9: Distribution table for household food insecurity experience (FIES)
Variables
Severely Food
Insecure
Moderately Food
Insecure
Mildly Food
Insecure
Sex of HH 0.034 (0.161) -0.018 (0.082) -0.017 (0.079)
Age of HH 0.011 (0.003)*** -0.006 (0.001)*** -0.005 (0.002)***
HH Educ. -0.013 (0.009) 0.007 (0.005) 0.006 (0.005)
Partner‟s Educ. 0.012 (0.009) -0.006 (0.004) -0.006 (0.005)
Maximum Educ. -0.028 (0.010)*** 0.014 (0.005)*** 0.013 (0.005)*
Marriage Status -0.253 (0.137)** 0.130 (0.068)* 0.123 (0.072)*
Family Size -0.040 (0.016)* 0.020 (0.009)* 0.019 (0.008)*
Productive Labor -0.226 (0.128)* 0.116 (0.068)* 0.110 (0.062)*
Off Farm Income -0.043 (0.051) 0.022 (0.026) 0.021 (0.025)
Farm Land -0.153 (0.113) 0.079 (0.059) 0.074 (0.055)
Livestock Holding -0.047 (0.029) 0.024 (0.015) 0.023 (0.015)
Adoption Status -0.091 (0.050)* 0.047 (0.025)* 0.044 (0.026)* Numbers in brackets are standard errors
*Significant at the 10% level, ** Significant at the 5% level, *** Significant at the 1% level
Source: Authors‟ estimates based on 2018 survey
The results of the regression has shown that technology adoption reduces the probability of
households to be severely food insecure and increases the probably of households to be in a
better food insecurity status.
Household head‟s age is the one factor that had positive influence on severely food insecure
households, while it showed negative relationship with moderately and mildly food insecure
households at 1% significant level. The result revealed that increment in the age of the household
head increased the probability of households being severely food insecure by 0.011, and
decreased the probability of households becoming moderately and mildly food insecure by 0.006
and 0.005, respectively. Even though, the effect is not worthy of consideration, it signifies that
old people are the one that are susceptible to severe food insecurity.

50
Maximum education status attained by any of the household member was the other factor that
negatively influenced the probability of households being severely food insecure at 1%
significant level, while it showed positive effect on moderately and mildly food insecure
household at 1% 1nd 10% significant level, respectively. Achieving a good level of education as
a household member decreased the probability of severely food insecure by 0.028, and increased
the probability of being moderately and mildly food insecure by 0.014 and 0.013, respectively.
As the computed report showed education reduced severity and by promoting moderate and mild
food insecurity, it works towards achieving food security. The negative effects of these variables
indicate that the importance of the household‟s education in terms of avoiding food insecurity.
Thus, the possible explanation is that education is a fundamental instrument to develop their
skills how to use and control farm lands, apply farm inputs and adopting new technologies,
applying family planning, and others (Ermias, 2011).According to Farhadian (2015) tried to
explain the fact that a person with a diploma or a degree holder is able to secure a good job and
has a higher income. It can also be observed that the households with household heads that have
a low level of education (never attend school, primary school, and secondary school) tend to
have the worst scores in comparison to the households with a better schooled household head
(institution of higher education).
Marital status showed negative relationship on being severely food insecure household at 5%
significant level, while the opposite being true on the case of being moderately and mildly food
insecurity at 10% significant level. The result indicated that being married reduced the
probability of being severely food insecurity by 0.253, and increased the probability of being
moderately and mildly food insecurity by 0.13 and 0.123. This might imply that household led
by married parents support each other all their way to food sufficiency while the singles and
widows lake mutual support. Single headed households were reported to be vulnerable to severe
food insecurity as compared to married ones (Nord et al, 2004)
Based on this paper, severe food insecurity has negative relationship with attributes like family
size, productive labor and technology adoption at 10% significant level that it reduces prevalence
of severe food insecurity by 0.04, 0.23 and 0.09, respectively. Furthermore, the probability of
households being both moderately and mildly food insecure was positively influenced by factors
like family size, productive labor and technology adoption at 10% significant level. Based on the
figure in the table, the probability of households being moderately food insecure was increased

51
by 0.02 and 0.12 as a result of increment in family size and productive labor, and also it was
increased by 0.05 if the household adopt agricultural technology. And also, the probability of
households being mildly food insecure was increased by 0.02 and 0.11 as a result of increment in
family and productive labor size, and also it was increased as a result of technology adoption by
0.04.
The result of the survey may also indicate that large households who share a common dish tend
to be food insecure compared to smaller family size. It shows that additional household
members' shares the limited resources; this leads the existing households to become more
foodinsecure. This result is in line with the result of (Mesfin , 2010; Taye, 2014). On an article
produced by Hussaini and his research partners (2016), dependency ratio, the reverse of
productivity labor ratio, was reported to affect households food security status negatively
(reduced it by 3.4%). From this report, one can conclude that having independent, productive and
self-supporting household member within the household would promote food security, or else
greatly deduct the challenge of severe food insecurity. In line with this paper, a report by Ermias
(2011), the relationship was found to be negative and significant. The explanation is that use of
improved seed or else adopting yield enhancing farm inputs is likely to increase productivity, as
a result it tend to decrease the probability of being food insecure.
4.6.5. Determinants of household‟s Adoption and Commercialization dynamics
In this study the dependent variable is “adoption with commercialization”, for which there are
three possible outcomes. These are households who adopt technology at the same time
commercialize their crop, those who adopt technology but do not sell their crop, and those who
neither adopt technology nor commercialize their crop.
The multinomial logistic regression model was used to run the regression as it is the best
multivariate approach to study the dynamics of technology adoption and commercialization
(Baulch, 2011). Due to the mentioned limitations of the multinomial logistic regression model,
marginal effects were used for a better interpretation of the results. According to Cameron and
Trivedi (2005), the marginal effect is the effect caused by a change in one unit of a dependent
variable upon the probability of falling into any of the possible outcomes. The marginal effect is
tabulated in Table 10.

52
A total of six explanatory variables were considered in the econometric model, all related to both
demographic and socio-economic characteristics and selected as to the interest of the author, in
order to identify factors that affect households‟ technology adoption and commercialization
dynamics. Marital status, family size, off farm income, livestock holding and farm size were
found to be significantly associated with the dependent variable.
Table 10: factors affecting dynamics of adoption and commercialization
Variables ADOCOM
dx/dy
ADOPT
dx/dy
NONE
dx/dy Age of HH -0.003 (0.002) 0.003 (0.003) 0.002 (0.002)
Marital status -0.033 (0.093) -0.147 (0.085)* -0.283 (0.069)***
Family size 0.003 (0.012) -0.040 (0.017)* 0.014 (0.015)
Off farm income 0.103 (0.046)* 0.013 (0.056) -0.101 (0.053)*
Farm size 0.205 (0.080)** 0.074 (0.109) -0.242 (0.127)*
Livestock holding 0.144 (0.023)*** -0.050 (0.031)* -0.105 (0.027)***
Numbers in brackets are standard errors
*Significant at the 10% level, ** Significant at the 5% level, *** Significant at the 1% level
Source: Authors‟ estimates based on 2018 survey
It can be seen in the above table that the higher the amount of livestock possession, farm size of
the household head, and participation in off farm activity, the probability of adopting technology
at the same time commercializing farm output increased by 0.14, 0.21 and 0.1,respectively. As a
result of being married, and a unit increment in family size and livestock holding, the probability
of households who adopt technology could not commercialize their crop, and decreased by 0.15,
0.04 and 0.05, respectively. And also, being married, having off farm income, and a unit increase
in farm size and livestock holding, the probability of none-adoption and none-commercialization
decrease by 0.3, 0.1, 0.2 and 0.1, respectively.
The result indicated that the effect would be great for households who had large farm size
followed by them having livestock possession, and being employed in off farm jobs. Even if it is
well understood that technology adoption promotes commercialization, the elements that play
great role behind the sine are the above attributes.
As the report in the above table indicates, marriage showed significant influence on adoption and
commercialization status of households. As a result of adoption, an urge for commercialization
could be realized by increased productivity. Married people are the one who take responsibility
of people under their shelter (Daudaet al, 2014). Elemashoet al (2017) reported that married
53
people were willing to adopt postharvest technologies than singles in pursuit of fulfilling family
responsibilities.
Livestock provides manures as main compost used by farmers for crop production in rural areas
as a result increase in the number of livestock owned would improve the crops productivity and
hence increases the marketable surpluses, and financial growth indirectly provoke farmers to try
technology adoption (Solomon et al, 2010, Aman, 2014).
It is true beyond doubt that having an additional timad (0.125 ha) is critical production asset
having a direct bearing on production of surplus and would increase the amount of horticultural
output sold (Angula, 2010; Aman, 2014; Obisesan, 2015 and Mengistuet al, 2016).
Off farm activity was the other factor with positive impact on promotion of adoption with
commercialization. A study by Kabiti et al (2015) bore witness to the fact that household income
can impact on the size (land size cultivated) and operations (type of cultivation, inputs, access to
transport) of the agricultural enterprise which thus impact on commercialization. And also, it has
the potential of reducing the dependency on agricultural produce as food and income sources;
and hence increased commercialization.
4.6.6. Determinants of Commercialization status of Households
Since the values of commercialization falls in between 0 and 1, tobit model has been used. The
estimated results of the model of the maximum likelihood, multicollinearity test result and the
marginal effects are shown in Appendix 13, Appendix 14 and Table 11, respectively. A total of
16 explanatory variables were used to compute the econometric model in order to identify factors
that determine household‟s market participation level. Out the total variables, only eight of them
were able to significantly market engagement.
Based on the result presented below, households‟ commercialization status were negatively
affected by Education status of household head, ratio of productive labors and market distance at
10%, 10% and 1% significant level, respectively. It was positively influenced by market
information, vehicular road, farm size, livestock holding and adoption at 1%, 10%, 10%, 1% and
1% significant level, respectively.

54
Table 11: Determinants of commercialization level of households
Variable Marginal effect Std. Err Z Sex of HH -0.075 0.121 -0.62
Age of HH -0.002 0.003 -0.66
HH Educ. -0.027 0.011 -2.37*
Partner‟s Educ. 0.006 0.012 0.56
Maximum Educ. 0.003 0.012 0.26
Productive Labor -0.328 0.182 -1.80*
Family Size -0.009 0.065 -0.14
Market Information 0.280 0.093 3.00***
Union Member -0.067 0.106 -0.63
Visit by DA‟s 0.004 0.002 1.54
Market Distance -0.017 0.006 -2.84***
Vehicular Road 0.266 0.138 1.92*
Off Farm Income 0.063 0.061 1.02
Farm Size 0.169 0.081 2.08*
Livestock Holding 0.182 0.037 4.89***
Adoption 0.226 0.085 2.65***
*Significant at the 10% level, ** Significant at the 5% level, *** Significant at the 1% level
Source: Authors‟ estimates based on 2018 survey
As the result indicated, each additional number of years on education status of household head
decreases the probability of selling the product on market by 0.03. In support of this finding,
Paul and Mauch (2017) showed that the probabilities of market participation by farmers who
produce improved chickpea were reduced by 0.5%. This might indicate that educated household
heads have their earnings from employment that they barely participate in market transaction. In
contrary to this result, the study done Justus et al (2015), the likelihood of becoming commercial
oriented, increased by 5% for every additional year of education attained by the household head.
It revealed education level increases many household heads becomes more commercial oriented
and focus on commercial production to make profits.
Labor productivity negatively affected commercialization status that increment in number of
households in a productive age groups decreased market participation by 0.33. This might be due
to the fact that productive member are those that could generate their own income, independent
of the family, as a result the household becomes relieved from the burden of providing to its
dependants by way of product sale. Contrary to this result, other literatures show that

55
availability of larger family labor for agriculture affects the likelihood of being a net seller in
crop markets positively (Tigist, 2015; Abafitaet al, 2016).
Distance to the nearest market negatively affected commercialization status of the farming
households by 0.02. A study by Kirui and Njiraini (2013), and Justus (2015) stated that market
participation was negatively influenced by market distance the ultimate cause to be the
transaction costs associated with time taken to reach markets outweighed the benefits of market
participation.
Market information positively influenced commercialization that having information about
market transaction increased the tendency of presenting agricultural products to market by 0.28.
A study done by Justus et al (2015) confirmed the great importance of market information in
farming since it informs the farmers about the market prices and potential buyers, thereby
facilitating decisions on the quantity and quality to sell.
Dwelling inkebeles that have vehicular road showed positive influence that it increased
commercialization by 0.27. In support of this finding, all-weather road increased market
participation by 0.54 (Abafitaet al, 2016). Rural infrastructure is severely limited inEthiopia
where, nearly half of the rural population does not have access to all weatheredroads which are
conducive for vehicular transportation. This highly challenges appropriate, even, long distance
trades. Thus, around 72 percent of the grain production is retained for on-farm use
(Gabremadhin, 2001).
Each unit increment in the amount of farm size in hectare brought significant increment in
households‟ commercialization status by 0.17. This was empirically justified by a number of
studies Possession of large farms is helpful to produce surplus as a result households easily
become market oriented compared to smaller ones. (Marteyet al, 2012: Justus, 2015).
Livestock possession influenced commercialization positively that it bring about 0.18 increment.
Livestock endowment strongly determines either the net position households assume in live
animal market (Moti and Birhanu, 2012) or it brings economic empowerment as a result the
households will be enabled to adopt yield enhancing technologies to attain surplus.
Agricultural technology adoption showed positive relationship with commercialization that the
tendencies of commercializing farm goods were increased by 0.23 for those who adopt

56
technology. The use of productivity enhancing inputs will improve the ability of smallholder
farmers to produce sufficient marketable surplus (Kirimiet al, 2013; Paul et al, 2017). To take it
further, application of high-yielding varieties increases surplus crop production by 7.39% per
year, whereas chemical fertilizer use increases surplus by 2.32%. When farmers apply the two
inputs jointly, marketed surplus increases by 6% which establish the complementarity of the two
technologies (Tigist, 2017).

57
5. CONCLUSION AND RECOMMENDATION
5.5. Summary and conclusion
This study was conducted to identify impact of agricultural technology adoption on agricultural
productivity, level of commercialization and household food security status of farming
households; and also to examine determinants of technology adoption, commercialization,
household dietary diversity and level of food insecurity of rural farming households in
BorichaWereda, Sidama Zone southern Ethiopia. Both primary and secondary sources were used
to carry out the study. A total of 334 household heads from the wereda were selected by random
sampling method from three kebeles of the city. The descriptive statistics results showed that out
of the total respondents, 66% of them adopted agricultural technology while 34% of did not.
The t- test showed that there was a significant difference between adopters and non-adopters in
terms of household labor whose age less than 14 and whose age in between 14 and 65, partner
education status, livestock holding (TLU), farm size, productivity, commercialization, nearest
market distance and dietary diversity score. The chi-square test also revealed a significant
difference between adopters and non-adopters in terms of sex, marital status, off farm income,
adoption by neighbor, information about new technology, usage of mobile phone, market
information, union membership, having access to vehicular road, household level of diet
diversity and food insecurity experience score.
Propensity score matching model (PSM) was employed to examine impact of agricultural
technology adoption on outcome variables of productivity, commercialization, household level
of dietary diversity and food insecurity experience. The model showed statistically significant
influence on the upper mentioned outcome variables.
The result revealed that adoption positively influenced productivity, commercialization and
household dietary diversity. While it showed negative relationship with sever food insecurity
experience. This is due to the fact that adoption of agricultural technology exacerbates market
participation as a result of surplus brought by huge productivity which in turn leads to the active
market participation, and by then households would have enough financial strength to secure its
food possession both qualitatively and quantitatively.
Logitic regression model was used to identify factors affecting agricultural technology adoption.
Variables such as adoption by neighbor, technology information, mobile usage, livestock holding

58
and farm size were found to have positive effect on technology adoption, while family size
showed negative relationship with adoption.
All being a tool to assume information about new technology, attributes like neighbor‟s
technology, information about new technology and mobile usage showed role play. It enables
farmers to learn the existence as well as the effective use of technology and this facilitates its
adoption due to the fact that farmers will only adopt the technology they are aware of or have
heard about it. Therefore, access to information reduces the uncertainty about a technology‟s
performance hence may change individual‟s assessment from purely subjective to objective over
time.
Livestock holding positively affected adoption status of households. This is due to the fact that
livestock provides manures as main compost used by farmers for crop production in rural areas
as a result increase in the number of livestock owned would improve the crops productivity and
hence increases the marketable surpluses. Commercializing farm output eventually brings
economic empowerment as a result the farmer could have enough money to buy new yield
enhancing technologies.
Farm size also exhibited a positive relationship with technology adoption. This is due to the fact
that farmers with large farm size are likely to adopt a new technology as they can afford to
devote part of their land to try new technology unlike those with less farm size.
Family size showed negative relationship with adoption. This might be due to the fact that large
families pressured by the need to provide more food for family consumption than spending their
money trying out new technologies.
Multinomial logitic regression model was used to identify factors affecting those households
who adopt and commercialize; those who adopt but do not commercialize; and those neither
adopt nor commercialize their product. Adoption at the same time commercialization was
positively affected by factors like off farm income, farm size and livestock holding. This is
probably due to the fact that increments in cultivated land size boost production of crops which
in turn makes surplus marketing possible.
This can be further exasperated by having high amount of livestock, as their excreta could be
used as compost to intensify yield. And also, off farm employment provides the family with

59
good some of finance and reduce burden, as a result the household will be able to buy new
technologies, and also their market share over in home consumption tend to increase. Adopters
but not commercializes are challenged by marital status, family size and livestock holding
because of the burden of nursing dependants and limited number of cattle but, because of
enormous farm size, households, even though non-adopters will be able to present their produce
to market.
Tobit regression model was employed in order to identify factors affecting commercialization
status of households. Households‟ commercialization status was negatively affected by ratio of
productive labors and market distance. Labor productivity negatively affected commercialization
status. This might be due to the fact that productive member are those that could generate their
own income, independent of the family, as a result they might not be interested to involve in
market transaction. And also, very far households from the market center might find market
vending very tedious.
Commercialization was positively influenced by market information, vehicular road, farm size,
livestock holding and technology adoption. Market information has great importance in farming
since it informs the farmers about the market prices and potential buyers etc. The rural
population does not have access to all weatheredroads which are conducive for vehicular
transportation. This highly challenges appropriate, even, long distance trades. Therefore, having
vehicular road will facilitate market transaction. Possession of large farm is helpful to produce
surplus as a result households easily become market oriented. Its effect was escalated by
livestock possession and technology adoption. The use of productivity enhancing inputs
improved the ability of smallholder farmers to produce sufficient marketable surplus.
Ordered logit regression model was used to identify determinants of household dietary diversity
and food insecurity experience. Marital status, livestock holding and technology adoption
showed its contribution for consumption of high diversity diet, at the same time reducing eating
medium to low diversity food. These might be due to the fact that women as marriage partner,
involve in food preparation, food selection is therefore expected to be influenced by women`s
knowledge regarding nutritional benefits of different foods and their power to allocate household
family budgets towards high quality foods. The herd size being a proxy for farmer‟s resource
endowment, larger holding increases household‟s income level and this in turn could be used to

60
purchase diversified items of food from market. And at last, but not the least, productivity
enhancing inputs bring food and monetary sufficiency as a result what they produce they eat,
what they lack they buy to diversify their diet.
Maximum education with in the household, marital status, family size, productive labor and
technology adoption had negative relationship with severe food insecurity as a result it reduce it
and in turn promote moderate and mild food insecurity working its way towards security. The
opposite is true for old household head‟s. The remaining possible explanations are; education is
an instrument to develop their skills how to use and control farm lands, apply farm inputs and
adopting new technologies, applying family planning, and drive away food insecurity; household
led by married parents support each other all their way to food sufficiency; additional household
members' shares the limited resources that leads to resource exhaustion and foodinsecure; self-
supporting household member within the household would promote food security; and adopting
yield enhancing farm inputs is likely to increase productivity, as a result it tend to decrease the
probability of being food insecure.

61
5.6. Recommendations
The following recommendations have been forwarded based on the results of the research.
o Adoption of yield enhancing agricultural technologies has great impact on enhancement
of farm productivity, initiating market participation, alleviating food insecurity
experience and improving dietary diversity. Its multidimensional impact worthy of
consideration to be incorporated in policy intervention by NGOs or government designed
projects. It is evident that technological package distribution has been insufficient in the
study area. Therefore, above all, care taking institutes, especially BoANRD of
borichaweredaand AGP‟s should work extra hard to actualize satisfactory distribution of
the package, not just in term coverage but also in terms of extent as per the need of the
farming system.
o Technology adoption showed positive impact on food security status of farming
households. Comparatively, its impact on dietary diversity seems better than its impact on
alleviating severe food insecurity. Even though households adopt technology, there are
still those who consume medium to low diversity diet. This is due to the fact that
adoption enhance productivity, but the ability to consume balanced diet is might be the
matter of nutrition education. Along with the package of yield enhancing technologies,
the food security issue will be addressed by nutrition education. Therefore, the package
should be accompanied by health education.
o Technology adoption is affected by determining factors highly relate to information and
asset possession like livestock holding and farm size. Information played great role on
household‟s condition of technology adoption. Development agents of the wereda or
other project officers should give maximum attention to dissemination of information
about any new technology at door.
o In some cases, even though households adopt and commercialized at the same time, their
food security situation was greatly challenged by the number of people under their
shelter. The issue of food security could not be solely dealt by farm activities so that
family planning has to take its place. Even more, an opportunity of employment has to be
created by the regional government as it helps in the battle with food insecurity.
Therefore, bureau of family guidance together with wereda administration has to work
closely.

62
o Market participation tendency of farmers were positively influenced by vehicular road
access. It true those rural areas, the majority of rural kebeles of borichawereda, were
disadvantaged of all weatheredroads which are conducive for vehicular transportation.
This highly challenges appropriate, even, long distance trades since vehicular road will
facilitate market transaction. Therefore, the responsible authority should work on this
matter as it greatly help to improve holistic feature of rural life, most importantly food
security.

63
Reference
Abafita, J., Atkinson, J. andKim, C.S. (2016)Smallholder Commercialization in Ethiopia: Market
Orientation and Participation International Food Research Journal 23(4): 1797-1807
AbduselamAbdulahi (2017). Food Security Situation in Ethiopia: A Review Study. International Journal
of Health Economics and Policy. Vol. 2, No. 3, pp. 86-96.
Agada, M. O. and E. M. Igbokwe.(2015) Dietary Diversity of Rural Households in North Central
Nigeria.European Journal of Nutrition & Food Safety Vol 5(3): 150-155
Ahmed F. F., Eugene, C. E. and Abah, P. O. (2015) Analysis of Food Security among Farming
Households in Borno State, Nigeria.Journal of Agricultural Economics, Environment and Social Sciences
vol 1(1):130–141
Ahmed, T.(2017).Impacts of Agricultural Commercialization on Smallholder Farmers in South-western
Region of Bangladesh.International Journal of Economics, Commerce and Research (IJECR). Vol. 7(2):
33-40.
Aman Tufa, Adam Bekele and Lemma Zemedu (2014) Determinants of Smallholder Commercialization
of Horticultural Crops in Gemechis District, West Hararghe Zone, Ethiopia African Journal of
Agricultural Research Vol. 9(3): 310-319.
Angula, M. (2010).Determinants of sustainable coffee marketing channel choice and supply response
among organic and certified smallholder farmers: Evidence from Uganda. MSc thesis submitted to
Michigan State University.
AssefaAdmassie and GezahegnAyele(2010).Adoption of Improved Technology in Ethiopia.Ethiopian
Journal of Economics, 1(5): 155-178.
ATA (2014).Transforming Agriculture in Ethiopia.Annual Report. Addis Ababa, Ethiopia.
Ballard, T.J., Kepple, A.W. &Cafiero, C. (2013).The food insecurity experience scale:development of a
global standard for monitoring hunger worldwide.Technical Paper. Rome, FAO. (available
athttp://www.fao.org/economic/ess/ess-fs/voices/en/).
BirhanuGedif, TegegnMolla, Solomon Addisu and YibeltalAyenew (2016).Status of Agricultural
Innovations, Innovation Platforms, and Innovations Investment.2015 PARI project country report:
Federal Democratic Republic of Ethiopia.Forum for Agricultural Research in Africa (FARA), Accra
Ghana.
BoANRD (Bureau of Agriculture and Natural Resource Development). (2016). „Regional Population
Projection‟:unpublished document, BorichaWereda, Sidama Zone.
Braun, J. (1995). Agricultural Commercialization: Impacts on Income and Nutrition and Implications For
Policy. Food Policy, 20(3), 187-202.
Caliendo, M. and Hujer, R. (2008).“The Microeconometric Estimation of Treatment Effects- An
overview”, Bonn, IZA publications.
Carletto, C., Corral, P. and Guelfi, A. (2017). Agricultural commercialization and nutrition revisited:
Empirical evidence from three African countries. Food Policy (67) 106–118

64
CSA (Central Statistical Agency) and OPCC (Office of the Population Census Commission) (2015).The
2007 Population and Housing Census of Ethiopia: Statistical Report for Southern Nations, Nationalities
and Peoples’ Region; Part I: Population Size and Characteristics,Ethiopia.
Dauda, AW.,Oladoja, MA., Aderinto, A. (2014). Effects of Fadama III Projects on Youth Empowerment
Schemeon Cow-pea Production in Iseyin Local GovernmentArea of Oyo State: Annals of Child and
Youth studies: Academic Journal of the NationalResearch and Development Network of children
andYouth in Agriculture Program in Nigeria, vol 51 (78).
DegnetAbebaw and MekibibHaile. (2013). The Impact of Cooperatives on Agricultural Technology
Adoption: Empirical Evidence from Ethiopia. Food Policy (38): 82-91.
DegyeGoshu, Belay Kassa and MengistuKetema (2013) Measuring Diet Quantity and Quality
Dimensions of Food Security in Rural Ethiopia.Journal of Development and Agricultural Economics Vol.
5(5) :174-185
Diskin, P. (1999) Agricultural Productivity Indicators Measurement Guide. Arlington, Va.: Food
Security and Nutrition Monitoring (IMPACT) Project, ISTI, for the U.S. Agency for International
Development.
Elemasho M.K., S.D.Y. Alfred, C.C. Aneke, A.J.C. Chugali and O. Ajiboye (2017) Factors Affecting
Adoption of Post-Harvest Technologies of Selected Food Crops in Rivers State, Nigeria. International
Journal of Agricultural Economics and Extension. Vol. 5 (5):295-301.
ERCS. (2008). Vulnerability and Capacity Assessment Report: conducted inBorichaWoreda.Sidama
Zone, SNNPR
ErmiasAssefa (2011)Severity and Determinants of Rural Households FoodSecurity Status: The Case of
AngolelanateraWoreda, North Shewa Zone, Amhara National Regional State,Ethiopia. MSc Thesis
Submitted to Haramaya University
EshetuSeid (2011) Determinants of Farm Household Poverty: The Case of Lay Gayint District South
Gonder Zone, Amhara Regional State. An MSc Thesis presented to the School of Graduate Studies of
Haramaya University.
FANTA. (2006).Developing and Validating Simple Indicators of Dietary Quality and Energy Intake of
Infants and Young Children in Developing Countries: Summary of findings from analysis of 10 data
sets.Working Group on Infant and Young ChildFeeding Indicators.Food and Nutrition Technical
Assistance (FANTA) Project,Academy for Educational Development (AED), Washington, D.C.
FAO. (1989). „Horticultural marketing: a resource and training manual for extension officers‟, Rome.
FAO (2015).Food and Agricultural Organization.The State of Food Insecurity: Report 2015 Food and
Agricultural Organization, Rome, Italy.
FAO, IFAD and WFP (2015).The State of Food Insecurity in the World: Meeting the 2015 international
hunger targets: taking stock of uneven progress. Rome, FAO.
FAO, IFAD, UNICEF, WFP and WHO. (2017). The State of Food Security and Nutrition in the World
2017. Building resilience for peace and food security. Rome, FAO.
65
Feleke, S.T., R. L. Kilmer and C.H. Gladwin (2003) „Determinants of Food Security in Southern Ethiopia
at the Household Level‟ Agricultural Economics 33(3): 351-363.
Gebremedhin, B., M. Jaleta, and D. Hoekstra (2009).Smallholders, Institutional Services, and
Commercial Transformation in Ethiopia.Agricultural Economics 40 (S1):773–787.
Govereh, J., Jayne, T.S. and Nyoro, J. (1999). Smallholder commercialization, interlinked markets and
food crop productivity: Cross country evidence in eastern and southern Africa.
Gujarati, D. (1995). Basic econometrics. 3rd (ed).McGraw-hill, Inc., New York.
Gujarati N.D. (2004). Basic Econometrics: 4th Edition. McGraw-Hill companies.
HailuBeyene. (2008). Adoption of improved Teff and Wheat Production Technologies in Crop Livestock
Mixed Systems in Northern and Western Shewa Zones of Ethiopia.DoctoralDissertation.University of
Pretoria. Pretoria, South Africa.
Hamilton, L. C. (2013). Statistics with Stata: Updated for Version 12. 8th ed. Boston: Brooks/Cole.
Hazell, P., Poulton, C., Wiggins, S. and Dorward, A. (2007).The future of small farms for poverty
reduction and growth. 2020 Discussion paper No. 42, IFPRI.
Heckman, J., Hidehiko, I., and Petra, T. (1997).“Matching as an Econometric Evaluation Estimator:
Evidence from Evaluating a Job Training Program.”Review of Economic Studies 64 (4): 605–54.
Hoddinott, J. &yohannes, y. (2002).Dietary diversity as a food security indicator.FANTA 2002,
Washington DC. (available at http://www.aed.org/Health/upload/ dietarydiversity.pdf)
IFAD (International Fund for Agricultural Development).Rural Poverty
Portal.http://www.ruralpovertyportal.org/region/home/tags/africa.
Hussaini Y.I, Segun S.A. and Hassan I. I. (2016)Determinants of Food Insecurity among Farming
Households in Katsina State, North Western Nigeria: An Ordinal Logit Regression Approach. Journal of
Agricultural Science, Vol. 61(3):291-301
International Food Policy Research Institute. (IFPRI) (2017). 2017 Global Food Policy Report.
Washington, DC: International Food Policy Research Institute.
Ismael Mohammed, WondaferahuMulugeta and BelaynehKassa. (2017). Impact of Commercialization on
Rural Households‟ Food Security in Major Coffee Growing Areas of South West Ethiopia: The Case of
Jimma Zone. International Journal of Economics & Management Sciences, vol 6 (4).
Justus, O., Owuor, G., Ouma, E. and Knerr, B. (2015, August 8-14). Agricultural commercialization and
household food security: The case of smallholders in Great Lakes Region of Central Africa. Paper
Presented at International Conference of Agricultural Economist (ICAE), Kampala, Uganda.
Kabiti, H.M., N.E. Raidimi, T.K. Pfumayaramba, and P.K. Chauke (2015) Determinants of Agricultural
Commercialization among Smallholder Farmers in Munyati Resettlement Area, Chikomba District,
Zimbabwe Journal of human ecology (Delhi, India) (publication volume not specified)
KidaneWelde, Maetz, M., and Dardle,P. (2006). Food Security and Agricultural Development in Sub-
Saharan Africa - building a case for more public support, FAO, Rome.

66
Kirimi, L., Gitau, R. and Olunga, M. (2013, April).Household Food Security and Commercialization
among Smallholder Farmers in Kenya.A paper prepared for the 4th International Conference of the
African Association of Agricultural Economists.Nairobi, Kenya
Kirui, O. K. and Njiraini, G. W. (2013, September 22-25).Determinants of agricultural commercialization
among the rural poor: Role of ICT and Collective Action Initiatives and gender perspective in Kenya.
Paper prepared for the 4th Conference of AAAE. DiarLemdina Hotel – Hammamet, Tunisia.
Lawin, K.G. and Zongo, W.J. (2016) Factors influencing smallholder cropcommercialization: Evidence
from Côte d‟Ivoire. African Journal of Agricultural Research, vol. 11(41): 4128-4140.
Long, S. J., &Freese, J. (2003).Regression models for categorical dependent variables using STATA. A
Stata Press Publication. STATA Corporation. College Station: TX.
Maddala, G.S. (1983). Limited dependent and qualitative variables in econometrics.Cambridge
University press, U.S.A.
Magrini, E. and Vigani, M. (2015). Technology adoption and the multiple dimensions of food security:
the case of maize in Tanzania. 19 th International Conferenc eof Agricultural Economics ICAE
Agriculture in an interconnected world. Milan, Italy.
Malumfashi, A. H. and Kwara, M. A. (2013).Agricultural Commercialization and Food Security in
Nigeria.International Journal of Advanced Research in Management and Social Sciences.Vol. 2 (7).
Martey, E., Al-Hassan, R. M.andKuwornu, J. (2012). Commercialization of smallholder agriculture in
Ghana: A Tobit regression analysis. African Journal of Agricultural Research Vol. 7 (14), pp. 2131-2141.
Maxwell, S. and T.R., Frankenberger, 1992.Household Food Security: Concepts, Indicators
andMeasurements.A Technical Review. United Nation Children's Fund and International Fund for
Agricultural Development, New York and Rome
McDonal, J.H. (2014). Handbook of Biological Statistics: Third Edition. University of Delaware.
Baltimore, Maryland, U.S.A.
MengistuKetema, DegefuKebede, NigussieDechassa and FeyisaHundessa (2016) Determinants of
Adoption of Potato Production Technology Package by Smallholder Farmers: Evidences from Eastern
Ethiopia.Review of Agricultural and Applied Economics.VolXIX (2) : 61–68.
MesfinKebede (2010) Determinants of Urban food security in Ethiopia: The case of Harar Town. M.Sc.
Thesis presented to the School of Graduate Studies of Alemaya University.
MisginaAsmelash (2014) Rural Household Food Security Status and Its Determinants: The Case of
LaelaymychewWoreda, Central Zone of Tigrai, Ethiopia. Journal Of Agricultural Extension And Rural
Development Vol. 6(5): 162-167
MoARD.(2010). Ethiopia’s Agricultural Sector Policy and Investment Framework (PIF) 2010-
2020.Ministry of Agriculture and Rural Development, Addis Ababa, Ethiopia.
MoFED. (2010). Growth And Transformation Plan. Addis Ababa: MOFED.

67
MoFED. (2012). Ethiopia’s progress towards eradicating poverty: An interim report on poverty analysis
study. Addis Ababa, Ethiopia.
MahMoud, E. (undated) The Role of Science and Technologyin Enhancing Food Security. Arab
Environment: Food Security.
Moti, J. and Berhanu, G. (2012).Interdependence of smallholders‟ net market positions in mixed crop-
livestock systems of Ethiopian highlands. J. Dev. Agric. Econ. 4(7):199-209.
NegaGebresellasssie and Senders, H. (2006).Farm-level adoption of sorghum technologies in Tigray,
Ethiopia.Journal of Agricultural Systems, Vol91(1-2): 122-134.
Nord, M., Andrews, M. and Carlson, S.(2004) Household Food Security in the United States.Food
Assistance & Nutrition Research Program, USA
Nunnally, J. and Bernstein, L.(1994) Psychometric theory. New York: McGraw-Hill Higher, INC.
Nur-Alam, M. (2015) Effect of Farmers Socio-economic
towardAdoptionLevelofAgriculturalTechnologyinSigiRegencyIndonesia.Journal ofApplied
Sciences15(5):826-830.
Obisesan, A. A. (2015) Causal Effect of Off-Farm Activity and Technology Adoption on FoodSecurity in
Nigeria. Agris on-line Papers in Economics and Informatics Volume VII (3).
Paul, M., Tabe, O., and Mausch, K. (2017, September 20-22).Impacts of Improved Chickpea Adoption on
Smallholder Production and Commercialization in Ethiopia.Conference on International Research on
Food Security, Natural Resource Management and Rural Development organized by the University of
Bonn, Bonn, Germany.
Paxton, KW., AK., Mishra, S. Chintawar, RK., Roberts., and JA Larson (2011).Intensify of Precision
Agricultural Technology Adoption by Cotton Producers. Agri. Resour.Econ. Rev Vol 40:133-144.
Pingali, L.P. and Rosegrant, M.W. (1995). Agricultural Commercialization and Diversification: Process
and Polices. Food Policy 20(3):171–185.
Quisumbing, A., Brown, L., Haddad, L. and Meizen-Ruth, D. (1998) Agriculture and Environment:
Perspectives on Sustainable Rural Development,The World Bank, Washington, DC, USA.
Ramakrishna, G. and DemekeAmare. (2002).An Empirical Analysis of Food Insecurity in Ethiopia: the
case of North Wello.Africa Development, 27 (1 & 2).
Rogers, E. (1962). Diffusion of Innovations (1st Ed). New York: Free press.
Rogers, E. (1995). Elements of Diffusion in Diffusion of Innovations, (4th Ed). New York, Press
Rogers, B.L. (1996) TheImplications of Female Household Headship for Food Consumption and
Nutritional Status in the Dominican Republic. World Development, Vol. 24 (1): 113-28.

68
Rosenbaum, P.R. and Rubin, D.B. (1983).Constructing a Control Group Using Multivariate Matched
Sampling Methods that Incorporate the Propensity Score. The American statistician.
Sadoulet, E., De Janvry, A. (1995). Quantitative Development Analysis.The Johns Hopkins University
Press, Baltmore, Maryland, USA.
Sokoni, C.H. (2008). Commercializationof Smallholder Production in Tanzania: Implications for
Sustainable Resources Management. Geogr. J. 174(2):158-161.
Solomon Asfaw, BekeleShiferawand Simtowe, F. (2010) Does Technology Adoption Promote
Commercialization? Evidence from Chickpea Technologies in Ethiopia.International Crops Research
Institute for the Semi-Arid Tropics (ICRISAT), UN Avenue, Nairobi, Kenya.
Solomon Asfaw, BekeleShiferaw, Simtowe, F. and MossiaHagos.(2011). Agricultural Technology
Adoption, Seed Access Constraints and Commercialization in Ethiopia.Journal of Development and
Agricultural Economics, 3(9): 436-447.
Strasberg, P. J., Jayne, T. S., Yamano, T., Nyoro, J., Karanja, D. and Strauss, J. (1999). Effects of
Agricultural Commercialization on Food Crop Input Use and Productivity in Kenya. Working Papers No.
71. Michigan State University International Development. Michigan, USA.
Swindale, A. and Bilinsky, P. (2006).Household Dietary Diversity Score (HDDS) for Measurement
ofHousehold Food Access: Indicator Guide (v.2). Washington, D.C.
TayeTesfaye (2014) Determinants of Food Security of Pastoral and Agro-pastoral Households: The Case
of Gode District,Shebele Zone of Somali Regional State, Ethiopia. Msc Thesis Submitted to School of
Agricultural Economics and Agribusiness, HaramayaUiniversty
TigistMekonnen (Working Paper No. 2015).Agricultural Technology Adoption and Market Participation
under Learning Externality: Impact Evaluation on Small-scale Agriculture from Rural Ethiopia. UNU-
MERIT, Maastricht
TigistMekonnen (2017) Agricultural Intensification and Market Participation under Learning
Externality: Impact Evaluation on Small-scale Agriculture. Maastricht University and UNU-MERIT
TigistMekonnen.(2017, February).Working Papers Impact of Agricultural Technology Adoption on
Market Participation in the Rural Social Network System. Maastricht Economic and social Research
Institute on Innovation and Technology UNU-MERIT
USAID (2008).Madagascar Food Security Development programming Framework. Madagascar.
Yamane, T. (1967). Statistics: An introductory Analysis, 2nd
Ed., NY: Harper and Row, page 258.
Yu, B., and A. Nin-Pratt.(2014). Fertilizer adoption in Ethiopia‟s Cereal Production.Journal of
Development and Agricultural Economics, 6(7): 318-337.
ZelekeAfato, AndargachewGidebo and YosephHalala. (2016). Determinants of Food Security in Rural
Households Intervened with Food Security Programme: The Case of BorichaWoredain Sidama Zone,
Southern Ethiopia.Journal of Biology, Agriculture and Healthcare. Vol.6,(5).

69
APPENDICES
Appendix 1: Survey questionnaire
ADDIS ABABA UNIVERSITY
COLLEGE OF DEVELOPMENT STUDIES
CENTER FOR FOOD SECURITY STUDIES
REGULAR PROGRAM
Dear respondent,
Your response to this Questionnaire will serve as source of information to the research paper to be
done for thesis entitled ‘Agricultural Technology Adoption, Commercialization and Food
SecurityLinkage: Micro Evidence from BorichaWereda, Sidama Zone Ethiopia’. Any response you
provide here is strictly confidential and will be used exclusively for the research purpose. No
individual‟s responses will be identified as such and the identity of persons responding will not be
published or released to anyone. Your honesty in responding the right answer is vital for the research
outcome to be reliable. Thank you in advance for your kind cooperation and dedicating your time.
Sincerely,
TagelAlemuTafese
A. PRODUCER’S CHARACTERISTICS:
A01 What is the SEX of the household head?
a. Male
b. Female
A02 How old is the AGE of the household head in years? ________
A03 How is EDUCATIONAL STATUS of household head? ___________
A04 How is MARITAL STATUS of the household head?
a. Single
b. Married
c. Widow/Widower
d. Divorced

70
A05 HOUSEHOLD SIZE or people who live under the shadow of the household
head_____
A06 Do you have other employment or OFF FARM INCOME?
a. Yes
b. No
A07 LABOR AVAILABILITY or individuals whose age is;
Age group How many individuals?
Less than 14
B/n 14 and 65
Greater than 65
B. TECHNOLOGY ADOPTION CHARACTERISTICS:
B01 Type of AGRICULTURAL TECHNOLOGY among the list below do you
adopt?
a. Improved seed
b. Fertilizer
c. Both
B02 What kind of IMPROVED SEED? _____________
B03 Does your NEIGHBOR ADOPT technology?
a. Yes
b. No
B04 Do you have ACCESS TO INFORMATION about any agricultural technology?
a. Yes
b. No
B05 Which COMMUNICATION TECHNOLOGY do you use?
Communication tools/
technology
Yes or
No
Mobile
Television

71
Radio
Newspaper
Internet
C. OWNERSHIP OF ASSETS:
C01 LIVESTOCK HOLDING
Livestock Holding How many?
Oxen
Cows
Goat
Sheep
Donkey
Chicken
C02 FARMLAND SIZE ________ hectare
C03 How many hectare is used to grow the improved seed?_________
C04 Do you grow OTHER CROPS like coffee, chat and enset?
a. Yes
b. No
C05 Annual FARM OUTPUT in kilograms (this year)_________
C06 Annual MARKET OUTPUT in kilograms (this year)____________
C07 UNITE PRICE at which each kg of output is normally sold (ETB)__________
D. MARKET ACCESS AND INSTITUTIONAL CHARACTERISTICS:
D01. Amount of CREDIT BENEFITED from microfinance or other
institutions?_______
D02. Do you have access to MARKET INFORMATION?
a. Yes
b. No

72
D03. Are you a MEMBER OF FARMER’S UNION or any other union?
a. Yes
b. No
D04. How many times you have been paid a VISIT BY ANY EXTENSION AGENT
this year?______
D05. Are you beneficiary of productive safety net program (PSNP)?
c. Yes
d. No
D06. MARKET DISTANCE between the residence of the household head and the
nearest market in kilometers.__________
D07. Do you have ACCESS TO VEHICULAR ROAD to convey produce to market?
a. Yes
b. No
E. HOUSEHOLD DIETARY DIVERSITY SCORE (HDDS)
Information on household food consumption should be collected using the previous
24hours as a reference period (24-hour recall).
Questions Scores
1. Any CEREALS sorghum, maize, rice, wheat?
2. Any PULSES and LEGUMES like beans, peas, lentils,or nuts?
3. Any ROOT and TUBERS like ensut, potatoes, yams, cassava or ?
4. Any VEGETABLEs?
5. Any FRUITS?
6. Any MEAT beef, pork, lamb, goat, chicken?
7. Any EGGS?
8. Any FISH?
9. Any DAIRY products like yogurt, milk or other milk products?
10. Any foods made with oil, fat, or butter?
11. Any sugar or honey?
12. Any other foods, such as condiments, coffee, tea?
Yes No
Yes No
Yes No
Yes No
Yes No
Yes No
Yes No
Yes No
Yes No
Yes No
Yes No
Yes No

73
F. HOUSEHOLD FOOD INSECURITY EXPERIENCE SCALE(HFIES)
The questions are provided to gather information within the time frame of the last
6 months; from September to February.
Question Score
E. Was there a time when You wereworried you would not have enough
food to eat because of a lack of money or other resources?
F. Was there a time when you were unable to eat healthy and nutritious
foodbecause of a lack of money or other resources?
G. Was there a time when you ate only a few kinds of foods because of a
lack of money or other resources?
H. Was there a time when you had to skip a meal because there was not
enough money or other resources to get food?
I. Was there a time when you ate less than you thought you should
because of a lack of money or other resources?
J. Was there a time when your household ran out of foodbecause of a lack
of money or other resources?
K. Was there a time when you were hungry but did not eat because there
was not enough money or other resources for food?
L. Was there a time when you went without eating for a whole day
because of a lack of money or other resources?
Yes No
Yes No
Yes No
Yes No
Yes No
Yes No
Yes No
Yes No

74
Appendix 2: Key informant interview
Good morning or afternoon sir/madam.
I am carrying out a study on the Agricultural Technology Adoption, Commercialization and Food
SecurityLinkage. Thank you for having granted me permission to interview you. I would like to
assure you that I will stick to all ethical codes of conduct with regard to conducting research as
stated in my introduction letter.
1. Demographic related questions
a. How the farmer‟s family status is looks like? Who is mostly the head? What about
family size? Are they educated? Is there off farm income opportunity?
b. Which religion is the most dominant in the community?
c. Is there any difference in food consumption habit in terms of the religion type?
2. Technology adoption related question
a. What kind of technology do the farmers adopt?
b. What are those factors that affect technology adoption status of farmers in
Borichawereda?
c. What type of food crop and cash crop do the farmers grow?
3. Commercialization related question
a. Do the farmers present their produce to market?
b. Is there any technology adoption, market related and farming system related support
or training for farmers in the wereda?
4. Food security related question
a. Do you think their food consumption pattern is diversified?
b. What kind of food do the farmers used to consume? Can you list your cultural foods
consumed by the farmers

75
Appendix 3: Adoption status of households
Adoption status Frequency percent Cumulative
Non-adopters 115 34.43 34.43
Adopters 219 65.57 100.00
Total 334 100.00
Appendix 4: chisquare distribution of agricultural technology types in the wereda
Variables
Categorie
s
Sample
proportion
(%)
Percentage distribution
Chi-
square
Adopter
s
Non-adopters
Improved seeds No 34.73 3.45 96.55 0.00***
Yes 65.27 98.62 1.38
Fertilizer No 35.93 5.83 94.17 0.00***
Yes 64.07 99.07 0.93
Appendix 5: Cash crops and Food crops grown in the wereda
Variables
Categories
Percentage distribution
Chi-square Adopters Non-adopters
Do you grow maize? No 12.24 87.76 0.000***
Yes 74.74 25.26
Do you grow haricot
bean?
No 54.22 45.78 0.000***
Yes 75.97 24.03
Do you grow chat? No 67.41 32.59 0.439
Yes 63.35 63.35
Do you grow coffee? No 67.90 32.10 0.299
Yes 62.42 37.58
Do you grow enset? No 91.30 8.70 0.000***
Yes 60.85 39.15

76
Appendix 6: Chisquare distribution of dietary groups in terms of adoption
Food groups
Categorie
s
Sample
proportion
(%)
Percentage distribution
Chi-
square
Adopter
s
Non-adopters
carbohydrate based food No 0% 100.00 100.00
Yes 100% 100.00 100.00
protein based food No 6.59 31.82 68.18 0.001***
Yes 93.41 67.95 32.05
vitamin based food No 16.77 62.50 37.50 0.596
Yes 83.23 66.19 33.81
plant based food No 100% 100.00 100.00
Yes 100% 65.57 34.43
animal based food No 23.05 49.35 50.65 0.001***
Yes 76.95 70.43 29.57
Sea based food No 95.81 94.98 97.39 0.296
Appendix 7: Chisquare distribution of food insecurity experience of households in terms od
adoption
Variables
Percentage distribution
Chi-square Adopters Non-adopters
Households with mild food insecurity 64.60 35.40 0.053*
Households with moderate food insecurity 62.18 37.82 0.005***
Households with severe food insecurity 59.32 40.68 0.011**

77
Appendix 8: Chisquare distribution of household dietary diversity score in terms of adoption
Variables
Categories
Percentage distribution
Chi-
square
Adopter
s
Non-adopters
Any CEREALS like sorghum, maize, rice,
wheat?
No 0.00 100.00 0.000***
Yes 66.97 33.03
Any PULSES and LEGUMES like beans,
peas, lentils,or nuts?
No 36.36 63.64 0.000***
Yes 72.76 27.24
Any ROOT and TUBERS like ensut,
potatoes, yams, cassava or ?
No 100.00 0.00 0.468
Yes 65.47 34.53
Any vegetables?
No 63.64 36.36 0.712
Yes 66.04 33.96
Any FRUITS?
No 67.34 32.66 0.248
Yes 60.47 39.53
Any MEAT beef, pork, lamb, goat,
chicken?
No 64.29 35.71 0.089*
Yes 80.77 19.23
Any EGGS? No 65.77 34.23 0.167
Yes 0.00 100.00
Any FISH?
No 65.00 35.00 0.296
Yes 78.57 21.43
Any DAIRY products like yogurt, milk or
other milk products?
No 51.25 48.75 0.002***
Yes 70.08 29.92
Any foods made with oil, fat, or butter?
No 68.12 31.88 0.617
Yes 68.12 64.91
Any sugar or honey?
No 63.18 36.82 0.043**
Yes 77.19 22.81
Any other foods, such as condiments,
coffee, tea?
No 70.00 30.00 0.765
Yes 65.43 34.57

78
Appendix 9: Likelihood ration of level of food insecurity experience score for ordered logistic
regression model
Appendix 10: Multicollinearity of level of food insecurity experience score for ordered logistic
regression model
/cut2 4.952888 .9318656 3.126465 6.779311
/cut1 2.869547 .8608964 1.182221 4.556873
adopt .4515496 .2509455 1.80 0.072 -.0402945 .9433936
LVSTOK .2338751 .1449856 1.61 0.107 -.0502915 .5180417
FLAND .7569893 .5662881 1.34 0.181 -.352915 1.866894
OFFFARM .2159279 .2522186 0.86 0.392 -.2784115 .7102674
LABOR_productive 1.117978 .6455847 1.73 0.083 -.147345 2.383301
HHSIZE .1955337 .0835622 2.34 0.019 .0317548 .3593125
married 1.252577 .6932129 1.81 0.071 -.1060955 2.611249
MAXEDU .1365375 .0526811 2.59 0.010 .0332845 .2397905
PAREDU -.0575548 .0426884 -1.35 0.178 -.1412225 .0261129
HHEDU .0633657 .0456457 1.39 0.165 -.0260983 .1528297
AGE -.0532087 .0139903 -3.80 0.000 -.0806293 -.0257881
SEX -.1723218 .7950854 -0.22 0.828 -1.73066 1.386017
FOODinsec Coef. Std. Err. z P>|z| [95% Conf. Interval]
Robust
Log pseudolikelihood = -272.18983 Pseudo R2 = 0.1138
Prob > chi2 = 0.0000
Wald chi2(12) = 43.69
Ordered logistic regression Number of obs = 323
Mean VIF 1.77
OFFFARM 1.09 0.919305
FLAND 1.15 0.870983
adopt 1.23 0.814388
LVSTOK 1.29 0.776701
HHSIZE 1.38 0.725029
LABOR_prod~e 1.43 0.699872
AGE 1.52 0.659642
HHEDU 1.65 0.607882
PAREDU 1.67 0.600107
MAXEDU 2.00 0.500911
SEX 3.39 0.295042
married 3.48 0.287450
Variable VIF 1/VIF
. estat vif

79
Appendix 11: Likelihood ration of level of household dietary diversity score for ordered logistic
regression model
Appendix 12: Multicollinearity of level household dietary diversity score for ordered logistic
regression model
/cut2 -2.631434 1.247193 -5.075888 -.1869811
/cut1 -5.218085 1.342798 -7.849921 -2.586249
adopt -2.009905 .5149822 -3.90 0.000 -3.019252 -1.000559
LVSTOK -1.220931 .3729572 -3.27 0.001 -1.951914 -.4899483
FLAND 1.153331 .5762263 2.00 0.045 .0239487 2.282714
OFFFARM -.7910014 .4989106 -1.59 0.113 -1.768848 .1868455
LABOR_productive -6.573148 1.52521 -4.31 0.000 -9.562504 -3.583792
HHSIZE -.0069351 .118301 -0.06 0.953 -.2388007 .2249306
married -3.597811 .8391533 -4.29 0.000 -5.242521 -1.953101
MAXEDU -.0850827 .1136915 -0.75 0.454 -.3079141 .1377486
PAREDU .0435471 .0846718 0.51 0.607 -.1224065 .2095008
HHEDU .0186499 .0803928 0.23 0.817 -.138917 .1762168
AGE .0212353 .0164568 1.29 0.197 -.0110195 .0534901
SEX 2.094595 .9056966 2.31 0.021 .3194626 3.869728
DIETdhh Coef. Std. Err. z P>|z| [95% Conf. Interval]
Robust
Log pseudolikelihood = -113.49911 Pseudo R2 = 0.3297
Prob > chi2 = 0.0000
Wald chi2(12) = 61.32
Ordered logistic regression Number of obs = 334
Mean VIF 1.76
OFFFARM 1.10 0.910320
FLAND 1.15 0.868170
adopt 1.24 0.807357
LVSTOK 1.29 0.776524
HHSIZE 1.36 0.734103
LABOR_prod~e 1.38 0.722327
HHEDU 1.51 0.663690
AGE 1.52 0.657477
PAREDU 1.73 0.576892
MAXEDU 1.94 0.516680
SEX 3.38 0.295819
married 3.47 0.288584
Variable VIF 1/VIF
. estat vif

80
Appendix 13: Likelihood ration of commercialization for tobit regression model
. margins, dydx(*)
0 right-censored observations
112 uncensored observations
Obs. summary: 222 left-censored observations at commerce<=0
/sigma .4008679 .0308814 .3401103 .4616255
_cons -.6284085 .2317957 -2.71 0.007 -1.084455 -.1723615
adopt .2255707 .0852079 2.65 0.009 .0579284 .3932131
LVSTOK .182121 .0372095 4.89 0.000 .1089131 .2553288
FLAND .1690291 .0813058 2.08 0.038 .0090639 .3289943
OFFFARM .0625944 .0612662 1.02 0.308 -.057944 .1831327
VROAD .2656968 .1380681 1.92 0.055 -.0059455 .5373391
DISTANCE -.01664 .0058668 -2.84 0.005 -.0281827 -.0050973
visit .0035166 .0022781 1.54 0.124 -.0009654 .0079986
UNION -.0665791 .1062937 -0.63 0.532 -.2757068 .1425487
MRKTINFO .2796358 .093295 3.00 0.003 .0960824 .4631892
MOBILE -.009121 .0651242 -0.14 0.889 -.1372497 .1190077
LABOR_productive -.3284024 .1820995 -1.80 0.072 -.6866743 .0298695
MAXEDU .0030759 .0120154 0.26 0.798 -.0205637 .0267156
PAREDU .0064244 .0115139 0.56 0.577 -.0162286 .0290774
HHEDU -.0265978 .0112426 -2.37 0.019 -.0487172 -.0044785
AGE -.002091 .003167 -0.66 0.510 -.0083219 .0041398
SEX -.0744517 .1206655 -0.62 0.538 -.3118553 .1629519
commerce Coef. Std. Err. t P>|t| [95% Conf. Interval]
Log likelihood = -145.19917 Pseudo R2 = 0.3021
Prob > chi2 = 0.0000
LR chi2(16) = 125.71
Tobit regression Number of obs = 334

81
Appendix 14: Multicollinearity of commercialization for tobit regression model
Appendix 15: Table of conversion factor to estimate TLU
Animal TLU
Cattle 1
Sheep and goat 0.15
Horse 1
Mule 1.15
Donkey 0.65
Camel 1.45
Poultry 0.005
Source: Ramakrishna and AssefaDemeke, 2002
.
Mean VIF 1.37
visit 1.10 0.909873
OFFFARM 1.10 0.908794
UNION 1.11 0.897648
FLAND 1.15 0.866356
DISTANCE 1.18 0.846051
MOBILE 1.25 0.800337
LABOR_prod~e 1.30 0.766601
MRKTINFO 1.34 0.745186
LVSTOK 1.35 0.742783
SEX 1.35 0.738284
AGE 1.43 0.700624
VROAD 1.48 0.674377
HHEDU 1.59 0.628517
adopt 1.61 0.619954
PAREDU 1.64 0.610739
MAXEDU 1.93 0.517775
Variable VIF 1/VIF
. estat vif