addendum: emerging technologies - brownfields toolbox
TRANSCRIPT

1
Addendum:
Emerging Technologies
For Wastewater Treatment &
In-Plant Wet Weather Management
EPA 832-R-11-002
September 2011
Office of Wastewater Management U.S. Environmental Protection Agency
Washington, D.C.
2
Preface
The U.S. Environmental Protection Agency (U.S. EPA) is charged by Congress with protecting the nation’s land, air, and water resources. Under a mandate of environmental laws, the Agency strives to formulate and implement actions leading to a balance between human activities and the ability of natural systems to support and sustain life. To meet this mandate, the Office of Wastewater Management (OWM) provides information and technical support to solve environmental problems today and to build a knowledge base necessary to protect public health and the environment well into the future.
This publication has been updated to provide current state of development as of the publication date. It is expected that this document will be revised periodically to reflect other advances in this rapidly evolving area. Except as noted, information, interviews, and data development for the Addendum was collected by the EPA. Some of the information, especially related to embryonic technologies, was provided by the manufacturer or vendor of the equipment or technology, and could not be verified or supported by full-scale case study. In some cases, cost data were based on estimated savings without actual field data. When evaluating technologies, estimated costs, and stated performance, efforts should be made to collect current and more up-to-date information.
The mention of trade names, specific vendors, or products does not represent an actual or presumed endorsement, preference, or acceptance by the U.S. EPA or Federal Government. Stated results, conclusions, usage, or practices do not necessarily represent the views or policies of the U.S. EPA. Electronic copies of this addendum and the original emerging technologies document can be downloaded from the U.S. EPA Office of Wastewater Management web site at: http://water.epa.gov/scitech/wastetech/publications.cfm
Recycled/Recyclable Printed with vegetable-based ink on paper that contains a minimum of 50 percent post-consumer fiber content, chlorine free.
3
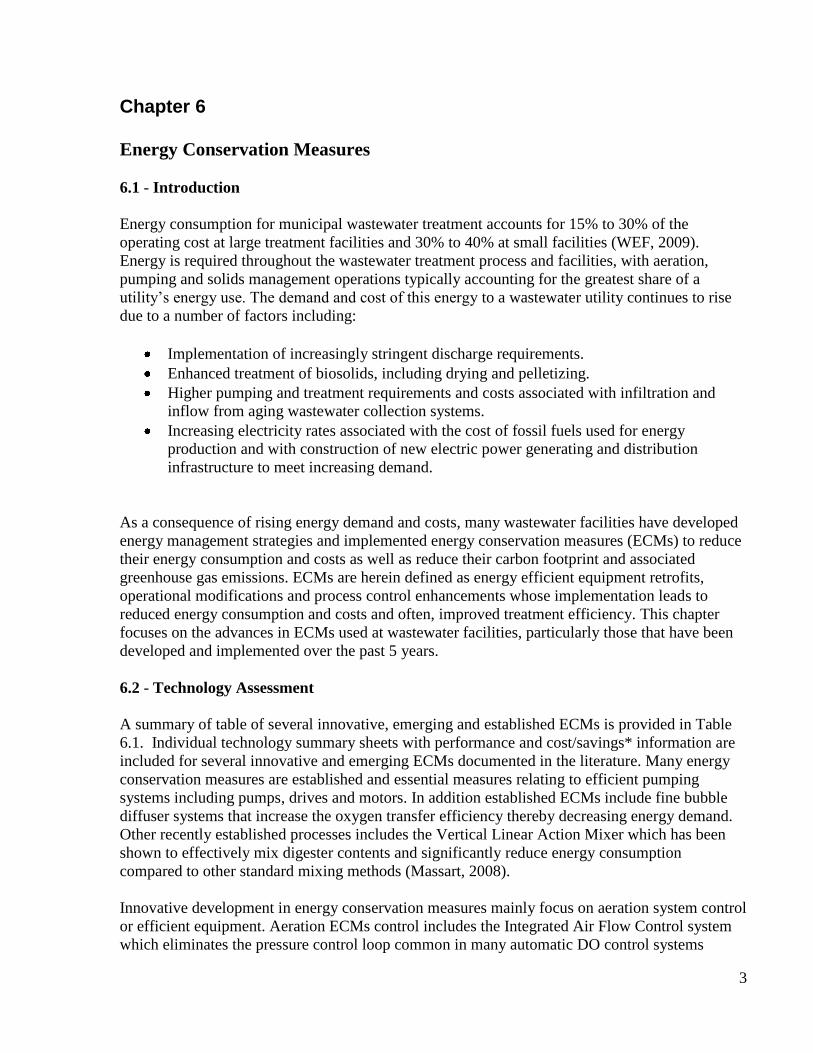
Chapter 6
Energy Conservation Measures
6.1 - Introduction
Energy consumption for municipal wastewater treatment accounts for 15% to 30% of the
operating cost at large treatment facilities and 30% to 40% at small facilities (WEF, 2009).
Energy is required throughout the wastewater treatment process and facilities, with aeration,
pumping and solids management operations typically accounting for the greatest share of a
utility’s energy use. The demand and cost of this energy to a wastewater utility continues to rise
due to a number of factors including:
Implementation of increasingly stringent discharge requirements.
Enhanced treatment of biosolids, including drying and pelletizing.
Higher pumping and treatment requirements and costs associated with infiltration and
inflow from aging wastewater collection systems.
Increasing electricity rates associated with the cost of fossil fuels used for energy
production and with construction of new electric power generating and distribution
infrastructure to meet increasing demand.
As a consequence of rising energy demand and costs, many wastewater facilities have developed
energy management strategies and implemented energy conservation measures (ECMs) to reduce
their energy consumption and costs as well as reduce their carbon footprint and associated
greenhouse gas emissions. ECMs are herein defined as energy efficient equipment retrofits,
operational modifications and process control enhancements whose implementation leads to
reduced energy consumption and costs and often, improved treatment efficiency. This chapter
focuses on the advances in ECMs used at wastewater facilities, particularly those that have been
developed and implemented over the past 5 years.
6.2 - Technology Assessment
A summary of table of several innovative, emerging and established ECMs is provided in Table
6.1. Individual technology summary sheets with performance and cost/savings* information are
included for several innovative and emerging ECMs documented in the literature. Many energy
conservation measures are established and essential measures relating to efficient pumping
systems including pumps, drives and motors. In addition established ECMs include fine bubble
diffuser systems that increase the oxygen transfer efficiency thereby decreasing energy demand.
Other recently established processes includes the Vertical Linear Action Mixer which has been
shown to effectively mix digester contents and significantly reduce energy consumption
compared to other standard mixing methods (Massart, 2008).
Innovative development in energy conservation measures mainly focus on aeration system control
or efficient equipment. Aeration ECMs control includes the Integrated Air Flow Control system
which eliminates the pressure control loop common in many automatic DO control systems
4
leading to more efficient blower operation and reduced energy consumption. Also included is the
Automated SRT/DO Control ECM which uses algorithms to optimize DO and SRT set points and
reduce energy consumption while maintaining process performance. Innovative aeration
equipment include highly efficient turbo blowers which use friction-free bearing designs coupled
with the use of high efficiency motors and integral speed control to achieve high energy
efficiency. Reactor mixing systems are also described including hyperbolic mixers which use a
stirrer located close to the bottom of a tank to promote complete mixing. A pulsed large bubble
mixing is included which achieves mixing requirements and reduced energy consumption by
using short bursts of compressed air instead of mechanical mixers.
5
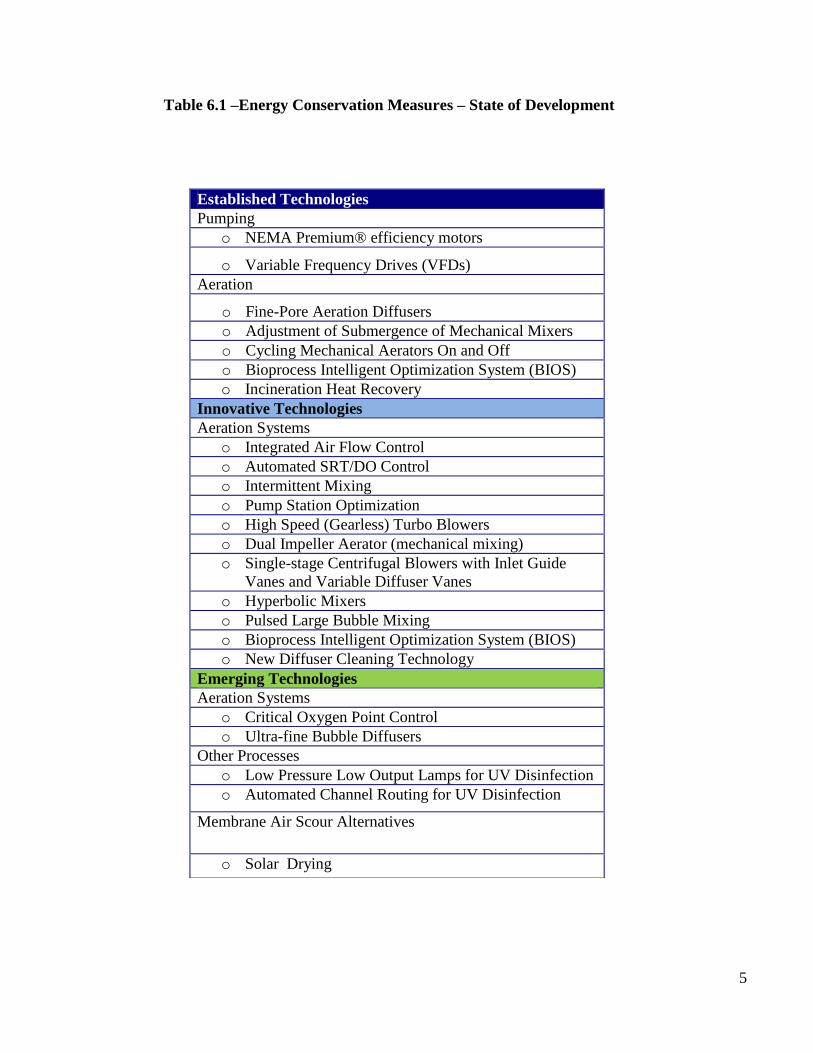
Table 6.1 –Energy Conservation Measures – State of Development
Established Technologies
Pumping
o NEMA Premium® efficiency motors
o Variable Frequency Drives (VFDs)
Aeration
o Fine-Pore Aeration Diffusers
o Adjustment of Submergence of Mechanical Mixers
o Cycling Mechanical Aerators On and Off
o Bioprocess Intelligent Optimization System (BIOS)
o Incineration Heat Recovery
Innovative Technologies
Aeration Systems
o Integrated Air Flow Control
o Automated SRT/DO Control
o Intermittent Mixing
o Pump Station Optimization
o High Speed (Gearless) Turbo Blowers
o Dual Impeller Aerator (mechanical mixing)
o Single-stage Centrifugal Blowers with Inlet Guide
Vanes and Variable Diffuser Vanes
o Hyperbolic Mixers
o Pulsed Large Bubble Mixing
o Bioprocess Intelligent Optimization System (BIOS)
o New Diffuser Cleaning Technology
Emerging Technologies
Aeration Systems
o Critical Oxygen Point Control
o Ultra-fine Bubble Diffusers
Other Processes
o Low Pressure Low Output Lamps for UV Disinfection
o Automated Channel Routing for UV Disinfection
Membrane Air Scour Alternatives
o Solar Drying

6
This page intentionally left blank.
7
Technology Summary
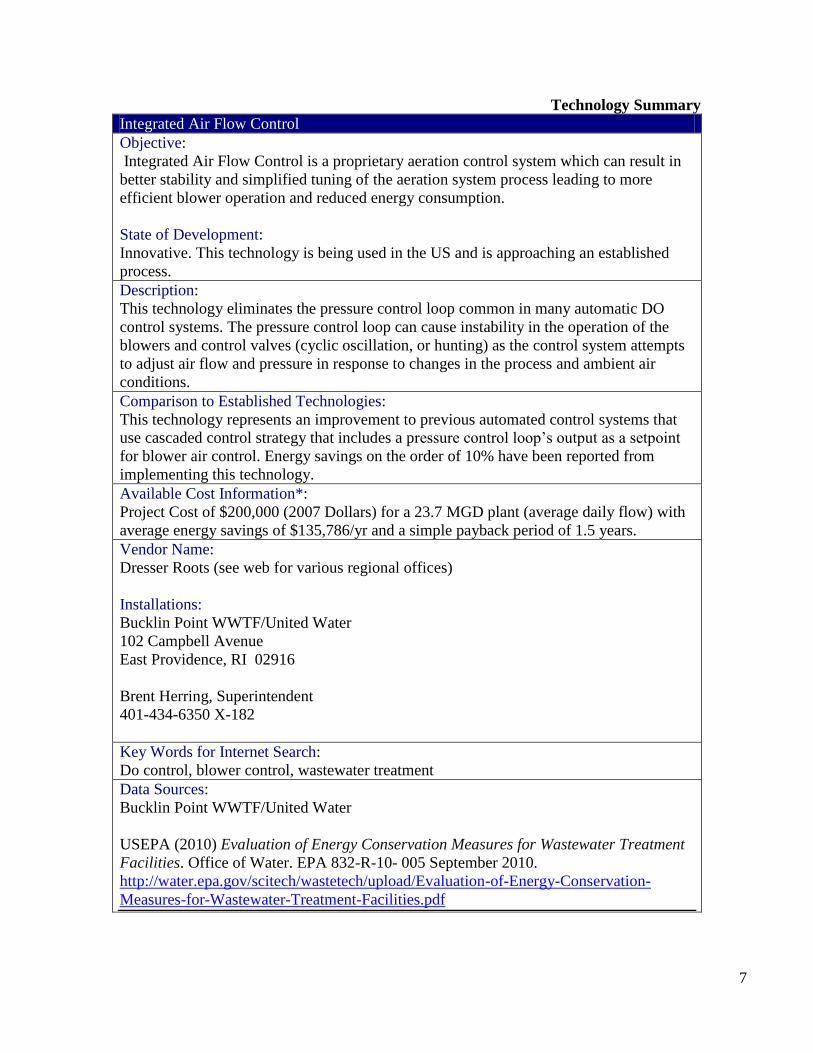
Integrated Air Flow Control
Objective:
Integrated Air Flow Control is a proprietary aeration control system which can result in
better stability and simplified tuning of the aeration system process leading to more
efficient blower operation and reduced energy consumption.
State of Development:
Innovative. This technology is being used in the US and is approaching an established
process.
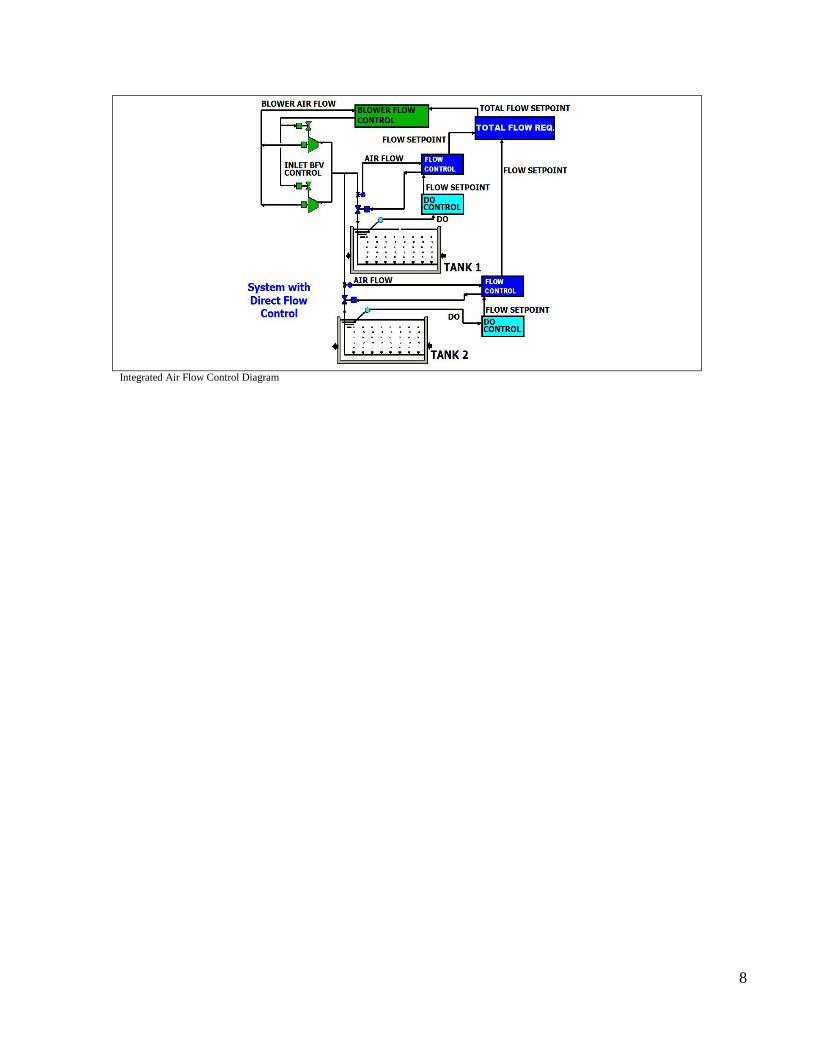
Description:
This technology eliminates the pressure control loop common in many automatic DO
control systems. The pressure control loop can cause instability in the operation of the
blowers and control valves (cyclic oscillation, or hunting) as the control system attempts
to adjust air flow and pressure in response to changes in the process and ambient air
conditions.
Comparison to Established Technologies:
This technology represents an improvement to previous automated control systems that
use cascaded control strategy that includes a pressure control loop’s output as a setpoint
for blower air control. Energy savings on the order of 10% have been reported from
implementing this technology.
Available Cost Information*:
Project Cost of $200,000 (2007 Dollars) for a 23.7 MGD plant (average daily flow) with
average energy savings of $135,786/yr and a simple payback period of 1.5 years.
Vendor Name:
Dresser Roots (see web for various regional offices)
Installations:
Bucklin Point WWTF/United Water
102 Campbell Avenue
East Providence, RI 02916
Brent Herring, Superintendent
401-434-6350 X-182
Key Words for Internet Search:
Do control, blower control, wastewater treatment
Data Sources:
Bucklin Point WWTF/United Water
USEPA (2010) Evaluation of Energy Conservation Measures for Wastewater Treatment
Facilities. Office of Water. EPA 832-R-10- 005 September 2010.
http://water.epa.gov/scitech/wastetech/upload/Evaluation-of-Energy-Conservation-
Measures-for-Wastewater-Treatment-Facilities.pdf
8
Integrated Air Flow Control Diagram
9
Technology Summary
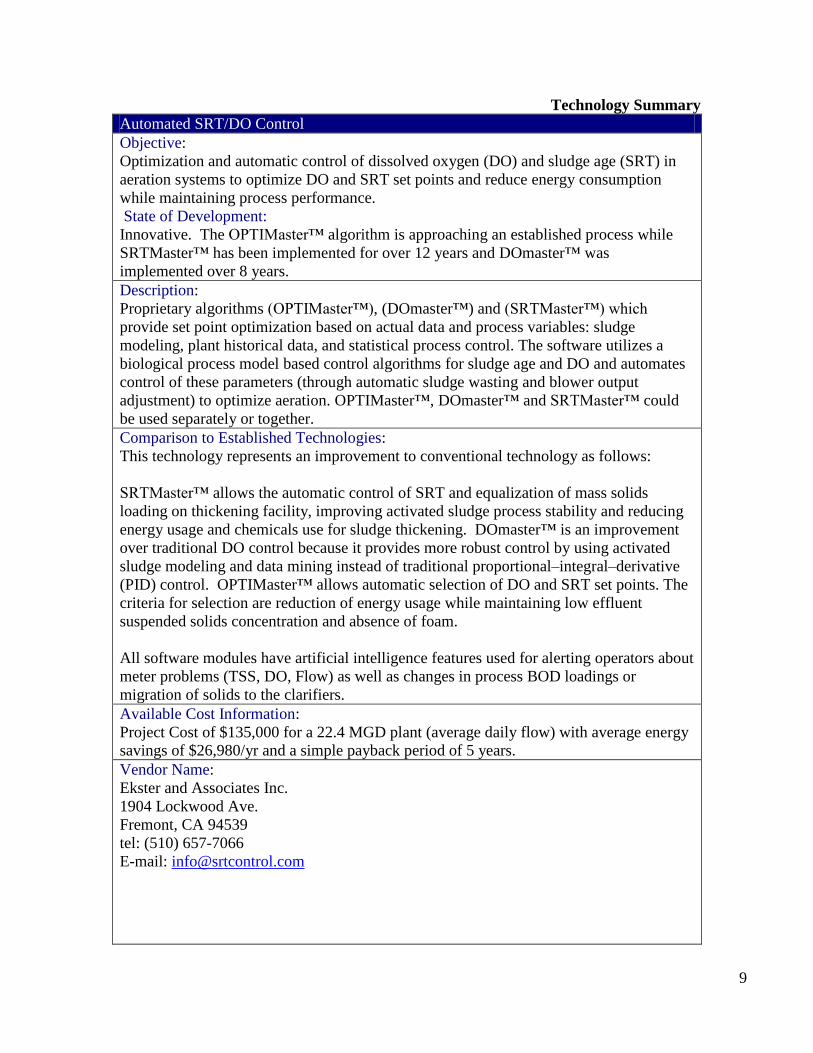
Automated SRT/DO Control
Objective:
Optimization and automatic control of dissolved oxygen (DO) and sludge age (SRT) in
aeration systems to optimize DO and SRT set points and reduce energy consumption
while maintaining process performance.
State of Development:
Innovative. The OPTIMaster™ algorithm is approaching an established process while
SRTMaster™ has been implemented for over 12 years and DOmaster™ was
implemented over 8 years.
Description:
Proprietary algorithms (OPTIMaster™), (DOmaster™) and (SRTMaster™) which
provide set point optimization based on actual data and process variables: sludge
modeling, plant historical data, and statistical process control. The software utilizes a
biological process model based control algorithms for sludge age and DO and automates
control of these parameters (through automatic sludge wasting and blower output
adjustment) to optimize aeration. OPTIMaster™, DOmaster™ and SRTMaster™ could
be used separately or together.
Comparison to Established Technologies:
This technology represents an improvement to conventional technology as follows:
SRTMaster™ allows the automatic control of SRT and equalization of mass solids
loading on thickening facility, improving activated sludge process stability and reducing
energy usage and chemicals use for sludge thickening. DOmaster™ is an improvement
over traditional DO control because it provides more robust control by using activated
sludge modeling and data mining instead of traditional proportional–integral–derivative
(PID) control. OPTIMaster™ allows automatic selection of DO and SRT set points. The
criteria for selection are reduction of energy usage while maintaining low effluent
suspended solids concentration and absence of foam.
All software modules have artificial intelligence features used for alerting operators about
meter problems (TSS, DO, Flow) as well as changes in process BOD loadings or
migration of solids to the clarifiers.
Available Cost Information:
Project Cost of $135,000 for a 22.4 MGD plant (average daily flow) with average energy
savings of $26,980/yr and a simple payback period of 5 years.
Vendor Name:
Ekster and Associates Inc.
1904 Lockwood Ave.
Fremont, CA 94539
tel: (510) 657-7066
E-mail: [email protected]
10
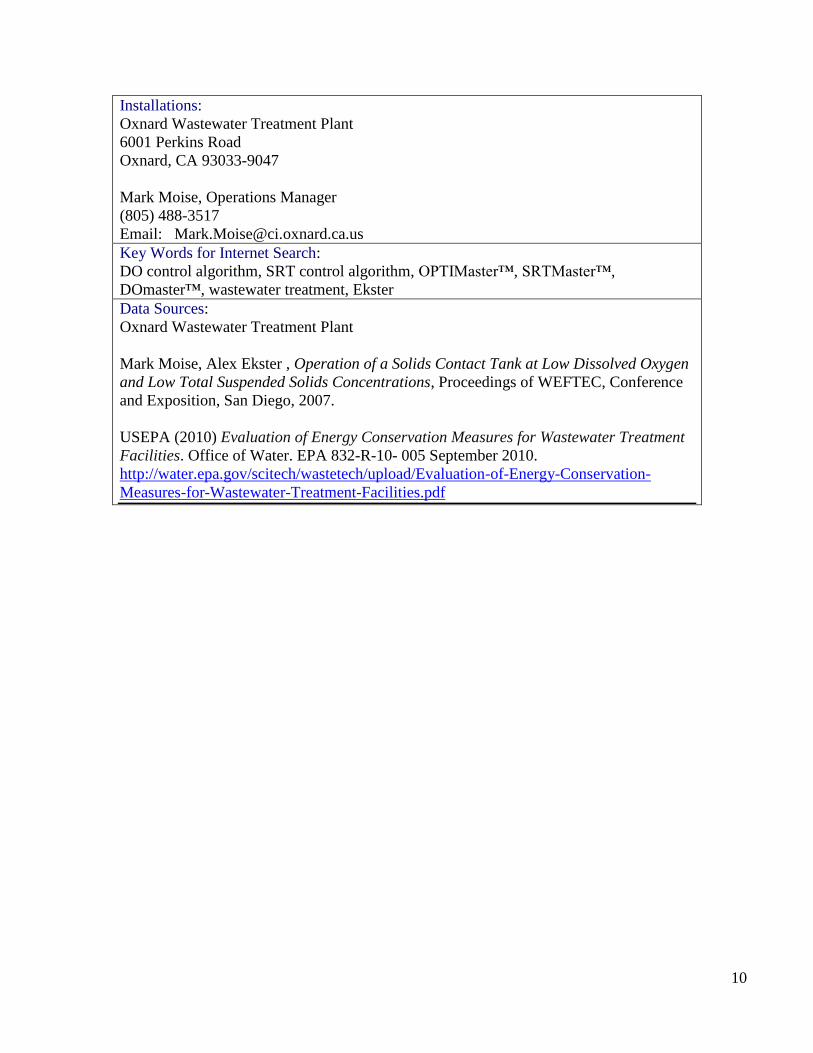
Installations:
Oxnard Wastewater Treatment Plant
6001 Perkins Road
Oxnard, CA 93033-9047
Mark Moise, Operations Manager
(805) 488-3517
Email: [email protected]
Key Words for Internet Search:
DO control algorithm, SRT control algorithm, OPTIMaster™, SRTMaster™,
DOmaster™, wastewater treatment, Ekster
Data Sources:
Oxnard Wastewater Treatment Plant
Mark Moise, Alex Ekster , Operation of a Solids Contact Tank at Low Dissolved Oxygen
and Low Total Suspended Solids Concentrations, Proceedings of WEFTEC, Conference
and Exposition, San Diego, 2007.
USEPA (2010) Evaluation of Energy Conservation Measures for Wastewater Treatment
Facilities. Office of Water. EPA 832-R-10- 005 September 2010.
http://water.epa.gov/scitech/wastetech/upload/Evaluation-of-Energy-Conservation-
Measures-for-Wastewater-Treatment-Facilities.pdf
11
Technology Summary
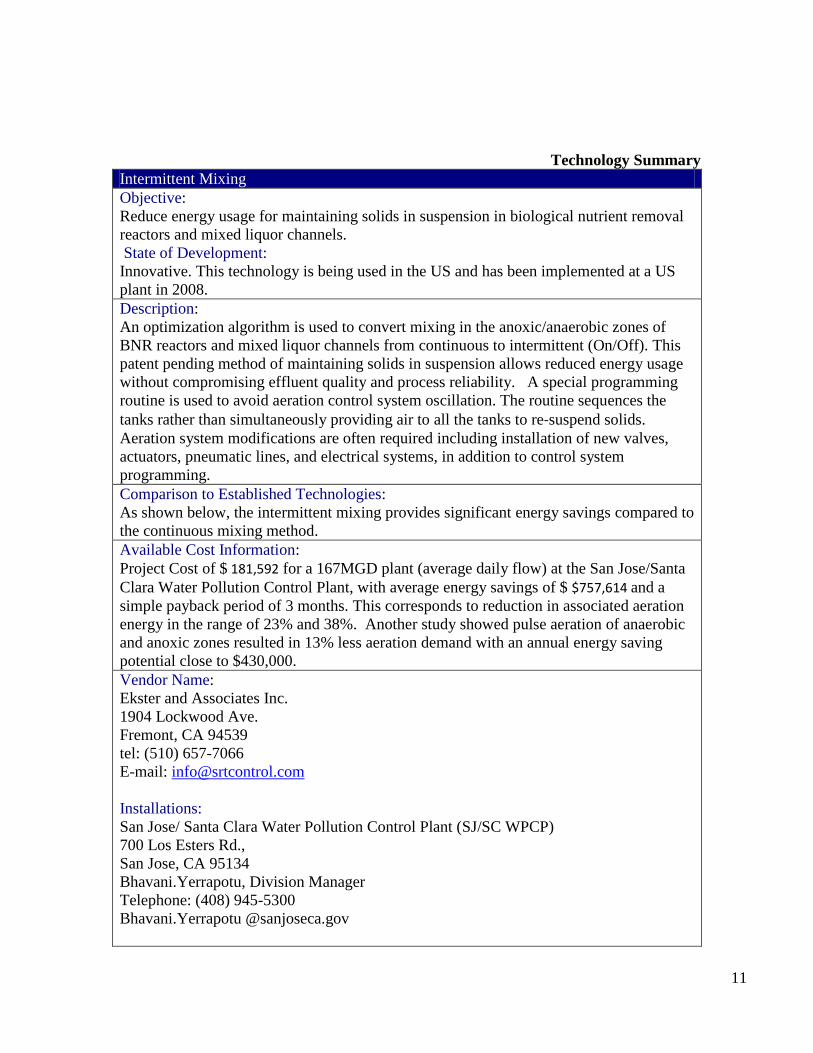
Intermittent Mixing
Objective:
Reduce energy usage for maintaining solids in suspension in biological nutrient removal
reactors and mixed liquor channels.
State of Development:
Innovative. This technology is being used in the US and has been implemented at a US
plant in 2008.
Description:
An optimization algorithm is used to convert mixing in the anoxic/anaerobic zones of
BNR reactors and mixed liquor channels from continuous to intermittent (On/Off). This
patent pending method of maintaining solids in suspension allows reduced energy usage
without compromising effluent quality and process reliability. A special programming
routine is used to avoid aeration control system oscillation. The routine sequences the
tanks rather than simultaneously providing air to all the tanks to re‐suspend solids.
Aeration system modifications are often required including installation of new valves,
actuators, pneumatic lines, and electrical systems, in addition to control system
programming.
Comparison to Established Technologies:
As shown below, the intermittent mixing provides significant energy savings compared to
the continuous mixing method.
Available Cost Information:
Project Cost of $ 181,592 for a 167MGD plant (average daily flow) at the San Jose/Santa
Clara Water Pollution Control Plant, with average energy savings of $ $757,614 and a
simple payback period of 3 months. This corresponds to reduction in associated aeration
energy in the range of 23% and 38%. Another study showed pulse aeration of anaerobic
and anoxic zones resulted in 13% less aeration demand with an annual energy saving
potential close to $430,000. Vendor Name:
Ekster and Associates Inc.
1904 Lockwood Ave.
Fremont, CA 94539
tel: (510) 657-7066
E-mail: [email protected]
Installations:
San Jose/ Santa Clara Water Pollution Control Plant (SJ/SC WPCP)
700 Los Esters Rd.,
San Jose, CA 95134
Bhavani.Yerrapotu, Division Manager
Telephone: (408) 945-5300
Bhavani.Yerrapotu @sanjoseca.gov
12
Key Words for Internet Search:
Pump stations, Pumping, Pumps Scheduling, Ekster
Data Sources:
San Jose/ Santa Clara Water Pollution Control Plant
Issayas T. Lemma, Steve Colby, Tom Herrington Pulse Aeration of Secondary Aeration
Tanks Holds Energy Saving Potential without Compromising Effluent Quality
Proceedings of 82nd WEFTEC, Conference and Exposition, Orlando, 2009.
USEPA (2010) Evaluation of Energy Conservation Measures for Wastewater Treatment
Facilities. Office of Water. EPA 832-R-10- 005 September 2010.
http://water.epa.gov/scitech/wastetech/upload/Evaluation-of-Energy-Conservation-
Measures-for-Wastewater-Treatment-Facilities.pdf
13
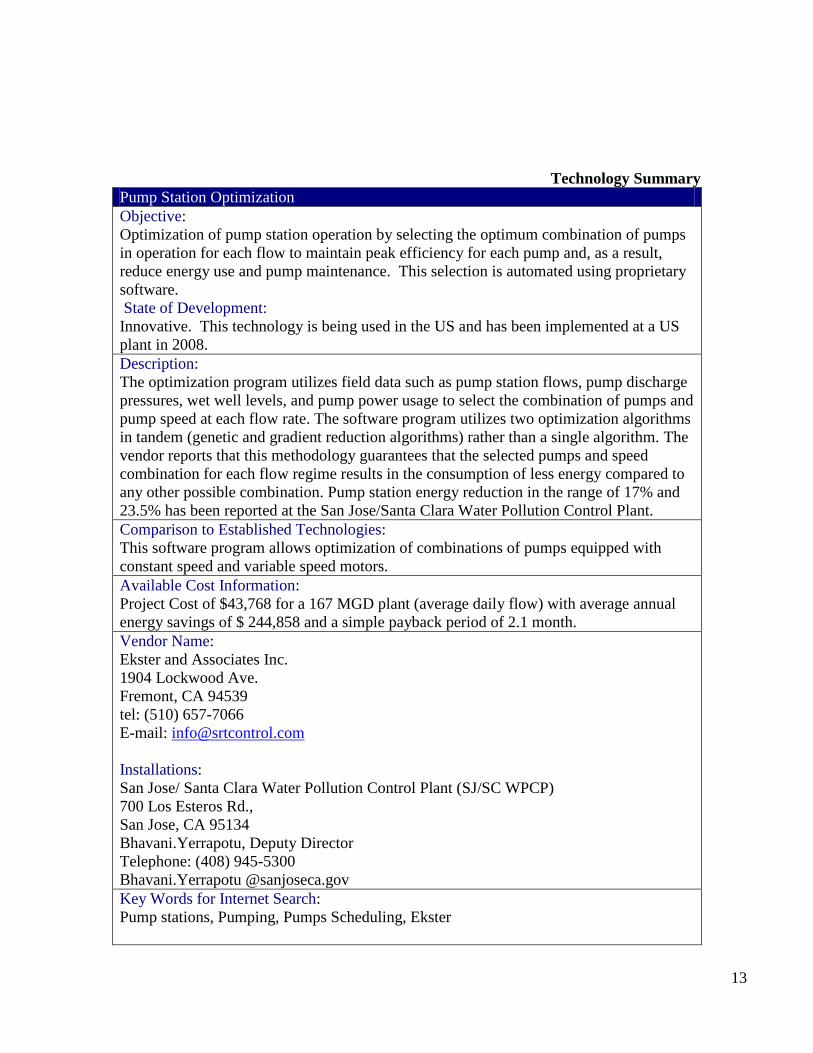
Technology Summary
Pump Station Optimization
Objective:
Optimization of pump station operation by selecting the optimum combination of pumps
in operation for each flow to maintain peak efficiency for each pump and, as a result,
reduce energy use and pump maintenance. This selection is automated using proprietary
software.
State of Development:
Innovative. This technology is being used in the US and has been implemented at a US
plant in 2008.
Description:
The optimization program utilizes field data such as pump station flows, pump discharge
pressures, wet well levels, and pump power usage to select the combination of pumps and
pump speed at each flow rate. The software program utilizes two optimization algorithms
in tandem (genetic and gradient reduction algorithms) rather than a single algorithm. The
vendor reports that this methodology guarantees that the selected pumps and speed
combination for each flow regime results in the consumption of less energy compared to
any other possible combination. Pump station energy reduction in the range of 17% and
23.5% has been reported at the San Jose/Santa Clara Water Pollution Control Plant. Comparison to Established Technologies:
This software program allows optimization of combinations of pumps equipped with
constant speed and variable speed motors.
Available Cost Information:
Project Cost of $43,768 for a 167 MGD plant (average daily flow) with average annual
energy savings of $ 244,858 and a simple payback period of 2.1 month.
Vendor Name:
Ekster and Associates Inc.
1904 Lockwood Ave.
Fremont, CA 94539
tel: (510) 657-7066
E-mail: [email protected]
Installations:
San Jose/ Santa Clara Water Pollution Control Plant (SJ/SC WPCP)
700 Los Esteros Rd.,
San Jose, CA 95134
Bhavani.Yerrapotu, Deputy Director
Telephone: (408) 945-5300
Bhavani.Yerrapotu @sanjoseca.gov
Key Words for Internet Search:
Pump stations, Pumping, Pumps Scheduling, Ekster

14
Data Sources:
San Jose/ Santa Clara Water Pollution Control Plant
USEPA (2010) Evaluation of Energy Conservation Measures for Wastewater Treatment
Facilities. Office of Water. EPA 832-R-10- 005 September 2010.
http://water.epa.gov/scitech/wastetech/upload/Evaluation-of-Energy-Conservation-
Measures-for-Wastewater-Treatment-Facilities.pdf

15
Technology Summary
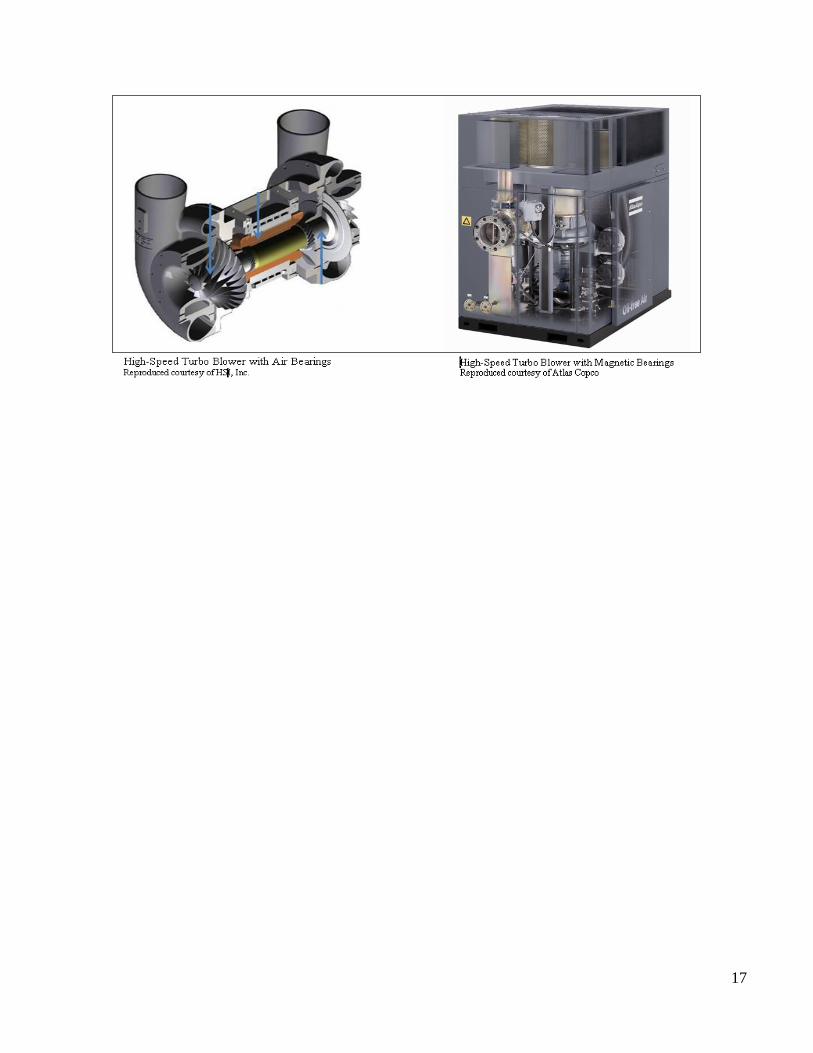
High Speed (Gearless) Turbo Blowers
Objective:
Improved blower and aeration efficiency by using advanced bearing designs to operate at
higher speeds with less energy input compared to multi-stage centrifugal and positive
displacement blowers.
State of Development:
Innovative. Introduced in the U.S. market around 2007 and have been and are being
tested and installed in a number of plants.
Description:
The technology employs advanced bearing designs resulting in near friction-free
operation at higher speeds (upwards of 40,000 rpm) with less energy input compared to
multi-stage centrifugal and positive displacement blowers. Turbo blowers typically are
configured as package systems with integrated VFDs and automated control systems that
improve the technology’s energy efficiency. They are currently available in two primary
configurations: (1) air bearing and (2) magnetic bearing. In an air bearing blower, an air
film is formed between the impeller shaft and its bearings as the shaft rotates at high
speeds, resulting in floating of the shaft and integral impeller. In a magnetic bearing
design, the impeller shaft is magnetically levitated to provide floating of the shaft. This
friction-free bearing design coupled with the use of high efficiency motors and integral
speed control contributes to the comparative high energy efficiency of the turbo blower
technology.
Comparison to Established Technologies:
Turbo blowers have many practical advantages (Gass, 2009 and Jones, 2009) including
10% to 20% more energy efficiency compared to multi-stage centrifugal and positive
displacement blowers. They also exhibit good turndown capacity (up to 50%) with little
efficiency drop off, small footprint and light weight. They are generally quiet, with low
vibration and few moving parts, and have relatively low maintenance requirements.
Available Cost Information:
The De Pere Plant in Green Bay, WI, magnetic bearing design:
Project Cost of $850,000 (2005 Dollars) for an 8.0 MGD plant (average daily flow) with
average energy savings of $63,758 /yr and a simple payback period of 13.3 years.
The Big Gultch Plant in Mukilteo, WA, air bearing design:
Project Cost of $1,446,304 for a 1.45 MGD plant (average daily flow) with average
energy savings of $43,756/yr (estimated in 2010) and a simple payback period of 33
years (based on adjusted loading basis).
Vendor Name:
ABS USA
140 Pondview Drive
Meriden, CT 06450
16
Tel: 203-238-2700
Fax: 203-514-4364
E-mail: [email protected]
Installations:
Green Bay metropolitan Sewerage District ‐ DePere Wastewater
Treatment Plant
315 Leonard Street
De Pere, WI 54115
Michael Kersten
Operations Manager
Telephone: (920) 339‐4094
email: [email protected]
___________________________________________________________________
Vendor Name:
KTurbo USA Inc.
118 Pierson Drive, Unit 118
Batavia, IL 6-510
Tel: 630-406-1473
Email: [email protected]
Installations:
Big Gulch Wastewater Treatment Facility
Mukilteo Water & Wastewater District
PO BOX 260
Mukilteo, WA 98275
Thomas G. Bridges
Wastewater Treatment Plant Manager
Telephone: 425‐355‐6637
email: [email protected]
Key Words for Internet Search:
Turbo, high speed, frictionless, high efficiency blower
Data Sources:
Gray & Osborne, Inc. 2008. Wastewater Treatment Plant Capacity Study and
Engineering Report. March, 2008.
USEPA (2010) Evaluation of Energy Conservation Measures for Wastewater Treatment
Facilities. Office of Water. EPA 832-R-10- 005 September 2010.
http://water.epa.gov/scitech/wastetech/upload/Evaluation-of-Energy-Conservation-
Measures-for-Wastewater-Treatment-Facilities.pdf
17

18
This page is left blank intentionally.
19
Technology Summary
Dual Impeller Aerator (mechanical mixing)
Objective:
Provide additional mixing energy near the floor of an aeration basin, permitting greater
power turndown when a VFD is used and an associated energy savings.
State of Development:
Innovative.
Description:
A dual impeller aerator by Eimco Water Technologies includes a lower impeller near the
bottom of the basin floor to augment the surface impeller. This provides additional
mixing energy near the floor of the basin, permitting greater power turndown when a
VFD is used and an associated energy savings.
Comparison to Established Technologies:
Improved energy efficiency compared to single impeller mechanical aerators which are
limited in their turn down due to the need to keep the contents of the basin from settling.
Available Cost Information:
Not available.
Vendor Name:
Ovivo USA (Formerly Eimco Water Technologies LLC)
2404 Rutland Drive
Austin, TX 78758
Tel: 512-834-6000
Fax: 512-834-6039
Email : [email protected]
Installations:
Information not available.
Key Words for Internet Search:
Dual impeller, turn down, basin floor mixing. Energy efficient mixing
Data Sources:
USEPA (2010) Evaluation of Energy Conservation Measures for Wastewater Treatment
Facilities. Office of Water. EPA 832-R-10- 005 September 2010.
http://water.epa.gov/scitech/wastetech/upload/Evaluation-of-Energy-Conservation-
Measures-for-Wastewater-Treatment-Facilities.pdf

20
This page is left blank intentionally.
21
Technology Summary
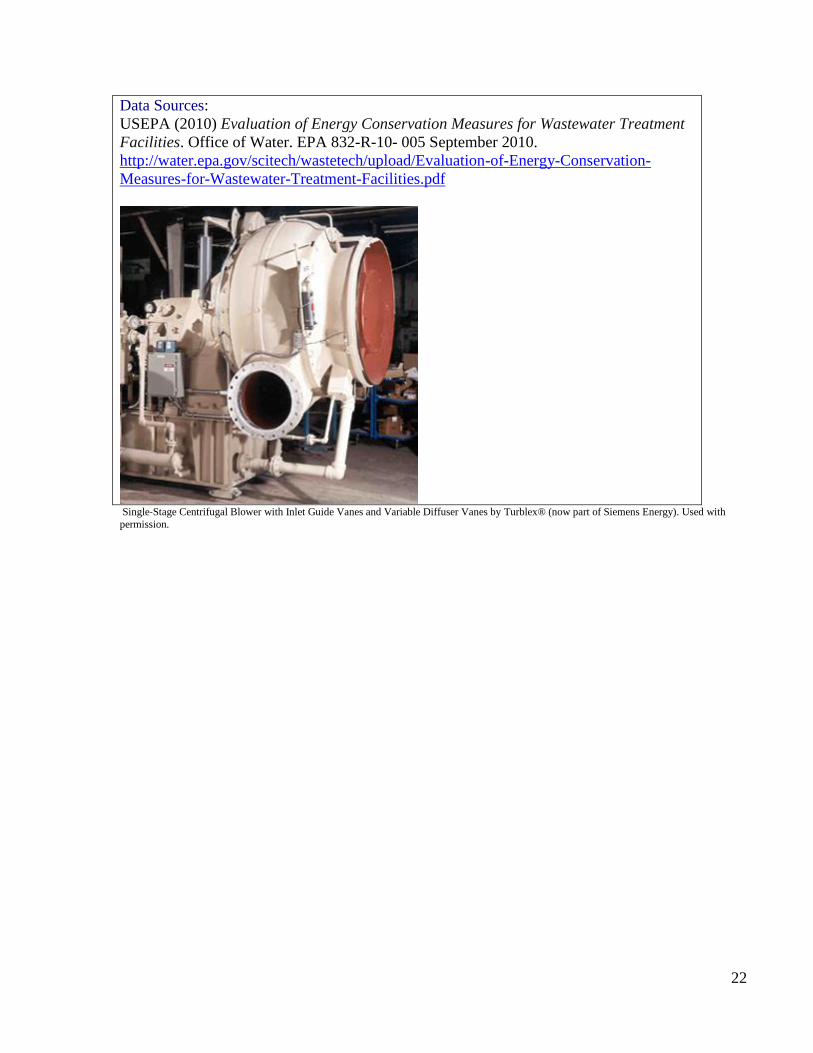
Single-stage Centrifugal Blowers with Inlet Guide Vanes and Variable Diffuser Vanes
Objective:
Utilizing inlet guide vanes and variable outlet vane diffusers on a single stage centrifugal
blower makes it possible to operate the blower at its highest efficiency point.
State of Development:
Innovative (some, but not all turbocmpressors, are innovative).
Description:
Single‐stage centrifugal blowers equipped with inlet guide vanes pre‐rotate the intake air
before it enters the high speed blower impellers. This reduces flow more efficiently than
throttling. Blowers that are also equipped with variable outlet vane diffusers have
improved control of the output air volume. Utilizing inlet guide vane and discharge
diffusers on a single‐stage centrifugal blower makes it possible to operate the blower at
its highest efficiency point, not only at the design condition but also within a greater
range outside of the design condition. PLC control can be used to optimize inlet guide
vane operation (i.e., positioning) based on ambient temperature, differential pressure, and
machine capacity. Automated DO and variable header pressure control can increase
efficiency.
Comparison to Established Technologies:
Increased energy efficiency compared to positive displacement blowers. Can be less
maintenance intensive, and can result in lower monitoring/operational costs if properly
automated.
Available Cost Information:
Project Cost of $901,000 for an 11.8 MGD plant (average daily flow) with average
energy savings of $63,889/yr and a simple payback period of 14 years.
Vendor Name:
Siemens Energy – Turbo machinery Solutions
4654 W. Farm Road 130
Springfield, MO 65802
Tel: 800-299-1035 or 417-864-5599
Fax: 417-866-0235
Installations:
Sheboygan Regional Wastewater Treatment Plant
3333 Lakeshore Drive
Sheboygan, WI 53081
Dale Doer
Wastewater Superintendent
Tel: 920‐459‐3464
Single Stage, mail: [email protected]
Key Words for Internet Search:
Single Stage Blower, Inlet Guide Vanes, Variable diffuser Vane
22
Data Sources:
USEPA (2010) Evaluation of Energy Conservation Measures for Wastewater Treatment
Facilities. Office of Water. EPA 832-R-10- 005 September 2010.
http://water.epa.gov/scitech/wastetech/upload/Evaluation-of-Energy-Conservation-
Measures-for-Wastewater-Treatment-Facilities.pdf
Single‐Stage Centrifugal Blower with Inlet Guide Vanes and Variable Diffuser Vanes by Turblex® (now part of Siemens Energy). Used with
permission.
23
Technology Summary
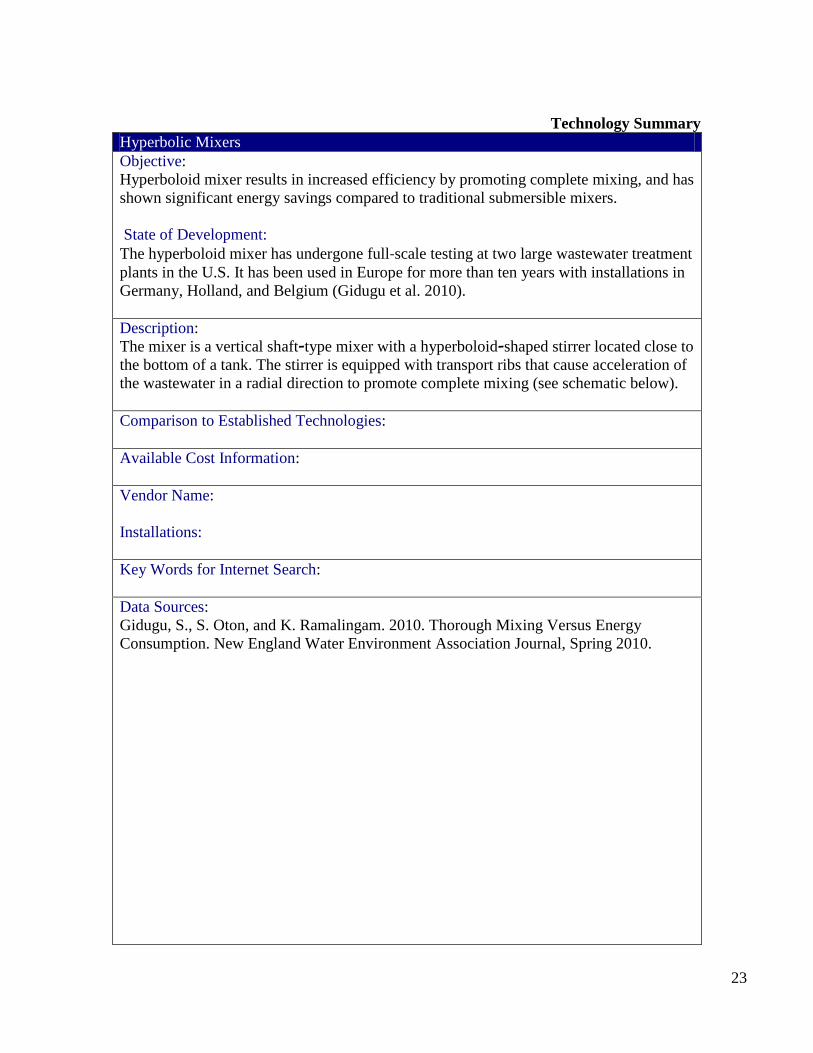
Hyperbolic Mixers
Objective:
Hyperboloid mixer results in increased efficiency by promoting complete mixing, and has
shown significant energy savings compared to traditional submersible mixers.
State of Development:
The hyperboloid mixer has undergone full‐scale testing at two large wastewater treatment
plants in the U.S. It has been used in Europe for more than ten years with installations in
Germany, Holland, and Belgium (Gidugu et al. 2010).
Description:
The mixer is a vertical shaft‐type mixer with a hyperboloid‐shaped stirrer located close to
the bottom of a tank. The stirrer is equipped with transport ribs that cause acceleration of
the wastewater in a radial direction to promote complete mixing (see schematic below).
Comparison to Established Technologies:
Available Cost Information:
Vendor Name:
Installations:
Key Words for Internet Search:
Data Sources:
Gidugu, S., S. Oton, and K. Ramalingam. 2010. Thorough Mixing Versus Energy
Consumption. New England Water Environment Association Journal, Spring 2010.
24
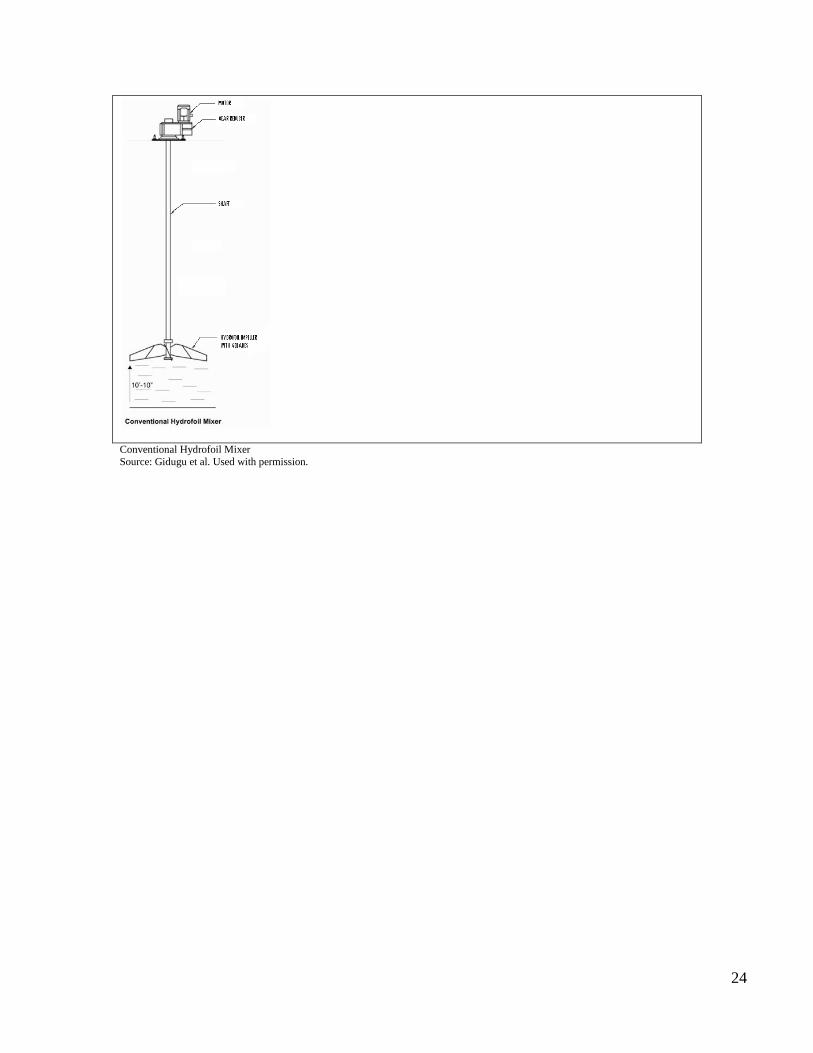
Conventional Hydrofoil Mixer
Source: Gidugu et al. Used with permission.
25
Technology Summary
Pulsed Large Bubble Mixing
Objective:
An innovative mixing technology by Enviromix called BioMx® reduces energy required
for anoxic or anaerobic zone mixing by firing short bursts of compressed air into the zone
instead of mechanically mixing it.
State of Development:
Innovative.
Description:
Uniquely designed nozzles produce a mass of large air bubbles, ranging from marble to
softball size, which mix the water as they rise to the surface. The large air bubbles, much
larger than those made by coarse bubble diffusers, are designed to minimize oxygen
transfer and maintain anoxic or anaerobic conditions. The system includes a PLC to
manage the timing of the air control valve firing, which gives the operator flexibility to
respond to different conditions within the tank.
Comparison to Established Technologies:
Testing at the F. Wayne Hill Water Resources Center in Gwinnett County, Georgia
showed that energy (in kW) required to mix one anaerobic cell using the BioMx® system
was 45 percent less than the energy required by a submersible mixer. Also, when
operated in three cells using the same compressor, 60 percent less energy was required.
The manufacturer reports that the system has non‐clogging, self cleaning in‐tank
components that require no maintenance.
Available Cost Information:
Not Available
Vendor Name:
EnviroMix
180 East Bay Suite 200
Charleston, SC 29401
Tel: 843-573-7510
Fax: 843-573-7531
Email: [email protected]
Installations:
Testing done at the F. Wayne Hill Water Resources Center in Gwinnett County, Georgia in
2009-2010.
Key Words for Internet Search:
Coarse bubble, Pulse mixing,
Data Sources:
Randall, C.W. and W. O. Randall. 2010. Comparative Analysis of a Biomix System and a
Submersible Propeller Mixer: Mixing in Anaerobic Zones at the F. Wayne Hill Water
Resources Center, Buford, Georgia. (Report provided in an e‐mail from Clifford W.
Randall on May 4, 2010).

26
USEPA (2010) Evaluation of Energy Conservation Measures for Wastewater Treatment
Facilities. Office of Water. EPA 832-R-10- 005 September 2010.
http://water.epa.gov/scitech/wastetech/upload/Evaluation-of-Energy-Conservation-
Measures-for-Wastewater-Treatment-Facilities.pdf
27
Technology Summary
Critical Oxygen Point Control
Objective:
Improve aeration efficiency by controlling the optimum delivery of oxygen in the
aeration basins. This is done by determining the critical oxygen point of the wastewater
under aeration and utilizing this data to change the DO setpoint.
State of Development:
Emerging.
Description:
Critical oxygen point control is a control method based on respirometric measurements.
Bacteria respire by diffusion of oxygen across their cell wall. Oxygen diffuses from a
high concentration external to the bacterial cell wall to the low concentration internal to
the bacterial cell. Diffusion will only take place once the oxygen concentration
differential across the cell wall is sufficient to drive the oxygen through it. The minimum
concentration at which this occurs is called the critical oxygen point. Below the critical
oxygen point, the biodegradation rate will rapidly decrease. At the critical oxygen point,
the biodegradation rate will be at a maximum for the available food source (i.e., organic
compounds and ammonia in the wastewater being treated). Accurately knowing the
critical oxygen point for the active biomass allows the optimal DO setpoint to be
determined.
Strathkelvin Instruments (Scotland, UK) has developed a proprietary software upgrade to
their Strathtox line of respirometers that, in real time, determines the critical oxygen point
of the wastewater under aeration and utilizes this data to change the DO setpoint to
control the optimum delivery of oxygen in the aeration basins.
Comparison to Established Technologies:
The vendor claims substantial savings in reducing aeration cycles while increasing
utilization of available capacity and reducing energy costs.
Available Cost Information:
Not available
Vendor Name:
Strathkelvin Instruments Limited,
Rowantree Avenue,
North Lanarkshire,
ML1 5RX,
Scotland, UK
Tel: 01698 730400
Fax: 01698 730401
Email: [email protected]

28
Installations:
See website which reports on a plant in the UK that reduced plant capacity by 25%
resulting in CO2 and energy reduction while maintaining compliance.
http://pdfs.findtheneedle.co.uk/107710-1483.pdf
Key Words for Internet Search:
Aeration efficiency, Critical Oxygen Point, respirometric measurements, optimal DO
setpoint
Data Sources:
USEPA (2010) Evaluation of Energy Conservation Measures for Wastewater Treatment
Facilities. Office of Water. EPA 832-R-10- 005 September 2010.
http://water.epa.gov/scitech/wastetech/upload/Evaluation-of-Energy-Conservation-
Measures-for-Wastewater-Treatment-Facilities.pdf
http://www.strathkelvin.com/waste_water/applications.asp
29
Technology Summary
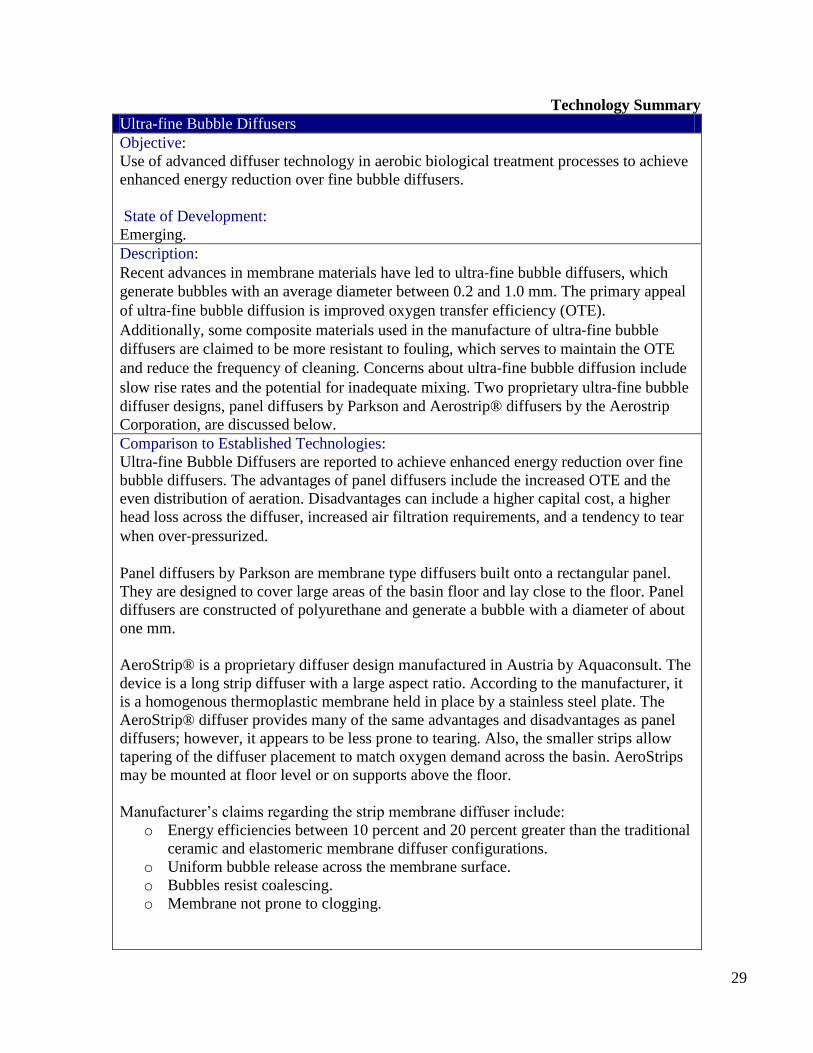
Ultra-fine Bubble Diffusers
Objective:
Use of advanced diffuser technology in aerobic biological treatment processes to achieve
enhanced energy reduction over fine bubble diffusers.
State of Development:
Emerging.
Description:
Recent advances in membrane materials have led to ultra‐fine bubble diffusers, which
generate bubbles with an average diameter between 0.2 and 1.0 mm. The primary appeal
of ultra‐fine bubble diffusion is improved oxygen transfer efficiency (OTE).
Additionally, some composite materials used in the manufacture of ultra‐fine bubble
diffusers are claimed to be more resistant to fouling, which serves to maintain the OTE
and reduce the frequency of cleaning. Concerns about ultra‐fine bubble diffusion include
slow rise rates and the potential for inadequate mixing. Two proprietary ultra‐fine bubble
diffuser designs, panel diffusers by Parkson and Aerostrip® diffusers by the Aerostrip
Corporation, are discussed below.
Comparison to Established Technologies:
Ultra-fine Bubble Diffusers are reported to achieve enhanced energy reduction over fine
bubble diffusers. The advantages of panel diffusers include the increased OTE and the
even distribution of aeration. Disadvantages can include a higher capital cost, a higher
head loss across the diffuser, increased air filtration requirements, and a tendency to tear
when over‐pressurized.
Panel diffusers by Parkson are membrane type diffusers built onto a rectangular panel.
They are designed to cover large areas of the basin floor and lay close to the floor. Panel
diffusers are constructed of polyurethane and generate a bubble with a diameter of about
one mm.
AeroStrip® is a proprietary diffuser design manufactured in Austria by Aquaconsult. The
device is a long strip diffuser with a large aspect ratio. According to the manufacturer, it
is a homogenous thermoplastic membrane held in place by a stainless steel plate. The
AeroStrip® diffuser provides many of the same advantages and disadvantages as panel
diffusers; however, it appears to be less prone to tearing. Also, the smaller strips allow
tapering of the diffuser placement to match oxygen demand across the basin. AeroStrips
may be mounted at floor level or on supports above the floor.
Manufacturer’s claims regarding the strip membrane diffuser include:
o Energy efficiencies between 10 percent and 20 percent greater than the traditional
ceramic and elastomeric membrane diffuser configurations.
o Uniform bubble release across the membrane surface.
o Bubbles resist coalescing.
o Membrane not prone to clogging.

30
o Diffusers are self cleaning, although Aerostrip panels have been reported to be
susceptible to frequent fouling requiring bumping and flexing of the membrane to
dislodge.
Available Cost Information:
Not available.
Vendor Name:
Parkson Corporation
telephone 1.888.PARKSON
fax 954.974.6182
AQUACONSULT Anlagenbau Ges.m.b.H.Wassergasse 22-26/9
A- 2500 Baden
Austria
Tel.: +43-2252 41 481
Fax: +43-2252 41 480
e-mail: [email protected]
Installations:
Information not available.
Key Words for Internet Search:
Fine bubble diffuser, panel diffuser, strip diffuser, thermoplastic membrane
Data Sources:
http://www.parkson.com/files/Brochures/HiOx_UltraFlex_Aeration_System.pdf
http://www.aquaconsult.at/indexe.php
USEPA (2010) Evaluation of Energy Conservation Measures for Wastewater Treatment
Facilities. Office of Water. EPA 832-R-10- 005 September 2010.
http://water.epa.gov/scitech/wastetech/upload/Evaluation-of-Energy-Conservation-
Measures-for-Wastewater-Treatment-Facilities.pdf
31
Technology Summary
Low Pressure High Output Lamps for UV Disinfection
Objective:
Reduce energy consumption for UV disinfection by replacing medium pressure lamps
with low pressure low output lamps.
State of Development:
Emerging.
Description:
Low‐pressure high‐output lamps are similar to low‐pressure low‐intensity lamps except
that a mercury amalgam is used instead of mercury gas.
Comparison to Established Technologies:
In some cases, WWTPs can save on energy costs by specifying low‐pressure low
intensity lamps. The power draw can be significantly lower than medium‐pressure lamps.
Tradeoffs are (1) a larger footprint for the same disinfection level, which can be
significant because as many as 20 low‐pressure low‐intensity lamps are needed to
produce the same disinfecting power as one medium‐pressure lamp, and (2) higher
operating costs for maintenance and change out of additional lamps.
Leong et al. (2008) reported that the energy demand for low‐pressure high‐output systems
is similar to that of low‐pressure low‐intensity systems. Thus, low‐pressure high‐output
lamps may be a good option for reducing the number of lamps and footprint while
keeping the energy requirements low. Salveson et al. (2009) presented results of a pilot
test at the Stockton, CA WWTP comparing design conditions and operation of medium
pressure and low‐pressure high‐output lamps. The power draw for the low‐pressure
high‐output lamps was between 20 and 30 percent of the power draw for the medium
pressure lamps, reducing annual O&M costs significantly. These results are similar to
information reported from one manufacturer for a 30 mgd plant treating secondary
effluent.
Available Cost Information:
Information not available.
Vendor Name:
Calgon Carbon Corporation
P.O. Box 717
Pittsburgh, PA 15230
Tel: 800-4CARBON
Phone: 412 787-6700
Fax: 412 787-6676
Installations:
Results of a pilot test at the Stockton, CA WWTP were reported in the report referenced
below by Salveson et al. (2009).
32
Key Words for Internet Search:
UV disinfection, low‐pressure low intensity lamps, low‐pressure high‐output lamps.
Data Sources:
Salveson, A., T. Wade, K. Bircher, and B. Sotirakos. 2009. High Energy Efficiency and
Small Footprint with High‐Wattage Low Pressure UV Disinfection for Water Reuse.
Presented at the International Ultraviolet Association (IUVA)/ International Ozone
Association (IOA) North American Conference. May 5, 2009. Boston, MA.
Leong, L.Y.C., J. Kuo, and C Tang. 2008. Disinfection of Wastewater Effluent—
Comparison of Alternative Technologies. Water Environment Research Foundation
(WERF), Alexandria, VA.
USEPA (2010) Evaluation of Energy Conservation Measures for Wastewater Treatment
Facilities. Office of Water. EPA 832-R-10- 005 September 2010.
http://water.epa.gov/scitech/wastetech/upload/Evaluation-of-Energy-Conservation-
Measures-for-Wastewater-Treatment-Facilities.pdf
33
Technology Summary
Automated Channel Routing for UV Disinfection
Objective:
Reduce energy use and extend UV lamp life for UV disinfection systems.
State of Development:
Emerging.
Description:
Automation can reduce the number of lamps and/or channels operating based on
real‐time flow and wastewater characteristic data. Controls can be designed to turn off
lamps or divert flow to a few operating channels depending on the UV system design.
Control is most commonly flow‐paced control or dose‐paced control. Flow‐paced is the
simplest with number of lamps/channels in service based strictly on influent flow rate.
Dose‐paced control is based on the calculated dose, which is derived from flow rate, UV
transmittance (UVT) and lamp power (including lamp age and on‐line intensity output)
data (Leong et al. 2008). During periods of high solids removal, UVT will increase and
UV output can be decreased to achieve the same dose. During wet weather events or
other periods of low effluent quality, lamp output can be increased in response to reduced
UVT.
Comparison to Established Technologies:
At the University of California, Davis Wastewater Treatment Plant, process controls were
Implemented to divert flow automatically to one of two channels during low flow
conditions (Phillips and Fan 2005). This change provided the flexibility to operate at 33,
50, 67 and 100 percent of maximum power. The original design limited operation to 67
and 100 percent of maximum power. The annual energy use at the UC Davis WWTP is
expected to decrease by 25 percent once the process changes are fully implemented in the
fall of 2010.
Available Cost Information:
Information not available.
Vendor Name:
Information not available
Installations:
University of California, Davis Wastewater Treatment Plant
Mike Fan, Superintendent Waste Water Treatment and Solid Waste
Tel: 530- 752-7553
Email: [email protected]
Key Words for Internet Search:
UV disinfection, automated channel routing, energy efficient UV control
Data Sources:
Leong, L.Y.C., J. Kuo, and C Tang. 2008. Disinfection of Wastewater Effluent—
Comparison of Alternative Technologies. Water Environment Research Foundation
(WERF), Alexandria, VA.

34
Phillips, D. L. and M. M. Fan. 2005. Automated Channel Routing to Reduce Energy Use
in Wastewater UV Disinfection Systems. University of California, Davis. Davis,
California.
USEPA (2010) Evaluation of Energy Conservation Measures for Wastewater Treatment
Facilities. Office of Water. EPA 832-R-10- 005 September 2010.
http://water.epa.gov/scitech/wastetech/upload/Evaluation-of-Energy-Conservation-
Measures-for-Wastewater-Treatment-Facilities.pdf
35
Technology Summary
Membrane Air Scour Alternatives
Objective:
Reduce membrane fouling by providing energy efficient air scour fouling control and
operational strategies.
State of Development:
Emerging.
Description:
Several membrane manufacturers have modified operational strategies to reduce air scour
fouling control requirements (Wallis‐Lage and Levesque 2009), particularly for MBR
systems.
For example, Kubota varies the volume of air used for aeration based on the flux (e.g.,
lower air scour rates are used for lower flux values). The manufacturer of the Huber
system claims reduced energy consumption for air scour due to a centrally positioned air
intake and low pressure. Siemens uses a combination of air and water to scour the
membrane (Wallis‐Lage and Levesque 2009). General Electric (GE) implemented
“cyclic” air scour whereby aeration would turned on and off in 10 second intervals. A
newer innovation is their 10/30 Eco‐aeration where the membrane is scoured for 10
seconds on, 30 second off during non‐peak flow conditions. GE claims that the 10/30
Eco‐aeration can reduce energy consumption by up to 50 percent compared to the
standard 10/10 aeration protocol (Ginzburg et al. 2008).
Comparison to Established Technologies:
The literature includes pilot‐ and full‐scale test data for a membrane fouling controller
and algorithm used to clean the GE ZENON ZeeWeed MBR. The system uses real‐time
analysis of the membrane’s filtration operating conditions to determine the fouling
mechanism present in the MBR system. The information obtained from the algorithm
dictates the implementation of specific control actions to respond to the particular fouling
mechanism (e.g., membrane aeration, backwash, chemical cleaning – the biggest impact
on energy consumption being membrane aeration). When aeration is identified as the
control action, the fouling controller/algorithm provides the MBR Programmable Logic
Controller (PLC) system the information to select between the traditional 10/10 (air scour
On/Off) protocol and a 10/30 Eco Aeration energy saving protocol. The algorithm was
piloted and later full‐scale tested at a 3 million gallon per day (mgd) plant in Pooler,
Georgia (Ginsburg et al. 2008). Ginzburg (2008) concluded that additional research is
required to further develop the on‐line fouling controller to include additional control
parameters such as membrane aeration flow rate, backwash flow rate, and backwash
duration.
Available Cost Information:
Information not available.
Vendor Name:
Enviroquip (a division of Eimco Water Technologies) -partnership with Kubota
Corporation, Japan)
36
2404 Rutland Drive
Austin, TX 78758
Tel: 512-834-6000
Fax: 512-834-6039
Email: [email protected]
HUBER SE
Industriepark Erasbach A1
D-92334 Berching
Germany
Tel: +49-8462-201-0
Fax: +49-8462-201-810
Email: [email protected]
ZENON Membrane Solutions (GE)
Oakville, Ontario, Canada
Tel: 905-465-3030
Email: www.gewater.com
Seimens Water Technologies
Warrendale, PA
Tel: 866.926.8420
Email: [email protected]
Installations:
Pilot and full scale testing was conducted at a wastewater treatment plant in Pooler,
Gerogia. See data reference below.
Key Words for Internet Search:
Membrane Air Scour, membrane cleaning, membrane fouling, MBR efficiency
Data Sources:
Wallis‐Lage, C.L. and S. D. Levesque. 2009. Cost Effective & Energy Efficient MBR
Systems. Presented at the Singapore International Water Week. June 22 – 26, 2009.
Suntec Singapore International Convention and Exhibition Center.
Ginzburg, B., J. Peeters, and J. Pawloski. 2008. On‐line Fouling Control for Energy
Reduction in
Membrane Bioreactors. Presented at Membrane Technology 2008. Atlanta, GA. WEF.
USEPA (2010) Evaluation of Energy Conservation Measures for Wastewater Treatment
Facilities. Office of Water. EPA 832-R-10- 005 September 2010.
http://water.epa.gov/scitech/wastetech/upload/Evaluation-of-Energy-Conservation-
Measures-for-Wastewater-Treatment-Facilities.pdf
37
Technology Summary
Solar Drying of Sewage Sludge
Objective:
Use of solar heat to evaporate residual water from sludge, reduce thermal energy
requirements and sludge utilization/disposal costs.
State of Development:
Emerging.
Description:
Thermal drying is the use of heat to evaporate residual water from sludge. It typically
follows dewatering and can increase the dry solids content from between 18 and 30
percent to more than 90 percent (WEF 2009). The thermal drying process reduces the
mass and volume of dewatered solids and results in a product with a high nutrient and
organic content that can be used as a low‐grade fertilizer. WEF and ASCE (2010) report
on growing use in Europe and the United States of an emerging ECM for thermal drying
called solar drying. First developed by researchers in Germany, solar drying uses solar
energy and convective air drying methods to produce solids containing no more than 10
percent moisture. Solar dryers consist of a wide concrete pad with low walls enclosed in a
“greenhouse” type structure. Sludge is pumped onto the pad and arranged in a relatively
thin layer or in windrows. A microprocessor monitors temperature and humidity and
adjusts fans and louvers to provide sufficient ventilation for drying. Auxiliary heat may
be used to enhance drying performance.
Comparison to Established Technologies:
The Parkson Corporation reports that approximately 95 percent of energy used for drying
is provided by solar panels. They cite 100 installations in a variety of climates and for
WWTP sizes ranging from 0.2 to 40 mgd. Solar drying is considered an emerging ECM
because of its capacity to significantly reduce fuel requirements compared to
conventional dryers. Disadvantages of the technology are its large footprint, the need for
sufficient days with adequate solar heating, and potential for odor problems. If odors are
present, appropriate control technologies is available and can be provided.
Available Cost Information:
Information not available.
Vendor Name:
Parkson Corporation
telephone 1.888.PARKSON
fax 954.974.6182
Installations:
As of 2008, WEF and ASCE (2010) report that 10 solar drying facilities are being built or
operated in the U.S., mainly at small plants.
Key Words for Internet Search:
Solar drying, sludge drying, thermal drying
38
Data Sources:
WEF. 2009. MOP No. 32: Energy Conservation in Water and Wastewater Facilities.
Prepared by the
Energy Conservation in Water and Wastewater Treatment Facilities Task Force of the
Water
Environment Federation. McGraw Hill, New York.
WEF and ASCE. 2010. Design of Municipal Wastewater Treatment Plants – WEF
Manual of Practice 8 and ASCE Manuals and Reports on Engineering Practice No. 76,
5th Ed. Water Environment Federation, Alexandria, VA, and American Society of Civil
Engineers Environment & Water Resources Institute, Reston, Va.
USEPA (2010) Evaluation of Energy Conservation Measures for Wastewater Treatment
Facilities. Office of Water. EPA 832-R-10- 005 September 2010.
http://water.epa.gov/scitech/wastetech/upload/Evaluation-of-Energy-Conservation-
Measures-for-Wastewater-Treatment-Facilities.pdf
39
References
Gass, J.V. (2009) Scoping the Energy Savings Opportunities in Municipal Wastewater
Treatment. Presented at the Consortium for Energy Efficiency Partner’s Meeting,
September 2009.
Gidugu, S., S. Oton, and K. Ramalingam. 2010. Thorough Mixing Versus Energy Consumption.
New England Water Environment Association Journal, Spring 2010.
Ginzburg, B., J. Peeters, and J. Pawloski. 2008. On‐line Fouling Control for Energy Reduction in
Membrane Bioreactors. Presented at Membrane Technology 2008. Atlanta, GA. WEF.
Gray & Osborne, Inc. 2008. Wastewater Treatment Plant Capacity Study and Engineering
Report. March, 2008.
Jones, T., Burgess, J. (2009) Municipal Water-Wastewater Breakout Session: High Speed Turbo
Blowers. Presented at the Consortium for Energy Efficiency Program Meeting, June 3,
2009.
Lemma, I., Steve Colby, Herrington, T., Pulse Aeration of Secondary Aeration Tanks Holds
Energy Saving Potential without Compromising Effluent Quality Proceedings of 82nd WEFTEC,
Conference and Exposition, Orlando, 2009.
Leong, L.Y.C., J. Kuo, and C Tang. 2008. Disinfection of Wastewater Effluent— Comparison of
Alternative Technologies. Water Environment Research Foundation (WERF), Alexandria, VA.
Massart, N., Doyle, J., Jenkins, J., Rowna, J., Wallis-Lang, C. (2008) Anaerobic Digestion –
Improving Energy Efficiency and Mixing. Presented at WEFTEC 2008.
Moise, M., Ekster, A. , Operation of a Solids Contact Tank at Low Dissolved Oxygen and Low
Total Suspended Solids Concentrations, Proceedings of WEFTEC, Conference and Exposition,
San Diego, 2007.
Randall, C.W. and W. O. Randall. 2010. Comparative Analysis of a Biomix System and a
Submersible Propeller Mixer: Mixing in Anaerobic Zones at the F. Wayne Hill Water Resources
Center, Buford, Georgia. (Report provided in an e‐mail from Clifford W. Randall on May 4,
2010).
Salveson, A., T. Wade, K. Bircher, and B. Sotirakos. 2009. High Energy Efficiency and Small
Footprint with High‐Wattage Low Pressure UV Disinfection for Water Reuse. Presented at the
International Ultraviolet Association (IUVA)/ International Ozone Association (IOA) North
American Conference. May 5, 2009. Boston, MA.
40
USEPA (2010) Evaluation of Energy Conservation Measures for Wastewater Treatment
Facilities. Office of Water. EPA 832-R-10- 005 September 2010.
Water Environment Federation Manual of Practice (MOP) No. 32: Energy
Conservation in Water and Wastewater Facilities. Prepared by the Water and Wastewater
Treatment facilities Task Force of the Water Environment Federation. McGraw Hill,
New York, 2009.
Wallis‐Lage, C.L. and S. D. Levesque. 2009. Cost Effective & Energy Efficient MBR Systems.
Presented at the Singapore International Water Week. June 22 – 26, 2009. Suntec Singapore
International Convention and Exhibition Center.
WEF and ASCE. 2010. Design of Municipal Wastewater Treatment Plants – WEF Manual of
Practice 8 and ASCE Manuals and Reports on Engineering Practice No. 76, 5th Ed. Water
Environment Federation, Alexandria, VA, and American Society of Civil Engineers Environment
& Water Resources Institute, Reston, Va.
* Capital costs shown in this chapter may include other needed facilities and/or ancillary equipment needed to implement the ECM and may
have been derived from the total cost of a larger project. In some cases, installation costs may not be available and not included. Capital and O&M costs as well as energy savings are site specific and equipment specific and can vary significantly. For details on the basis of some of the reported costs, please consult the EPA document referenced in this chapter which is available at http://water.epa.gov/scitech/wastetech/upload/Evaluation-of-Energy-Conservation-Measures-for-Wastewater-Treatment-Facilities.pdf