adclin tips 01 - adclin®: the data experts reporting system – tips page 5 of 22 1.4 logic detail...
TRANSCRIPT

AdClin® TIPS
N°1
Copyright © AdClin, 2001-2009


AdClin Reporting System – TIPS
Page 3 of 22
Table of contents
1. Introduction.................................................................................................................. 4 1.1 N°1 Goal ............................................................................................................... 4 1.2 Recall of the %Table1 Logic..................................................................................... 4 1.3 Current Restrictions................................................................................................ 4 1.4 Logic detail ............................................................................................................ 5
2. How to get several levels or variables as columns: Basics................................................... 6 2.1 TIP to get 2 variables (“ITT” and “PP”) as columns ..................................................... 6 2.2 TIP to get 2 levels as columns: Treatments within variables (“ITT” and “PP”). ................ 7 2.3 TIP to get 2 levels + 1 Variable as columns: Treatments within Visits and Variation between 2 Visits + By-processing by Site. ........................................................................ 8
3. How to get several levels or variables as columns: Real Life Examples ............................... 12 3.1 By procesing (+ "All") - Crossing of 2 levels in columns - N= reformatted. .................. 13 3.2 By procesing - Crossing of 2 levels in columns - Hiding missing values........................ 15 3.3 Crossing of 2 heterogeneous levels in columns - External Anova results ...................... 16
Appendix 1. SAS Librarie Main1....................................................................................... 18 DataSets and Vaiables .......................................................................................... 18 Content of Formats............................................................................................... 18 The Subject Dataset (Excerpt) ............................................................................... 19 The SubRL Dataset (Excerpt) ................................................................................. 20 The SubRV Dataset (Excerpt)................................................................................. 21 The XSubRLV Dataset (Excerpt) ............................................................................. 22

AdClin Solution Pack – %Table1
Page 4 of 22
1. Introduction
1.1 N°1 Goal
In this TIP number, AdClin proposes TIPS to allow AdClin users to use %Table1 in non-standard conditions: The crossing of several levels of information as columns.
1.2 Recall of the %Table1 Logic
%Table1 is meant to report into the same table univariate statistics and/or frequencies and percentages for various variables, coming from various datasets. The variables define blocks of reported figures, which are stacked up vertically. The different blocks line-up their results under a set of common columns, defined by a variable, as shown in the example below.
Treatment A Treatment B All N=294 N=296 N=590
Sex Male 124 (42.2%) 129 (43.6%) 253 (42.9%) Female 170 (57.8%) 167 (56.4%) 337 (57.1%) Race Caucasian 285 (96.9%) 288 (97.3%) 573 (97.1%) Black 2 (0.7%) 1 (0.3%) 3 (0.5%) Oriental 2 (0.7%) 4 (1.4%) 6 (1.0%) Other 5 (1.7%) 3 (1.0%) 8 (1.4%) Age (years) N 294 296 590 Mean (Std) 44.1 (12.89) 43.9 (13.56) 44.0 (13.22) Median 44.6 44.5 44.5 Min ; Max 18 ; 69 18 ; 71 18 ; 71
The columns are defined by the values of a column variable (here, Treatment) found in a reference dataset, the population dataset. The variables reported in the blocks may come from this population dataset, or from other datasets. In the latter case, the other datasets must have a one-to-one or many-to-one relation to the population dataset. In addition, by default, all column percentages will be computed versus frequencies computed once for the whole table, from the population dataset, and displayed as N= in the headings of the columns above.
1.3 Current Restrictions
Currently, %Table1 manages only one level of information as columns with Colvar= (e.g. Treatment) and also one level of by-variable with By=.
Furthermore the column levels are the categories of a frequency variable. There is a priori no possibility to represent 2 non-disjonctive sets in columns (e.g. “ITT” and “PP” or any variables).
Also, it is not possibe to display univariate statistics (Mean, Median, Std,…) as columns.

AdClin Reporting System – TIPS
Page 5 of 22
1.4 Logic detail
In fact, %table1 requires a PopDataSet (Subject) with the generic structure below:
subid trt itt pp sex hight
0101 2 1 0 1 171.9
0102 1 1 1 1 169.3
0103 2 1 1 2 163.7
0104 2 1 1 1 173.2
0105 2 1 1 2 171.7
0106 2 1 1 2 173.2
0107 1 1 1 2 171
0108 1 1 1 2 171.1
0109 2 1 1 2 169.7
0110 2 1 0 2 169.6
The syntax:
%Title( Basics) %Table1( Popdataset=subject, PopId=subid, pctcol=nonmiss, type=freq, ColVar=trt " ", Blocks= Sex "Sex" )
Gives:
Table 01 Basics Trt A Trt B All N=3 N=7 N=10
Sex Male 1 (33.3%) 2 (28.6%) 3 (30.0%) Female 2 (66.7%) 5 (71.4%) 7 (70.0%)
The columns are defined by the values of the column variable (here, Treatment). One can notice that if the subjects were repeated (for treatment A then B), as in cross-overs, %Table1 is still properly working according to this principle.
Of course, the column All will have to be displayed carefully depending on the context.

AdClin Solution Pack – %Table1
Page 6 of 22
2. How to get several levels or variables as columns: Basics
2.1 TIP to get 2 variables (“ITT” and “PP”) as columns
The above principle can be generalized, for instance, to display the following table:
Tip 02 2 Variables in columns
ITT PP N=10 N=8
Sex Male 3 (30.0%) 2 (25.0%) Female 7 (70.0%) 6 (75.0%)
With the “ITT” (Intent To Treat) and “PP” (Per Protocol) variables as columns.
The TIP consists in grouping and repeating records from the original PopDataSet according to the “pop” Colvar as below:
subid trt itt pp Sex hight Pop
0101 2 1 0 1 171.9 ITT
0102 1 1 1 1 169.3 ITT
0103 2 1 1 2 163.7 ITT
0104 2 1 1 1 173.2 ITT
0105 2 1 1 2 171.7 ITT
0106 2 1 1 2 173.2 ITT
0107 1 1 1 2 171 ITT
0108 1 1 1 2 171.1 ITT
0109 2 1 1 2 169.7 ITT
0110 2 1 0 2 169.6 ITT
0102 1 1 1 1 169.3 PP
0103 2 1 1 2 163.7 PP
0104 2 1 1 1 173.2 PP
0105 2 1 1 2 171.7 PP
0106 2 1 1 2 173.2 PP
0107 1 1 1 2 171 PP
0108 1 1 1 2 171.1 PP
0109 2 1 1 2 169.7 PP
This can be easily done with the set of statements:
data subject; set main0.subject; if itt=1 then do; pop = "ITT"; output; end; if pp=1 then do; pop = "PP "; output; end; run;

AdClin Reporting System – TIPS
Page 7 of 22
And then calling %Table1 with the following syntax:
%Table1( Popdataset=work.subject, PopId=subid, colall=no, pctcol=nonmiss, type=freq, ColVar=pop " ", Blocks= Sex "Sex" )
Giving:
Tip 02 2 Variables as columns
ITT PP N=10 N=8
Sex Male 3 (30.0%) 2 (25.0%) Female 7 (70.0%) 6 (75.0%)
2.2 TIP to get 2 levels as columns: Treatments within variables (“ITT” and “PP”).
We want, now, to display 2 levels as columns. For instance:
Tip 03 2 Levels as columns ITT PP
Trt A Trt B Trt A Trt B
N=3 N=7 N=3 N=5 Sex Male 1 (33.3%) 2 (28.6%) 1 (33.3%) 1 (20.0%) Female 2 (66.7%) 5 (71.4%) 2 (66.7%) 4 (80.0%)
The TIP consists in grouping and repeating records from the Original PopDataSet according to the “poptrt” Colvar as below:
subid trt itt pp Sex hight pop poptrt
0101 2 1 0 1 171.9 ITT ITT2
0102 1 1 1 1 169.3 ITT ITT1
0103 2 1 1 2 163.7 ITT ITT2
0104 2 1 1 1 173.2 ITT ITT2
0105 2 1 1 2 171.7 ITT ITT2
0106 2 1 1 2 173.2 ITT ITT2
0107 1 1 1 2 171 ITT ITT1
0108 1 1 1 2 171.1 ITT ITT1
0109 2 1 1 2 169.7 ITT ITT2
0110 2 1 0 2 169.6 ITT ITT2
0102 1 1 1 1 169.3 PP PP1
0103 2 1 1 2 163.7 PP PP2
0104 2 1 1 1 173.2 PP PP2
0105 2 1 1 2 171.7 PP PP2
0106 2 1 1 2 173.2 PP PP2
0107 1 1 1 2 171 PP PP1
0108 1 1 1 2 171.1 PP PP1
0109 2 1 1 2 169.7 PP PP2
This can be easily done with the set of statements:

AdClin Solution Pack – %Table1
Page 8 of 22
data subject; set main0.subject; if itt=1 then do; pop = "ITT"; poptrt = trim(pop) || left(trim(put(trt,1.0))); output; end; if pp=1 then do; pop = "PP "; poptrt = trim(pop) || left(trim(put(trt,1.0))); output; end; run;
And then calling %Table1 with the following syntax:
%Table1( Popdataset=work.subject, PopId=subid, colall=no, pctcol=nonmiss, type=freq, ColVar=poptrt " " ("ITT1"="Trt A" "ITT2"="Trt B" "PP1"="Trt A" "PP2"="Trt B"), ColGroups= ("ITT1" "ITT2") "ITT" ("PP1" "PP2") "PP" , Blocks= Sex "Sex" )
Giving:
Tip 03 2 Levels as columns ITT PP
Trt A Trt B Trt A Trt B
N=3 N=7 N=3 N=5 Sex Male 1 (33.3%) 2 (28.6%) 1 (33.3%) 1 (20.0%) Female 2 (66.7%) 5 (71.4%) 2 (66.7%) 4 (80.0%)
2.3 TIP to get 2 levels + 1 Variable as columns: Treatments within Visits and Variation between 2 Visits + By-processing by Site.
In this example, conversely to the “tip 03”, the involved variables, to be crossed as columns, come from different datasets. “Treatment”, as already explained, must be part of PopDataSet=”Subject”. In our example, PopDataSet has thus one record per subject. But, “Visit” is part of the VarDataSet=“Subvis”. Dataset whose structure is by “subject”, “site” and “visit”. These original datasets are presented below:
PopDataSet=”Subject” subid trt itt pp sex height
0101 2 1 0 1 171.9
0102 1 1 1 1 169.3
0103 2 1 1 2 163.7
0104 2 1 1 1 173.2
0105 2 1 1 2 171.7
0106 2 1 1 2 173.2
0107 1 1 1 2 171
0108 1 1 1 2 171.1
0109 2 1 1 2 169.7
0110 2 1 0 2 169.6

AdClin Reporting System – TIPS
Page 9 of 22
VarDataSet=“Subvis” subid site visit size vsize trt
0101 1 1 216.8 0 2
0101 1 2 250.6 33.8 2
0101 2 1 210.7 0 2
0101 2 2 243.9 33.2 2
0102 1 1 218.4 0 1
0102 1 2 254.8 36.4 1
0102 2 1 208.4 0 1
0102 2 2 244.8 36.4 1
0103 1 1 214.9 0 2
0103 1 2 251.9 37 2
0103 2 1 211 0 2
0103 2 2 239.4 28.4 2
0104 1 1 221.2 0 2
0104 1 2 248.6 27.4 2
0104 2 1 212.5 0 2
0104 2 2 238.1 25.6 2
0105 1 1 217.4 0 2
0105 1 2 250.4 33 2
0105 2 1 212.5 0 2
0105 2 2 235.9 23.4 2
0106 1 1 217.2 0 2
0106 1 2 249.5 32.3 2
0106 2 1 212 0 2
0106 2 2 240.7 28.7 2
0107 1 1 220.5 0 1
0107 1 2 245 24.5 1
0107 2 1 205.3 0 1
0107 2 2 240.3 35 1
0108 1 1 221.4 0 1
0108 1 2 255.6 34.2 1
0108 2 1 204.5 0 1
0108 2 2 240 35.5 1
0109 1 1 218.4 0 2
0109 1 2 250.2 31.8 2
0109 2 1 218.3 0 2
0109 2 2 241.4 23.1 2
0110 1 1 222.6 0 2
0110 1 2 252 29.4 2
0110 2 1 210.8 0 2
0110 2 2 244.6 33.8 2
Vsize, represents the variarion of Size between Visit 1 and 2.

AdClin Solution Pack – %Table1
Page 10 of 22
The expected table of results is:
Tip 04 2 Levels + 1 Variable as columns + By-Processing J0 J2 Variation J2-J0
Trt A Trt B Trt A Trt B Trt A Trt B
N=3 N=7 N=3 N=7 N=3 N=7 Size High N 3 7 3 7 3 7 Mean (std) 220.10 (1.54) 218.36 (2.67) 251.80 (5.90) 250.46 (1.22) 31.70 (6.33) 32.10 (3.09) Median 220.50 217.40 254.80 250.40 34.20 32.30 Min / max 218.4 / 221.4 214.9 / 222.6 245.0 / 255.6 248.6 / 252.0 24.5 / 36.4 27.4 / 37.0 Low N 3 7 3 7 3 7 Mean (std) 206.07 (2.06) 212.54 (2.65) 241.70 (2.69) 240.57 (3.09) 35.63 (0.71) 28.03 (4.33) Median 205.30 212.00 240.30 240.70 35.50 28.40 Min / max 204.5 / 208.4 210.7 / 218.3 240.0 / 244.8 235.9 / 244.6 35.0 / 36.4 23.1 / 33.8
The TIP consists in grouping and repeating records from the Original VarDataSet and PopDataSet according to the “VisTrt” Colvar as below that need to derived within both datasets:
VarDataSet=“tip_Subvis” subid site visit size vsize trt VisTrt
0101 1 1 216.8 0 2 12
0101 1 2 250.6 33.8 2 22
0101 1 2 33.8 33.8 2 32
0101 2 1 210.7 0 2 12
0101 2 2 243.9 33.2 2 22
0101 2 2 33.2 33.2 2 32
0102 1 1 218.4 0 1 11
0102 1 2 254.8 36.4 1 21
0102 1 2 36.4 36.4 1 31
0102 2 1 208.4 0 1 11
0102 2 2 244.8 36.4 1 21
0102 2 2 36.4 36.4 1 31
… … … … … … …
PopDataSet=”tip_Subject” subid trt itt pp sex hight Visit VisTrt
0101 2 1 0 1 171.9 1 12
0102 1 1 1 1 169.3 1 11
0103 2 1 1 2 163.7 1 12
0104 2 1 1 1 173.2 1 12
0105 2 1 1 2 171.7 1 12
… … … … … … … …
0101 2 1 0 1 171.9 2 22
0102 1 1 1 1 169.3 2 21
0103 2 1 1 2 163.7 2 22
0104 2 1 1 1 173.2 2 22
0105 2 1 1 2 171.7 2 22
… … … … … … … …
0101 2 1 0 1 171.9 3 32
0102 1 1 1 1 169.3 3 31
0103 2 1 1 2 163.7 3 32
0104 2 1 1 1 173.2 3 32
0105 2 1 1 2 171.7 3 32
… … … … … … … …
This can be easily done with the set of statements:

AdClin Reporting System – TIPS
Page 11 of 22
*- Create: - Colvar=VisTrt as the logical combination of "Treatment" within "Visit": reflecting Treatments nested within Visits ; data tip_subvis; set main0.subvis; VisTrt = visit*10 + trt; output; *--- add variation J2-J0: e.g = replication of input data as if it was a 3rd visit...!; if visit = 2 then do; VisTrt = 30 + trt; Size = vSize; output; end; run;
*- Create: - new popdataset for %table1 reflecting the logical combination of "Treatment" within "Visit" ; data tip_subject; set main0.subject (keep=subid trt); *--- PopDataSet MUST reflect the nesting of Treatments within Visits and have the related ColVar: VisTrt.; do visit = 1, 2, 3; VisTrt = visit*10 + trt; output; end; run;
And then calling %Table1 with the following syntax:
%Table1( Popdataset=work.tip_subject, PopId=subid, popdatakey=subid VisTrt, type=univ, colall=no, ColVar=vistrt " " (11="Trt A" 12="Trt B" 21="Trt A" 22="Trt B" 31="Trt A" 32="Trt B"), ColGroups= (11 12) "J0" (21 22) "J2" (31 32) "Variation J2-J0" , VarDataSet=work.tip_subvis, by=site, Blocks= Size "Size" )
Giving: Tip 04 2 Levels + 1 Variable as columns + By-Processing
J0 J2 Variation J2-J0 Trt A Trt B Trt A Trt B Trt A Trt B
N=3 N=7 N=3 N=7 N=3 N=7 Size High N 3 7 3 7 3 7 Mean (std) 220.10 (1.54) 218.36 (2.67) 251.80 (5.90) 250.46 (1.22) 31.70 (6.33) 32.10 (3.09) Median 220.50 217.40 254.80 250.40 34.20 32.30 Min / max 218.4 / 221.4 214.9 / 222.6 245.0 / 255.6 248.6 / 252.0 24.5 / 36.4 27.4 / 37.0 Low N 3 7 3 7 3 7 Mean (std) 206.07 (2.06) 212.54 (2.65) 241.70 (2.69) 240.57 (3.09) 35.63 (0.71) 28.03 (4.33) Median 205.30 212.00 240.30 240.70 35.50 28.40 Min / max 204.5 / 208.4 210.7 / 218.3 240.0 / 244.8 235.9 / 244.6 35.0 / 36.4 23.1 / 33.8
AdClin Solution Pack – %Table1
Page 12 of 22
3. How to get several levels or variables as columns: Real Life Examples
The examples below are done from the SAS Library presented in Appendix 1. They outlines tips related to the main purpose of this TIP N° 1 from real life studies (anonymized) but also they recall useful features of %Table1.
Every time, the Table of results (HTML Output) is presented first. Then the TIP (Pre-processing) followed by the %Table1 syntax.

AdClin Reporting System – TIPS
Page 13 of 22
3.1 By procesing (+ "All") - Crossing of 2 levels in columns - N= reformatted.
Table of results: Tip 10 By procesing (+ "All") - Crossing of 2 levels in columns - N= reformatted - ITT Population
J0 J2 J3 Trt A Trt B Trt A Trt B Trt A Trt B
FD
Number of
patients N=30
Number of
patients N=20
Number of
patients N=30
Number of
patients N=20
Number of
patients N=30
Number of
patients N=20
Reader 1 Nb. Lesions 33 22 31 24 37 23 1 - Cancer and paraneoplasic 0 (0.0%) 1 (4.5%) 2 (6.5%) 0 (0.0%) 1 (2.7%) 0 (0.0%) 2 - Vascular disease (except vascular malformations) 2 (6.1%) 3 (13.6%) 2 (6.5%) 1 (4.2%) 2 (5.4%) 0 (0.0%) 3 - Tumor with no specific diagnosis 1 (3.0%) 0 (0.0%) 1 (3.2%) 0 (0.0%) 1 (2.7%) 0 (0.0%) 4 - Infectious disease 1 (3.0%) 0 (0.0%) 3 (9.7%) 2 (8.3%) 2 (5.4%) 1 (4.3%) 5 - Inflammatory disease and syringomyelia 0 (0.0%) 1 (4.5%) 0 (0.0%) 0 (0.0%) 0 (0.0%) 0 (0.0%) 6 - Traumatic lesion 1 (3.0%) 0 (0.0%) 1 (3.2%) 0 (0.0%) 2 (5.4%) 0 (0.0%) 7 - Metabolic disease 0 (0.0%) 0 (0.0%) 0 (0.0%) 0 (0.0%) 0 (0.0%) 0 (0.0%) 8 - Benign tumor 5 (15.2%) 1 (4.5%) 5 (16.1%) 6 (25.0%) 7 (18.9%) 10 (43.5%) 9 - Post operative change 3 (9.1%) 4 (18.2%) 4 (12.9%) 3 (12.5%) 3 (8.1%) 2 (8.7%) 10 - Malformative disease 0 (0.0%) 0 (0.0%) 0 (0.0%) 0 (0.0%) 0 (0.0%) 0 (0.0%) 11 - Non specific lesion 10 (30.3%) 7 (31.8%) 6 (19.4%) 11 (45.8%) 13 (35.1%) 8 (34.8%) 12 - Normal or degenerative change 10 (30.3%) 5 (22.7%) 7 (22.6%) 1 (4.2%) 6 (16.2%) 2 (8.7%) Reader 2 Nb. lesions 21 16 24 18 23 18 1 - Cancer and paraneoplasic 0 (0.0%) 0 (0.0%) 3 (12.5%) 0 (0.0%) 3 (13.0%) 0 (0.0%) 2 - Vascular disease (except vascular malformations) 2 (9.5%) 2 (12.5%) 1 (4.2%) 2 (11.1%) 1 (4.3%) 2 (11.1%) 3 - Tumor with no specific diagnosis 1 (4.8%) 0 (0.0%) 1 (4.2%) 0 (0.0%) 1 (4.3%) 0 (0.0%) 4 - Infectious disease 0 (0.0%) 0 (0.0%) 2 (8.3%) 0 (0.0%) 2 (8.7%) 0 (0.0%) 5 - Inflammatory disease and syringomyelia 1 (4.8%) 3 (18.8%) 1 (4.2%) 3 (16.7%) 1 (4.3%) 4 (22.2%) 6 - Traumatic lesion 1 (4.8%) 0 (0.0%) 1 (4.2%) 0 (0.0%) 1 (4.3%) 0 (0.0%) 7 - Metabolic disease 0 (0.0%) 0 (0.0%) 0 (0.0%) 0 (0.0%) 0 (0.0%) 0 (0.0%) 8 - Benign tumor 5 (23.8%) 3 (18.8%) 4 (16.7%) 7 (38.9%) 5 (21.7%) 6 (33.3%) 9 - Post operative change 6 (28.6%) 4 (25.0%) 6 (25.0%) 3 (16.7%) 4 (17.4%) 3 (16.7%) 10 - Malformative disease 1 (4.8%) 0 (0.0%) 1 (4.2%) 0 (0.0%) 1 (4.3%) 0 (0.0%) 11 - Non specific lesion 0 (0.0%) 2 (12.5%) 1 (4.2%) 2 (11.1%) 1 (4.3%) 2 (11.1%) 12 - Normal or degenerative change 4 (19.0%) 2 (12.5%) 3 (12.5%) 1 (5.6%) 3 (13.0%) 1 (5.6%) Reader 3 Nb. lesions 30 19 33 24 32 21 1 - Cancer and paraneoplasic 0 (0.0%) 0 (0.0%) 3 (9.1%) 1 (4.2%) 1 (3.1%) 1 (4.8%) 2 - Vascular disease (except vascular malformations) 2 (6.7%) 2 (10.5%) 0 (0.0%) 2 (8.3%) 0 (0.0%) 2 (9.5%) 3 - Tumor with no specific diagnosis 0 (0.0%) 0 (0.0%) 0 (0.0%) 1 (4.2%) 0 (0.0%) 0 (0.0%) 4 - Infectious disease 1 (3.3%) 0 (0.0%) 1 (3.0%) 0 (0.0%) 1 (3.1%) 0 (0.0%) 5 - Inflammatory disease and syringomyelia 0 (0.0%) 0 (0.0%) 0 (0.0%) 0 (0.0%) 0 (0.0%) 0 (0.0%) 6 - Traumatic lesion 0 (0.0%) 0 (0.0%) 1 (3.0%) 0 (0.0%) 1 (3.1%) 0 (0.0%) 7 - Metabolic disease 0 (0.0%) 0 (0.0%) 0 (0.0%) 0 (0.0%) 0 (0.0%) 0 (0.0%) 8 - Benign tumor 4 (13.3%) 3 (15.8%) 5 (15.2%) 9 (37.5%) 2 (6.3%) 7 (33.3%) 9 - Post operative change 2 (6.7%) 4 (21.1%) 6 (18.2%) 2 (8.3%) 7 (21.9%) 4 (19.0%) 10 - Malformative disease 0 (0.0%) 1 (5.3%) 0 (0.0%) 1 (4.2%) 0 (0.0%) 0 (0.0%) 11 - Non specific lesion 15 (50.0%) 7 (36.8%) 11 (33.3%) 2 (8.3%) 13 (40.6%) 4 (19.0%) 12 - Normal or degenerative change 6 (20.0%) 2 (10.5%) 6 (18.2%) 6 (25.0%) 7 (21.9%) 3 (14.3%) All Readers Nb. lesions 84 57 88 66 92 62 1 - Cancer and paraneoplasic 0 (0.0%) 1 (1.8%) 8 (9.1%) 1 (1.5%) 5 (5.4%) 1 (1.6%) 2 - Vascular disease (except vascular malformations) 6 (7.1%) 7 (12.3%) 3 (3.4%) 5 (7.6%) 3 (3.3%) 4 (6.5%) 3 - Tumor with no specific diagnosis 2 (2.4%) 0 (0.0%) 2 (2.3%) 1 (1.5%) 2 (2.2%) 0 (0.0%) 4 - Infectious disease 2 (2.4%) 0 (0.0%) 6 (6.8%) 2 (3.0%) 5 (5.4%) 1 (1.6%) 5 - Inflammatory disease and syringomyelia 1 (1.2%) 4 (7.0%) 1 (1.1%) 3 (4.5%) 1 (1.1%) 4 (6.5%) 6 - Traumatic lesion 2 (2.4%) 0 (0.0%) 3 (3.4%) 0 (0.0%) 4 (4.3%) 0 (0.0%) 7 - Metabolic disease 0 (0.0%) 0 (0.0%) 0 (0.0%) 0 (0.0%) 0 (0.0%) 0 (0.0%) 8 - Benign tumor 14 (16.7%) 7 (12.3%) 14 (15.9%) 22 (33.3%) 14 (15.2%) 23 (37.1%) 9 - Post operative change 11 (13.1%) 12 (21.1%) 16 (18.2%) 8 (12.1%) 14 (15.2%) 9 (14.5%) 10 - Malformative disease 1 (1.2%) 1 (1.8%) 1 (1.1%) 1 (1.5%) 1 (1.1%) 0 (0.0%) 11 - Non specific lesion 25 (29.8%) 16 (28.1%) 18 (20.5%) 15 (22.7%) 27 (29.3%) 14 (22.6%) 12 - Normal or degenerative change 20 (23.8%) 9 (15.8%) 16 (18.2%) 8 (12.1%) 16 (17.4%) 6 (9.7%)

AdClin Solution Pack – %Table1
Page 14 of 22
Statements:
%Title( tip 10 By procesing (+ "All") - Crossing of 2 levels in columns - N= reformatted - ITT population) *--- Start TIP for %table1----------------------------------------------------------; *- Create: - Records for All readers: e.g: Reader 4 - Colvar=readtrt for %table1 as the logical combination of "Reading" with "Treatment" reflecting Treatments nested within Readings ; data _tip; set main1.xsubrlv; readtrt = reading*10 + trt; output; *--- add all readers records: e.g = replication of input data; reader = "4"; output; run; *- Create: - new popdataset for %table1 reflecting the logical combination of "Reading" with "Treatment" ; data ref_tip; set main1.subject (keep=subid trt itt); do reading = 1 to 3; readtrt = reading*10 + trt; output; end; run; *- Create: - new format for N= line - format for the new ByVariable "reader" ; proc format; picture _NEqualP (round default=25) /* display missing as - */ ._ - .Z = "N=-" /* display negative numbers surrounded with stars */ low-<0 = "0000000000000009 ***" (prefix="Number§of§patients§N=-" fill="*") /* display other values as N=x */ 0-high = "0000000000000009" (prefix="Number§of§patients§N=") ;
value $reader "1" = "Reader 1" "2" = "Reader 2" "3" = "Reader 3" "4" = "All Readers" ; run; *--- End TIP------------------------------------------------------------------------;
%Table1( Popdataset=work.ref_tip, PopId=subid, PopFilter=itt=1, PopDatakey=subid readtrt, BoxText="FD", PctCol=nonmiss, Type=Freq, ColAll=no, NFormat=_NEqualP., ColVar=readtrt " " (11="Trt A" 12="Trt B" 21="Trt A" 22="Trt B" 31="Trt A" 32="Trt B"), ColGroups= (11 12) "J0" (21 22) "J2" (31 32) "J3", ValueSource=format, By=reader $reader., ByInBlocks=no, VarDataset=work._tip, Blocks= _one_@(fd>.Z) "Nb. lesions" pctcol=no/ fd " " / )

AdClin Reporting System – TIPS
Page 15 of 22
3.2 By procesing - Crossing of 2 levels in columns - Hiding missing values
Table of results: Tip 11 By procesing - Crossing of 2 levels in columns - Hiding missing values - ITT Population
J0 J2 J3 Trt A Trt B Trt A Trt B Trt A Trt B
IQ
N=30 N=20 N=30 N=20 N=30 N=20 On T1 J0 Reader 1 Number of sequences 30 20 30 20 Mean (std) 1.13 (0.35) 1.20 (0.41) 1.10 (0.31) 1.15 (0.37) Min - median - max 1.0 - 1.00 -
2.0 1.0 - 1.00 -
2.0 1.0 - 1.00 -
2.0 1.0 - 1.00 -
2.0
Reader 2 Number of sequences 30 19 30 20 Mean (std) 1.83 (0.38) 2.00 (0.33) 1.90 (0.31) 2.00 (0.32) Min - median - max 1.0 - 2.00 -
2.0 1.0 - 2.00 -
3.0 1.0 - 2.00 -
2.0 1.0 - 2.00 -
3.0
Reader 3 Number of sequences 30 20 30 20 Mean (std) 1.30 (0.47) 1.30 (0.47) 1.50 (0.51) 1.70 (0.57) Min - median - max 1.0 - 1.00 -
2.0 1.0 - 1.00 -
2.0 1.0 - 1.50 -
2.0 1.0 - 2.00 -
3.0
On T1 J3 Reader 1 Number of sequences 30 20 30 20 Mean (std) 1.10 (0.31) 1.20 (0.41) 1.03 (0.18) 1.00 (0.00) Min - median - max 1.0 - 1.00 -
2.0 1.0 - 1.00 -
2.0 1.0 - 1.00 -
2.0 1.0 - 1.00 -
1.0 Reader 2 Number of sequences 30 20 30 20 Mean (std) 1.90 (0.31) 2.00 (0.32) 1.93 (0.25) 2.00 (0.32) Min - median - max 1.0 - 2.00 -
2.0 1.0 - 2.00 -
3.0 1.0 - 2.00 -
2.0 1.0 - 2.00 -
3.0 Reader 3 Number of sequences 30 20 30 20 Mean (std) 1.50 (0.51) 1.60 (0.60) 1.17 (0.38) 1.15 (0.37) Min - median - max 1.0 - 1.50 -
2.0 1.0 - 2.00 -
3.0 1.0 - 1.00 -
2.0 1.0 - 1.00 -
2.0
Statements:
%Title( tip 11 By procesing - Crossing of 2 levels in columns - Hiding missing values - ITT Population) *--- Start TIP for %table1----------------------------------------------------------; *- Create: - Colvar=readtrt for %table1 as the logical combination of "Reading" with "Treatment" reflecting Treatments nested within Readings ; data _tip; set main1.subrv; readtrt = reading*10 + trt; run; *- Create: - new popdataset for %table1 reflecting the logical combination of "Reading" with "Treatment" ; data ref_tip; set main1.subject (keep=subid trt itt); do reading = 1 to 3; readtrt = reading*10 + trt; output; end; run; *--- End TIP------------------------------------------------------------------------;

AdClin Solution Pack – %Table1
Page 16 of 22
%Table1( Popdataset=work.ref_tip, PopId=subid, popfilter=itt=1, popdatakey=subid readtrt, boxtext="IQ", pctcol=nobs, type=univ, colall=no, ColVar=readtrt " " (11="Trt A" 12="Trt B" 21="Trt A" 22="Trt B" 31="Trt A" 32="Trt B"), ColGroups= (11 12) x1 "J0" (21 22) "J2" (31 32) "J3", UnivLayout=( "Number of sequences" ! n ; mean "_(" std ")" ; min "_-_" median "_-_" max), vardataset=work._tip, by=reader, byprefix="Reader ", Blocks= iqual1 "On T1 J0" cells=( 1 31 = (" ") 2 31 = (" ") 3 31 = (" ") 1 32 = (" ") 2 32 = (" ") 3 32 = (" ") )/ iqual4 "On T1 J3" cells=( 1 11 = (" ") 2 11 = (" ") 3 11 = (" ") 1 12 = (" ") 2 12 = (" ") 3 12 = (" ") )/ )
3.3 Crossing of 2 heterogeneous levels in columns - External Anova results
Table of results: Tip 12 Crossing of 2 heterogeneous levels in columns - External Anova results - ITT Population
J0 J3 Variation J3-J0 Trt A Trt B Trt A Trt B Trt A Trt B
Contrast Score
N=30 N=20 N=30 N=20 N=30 N=20
Test
All Readers Number of lesions 84 57 92 62 54 39 Mean (std) 1.52 (0.64) 1.54 (0.71) 2.04 (0.65) 2.05 (0.80) 0.55 (0.65) 0.41 (0.79) Median 2.00 1.00 2.00 2.00 1.00 0.00 Min - max 0.0 - 3.0 0.0 - 3.0 1.0 - 3.0 1.0 - 3.0 -1.0 - 2.0 -1.0 - 2.0
Anova° results: Trt A - Trt B: Mean(SE) = 0.130 (0.182) Pr > T = 0.4791 95% I.C = -0.24 ; 0.50 Treatment: p-value = 0.4791 Reader: p-value = 0.3355 Treatment x Reader: p-value = 0.0843
° Contrast Score = Treatment + Reader + Treatment x Reader, repeated Reader / subject=Lesion(Patient) type=CS Pre Reading Carried Forward procedure applied in 0 % of lesions in post-reading.
Statements:
%Title( tip 12 Crossing of 2 heterogeneous levels in columns - External Anova results - ITT Population) *--- Start TIP for %table1----------------------------------------------------------; *- Create: - Colvar=readtrt for %table1 as the logical combination of "Reading" with "Treatment" reflecting Treatments nested within Readings ; data _tip; set main1.xsubrlv; readtrt = reading*10 + trt; output; *--- add variation J3-J0: e.g = replication of input data; if reading = 3 then do; readtrt = 90 + trt; prcfcs = vprcfcs; output; end; run; *- Create: - new popdataset for %table1 reflecting the logical combination of "Reading" with "Treatment" ; data ref_tip; set main1.subject (keep=subid trt itt); do reading = 1,3,9 ; readtrt = reading*10 + trt; output; end; run;

AdClin Reporting System – TIPS
Page 17 of 22
*- Create: - format for Anova sources of variations ; proc format; value $effect "trt" = "Treatment" "reader" = "Reader" "trt*reader" = "Treatment x Reader" ; run; *- Pre Reading Carried Forward procedure applied in x "% of lesions in post-reading; proc sql noprint; select sum(prcf=1 and cs<=.Z) as nbprcf, sum(cs<=.Z) as Nbles into : nbprcf, :nbles from _tip where readtrt>90 and itt=1 ;
quit; %let pctprcf = %sysfunc(round(&nbprcf/&nbles*100,0.01)); *--- End TIP------------------------------------------------------------------------; *- anova model; ods output estimates=est tests3=sources; proc mixed data=main1.subrl (where=(itt=1)) method=REML order=internal; class subid trt concles reader ; model vprcfcontrapo_pr = trt reader trt*reader; repeated reader/ type=CS subject=concles(subid); estimate "Trt A - Trt B" trt 1 -1 / cl alpha = .05; title "&_rpTitle - Anova"; run; ods output close;
*- Table output; %Table1( Popdataset=ref_tip, PopId=subid, popfilter=itt=1, popdatakey=subid readtrt, boxtext="Contrast Score", type=univ, colall=no, ColVar=readtrt " " (11="Trt A" 12="Trt B" 31="Trt A" 32="Trt B" 91="Trt A" 92="Trt B" ), ColGroups= (11 12) x1 "J0" (31 32) "J3" (91 92) "Variation J3-J0", UnivLayout=( "Number of lesions" ! n ; mean "_(" std ")" ; median ; min "_-_" max), vardataset=_tip, varfilter=reading in (1 3), Blocks= prcfcs "All Readers" type=univ test=("Anova° results:"; "___Trt A - Trt B: Mean(SE) = " [work.est.estimate] 12.3 "_(" [work.est.stderr] 12.3)" ; "___Pr > T_=_" [work.est.probt] pvalue6.4; "___95% I.C = " [work.est.lower] 12.2 " ; " [work.est.upper] 12.2; "___Treatment: p-value = " [work.sources.probf]@(effect="trt") pvalue6.4 ; "___Reader: p-value = " [work.sources.probf]@(effect="reader") pvalue6.4 ; "___Treatment x Reader: p-value = " [work.sources.probf]@(effect="trt*reader") pvalue6.4 )/ ) %addnote(° Contrast Score = Treatment + Reader + Treatment x Reader,§__repeated Reader / subject=Lesion(Patient) type=CS) %addnote(Pre Reading Carried Forward procedure applied in &pctprcf % of lesions in post-reading.)

AdClin Solution Pack – %Table1
Page 18 of 22
Appendix 1. SAS Librarie Main1
DataSets and Vaiables
Dataset name Variable name Variable label
SUBJECT Trt Treatment
SUBJECT Itt ITT1 (ITT and T1 pre sequence available
SUBJECT Subid
SUBRL Reader Reader
SUBRL Concles Concordance lesion number
SUBRL vprcfcontrapo_pr Contrast Score: Post - Pre Variation (PRCF)
SUBRL Subid
SUBRL Trt Treatment
SUBRL Itt ITT1 (ITT and T1 pre sequence available
SUBRV Reader Reader
SUBRV Reading Reading
SUBRV iqual1 Image quality : T1 SE (Pre)
SUBRV iqual4 Image quality : T1 SE (Post)
SUBRV Fcp Recoded Final Characterization of the Patient
SUBRV Ocp Recoded Overall Characterization of the Patient
SUBRV Subid
SUBRV Trt Treatment
SUBRV Itt ITT1 (ITT and T1 pre sequence available
XSUBRLV Vprcfcs Change in Contrast Score (PRCF)
XSUBRLV Reader Reader
XSUBRLV Concles Lesion number
XSUBRLV Reading Reading
XSUBRLV Prcfcs Contrast Score (Mean Summary + PRCF)
XSUBRLV Prcf
XSUBRLV Fd
XSUBRLV Subid
XSUBRLV Trt Treatment
XSUBRLV Itt ITT1 (ITT and T1 pre sequence available
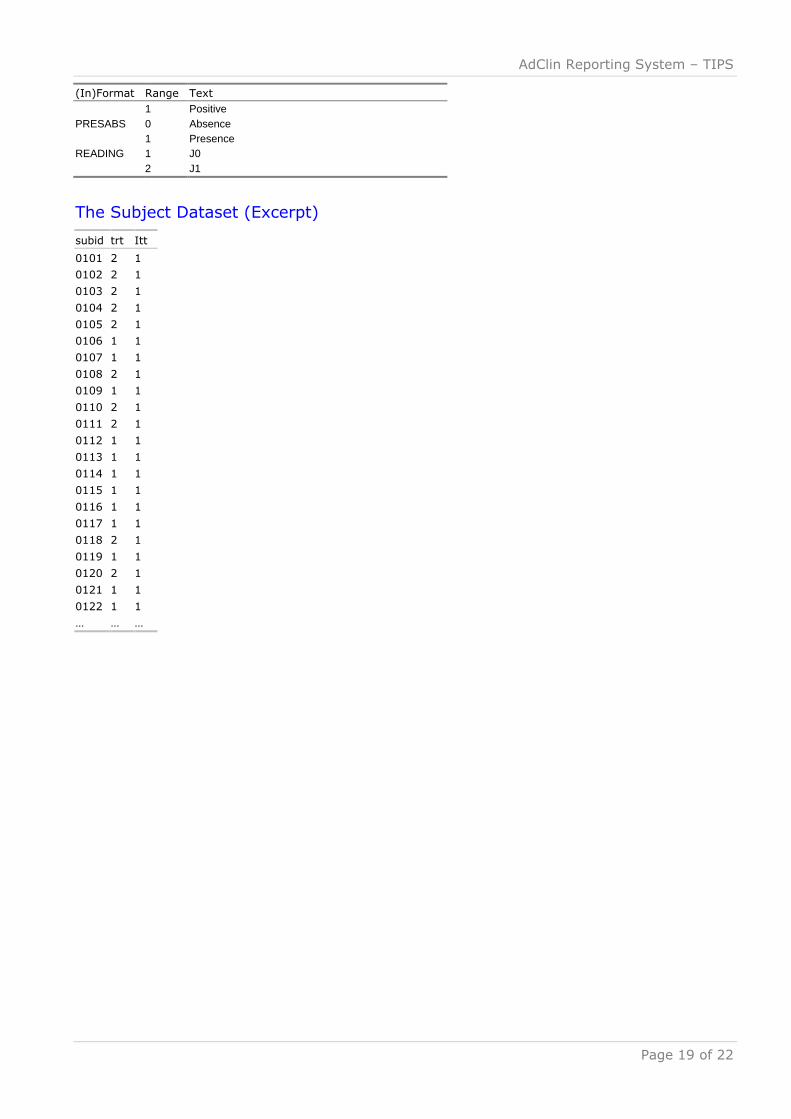
Content of Formats
(In)Format Range Text GROUP 1 1 - Cancer and paraneoplasic 2 2 - Vascular disease (except vascular malformations) 3 3 - Tumor with no specific diagnosis 4 4 - Infectious disease 5 5 - Inflammatory disease and syringomyelia 6 6 - Traumatic lesion 7 7 - Metabolic disease 8 8 - Benign tumor 9 9 - Post operative change 10 10 - Malformative disease 11 11 - Non specific lesion 12 12 - Normal or degenerative change NEGPOS 0 Negative
AdClin Reporting System – TIPS
Page 19 of 22
(In)Format Range Text 1 Positive PRESABS 0 Absence 1 Presence READING 1 J0 2 J1
The Subject Dataset (Excerpt)
subid trt Itt
0101 2 1
0102 2 1
0103 2 1
0104 2 1
0105 2 1
0106 1 1
0107 1 1
0108 2 1
0109 1 1
0110 2 1
0111 2 1
0112 1 1
0113 1 1
0114 1 1
0115 1 1
0116 1 1
0117 1 1
0118 2 1
0119 1 1
0120 2 1
0121 1 1
0122 1 1
… … …

AdClin Solution Pack – %Table1
Page 20 of 22
The SubRL Dataset (Excerpt)
subid reader concles vprcfcontrapo_pr trt itt
0101 1 1 . 2 1
0101 1 2 . 2 1
0101 1 3 . 2 1
0101 2 2 . 2 1
0101 2 3 . 2 1
0102 1 1 0 2 1
0102 1 2 1 2 1
0102 1 3 . 2 1
0102 2 1 0 2 1
0102 3 1 0 2 1
0102 3 2 0 2 1
0103 . . 2 1
0104 1 1 1 2 1
0104 1 2 0 2 1
0104 1 4 . 2 1
0104 2 2 0 2 1
0104 2 3 -1 2 1
0104 2 5 . 2 1
0104 3 1 0 2 1
0104 3 2 0 2 1
0105 1 1 . 2 1
0105 1 3 . 2 1
0105 2 3 . 2 1
0105 3 1 . 2 1
0105 3 2 . 2 1
0105 3 3 . 2 1
0106 1 1 0 1 1
0106 1 2 0 1 1
0106 2 1 1 1 1
0106 2 2 1 1 1
0106 2 3 0 1 1
0106 3 1 . 1 1
0106 3 2 . 1 1
0106 3 3 1 1 1
0106 3 4 . 1 1
… … … … … …

AdClin Reporting System – TIPS
Page 21 of 22
The SubRV Dataset (Excerpt)
subid reader reading iqual1 iqual4 fcp ocp trt itt
0101 1 1 1 . 0 0 2 1
0101 1 2 1 1 0 0 2 1
0101 1 3 . 1 0 0 2 1
0101 2 1 2 . 0 0 2 1
0101 2 2 2 2 0 0 2 1
0101 2 3 . 2 0 0 2 1
0101 3 1 1 . 0 0 2 1
0101 3 2 1 1 0 0 2 1
0101 3 3 . 1 0 0 2 1
0102 1 1 1 . 0 1 2 1
0102 1 2 1 1 0 1 2 1
0102 1 3 . 1 0 1 2 1
0102 2 1 2 . 0 0 2 1
0102 2 2 2 2 0 0 2 1
0102 2 3 . 2 0 0 2 1
0102 3 1 1 . 0 0 2 1
0102 3 2 2 2 0 0 2 1
0102 3 3 . 1 0 0 2 1
0103 1 1 2 . 0 0 2 1
0103 1 2 1 1 0 0 2 1
0103 1 3 . 1 0 0 2 1
0103 2 1 2 . 0 0 2 1
0103 2 2 2 2 0 0 2 1
0103 2 3 . 2 0 0 2 1
0103 3 1 1 . 0 0 2 1
0103 3 2 2 2 0 0 2 1
0103 3 3 . 1 0 0 2 1
… … … … … … … … …

AdClin Solution Pack – %Table1
Page 22 of 22
The XSubRLV Dataset (Excerpt)
subid reader concles reading vprcfcs prcfcs prcf fd trt itt
0101 1 1 1 0 3 0 11 2 1 0101 1 1 2 . . 0 . 2 1 0101 1 1 3 . . 0 . 2 1 0101 1 2 1 0 1 0 11 2 1 0101 1 2 2 . . 0 . 2 1 0101 1 2 3 . . 0 . 2 1 0101 1 3 1 . . 0 . 2 1 0101 1 3 2 . 1 0 11 2 1 0101 1 3 3 . 1 0 11 2 1 0101 2 2 1 0 1 0 5 2 1 0101 2 2 2 . . 0 . 2 1 0101 2 2 3 . . 0 . 2 1 0101 2 3 1 . . 0 . 2 1 0101 2 3 2 . 1 0 5 2 1 0101 2 3 3 . 1 0 5 2 1 0102 1 1 1 0 2 0 9 2 1 0102 1 1 2 1 3 0 11 2 1 0102 1 1 3 0 2 0 9 2 1 0102 1 2 1 0 1 0 8 2 1 0102 1 2 2 2 3 0 8 2 1 0102 1 2 3 1 2 0 8 2 1 0102 1 3 1 . . 0 . 2 1 0102 1 3 2 . . 0 . 2 1 0102 1 3 3 . 3 0 8 2 1 0102 2 1 1 0 3 0 9 2 1 0102 2 1 2 0 3 0 9 2 1 0102 2 1 3 0 3 0 9 2 1 0102 3 1 1 0 2 0 9 2 1 0102 3 1 2 . . 0 . 2 1 0102 3 1 3 0 2 0 9 2 1 0102 3 2 1 0 2 0 8 2 1 0102 3 2 2 1 3 0 8 2 1 0102 3 2 3 0 2 0 8 2 1 … … … … … … … … … …