adapting bridge infrastructure to climate change
TRANSCRIPT
ORIGINAL ARTICLE
Adapting bridge infrastructure to climate change:institutionalizing resilience in intergovernmentaltransportation planning processesin the Northeastern USA
Anna Schulz1 & Asim Zia1 & Christopher Koliba1
Received: 9 March 2015 /Accepted: 8 July 2015# Springer Science+Business Media Dordrecht 2015
Abstract Multi-level governance networks provide both opportunities and challenges tomainstream climate change adaptation due to their routine decision-making and coordinationprocesses. This paper explores institutionalizing resilience and adaptation to climate change inthe intergovernmental transportation planning processes that address bridge infrastructure inthe Northeastern United States (USA), specifically in Vermont and Maine. The researchpresented here relies on nine interviews with policy-makers and planners, a survey oftransportation project prioritization criteria, development of a longitudinal bridge fundingdatabase, and its integration with publicly available geospatial data. It presents a novel spatialanalysis methodology, a modified version of which could be adopted by transportationagencies for prioritizing scarce adaptation funds. Although transportation agencies are under-taking a variety of mitigation activities to address business-as-usual needs, climate changeadaptation and resilience efforts remain underprioritized. Adaptation is a global concern, butimpacts vary dramatically between regions and require localized solutions. Bridges andculverts, which are especially vulnerable to climate-induced flooding impacts, have complexmaintenance and design processes and are subject to convoluted adaptation planning proce-dures. Critical gaps in resources and knowledge are barriers to improved adaptation planning.Restructuring the transportation project prioritization procedures used by planning organiza-tions to explicitly include adaptation may provide a novel strategy to institutionalize resiliencein transportation. These procedures must be considered in the context of the intergovernmentalnetworks that exist to support transportation infrastructure. Although these networks will likelyvary across countries, the approaches introduced here to study and address transportationinfrastructure adaptation may be applied to many settings.
Mitig Adapt Strateg Glob ChangeDOI 10.1007/s11027-015-9672-x
* Anna [email protected]
1 Department of Community Development and Applied Economics, University of Vermont, MorrillHall 102, 146 University Place, Burlington, VT 05405, USA
Keywords Adaptation.Bridgeinfrastructure .Climatechange .Geospatialanalysis .Multi-levelgovernance . Transportation planning . Resilience to extreme events . Institutional design
1 Introduction
Extreme events induced by global climate change, such as more persistent rainfall leading toflooding or more intense tropical storms, pose ominous risks to transportation infrastructureacross the globe (Jaroszweski et al. 2010). The majority of the literature on transportation andclimate change focuses on mitigation (e.g., the role of transportation in carbon reduction)(Schmidt and Meyer 2009). More research is needed on the impacts of global climate changeon transportation infrastructure (e.g., see Hunt and Watkiss 2011) and, consequently, ontransportation system adaptation and resilience as well. This paper employs the followingdefinitions of key terms relevant to the impacts of climate change on transportation infrastruc-ture: resilience is “the capacity of a system to absorb disturbances and retain essentialprocesses” (Savonis et al. 2008), and adaptation, which is specific to the processes that areundertaken to result in system resilience, is defined here as “the development, modification,maintenance, and renewal of transportation infrastructure, operations, and policy to moderatethe impacts of climate change” (Oswald and McNeil 2013). In the Intergovernmental Panel onClimate Change’s (IPCC’s) Fifth Assessment Report, Revi et al. (2014, p. 562) concluded thattransportation systems are “a difficult sector to adapt due to large existing stock, especially incities in developed countries, leading to potentially large secondary economic impacts withregional and potentially global consequences for trade and business. Emergency responserequires well-functioning transport infrastructure.” The IPCC synthesis team concluded (Reviet al. 2014, p. 563) that there is relatively less literature available on understanding the role of“local government decisions to include adaptation in plans and investment programs.” Thelocal government decisions are, however, typically embedded in intergovernmental networks,some of which extend beyond public–public intergovernmental configuration, into governancenetworks comprised of public, private, and civil society actors (Koliba et al. 2010). Coordi-nation among national, regional, and local level agencies in such governance networks iscritical for implementing adaptation strategies in the transport sector, as climate changeimpacts are widespread and extend across scales (Regmi and Hanaoka 2011).
Multi-level governance systems provide both opportunities and challenges to mainstream/integrate adaptation in their routine decision-making and coordination processes. While someinternational studies (Lowe et al. 2009; Kehew et al. 2013) have found that mainstreamingadaptation into urban, regional and transportation planning, land use management, and legaland regulatory frameworks is critical for successful adaptation, other studies have found thatmany of these multi-level governance networks are intergovernmental, cross-institutional, andcomplex, operating at vastly different scales and timelines with often conflicting stakeholdersand high uncertainty (Roberts and O’Donoghue 2013). In this paper, we explore the potentialof institutionalizing resilience and adaptation into the transportation planning processes. Wefocus on investigating the potential of adaptation to climate change integration in the inter-governmental planning processes that address bridge infrastructure maintenance and develop-ment in the Northeastern USA.
Increasing trends in mean and extreme precipitation have been relatively large in theNortheastern United States (USA) compared to other regions. Sea levels in the northeast havealready risen by roughly 1 ft and are on track to rise another 1 to 4 ft further by the end of the
Mitig Adapt Strateg Glob Change
century (Horton et al. 2014). Annual precipitation has increased by 8 % since 1991 relative to1901–1960, while extreme precipitation, defined as the 1 % of rainiest days, has increased over50 % 2001–2012 relative to 1901–1960 (Walsh et al. 2014). This observed increase in meanand extreme precipitation across the Northeast USA is projected to continue into the future.For example, the current 1 in 20-year (1981–2000) storm is expected to occur three to fourtimes more often by the end of the century under Representative Concentration Pathway(RCP) 8.5 (Walsh et al. 2014). The state of Vermont received disaster relief funds from theFederal Emergency Management Agency (FEMA) a record 11 times in the 5 years between2007 and 2011, almost double that of any other 5-year period since 1962 (Johnson 2012).Thus, the measures that northeastern states take to address the role of climate change impactson its transportation infrastructure can serve as important guideposts for other jurisdictionsacross the globe facing similar, increased high precipitation extreme events.
The implications of climate change for transportation are varied and complex. Highertemperatures may cause asphalt to wear faster and expansion joints to suffer. Heavier rainfalland more storms are indicative of more runoff and flooding, both of which have the potentialto stress bridges, culverts, and low-lying roadways. Rising seas will force the elevation ofcoastal infrastructure. All of the above, taken together, present high risk and exposure and apersuasive argument for adaptation.
This paper focuses on two very important features of designing resilient and adaptivetransportation infrastructure, namely, how and to what extent are the intergovernmentalnetworks in selected regions undertaking planning and implementation practices to adapttransportation infrastructure, specifically bridge infrastructure, to the threats posed by climatechange? And how does spatial scale, scope of the landscape, and other features affect localjurisdictions’ exposure to flooding risk for sustaining bridge infrastructure in the face ofclimate change and can such risk assessment methods at higher governance level (e.g., state)be used to prioritize bridge adaptation funding?
In the USA, transportation governance follows a very hierarchical/multi-level structure. Thefederal (national) level is responsible for crafting major legislation, distributing funding, andimposing requirements on the states. Each of the 50 states has its own Department ofTransportation (DOT), which coordinates overall state transportation policies, assemblescomprehensive state-wide plans, and oversees projects within state boundaries. Within states,there are even smaller organizations as well: Metropolitan Planning Organizations (MPOs)manage transportation planning in urban areas, while Regional Planning Commissions (RPCs)are responsible for more rural areas. The geographic scope of the USA results in differingadaptation needs across and sometimes within states. Political control and recent experienceswith disaster may also influence states’ adaptation priorities.
The Northeastern USA has suffered from recent storms that point toward a need forimproved resilience. In August of 2011, Vermont was hit especially hard by Tropical StormIrene, which caused an estimated $250 million of damage to transportation infrastructurealone. In addition to the approximately 200 bridges that were damaged on state roads,municipalities had to repair or replace another 280 bridges and 960 culverts (Johnson 2012).The Vermont Agency of Transportation (known as VTrans) responded quickly to rebuild, butas importantly, the disaster spurred the agency—as a state-level organization—to formalize itsstance on climate change adaptation. In a white paper released a year after Tropical StormIrene, VTrans outlines its goals and procedures for adaptation and also notes roadblocks andpotential improvement actions. Among the roadblocks are regulatory constraints, forecastingdifficulties, political tensions, and, above all, budgetary restrictions. Some noted opportunities
Mitig Adapt Strateg Glob Change
for improvement include standardization and digitization of records, infrastructure resiliencemonitoring, the expansion of asset inventories, and updating project prioritization guidelines(Johnson 2012). Not long after Tropical Storm Irene, in 2012, Super Storm Sandy causedapproximately $5.7 billion worth of damage to transportation infrastructure in the states ofNew Jersey and New York alone, a figure that does not include the costs associated with themulti-day paralysis of the transportation network in America’s most populous region (USGovernment Accountability Office 2014). Devastating storms may force transportation agen-cies to reconsider the risks posed to infrastructure and the potential costs of infrastructurefailure. Funding constraints, however, may dictate priorities.
As of the writing of this article, the USA awaits passage of a federal transportation fundingauthorization, with the current funding set to expire at the end of July 2015. The previous bill,titled “Moving Ahead for Progress in the 21st Century” (abbreviated “MAP-21”), barelytouches upon the issue of resilience and adaptation. While the US transportation budget isconstrained, mere maintenance of the existing infrastructure with existing specificationsthreatens the system’s long-term sustainability. Even keeping the system intact in its currentform is growing more expensive in the face of climate change: as extreme weather becomesmore frequent and more severe, state-level DOTs report that maintenance costs continue to rise(Venner and Zamurs 2012).
Research suggests that, in the absence of federal requirements for integrating adaptationinto planning, both some state DOTs and regional MPOs are beginning to tackle the task ontheir own, particularly in areas that are seeing impacts (Gallivan et al. 2009; McBeath 2003;Walker et al. 2011). The absence of explicit language encouraging adaptation certainly doesnot prohibit organizations from interpreting mandated actions (such as increasing the safetyand security of the system) to include climate-related factors. Some agencies have begun toincorporate climate planning through long-range transportation plans, which are mandated bythe federal government and have a 20-year timeframe. A 2009 study of a dozen proactiveorganizations, all of which explicitly included climate change in their long-range transportationplans, yielded mixed results: some only addressed mitigation, while others referred to adap-tation as a vague goal without specific steps (Gallivan et al. 2009).
A study conducted in 2011 focused on the northwestern corner of the USA and the state ofAlaska. It examined both long-range transportation plans and climate action plans, which havebeen developed by many cities, counties, and states. In general, the region was found to beahead of the national trend, with almost all agencies having completed climate action plans andmany touching on the idea of adaptation (Walker et al. 2011). Similar to other regions,however, the long-range transportation plans tended to skip discussion of climate changeentirely, focus exclusively on mitigation, or only briefly mention adaptation in a non-action-oriented context (Walker et al. 2011). Despite an awareness of the potential impacts of climatechange, agencies did not present strategies to adapt transportation infrastructure. The researchhighlighted a fundamental disconnect between climate planning and transportation planning.
The USA is not alone in its struggle to incorporate climate adaptation measures intotransportation planning. Many of Asia’s coastal and island nations are already struggling withthe effects of climate change, but studies relating to adaptation measures are limited. A 2009survey assessed various factors relating to transportation adaptation in Asia, including levels ofawareness, coordination and response to climate emergencies, adequacy of design standards,and adequacy of current policies (Regmi and Hanaoka 2011). The respondents, transportationprofessionals from 21 widely dispersed Asian nations, cited a need for improved awareness ofthe transportation challenges posed by climate change, a desire for better inter-agency
Mitig Adapt Strateg Glob Change
collaboration, and concerns over both funding and technical support for adaptation planningand implementation (Regmi and Hanaoka 2011).
Perhaps the most comprehensive assessment to date of literature on adapting transportationto climate change was authored by Eisenack et al. (2012). They note that while extensiveresearch has been done regarding the influence of climate change on ecosystem, little literaturefocuses on the adaptation needs of the transportation sector and what literature does exist endsto be impractically specific or overly broad. The authors ultimately determine that there maybe a need for adaptation actions that can bridge the difference between those categories andbegin to provide insight toward best practices (Eisenack et al. 2012).
In 2013, a review of climate adaptation activities across the USA identified seven primarybarriers to adaptation planning and implementation: uncertainty in the decision-making pro-cess about climate change; lack of resources; fragmented decision-making; institutionalconstraints; lack of leadership; and divergent perceptions relating to risk, cultures, and values(Bierbaum et al. 2013). Ultimately, the review recommended pursuing low-risk strategies,engagement of stakeholders, and sharing of best practices (Bierbaum et al. 2013). Anotheranalysis comparing state-level climate action plans across the USA and examining potentialinfluencing factors found that most states have yet to incorporate adaptation planning and,even among the 13 most forward-thinking states, only 3 (Connecticut, Minnesota, and NewYork) formally addressed transportation in their adaptation planning efforts (Lysák and Bugge-Henricksen 2014). Influencing factors were shown to include political affiliation of stateleadership, state gross domestic product (GDP), and coastal population levels.
In the USA, a growing body of literature provides suggestions on how state and localorganizations could integrate adaptation into transportation planning. The National Transpor-tation Policy Project released a white paper on transportation adaptation to climate change thatlists a number of specific strategies for integrating climate change adaptation into current USpolicy, all of which fall into one of five main categories: research; planning; design standards;project delivery and the environmental review process; and funding, performance, and ac-countability (Cambridge Systematics 2009). Most of the recommended policies target thefederal legislature. Federal policies can have broad-reaching effects, making them well-suitedto mitigation, which needs to be addressed at as large a scale as possible to effectively combatcollective greenhouse gas emissions. Adaptation, however, is not only a global- or federal-scale issue: the variability of climate-related impacts in any given region requires regionallytailored approaches to appropriately address specific needs (IPCC 2013). State and regionalpolicies and planning processes provide smaller-scale adjustments through which adaptationcould be addressed. Long-range transportation plans developed at the regional level canformalize adaptation methodologies that are replicable from region-to-region and have step-by-step processes that include capacity analysis, risk assessment, inventory evaluation, andmonitoring, among other techniques (Oswald and McNeil 2013). Some suggested frameworksare more conceptual, with broader, more flexible steps that allow planning to be tailored to awider variety of organizations and plan types (Schmidt and Meyer 2009). Others suggest thatadaptation hinges on national priorities, the education of policy-makers, performance-basedplanning, land use concerns, and communication and collaboration (Plumeau and Lawe 2009).
A less-studied strategy for incorporating adaptation is through the modification of priori-tization procedures used by MPOs and state DOTs for selecting transportation projects forfunding. Because transportation funding is so limited and the number of prospective projects isso great, MPOs and state DOTs are forced to prioritize which projects are most necessary eachyear (or two, depending on the location). MPOs have substantial control over which projects
Mitig Adapt Strateg Glob Change
are funded within their boundaries; state DOTs are responsible for selecting projects from non-metropolitan regions with limited input from local planning commissions. Each MPO and statehas its own procedures for selecting which projects to include. Factors such as safety,pavement condition, and average daily traffic are among the criteria commonly incorporatedinto prioritization procedures. Some states and MPOs employ highly quantitative methods thatassign points if a project meets specific criteria, while others employ less formal, morequalitative methods.
The Boston Region MPO, which oversees transportation in one of the northeast’s biggestcities, is one of the few organizations that include adaptation-related components in their actualproject prioritization procedures. Out of a total possible 154 points, projects can earn up to 6points for their “ability to respond to extreme conditions,” with two of those points relatingdirectly to sea level-rise and flooding (Boston Region 2013). Another 25 points can be earnedfor mitigation-related components. In that prioritization scheme, adaptation is still weighted farless heavily than mitigation, but it at least earns mention. The explicit inclusion of bothmitigation and adaptation in Boston MPO’s prioritization scheme was driven by the Massa-chusetts Global Warming Solutions Act of 2008. In consultation with other agencies, the MPOworked to implement policies that would help meet greenhouse gas emissions targets as wellas improve system resilience (S. Pfalzer, Boston MPO, unpublished data).
Increasingly, states and MPOs are able to use specific tools to aid in transportationplanning. The use of Geographic Information Systems (GIS) has proven to be valuable fortransportation planning in many ways, from mapping daily traffic loads to determining routedistances. It is now being applied to various strategies for adaptation, too. In 2009, a county inWashington State employed GIS to map different sea level rises and compare the scenarios’effects on coastal roads (Federal Highway Administration [FHWA], 2011). On the east coast,the New England Environmental Finance Center, in partnership with the University ofSouthern Maine, has developed a tool called “Coastal Adaptation to Sea Level Rise Tool”(COAST), which helps towns or organizations to calculate the potential economic costsassociated with different climate scenarios (FHWA 2011). In the state of North Carolina,Buncombe County worked with the University of North Carolina-Asheville to develop aMulti-Hazard Risk Tool, which enables users to layer data from various sources in map-form,then analyze it using certain GIS-specific tools (FHWA 2011). A study in the state of Virginiaused transportation data, climate projections, and existing demographic data (including pop-ulation density data) to map risk relative to various factors (Wu et al. 2013). Its approach wasfairly novel because it magnified the risk according to the presence of important transportationinfrastructure or population centers; it did not simply map areas susceptible to flooding. InVermont, different organizations have begun to consider ways to use GIS to identifyvulnerabilities, particularly since Tropical Storm Irene. Shortly after the storm, geol-ogists from Vermont’s Norwich University used GIS to map the impacts, which mayprovide insight toward future adaptation activities (Springston and Underwood 2012).Currently, the Vermont Department of Environmental Conservation is working on aproject to map full natural corridors of the all state’s rivers, which would help identifyareas not to build.
The Federal Highway Administration, which is an agency within the federal DOT thatsupports state- and local-level transportation initiatives, evaluates climate change-related riskto infrastructure based on two primary factors: first, the exposure to threats, and second, theconsequences associated with failed or compromised structures (FHWA 2012). Low spendingon infrastructure that typically requires maintenance is in itself considered an indicator of risk
Mitig Adapt Strateg Glob Change

exposure. While there are many environmental factors that influence structure vulnerability,major concerns for bridges include precipitation levels and slope angles (FHWA 2012).
This paper seeks to build on prior research and literature regarding transportation adaptation toclimate change. It examines current practices, project prioritization procedures, and allocatedfunding trends in the northeastern states of Vermont and Maine and employs geospatial analysisto highlight the challenges posed by the straightforward integration of adaptation in the transpor-tation project prioritization processes. The states are used as case studies that provide insight intotwo research questions: first, how and to what extent are the intergovernmental networks inVermont and Maine undertaking planning and implementation practices to adapt transportationinfrastructure, specifically bridge infrastructure, to the threats posed by climate change? Second,how do spatial scale, scope of the landscape, and other features affect local jurisdictions’ exposureto flooding risk for sustaining bridge infrastructure in the face of climate change and can such riskassessment methods be used at higher governance levels (such as the state level) to prioritize bridgeadaptation funding? The research presented here addresses the second question using a demon-strative spatial analysis tomap bridge funding priorities based on assessments of vulnerability at thetown level in Vermont, then examines those spending patterns relative to potential risks, includingprecipitation levels and slope. Future extensions of this methodology can include more sophisti-cated approaches to measure the structural risk to bridges. The integration of funding data withgeospatial analysis creates a novel approach. Basic demographic data—population and income—are also included in the analysis. The goal is to assess whether such risk assessment approaches canbe embedded in multi-level governance systems for prioritizing future bridge adaptation funding.Section 2 presents the methodological details; Section 3 presents results from the NortheasternUSA; Section 4 discusses gaps in adaptation planning in the US context and discusses theimplications of these findings for multi-level institutional designs; and Section 5 concludes withrecommendations.
2 Background and methodology
Vermont and Maine were chosen as case study states for their limited geographic size, thereadily available planning data, and the extreme events of recent history. Having recentlyrecovered from the impacts of Tropical Storm Irene, Vermont is a unique state for evaluatingtransportation adaptation planning. While Irene, like Katrina, is impossible to attribute toclimate change, the storm displayed many of the climate change-related characteristics thatthreaten the northeast: heavy rain, an exceptionally intense storm, and massive flooding.Tropical Storm Irene highlighted resilient and unresilient portions of the transportation infra-structure. Maine, which is similar to Vermont in its rural nature and northeastern location, isused for context and comparison throughout much of this paper. Unlike Vermont, Maine waslargely missed by Tropical Storm Irene, which veered through only the northwestern corner ofthe state (Russell et al. 2011). The scale of rebuilding due to Tropical Storm Irene performedby the Maine Department of Transportation (MaineDOT) was a small fraction of that done byVTrans. According to the director of MaineDOT’s environmental office, Maine has notsuffered from any storms on the scale of Irene in recent history, which may be one of thereasons that Maine has only recently begun to focus on adaptation (J. Gates, MaineDOT,unpublished data). It is not altogether surprising that a state recovering from an extreme storm,like Vermont, might find the need for adaptation more pressing than a state with differingexperiences.
Mitig Adapt Strateg Glob Change
Four main processes contributed to the research presented in this paper: (1) interviews andqualitative research, (2) analysis of state prioritization procedures, (3) compilation and assess-ment of bridge and culvert funding data, and (4) using geospatial analysis to map potentiallyvulnerable localities. Maine was researched comparatively for multi-level planning regimes.We triangulate both qualitative and quantitative/geospatial approaches to address the researchquestions posed above.
2.1 Interviews and qualitative research
The first stage relied primarily on interviews conducted in 2014 with key informants to providebackground information on existing adaptation practices. Eleven different individuals fromseven different organizations contributed insight either via phone or email.1 Online datamining and a survey of existing literature also contributed context necessary to pursueadditional research.
2.2 Project prioritization procedure assessment
In the second step, state project prioritization procedures were assessed for the inclusion ofadaptation-specific components. Project prioritization procedures are essentially rubrics thatguide how an agency goes about choosing certain transportation projects over others toallocate limited funding. These procedures, which are readily available to the public, can varywidely from state to state.
2.3 Funding allocation analysis
The third phase of research focused on compiling funding data dating back to the year 2000into a Vermont Bridge Funding Table. This required the acquisition of Vermont’s CapitalPrograms from VTrans. For Maine, the best available funding plans were Statewide Trans-portation Improvement Programs (STIPs). It should be noted that while the two plan types areclosely related, they do have distinct differences: Capital Programs are more representative ofthe budget, while STIPs are plans used for committing federal funds. Capital Programs alsotend to operate on the state fiscal year, while STIPs align with the federal fiscal year. In thecase of both plan types, specific projects often fall behind schedule or are delayed for anotheryear. As a result, some projects can reappear in plans for several consecutive years even if theyare not actually active, which leads to funds being overcounted (M. Langham, VTrans,unpublished data). Capital Programs are also produced annually, while STIPs are producedbiennially, meaning that in the STIPs, the second year is typically a much rougher estimate ofallocated funding.
The Capital Programs and STIPs were used to build a project database that included allavailable information about a given project. For the purposes of this research, only bridge andculvert projects were included. VTrans divides its projects into specific programs: thoseprojects belonging to the “Interstate Bridges,” “State Highway Bridges,” and “Town Highway
1 The organizations from which participants were interviewed are the VTrans, the MaineDOT, ChittendenCounty Regional Planning Commission (CCRPC), Boston MPO, Kittery Area Comprehensive TransportationSystem (KACTS), Portland Area Comprehensive Transportation System (PACTS), and Bangor Area Compre-hensive Transportation System (BACTS).
Mitig Adapt Strateg Glob Change
Bridges” categories were included in the database. For plans produced in 2006 and later,maintenance projects were segregated into a separate “Bridge Maintenance” category; thosewere included as well. MaineDOT does not subdivide bridge projects into program classes asneatly as VTrans, which made the funding allocations less clear: projects were selected if theirdescriptions explicitly stated that they were bridge or culvert projects. These processes resultedin the selection of 1,682 projects in Vermont for the period 2000 to 2015 and 1,418 projects inMaine for a comparable period (MaineDOT 2000-2014; VTrans 2000-2015).
2.4 Geospatial analysis
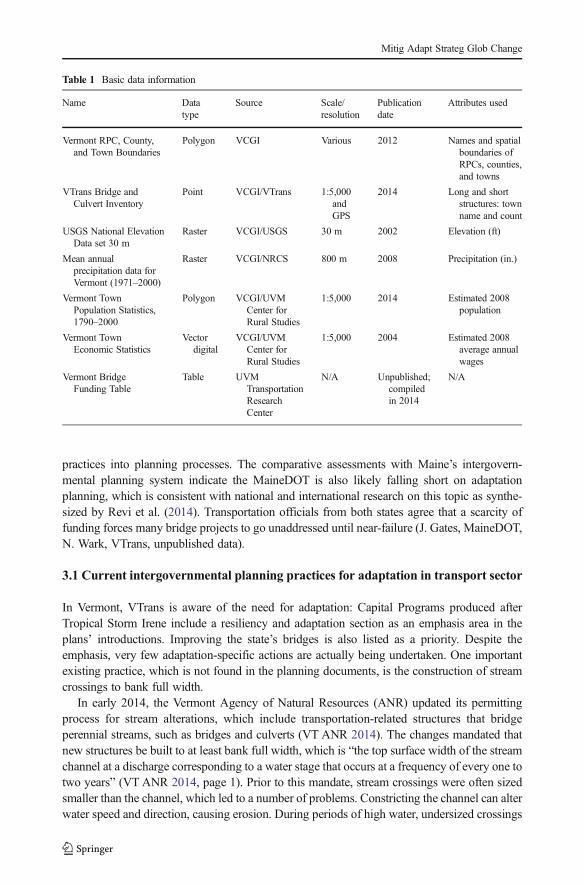
For the fourth stage, spatial analysis was conducted with GIS software to link spendingpatterns to variables potentially associated with bridge vulnerability and, consequently, provideinsight toward the complexities associated with identifying risk. Mean values were calculatedfor slope, precipitation, bridge count, and bridge funding. These attributes were used toidentify potential hot spot towns, defined as towns that had higher than average precipitation,steeper than average slope, a greater than average number of bridges, and sub-average levels offunding. The selected towns were also then compared against population and income. Thisproposed approach of identifying hot spot towns is merely for illustration purposes to highlightthat complexities that arise from varied sloping landscape and socioeconomic conditionswithin and across towns, regions, and states in multi-level governance systems. Future studiescan improve the methodology for identifying “hot spot” towns; we recognize that the slope,without consideration of the soil or rock conditions, does not define stability or the relationshipbetween precipitation and runoff. Due to issues with data availability and consistency, thisstage of analysis was conducted for Vermont but not for Maine. Table 1 provides backgroundon the data used.
VTrans maintains publicly available data that maps out bridge location, along with othercomponents such as date built. For the purposes of this research, only state system-levelbridges were used. Both long (over 20 ft in length) and short (6–20 ft in length) state-systembridges were included, for a total of approximately 4,000 unique structures. Funding data arenot part of the VTrans spatial data; the funding information used in this step was taken fromthe bridge funding database discussed in Section 2.3. Because the bridge location dataprovided in the funding documents were insufficiently detailed to assign to specific points,bridge funding information was aggregated by town. Individual bridges were also aggregatedby town to achieve a total count for each town.
The environmental factors that have the potential to impact flooding and compromisebridges are myriad. For the purposes of this analysis, slope and precipitation were chosen asexperimental variables. To add a small degree of depth to the analysis, basic demographic datawere added to the map as well, in the form of both population and income. The higher anarea’s population, the more people will feel impacts from a washed out bridge and, historically,low-income populations are disproportionately affected by natural disasters (Masozeraa et al.2007).
3 Results
Analysis of current practices, project prioritization procedures, bridge and culvert funding data,and geospatial patterns indicates that VTrans is not thoroughly incorporating adaptation
Mitig Adapt Strateg Glob Change
practices into planning processes. The comparative assessments with Maine’s intergovern-mental planning system indicate the MaineDOT is also likely falling short on adaptationplanning, which is consistent with national and international research on this topic as synthe-sized by Revi et al. (2014). Transportation officials from both states agree that a scarcity offunding forces many bridge projects to go unaddressed until near-failure (J. Gates, MaineDOT,N. Wark, VTrans, unpublished data).
3.1 Current intergovernmental planning practices for adaptation in transport sector
In Vermont, VTrans is aware of the need for adaptation: Capital Programs produced afterTropical Storm Irene include a resiliency and adaptation section as an emphasis area in theplans’ introductions. Improving the state’s bridges is also listed as a priority. Despite theemphasis, very few adaptation-specific actions are actually being undertaken. One importantexisting practice, which is not found in the planning documents, is the construction of streamcrossings to bank full width.
In early 2014, the Vermont Agency of Natural Resources (ANR) updated its permittingprocess for stream alterations, which include transportation-related structures that bridgeperennial streams, such as bridges and culverts (VT ANR 2014). The changes mandated thatnew structures be built to at least bank full width, which is “the top surface width of the streamchannel at a discharge corresponding to a water stage that occurs at a frequency of every one totwo years” (VT ANR 2014, page 1). Prior to this mandate, stream crossings were often sizedsmaller than the channel, which led to a number of problems. Constricting the channel can alterwater speed and direction, causing erosion. During periods of high water, undersized crossings
Table 1 Basic data information
Name Datatype
Source Scale/resolution
Publicationdate
Attributes used
Vermont RPC, County,and Town Boundaries
Polygon VCGI Various 2012 Names and spatialboundaries ofRPCs, counties,and towns
VTrans Bridge andCulvert Inventory
Point VCGI/VTrans 1:5,000andGPS
2014 Long and shortstructures: townname and count
USGS National ElevationData set 30 m
Raster VCGI/USGS 30 m 2002 Elevation (ft)
Mean annualprecipitation data forVermont (1971–2000)
Raster VCGI/NRCS 800 m 2008 Precipitation (in.)
Vermont TownPopulation Statistics,1790–2000
Polygon VCGI/UVMCenter forRural Studies
1:5,000 2014 Estimated 2008population
Vermont TownEconomic Statistics
Vectordigital
VCGI/UVMCenter forRural Studies
1:5,000 2004 Estimated 2008average annualwages
Vermont BridgeFunding Table
Table UVMTransportationResearchCenter
N/A Unpublished;compiledin 2014
N/A
Mitig Adapt Strateg Glob Change
cannot accommodate flow and can also become easily blocked with debris, leading to floodingand washouts.
Another major problem with undersized stream crossings is that they often becomeimpassable for fish and other aquatic life. In Vermont, as in many other states, the push forbank full width crossings came predominately from environmentalists and natural resourceadvocates, not from the transportation community. Despite the move to bank full width designbeing instituted on behalf of fish, it has important implications for transportation adaptation aswell. AVTrans hydraulic engineer noted that, anecdotally, he could not think of any bank fullwidth structures that had failed in the last 10 years (N. Wark, VTrans, unpublished data). Astudy of a small number of stream crossings in Vermont found that those that built to bank fullwidth survived Tropical Storm Irene, while undersized crossings in similar areas did not(Gillespie et al. 2014). Unfortunately, building appropriately designed structures is typicallymore expensive than installing undersized pipe culverts, although the difference in cost canvary widely from project to project (N. Wark, VTrans, unpublished data).
Maine, like Vermont, has width requirements for stream crossings. Since 2010, all priority 1roads have been required to have crossings at least 1.2 times bank full width, and smaller roadsrequire permits for any crossings not built to bank full width (J. Gates, MaineDOT, unpub-lished data). Although the requirements were initially instituted for the benefit of salmon andother fish, they have the dual benefit of creating a more resilient system from a transportationperspective.
Although adaptation is not a part of Maine’s primary transportation planning documents—none of the terms “adaptation,” “resilience,” or “climate change” appear in the most recentSTIPs or work plans—the state is beginning to undertake adaptation-related initiatives. Thepolitical climate in Maine has likely contributed to the state’s relatively slow movement onadaptation. Governor Paul LePage, sworn in during 2011, was widely criticized for hisdisbelief in climate change and, in 2013, drew more criticism for publicly stating that climatechange could have major benefits for the state (Moretto 2013). Recognizing the dangers posedby sea level rise in particular, MaineDOT has begun to pursue adaptation. With the help ofFHWA grant funding, the agency recently embarked on a vulnerability study to assess the riskposed to transportation infrastructure.
3.2 Institutionalizing resilience through project prioritization procedures
States and MPOs in intergovernmental networks have different methods for selecting whichprojects to include in the STIP or Transportation Improvement Program (TIP) (Zia and Koliba2013). Analysis of their procedures for prioritization reveal which criteria are deemed mostpressing and which are given less weight (or are not considered whatsoever). At the state DOTlevel, both Vermont and Maine fail to include adaptation-specific criteria.
While VTrans recognizes the need for adaptation, progress is impeded by other demandsmade on the system. The Environmental Policy Manager for VTrans noted that information,ideas, and best practices for improving resilience are becoming increasingly available. VTransis collaborating more closely with the Agency of Natural Resources, striving to establishpartnerships that strengthen the system overall (G. Campoli, VTrans, unpublished data). Whilethese are beneficial steps, they do not actually impact project prioritization. The current projectprioritization scheme, which assigns points quantitatively based on a project’s ability to meetcertain criteria, is based on asset classes, and none of these criteria directly include “adapta-tion” or “resilience” in the scoring list. Although VTrans does indeed direct funding explicitly
Mitig Adapt Strateg Glob Change
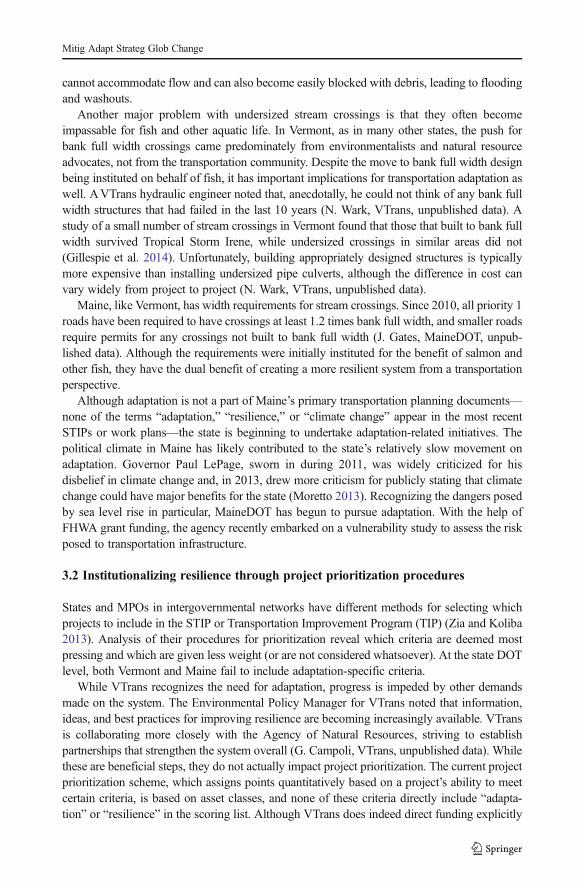
toward bridges and list criteria, such as scour, that can be associated with resilience, suchindirect effects are not summed up in their own category as adaptation or resilience. Somecriteria may also overlap with adaptation/resilience: “regional priority,” for example, may beone area in which adaptation-related concerns could be factored into the evaluation scheme.Table 2, below, displays the current project prioritization processes in place at VTrans. Thepoint system was determined based on input from a series of meetings between VTrans and theDirectors of the Vermont Association of Planning and Development Agencies. A multi-criteriaanalysis tool also aided decision-makers in creating procedures that considered stakeholderconcerns (Novak et al. 2015).
Table 2 VTrans project prioritization procedures
Asset class Factors Points
Paving Pavement condition index 20
Benefit/cost (60 points) 60
Regional priority 20
Roadway Highway system 40
Cost per vehicle mile 20
Regional priority 20
Project momentum 20
Designated downtown project (bonus class) 10
Bridge Bridge condition 30
Remaining life 10
Functionality 5
Load capacity and use 15
Waterway adequacy and scour susceptibility 10
Project momentum 5
Regional priority 15
Asset-benefit cost factor 10
Traffic operation Intersection Capacity 40
Accident rate 20
Cost per intersection volume 20
Regional priority 20
Project momentum 10
Bicycle/pedestrian Land use density 20
Connectivity to larger network 10
Multi-modal access 5
Designated downtown 5
Project cost 20
Regional priority 20
Project momentum 20
Park and ride Total highway and location 40
Cost per parking space 20
Regional priority 20
Project momentum 20
Data from Chittenden Country Regional Planning Commission 2011
Mitig Adapt Strateg Glob Change
By contrast, MaineDOT employs a prioritization scheme that is less quantitative. First, itdivides roadways into five Highway Corridor Priority (HCP) classes, with priority 1 roadscarrying the highest volume of traffic. The agency then also identifies three different customerservice levels (CSLs): safety, condition, and service. Projects are given report card style grades,A–F, based on their priority and CSL performance.
After the initial quantitative weighing of projects, a group of experts convenes to make the finalchoices (B. Condon, MaineDOT, unpublished data). Although the final round of decision-makinguses input from the grading and from different departments within MaineDOT, it is ultimately aqualitative process. There is not a quantitative method for determining the value of a grade “C”versus a grade “D,” for example.While such a process allows for some flexibility and the inclusionof factors that are difficult to quantify, it also allows for the interference of politics, personal ideals,and public preferences. One transportation planner noted that factors such as public complaints androadway access to business networks are commonly part of project considerations (B. Condon,MaineDOT, unpublished data).
Much like the prioritization procedures used by VTrans, those used by MaineDOT do notexplicitly incorporate any adaptation components. Certain factors, such as scour and bridgecondition, can be construed to incorporate adaptation, but they are not required to do so underthe current system. Neither climate change nor sustainability resiliency or adaptation measuresare awarded any points. While Maine’s four MPOs each have their own prioritization systems,some of which consider environment, none currently includes adaptation as a specific factor(T. Reinauer, Kittery Area Comprehensive Transportation System; C. Eppich, Portland AreaComprehensive Transportation System; D. Rice, Bangor Area Comprehensive TransportationSystem; unpublished data).
3.3 Funding allocations
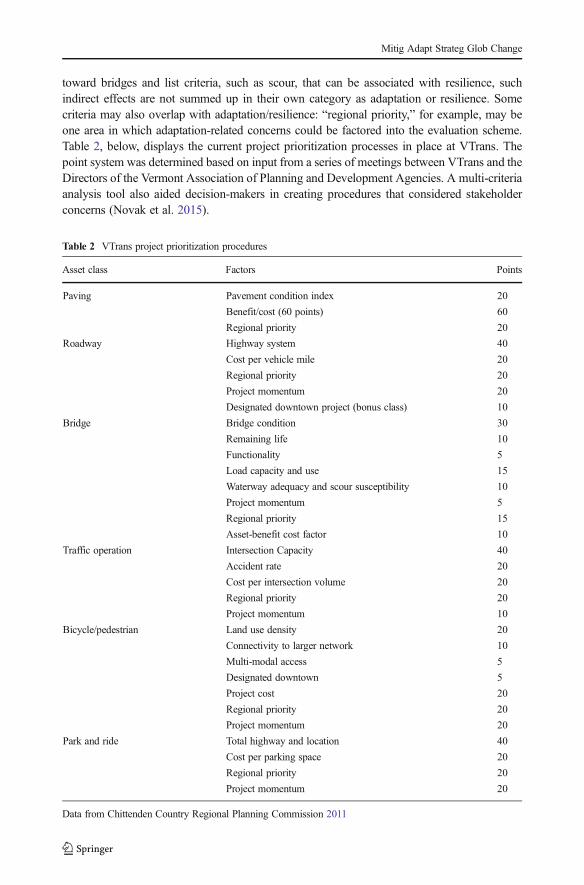
Below, Fig. 1a, b provides a snapshot of bridge and culvert funding allocations in Vermont andMaine from 2000 to 2015, derived from the new database. It is important to note that thefunding information presented here represents planned—not actual—spending. The VermontCapital Program for year 2011, for example, was written in May of 2010. The spike in 2011funding, therefore, is not at all related to Tropical Storm Irene nor is the 2012 funding, whichwas allocated in early 2011. The 2011 spike is largely attributable to the reconstruction of theCrown Point Bridge, which was allocated over $27.5 million for the year 2011 alone. A singlelarge, expensive bridge can skew the funding patterns, particularly in small states likeVermont. Additionally, it should be noted that the figures here have not been adjusted forinflation over the 15-year period.
Mean funding per project is not consistent from year to year in either state, ranging broadlyfrom a minimum of $0.32 million to a maximum of $2.2 million (both in Maine). In Vermont,the mean funding per project over the 16-year period is $0.76 million (standard deviation of$0.29 million), and for Maine, it is $0.82 million (standard deviation $0.5 million). In general,the funding trend in Vermont is more consistent than in Maine, indicative of a general increasein bridge investments in the former. Absolute allocations in terms of total yearly funding haveseen a steady increase in Vermont since 2010. For the period from 2000 to 2009, the meanfunding allocation was $51.9 million per year (standard deviation $7.9 million); funding hasincreased to a mean of $125.9 million per year (standard deviation $18 million) for 2010–2015period. As Tropical Storm Irene damage continues to be incorporated into the database, thatfigure will continue to rise. In contrast, the increase in Maine has been much less dramatic:
Mitig Adapt Strateg Glob Change
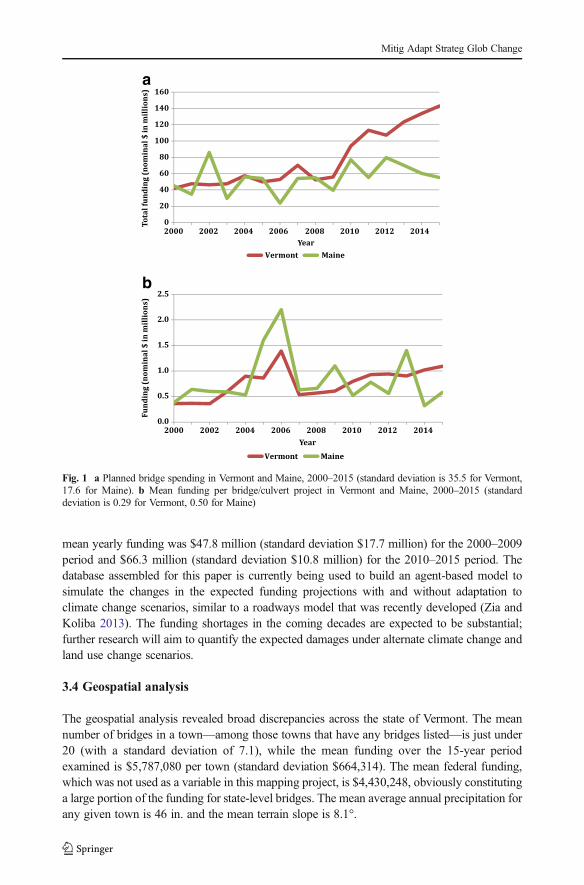
mean yearly funding was $47.8 million (standard deviation $17.7 million) for the 2000–2009period and $66.3 million (standard deviation $10.8 million) for the 2010–2015 period. Thedatabase assembled for this paper is currently being used to build an agent-based model tosimulate the changes in the expected funding projections with and without adaptation toclimate change scenarios, similar to a roadways model that was recently developed (Zia andKoliba 2013). The funding shortages in the coming decades are expected to be substantial;further research will aim to quantify the expected damages under alternate climate change andland use change scenarios.
3.4 Geospatial analysis
The geospatial analysis revealed broad discrepancies across the state of Vermont. The meannumber of bridges in a town—among those towns that have any bridges listed—is just under20 (with a standard deviation of 7.1), while the mean funding over the 15-year periodexamined is $5,787,080 per town (standard deviation $664,314). The mean federal funding,which was not used as a variable in this mapping project, is $4,430,248, obviously constitutinga large portion of the funding for state-level bridges. The mean average annual precipitation forany given town is 46 in. and the mean terrain slope is 8.1°.
a
b
Fig. 1 a Planned bridge spending in Vermont and Maine, 2000–2015 (standard deviation is 35.5 for Vermont,17.6 for Maine). b Mean funding per bridge/culvert project in Vermont and Maine, 2000–2015 (standarddeviation is 0.29 for Vermont, 0.50 for Maine)
Mitig Adapt Strateg Glob Change
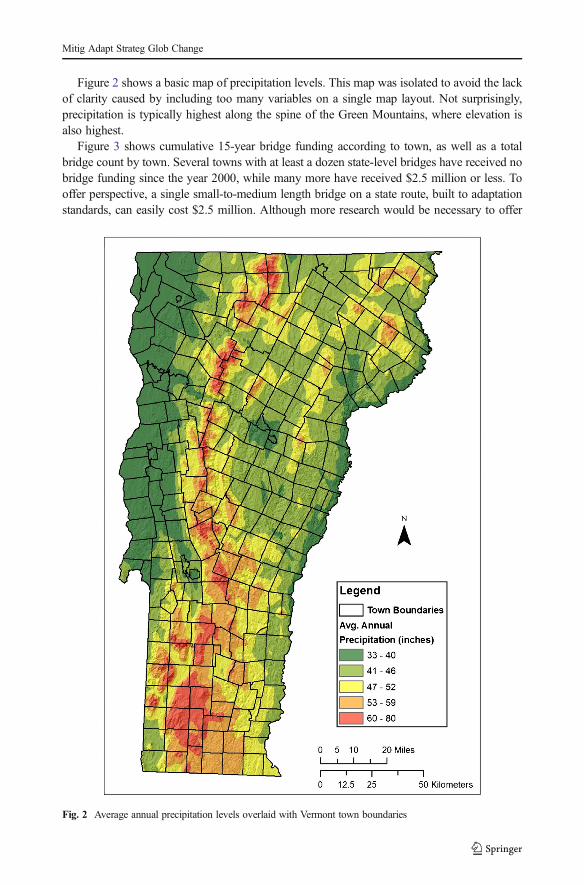
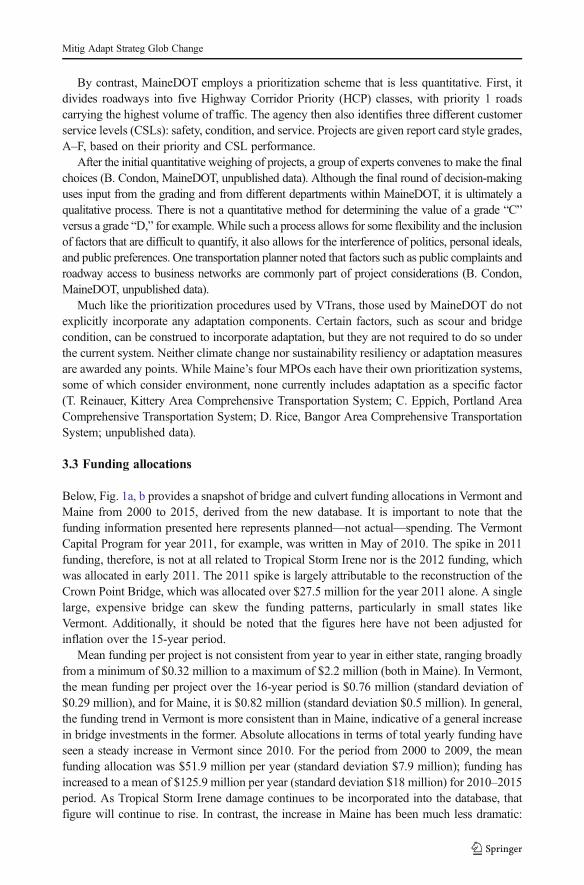
Figure 2 shows a basic map of precipitation levels. This map was isolated to avoid the lackof clarity caused by including too many variables on a single map layout. Not surprisingly,precipitation is typically highest along the spine of the Green Mountains, where elevation isalso highest.
Figure 3 shows cumulative 15-year bridge funding according to town, as well as a totalbridge count by town. Several towns with at least a dozen state-level bridges have received nobridge funding since the year 2000, while many more have received $2.5 million or less. Tooffer perspective, a single small-to-medium length bridge on a state route, built to adaptationstandards, can easily cost $2.5 million. Although more research would be necessary to offer
Fig. 2 Average annual precipitation levels overlaid with Vermont town boundaries
Mitig Adapt Strateg Glob Change
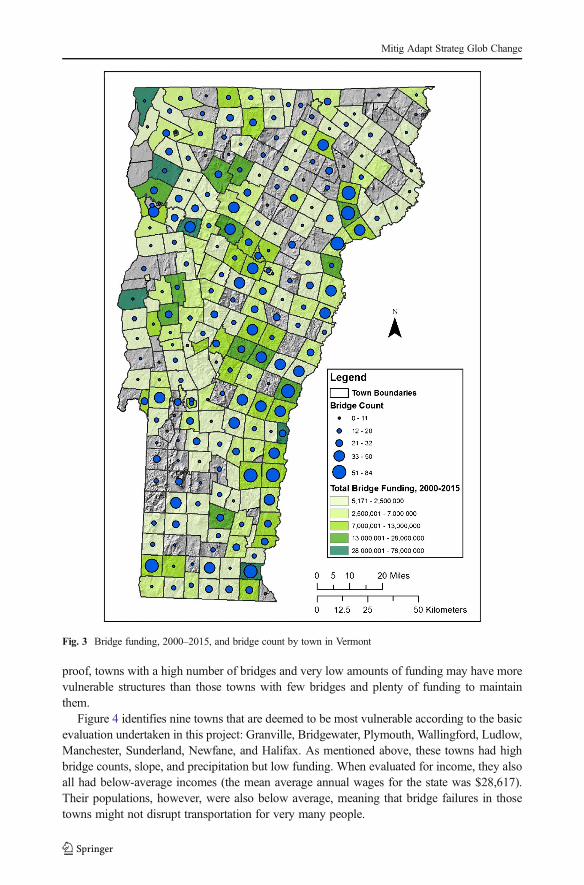
proof, towns with a high number of bridges and very low amounts of funding may have morevulnerable structures than those towns with few bridges and plenty of funding to maintainthem.
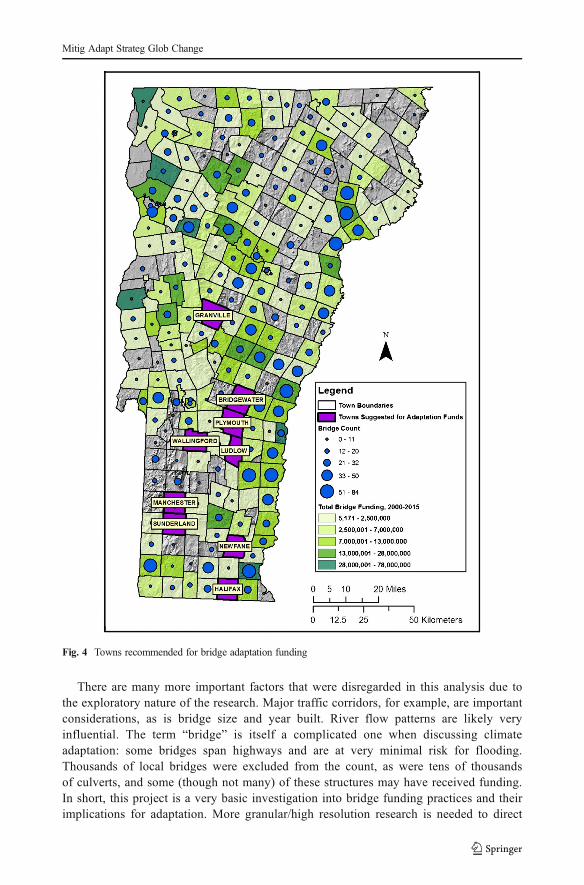
Figure 4 identifies nine towns that are deemed to be most vulnerable according to the basicevaluation undertaken in this project: Granville, Bridgewater, Plymouth, Wallingford, Ludlow,Manchester, Sunderland, Newfane, and Halifax. As mentioned above, these towns had highbridge counts, slope, and precipitation but low funding. When evaluated for income, they alsoall had below-average incomes (the mean average annual wages for the state was $28,617).Their populations, however, were also below average, meaning that bridge failures in thosetowns might not disrupt transportation for very many people.
Fig. 3 Bridge funding, 2000–2015, and bridge count by town in Vermont
Mitig Adapt Strateg Glob Change
There are many more important factors that were disregarded in this analysis due tothe exploratory nature of the research. Major traffic corridors, for example, are importantconsiderations, as is bridge size and year built. River flow patterns are likely veryinfluential. The term “bridge” is itself a complicated one when discussing climateadaptation: some bridges span highways and are at very minimal risk for flooding.Thousands of local bridges were excluded from the count, as were tens of thousandsof culverts, and some (though not many) of these structures may have received funding.In short, this project is a very basic investigation into bridge funding practices and theirimplications for adaptation. More granular/high resolution research is needed to direct
Fig. 4 Towns recommended for bridge adaptation funding
Mitig Adapt Strateg Glob Change
future adaptation funding, but the towns selected here may likely be appropriate recip-ients of funds. Process-based flood risk models that account for soil structure and otherparameters could potentially improve the risk assessment procedure for prioritizingadaptation funding. Here, we have just presented a demonstrative example to show thepotential for using such spatial models to quantify the flood risk in the face of climatechange and ultimately incorporate the quantified risk in the intergovernmental planningpractices. High resolution and process model-based spatial risk assessments could beprioritized at international scale by the adaptation funding agencies in the transportationsector. Quantified risk from such risk assessments could be integrated in multi-criteria(Vermont-like) or qualitative (Maine-like) intergovernmental planning processes.
4 Discussion: gaps in adaptation planning
Adaptation planning varies widely among states and regions, but certain challenges are shared.Critical gaps in resources and knowledge render adaptation planning difficult for manyorganizations.
4.1 Resources
The most notable gap in resources is the limited availability of funding, which influences theavailability of almost all other resources. Funding for infrastructure is typically devoted to themost severely failing structures, and, additionally, funding is limited for personnel as well.VTrans, for example, has a hydraulics staff of four people, yet Vermont has more than 2700bridges not including those under 20 ft in length (N. Wark, VTrans, unpublished data). Withoutfunding to hire additional staff, the hydraulics team is forced to attend to the most urgentproblems and does not have the capacity to work proactively.
In additional to financial resources, state DOTs and MPOs alike are hindered by theirlimited access to other types of tools. Several organizations are striving to equip transportationplanners with better tools for integrating resilience: for example, the National CooperativeHighway Research Program (NCHRP) recently released a guide aimed at developing trans-portation professionals’ understanding of how the changing climate will impact the transpor-tation system and, consequently, how to adapt for the sake of resilience (NCHRP 2014). Riskmanagement frameworks have been cited as a critical part of a city or region’s ability todevelop resilience (Oswald and McNeil 2013). Developing such frameworks is not withoutcost, however: communities must identify both their exposure to certain hazards and thevulnerabilities in their transportation system, then they must also define and measure theirsystem’s current resilience (Schmidt and Meyer 2009).
Tailoring sensitivity matrices to individual regions could help transportation planners screenfor especially sensitive assets and services (Rowan et al. 2013). Similarly, decision-supporttools could help agencies target the most vulnerable places and structures, diverting funding tothose projects that are most critical for resilience (Croope and McNeil 2011). The expansion ofasset management systems could help agencies track the status of more vulnerable infrastruc-ture under changing conditions (Meyer et al. 2010). GIS programs could be used to map assetsrelative to climate-based risks (Wu et al. 2013). Many existing tools could prove exceptionallyuseful; the challenge lies in financing both the acquisition of certain tools and of staff trained intheir use.
Mitig Adapt Strateg Glob Change
4.2 Knowledge
To date, most climate data are generalized over relatively broad regions. Within those regions,impacts can vary. More locally specific climate data would be useful to planners who are trying toweigh investment versus risk. Many agencies rely on flood recurrence data that are outdated and,additionally, build structures with a design life that does not consider the anticipated changes inenvironmental conditions for the end of the design life (N. Wark, VTrans, unpublished data). Yet,another knowledge gap relates to semantic differences in the terms andmethods of analysis used byclimate scientists versus those employed by civil engineers. While climate scientists are typicallyfocused on trends in magnitudes of precipitation and flooding, engineers may be more concernedwith changes in the number of exceedances (Bonnin et al. 2001).
Because building more resilient infrastructure is typically more expensive, transportationagencies are faced with a choice: either they invest now, anticipating that improved infrastruc-ture can withstand the onslaught of climate change, or risk paying to repair damagedinfrastructure in the future. Agencies would benefit immensely from cost–benefit analysesthat consider different adaptation scenarios and evaluate the tradeoffs. The spatial analysisemployed here is rudimentary, but the methodology can be refined and extended. Usingexisting funding data to aid in quantifying risk can be integrated into the channelization ofadaptation funding in intergovernmental planning contexts. The use of GIS is promising as atool to aid decision-making: improved access to geospatial analysis may advance agencies’capacity to appropriately guide the allocation of funding toward the most vulnerable locations.
5 Challenges and opportunities for institutionalizing resiliencein intergovernmental networks
The intergovernmental transportation network in the US context operates at three to fivedistinct levels at which policy and planning can address transportation adaptation to climatechange in a rather complex inter-twined system: federal, state, regional (the level of MPOs andRPCs), counties, and local towns/villages. Each level has distinct challenges to and opportu-nities for incorporating adaptation into transportation planning. Transportation policies areinfamously complex, necessitating the use of multi-faceted analysis that appropriately con-siders the major process variables at work (Zia and Koliba 2013; Novak et al. 2015). While afull analysis is a major undertaking, here we hope to offer insight into some of the consider-ations that should be made when examining adaptation planning alternatives. At any level,political feasibility, budget availability, and efficiency are important factors in weighing apolicy’s relevance. As of now, however, climate adaptation policies for transportation are soanemic that a variety of alternatives could represent an improvement. Rather than beingprompted into action by dramatic focusing events such as natural disasters, policy-makerscan take steps toward institutionalizing resilience by introducing appropriate legislation inadvance. There are, however, cross-scale complexities for quantifying the risk and allocatingthe resources through the intergovernmental planning processes.
5.1 Federal (national) level
The primary policy alternative at the federal level is legislation that either allocates funding foradaptation efforts, mandates states, provinces, or regions to incorporate adaptation or does
Mitig Adapt Strateg Glob Change
both. The costs of such a policy could be vast and, since there is little precedent for this type ofpolicy, it is difficult to predict whether the benefits would be substantial (Cambridge System-atics 2009). Given the US Congress’ failure to pass a new transportation funding authorizationbill, federal funding in the USA remains unpredictable. Despite initial funding requirements,the long-term benefits of some adaptation measures may outweigh the risks and costsassociated with the failure to adapt. Because the federal government, through FEMA andFHWA, is responsible for providing aid to states struggling with natural disasters, this is arelevant concern: without adaptation, rebuild costs may be higher.
One major issue with a national policy relates to the different needs among states. SouthDakota, for example, has vastly different adaptation needs than New York. Differences ingeography, climate, population distribution, and existing infrastructure render adaptation amuch greater priority for some states than others. Furthermore, uniform national policies andresource allocation programs that approach infrastructure with “one-size-fits-all” standards arethe least flexible options, making it difficult to reassess and adapt in the face of dramatic eventslike extreme storms. Given the sheer number of competing interests and extreme politicalpolarization present in national political arena, political feasibility is yet another challenge.Small allowances in federal policy, however, can provide states, provinces, and regions withthe power to undertake actions of their own. In the case of the Intermodal Surface Transpor-tation Efficiency Act of 1991 (ISTEA), measures to protect the environment were notexplicitly required but were rather made more easily eligible for funding (Downing andNoland 1998).
5.2 State, provincial, and local levels
In the USA, states and MPOs have considerable control over the transportation activitiesundertaken within their boundaries. It is the state DOTs and MPOs, not the federal agencies,that develop the STIPs and Capital Plans and thereby create the transportation work lists.Prioritization procedures and funding allocations are dictated by policies at the state and locallevel. Furthermore, state and local agencies are more familiar with their infrastructure, climate,and stakeholders. In New England, the focus region of this paper, states are geographicallysmall enough that state-level policy can be appropriately targeted. Restructuring of prioritiza-tion procedures for STIPs and TIPs would be a relatively straightforward, inexpensive way tobegin to incorporate adaptation. Allocating a small number of points to projects that incorpo-rate adaptation could modify the slate of projects undertaken in any given year and begin toshift the emphasis from maintenance to forward-thinking design and building. Similar plan-ning practices can be adopted by intergovernmental networks in developing countries wheretransportation infrastructure is vulnerable to climate change-induced extreme events.
In the US context, if funding does not increase and emphasis begins to shift away frommaintenance and constant rebuilding of damaged infrastructure, states and localities may needto engage in conversations and planning processes to address strategic disinvestment. BostonMPO, with its present inclusion of adaptation criteria in its STIP, may provide an interestingcase study for other MPOs trying to restructure project prioritization. Politics and localpriorities may exert strong influence over how and whether states and MPOs incorporateadaptation criteria. In the case of Boston, collaborations with other agencies and local policyobjectives both played major roles in changing prioritization criteria (S. Pfalzer, Boston MPO,unpublished data). In Vermont, local or state transportation officials would have to determinewhich present criteria would need to be deemphasized to shift points toward adaptation.
Mitig Adapt Strateg Glob Change
It is at the state and local levels that GIS and spatial risk analysis are most promising aswell. Performing geospatial analysis over too broad a region poses the risk of losing granu-larity and, consequently, may result in overly generic results that are of reduced practical use todecision-makers. As illustrated here, geospatial analysis conducted at the state, provincial,metropolitan levels has the power to employ specific variables to isolate individual localitieslikely to be in greatest need of funding. Combining funding analysis with spatial componentsoffers a unique way to assess vulnerability. “Hot spots” defined by particular geographic andclimatological variances can be mapped with climate- and geography-specific variables, suchas precipitation and slope, with the addition of information pertaining to biogeochemicalproperties of the landscape.
The methodology presented here, however, suffers from certain weaknesses and assump-tions that could be addressed in future research. First, rather than examining means, certainvariables could be assessed for limits or tipping points that have been shown to demonstrateincreased risk in actuality. Second, funding data would ideally display actual expenditures, andemergency funding data would be incorporated into funding databases to identify which townsmay have new (and likely sturdier) bridge infrastructure. Third, the methodology could befurther tailored and strengthened by incorporating additional attributes depending on theavailability of data. Soil type, land cover, and bridge age are all examples of potentiallycontributing variables.
6 Conclusions
While climate change-induced extreme events could have devastating consequences fortransportation infrastructure such as roads and bridges, institutionalization of adaptation andresilience in the planning processes are rather complex and compete with other goals. Despitethe clear trend toward increasing climate change impacts, in this study, we find that transpor-tation agencies in Vermont and Maine are not undertaking significant planning changes toengage in adaptation actions that will improve system resilience. Due to limited federalfunding and competing political interests, top-down change appears unlikely to happen fromthe national level. Adaptation to climate change is by nature very local, which requires bottom-up, innovative solutions to the risks posed by climate change across different landscapes. In theUSA, state agencies and MPOs, with their important role in planning, have the ability to takesteps toward improving planning processes in intergovernmental networks. By modifyingproject prioritization structures to explicitly incorporate adaptation and resilience measures,state agencies and MPOs can begin changing planning processes to adequately prepare for therisks and costs that climate change will place on our transportation system. Further, in the faceof funding shortfalls, spatial risk analysis approaches can be used to target limited funds to thelocal towns that are vulnerable to climate change-induced hydrometeorological hazards suchas floods, flash floods, and landslides.
Adapting infrastructure to climate change, both in the planning and implementation phases,is a concern for transportation agencies across the globe. Although these intergovernmentalnetworks will likely vary across countries, the approaches to study and address the challengesto building robust governance networks designed to ensure transportation infrastructureadaptation and resilience introduced in this article may be applied to a diverse array of settings.Project design and prioritization are key components of building resilience within the trans-portation sector. In the face of challenges related to knowledge, financial resources, and
Mitig Adapt Strateg Glob Change
political processes, approaches are needed that are both novel and replicable. The alteration ofproject prioritization procedures, coupled with the use of spatial risk analysis, may provide anew strategy for allocating scarce resources to adaptation initiatives.
Acknowledgments We gratefully acknowledge funding from the United States Department of Transportationvia the University of Vermont Transportation Research Center and National Science Foundation EPS-1101317.
Compliance with ethical standards The authors bear complete responsibility for all the data and informationprovided in this manuscript. The authors also verify that there are no conflicts of interest; that this manuscript hasnot been simultaneously submitted in full or in part to another journal; that no part of this manuscript has alreadybeen published; that no animal subjects were used in research; that human subjects were used only as non-personal interview sources; and that those individuals provided informed consented for the use of their statementsin our research findings.
References
Bierbaum R, Smith JB, Lee A et al (2013) A comprehensive review of climate adaptation in the United States:more than before, but less than needed. Mitig Adapt Strat Glob Chang 18:361–406
Bonnin GM, Maitaria K, Yetka M (2001) Trends in rainfall exceedances in the observed record in selected areasof the United States. J Am Water Resour Assoc 46(2):344–353
Boston Region MPO (2013) FFYs 2014–17 TIP evaluation scoring. www.ctps.org/Drupal/data/pdf/plans/TIP/TIP_Evaluation_Scoring.pdf. Cited 6 March 2015
Cambridge Systematics, Bipartisan Policy Center (2009) Transportation adaptation to global climate change. http://bipartisanpolicy.org/library/research/transportation-adaptation-global-climate-change. Cited 6 March 2015
Chittenden County Regional Planning Commission (2011) Prioritization of transportation projects. www.ccrpcvt.org/library/CIRC/docs/VTrans_CCRPC_Prioritization_Methdology_20110805.pdf. Cited 6 March 2015
Croope SV, McNeil S (2011) Improving resilience of critical infrastructure systems postdisaster: recovery andmitigation. Transp Res Rec 2234:3–13
Downing D, Noland RB (1998) Environmental consequences of reducing the federal role in transportation: legalframework. Transp Res Rec 1626:3–10
Eisenack K, Stecker R, Reckien D, Hoffman E (2012) Adaptation to climate change in the transport sector: areview of actions and actors. Mitig Adapt Strateg Glob Chang 17:451–469
Federal Highway Administration (2011) Geographic information systems applications for climate changedecision-making: peer exchange summary report. https://www.gis.fhwa.dot.gov/documents/GIS_for_Climate_Change_Proceedings.pdf
Federal Highway Administration (2012) Climate change and extreme weather vulnerability assessment frame-work. http://www.fhwa.dot.gov/environment/climate_change/adaptation/publications_and_tools/vulnerability_assessment_framework/fhwahep13005.pdf
Gallivan F, Ang-Olsen J, Turchetta D (2009) Integrating climate change into state and regional transportationplans. Transp Res Rec 2119:1–9
Gillespie N, Unthank A, Campell L, Anderson P, Gubernick R, Weinhold M, Cenderelli D, Austin B, McKinley D,Wells S, Rown J, Orvis C, HudyM, Bowden A, Singler A, Fretz E, Levine J, Kirn R (2014) Flood effects on road-streamcrossing infrastructure: economic and ecological benefits of stream simulation designs. Fisheries 39(2):67–76
Horton R, Yohe G, Easterling W et al. (2014) Chapter 16: Climate change impacts in the United States: the thirdNational Climate Assessment. In: Melillo JM et al. (eds) Climate change impacts in the United States: thethird national climate assessment. Available via US Global Change Research Program. http://nca2014.globalchange.gov/report/regions/northeast. Cited 12 June 2014
Hunt A, Watkiss P (2011) Climate change impacts and adaptation in cities: a review of the literature. Clim Chang104(1):13–49
IPCC (2013) Climate change 2013: the physical science basis. Contribution of working group I to the fifth assessmentreport of the intergovernmental panel on climate change. www.climatechange2013.org. Cited 2 May 2014
Jaroszweski D, Chapman L, Petts J (2010) Assessing the potential impact of climate change on transportation:the need for an interdisciplinary approach. J Transp Geogr 18(2):331–335
Johnson I (2012) Adapting Vermont’s transportation infrastructure to the future impacts of climate change:VTrans climate adaptation white paper. http://vtransplanning.vermont.gov/sites/aot_policy/files/documents/planning/Climate%20Change%20Adaptation%20White%20Paper.pdf. Cited 15 May 2014
Mitig Adapt Strateg Glob Change
Kehew RB, Kolisa M, Rollo C et al (2013) Formulating and implementing climate change laws and policies inthe Philippines, Mexico (Chiapas), and South Africa: a local government perspective. Local Environ 18(6):723–737
Koliba C, Meek J, Zia A (2010) Governance networks in public administration and public policy. CRC Press/Taylor & Francis, Boca Raton
Lowe A, Foster J, Winkelman S (2009) Ask the climate question: adapting to climate change impacts in urbanregions. Center for Clean Air Policy (CCAP), Washington, DC
LysákM, Bugge-Henricksen C (2014) Current status of climate change adaptation plans across the United States.Mitig Adapt Strateg Glob Chang. doi:10.1007/s11027-014-9601-4
Maine Department of Transportation (2000–2014) Statewide transportation improvement programs. http://www.maine.gov/mdot/stip/. Cited 15 July 2014
Masozeraa M, Bailey M, Kerchnerc C (2007) Distribution of impacts of natural disasters across income groups: acase study of New Orleans. Ecol Econ 63:299–306
McBeath J (2003) Institutional responses to climate change: the case of the Alaska transportation system. MitigAdapt Strateg Glob Chang 8(3):3–28
Meyer M, Amedkudzi A, O’Har JP (2010) Transportation asset management systems and climate change:adaptive systems management approach. Transp Res Rec 2160:12–20
Moretto M (2013) LePage sees upside for global warming in Maine with opening of northeast passage. BangorDaily News. 5 December 2013. http://bangordailynews.com/2013/12/05/politics/lepage-sees-upside-for-global-warming-in-maine-with-opening-of-northeast-passage/. Cited 30 June 2014
National Cooperative Highway Research Program (2014) Strategic issues facing transportation: climate change,extreme weather events, and the highway system: practitioner’s guide and research report. Report 750(2).http://onlinepubs.trb.org/onlinepubs/nchrp/nchrp_rpt_750v2.pdf. Cited 30 June 2014
Novak D, Koliba C, Zia A, Tucker D (2015) Evaluating the outcomes associated with an innovative change in astate-level transportation project prioritization process: a case study of Vermont. Transport Policy
Oswald MR, McNeil S (2013) Methodology for integrating adaptation to climate change into the transportationplanning process. Public Works Manag Policy 18(2):145–166
Plumeau P, Lawe S (2009) Meeting the challenge of institutional fragmentation in addressing climate change intransportation planning and investment. Transp Res Rec 2139:81–87
Regmi M, Hanaoka S (2011) A survey on impacts of climate change on road transport infrastructure andadaptation strategies in Asia. Environ Econ Policy Stud 12(1):21–41
Revi A, Satterthwaite DE, Aragón-Durand F et al. (2014) Urban areas. In: Climate change 2014: impacts,adaptation, and vulnerability. Part A: global and sectoral aspects. Contribution of Working Group II to thefifth assessment report of the Intergovernmental Panel on Climate Change [Field CB, Barros VR, DokkenDJ et al. (eds.)]. Cambridge University Press, Cambridge, United Kingdom and New York, NY, USA, 535–612
Roberts D, O’Donoghue S (2013) Urban environmental challenges and climate change action in Durban, SouthAfrica. Environ Urban 25(2):299–319
Rowan E, Evans C, Riley-Gilbert M, Hyman R, Kafalenos R, Beucler B, Rodehorst B, Choate A, Schultz P(2013) Assessing the sensitivity of transportation assets to extreme weather events and climate change.Transp Res Rec 2326:16–23
Russell E, Cousins C, Curtis A, Lynds J (2011) Thousands without power, bridges closed as state cleans up afterIrene. Bangor Daily News. 29 August 2011. http://bangordailynews.com/2011/08/29/news/state/the-cleanup-from-irene-begins-nearly-200000-mainers-without-power/. Cited 2 July 2014
Savonis MJ, Burkett VR, Potter JR (eds) (2008) Impacts of climate change and variability on transportationsystems and infrastructure: Gulf Coast study, phase I. US Department of Transportation; Washington, DC
Schmidt N, Meyer MD (2009) Incorporating climate change considerations into transportation planning. TranspRes Rec 2119:66–73
Springston G, Underwood K (2012) Impacts of tropical storm Irene on streams in Vermont. http://www.anr.state.vt.us/dec/geo/pdfdocs/IreneGeomorphRevised02142012small.pdf
US Government Accountability Office. (2014) Emergency transportation relief: agencies could improve collab-oration begun during Hurricane Sandy response. GAO-14-512. http://www.gao.gov/products/GAO-14-512.Cited 2 July 2014
Venner M, Zamurs J (2012) Increased maintenance costs of extreme weather events: preparing for climate changeadaptation. Transp Res Rec 2292:20–28
Vermont Agency of Natural Resources (2014) Stream alteration general permit. http://www.watershedmanagement.vt.gov/rivers/docs/2014_04_10_Stream_Alteration_GP.pdf. Cited 30 June 2014
Vermont Agency of Transportation (2000–2014) Capital Programs. http://vtrans.vermont.gov/about-us/capital-programs. Cited 30 May 2014
Walker L, Figliozzi MA, Haire AR, MacArthur J (2011) Climate action plans and long-range transportation plansin the Pacific Northwest and Alaska. Transp Res Rec 2252:118–126
Mitig Adapt Strateg Glob Change
Walsh J, Wuebbles D, Haykoe K et al. (2014) Chapter 2: Our changing climate. In: Melillo JM et al. (eds)Climate change impacts in the United States: the third national climate assessment. Available via US GlobalChange Research Program. http://nca2014.globalchange.gov/report/sectors/transportation. Cited 5 July 2015
Wu Y, Hayat T, Clarens A, Smith BL (2013) Climate change effects on transportation infrastructure: scenario-based risk analysis using geographic information systems. Transp Res Rec 2375:71–81
Zia A, Koliba C (2013) The emergence of attractors under multi-level institutional designs: agent-based modelingof intergovernmental decision-making for funding transportation projects. AI & Society: Knowledge,Culture, and Communication. http://link.springer.com/article/10.1007/s00146-013-0527-2/fulltext.html.Cited 5 May 2014
Mitig Adapt Strateg Glob Change