adaptations to an extreme environment: retinal ... · retina, whereas sws2 opsin expression is...
TRANSCRIPT

2363
The Notothenioidei is a suborder of teleosts largely endemicto the Antarctic region of the Southern Ocean, which dominatethe Antarctic fish fauna in the number of species (45%) andbiomass (>90%; Eastman, 2005). Members of this suborderinhabit a variety of depths under pack and fast ice, and a majoradaptation that enables survival at icy, freezing seawatertemperatures is the production of ‘antifreeze’ glycoproteinsthat prevent the growth of environmental ice crystals that enterthe body fluids, preserving their liquid state (DeVries et al.,1970; DeVries et al., 1971; Raymond and DeVries, 1977; forreviews see Cheng, 1998; Fletcher et al., 2001). The visualenvironment is also affected by this severe habitat; not only isthe amount of light reduced by snow and ice cover (Littlepage,1965; Pankhurst and Montgomery, 1989), but short- and long-wave light is unable to penetrate thick sheets of ice. Therefore,notothenioid fish are exposed to a light environment that isquite different from other aquatic species. A recent study hasdetailed the cold adaptation of the eye lens of these fish (Kisset al., 2004), but so far very little information is available on
the visual system of these fish in terms of the spectralsensitivity of their photoreceptors.
Both rod and cone photoreceptors are present in the retinae ofnotothenioid fishes (Meyer-Rochow and Klyne, 1982). Singleand double cones have been reported in a number of species(Eastman and Lannoo, 2003; Meyer-Rochow and Klyne, 1982;Miyazaki et al., 2002), and Miyazaki et al. (2001) identified asquare mosaic that is formed with double cones at the sides andsingle cones in the centre and at each of the four corners. Conesin corner positions have been shown to contain a UV-sensitivevisual pigment in the retinae of a number of teleost species(Avery et al., 1983; Bowmaker et al., 1991b; Hárosi andHashimoto, 1983; Hisatomi et al., 1996, 1997; Whitmore andBowmaker, 1989), so it is possible that UV sensitivity is alsopresent in notothenioid fishes. Meyer-Rochow and Klyne (1982)reported an increase in the overall proportion of rods and adecrease in cones in three species of notothenioid fishes as depthof habitat increased; the deeper dwelling species, Dissostichusmawsoni, has a higher concentration of rods with longer outer
The Journal of Experimental Biology 208, 2363-2376Published by The Company of Biologists 2005doi:10.1242/jeb.01647
The Notothenioid suborder of teleosts comprises anumber of species that live below the sea ice of theAntarctic. The presence of ‘antifreeze’ glycoproteins inthese fish as an adaptation to freezing temperature hasbeen well documented but little is known about theadaptations of the visual system of these fish to a lightenvironment in which both the quantity and spectralcomposition of downwelling sunlight has been reduced bypassage through ice and snow. In this study, we show thatthe red/long-wave sensitive (LWS) opsin gene is notpresent in these fish but a UV-sensitive short-wavesensitive (SWS1) pigment is expressed along with blue-sensitive (SWS2) and green/middle-wave sensitive (Rh2)pigments. The identity and spectral location of maximalabsorbance of the SWS1 and Rh2 pigments was confirmedby in vitro expression of the recombinant opsins followedby regeneration with 11-cis retinal. Only the SWS2
pigment showed interspecific variations in peakabsorbance. Expression of the Rh2 opsin is localised todouble cone receptors in both the central and peripheralretina, whereas SWS2 opsin expression is present only inthe peripheral retina. SWS1 cones could not be identifiedby either microspectrophotometry or in situ hybridisation,presumably reflecting their low number and/or unevendistribution across the retina. A study of photoreceptororganisation in the retina of two species, the shallowerdwelling Trematomus hansoni and the deeper dwellingDissostichus mawsoni, identified a square mosaic in theformer, and a row mosaic in the latter species; the rowmosaic in Dissostichus mawsoni with less tightly packedcone photoreceptors allows for a higher rod photoreceptordensity.
Key words: icefish, visual pigment, retina, photoreceptor.
Summary
Introduction
Adaptations to an extreme environment: retinal organisation and spectralproperties of photoreceptors in Antarctic notothenioid fish
Marie A. Pointer1, Chi-Hing Christina Cheng2, James K. Bowmaker1, Juliet W. L. Parry1,Nelyn Soto2, Glen Jeffery1, Jill A. Cowing1 and David M. Hunt1,*
1Institute of Ophthalmology, University College London, 11-43 Bath Street, London, EC1V 9EL, UK and2Department of Animal Biology, University of Illinois at Urbana-Champaign, 515 Morrill Hall, 505 S. Goodwin
Avenue, Urbana, Illinois 61801, USA*Author for correspondence (e-mail: [email protected])
Accepted 18 April 2005
THE JOURNAL OF EXPERIMENTAL BIOLOGY

2364
segments as compared to the two shallower living species,Trematomus borchgrevinki and T. bernacchii.
In the present study, we have examined the organisation ofthe retina in a number of notothenioid species that live indifferent depth habitats. We have focused on the classes ofphotoreceptors present, and the spectral characteristics ofthe associated visual pigments have been determined bymicrospectrophotometry (MSP). The corresponding visualpigment genes have been sequenced and the peak absorbance(λmax) of encoded cone pigments confirmed by in vitroexpression of the opsin protein and regeneration with 11-cis-retinal. Finally, the organisation of the retina has beenexamined by conventional histology and in situ hybridisationwith opsin cRNA probes.
Materials and methodsFish and tissue collection
Specimens of Antarctic notothenioid fish representing threeof the five endemic families were utilised in this study. Manyof the nototheniid (family Nototheniidae) species werecollected from McMurdo Sound, Antarctica (77°51.0′S,166°40.0′E) through ice holes. The giant nototheniidDissostichus mawsoni (Norman) was captured at about350–500·m with baited hooks on a vertical set line, and theshallow water (0–10·m) cryopelagic Pagothenia borchgrevinki(Boulenger) by hook and line. The shallow benthic (30–60·m)nototheniid species Trematomus bernacchii (Boulenger) andT. hansoni (Boulenger), the shallow benthic dragonfish(Bathydraconidae) Gymnodraco acuticeps (Boulenger), andthe deep water (600·m) T. loennbergii (Regan), were caughtwith baited traps, and the icefish (Channichthyidae) Pagetopsismacropterus (Boulenger) by diving at around 40·m. Thepelagic nototheniid Pleuragramma antarcticum (Boulenger)was caught with otter trawl in the Ross Sea, and the mackerelicefish Champsocephalus gunnari (Lönnberg) by otter trawlfrom the Antarctic Peninsular water. Finally, the cooltemperate nototheniid Notothenia angustata (Hutton) wasobtained from the shallow rocky shore at the entrance of OtagoHarbor (45.5°S, 170°E) of South Island, New Zealand. Aftercapture, all Antarctic notothenioid species were kept in flow-through seawater aquarium tanks under dim fluorescentlighting for 1–3·months.
Liver and spleen were flash frozen in liquid nitrogen forsubsequent DNA extraction. Whole eyes were dissectedfrom the fish, the lens was removed, and the eye cup was flashfrozen in liquid nitrogen for subsequent RNA isolation. Formicrospectrophotometry, fish were dark adapted for severalhours in aquarium tanks. Eye capsules were then dissected indim red light at 4°C, and lightly fixed for 15–30·s in 2%glutaraldehyde in notothenioid fish PBS (0.1·mol·l–1 phosphatebuffer, 0.1·mol·l–1 NaCl, pH 7.4), and stored in light-tightbottles with fresh notothenioid PBS containing penicillin(100·U·ml–1), streptomycin (0.1·mg·ml–1), and amphotericin B(0.25·µg·ml–1) at 4°C. For retinal histology, either the lens andvitreous humour was removed from the eye prior to fixation or
fixative was injected into the vitreous humour of the intact eyewith a 30-gauge needle. In both cases, the eye capsules werethen fully immersed in 4% (w/v) paraformaldehyde innotothenioid PBS.
Microspectrophotometry
Absorption spectra of individual photoreceptors weredetermined using a computer-controlled modified Liebmandual beam microspectrophotometer. By means of an infraredconverter, the measuring beam (normally about 2·µm2 crosssection) was aligned to pass transversely through a givenphotoreceptor outer segment, while the reference beam passedthrough a clear space adjacent to the photoreceptor. Spectrawere scanned from 750·nm to 350·nm in 2·nm steps and backfrom 351·nm to 749·nm. To estimate the peak absorbance(λmax) of each outer segment, a standardised computer programwas employed. A detailed description of the experimentalprocedures and methods of analysis have been publishedpreviously (Bowmaker et al., 1991a).
Genomic DNA extraction
High molecular mass genomic DNA was prepared fromfrozen liver or spleen. Tissue was ground with a pre-chilledpestle and mortar, and the pulverized tissue was digested(1:10 w/v) in lysis buffer (10·mmol·l–1 Tris-HCl, pH·8.0,100·mmol·l–1 NaCl, 250·mmol·l–1 EDTA, 0.5% SDS and100·µg·ml–1 proteinase K) at 60°C. The digest was thenextracted twice with an equal volume of Tris-HCl-buffer-saturated phenol (pH·8.0), and then once each withphenol–chloroform and chloroform. The genomic DNA in thesupernatant was dialyzed against 0.5� TE (5·mmol·l–1 Tris-HCl, 0.5·mmol·l–1 EDTA, pH·8.0), treated with RNaseA(50·µg·ml–1), re-dialyzed and stored at 4°C until use.
RNA isolation
Frozen eye cups were ground to a fine powder in a pre-chilled pestle and mortar, and total RNA was extracted withthe Ultraspec RNA isolation reagent (Biotecx, Houston, TX,USA), which is based on the single-step acidic phenolextraction of Chomczynski and Sacchi (1987).
Southern blot and hybridisation
Genomic DNA was digested with the restriction enzymeEcoRI, separated by gel electrophoresis, transferred to anitrocellulose membrane by capillary action in 20� SSC andfixed by baking at 80°C for 3·h. The blot was incubated withradiolabelled probes for the four vertebrate cone opsins, SWS1,SWS2 (short-wave sensitive 1 and 2), Rh2 (middle-wavesensitive) and LWS (long-wave sensitive). The SWS1 probewas cloned from D. mawsoni retinal cDNA and encompassedthe entire coding region. The SWS2, Rh2 and LWS cloneswere obtained from retinal cDNA isolated from black bream,Acanthopagrus butcheri (J.A.C. and D.M.H., unpublisheddata). In all cases, the probes were cloned into the pGEM-T-Easy plasmid (Promega, Southampton, UK). The opsin insertswere excised by restriction enzyme digestion and radioactive
M. A. Pointer and others
THE JOURNAL OF EXPERIMENTAL BIOLOGY
2365The visual system of notothenioid fish
probes were synthesised using the Ready-To-Go™ DNALabelling Beads (α-dCTP) (Amersham Biosciences, LittleChalfont, Bucks, UK), following the manufacturer’sinstructions. The membranes were prehybridised for 3·h at50–65°C (depending on probe specificity) in a buffercontaining 0.05·mol·l–1 PO4, 4� SSC, 5� Denhardt’s reagent,5·mg·ml–1 denatured, fragmented salmon sperm DNA, 0.3%(w/v) SDS and 0.15% sodium pyrophosphate (NaPPi). Themembrane was then hybridised against the SWS1, SWS2, Rh2or LWS opsin probes overnight at 50–60°C. The blot waswashed twice in 6� SSC, 0.5% (w/v) SDS and twice in 3�SSC, 0.5% SDS at 50–65°C before exposure to X-ray film.
Northern blot and hybridisation
Approximately 6 µg of total retinal RNA of each species wereelectrophoresed on a 1.2% agarose/2.2·mol·l–1 formaldehydegel, vacuum blotted onto Hybond N (Amersham) nylonmembrane, and UV-crosslinked (Stratalinker, Stratagene, LaJolla, CA, USA). The membrane was prehybridised at 55°C inQuickHyb solution (Stratagene), and hybridised at 55°C to opsinprobes generated from random-primed, 32P-labelled sea breamopsin cDNA (SWS2, Rh2 and LWS) and P. borchgrevinki opsin(SWS1) cDNA. Hybridised blots were washed exhaustively in2� SSC/0.1% SDS, followed by 0.1� SSC/0.5% SDS up to50°C, and autoradiographed on X-ray film.
PCR cloning and sequencing of SWS1, SWS2 and Rh2 opsins
Standard polymerase chain reaction (PCR) conditions wereused with either 30·ng cDNA or 100·ng of genomic DNA in a
50·µl reaction volume. A cDNA fragment of about 800·bp ofSWS1 opsin was first obtained from P. borchgrevinki retinalRNA by reverse transcription-PCR amplification. The firststrand cDNA was synthesised using Superscript II reversetranscriptase (Invitrogen), and used for the PCR amplificationof a cDNA fragment with degenerate primers VSWS1F andVSWS1R (Table·1) designed from an alignment of vertebrateSWS1 opsins. Sequencing of the RT-PCR product andBLASTP of translated sequence verified that the fragment wasfrom an SWS1 mRNA. SWS1-specific primers were designedbased on this partial sequence to generate overlapping 5′ and3′ fragments inclusive of UTRs by 5′RACE (rapidamplification of cDNA ends) and 3′RACE. For 5′RACE, thefirst strand cDNA was dC-tailed with terminal deoxynucleotidetransferase and amplified using the SWS1-specific reverseprimer paired with the 5′ RACE adaptor primer (5′RACE kit,Invitrogen). The 3′RACE product was amplified with theSWS1-specific forward primer paired with lock-dockingoligo(dT) (NV(T)20). Primers to the 5′UTR and 3′UTR(P.borchSWS1F and P.borchSWS1R) were used to amplifyfull-length SWS1 cDNA from P. borchgrevinki, D. mawsoniand T. loennbergii first strand cDNA.
Degenerate PCR was also used to amplify the Rh2 opsinsfrom four species, D. mawsoni, P. borchgrevinki, N. angustataand G. acuticeps. Degenerate primers Green1F and Green596Rwere used to amplify an approximately 600·bp product fromD. mawsoni cDNA, which showed homology to teleost Rh2opsins. The 3′ cDNA sequence was obtained by 3′ RACE usingthe FirstChoice™ RLM-RACE kit (Ambion, Austin, TX,
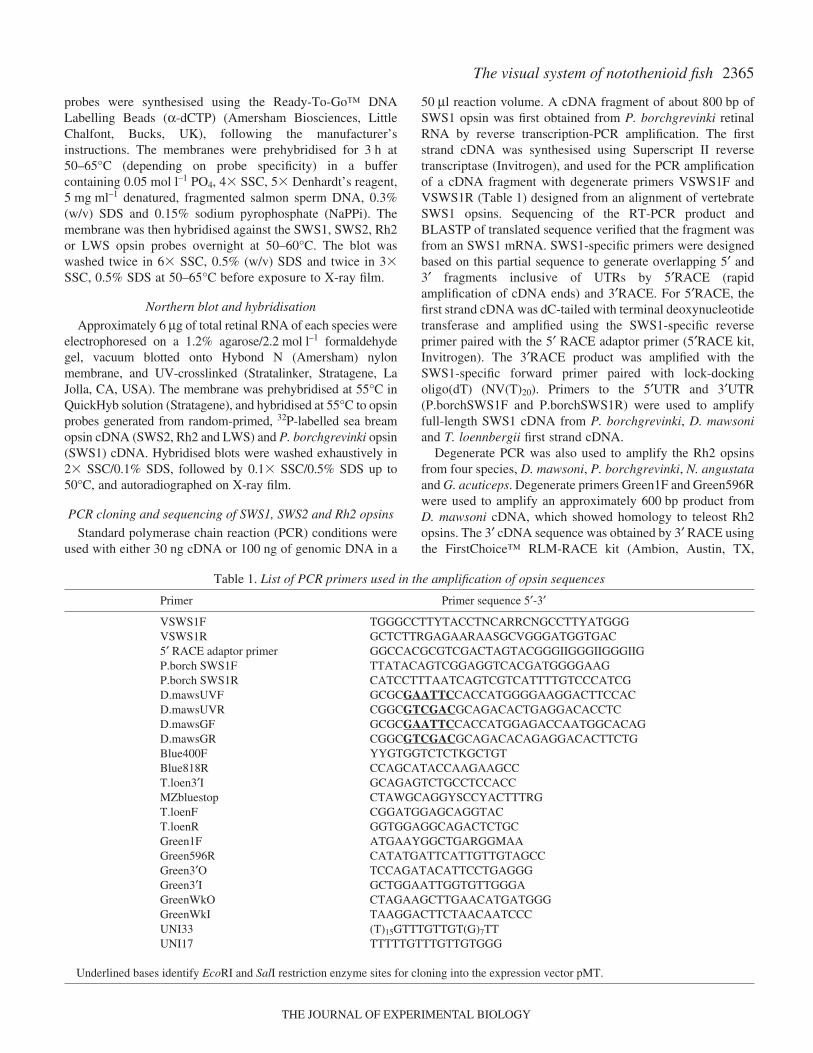
Table·1. List of PCR primers used in the amplification of opsin sequences
Primer Primer sequence 5′-3′
VSWS1F TGGGCCTTYTACCTNCARRCNGCCTTYATGGGVSWS1R GCTCTTRGAGAARAASGCVGGGATGGTGAC5′ RACE adaptor primer GGCCACGCGTCGACTAGTACGGGIIGGGIIGGGIIGP.borch SWS1F TTATACAGTCGGAGGTCACGATGGGGAAGP.borch SWS1R CATCCTTTAATCAGTCGTCATTTTGTCCCATCGD.mawsUVF GCGCGAATTCCACCATGGGGAAGGACTTCCACD.mawsUVR CGGCGTCGACGCAGACACTGAGGACACCTCD.mawsGF GCGCGAATTCCACCATGGAGACCAATGGCACAGD.mawsGR CGGCGTCGACGCAGACACAGAGGACACTTCTGBlue400F YYGTGGTCTCTKGCTGTBlue818R CCAGCATACCAAGAAGCCT.loen3′I GCAGAGTCTGCCTCCACCMZbluestop CTAWGCAGGYSCCYACTTTRGT.loenF CGGATGGAGCAGGTACT.loenR GGTGGAGGCAGACTCTGCGreen1F ATGAAYGGCTGARGGMAAGreen596R CATATGATTCATTGTTGTAGCCGreen3′O TCCAGATACATTCCTGAGGGGreen3′I GCTGGAATTGGTGTTGGGAGreenWkO CTAGAAGCTTGAACATGATGGGGreenWkI TAAGGACTTCTAACAATCCCUNI33 (T)15GTTTGTTGT(G)7TTUNI17 TTTTTGTTTGTTGTGGG
Underlined bases identify EcoRI and SalI restriction enzyme sites for cloning into the expression vector pMT.
THE JOURNAL OF EXPERIMENTAL BIOLOGY
2366
USA) and the D. mawsoni-specific primers Green3′O andGreen3′I. To extend the 5′ sequence and to obtain upstreamsequence information, a genomic walking method withgenomic DNA was used as described by Dominguez andLopez-Larrea (1994) with the initial PCR performed with theuniversal primer UNI33 and the D. mawsoni-specificGreenWkO primer. The inner nested PCR was performed withthe universal primer UNI17 and the gene-specific GreenWkIprimer. The complete Rh2 sequences for P. borchgrevinki, N.angustata and G. acuticeps were amplified with the primersD.mawsGF and D.mawsGR.
The SWS2 opsin DNA was PCR amplified from T.loennbergii genomic DNA with the degenerate primersblue400F and blue818R using a low annealing temperature of48–54°C. This fragment encompassed exons 3 to 5. To extendthe 3′ sequence of the gene, a PCR with the primers T.loen3′Iand MZbluestop was performed on T. loennbergii genomicDNA.
All PCR-amplified products were analysed by gelelectrophoresis and extracted using Wizard™ columns(Promega). The eluted DNA was cloned into the pGEM-T-Easy™ vector (Promega) and sequenced on an ABI 3100 usingthe BigDye® Terminator v3.1 Cycle Sequencing kit (PEApplied Biosystems, Foster City, CA, USA) V.2 or V.3 andvector-specific primers.
Expression of recombinant opsins
The entire coding sequences for D. mawsoni SWS1 and Rh2opsins were amplified from retinal cDNA with Pfu DNApolymerase, using primer pairs D.mawsUVF/D.mawsUVRand D.mawsGF/D.mawsGR containing EcoRI and SalIrestriction sites (shown underlined in Table·1). The resultingproducts were then cloned via these restriction sites into theexpression vector pMT4, which contains the sequence for the1D4 epitope from bovine rod opsin downstream of and in-frame with the SalI site (Franke et al., 1988).
The pMT vector containing either the SWS1 or Rh2 codingsequence was transfected into HEK-293T cells with Genejuice(Invitrogen) according to the manufacturer’s instructions.Thirty 90·mm plates were used per transfection and the cellswere harvested 48·h post-transfection, and washed with 1�PBS. The visual pigments were regenerated in 1� PBS with40·µmol·l–1 11-cis retinal in the dark. The pigments were thenincubated with 1% (w/v) dodecyl-maltoside and 20·mg·ml–1
phenyl methyl sulphonyl fluoride (PMSF) and isolated bypassage over a CNBr-activated Sepharose binding columncoupled to an anti-1D4 monoclonal antibody (Molday andMacKenzie, 1983).
Absorption spectra were recorded in the dark using a dual-path spectrophotometer (Spectronic Unicam, Cambridge,UK). Pigments were either bleached by exposure to lightfor 15·min or acid denatured by incubation with 10.8·µl 1·NHCl for 10·min. The λmax value for each pigment wasdetermined by subtracting the bleached or acid denaturedspectrum from the dark spectrum to produce a differencespectrum. This was then fitted to a standard Govardovskii
rhodopsin A1 template (Govardovskii et al., 2000) and theλmax determined.
In situ hybridisation
Enucleated eyes were fixed in 4% (w/v) paraformaldehydein 1� PBS overnight and then washed briefly in fresh 1� PBS,and stored in 1� PBS until use. Whole mounts were preparedby removing the retinal pigment epithelium (RPE) and placing1·cm wide strips, photoreceptor layer side up, on glass slides.Coverslips were placed on top and weighted down so as to keepthe sample flat. The slides were left in 25% (w/v) sucrose in1� PBS overnight, and then stored at –80°C (with coverslipsremoved). The retinal tissue to be sectioned was left with RPEattached and cut into 0.5·cm squares, placed in 25% (w/v)sucrose overnight and then embedded in OCT medium.Sections 2·µm thick were cut on a cryostat.
Digoxigenin (DIG)-labelled antisense and sense RNAprobes were synthesised from the D. mawsoni SWS1 andRh2 opsin clones and from the sea bream SWS2 opsin clonein pGEM-T-Easy using a DIG RNA labelling kit (RocheDiagnostics Ltd., Lewes, UK). The level of probe cross-hybridisation, as assessed by dot blot analysis, was found tobe very low (data not shown). For hybridisation, retinalwhole mounts and sections were rinsed in 1� PBS and leftto dry for 2·h. Whole mounts were washed in PBS with 0.1%(w/v) Tween (PBST), treated with proteinase K (10·mg·ml–1)for 1–5·min, fixed with 4% (w/v) paraformaldehyde in 1�PBS for 20·min and then washed in PBST before beingincubated in hybridisation buffer for 1·h at 60°C. Retinalsections were treated as described above but withoutproteinase K treatment. DIG-labelled RNA probe was thenadded at an approximate concentration of 0.5·µg·ml–1 andleft to hybridise overnight at 60°C. After multiple washes inSSC and PBST, hybridisation was detected with anti-DIGalkaline phosphatase Fab fragment and labelled forvisualisation with a solution of Nitrobluetetrazoleum (NBT)(18.75·mg·ml–1) and BCIP (9.4·mg·ml–1). Slides wereviewed under a light microscope and images taken with aNikon digital camera.
Histology
Enucleated eyes were transferred into 2% (w/v)paraformaldehyde, 2% (w/v) glutaraldehyde in 1� PBSovernight. The large size of the D. mawsoni eyes (a diameterof approximately 5·cm) made manipulation of the whole retinavery difficult, so fragments were dissected from the eyecup,with the RPE intact, and dehydrated before storage inhistoresin for 24–120·h at 4°C. The fragments were thenembedded in Technovit embedding hardener (Heraeus, Hanau,Germany) and flat mounted on to slides. The eyes of T. hansoniare considerably smaller (1.5·cm diameter) so the whole retinawith RPE attached was dissected and flat mounted. 0.5–2.5·µmthick sections were cut with a glass blade and dried on to slides.The cells were stained with 1% (w/v) Toluidine Blue beforebeing coverslipped. Images were captured using a Nikondigital camera attached to a light microscope.
M. A. Pointer and others
THE JOURNAL OF EXPERIMENTAL BIOLOGY

2367The visual system of notothenioid fish
Phylogenetic analysis
Neighbor-joining (Saitou and Nei, 1987) was used toconstruct phylogenetic trees from opsin nucleotide codingsequences after alignment with ClustalW (Higgins et al.,1996). The degree of support for internal branching wasassessed by bootstrapping with 1000 replicates using theMEGA2 computer package (Kumar et al., 2001).
ResultsThe notothenioids studied represent three families, the
Nototheniidae or cod icefishes (seven species), theChannichthyidae or crocodile icefishes (two species), and theBathydraconidae or Antarctic dragon fish (one species). Mostof these species can be found in shallow water (0–100·m),although for many, their maximal depth range can extend to atleast 500·m (Table·2). One species, the mid-water Dissostichusmawsoni, is deeper dwelling, with a depth range extending to
1600·m. Seven of the species studied, namely Pagotheniaborchgrevinki, Trematomus hansoni, T. bernacchii, T.loennbergii, Gymnodraco acuticeps, Pagetopsis macropterusand Champsocephalus gunnari, are near-shore species whereice cover is generally continuous throughout the year. Theremaining two species, D. mawsoni and Pleuragrammaantarcticum, are migratory and schooling respectively, so willspend some time in open water in the summer, although theyare also frequently found under sea ice. These Antarcticnotothenioids therefore spend a significant proportion, if notall, of the year under ice cover of various thicknesses.Notothenioids do not show a diurnal vertical migration. Theygenerally sit on the sea bottom as they lack a swim bladder andare negatively buoyant. Regular large excursions in the watercolumn at freezing seawater temperatures would therefore beenergetically too costly. A 24·h light:dark cycle is not presentin the high-latitude Antarctic. Larval forms of these species arealso recovered from under the ice.
Table·2. List of notothenioid fish species
Family Common name Species Dwelling and depth range*
Nototheniidae Cod icefishes Dissostichus mawsoni Pelagic; 88–1600·m; usually near-bottom rangeNotothenia angustata Demersal; 0–100·mPagothenia borchgrevinki Cryopelagic; 0–30·mPleuragramma antarcticum Pelagic; 0–700·mTrematomus loennbergii Bathydemersal; 65–832·m; mostly �300·m Trematomus hansoni Demersal; 5–550·mTrematomus bernacchii Demersal; �200·m
Channichthyidae Crocodile icefishes Pagetopsis macropterus Demersal; 5–655·m; mostly 5–40·mChampsocephalus gunnari Pelagic; 0–700·m
Bathydraconidae Antarctic dragonfish Gymnodraco acuticeps Demersal; 0–550·m; mostly �50·m
*Data from Gon and Heemestra (1990).
Table·3. Peak absorbance of visual pigments in rods and cones from microspectrophotometry
SWS, single cone MWS, single cone MWS, double cone Rods
Pagothenia borchgrevinkiMean absorbance No pigment 488.7±0.8 489.2±0.8 498.5±1.2Density/number 0.030/12 0.037/18 0.034/8
Trematomus loennbergiiMean absorbance 426.4±1.3 490.1±6.5 489.8±1.0 500.0±0.5Density/number 0.020/8 0.011/1 0.023/8 0.026/12
Trematomus hansoniMean absorbance 417.6±7.3 490.1±0.9 489.5±1.1 501.0±0.7Density/number 0.005/4 0.025/11 0.026/7 0.017/10
Trematomus bernacchiiMean absorbance 416.1±2.8 489.6±0.8 489.1±1.1 502.3±0.6Density/number 0.009/9 0.028/6 0.031/12 0.022/9
Dissostichus mawsoniMean absorbance 414.3±2.9 490.4±1.3 490.8±0.6 503.7±1.7Density/number 0.012/6 0.016/8 0.030/15 0.014/4
Peak absorbance (λmax) in nm (± S.D.) of the mean absorbance spectra including the mean maximum transverse absorbance and the numberof cells that passed selection criteria.
THE JOURNAL OF EXPERIMENTAL BIOLOGY
2368
Microspectrophotometry
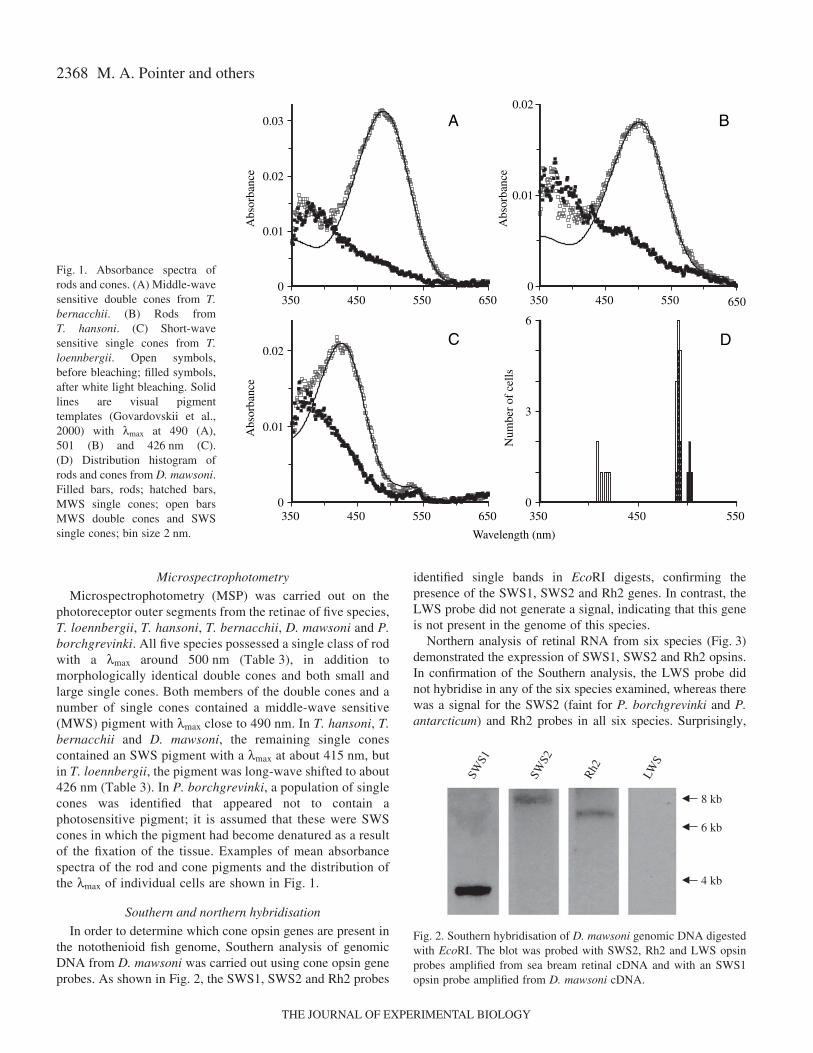
Microspectrophotometry (MSP) was carried out on thephotoreceptor outer segments from the retinae of five species,T. loennbergii, T. hansoni, T. bernacchii, D. mawsoni and P.borchgrevinki. All five species possessed a single class of rodwith a λmax around 500·nm (Table·3), in addition tomorphologically identical double cones and both small andlarge single cones. Both members of the double cones and anumber of single cones contained a middle-wave sensitive(MWS) pigment with λmax close to 490·nm. In T. hansoni, T.bernacchii and D. mawsoni, the remaining single conescontained an SWS pigment with a λmax at about 415·nm, butin T. loennbergii, the pigment was long-wave shifted to about426·nm (Table·3). In P. borchgrevinki, a population of singlecones was identified that appeared not to contain aphotosensitive pigment; it is assumed that these were SWScones in which the pigment had become denatured as a resultof the fixation of the tissue. Examples of mean absorbancespectra of the rod and cone pigments and the distribution ofthe λmax of individual cells are shown in Fig.·1.
Southern and northern hybridisation
In order to determine which cone opsin genes are present inthe notothenioid fish genome, Southern analysis of genomicDNA from D. mawsoni was carried out using cone opsin geneprobes. As shown in Fig.·2, the SWS1, SWS2 and Rh2 probes
identified single bands in EcoRI digests, confirming thepresence of the SWS1, SWS2 and Rh2 genes. In contrast, theLWS probe did not generate a signal, indicating that this geneis not present in the genome of this species.
Northern analysis of retinal RNA from six species (Fig.·3)demonstrated the expression of SWS1, SWS2 and Rh2 opsins.In confirmation of the Southern analysis, the LWS probe didnot hybridise in any of the six species examined, whereas therewas a signal for the SWS2 (faint for P. borchgrevinki and P.antarcticum) and Rh2 probes in all six species. Surprisingly,
M. A. Pointer and others
350 450 550 6500
0.01
0.02
Wavelength (nm)
350 450 550 6500
0.01
0.02
0
0.01
0.02
0.03
Abs
orba
nce
Abs
orba
nce
Abs
orba
nce
Num
ber
of c
ells
350 450 550 650
0
3
6
350 450 550
A B
C D
Fig.·1. Absorbance spectra ofrods and cones. (A) Middle-wavesensitive double cones from T.bernacchii. (B) Rods fromT. hansoni. (C) Short-wavesensitive single cones from T.loennbergii. Open symbols,before bleaching; filled symbols,after white light bleaching. Solidlines are visual pigmenttemplates (Govardovskii et al.,2000) with λmax at 490 (A),501 (B) and 426·nm (C).(D) Distribution histogram ofrods and cones from D. mawsoni.Filled bars, rods; hatched bars,MWS single cones; open barsMWS double cones and SWSsingle cones; bin size 2·nm.
SWS1
SWS2
Rh2
LWS
8 kb
6 kb
4 kb
Fig.·2. Southern hybridisation of D. mawsoni genomic DNA digestedwith EcoRI. The blot was probed with SWS2, Rh2 and LWS opsinprobes amplified from sea bream retinal cDNA and with an SWS1opsin probe amplified from D. mawsoni cDNA.
THE JOURNAL OF EXPERIMENTAL BIOLOGY

2369The visual system of notothenioid fish
only RNA from the P. borchgrevinki retina hybridised with theSWS1 probe. SWS1 opsins are clearly expressed in the otherspecies since SWS1 coding sequences were amplified fromretinal cDNA. The restriction of signal only to the RNA fromthe P. borchgrevinki retina may reflect a quantitative difference,with rather more SWS1 photoreceptors in the cryopelagicspecies, P. borchgrevinki, that is found at the underside of seaice, than in the other species that live at deeper depths.
Amplification and sequencing of opsin genes
SWS1 opsins
The SWS1 coding sequence was amplified from retinalcDNA using a combination of RT-PCR and 5′ and 3′ RACE.
Primer details are in Table·1. Full coding sequences wereobtained for five species, D. mawsoni, N. angustata, P.borchgrevinki, T. loennbergii and P. macropterus (Fig.·4A).These opsins showed an average of 90.7% amino acid identity,with no consistent differences between the two notothenioidfamilies that these species represent.
The λmax of the SWS1 class of visual pigments varies indifferent vertebrate species between the UV (generally around360·nm) and violet (>390·nm) regions of the spectrum. SinceUVS cones were not identified by MSP, the λmax of the pigmentin D. mawsoni was determined as a recombinant opsinexpressed in HEK 293T cells and regenerated in vitro with 11-cis-retinal. As shown in Fig.·4B, a Govardovski visual pigment
SWS1 SWS2 Rh2 LWS
D. m
awso
niP.
bor
chgr
evin
ki
T. h
anso
niG
. acu
ticep
sP.
ant
arct
icum
C. g
unna
ri
D. m
awso
niP.
bor
chgr
evin
ki
T. h
anso
niG
. acu
ticep
sP.
ant
arct
icum
C. g
unna
ri
D. m
awso
niP.
bor
chgr
evin
ki
T. h
anso
niG
. acu
ticep
sP.
ant
arct
icum
C. g
unna
ri
D. m
awso
niP.
bor
chgr
evin
ki
T. h
anso
niG
. acu
ticep
sP.
ant
arct
icum
C. g
unna
ri
Fig.·3. Northern blots of retinal RNAfrom six species of notothenioid fish.The blots were hybridised with opsinprobes amplified and cloned either fromsea bream opsin cDNA (SWS2, Rh2 andLWS) or from P. borchgrevinki (SWS1)cDNA.
Fig.·4. SWS1 opsins. (A) Deduced amino acid sequences from six species of notothenioid fish (GenBank accession numbers AY927651-6).The Phe residue at the equivalent site to 86 in the bovine opsin sequence that is critically important for tuning into the UV is boxed, togetherwith the counterion Glu at the equivalent site to 113 and the Lys at the equivalent site to 296 that binds the chromophore. (B) In vitro absorbancespectrum for the pigment from D. mawsoni. Recombinant SWS1 opsin was produced in transfected HEK 293T cells and the pigment regeneratedwith 11-cis-retinal. The difference spectrum shown with a fitted Govardovski visual pigment template, was obtained by subtracting the acid-denatured spectrum from the dark spectrum.
M G KD FHL YEN VS NIS PF EGP QYH LA PRW AF HLQ TFF MG LVF LA GTP LNL LV LFV TL KHK KLR VP LNY IL VNV SAS GF IF V 8 0. . .. ... ... .. ... .. ... ... .. .L . .. ... .V .. . ... .. ... ... .. ... .. ... ... .. ... .. ... ..A . . .. .
. . .H . .. ... .. ... .. ... ... .. .L .. . ... .V . .. ... .. ... ... .. ... .. ... ... .. ... .. ... ..A .. . . .
. . .. ... ... .. ... .. ... ... .. ... .. ... .I . .. F.. F V ... ..V . . ... .. ... ... .. ... .. ... .F A. . .. T
. . .. ... ... .. ... .. ... ... .. ... .. ... .I . .. F..F . ... ... .. ... .. ... ... .. ... .. ... .F A. . .. A
. . .. ... ... .. ... .. ... ... .. ... . .Y .. .I .. .F .. F .. .. ... .. ... .. ... ... .. ... .. ... .FA .. .. T
T F SV SQV FIS ST RGY FF LGH TMC SL ESA MG SIA GLV TA WSL AV LSL ERY LV ICK PL GAF TFT NN YAL AA VAF TWF MG IG C 1 60. . .. ... ... .. .. .Y . ... ... .. .A .. . ... ... .. ... .. ... .. .F . ... .. ... ..S ..H .V .. . .. ... .. .S .. . .. ... ... .. ... .. ... ... .M . .. .. ... ... .. ... .. ... ... F .. .. .. ... ... . .H .. .. ... ... .. .. .
. . .. ... ..C . A .. .Y . ..L .L. K ..A . .. A.. . .. .S . .. .. ... ... F .. .. .. ... ..G K E H. .G . .G .. .. . .V . .
S . .. ... ..C . . ... .. ..L .. .T . ... .. ... ... .S .. . .. ... .. .F . ... .. ... ..S .E H.M .. .G . ... .. V..
. . .. ... ..C . A .. .Y . ... ... A .. AT .. ... ... .. ... .. ... .. .F . ... .. ... ..S .E H. . .. .G . ... .. V..
A I PP FFG WSR YI PEG LG CSC GPD WY THN EE FHC SSY TA FLM VT CFI TPL SI IIF CY AQL MMT LK AVA AQ QAE SVS TQ KA E 2 40. . .. ... ... .. ... .. .A . ... .. ... .. ... T.. . . ... .. ... ... .. ... .. .. .L .. .R .. . .. ... ... .. .. .
. . .. ... ... .. ... .. .A . ... .. ... .. ... G.. . . ... .. ... ... .. ... .. .. .L .. .R .. . .E . .. ... .. .. .
.T . . .Y .. .. .. ... .. .A . ... .. ... .. Y..T .. .F ..L . . ..V M.I .V .. . . .S .. L.. .R . .. .. ... ... .. .. .
. . .. ... ... .. ... .. ... ... .. ... . .Y .. T.. .F . .L .. . .V M .I .. . .. .. .. .L .. .R .. . .. ... ... .. .. .
. . .. ... ... .. ... .. .A . ... .. ... .. Y.. . .. .F . .. .. ... M.. . . .N . .. G..L .. .R .. . .. ... ... .. .. .
K E VS RMI VVM VG SFL VC YGP YAL AA LYF AY STE QNK DY RLV AI PAL FSK SS CVY NP LIY AFM NK QFK GC IME TVF GK NT E 3 20. . .. ... ... .. ... .. ... ... .. .. .G F. .. ... .. .. .T . ..M .. . .. ... .. ... ... .. ... .. ... ... .. .. .
. . .. ... ... .. ... .. ... ... .. ... .. ... ... .. ... .. ... ... .. ... .. ... ... .. ... .. ... ... .. .. .
. . .. ... ... .. ..V . . .A .. . .S . ... .. ..D P. . .. .. .T . ..M .. . .. ... .. ... ... .. ... .. ... ... .. .P .
. . .. ... ... .. ..V . . .A .. .. .. ... .. ..D P.. .. ... TV ... ... .. ... .. ... ... .. ... .. ... ... .. .. .
. . .. ... ... .. ..V . . .A .. .. .. ... .. ..D P.. .. ... .. ..I . .. .. ... .. ... T.. . . ... .. ... ... .. .. .
D D SK VSA SKT EV SSV S 336.A . Q ..T . N .. . ... .
.A . Q ..T . .. .. ... .
. . .. ..T . .. .. ... .
. . .. ..T . .. .. ... .
. . .. ..T . .. .. ... .
M G KD FHL YEN VS NIS PF EGP QYH LA PRW AF HLQ TFF MG LVF LA GTP LNL LV LFV TL KHK KLR VP LNY IL VNV SAS GF IF V 8 0. . .. ... ... .. ... .. ... ... .. .L . .. ... .V .. . ... .. ... ... .. ... .. ... ... .. ... .. ... ..A . . .. .
350 400 450 500 550
0
0.01
–0.01
0.02
0.03
Wavelength (nm)
Abs
orba
nce
λmax 369 nm
A BD. mawsoniT. loennbergiiP. borchgrevinkiN. angustataP. macropterusG. acuticeps
D. mawsoniT. loennbergiiP. borchgrevinkiN. angustataP. macropterusG. acuticeps
D. mawsoniT. loennbergiiP. borchgrevinkiN. angustataP. macropterusG. acuticeps
D. mawsoniT. loennbergiiP. borchgrevinkiN. angustataP. macropterusG. acuticeps
D. mawsoniT. loennbergiiP. borchgrevinkiN. angustataP. macropterusG. acuticeps
THE JOURNAL OF EXPERIMENTAL BIOLOGY

2370
template (Govardovskii et al., 2000) fitted to the differencespectrum gave a λmax of 369·nm, confirming the presence of aUVS SWS1 pigment in this species.
Previous work (Cowing et al., 2002; Fasick et al., 2002;
Parry et al., 2004) has shown that the amino acid present at site86 is critically important for the production of UV- or violet-sensitivity, with phenylalanine (Phe) present in all teleost,amphibian, reptilian and mammalian UVS pigments sequenced
M. A. Pointer and others
T. loennbergii ---------------------------------------------------------INALTVACTIQNKKLRSHLNYIL 80Goldfish MKQVPEFHEDFYIPIPLDINNLSAYSPFLVPQDHLGNQGIFMAMSVFMFFIFIGGAS..I..IL....F...........
T. loennbergii VNLAVSNLLVSCVGSLTAFLSFANKYFILGPLACNIEGFIATLGGMVSLWSLAVVALERWLVICKPLGHFIFKPDHAIAC 160Goldfish ...SIA..F.AIF..PLS.Y..F.R...F.AT..K....L.......G........F...........N.T..TP....G
T. loennbergii CALTWVFALIASVPPLPIFGWSRYIPEGLQCSCGPDWYTTNNKYNNESYVMFLFGFCFAVPFATIVFCYSQLLITLK-AV 240Goldfish .I.P.IS..A..L.--.L....................................C.......G......G.......L.A
T. loennbergii KAQAESASTQKAEREVTRMVVIMVFGFLVCWLPYASFALWDVNNRGQTFDLRLASVPSVFSKSSAIYNPVIYVLLNKQFR 320Goldfish ....D............K...V..L......A.....S..I.SH..EE....M..I..CL..A.TV........M.....
T. loennbergii TCMMKILGMGGGDDDESSSTTSVTEVSKVAPA- 353Goldfish S....MVCGKNIEE..A..SSQ..Q..S...EK
Fig.·5. Deduced amino acidsequences for the partial sequenceof SWS2 opsin from T.loennbergii (GenBank accessionnumber AY771356), aligned withgoldfish SWS2 opsin. Boxedresidues identify known spectraltuning sites.
D. mawsoni METNGTEGNNFYIPMSNRTGIVRSPYEYQQYYLADPIMFKLLAFYMLFLIFTGTPINALTLLVTIQNKKLQTPLNLILVN 80P. borchgrevinki ..............................................V.................................N. angustata .....A......................N...........V.....V............................F....G. acuticeps ............V...............N...M.......IQ......................................
D. mawsoni LAVAGLIMCAFGFTITFVSSINGYFILGPTFCAIEGFMATLGGQVSLWSLVVLAVERYIVVCKPMGSFKFSNTHAGIGVG 160P. borchgrevinki ......V..........I...S...........M..............................................N. angustata .................I..M......................E.A.................S................G. acuticeps .S...............I...............M...L..........................................
D. mawsoni ITWVMASTCAGPPLLGWSRYIPEGMQCSCGPDFYTLAPGFNNESYVMYMFTVHFFTPVFLIFFSYGSLVLTVKAAAAQQQ 240P. borchgrevinki ...L..IA..A...F.....L...L.......Y...............L.V......G......................N. angustata ......FA......F.....L...........Y...........F....S.I............................G. acuticeps ......FA......F.....L...L.......Y...............L.C......I......................
D. mawsoni ESESTQKAEREVTRMCILMVFGFLLAWVPYASFAGWIFLNKGAAFTALTAAIPAFFAKSSALYNPVIYVLLNKQFRNCML 320P. borchgrevinki ..................................A...M.........................................N. angustata ................L.......V....................S..................................G. acuticeps ................L.......V.......................................................
D. mawsoni STIGMGRMVEDETSVSASKTEVSSVS 346P. borchgrevinki ..V...G...................N. angustata ......G...................G. acuticeps .S....G.....S.............
–0.01
0
0.01
0.02
Abs
orba
nce
A
P. borchgrevinki
G. acuticeps
D. mawsoni
N. angustata
Goldfish Rh2
Goldfish Rh1
Goldfish SWS2
Goldfish SWS1
Goldfish LWS
Drosophila Rh3
91
94
100
100
40
100
35
0.1
CB
350 400 450 500 550Wavelength (nm)
λmax 488 nm
Fig.·6. Rh2 opsins. (A) Deduced amino acid sequences from four species of notothenioid fish(GenBank accession numbers AY771352-AY771355). Residue 122 is boxed. (B) Neighbor-joining tree of opsin amino acid sequences. The numbers at each branch point are the bootstrapvalues derived from 1000 bootstraps. The scale bar is calibrated as 0.1 substitutions per site,with the length of each branch proportional to divergence. Drosophila Rh3 (GenBank accession number NM_079687) was used as an outgroup.Goldfish opsin GenBank accession numbers: Rh1 L11863, Rh2 L11866, SWS1 D85863, SWS2 11864, LWS L11867 (C) In vitro absorbancespectrum for the pigment from D. mawsoni. The difference spectrum shown with a fitted Govardovski visual pigment template, was obtainedby subtracting the bleached spectrum from the dark spectrum.
THE JOURNAL OF EXPERIMENTAL BIOLOGY
2371The visual system of notothenioid fish
to date (Hunt et al., 2004). Since Phe86 is present in all six ofthe notothenioid SWS1 pigments, and the opsin in D. mawsonihas been shown to encode a UVS pigment by in vitroexpression, it is likely that all six species possess a UVS SWS1pigment.
SWS2 opsins
The SWS2 opsin gene sequence was amplified from T.loennbergii genomic DNA using degenerate PCR primersBlue400F and Blue818R (Table·1). This generated a 1·kbfragment that included exons 3–5. A 500·bp fragment at the 5′end was then amplified by a genomic walk (Dominguez andLopez-Larrea, 1994) with gene-specific primers (Table·1).This extended the sequence into the first exon to within 200·bpof the start codon. However, further sequence could not beobtained at the 5′ end as the universal first round walkingprimer consistently bound to the same site within the first exon.Expression was validated by RT-PCR in P. borchgrevinki andG. acuticeps, but no product could be amplified from D.mawsoni or N. angustata mRNA (data not shown).
The deduced amino acid sequence is shown in Fig.·5,aligned with the goldfish SWS2 sequence. This sequence wasthen used to design a primer pair, T.loenF and T.loenR(Table·1), that successfully amplified a short 250·bp fragmentof the SWS2 coding sequence (data not shown) from retinalcDNA of two species, P. borchgrevinki and G. acuticeps,thereby confirming expression of the SWS2 gene in thenotothenioid fish retina.
Rh2 opsins
The coding sequence for the Rh2 opsin gene was initiallyamplified from D. mawsoni retinal cDNA using degenerateprimers Green1F and Green596R (Table·1). From this 600·bpfragment, 3′ RACE and genomic walking primers(Dominguez and Lopez-Larrea, 1994) were designed tocomplete the coding region. Primers designed to the 5′ and3′ ends of the coding region were then used to amplify fullcoding sequences from P. borchgrevinki, G. acuticeps and N.angustata cDNA. The translated sequences are shownaligned in Fig.·6A. Phylogenetic analysis (Fig.·6B) showsthat the notothenioid sequences form a clade with goldfishRh2 with a bootstrap value of 100. The sequences areapproximately 93% identical to each other at the amino acidlevel and show an 84% identity with cichlid (Metriaclimazebra, GenBank acc. no. AF247122), and a 74% identity withcyprinid (goldfish, GenBank acc. no. L11866) Rh2 opsins.Their identity as Rh2 cone pigments was further confirmedby in vitro expression of the D. mawsoni opsin in HEK 293Tcells followed by regeneration of the pigment with 11-cis-retinal. The difference spectrum for the pigment (Fig.·6C) fitsa Govardovskii template at 488·nm, which closely matchesthe value of 490·nm obtained from single and double conephotoreceptors by MSP, and differs from the rod pigmentwhich has a λmax of around 500·nm as determined by MSP(Table·3).
Although the amino acid sequences of the Rh1 and Rh2
opsins are similar, Rh2 pigments show higher rates ofregeneration and meta II decay than Rh1 pigments, and thisdifference has been shown, for chicken pigments, to belargely dependent on the residue present at site 122 (Imai etal., 1997). Interestingly, the notothenioid Rh2 pigments differat this site, with three species following chicken Rh2, withGln, but one, N. angustata, following chicken Rh1, with Glu(Fig.·6A).
In situ hybridisation
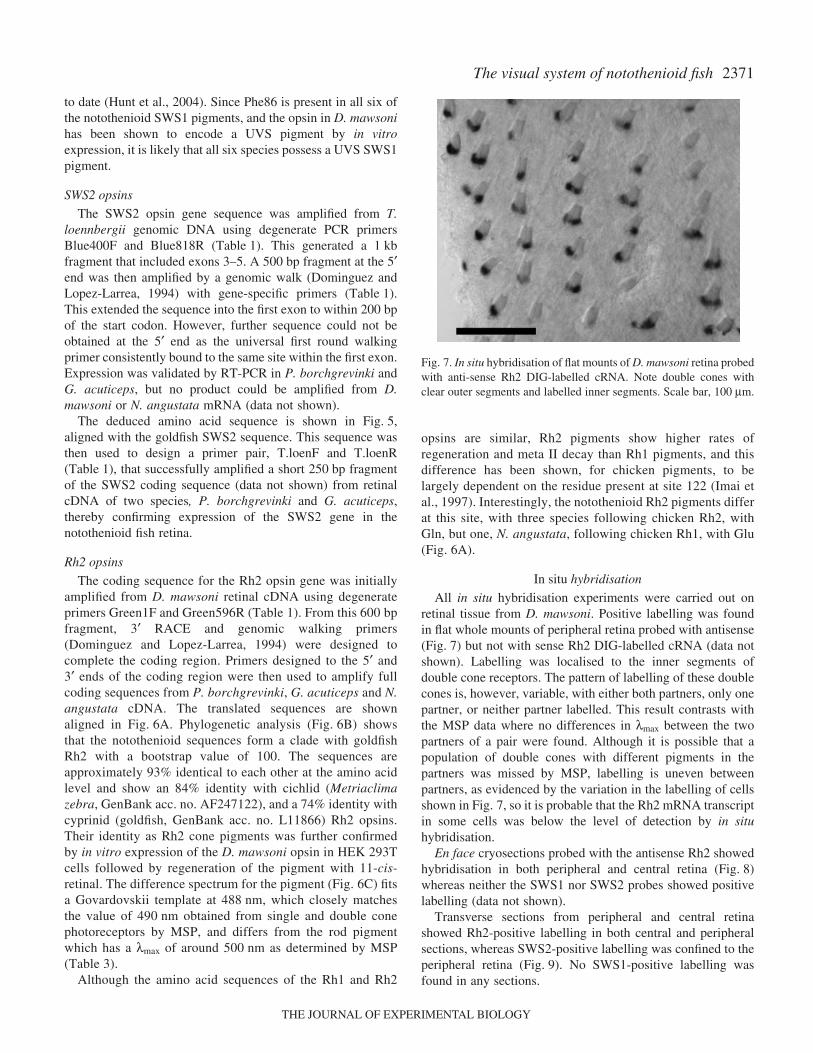
All in situ hybridisation experiments were carried out onretinal tissue from D. mawsoni. Positive labelling was foundin flat whole mounts of peripheral retina probed with antisense(Fig.·7) but not with sense Rh2 DIG-labelled cRNA (data notshown). Labelling was localised to the inner segments ofdouble cone receptors. The pattern of labelling of these doublecones is, however, variable, with either both partners, only onepartner, or neither partner labelled. This result contrasts withthe MSP data where no differences in λmax between the twopartners of a pair were found. Although it is possible that apopulation of double cones with different pigments in thepartners was missed by MSP, labelling is uneven betweenpartners, as evidenced by the variation in the labelling of cellsshown in Fig.·7, so it is probable that the Rh2 mRNA transcriptin some cells was below the level of detection by in situhybridisation.
En face cryosections probed with the antisense Rh2 showedhybridisation in both peripheral and central retina (Fig.·8)whereas neither the SWS1 nor SWS2 probes showed positivelabelling (data not shown).
Transverse sections from peripheral and central retinashowed Rh2-positive labelling in both central and peripheralsections, whereas SWS2-positive labelling was confined to theperipheral retina (Fig.·9). No SWS1-positive labelling wasfound in any sections.
Fig.·7. In situ hybridisation of flat mounts of D. mawsoni retina probedwith anti-sense Rh2 DIG-labelled cRNA. Note double cones withclear outer segments and labelled inner segments. Scale bar, 100·µm.
THE JOURNAL OF EXPERIMENTAL BIOLOGY

2372
HistologyIn order to determine the spatial organisation of cone
photoreceptors in species adapted to different depths, flatwhole mounts of retinae from two species, D. mawsoni, whichinhabits depths down to 1600·m, and T. hansoni, whichgenerally lives in shallow waters and is found down to 550·m(Table·2), were examined. Note, however, that both specieshad been maintained after capture in identical conditions of aflow-through tank under continuous dim light, so anydifferences in morphology do not just reflect differences indark adaptation of the individuals under study. As shown in
Fig.·10, the retina of D. mawsoni is organised with the septumbetween double cone partners always orientated in the samedirection. This is typical of a row mosaic. There are some gapsin the mosaic caused by missing single cones, although ingeneral, the mosaic is retained across all regions of the retina.In contrast, the retina of T. hansoni is organised into a squaremosaic in which adjacent double cones lie at right angles toeach other. Central cones are present but corner cones arelacking. The overall packing of cone photoreceptors is lowerin the D. mawsoni retina, thereby allowing for a higher rodphotoreceptor density.
DiscussionThe ancestral visual pigment complement of jawed
vertebrates almost certainly comprised a single rod pigmentclass and four cone pigment classes with λmax values in the UV,blue, green and yellow regions of the spectrum. Thecombination of direct sampling of visual pigment spectra insitu by MSP, Southern analysis of opsin genes, and northernanalysis of opsin gene transcripts in the retinae of notothenioidfish is consistent in demonstrating the retention of the rod andthree of the cone classes, a UV-sensitive SWS1 opsin, a blue-sensitive SWS2 opsin, and a green-sensitive Rh2 opsin. TheLWS opsin would appear to have been discarded and the lackof any signal from the Southern analysis indicates that thishappened sufficiently long ago for the defunct sequence tohave diverged such that it no longer hybridises with the LWSgene probe.
As down-welling light passes through a body of water, itbecomes progressively attenuated with a maximum penetrationin the clearest oceanic water to around 1000·m. Thisattenuation is greater, however, at longer and shorterwavelengths, such that after a few hundred metres, down-welling light is reduced to a narrow band of radiation between470 and 480·nm in the blue-green region of the spectrum(Jerlov, 1976). In Antarctic waters, light penetration is furtherreduced by snow and thick sea-ice cover with a peaktransmission around 500·nm (Pankhurst and Montgomery,1989; Perovich et al., 1998). These reduced light levels underthe ice will therefore limit photopic vision to the upper 150·mand scotopic vision to a maximum depth of around 300–400·m(Morita et al., 1997; Pankhurst and Montgomery, 1989) insummer months. In the winter, these limitations will besubstantially greater.
The longwave spectral attenuation of light as it passesthrough ice and water is the most probable evolutionary basisfor the loss of the LWS pigment and red-sensitivephotoreceptors in notothenioid fish. In fact, the loss of long-wave sensitivity is not unusual in fish, particularly in speciesfrom low-light environments such as the deep ocean (Douglaset al., 2003; Levine and MacNichol, 1979; Loew and Lythgoe,1978; Yokoyama and Tada, 2000; Yokoyama et al., 1999) anddeep lakes. The species flock of cottoid fish in Lake Baikal isan example of the latter situation; amongst these species, onlythe very surface dwelling have retained red cones (Bowmaker
M. A. Pointer and others
Fig.·8. In situ hybridisation of en face sections of D. mawsoni retina.(A) Central retina probed with anti-sense Rh2 DIG-labelled cRNA.(B) Peripheral retina probed with anti-sense Rh2 DIG-labelled cRNA.(C) Control probed with sense Rh2 DIG-labelled cRNA. Labelledcells are indicated with arrows. Scale bar, 100·µm.
THE JOURNAL OF EXPERIMENTAL BIOLOGY

2373The visual system of notothenioid fish
et al., 1994). What remains unclear is why the UVS pigmenthas been retained in notothenioid fish where the penetration ofUV light though snow and sea ice would also be extremelylimited.
Only P. borchgrevinki retinal RNA gave a positive signal bynorthern analysis with an SWS1 opsin probe, althoughexpression of an SWS1 opsin in the retinae of other species isindicated by the successful amplification of the full SWS1coding sequences from retinal cDNAs. Presumably, only asmall number of SWS1 receptors are present in these latterspecies such that the SWS1 mRNA levels are below detectionlevel by northern analysis. No UV cones were identified byMSP, although this may be a sampling problem arising fromthe small number of UV cones that may be present in the retina.UV sensitivity of the SWS1 pigment, if present, is a consistentfinding in teleost fish and the UV sensitivity of the pigment inD. mawsoni was confirmed directly by in vitro expression and
regeneration. The key amino acid for thisUV sensitivity is Phe at site 86 (Hunt et al.,2004); all five notothenioid fish studiedpossessed this residue so it is probable thatthe other four species also possess a UVpigment. Many fish possess UV sensitivitywhile immature to aid plankton foraging,but it is then lost upon maturity (Bowmakerand Kunz, 1987; Loew et al., 1993).Notothenioid fish may also follow thispattern, with a low number of UV conesretained into the adult, although the positivesignal by northern analysis seen with P.borchgrevinki retinal RNA may beassociated with a higher frequency of UVcones in this cryopelagic species that lives
Fig.·9. In situ hybridisation of transverse cryosections of D. mawsoniretina. (A) Peripheral retina with SWS2 anti-sense probe. (B) Centralretina with SWS2 anti-sense probe. (C) Control peripheral retina withSWS2 sense probe. (D) Peripheral retina with Rh2 anti-sense probe.(E) Control peripheral retina with Rh2 sense probe. Positive regionsare stained blue. INL, inner nuclear layer; ONL, outer nuclear layer;OS, outer segments; RPE, retinal pigmented epithelium. Scale bar,100·µm.
Fig.·10. Flat whole-mounted retinae from (A) D. mawsoni and (B) T. hansoni. S, singlecones; D, double cones. Scale bar, 100·µm.
THE JOURNAL OF EXPERIMENTAL BIOLOGY
2374
in the platelet ice layer on the underside of surface sea ice; thehigher levels of UV light just below the ice that this specieswill encounter may have led to the retention of more UV conesthan in other species.
SWS2 opsin expression in retinal RNA was confirmed bynorthern analysis in six species, by PCR in two species, P.borchgrevinki and G. acuticeps, and by the amplification,cloning and sequencing of 800·bp of the SWS2 gene from thegenomic DNA of a third species, T. loennbergii. Surprisingly,although northern analysis gave a positive, albeit faint, signalwith P. borchgrevinki retinal RNA, no blue cones wereidentified by MSP. This may again be due to samplinglimitation although a population of single cones was identifiedby MSP that appear to have outer segments devoid of pigment.It may be that these cones originally contained the blue-sensitive SWS2 pigment but that fixation had denatured thepigment.
All five species of notothenioid fish examined by MSP gavea λmax for the MWS cones of around 490·nm, a common valuefor Rh2 pigments in teleost fish, and this value was alsoobtained for the D. mawsoni Rh2 pigment by in vitroexpression and regeneration with 11-cis retinal. This alsoagrees exactly with the photopic spectral sensitivity asdetermined by electrophysiology in P. borchgrevinki (Moritaet al., 1997) and in T. bernacchii (Pankhurst and Montgomery,1989). Although the λmax values for the pigment in the differentnotothenioid species are essentially identical, they do differ atsite 122, which has been implicated in determining the rate ofpigment regeneration and meta II decay in chicken rod and Rh2cone pigments (Imai et al., 1997). In chicken rod, chargedGlu122 is present with uncharged Gln in chicken Rh2. Thepigment in N. angustata departs from this rule however, withGlu present rather than Gln, although it is difficult to see whythe Rh2 pigment in N. angustata should be more rod-like thanthe pigments in the other three species. Moreover, acomparison of other fish rod and Rh2 cone opsin sequencesshows that the residue present at site 122 is not tightlyconserved, with Glu present in the Rh2 pigments of goldfishand Metriaclima zebra, and either Glu, Gln or Val present inthe rod pigments of different species of deep-sea fish (Hunt etal., 2001). In view of this, it would seem unlikely that this siteplays the same key role in the regulation of the rate ofregeneration in fish as it does in chicken pigments. However,it would appear to have an impact on spectral tuning, with thesubstitution of Gln by Glu causing a 14–15·nm shortwave shiftin zebrafish Rh2 pigments (Chinen et al., 2005).
MSP identified both partners of all the double cones as greensensitive, and single cones as either blue or green sensitive. Insitu hybridisation with an Rh2 probe also demonstrated thatdouble cones express the Rh2 pigment, both in peripheral andcentral retina. Although SWS single cones were routinelyidentified by MSP, the SWS2 probe showed positive stainingonly in transverse sections of peripheral retina, indicatingeither that blue cones are only present in the peripheral retinaor that the expression level in the central retina is belowdetection by in situ hybridisation. No signal for UV cones was
obtained by in situ hybridisation with the SWS1 probe, and noUV cones were identified by MSP, although PCR experimentsdid confirm that SWS1 mRNA is present in the retina of D.mawsoni.
This absence of identifiable UV cones raises a majorquestion regarding the organisation of the different spectralcone classes within the retinal cone mosaic. In a number ofspecies of Trematomus, there is a typical square cone mosaicwith both central and corner single cones (Meyer-Rochow andKlyne, 1982; Miyazaki et al., 2002; Miyazaki et al., 2001).Miyazaki et al. have assumed that because the corner cones inmany teleosts are UV sensitive, this will also be the case in thenotothenioids. Our data, both molecular and MSP, indicate thatthis cannot be the case, at least not throughout the retina.During MSP experiments, we often encountered preparationswhere two small single cones were clearly aligned on eitherside of a double cone in the position of corner cones. Thesesingle cones were, however, green sensitive and spectrallyidentical to the double cones. We infer from this that at leastin some regions of the retina, the mosaic squares are composedof double cones and corner single cones that are all greensensitive, surrounding a blue-sensitive central single cone.
The organisation of the cone receptor mosaics is different inthe retinae of two related nototheniid species, D. mawsoni andT. hansoni. The deeper dwelling D. mawsoni (mainly around1600·m, but sometimes up at 300–500·m to feed) has doubleand single cones positioned in a row mosaic. All double conesin a single row lie in the same orientation, with single conesforming rows in between the doubles. Meyer-Rochow andKlyne (1982) described this as a hexagonal arrangement ofdouble cones surrounding a pair of single cones, but this wouldappear to be a consequence of the slightly disordered row array(Fig.·10). Cone row arrays are commonly found in fish thathave a reduced demand on photopic vision, e.g. in deeperdwelling species where vision is largely dependent on thescotopic system, and in species with a non-predatory lifestyle.The lack of a retinomotor response in the D. mawsoni retina(Meyer-Rochow and Klyne, 1982) is also consistent with alight environment that lacks significant fluctuations in intensityas found at depth in the ocean. The second species examined,T. hansoni, is demersal but lives in shallower water (down to550·m). The retina of this species is organised into a typicalsquare mosaic in which the double cones form the sides of asquare, each orientated 90° to its closest neighbours. In contrastto the previous study by Miyazaki et al. (2001), there appearsto be only a single morphologically distinct class of centralsingle cones, with corner cones absent, which may explain thefailure to identify UV cones by MSP. Two distinct retinalarrangements are therefore present in two related specieswithin the same family. However, the visual pigments of thedeeper dwelling species do not differ from the more shallowliving fish: indeed, the λmax values for rod, Rh2, and SWS2pigments match almost exactly across all notothenioid speciesstudied.
In general there is a trend in deep-water fish for themaximum sensitivities of the visual pigments of both rods and
M. A. Pointer and others
THE JOURNAL OF EXPERIMENTAL BIOLOGY

2375The visual system of notothenioid fish
cones to be displaced to shorter wavelengths with increasingdepth of habitat, and for the cone population to be reduced andeventually lost. This is most evident in deep-sea fish that havepure rod retinae with λmax around 470–480·nm (Bowmaker,1995; Douglas and Partridge, 1997; Partridge et al., 1989),tuned to the maximum transmission of oceanic water and/or tothe maximum emission of bioluminescence, and in the cottoidspecies flock of Lake Baikal (Bowmaker et al., 1994; Hunt etal., 1996). Why is similar spectral tuning not apparent in thedifferent species of notothenioid fish and how is optimalsensitivity achieved further down the water column? Lightpenetrating through bare Arctic sea ice has a peaktransmittance at around 500·nm and substantially reducedintensity, and the effect of a snow covering will be to reduceintensity further but not to alter the spectral characteristics(Perovich et al., 1998). Transmission on through the clearwaters of the Antarctic (algal bloom is limited to the australsummer) would be expected to lead to a further attenuation ofintensity and shift in the wavelength of maximal penetrationtowards 480·nm. Under these restricted photic conditions, thenotothenioid rods with λmax at about 500·nm and the dominantdouble cones with λmax at 490·nm would appear to be tuned tothe available down-welling light (Morita et al., 1997). Also,most bioluminescence peaks in the same spectral region(Nicol, 1969; Herring, 1983). Increased sensitivity is achievedin the deeper-dwelling species such as D. mawsoni by anincrease in the proportion of rod photoreceptors and anincrease in the length of the outer segments (Meyer-Rochowand Klyne, 1982). This is a common mechanism in deep-seafish for photon capture in a dim light environment.Furthermore, the more shallow water species organise the conereceptors in a square mosaic to ensure optimal packing ofcones in the retina, since these fish presumably rely more onphotopic vision. Behavioural studies on both shallow and deepliving species may help to identify how the different retinalarrangements affect chromatic and overall light sensitivity.
M.A.P. was supported by a studentship from the NaturalEnvironment Research Council (NERC). C.-H.C.C.acknowledges NSF Office of Polar Programs for grantfunding OPP9909841 and OPP 0231006 in support of thiswork. The work was also partly funded by a grant from theLeverhulme Trust to J.K.B. and D.M.H. We thank ArthurDeVries, University of Illinois, for the collection of theAntarctic notothenioid species, Bev Dickson, PortobelloMarine Station, University of Otago, for collecting the NewZealand nototheniid specimens, and Linda Erskine, Instituteof Ophthalmology, UCL, for advice on the in situhybridisation protocol. We are grateful to Rosalie Crouch,Medical University of South Carolina, for the gift of 11-cis-retinal.
ReferencesAvery, J. A., Bowmaker, J. K., Djamgoz, M. B. A. and Downing, J. E. G.
(1983). Ultraviolet receptors in a freshwater fish. J. Physiol. 334, 23P.
Bowmaker, J. K. (1995). The visual pigments of fish. Prog. Retinal Eye Res.15, 1-31.
Bowmaker, J. K. and Kunz, Y. W. (1987). Ultraviolet receptors,tetrachromatic colour vision and retinal mosaics in the brown trout (Salmotrutta): age-dependent changes. Vision Res. 27, 2101-2108.
Bowmaker, J. K., Astell, S., Hunt, D. M. and Mollon, J. D. (1991a).Photosensitive and photostable pigments in the retinae of Old Worldmonkeys. J. Exp. Biol. 156, 1-19.
Bowmaker, J. K., Thorpe, A. and Douglas, R. H. (1991b). Ultraviolet-sensitive cones in the goldfish. Vision Res. 31, 349-352.
Bowmaker, J. K., Govardovskii, V. I., Shukolyukov, S. A., Zueva, L. V.,Hunt, D. M., Sideleva, V. G. and Smirnova, O. G. (1994). Visualpigments and the photic environment: the cottoid fish of Lake Baikal. VisionRes. 34, 591-605.
Cheng, C.-H. C. (1998). Evolution of the diverse antifreeze proteins. Curr.Opin. Genet. Dev. 8, 715-720.
Chinen, A., Matsumoto, Y. and Kawamura, S. (2005). Reconstitution ofAncestral Green Visual Pigments of Zebrafish and Molecular Mechanismof their Spectral Differentiation. Mol. Biol. Evol. 22, 1001-1010.
Chomczynski, P. and Sacchi, N. (1987). Single-step method of RNAisolation by acid guanidinium thiocyanate-phenol-chloroform extraction.Anal. Biochem. 162, 156-159.
Cowing, J. A., Poopalasundaram, S., Wilkie, S. E., Robinson, P. R.,Bowmaker, J. K. and Hunt, D. M. (2002). The molecular mechanism forthe spectral shifts between vertebrate ultraviolet- and violet-sensitive conevisual pigments. Biochem. J. 367, 129-135.
DeVries, A. L., Komatsu, S. K. and Feeney, R. E. (1970). Chemical andphysical properties of freezing point-depressing glycoproteins fromAntarctic fishes. J. Biol. Chem. 245, 2901-2908.
DeVries, A. L., Vandenheede, J. and Feeney, R. E. (1971). Primarystructure of freezing point-depressing glycoproteins. J. Biol. Chem. 246,305-308.
Dominguez, O. and Lopez-Larrea, C. (1994). Gene walking byunpredictably primed PCR. Nucl. Acids Res. 22, 3247-3248.
Douglas, R. H. and Partridge, J. C. (1997). On the visual pigments of deep-sea fish. J. Fish Biol. 50, 68-85.
Douglas, R. H., Hunt, D. M. and Bowmaker, J. K. (2003). SpectralSensitivity Tuning in the Deep-Sea. In Sensory Processing in AquaticEnvironments (ed. S. P. Collin and N. J. Marshall). New York: Springer-Verlag.
Eastman, J. T. (2005). Nature of the diversity of Antarctic fishes. Polar Biol.28, 93-107.
Eastman, J. T. and Lannoo, M. J. (2003). Diversification of brain and senseorgan morphology in Antarctic dragonfishes (Perciformes: Notothenioidei:Bathydraconidae). J. Morphol. 258, 130-150.
Fasick, J. I., Applebury, M. L. and Oprian, D. D. (2002). Spectral tuningin the mammalian short-wavelength sensitive cone pigments. Biochemistry41, 6860-6865.
Fletcher, G. L., Hew, C. L. and Davies, P. L. (2001). Antifreeze proteins ofteleost fishes. Ann. Rev. Physiol. 63, 359-390.
Franke, R. R., Sakmar, T. P., Oprian, D. D. and Khorana, H. G. (1988).A single amino acid substitution in rhodopsin (lysine 248––leucine)prevents activation of transducin. J. Biol. Chem. 263, 2119-2122.
Gon, O. and Heemestra, P. C. (1990). Fishes of Southern Ocean (ed. O. Gonand P. C. Heemestra). Grahamstown, South Africa: JLB Smith Institute ofIcthyology.
Govardovskii, V. I., Fyhrquist, N., Reuter, T., Kuzmin, D. G. and Donner,K. (2000). In search of the visual pigment template. Vis. Neurosci. 17, 509-528.
Hárosi, F. I. and Hashimoto, Y. (1983). Ultraviolet visual pigment in avertebrate: a tetrachromatic cone system in the dace. Science 222, 1021-1023.
Herring, P. J. (1983). The spectral characteristics of luminous marineorganisms. Proc. R. Soc. Lond. B 220, 183-217.
Higgins, D. G., Thompson, J. D. and Gibson, T. J. (1996). Using CLUSTALfor multiple sequence alignments. Methods Enzymol. 266, 383-402.
Hisatomi, O., Satoh, T., Barthel, L. K., Stenkamp, D. L., Raymond, P. A.and Tokunaga, F. (1996). Molecular cloning and characterization of theputative ultraviolet-sensitive visual pigment of goldfish. Vision Res. 36, 933-939.
Hisatomi, O., Satoh, T. and Tokunaga, F. (1997). The primary structure anddistribution of killifish visual pigments. Vision Res. 37, 3089-3096.
Hunt, D. M., Fitzgibbon, J., Slobodyanyuk, S. J. and Bowmaker, J. K.(1996). Spectral tuning and molecular evolution of rod visual pigments
THE JOURNAL OF EXPERIMENTAL BIOLOGY

2376
in the species flock of cottoid fish in Lake Baikal. Vision Res. 36, 1217-1224.
Hunt, D. M., Dulai, K. S., Partridge, J. C., Cottrill, P. and Bowmaker, J.K. (2001). The molecular basis for spectral tuning of rod visual pigmentsin deep-sea fish. J. Exp. Biol. 204, 3333-3344.
Hunt, D. M., Cowing, J. A., Wilkie, S. E., Parry, J., Poopalasundaram, S.and Bowmaker, J. K. (2004). Divergent mechanisms for the tuning ofshortwave sensitive visual pigments in vertebrates. Photochem. Photobiol.Sci. 3, 713-720.
Imai, H., Kojima, D., Oura, T., Tachibanaki, S., Terakita, A. andShichida, Y. (1997). Single amino acid residue as a functionaldeterminant of rod and cone visual pigments. Proc. Natl. Acad. Sci. USA94, 2322-2326.
Jerlov, N. G. (1976). Marine Optics. Amsterdam: Elsevier Scientific.Kiss, A. J., Mirarefi, A. Y., Ramakrishnan, S., Zukoski, C. F., Devries, A.
L. and Cheng, C.-H. C. (2004). Cold-stable eye lens crystallins of theAntarctic nototheniid toothfish Dissostichus mawsoni Norman. J. Exp. Biol.207, 4633-4649.
Kumar, S., Tamura, K., Jakobsen, I. B. and Nei, M. (2001). MEGA2:molecular evolutionary genetics analysis software. Bioinformatics 17, 1244-1245.
Levine, J. S. and MacNichol, E. F., Jr (1979). Visual pigments in teleostfishes: effects of habitat, microhabitat, and behavior on visual systemevolution. Sens. Processes 3, 95-131.
Littlepage, J. C. (1965). Oceanographic investigations in the McMurdoSound, Antactica. Biology of Antactic seas 2. Antarctic Res. 5, 1-37.
Loew, E. R. and Lythgoe, J. N. (1978). The ecology of cone pigments inteleost fishes. Vision Res. 18, 715-722.
Loew, E. R., Macfarland, W. N., Mills, E. and Hunter, D. (1993). Achromatic action spectrum for planktonic predation by juvenile yellowperch, Perca flavescens. Can. J. Zool. 71, 384-386.
Meyer-Rochow, V. B. and Klyne, M. A. (1982). Retinal organization of theeyes of three nototheniid fishes from the Ross Sea (Antarctica). GegenbaursMorphol. Jahrb. 128, 762-777.
Miyazaki, T., Iwami, T., Yamauchi, M. and Somiya, H. (2001). ‘Accessorycorner cones’ as putative UV-sensitive photoreceptors in the retinas of sevenadult nototheniid fishes. Polar Biol. 24, 628-632.
Miyazaki, T., Iwami, T., Somiya, H. and Meyer-Rochow, V. B. (2002).
Retinal topography of ganglion cells and putative UV-sensitive cones in twoAntarctic fishes: Pagothenia borchgrevinki and Trematomus bernacchii(Nototheniidae). Zoolog. Sci. 19, 1223-1229.
Molday, R. S. and MacKenzie, D. (1983). Monoclonal antibodies torhodopsin: characterization, cross-reactivity, and application as structuralprobes. Biochemistry 22, 653-660.
Morita, Y., Meyer-Rochow, V. B. and Uchida, K. (1997). Absolute andspectral sensitivities in dark- and light-adapted Pagothenia borchgrevinki,an Antarctic nototheniid fish. Physiol. Behav. 61, 159-163.
Nicol, J. A. C. (1969) Bioluminescence. In Fish Physiology (ed. W. S. Hoarand D. J. Randall), pp. 355-400, Vol. III. New York: Academic Press.
Pankhurst, N. W. and Montgomery, J. C. (1989). Visual function in fourAntarctic nototheniid fishes. J. Exp. Biol. 142, 311-324.
Parry, J. W., Poopalasundaram, S., Bowmaker, J. K. and Hunt, D.M. (2004). A novel amino acid substitution is responsible for spectraltuning in a rodent violet-sensitive visual pigment. Biochemistry 43, 8014-8020.
Partridge, J. C., Shand, J., Archer, S. N., Lythgoe, J. N. and vanGroningen-Luyben, W. A. (1989). Interspecific variation in the visualpigments of deep-sea fishes. J. Comp. Physiol. A 164, 513-529.
Perovich, D. K., Longacre, J., Barber, D. G., Maffione, R. A., Cota,G. F., Mobley, C. D., Gow, A. J., Onstott, R. G., Grenfell, T. C.,Pegau, W. S. et al. (1998). Field observations of the electromagneticproperties of first-year sea ice. IEEE Trans. Geosci. Remote Sens. 36,1705-1715.
Raymond, J. A. and DeVries, A. L. (1977). Adsorption inhibition as amechanism of freezing resistance in polar fishes. Proc. Natl. Acad. Sci. USA74, 2589-2593.
Saitou, N. and Nei, M. (1987). The neighbor-joining method: a new methodfor reconstructing phylogenetic trees. Mol. Biol. Evol. 4, 406-425.
Whitmore, A. V. and Bowmaker, J. K. (1989). Seasonal variation in conesensitivity and short-wave absorbing visual pigments in the rudd, Scardiniuserythrophthalmus. J. Comp. Physiol. A 166, 103-115.
Yokoyama, S. and Tada, T. (2000). Adaptive evolution of the African andIndonesian coelacanths to deep-sea environments. Gene 261, 35-42.
Yokoyama, S., Zhang, H., Radlwimmer, F. B. and Blow, N. S. (1999).Adaptive evolution of color vision of the Comoran coelacanth (Latimeriachalumnae). Proc. Natl. Acad. Sci. USA 96, 6279-6284.
M. A. Pointer and others
THE JOURNAL OF EXPERIMENTAL BIOLOGY