adaptation to sea level rise a regional approach in saco...
TRANSCRIPT

Adaptation to Sea Level
Rise – A Regional Approach
in Saco Bay, MEPeter Slovinsky, Marine Geologist
Maine Geological Survey, Department of
ConservationProject Funding from:
Project Partners:

Saco Bay – Hazards and Habitats
Saco River
Scarborough
River
Goosefare
Brook

Data Development, Outreach, Education, and Partnership Development
Coastal Hazard Resiliency Tools (CHRT) Project
State Agencies – Regional Planning Commission - Municipalities
Year 3 Rounding Up!

Framing the Problem
Sea Level is RISING, right?
By how much? What will the potential impacts
be? What can be done?

Portland Tide gauge = global ocean over last century 1.8 mm/yr (IPCC, 2007).
In Maine, this is the fastest in past 3000 years
Sea Level, Portland, Maine1912-2009
y = 0.0058x - 11.581
R2 = 0.7358
-0.600
-0.500
-0.400
-0.300
-0.200
-0.100
0.000
0.100
0.200
0.300
1910 1920 1930 1940 1950 1960 1970 1980 1990 2000 2010
Time (years)
Ele
va
tio
n (
ft,
MS
L)
P.A. Slovinsky, Maine Geological Survey, February 2, 2010
1.79 mm per yr or 0.6 ft (7.2") per century

Data courtesy of NOAA CO-OPS
2.1 mm/yr
(1947-2006)
2.0 mm/yr
(1929-2006)
1.8 mm/yr (1912-2009)
1.8 mm/yr (1926-2001)
Documented Sea Level Rise
Based on measurements, about 7-8”
(0.6-0.7 feet) of sea level rise has
occurred along the Maine coast.

IPCC 3rd Assessment (Tech. Summary of Working Group I Report, Fig. 24, p. 74., 2001 )

Satellite altimetry (1992-2010) = global sea level 3.2 + 0.4 mm/yr
Portland during same time period = 1.9 mm/yr http://sealevel.colorado.edu/

Hugo Ahlenius, United Nations Environment Programme, 2007
http://maps.grida.no/go/graphic/projected-sea-level-rise-for-the-21st-century
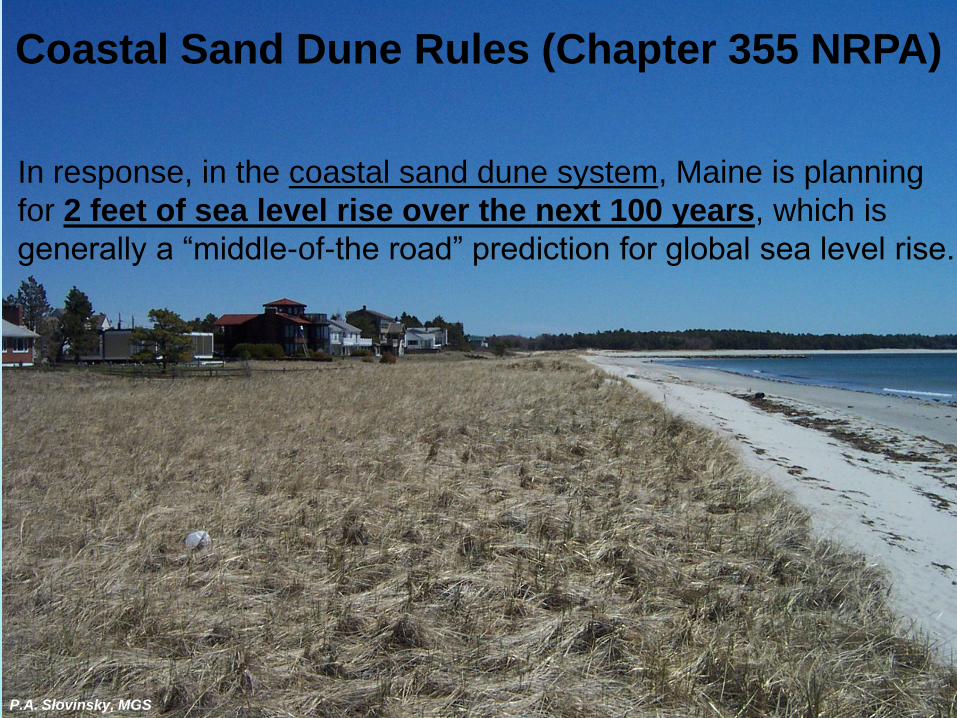
Coastal Sand Dune Rules (Chapter 355 NRPA)
In response, in the coastal sand dune system, Maine is planning
for 2 feet of sea level rise over the next 100 years, which is
generally a “middle-of-the road” prediction for global sea level rise.
P.A. Slovinsky, MGS

“Coastal wetlands” means all tidal and subtidal
lands; all areas with vegetation present that is
tolerant of salt water and occurs primarily in salt
water or estuarine habitat; and any swamp, marsh,
bog, beach, flat or other contiguous lowland that is
subject to tidal action during the highest tide level
for each year in which an activity is proposed as
identified in tide tables published by the National
Ocean Service. Coastal wetlands may include
portions of coastal sand dunes.
Coastal wetlands
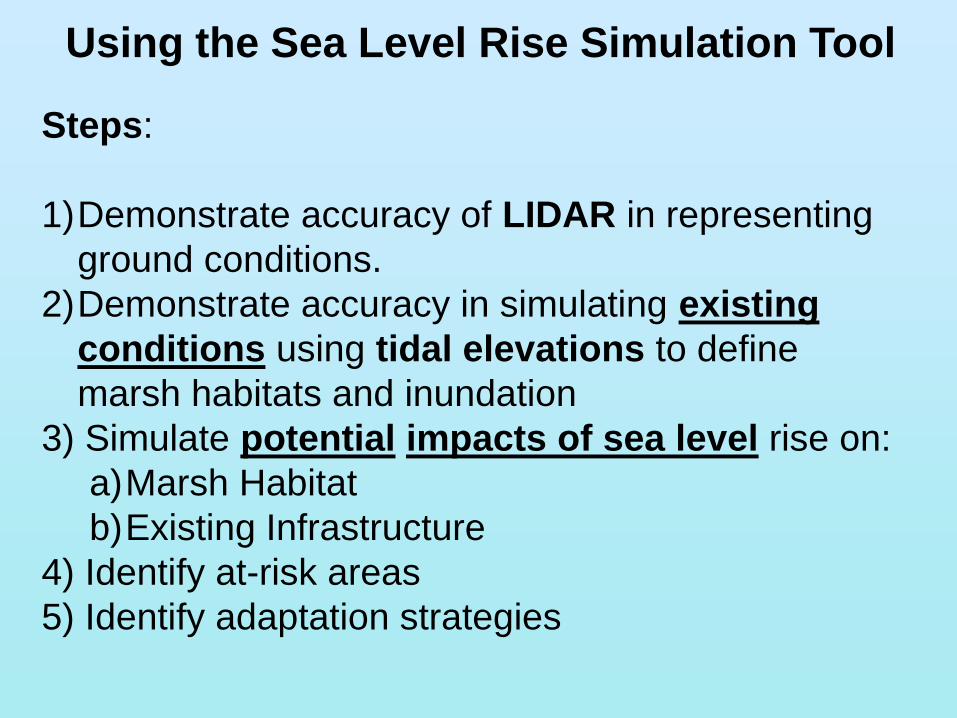
Using the Sea Level Rise Simulation Tool
Steps:
1)Demonstrate accuracy of LIDAR in representing
ground conditions.
2)Demonstrate accuracy in simulating existing
conditions using tidal elevations to define
marsh habitats and inundation
3) Simulate potential impacts of sea level rise on:
a)Marsh Habitat
b)Existing Infrastructure
4) Identify at-risk areas
5) Identify adaptation strategies

Assumptions:
Open Water generally exists below mean sea level.
Low Marsh generally exists from mean sea level to mean high
water.
High Marsh generally exists from mean high water to highest
annual tide.
Data is limited to where we have LIDAR data coverage.
Represent Marsh Boundaries
Using Tidal Elevations

Marsh Habitats
Scarborough River, Scarborough
Saco Bay

“Groundtruthing”

Identify marsh boundaries

Overlay LIDAR
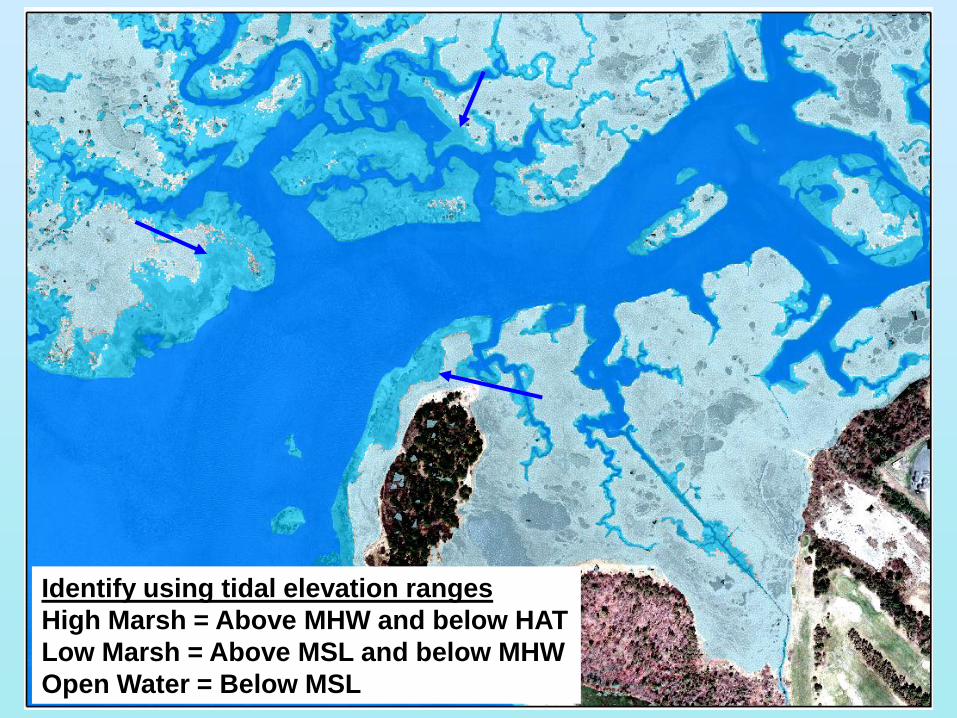
Identify using tidal elevation ranges
High Marsh = Above MHW and below HAT
Low Marsh = Above MSL and below MHW
Open Water = Below MSL
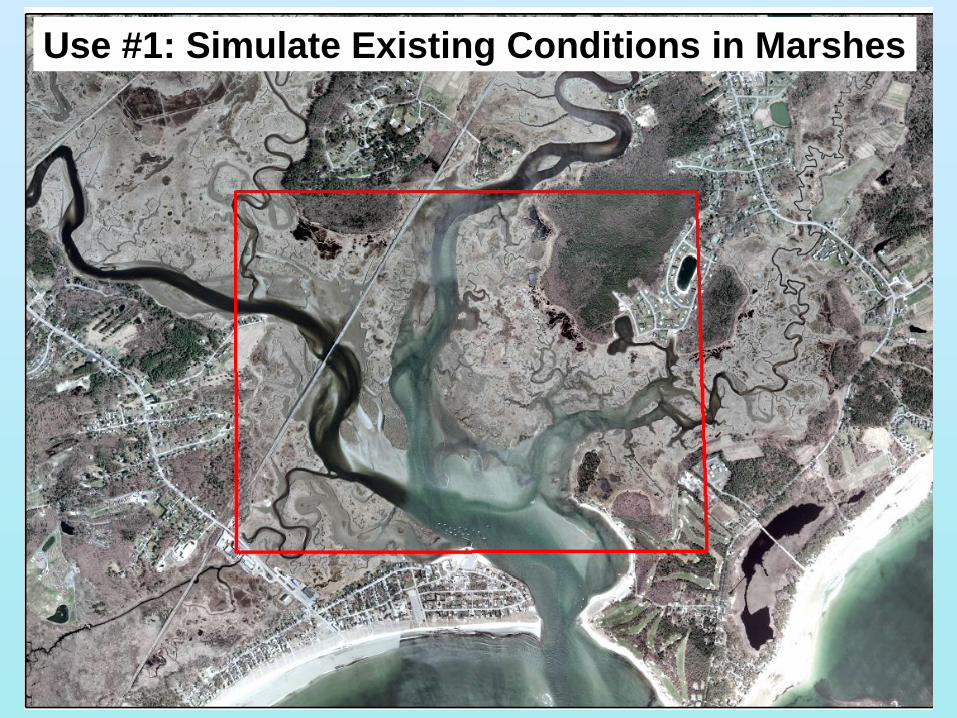
Use #1: Simulate Existing Conditions in Marshes

Open water (<MSL)
Low Marsh (MSL – MHW)
High Marsh (MHW-HAT)

Use #2: Simulate Potential Future Marsh Conditions
Use #3: Identify low-lying uplands for marsh
transgression

Flooding and Inundation
Ocean Park, Old Orchard Beach
Simulation of Existing Conditions

Use #4: Simulate Existing Inundation
92.8 acres

Use #5: Simulate Inundation under Future Conditions
169.2 acres (83% increase)
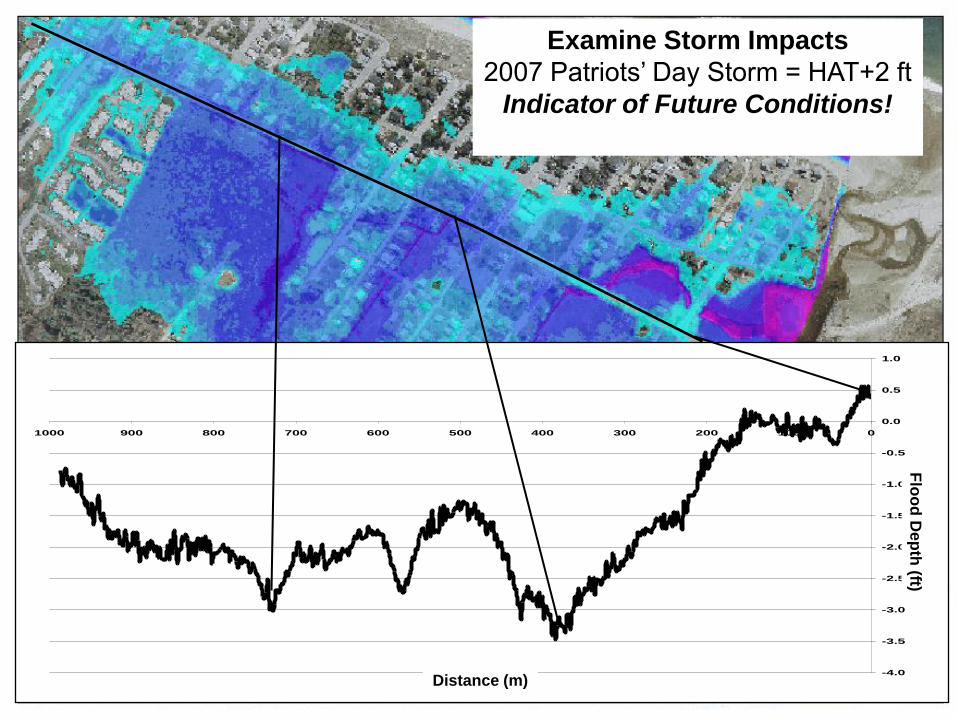
Flood Depths (ft)
HAT + 2 ft SL rise
depth, ft
-8 - -7
-7 - -6
-6 - -5
-5 - -4
-4 - -3
-3 - -2
-2 - -1
-1 - 0
Examine Storm Impacts
2007 Patriots’ Day Storm = HAT+2 ft
Indicator of Future Conditions!
-4.0
-3.5
-3.0
-2.5
-2.0
-1.5
-1.0
-0.5
0.0
0.5
1.0
01002003004005006007008009001000
Distance
Floo
d de
pth
(ft)
Flo
od
De
pth
(ft)
Distance (m)

2007
2007 Patriots’ Day Storm
HAT+2 = Pats’ Day Flooding
Memorial Library
Temple St.

Temple St.
2-3 feet flooding
Memorial Library
2-3 feet flooding
Images courtesy of Bill Edwards, www.mainecoastimages.com and NOAA NWS

Memorial Library
Temple St.
2007
2007 Patriots’ Day Storm
HAT+2 = Pats’ Day Flooding
Memorial Library

Memorial Library
Use #7: Simulate potential future storm
impacts
2007 Patriots’ Day Storm
Plus 2 feet of Sea level Rise

Show Visualization Techniques (CanVis2.3)
Memorial Library

Simulation of Mapped Flood Conditions
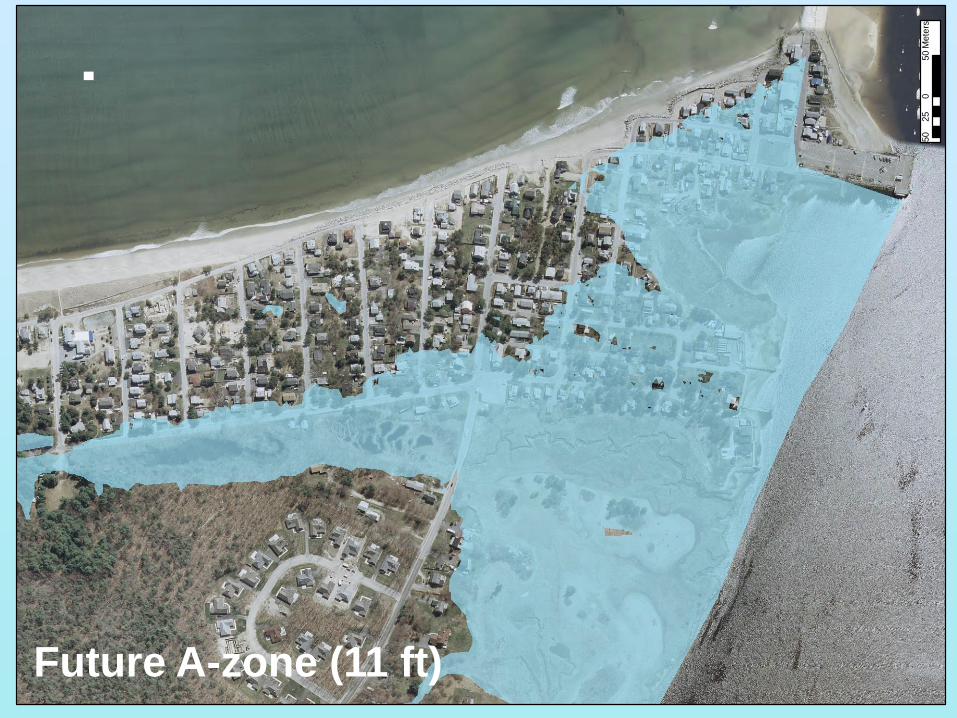
Use #8: Simulate impacts to FEMA
FIRM static floodplains

.
50
050
25
Mete
rs
Existing A-zone (9 ft)
.
50
050
25
Mete
rs
Future A-zone (11 ft)

Use #9: Simulate impacts
on volumetric increases at culverts
Route 1, Scarborough, ME

Culvert

Almost a 3x increase!

Some Potential Regional
Adaptation Techniques

Open Space Designation/Acquisition
“Future” Flood or Wetland Areas
P.A. Slovinsky, MGS
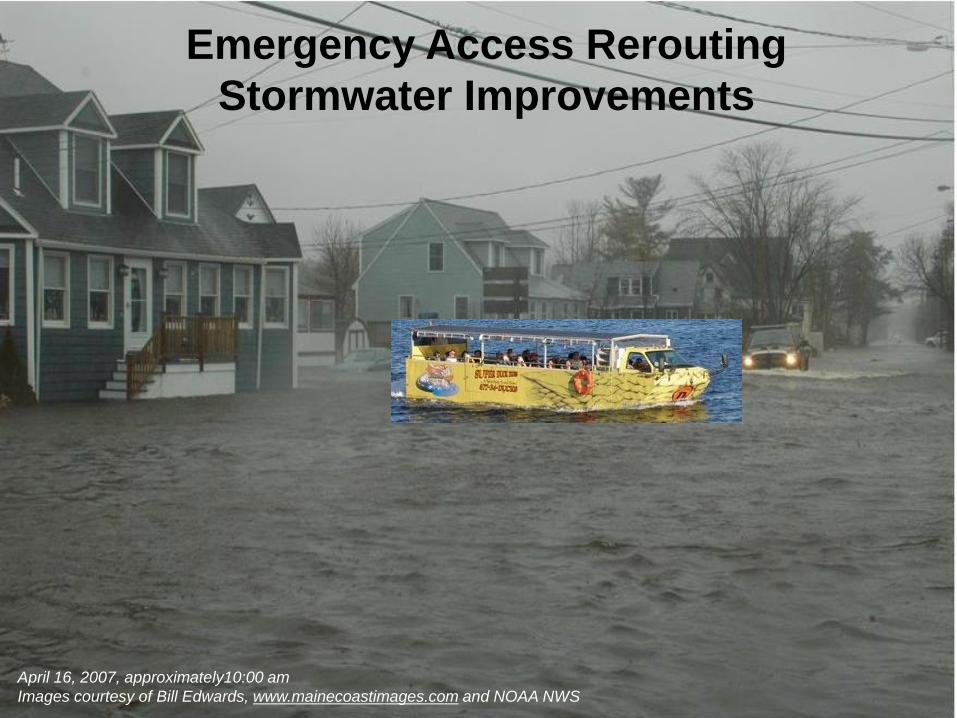
April 16, 2007, approximately10:00 am
Images courtesy of Bill Edwards, www.mainecoastimages.com and NOAA NWS
Emergency Access Rerouting
Stormwater Improvements

Tidal Flow Control…elevation, sizing
New locations?
P.A. Slovinsky, MGS

Elevation and sitingP.A. Slovinsky, MGS

Sea Level Rise as
Future requirement?
P.A. Slovinsky, MGS
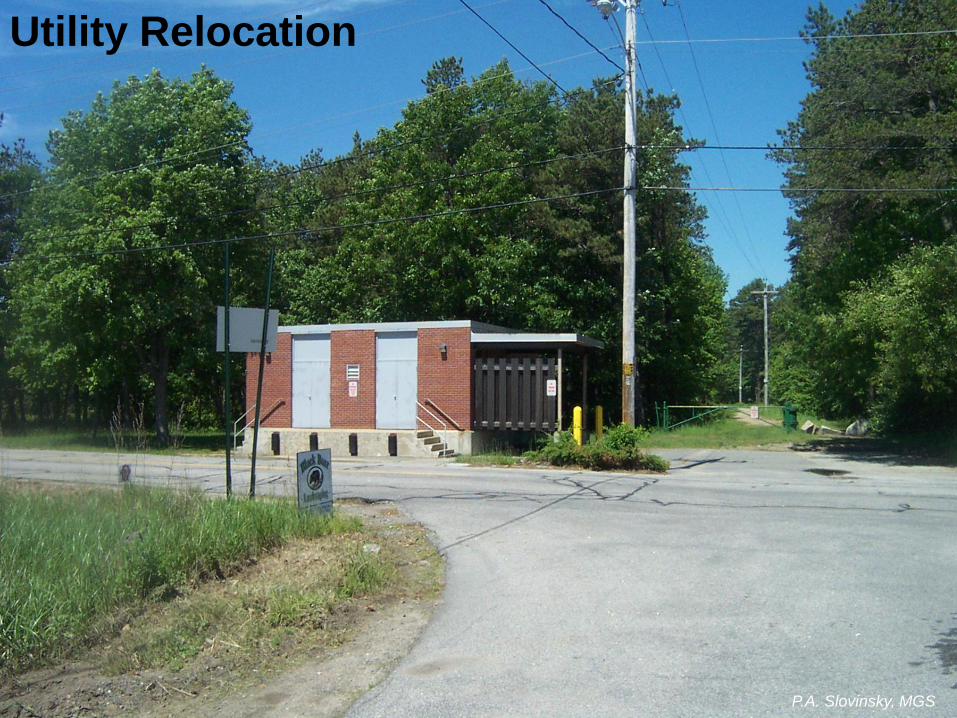
Utility Relocation
P.A. Slovinsky, MGS
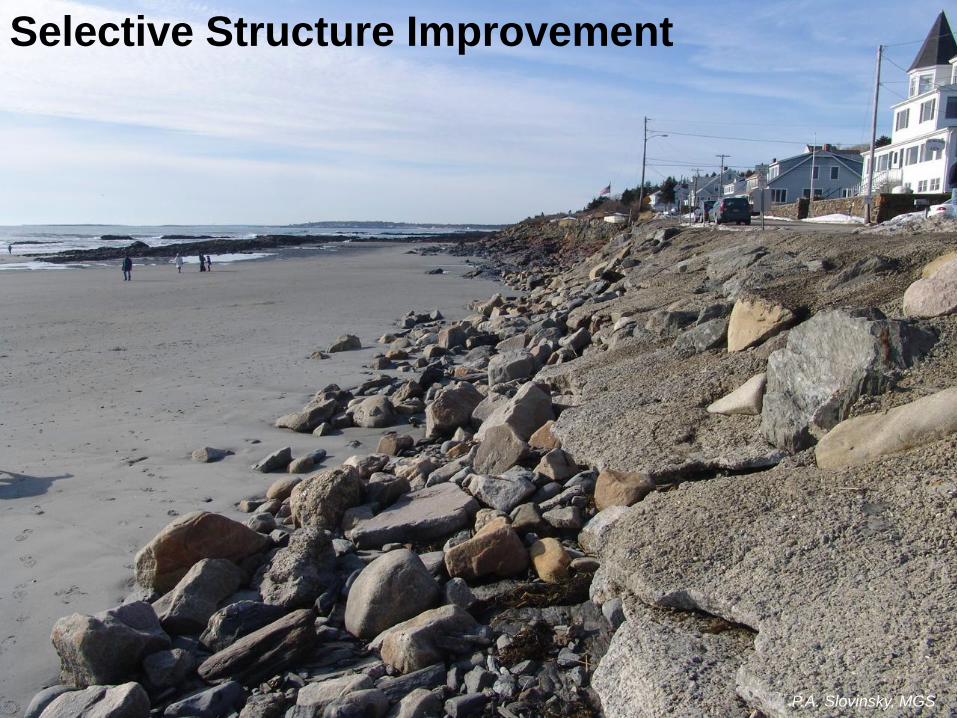
Selective Structure Improvement
P.A. Slovinsky, MGS

Regional Sediment
Management
Beach nourishment
Dune restoration/creation
• RSM Within the
Region (inter)
2 federal projects
• Northerly drift
• RSM within the
community (intra)

Developing a Regional Approach…SLAWG
Hazards do not follow
geopolitical boundaries!