adaptation to climate change and reducing natural disaster ... fileassoc. prof. dr. koji asai...
TRANSCRIPT
Adaptation to Climate Change and Reducing Natural Disaster Risk: A Study on Country Practices and Lesson between Malaysia and Japan
[FINAL RESEARCH REPORT]
JUNE – OCTOBER 2011 VISITING RESEARCHER OF FY2011A ASIAN DISASTER REDUCTION CENTER (ADRC)
Surina Binti Othman Meteorological Officer, Malaysian Meteorological Department (METMalaysia)
Ministry of Science, Technology and Innovation (MOSTI), MALAYSIA

Disclaimer This report was compiled by an ADRC visiting researcher (VR) from ADRC member countries. The views expressed in the report do not necessarily reflect the views of the ADRC. The boundaries and names shown and the designations used on the maps in the report also do not imply official endorsement or acceptance by the ADRC.
2
Objectives
1. As a preliminary study on Climate Change Adaptation (CCA) related to Disaster Risk Reduction (DRR) and their applications to developed country like Japan and the developing country such Malaysia.
2. To study on Japan’s approach in term of climate change policies and adaptation measures as comparison and reference to Malaysia in enhance the measures.
3. To study recent research project and activities are being done/undertaken by Japan to support the
development of adaptation strategies in regions.
4. To study on Legal Framework & National Climate Change Policy in Japan as comparison to Malaysia Policy – ‘National Climate Change Policy of Malaysia’
5. To look at the roles of Government Organizations and NGOs involvement in CCA’s planning in
Japan and Malaysia.

3
Acknowledgements First and foremost, I would like to express my sincere gratitude and lots of thanks to Ms. Miki Kodama – Senior Researcher of Asian Disaster Reduction Center (ADRC) as our main supervisor for the whole of the Visiting Researcher Program of FY2011A (June – October 2011), that had fully conducted to this program until it has been successfully organized. She had done a best hospitality during our memorable stay in Japan and fully involved in our research activities during the program. Specially dedicated to my mentor, Ms. Yumi Shiomi – Researcher of ADRC for the fruitful advise and guidance in order to help me for my research studies and realization of this final research report. Priceless appreciation and gratitude to all the lecturers for the commitment to share the knowledge and experience to me in the context of climate change issues; Prof. Dr. Manabu D. Yamanaka (JAMSTEC), Assoc. Prof. Dr. Koji Asai (Yamaguchi University), Mr. Enomoto Hiroshi – Deputy Director of Office for Climate Change (JICA Tokyo) and Mr. Koichi Kawada, Planning Department of Kobe Observation Office (JMA). Big thanks and warm regards to the members of Asian Disaster Reduction Center (ADRC) – Mr. Atsushi Koresawa (Executive Director of ADRC), Mr. Masaru Arakida, Mr. Tetsuo Ibaraki, Ms. Nakamura, Mr. Takahiro Ono, Mr. Makato Ikeda, Mr. Sugiura, Ms. Chinoi (ADRC, Tokyo), Mr. Kozo Arakawa (Admin Manager), Ms. Tae Watanabe (Admin), Ms. Junko Fujinaka (Admin), Ms. Katsura Kawaguchi (Admin), Mr. Masa (IT engineer) and other staff members, also the staff from JICA, IRP, IGES, UNISDR etc., in order to give a good cooperation, best friendship and share cherish moments together from beginning until to the end of the program. An appreciation and best regards to our Japanese Sensei – Mr. Shoji Kawahara, as being a good Nihongo’s teacher that always passionate to teach us the Japanese’s language, culture, foods and others as an important knowledge to us to clearly understand while living in Japan. Thank you to my God, Allah SWT the Almighty for His blessed to my guts until completely finished the course in smooth way and successfully produced this research report of the VR’s Program. Mostly dedicated to my beloved parents and friends that always gave me fully support, pray and motivation during my study and stayed in this wonderful and nice country - Japan for almost 4 months. To my VR colleagues, Ms. Anna-lisa Dumaguing Orallo (Philippines), Mr. Sisira Wanninayake (Sri Lanka) and Mr. Emin Nazarov (Azerbajian) – the VR’s members, that be my best buddies whenever in happy or in hard time during our stay in Japan. Last but not least, for the Government of Japan and Malaysian Government itself, thank you for this opportunity to me in order to learn new knowledge and gained priceless experience, for all the support they have given. Hopefully, I can give a best contribution regarding the disaster risk management, share the Japan’s lesson related to climate change adaptation in a way to reduce the disaster risk and finally could proposed to my department and country as a brief reference through the Japan’s view points as developed country.
4
Table of Contents
Chapter
Topic Page
Acknowledgements 1.0 Introduction 6
1.1 Terms of Climate and Climate Change Definition 6 1.2 Effect of Climate Change 8 1.3 Understanding Climate Change Adaptation (CCA) and Relation to
Disaster Risk Reduction (DRR) 10
1.3.1 What is Climate Change Adaptation (CCA) 10 1.3.2 Definition of Disaster Risk Reduction (DRR) 12 1.3.3 Linkages between Climate Change Adaptation and
Disaster Risk Reduction 12
2.0 Climate Change and Its Impact in Japan 14 2.1 Japan’s Climate 14 2.2 Japan’s Situation Impact of Changing Climate 15 2.2.1 Temperature Rises 18 2.2.2 Changing in Precipitation Patterns 19 2.2.3 Increasing of Tropical Cyclones 21 2.2.4 Changes in Sea Level 22 2.2.5 Ocean Acidification 23
3.0 Climate Change Plan, Practices and Initiative with Comprehensive Disaster Management Measures in Japan
25
3.1 Legal Policy and Framework of Climate Change in Japan 25 3.1.1 Background and Significance of the Revised Kyoto
Protocol Target Achievement Plan 25
3.2 Japan’s Global Warming Countermeasures by National Level to Community Peoples
25
3.2.1 Low Carbon Society in Japan 27 3.2.2 Nippon Keidanren Voluntary Action Plan for Industrial
Community 29
3.2.3 Initiatives by the National Government of Japan 29 3.2.4 Initiatives by NGOs and Community Levels in Japan 31 3.3 Recent Adaptation Measures by Ministry of Environment of Japan
(MOEJ) 31
3.4 Recent Adaptation Measures by Ministry of Land, Infrastructure, Transport and Tourism (MLIT)
34
3.5 Recent Activities/Project Related to Adaptation Measures by JMA, JICA and JAMSTEC
36
3.5.1 Meteorological Operation by Japan Meteorological Department (JMA)
36
3.5.2 Capacity Building by Japan International Cooperation Agency (JICA)
40
3.5.2(i) Low Carbon and Climate Resilient Development Cooperation
41
3.5.2(ii) JICA’s Technical Cooperation, Loan Aid and Grant Aid
42
3.5.2(iii) Policy Based Assistance for Climate Change Policy in Developing Countries
43
3.5.3 Research Development by Japan Agency for Marine – Earth Science and Technology (JAMSTEC)
3.5.3(i) Promotion at MCCOE by a Japan-Indonesia Collaboration Project
44
45
4.0 Malaysia as Developing Country faced the Climate Change 48

5
4.1 Malaysia’s Climate 48 4.1.1 Temperature Analysis by Malaysian Meteorological
Department (METMalaysia) 48
4.1.2 Rainfall Analysis by Malaysian Meteorological Department (METMalaysia)
51
4.2 Changing Climate of Malaysia and the Vulnerability 53 4.3 Malaysian Approach of Climate Change Adaptation in Reducing the Risk
of Impact 56
4.3.1 Policy Framework and Research Publications by Government of Malaysia
56
4.3.2 Research Activities Related to Natural Disaster Impact: Malaysian Meteorological Department (METMalaysia)
59
4.3.3 Research Plan Related to Water-Resource Impact: National Hydraulic Research Institute of Malaysia (NAHRIM)
61
4.3.4 Flood Mitigation Projects by Department of Irrigation and Drainage (DID), Malaysia 4.3.4 (i) Atmospheric Model-Based Rainfall & Flood Forecasting
System (AMRFF) 4.3.4 (ii) Flood Forecasting and Warning (Operation)
62
62
63 4.3.5 Case Study of Iskandar Malaysia as Sustainable Eco
Planning City: University Technology of Malaysia, Johor 64
5.0 Recommendation and Future Plan 66 6.0 Conclusions 68
References 69

6
1.0 Introduction The world is facing an increasing frequency and intensity of disasters – natural and man-made – that have had devastating impacts. As reported by the secretariat of the UN International Strategy for Disaster Reduction (UNISDR), the last 10 years have seen 478,100 people killed, more than 2.5 billion people affected and about US$ 690 billion in economic losses due to disasters. Disasters triggered by hydro-meteorological hazards amounted for 97 percent of the total people affected by disasters, and 60 percent of the total economic losses. The tragedy is that many of the losses due to such disasters could have been reduced with proper risk management. Recent year, climate change that accompany anthropogenic global warming (hereinafter referred to as the “climate change”) are a serious issue as they are predicted to cause serious and large adverse impacts, including those that may also shake the foundation of people’s life, as well as those on ecosystems, water resources, foods, coastal and low-land areas, industries, and human health. In coastal and low-land areas, both the frequencies and scales of floods, sediment disasters and storm surges are predicted to increase due to sea level rise, increased frequencies of heavy precipitation events and frequent attack of strong typhoons. Serious droughts are also likely to increase due to enlarged degree of fluctuation in precipitation. Related to this issue, the Intergovernmental Panel on Climate Change (IPCC) was formed by the World Meteorological Organization (WMO) and the United Nations Environment Programme (UNEP) in 1988 in order to help people understand how the earth’s climate system works and share the knowledge about the climate change itself. In addition, the IPCC had published its 4th report to suggests that nations should take adaptation measures since global warming mitigation measures has limitation and global warming impacts would continue over centuries even when mitigation measures are taken. Thus, this final research report will preliminary studied on the climate change phenomena occurring in developed country like Japan and Malaysia as developing country to face the vulnerabilities and impacts. The study between both countries will cover on how to adapt the climate change in a way to reducing the natural disaster risk which is focusing on Japan’s practices and adaptation measures. 1.1. Terms of Climate and Climate Change Definition “Climate” is a term denoting the state derived by averaging the state of the atmosphere, oceans, and others over a sufficiently long period of time. The average over a sufficiently long period of time usually means a 30-year average (the average from 1971 to 2000 at present) based on a statistical methodology adopted in the World Meteorological Organization (WMO). Whereas, “Climate variability” means variations from the average climate or other statistics (standard deviations, frequency of extreme values, etc.) on all temporal and spatial scales larger than individual weather events. It includes short-term variations on temporal scales of seasonal, inter annual, and longer. Examples are variations of extreme events such as heat waves, droughts, heavy precipitation, tropical cyclones (typhoons, hurricanes) as well as El Niño and La Niña phenomena. On the other hand, “climate change” refers to a long-term changing trend of climate. It means clearly noticeable changes in the average state of climate over a period of at least several decades, captured by such recognition of weather as warmer as or drier than before, or of duration of sunshine as longer or shorter than before. In addition, this term is usually used for all the observed changes as appears in the IPCC documents regardless of their cause, be it natural or anthropogenic. But, in the UNFCCC documents, this term is used under definition only to mean climate change induced by anthropogenic causes.

7
Climate change can be considered from two (2) different aspects of the climate system: responses to external forcing and internal natural variability. The climate system is a system that forms and changes the climate through the dynamic interaction of the atmosphere, oceans, and land surface. The actual climate change is caused by a combination of responses to various external forcing and natural variability. Therefore, to understand the climate change that occurred in the past, it is necessary to separate variability into those two (2) types and examine them individually. Based on this approach, variations of global average temperatures in the 20th century were analyzed using climate models, the results of which are shown in Fig. 1.1(a) and Fig. 1.1 (b) as comparison between the diagrams:
Source: IPCC 2007 WG1 – AR4
Fig. 1.1(a)Comparison of observed and global-scale changes in surface temperature with results simulated by climate models using only natural or both natural and anthropogenic forcings. Decadal averages of observations are shown for the period 1906-2005 (black line) plotted against the centre of the decade and relative to the corresponding average for the 1901-1950. Blue shaded bands show the 5 to 95% range for 19 simulations from five climate models using only the natural forcings due to solar activity and volcanoes. Red shaded bands show the 5 to 95% range for 58 simulations from 14 climate models using both natural and anthropogenic forcings.
Source: IPCC 2007 WG1 – AR4
Fig. 1.1 (b) Various regions of the world all show warming trends over the past 100 years. These graphs compare the observed changes in temperature (black lines) with model results that include only natural climate forcings like volcanic eruptions and changes in solar energy (blue) and model results that use both natural and human caused climate forcings (pink).
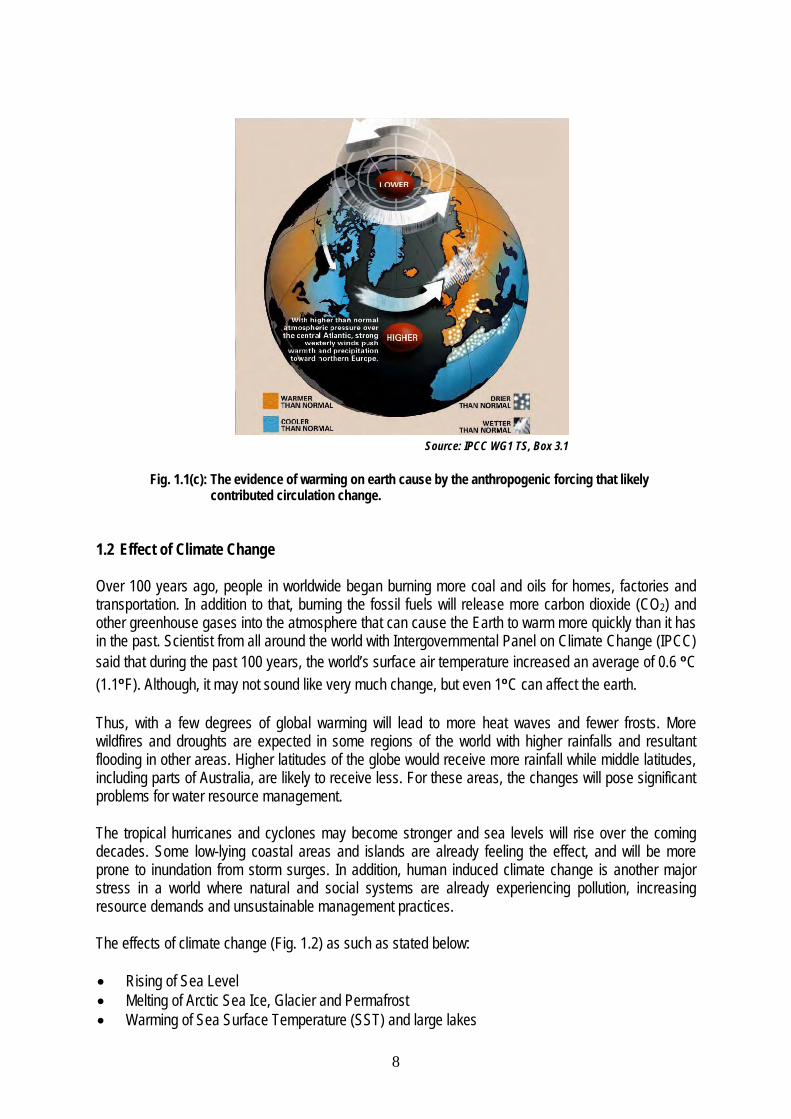
Whereas based on the IPCC Working Group 1, they reported about the evidence of warming on earth that cause by the anthropogenic forcing that likely contributed circulation change as shown in Fig. 1.1(c).
8
Source: IPCC WG1 TS, Box 3.1
Fig. 1.1(c): The evidence of warming on earth cause by the anthropogenic forcing that likely
contributed circulation change. 1.2 Effect of Climate Change
Over 100 years ago, people in worldwide began burning more coal and oils for homes, factories and transportation. In addition to that, burning the fossil fuels will release more carbon dioxide (CO2) and other greenhouse gases into the atmosphere that can cause the Earth to warm more quickly than it has in the past. Scientist from all around the world with Intergovernmental Panel on Climate Change (IPCC) said that during the past 100 years, the world’s surface air temperature increased an average of 0.6 ºC (1.1ºF). Although, it may not sound like very much change, but even 1ºC can affect the earth.
Thus, with a few degrees of global warming will lead to more heat waves and fewer frosts. More wildfires and droughts are expected in some regions of the world with higher rainfalls and resultant flooding in other areas. Higher latitudes of the globe would receive more rainfall while middle latitudes, including parts of Australia, are likely to receive less. For these areas, the changes will pose significant problems for water resource management.
The tropical hurricanes and cyclones may become stronger and sea levels will rise over the coming decades. Some low-lying coastal areas and islands are already feeling the effect, and will be more prone to inundation from storm surges. In addition, human induced climate change is another major stress in a world where natural and social systems are already experiencing pollution, increasing resource demands and unsustainable management practices.
The effects of climate change (Fig. 1.2) as such as stated below: Rising of Sea Level Melting of Arctic Sea Ice, Glacier and Permafrost Warming of Sea Surface Temperature (SST) and large lakes

9
Heavier Rainfall caused Flooding in many regions. Increasing of Extreme Drought Withering of Crops affected the grain production, impact to food shortage Changing in Ecosystem Hurricanes have changed in Frequency and Strength characteristics More Frequent Heat Waves Health Hazard such, diarrheal illness, increasing of cholera bacteria and etc. More Acidic condition in Seawater Changing in Ecosystem, vulnerable species tend to die like coral reefs and polar animals.
Source: by John E Hay, Lead Author of IPCC
Fig. 1.2: Example of Present Impacts; Melting Ice Sheets, Heat waves and Intense Windstorms

10
1.3 Understanding Climate Change Adaptation (CCA) and relation to Disaster Risk Reduction (DRR)
In many years around the world, many extreme weathers were occurred such in 2008 and 2007, the massive cyclones struck Myanmar and Bangladesh; a hurricane struck the United States in 2005 that causing 1,700 people to lose their lives and others. While it is difficult to conclude the extent to which global warming has contributed to these extreme weather events, it has been scientifically predicted that if global warming continues, these types of extreme weather events will increase. Nowadays, issues of climate change are not just discussed in relation to the United Nations Framework Convention on Climate Change but they are discussed in various contexts, such as water resources, food, security and biodiversity. 1.3.1 What is Climate Change Adaptation (CCA) Climate Change Adaptation (CCA) is requires in a way to integrated long term planning, comprehensive risk management, and good natural resources governance and management. For long term adaptation programs to work, they need to be designed to deal not only with the anticipated problems but also with those that societies and communities are presently facing. This is not difficult to do for climate change because the anticipated impacts are already being manifested, with previews of what could be the norm in terms of climate events in the future. An ‘adaptation to climate change’ can be classified into several definitions - such as, bear losses, share losses, modify the threat (include increased irrigation water in agricultural activity and flood control works such as dams, dikes, and levees), prevent effects, change in use (a farmer may choose to substitute a more drought tolerant crop), change of location, research, encourage behavioral change through education, information and regulation. Thus, the CCA strategies aim to reduce vulnerability to expected impacts of climate change. According to research work by JICA in the Final Report of JICA – FIT (Adaptation) – Finance Impact Tool for Adaptation by June 2011, Table 1.3.1 below shown the overarching points on adaptation in developing countries like Malaysia that can be refers to:
11
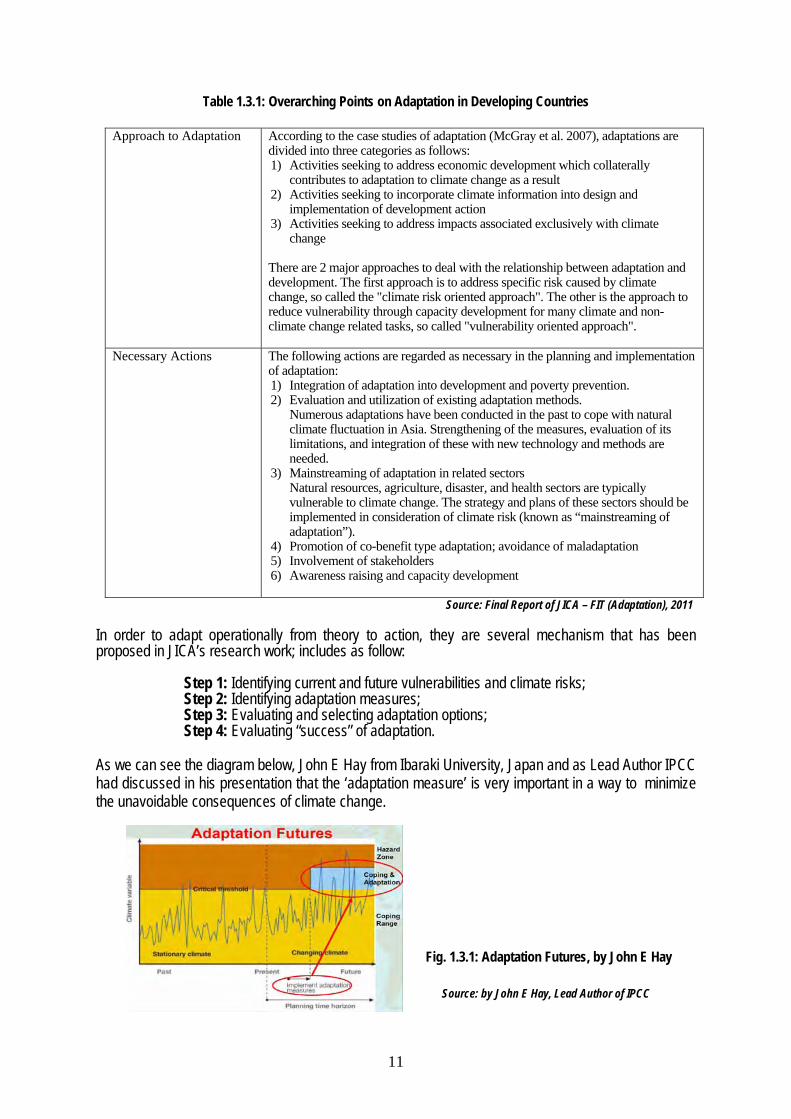
Table 1.3.1: Overarching Points on Adaptation in Developing Countries
Approach to Adaptation According to the case studies of adaptation (McGray et al. 2007), adaptations are divided into three categories as follows: 1) Activities seeking to address economic development which collaterally
contributes to adaptation to climate change as a result 2) Activities seeking to incorporate climate information into design and
implementation of development action 3) Activities seeking to address impacts associated exclusively with climate
change There are 2 major approaches to deal with the relationship between adaptation and development. The first approach is to address specific risk caused by climate change, so called the "climate risk oriented approach". The other is the approach to reduce vulnerability through capacity development for many climate and non-climate change related tasks, so called "vulnerability oriented approach".
Necessary Actions The following actions are regarded as necessary in the planning and implementation of adaptation: 1) Integration of adaptation into development and poverty prevention. 2) Evaluation and utilization of existing adaptation methods.
Numerous adaptations have been conducted in the past to cope with natural climate fluctuation in Asia. Strengthening of the measures, evaluation of its limitations, and integration of these with new technology and methods are needed.
3) Mainstreaming of adaptation in related sectors Natural resources, agriculture, disaster, and health sectors are typically vulnerable to climate change. The strategy and plans of these sectors should be implemented in consideration of climate risk (known as “mainstreaming of adaptation”).
4) Promotion of co-benefit type adaptation; avoidance of maladaptation 5) Involvement of stakeholders 6) Awareness raising and capacity development
Source: Final Report of JICA – FIT (Adaptation), 2011 In order to adapt operationally from theory to action, they are several mechanism that has been proposed in JICA’s research work; includes as follow:
Step 1: Identifying current and future vulnerabilities and climate risks; Step 2: Identifying adaptation measures; Step 3: Evaluating and selecting adaptation options; Step 4: Evaluating “success” of adaptation.
As we can see the diagram below, John E Hay from Ibaraki University, Japan and as Lead Author IPCC had discussed in his presentation that the ‘adaptation measure’ is very important in a way to minimize the unavoidable consequences of climate change. Source: by John E Hay, Lead Author of IPCC
Fig. 1.3.1: Adaptation Futures, by John E Hay

12
1.3.2 Definition of Disaster Risk Reduction (DRR) Whereas, Disaster Risk Reduction (DRR) as defined by UNISDR is ‘the systematic development and application of policies, strategies and practices to minimize vulnerabilities, hazards and the unfolding of disaster impacts throughout a society, in the broad context of sustainable development’ (UNISDR, 2004: p3). DRR is multi-disciplinary in nature, recognizing the importance of links between hazards and the wider environment (Lewis, 1999; Wisneret al., 2004; Tran and Shaw, 2007). The strategies for DRR include hazard, vulnerability and capacity assessments. 1.3.3 Linkages between Climate Change Adaptation and Disaster Risk Reduction The expressions “disaster risk reduction” and “climate change adaptation” represent policy goals, one concerned with an ongoing problem (disasters) and the other with an emerging issue (climate change). While these concerns have different origins, they overlap a great deal through the common factor of weather and climate and the similar tools used to monitor, analyze and address adverse consequences. It makes sense, therefore, to consider them and implement them in a systematic and integrated manner. For example, risk assessments, flood management systems and building code enforcement contribute to both policy goals. At the same time there are areas of non-overlap, such as in earthquake risk engineering for disaster risk reduction and agricultural or trade policy initiatives for adaptation. Fig. 1.3.3 illustrates the relationship, with each pyramid representing the hierarchy from a distinctive top-level policy goal, down through institutions and mechanisms, to a base of concrete programme actions that increasingly overlap. Climate change adaptation and disaster risk reduction share another common feature – they are not sectors in themselves but must be implemented through the policies of other sectors, in particular, those of agriculture, water resources, health, land use, environment, finance and planning. There are also linkages with other policies, most notably poverty eradication and planning for sustainable development, and education and science.
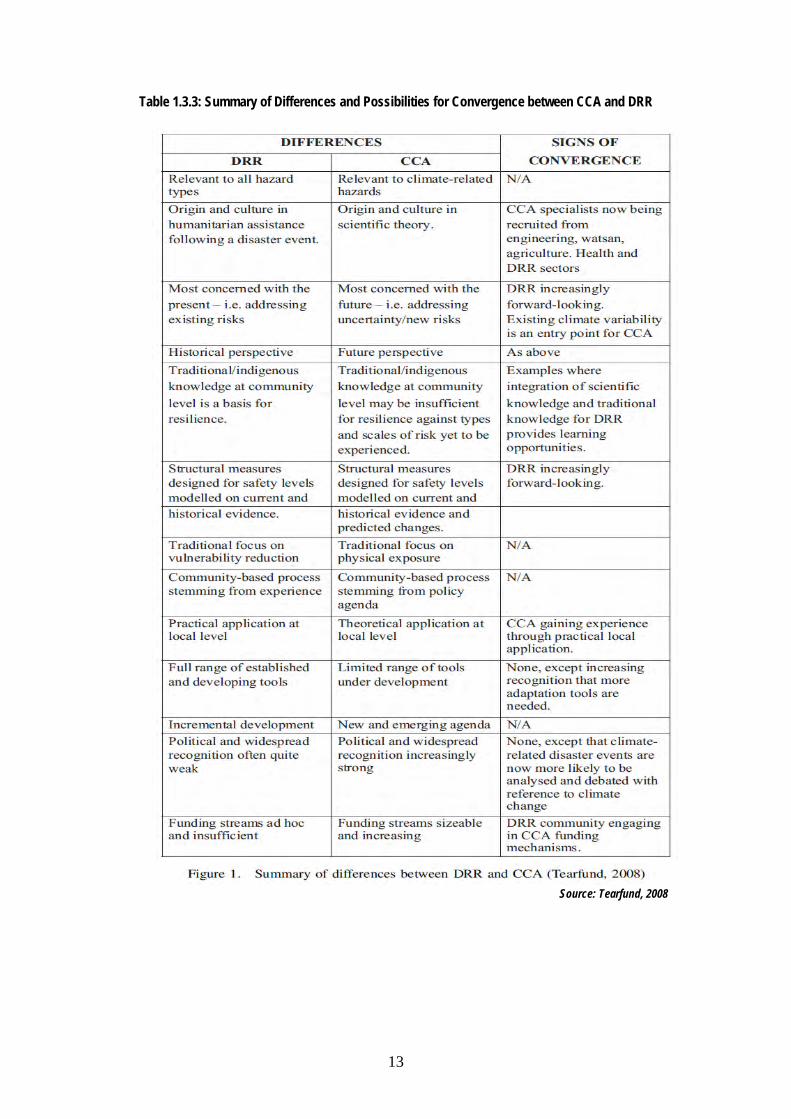
Fig. 1.3.3 Relationship between CCA and DRR In addition, Table 1.3.3 below shown the ‘Summary of Differences and Possibilities for Convergence between CCA and DRR’ that proposed by Tearfund, 2008.
13
Table 1.3.3: Summary of Differences and Possibilities for Convergence between CCA and DRR
Source: Tearfund, 2008
14
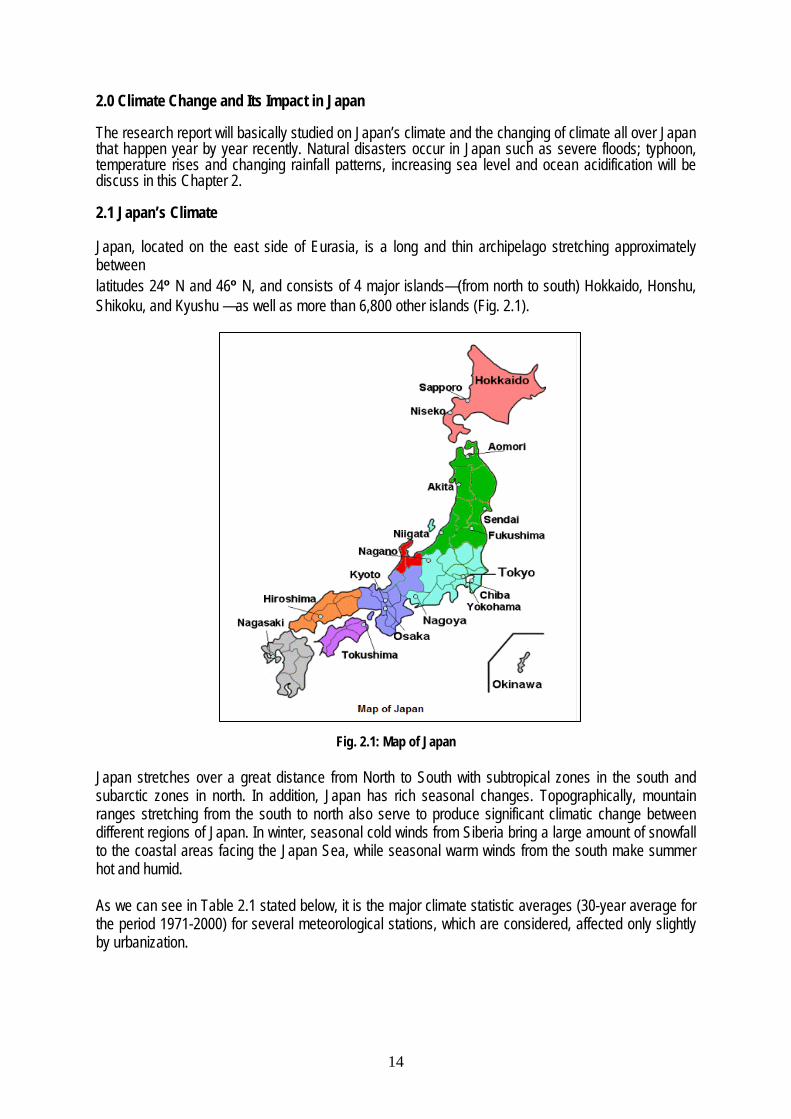
2.0 Climate Change and Its Impact in Japan The research report will basically studied on Japan’s climate and the changing of climate all over Japan that happen year by year recently. Natural disasters occur in Japan such as severe floods; typhoon, temperature rises and changing rainfall patterns, increasing sea level and ocean acidification will be discuss in this Chapter 2. 2.1 Japan’s Climate Japan, located on the east side of Eurasia, is a long and thin archipelago stretching approximately between latitudes 24º N and 46º N, and consists of 4 major islands—(from north to south) Hokkaido, Honshu, Shikoku, and Kyushu —as well as more than 6,800 other islands (Fig. 2.1).
Fig. 2.1: Map of Japan Japan stretches over a great distance from North to South with subtropical zones in the south and subarctic zones in north. In addition, Japan has rich seasonal changes. Topographically, mountain ranges stretching from the south to north also serve to produce significant climatic change between different regions of Japan. In winter, seasonal cold winds from Siberia bring a large amount of snowfall to the coastal areas facing the Japan Sea, while seasonal warm winds from the south make summer hot and humid. As we can see in Table 2.1 stated below, it is the major climate statistic averages (30-year average for the period 1971-2000) for several meteorological stations, which are considered, affected only slightly by urbanization.

15
Table 2.1: Major Climate Components of Japan
Source: JMA – ‘Climate Table of Japan’ (CD Rom – 8th Edition)
Two (2) primary factors influence Japan's climate are the location near the Asian continent and the existence of major oceanic currents. The climate from June to September is marked by hot, wet weather brought by tropical airflows from the Pacific Ocean and Southeast Asia. These airflows are full of moisture and deposit substantial amounts of rain when they reach land. There is a marked rainy season, beginning in early June and continuing for about a month. It is followed by hot, sticky weather. Five or six typhoons pass over or near Japan every year from early August to early September, sometimes resulting in significant damage. Annual precipitation, which averages between 1,000 and 2,000 mm (39.4 and 78.7 in), is concentrated in the period between June and September. In fact, 70 to 80 percent of the annual precipitation falls during this period. In winter, a high-pressure area develops over Siberia, and a low-pressure area develops over the northern Pacific Ocean. The result is a flow of cold air eastward across Japan that brings freezing temperatures and heavy snowfalls to the central mountain ranges facing the Sea of Japan, but clear skies to areas fronting on the Pacific.

16
2.2. Japan’s Situation Impact of Changing Climate Since 70% of the national land of Japan is mountainous, about a half of the population and three-fourth of the total assets exist in alluvial plains, which account for only 10% of the area as shown in the Fig. 2.2(a).
Source: Ministry of Land, Infrastructure, Transport and Tourism (MLIT), Japan
Fig. 2.2(a): Comparison between Kinki Region and Kanto Region Areas below sea level in the three major bays of Japan (Tokyo, Ise and Osaka Bays) occupy an area of 577 km2, accommodating 4.04 million habitants. In Japan, which is located on the circum-Pacific orogenic zone, mountains are steep, rivers are short and fast, many fracture zones and landslide-prone areas exist; thus, Japan is topographically and geologically prone to disasters. The islands are located on the eastern end of the Monsoon Asia, which is marked by high precipitation, receive a mean annual precipitation of about 1,700 mm, which is twice as much as the world average, are on the route of typhoons, and suffer severe climate events such as large hourly precipitation of almost 200 mm. The land is thus vulnerable to floods, sediment-related disasters, and storm surges. The mechanism of global warming and climate change in Japan can be summarized in the Fig. 2.2(b).
Source: Ministry of Land, Infrastructure, Transport and Tourism (MLIT), Japan Fig. 2.2(b): Mechanism of Global Warming and Climate Change in Japan

17
In Japan, weather stations began to be set up in various type of the country at 1870s where the weather observation using instruments were launched. With the enactment of the Meteorological Observation Law in 1886, observation and statistical methodologies were standardized and such standardized methodologies have since been employed in Japan. At present, surface weather observations are being carried out at about 160 meteorological observatories and weather stations distributed across the country. In addition, automatic observations of temperature, precipitation, and other elements are being performed over the network called Automated Meteorological Data Acquisition System (AMeDAS) of about 1,300 observation stations, including meteorological observatories and weather stations. Some of those observation stations have kept long-term records since the end of the 19th century, which provide valuable information for tracking climate change in Japan. It is important that the uniformity of observation data is maintained over a long period to enable an understanding of climate change. Thus, in terms of precipitation, which is rarely influenced by urbanization, JMA use observation records obtained at 51 observation stations where the uniformity of observation data has been maintained; whereas in terms of temperature, which is substantially influenced by urbanization, the observation records obtained at 17 observation stations as we can see in Fig. 2.2(c) where urbanization is not very advanced besides the uniformity of records has been maintained. Those observation stations are not fully free from environmental impacts such as urbanization, but they believe that their observation records are appropriate for monitoring natural variability in the climate and temperature change caused by global warming,
Source: Japan Meteorological Agency (JMA)
Remark: The blue triangles represent the 51 observation stations for deriving precipitation ratios and the red circles are the 17 observation stations for deriving average temperature anomalies
Fig. 2.2(c): Observation stations whose data are used to estimate the surface temperature and precipitation in
Japan

18
2.2.1 Temperature Rises Due to climate change phenomenon, the annual temperature in Japan has been rising at a rate of 1.1°C per century since 1898. The long-term trend of the annual temperature anomaly in Japan is about 1.1°C per century (statistical period: from 1898 to 2008) is shown in Fig. 2.2.1(a). High-temperature years have been particularly frequent after the 1990s. As temperatures rise, the numbers of days with minimum temperatures (Tmin) of ≥ 25°C and days with maximum temperatures (Tmax) of ≥ 35°C are increasing respectively, while that of days with Tmin < 0°C is decreasing. In particular, most of temperature rises since the mid-20th century are very likely to be attributable tothe increases in anthropogenic GHG concentrations. The period of relatively low temperatures continued up to the 1940s, but temperatures began to rise abruptly in the latter half of the 1980s. The years that recorded significantly high temperatures are concentrated in the period after 1990. The cause behind the frequent appearance of high temperature in recent years is considered to be a combination of global warming due to increased emissions of GHGs and natural variations on the time scale of several years to several decades, similar to the cause behind the rise of global average temperatures. As shown in Table 2.2.1 (b), the significant temperature rise is found in all seasons for the all four areas of Japan — Northern, Eastern, Western Japan, and Okinawa-Amami.
Source: Japan Meteorological Agency (JMA), 2009
Remark: Annual surface temperature anomalies obtained at 17 observation stations (Fig. 2.2(c)) are shown. The bar graph represents anomalies from normal (i.e. the 1971 – 2000 average). The heavy line (blue) shows the five-year running mean. The straight line (red) is the long-term trend.
Fig. 2.2.1(a): Annual surface temperature anomalies from 1898 to 2008 in Japan

19
Table 2.2.1(b): Long-term trend in annual and seasonal average surface temperatures in Japan Source: Adapted from JMA, 2005a. Long-term trends obtained by linear regression analysis. Statistical period: 1898 to 2008. Regardless of the area and season, all increasing trends are significant with a 95% confidence level. Observation stations used for this estimation: Northern Japan (Abashiri, Nemuro, Suttsu, Yamagata, Ishinomaki); Eastern Japan (Fushiki, Nagano, Mito, Iida, Choshi); Western Japan (Sakai, Hamada, Hikone, Miyazaki, Tadotsu); Okinawa/Amami (Naze, Ishigakijima) Due to temperature rising in Japan, it is also connected to the ‘Urban Heat Island Effect’ – phenomenon which raises urban temperatures more than suburban temperatures as a result of anthropogenic heat emissions, heat accumulation, and restraint of water evaporation and transpiration when urban ground is covered with asphalt or concrete. Recent temperature rises in urban areas like in Tokyo or other metropolitan cities in Japan, in conjunction with global warming. For example, the annual average temperature rise in Tokyo is about 3°C per century (Source: JMA). The average temperature rise in other large Japanese cities, including Sapporo, Sendai, Nagoya, Kyoto, Osaka, and Fukuoka, is more than 2°C per century. The temperature rise in those cities is far greater than the 17 station average temperature representing the average temperature rise in Japan attributable to global warming (1.1°C). This implies that the heat island phenomenon is causing a temperature rise equivalent to or surpassing the level attributed to global warming. 2.2.2 Changing in Precipitation Patterns In Japan, the annual precipitation varies largely from year to year as recorded by JMA, and no clear trends of increases or decreases have been observed. On the other hand, the number of heavy precipitation days, such as days with daily precipitation of ≥ 100 mm or 200 mm, has been increasing over a long period, and suggests the possibility of influence from global warming. Fig. 2.2.2 (a) below shown the severe floods occurred in year 2008 – Hyogo Prefecture and Aichi Prefecture, Japan due to largest – ever amount of rainfall.
Source: Ministry of Land, Infrastructure, Transport and Tourism, Japan (MLIT) Fig. 2.2.2(a): Severe floods disaster in Hyogo and Aichi Prefectures, Japan
As shown in Fig. 2.2.2(b) below, from the annual precipitation changes in Japan, it is known that heavy precipitation occurred in the years up to the mid-1920s and also around the 1950s, but annual variations have gradually increased since the 1970s.

20
Source: Japan Meteorological Agency (JMA), 2009 Remark: Changes in annual precipitation ratio taken at 51 stations in Japan are shown. The bar graph represents annual precipitation ratios to the normal (i.e. the 1971 – 2000 average). The heavy line (green) shows the five-year running mean.
Fig. 2.2.2(b): Annual Precipitation Ratios from 1898 to 2008 in Japan Refer to IPCC AR4, they provided a view that the frequency of heavy precipitation was likely to have increased in the latter half of the 20th century in most regions in the world, a similar trend seen in the increased number of years with heavy precipitation in Japan. This suggests the possibility that the increasing trend of heavy precipitation in Japan has occurred under the influence of global warming as an effect of climate change as well. Due to global warming, Japan also had experienced of rainfall pattern changing in spring season that occur between April - June, as we can see in the Fig. 2.2.2(c). The diagram summarized the decreasing amount of rainfall in most areas in Japan from March through June by comparing between the present rainfall and predicted rainfall after 100 years.
Source: Water Resources in Japan 2007, Land and Water Bureau, MLIT
Fig. 2.2.2(c): Comparison between the Present Rainfall and Predicted Rainfall after 100 years in Japan

21
Concerning the relationship between heavy precipitation and global warming, IPCC AR4 reported that “the frequency of heavy precipitation events has increased over most land areas, consistent with warming and observed increases of atmospheric water vapor.” (observation) based on the evaluation using daily precipitation observations. It then offered the view that “It is very likely that hot extremes, heat waves and heavy precipitation events will continue to become more frequent.”(projection). An increasing long-term trend of daily precipitation amounts in Japan is consistent with this view of IPCC and it is likely to have occurred under the influence of global warming. 2.2.3 Increasing of Tropical Cyclones Japan, being one of the countries exposed to tropical cyclones in the Pacific, has experienced severe physical damage and other, indirect economic consequences of these weather systems. In Japan, the typhoon season is typically from around July to September, and hence most of the downtime usually 2 occurs during these months. Globally, the major factor affecting tropical cyclone frequency and tracks on an interannual (e.g., 2-7 year) time scale is the ENSO phenomenon. This has been shown to affect the genesis regions and the subsequent motion in all tropical cyclone basins (Nicholls, 1979, 1984; Chan, 1985, 2000; Gray and Sheaffer, 1991; Landsea et al., 1999; Irwin and Davis, 1999; Chia and Ropelewski, 2002; Wang and Chan 2002; Chu, 2005; Ho et al., 2006). On the interannual time-scale, there is no established insitu positive relationship between sea surface temperature and tropical cyclone frequency (Nicholls, 1984; Raper, 1992; Chan and Liu, 2004) The exception to this is the North Atlantic, where it is well established that sea surface temperature (SST) is one of the factors impacting on the number and severity of cyclones (Shapiro, 1982, Raper 1992, Shapiro and Goldenberg, 1998, Landsea et al., 1998). No such in-situ relationship has been established for the other cyclone basins. Fig.2.2.3(a) below shown the total numbers of Tropical Storm (TS), Severe Tropical Storm (STS) and Typhoon (TY) formations, their approaches to Japan (including the Ogasawara Islands and the Nansei Islands), and their landfalls on Japan during the period from 1951 to 2008. The thin solid lines show the number of Tropical Cyclones formation (blue), those of approaches to Japan (including the Ogasawara Islands and the Nansei Islands) (green), and those of landfalls on Japan (red). The heavy solid lines give the five-year running means. The thin dashed lines show the normal values (average from 1971 to 2000).
Source: JMA, 2009
Fig. 2.2.3 (a) Number of tropical cyclones formations, their approaches, and landfalls on Japan
22
Through the work of many researchers (Emanuel 1999, Emanuel et al. 2004, Free et al. 2004, Holland 1987, Holland 1997, Tonkin et al. 2000, Persing and Montgomery 2003, Montgomery et al. 2006) there is developing theory governing maximum tropical cyclone intensity. The key concept is that for a given ocean temperature and atmospheric thermodynamic environment there is an upper bound on the intensity a tropical cyclone may achieve. This upper bound is referred to as the Maximum Potential Intensity (or MPI). Emanuel (1987) and Tonkin et al (1997) presented evidence that CO2 induced climate change would bring about a substantial increase in the MPI of tropical cyclones around the globe. Thus, climate models (global and regional) remain an important tool for investigating tropical cyclone variability and change. It is likely that some increase in tropical cyclone peak wind-speed and rainfall will occur if the climate continues to warm. Model studies and theory project a 3-5% increase in wind-speed per degree Celsius increase of tropical sea surface temperatures as summarized in the Statement on Tropical Cyclones and Climate Change - WMO International Workshop on Tropical Cyclones, IWTC-6, San Jose, Costa Rica, on November 2006.
2.2.4 Changes in Sea Level
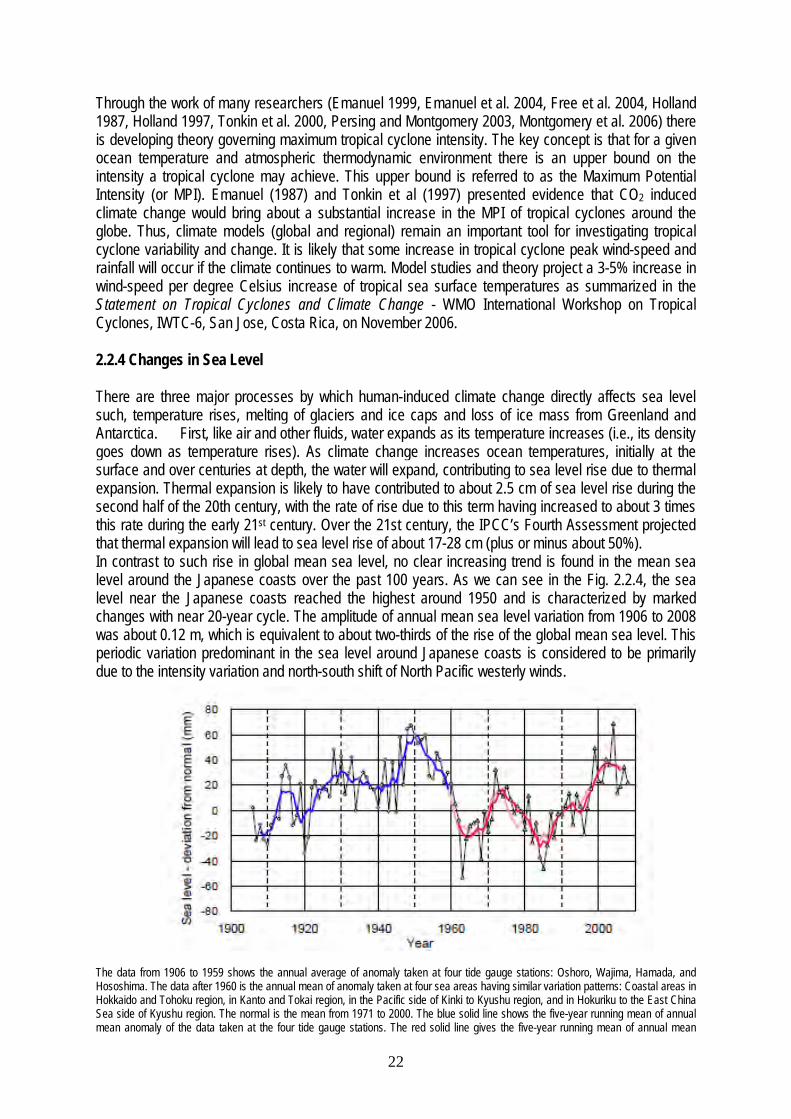
There are three major processes by which human-induced climate change directly affects sea level such, temperature rises, melting of glaciers and ice caps and loss of ice mass from Greenland and Antarctica. First, like air and other fluids, water expands as its temperature increases (i.e., its density goes down as temperature rises). As climate change increases ocean temperatures, initially at the surface and over centuries at depth, the water will expand, contributing to sea level rise due to thermal expansion. Thermal expansion is likely to have contributed to about 2.5 cm of sea level rise during the second half of the 20th century, with the rate of rise due to this term having increased to about 3 times this rate during the early 21st century. Over the 21st century, the IPCC’s Fourth Assessment projected that thermal expansion will lead to sea level rise of about 17-28 cm (plus or minus about 50%). In contrast to such rise in global mean sea level, no clear increasing trend is found in the mean sea level around the Japanese coasts over the past 100 years. As we can see in the Fig. 2.2.4, the sea level near the Japanese coasts reached the highest around 1950 and is characterized by marked changes with near 20-year cycle. The amplitude of annual mean sea level variation from 1906 to 2008 was about 0.12 m, which is equivalent to about two-thirds of the rise of the global mean sea level. This periodic variation predominant in the sea level around Japanese coasts is considered to be primarily due to the intensity variation and north-south shift of North Pacific westerly winds.
Source: JMA, 2009 The data from 1906 to 1959 shows the annual average of anomaly taken at four tide gauge stations: Oshoro, Wajima, Hamada, and Hososhima. The data after 1960 is the annual mean of anomaly taken at four sea areas having similar variation patterns: Coastal areas in Hokkaido and Tohoku region, in Kanto and Tokai region, in the Pacific side of Kinki to Kyushu region, and in Hokuriku to the East China Sea side of Kyushu region. The normal is the mean from 1971 to 2000. The blue solid line shows the five-year running mean of annual mean anomaly of the data taken at the four tide gauge stations. The red solid line gives the five-year running mean of annual mean

23
anomaly of the data taken at the four sea areas. The pink line shows the five-year running mean of annual mean anomaly of the data taken at the four tide gauge stations for the period after 1960, which is presented for reference.
Fig. 2.2.4: Changes in annual mean sea level in Japan (1906 to 2008)
2.2.5 Ocean Acidification Each year, the oceans absorb the equivalent of about a third of human emissions of carbon dioxide (CO2), transferring most of it to the deep ocean. Over the past 200 years, the increasing CO2 emissions from fossil fuel combustion have led to an exponential increase in the net amount of CO2 being dissolved in the ocean. Dissolved CO2 creates carbonic acid, which reduces the ocean pH level, making it more acidic In the ocean areas to the south of Japan, the CO2 concentration is increasing over time in the zone between the sea surface and its intermediate layer, and ocean acidification is advancing noticeably.
Source: JMA, 2009
Fig. 2.2.5: Long-term changes in CO2 concentrations in surface seawater and the atmosphere in winter in the ocean area along 137°E (mean in the range of 7 to 33° N) As shown in Fig. 2.2.5, in the ocean area along 137°E (7°N to 33°N) to the south of the Kii Peninsula where oceanographic observations have been continued for years, the CO2 concentration in the surface seawater in winter has been increasing since 1984 when the observations started. The total concentration of carbonic acid substances (total carbon concentration) within the ocean has also been showing an increasing trend since 1994. For example, in the ocean area around 30°N immediately south of the Kuroshio Current, the total carbon concentration is increasing at a rate of +1.0±0.2 μmol/kg/year25 near the sea surface. As CO2 emissions and climate change continue, risks to the health of the ocean will become a more prominent concern. With accelerated melting back of glaciers and ice sheets and the subsequent rise in sea level, with further decreases in oceanic pH, and with deceleration of the thermohaline circulation, there are many ways in which the delicate balance of ocean dynamics and ecosystems are being put at risk. These factors, combined with the uncertainty in predicting exactly how these impacts will interact, are causing changes in the ocean: an increasingly problematic issue for future generations.

24
3.0 Climate Change Plan, Practices and Initiative with Comprehensive Disaster Management
Measures in Japan The scientific evidence of a likely link between climate change and human activity provides a major challenge to policy-making. Mitigation and adaptation will affect the environment and societies in many ways. The scale and complexity of the interactions between society and the environment represent an unprecedented challenge especially for research institutions. Major progress in understanding the complex interplay of the processes of global change, mitigation and adaptation measures and their impacts can only be made through well coordinated joint research across national and disciplinary borders. 3.1 Legal Policy and Framework of Climate Change in Japan In order to get more clear understanding, the adaptation strategies of Japan itself to climate change due to global warming will be studied. In this Chapter 3, we will discuss on how the National Level implements their countermeasures and practices until to the Community Level in a way to adapt the climate change impact in Japan. 3.1.1 Background and Significance of the Revised Kyoto Protocol Target Achievement Plan First and foremost, Japan has promoted countermeasures against global warming due to climate change impact in various ways, such as the establishment of the Action Program to Arrest Global Warming (1990), Basic Policy on Measures to Tackle Global Warming (1999), and the Outline for Promotion of Efforts to Prevent Global Warming (1998, 2002). In response, the Kyoto Protocol Target Achievement Plan was drafted in April 2005 following the establishment of the Outline for Promotion of Efforts to Prevent Global Warming, Action Program to Arrest Global Warming, and Basic Policy on Measures to Tackle Global Warming. Based on the Act on Promotion of Global Warming Countermeasures, the plan was drafted in order to stipulate the measures necessary for reliably achieving the Kyoto Protocol’s commitment of 6% emission cuts, and as a result of the 2004 evaluation and revision of the Outline for Promotion of Efforts to Prevent Global Warming. In 2007, the revised Act on Promotion of Global Warming Countermeasures provided that the study shall be conducted concerning the targets and programs prescribed in the Kyoto Protocol Target Achievement Plan and that any changes to the Plan will promptly enacted if found necessary based on the results of the study. Therefore, the plan was completely revised in March 2008 where the Global Warming Prevention Headquarters, which is composed of all Cabinet members, completed a proposal for the plan’s revision and amendments to the Kyoto Protocol Target Achievement Plan were adopted by the Cabinet. 3.2 Japan’s Global Warming Countermeasures by National Level to Community Peoples
National Government has the role of comprehensively promoting global warming countermeasures and taking the initiative in implementing such countermeasures. An achievement of the reduction commitments of developed countries stipulated in the Kyoto Protocol is a significant milestone toward achieving the ultimate objective of the UNFCCC: Stabilization of Greenhouse Gas Concentrations in the Atmosphere. Perhaps, the greenhouse gas emissions are closely related to economic activities and citizens’ lives. Therefore, the Government of Japan is implementing the ‘Global Warming Countermeasures’, founded on the basic philosophy of “Compatibility between the Environment and the Economy.” Consequently, Japan is proposing as a long-term global common goal “to cut greenhouse gas emissions by half from the current level by 2050” in the “Cool Earth 50” which it announced in May 2007 (Fig. 3.2).

25
Source: Japan International Cooperation Agency (JICA)
Fig. 3.2: “Cool Earth 50” Promotion Program in Japan
In order to achieve its commitment under the Kyoto Protocol, Japan will promote the measures necessary to reduce its total greenhouse gas emissions by 6% from the base year level in the first commitment period (2008-2012). Currently, Japan is a world leader in the development of new climate-friendly technologies such as Honda and Tokyo Hybrid Electric vehicles were named to have the highest fuel efficiency and lowest emissions. The fuel economy and emissions decrease is due to the advanced technology in hybrid systems, biofuels, use of lighter weight material and better engineering.
Aiming to be a world-leading environmental nation, Japan will also promote the innovative technology development and creation of a low-carbon society, encourage the participation and collaboration of national and local governments, business operators and citizens, and try to ensure transparency and share information in order to achieve it. The Government of Japan had actively provide and share knowledge about the increasingly serious global warming issue and information about the specific actions demanding enormous efforts to achieve the 6% reduction commitment and about what each individual must do. They will carry out public relations and dissemination activities in a way to improve the awareness of households and enterprises and rouse them to take the action.
In order to constantly assess the effectiveness of this plan and make it reliable, each year after formulation of the plan, the Government of Japan will rigorously inspect the progress of the policies for each countermeasure using countermeasure evaluation indices and others, and will expeditiously revise the Plan to add or strengthen measures and policies as necessary. To promptly take effective additional measures and policies in and after FY2010 (the middle year of the first commitment period) to achieve the target, in FY2009 the Government will comprehensively evaluate the progresses of measures and policies in this Plan and the state of emissions, based on the projection of Japan’s greenhouse gas emissions during the whole first commitment period (5 years).

26
3.2.1 Low Carbon Society in Japan Moreover, the carbon dioxide - CO2 emissions are projected to rapidly increase as a result of the future population growth and economic development on a global scale. Therefore, Japan, which has superior technological capabilities and accumulated experience in environmental conservation, will take a leading role in the world’s efforts to combat global warming through international cooperation. From the viewpoints of responding to the global warming issue and freeing ourselves from fossil fuel resource constraints, it is necessary to create a “Low Carbon Society,” in which citizens can feel the affluence in their life and at the same time the atmospheric greenhouse gas concentrations are stabilized at a level that has no negative impact on the climate, by substantially reducing greenhouse gas emissions from fossil fuel consumption to the level equivalent to the capacity of natural sinks. Furthermore, all national government agencies are to promote the countermeasures by sufficiently collaborating in line with this overall framework and mobilizing diverse policy instruments including voluntary, regulatory, economic and informational ones, environmental impact assessment, and social capital development. Therefore, the Government will work toward building a “Low-Carbon Society” by commencing the transformation of urban/regional structures and socioeconomic systems from a mid- and long-term perspective at the earliest possible time. In particular, the Government of Japan will reconstruct urban structures into low-carbon since urban structures can have a big impact on global warming, taking into account the aims of the Improvement Plan for Cities and Urban Lives. Furthermore, the Government will formulate and improve policies based on regional voices through the invitation of proposals concerning the special zones for structural reform and the regional revival. Therefore, they are many efforts had ongoing by the Government of Japan due to development of ‘Low – Carbon Society’ in Japan such as; 1. Realization of Compact, Low-carbon Urban Structures
- The Government was encourage low-carbon urban/regional development by realizing cities
with minimal environmental loads, or “Compact Cities,” where urban functions are allocated within walking distance.
- The Government will promote the creation of environmental model cities out of around 10 cities selected from all over Japan, which will take on pioneering efforts by setting challenging goals for drastic greenhouse gas reductions.
2. Measures at the Block and District Levels
- Through, introduction of area-wide measures at the block and district levels, for example,
bringing in pioneering measures to an entire district or complex buildings, which are anticipated to lead to drastic reductions in CO2 emissions by the efforts through public-private partnership.
3. Promotion of Area-wide Energy Usage
- The Government will intensively introduce multiple renewable energy-utilizing equipment to
blocks, districts or buildings, and will actively introduce and disseminate environmentally outstanding district heating and cooling, keeping in mind the characteristics of each area, the promoting actor, the feasibility of each measure, and the Government will also continue to implement policies including the utilization of city planning systems. Thus in local areas, large CO2-saving benefits can be expected from efficient area-wide energy usage including efficient energy supply to multiple facilities and buildings, mutual energy accommodation among facilities and buildings, and utilization of untapped energy.

27
4. Efforts Transcending the Individual Boundaries Between Actors
- In order to promote CO2 saving in an entire building or facility such as multi-tenant building or housing complex, the Government will activate efforts transcending the individual boundaries between actors like building owners, tenants and energy suppliers. For this reason, the Government will utilize information technology to promote efforts such as energy management and control for an entire area, collective energy management for multiple buildings and facility-wide energy management.
- 5. Decarbonization of Urban Areas Through Improving the Thermal Environment by Urban
Greening and Other Heat Island Countermeasures - The Government will do measures to improve area-wide land coverage such as, keeping green
areas through the creation of urban parks; greening public spaces and government and other public facilities; greening the premises of buildings through utilization of the greening region system; carrying out facility greening such as rooftop and wall surface greening; using spring water or reclaimed wastewater; utilizing road paving materials that can control the rise in road surface temperatures; introducing integrally such technologies as water-retentive building materials and highly reflective coatings; and preserving privately-owned green areas and promoting the formation of water and greenery networks through collaboration among projects on parks, roads, rivers, sabo (erosion and sediment control), ports or sewage systems; and building cities with small environmental burdens.
6. Measures for Extending the Useful Life of Housing
- Toward the realization of a sustainable society, the Government will also promote measures for “200-year Housing,” which is designed to have long useful life, in order to contribute to CO2 saving and other environmental burden reduction through long-term use of housing in good condition. These measures include the encouragement of construction and appropriate maintenance of housing with superior performances in durability, ease of maintenance and energy efficiency.
7. Construction of Low-Carbon Transport Systems
- In order to increase the efficiency of transport systems, the Government, coupled with
realization of a compact urban structure, will implement comprehensive measures including the following: traffic jam alleviation; traffic demand management; development of traffic safety facilities such as traffic signals; and promotion of the use of public transport systems.
8. Formation of Low-Carbon Logistics Systems
- To promote the greening of the overall logistics system, the Government will strengthen and
expand the efforts under the cooperation among shippers and logistics operators, while promoting ‘modal shifts’, 4 improvements of the truck transport efficiency or other measures.
9. Promotion and Campaign such a ‘Cool Earth Day’
- July 7 every year has been designated as, ‘Cool Earth Day’ in Japan, when the steps toward
the low-carbon society are shared among the Japanese people. Every year various activities and events like the Tanabata (Star Festival) Light Down, which was held in fiscal 2008, will be held to encourage a shift in the awareness of the Japanese people toward the low-carbon society. Thus, it will encourage the understanding of children toward global warming through

28
activities to spread information in schools, and the promotion of initiatives to make people think about local production for local consumption.
- Initiatives toward things such as car sharing, which involves a shift in consciousness from ownership to utilization of functions, and the 3 Rs (reduce, reuse, recycle) will be promoted.
3.2.2. Nippon Keidanren Voluntary Action Plan for Industrial Community In order for Japan to achieve its reduction commitment under the Kyoto Protocol, it is extremely important for the industrial community to advance efforts to control emissions, including the improvement of energy consumption intensity or CO2 emissions intensity, so that the targets of these voluntary action plans will be achieved. For this reason, the targets and content of voluntary action plans will be determined by the industrial community itself. Some of the following efforts are encouraged from the viewpoint of meeting social demands:- 1. Formulating a new plan for a business which has no plan; 2. Quantifying targets (i.e. setting quantitative targets) for a business which has qualitative targets only; 3. Undergoing strict assessments and verifications for the plan by the Government; and 4. Raising targets in the case where targets are already overachieved. In order to advance the effective and efficient reduction of greenhouse gas emissions, reduce the cost burden on the entire nation as much as possible with fairness taken into account, and achieve the multiple policy objectives of environmental conservation and economic development at the same time, the Government of Japan will utilize a ‘Policy Mix Approach’ of fully mobilizing all policy instruments, including voluntary, regulatory, economic and informational ones, taking advantage of their respective characteristics and organically combining them. The Government of Japan will promptly conduct a comprehensive study of the most appropriate form for this approach while monitoring the progress of the measures and policies of the plan. 3.2.3 Initiatives by the National Government of Japan With the first commitment period of FY2008-FY2012, the Government of Japan will make leading efforts concerning its own administration and undertakings such as the purchase and utilization of goods and services, and the construction and management of buildings, based on the National Government Action Plan under the Act on Promotion of Global Warming Countermeasures and each ministry’s implementation plan under this Plan. In particular, the initiatives are include: 1. They will intensively promote greening of National Government buildings across the country by
means of photovoltaic power generation, building planting, ESCO 9 and others. 2. They will conclude environment-conscious contracts mainly in four areas: electrical power,
automobiles, ESCO and buildings, based on the Act Concerning the Promotion of Contracts Considering Reduction of Greenhouse Gases and Other Emissions by the State and Other Entities (Act No.56 of 2007; hereinafter referred to as the “Green Contract Act”). The Basic Policies also will be revised if necessary.
3. With regards to national government buildings, they will continue to promote Green Government Building construction, Green Assessment and Green Renovation and thorough appropriate operation and management.
4. They will utilize the Life Cycle Energy Management (LCEM), method of air-conditioning system and introducing fuel-efficient vehicles such as clean diesel, clean energy and idling stop vehicles.
5. They will work to form a “CO2 -Saving Government Office Area” around Kasumigaseki District

29
through pioneering introduction of new technology and systems and organic collaboration among ministries and agencies such using the solar
6. They introduce the sophistication of common-use bicycle systems; and further promotion of planting.
7. They will further strengthen the roles of the Japan Center for Climate Change Action, prefectural and major municipal Promotion Centers for Climate Change Action, Climate Change Action Officers, Regional Councils on Global Warming Countermeasures and other organizations which promote the activities of controlling greenhouse gas emissions.
8. They will encourage individual citizens to take voluntary actions for preventing global warming by strongly appealing to the awareness of citizens through the appropriate provision of information using diverse methods, including the proactive utilization of various mass media such as television, newspapers and the Internet, on the “I declare CO2 reduction of 1 kg 1 day 1 person” movement, Cool Biz (business style to wear light clothing with the air conditioning set at 28� in summer), Warm Biz (business style to wear warm clothing with the air conditioning set at 20� in winter), and other efforts in the Team Minus 6% campaign.
9. They will take such measures as introduction of fluorocarbon-free insulation materials, renovations contributing to global warming countermeasures including local wood use and introduction of renewable energy devices, while utilizing the Internet or other media to promote support for global warming countermeasures in households.
10. The Government of Japan will disseminate examples of energy-saving ideas through its ‘National Energy-saving Campaign’, and will develop a ‘Nationwide Eco-Action-Point scheme’, under which people can acquire points through the purchase of energy-efficient appliances or other products or services that contribute to reducing greenhouse gas emissions.
Thus, the Government of Japan estimated that if these countermeasures are implemented as planned, an annual average removal volume of about 0.06% relative to the base year total emissions (0.74 million t- CO2 ) will be acquired in the first commitment period. Moreover, At the United Nations Summit on Climate Change on September 22, 2009, Prime Minister Yukio Hatoyama announced that Japan would aim to reduce its emissions by 25% by 2020, if compared to the 1990 level, premised on the formulation of a fair and effective international framework by all major economies and agreement on their ambitious targets. The Prime Minister was resolved to exercise the political will required to deliver on this promise by mobilizing all available policy tools. These will include the introduction of a domestic emission trading mechanism and a feed in tariff for renewable energy, as well as the consideration of a global warming tax. 3.2.4 Initiatives by NGOs and Community Levels in Japan In order to succeed such policies, action plans and practices by the National Government Level due to climate change adaptation - fully involvement, collaboration and good cooperation between Government and the Community Level is very important. Therefore, the Government of Japan will collaborate with a variety of different actors, such as NGOs, community groups, citizens, companies, and the administration, with the aim of established and spreading across the country activities that are rooted in the community, such as region-wide citizens’ movements, thus creating a society in which individuals act starting from what is closest at hand. To achieve this, the Government will support the initiatives of organizations of different types, such as the Centers for Climate Change Actions and regional committees, and the initiatives of climate change action officers. It will also support environmental conservation initiatives carried out through

30
partnerships of regional NGOs, NPOs, companies, regional public bodies, etc. Moreover, the Government will support community funds that give financial and non-financial support to the initiatives of organizations, NGOs, etc., that have close links to the community and demonstrate leadership; it will support businesses consulting on the emission reduction initiatives of companies and individuals; and it will facilitate such initiatives. The government will also support, through regional industry-university-government collaboration, the development of new products and services that contribute to bringing about a low-carbon society, and the expansion of markets for these products and services, by promoting Industrial Cluster Project. 3.3 Recent Adaptation Measures by Ministry of Environment of Japan (MOEJ) The Fourth Assessment Report (AR4) of the Intergovernmental Panel on Climate Change (IPCC) pointed out that even the most stringent mitigation efforts (i.e., reduction of greenhouse gases (GHGs)) cannot avoid further impacts of climate change in the next few decades. It is therefore essential to carry out not only initiatives for the long-term mitigation of climate change, but also initiatives to adapt to climate change. Thus, Japan has already pursued energy conservation for many decades, and has been progressive in its climate change mitigation efforts. In parallel with those efforts, Japan has recognized the significance of the impacts of global warming and climate change, and has been engaged in extensive research, studies and policy discussions since 1990s. In 2008, MOEJ released “Wise Adaptation to Climate Change” (Fig. 3.3(a)) report that summarized the scientific knowledge available to date on the impacts of, and adaptation to, climate change in Japan and Asian developing countries, and to present concepts of “wise” (effective and efficient) adaptation. Together, various MOEJ reports provide the latest information on the impacts of an adaptation to climate change, and propose further research necessary, taking into account the need to contribute to decision making.
Source: Wise Adaptation to Climate Change (MOEJ, 2008)
Fig. 3.3(a): Wise Adaptation to Climate Change

31
Source: Ministry of Environment of Japan (MOEJ)
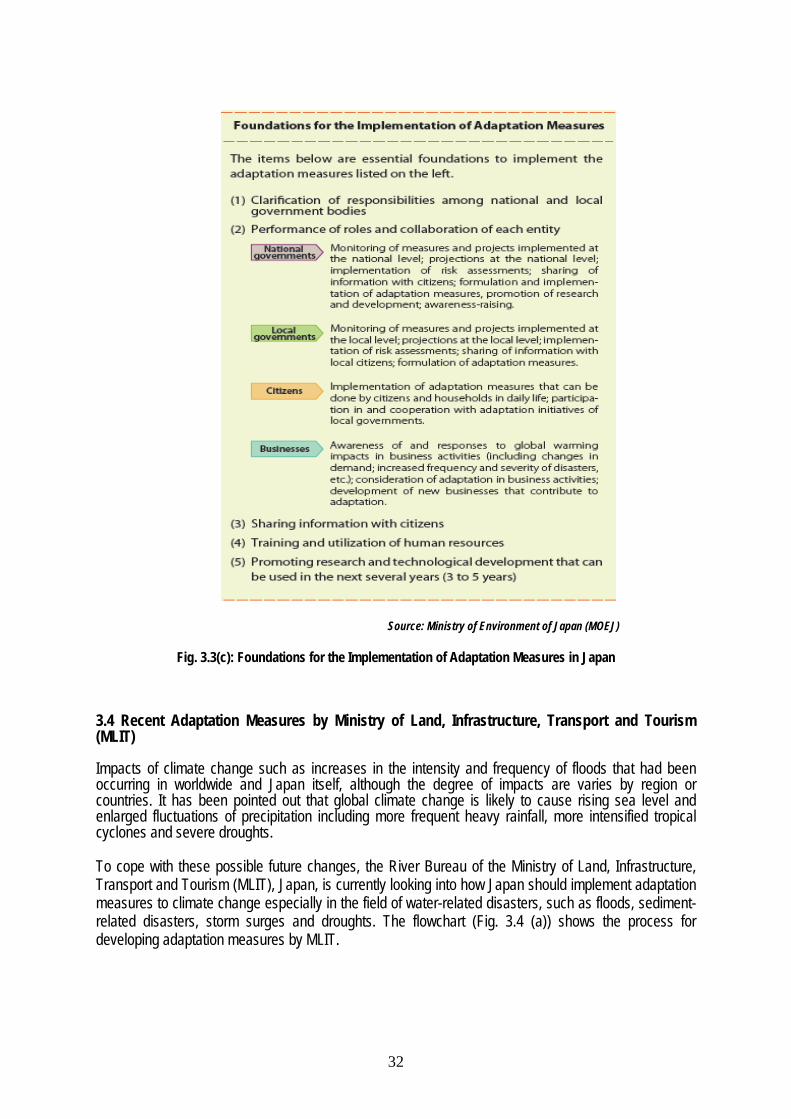
Fig. 3.3(b): Overview of design & implementation of adaptation measures Adaptation planning should be carried out based on an understanding of the necessity and priority rank of adaptation strategies. Rather than starting completely from zero, it is often better to start by integrating the concepts and approaches of adaptation into existing plans and measures. Adaptation strategies will be more effective and efficient if an effort is made to utilize existing structures and frameworks to the greatest extent possible. As we can see in the Fig. 3.3(b) is shown the overview of design & implementation of adaptation measures in Japan itself. Fig. 3.3(c) below shows the essential foundations for the implementation of Adaptation Measures – performance of roles and collaboration between National Governments, Local Governments, Citizens and Business in Japan.
32
Source: Ministry of Environment of Japan (MOEJ)
Fig. 3.3(c): Foundations for the Implementation of Adaptation Measures in Japan 3.4 Recent Adaptation Measures by Ministry of Land, Infrastructure, Transport and Tourism (MLIT) Impacts of climate change such as increases in the intensity and frequency of floods that had been occurring in worldwide and Japan itself, although the degree of impacts are varies by region or countries. It has been pointed out that global climate change is likely to cause rising sea level and enlarged fluctuations of precipitation including more frequent heavy rainfall, more intensified tropical cyclones and severe droughts. To cope with these possible future changes, the River Bureau of the Ministry of Land, Infrastructure, Transport and Tourism (MLIT), Japan, is currently looking into how Japan should implement adaptation measures to climate change especially in the field of water-related disasters, such as floods, sediment-related disasters, storm surges and droughts. The flowchart (Fig. 3.4 (a)) shows the process for developing adaptation measures by MLIT.
33
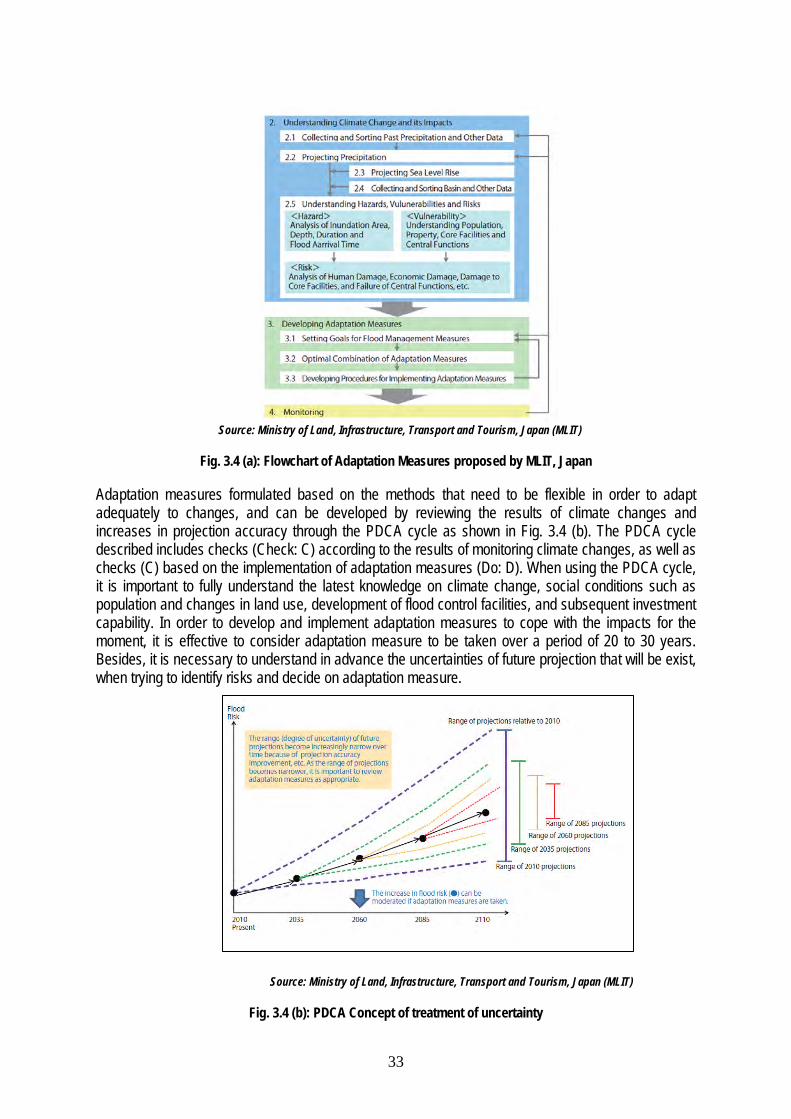
Source: Ministry of Land, Infrastructure, Transport and Tourism, Japan (MLIT)
Fig. 3.4 (a): Flowchart of Adaptation Measures proposed by MLIT, Japan
Adaptation measures formulated based on the methods that need to be flexible in order to adapt adequately to changes, and can be developed by reviewing the results of climate changes and increases in projection accuracy through the PDCA cycle as shown in Fig. 3.4 (b). The PDCA cycle described includes checks (Check: C) according to the results of monitoring climate changes, as well as checks (C) based on the implementation of adaptation measures (Do: D). When using the PDCA cycle, it is important to fully understand the latest knowledge on climate change, social conditions such as population and changes in land use, development of flood control facilities, and subsequent investment capability. In order to develop and implement adaptation measures to cope with the impacts for the moment, it is effective to consider adaptation measure to be taken over a period of 20 to 30 years. Besides, it is necessary to understand in advance the uncertainties of future projection that will be exist, when trying to identify risks and decide on adaptation measure.
Source: Ministry of Land, Infrastructure, Transport and Tourism, Japan (MLIT)
Fig. 3.4 (b): PDCA Concept of treatment of uncertainty

34
In addition, the uncertainties associated with climate change projection include, such as; - uncertainty inherent in the global warming scenarios themselves; a number of cases are assumed
in connection with the global warming scenarios. - projections made by use of global climate models (GCM) that have differences in projection results
among different global climate models. - uncertainty relates to downscaling needed for the reproduction and projection of river basin scale
rainfall distributions based on projection results made by global climate models (GCM). - uncertainty exists in the prediction of future changes in floodplain vulnerability (e.g., population,
property). Part of this, flood management is needed to be developed with a long-term perspective in Japan. Under MLIT, the International Center for Water Hazard and Risk Management (ICHARM) has developed the Integrated Flood Analysis System (IFAS) as shown in Fig. 3.4 (c). IFAS uses satellite based precipitation data to perform integral analyses, including runoff analysis and calculations of flood propagation in river channels. IFAS distributed by ICHARM is a flood analysis system that utilizes satellite precipitation data and a geographic information system. IFAS makes it possible to perform runoff analyses and flooding analyses of areas where there are few or no ground-based observation stations and precipitation and other basic data are lacking. IFAS, therefore, is thought to be particularly useful in developing countries that do not have adequate ground-based hydrologic observation systems.
Source: Ministry of Land, Infrastructure, Transport and Tourism, Japan (MLIT)
Fig. 3.4 (c): Discharge analysis technology using satellite data
The Ministry of Land, Infrastructure, Transport and Tourism (MLIT) implements a variety of flood control projects to protect life and property from floods. To drain flood waters safely and efficiently, the MLIT improves river channels and constructs floodways and retarding basins. In urban areas, comprehensive MLIT flood protection measures improve the water-retaining and retarding functions of river basins. MLIT projects also improve and construct river channels, regulating basins, underground rivers and also use the dams for flood mitigation. Besides, MLIT assistance covers project finding and formation, promotion of development and transfer of technology, promotion of international exchanges, and dispatching of advisory attaches. For example in Malaysia, technical assistance between Malaysia and Japan by MLIT with Malaysian Government - Department of Irrigation and Drainage (DID), had been undergoing collaborate in the project of, “National Estuary Management Flood Control Planning Comprehensive Muda River Basin Administration Planning”.

35
3.5 Recent Activities/Project Related to Adaptation Measures by JMA, JICA and JAMSTEC Based on this report, three (3) agencies in Japan; Japan Meteorological Agency (JMA), Japan International Cooperation Agency (JICA) and Japan Agency for Marine-Earth Science and Technology (JAMSTEC) had been selected in order to study their recent activities; research project or plan as the adaptation countermeasures of climate change impact, due to reducing the disaster risk in Japan. 3.5.1 Meteorological Operation by Japan Meteorological Department (JMA) Recent years have seen growing concern over world environmental issues such as global warming, ozone layer depletion and acid rain as well as extreme weather events associated with climate change. To address the related issues, Japan Meteorological Agency (JMA) contributes to the development of mitigation and adaptation measures related to climate change in various sectors through the provision of scientific information and expertise on climate change. For this purpose, JMA monitors and analyzes climatic conditions in Japan and around the world as well as greenhouse gas (GHG) concentrations and global average surface temperatures. The Agency publishes the results of numerical projections for future climate conditions obtained using a coupled atmosphere-ocean general circulation model and a regional climate model developed by its Meteorological Research Institute (MRI) to assess the effects of global warming (Fig. 3.5.1(a)). In addition, the Global Environment and Marine Department as one of JMA’s departments was established in July 2005 in order to serves the public through the climate data, marine observation report and environment’s information as dissemination of GHG due to climate change. JMA contributes to international collaboration for the purpose of assessing climate change, particularly through the activities of the Intergovernmental Panel on Climate Change (IPCC), by preparing assessment reports.
Source: Japan Meteorological Agency (JMA)
Fig. 3.5.1(a): Unified Approach for Global Environmental Issues by JMA In the context of climate condition and extreme weather, JMA monitors global climate data through WMO's Global Telecommunication System (GTS). It assembles quality-checked data on temperature and precipitation to assess extreme climate events, and publishes Monitoring Reports on such phenomena with brief descriptions of the resulting disastrous conditions (Fig. 3.5.1(b)). The Agency also monitors the present state of the global climate system (Fig. 3.5.1(c)). These monitoring results are useful in understanding the present climate, including extreme events and long-term trends, and in carrying out long-range forecasts and scientific research such in (Fig.3.5.1 (d) (e) (f)) had been shown in this report.

36
Source: Climate Change Observation Report JMA, 2006 Fig. 3.5.1(b): Extreme High and Low Temperature in Japan
Source: Japan Meteorological Agency (JMA) Fig. 3.5.1(c): Regional Climate Model by JMA
Source: Extreme Weather Report JMA, 2005 Fig. 3.5.1(d): Prediction of Change in Average Temperature in Japan and Surrounding Areas

37
As shown in Fig. 3.5.1(d), the Climate Model Prediction by JMA Extreme Weather Report based on A2 Scenario relatively high emission of CO2 in Japan. The report described the increasing of 2 - 3ºC temperature (4ºC in a part of Hokkaido) and remarkable increase in winter on January compare to summer on July.
Source: Extreme Weather Report JMA, 2005
Fig. 3.5.1(e): Prediction of Change of Numbers of Tropical Day and Extremely Hot Day
Besides in Fig. 3.5.1(e) show the prediction of number of day changes in two situation based in Tokyo, Japan; 23.1 days in tropical night (~days with the minimum temperature over 25ºC) and 45.6 days in tropical day (~days with the maximum temperature over 30ºC) between years of 1971 till 2000. This can be caused by the global warming as an impact of climate change.
Source: Extreme Weather Report JMA, 2005 Fig. 3.5.1(f): Prediction of Change of Yearly Precipitation in Japan
Whereas in Fig. 3.5.1(f) shows the prediction of change of yearly precipitation occur basically all around Japan. It can be summarized from JMA’s report that the precipitation will be increase almost all areas especially in Western Japan about 20% increase related to changing of climate.

38
In addition, JMA had reported based on their forecast of tropical low pressure in Japan, the strong low pressure will be increasing whereas the number of generation will be decreasing. This study is the comparison between the early 21st century and late 21st century, as shown in Fig. 3.5.1(g).
Source: Extreme Weather Report JMA, 2005
Fig. 3.5.1(g): Forecast of Tropical Low Pressure 3.5.2 Capacity Building by Japan International Cooperation Agency (JICA) The Japan International Cooperation Agency (JICA), was established in 1974 is the semi - Japanese Governmental Agency that provides strategic and effective ODA through integrated and comprehensive implementation of Technical Cooperation, Loan Aid and Grant Aid as one of the largest ODA executing agency in the world (Fig. 3.5.2). JICA undertakes many climate change related projects and programs in developing countries through this three schemes.
Source: Japan International Cooperation Agency (JICA)
Fig. 3.5.2: JICA and Japan’s ODA

39
3.5.2(i) Low Carbon and Climate Resilient Development Cooperation JICA has been continuously tackling climate change including both mitigation and adaptation measures in developing countries as a critical part of development issues, based on the “Direction of JICA Operation Addressing Climate Change” announced on October 1, 2008. The approach is basically based upon the following principles as stated in Fig. 3.5.2(i)(a) below.
Source: Japan International Cooperation Agency (JICA)
Fig. 3.5.2 (i) (a): Overall action plans by JICA’s approach to achieving Low Carbon and Climate Resilient Society
Thus, some of the important key-points to be highlight related to this JICA’s approach are;
1. Promoting Integrated Cooperation Addressing Climate Change Measures in Development Cooperation
JICA is promoting integrated cooperation from cross-cutting perspective based on the experience and good practice in previous development cooperation in order to reduce greenhouse gas (GHG) emissions and achieve economic growth in a compatible manner.
2. Aligning Climate Change and Development based on Co-Benefits and Climate Risk-based
Approach
Development cooperation, including financial and technical support is crucial to planning and implementing measures addressing climate change and sustainable development in developing countries. JICA is conducting its development cooperation operations based on Co-Benefits and Climate Risk-based Approach to achieving Low Carbon and Climate Resilient Society
3. Realizing Tangible Development Projects from the Perspective of Climate Change Mitigation and Adaptation
JICA is conducting development cooperation to address both climate change measures and development by effectively utilizing Japan’s cutting- edges technologies including those of the private sector. These activities are focused on development needs of the respective developing countries.
In addition, example of JICA’s project that focused on the adaptation measures were such as, Bali Beach Conservation Project (Indonesia, 2009), Project for Construction of Multipurpose Cyclone
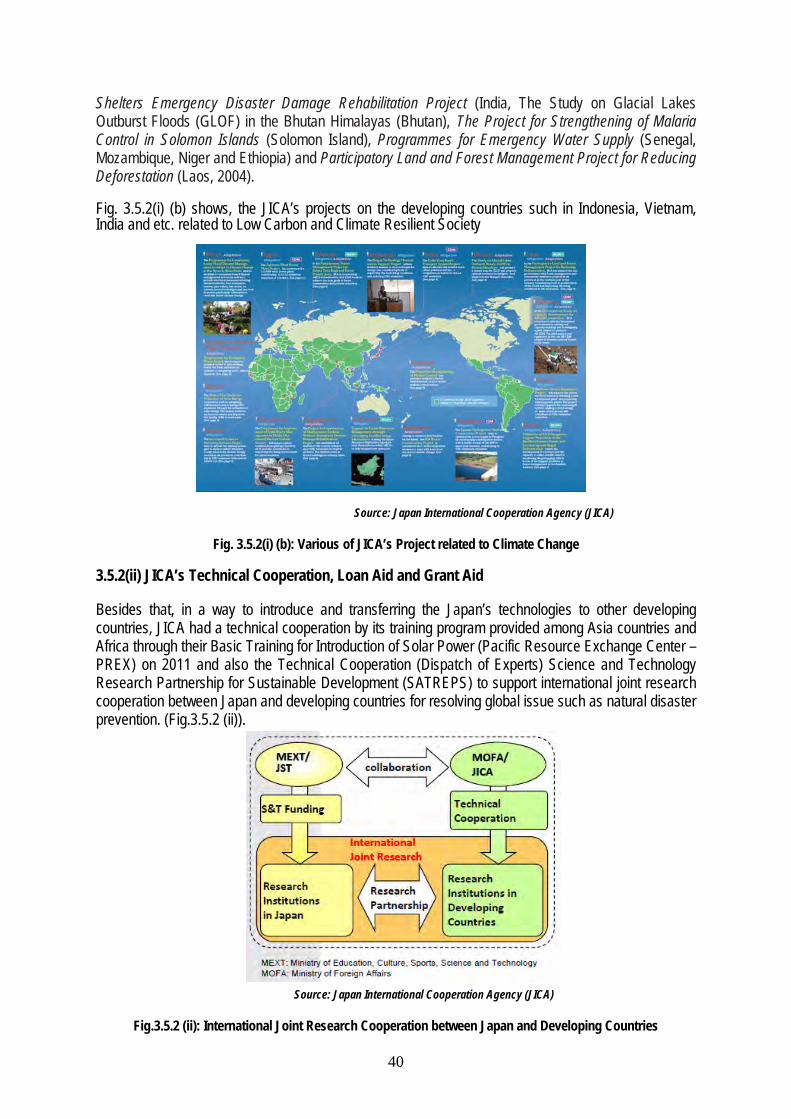
40
Shelters Emergency Disaster Damage Rehabilitation Project (India, The Study on Glacial Lakes Outburst Floods (GLOF) in the Bhutan Himalayas (Bhutan), The Project for Strengthening of Malaria Control in Solomon Islands (Solomon Island), Programmes for Emergency Water Supply (Senegal, Mozambique, Niger and Ethiopia) and Participatory Land and Forest Management Project for Reducing Deforestation (Laos, 2004). Fig. 3.5.2(i) (b) shows, the JICA’s projects on the developing countries such in Indonesia, Vietnam, India and etc. related to Low Carbon and Climate Resilient Society
Source: Japan International Cooperation Agency (JICA)
Fig. 3.5.2(i) (b): Various of JICA’s Project related to Climate Change 3.5.2(ii) JICA’s Technical Cooperation, Loan Aid and Grant Aid Besides that, in a way to introduce and transferring the Japan’s technologies to other developing countries, JICA had a technical cooperation by its training program provided among Asia countries and Africa through their Basic Training for Introduction of Solar Power (Pacific Resource Exchange Center – PREX) on 2011 and also the Technical Cooperation (Dispatch of Experts) Science and Technology Research Partnership for Sustainable Development (SATREPS) to support international joint research cooperation between Japan and developing countries for resolving global issue such as natural disaster prevention. (Fig.3.5.2 (ii)).
Source: Japan International Cooperation Agency (JICA)
Fig.3.5.2 (ii): International Joint Research Cooperation between Japan and Developing Countries

41
Whereas, there are many kinds of loan aid in such area like CDM, energy efficiency, renewal energy promotion and others that had been offered by JICA itself. Perhaps, the grant aid by JICA also includes the Grant Aid (Program Grant Aid for Environment & Climate Change) for Samoa (2010 – 2013): Program for Improving the Weather Forecasting System and Meteorological Warning Facilities in order to enhance the weather forecasting ability and reducing vulnerability to natural disaster through improvement of system and facilities. In Kenya, JICA provided the grant aid through the Program for Community‐based Flood Disaster Management to Adapt to Climate Change in the Nyando River Basin (2009 – 2011). The grant aid provides structural (evacuation facilities) and non‐structural (training) measures to adapt to negative impacts of climate change. 3.5.2(iii) Policy Based Assistance for Climate Change Policy in Developing Countries Climate Change Program Loan (CCPL) under JICA is an innovative scheme to facilitate the implementation of climate change policies through financial and technical assistance for developing countries in alignment with their national development policies and strategies. In Indonesia, JICA had signed a CCPL Agreement on September 2008 as its first case. Through the year 2008, JICA conducted monitoring and also provided advisory services to Indonesia to achieve the secure implementation of their National Action Plan addressing Climate Change. Furthermore, JICA and Indonesia signed their 2nd and 3rd agreements to finance CCPL after modification of the policy matrix to improve effective, feasible and tangible policy actions based on year-round monitoring. Even, JICA also signed the same type of program loan agreement with Vietnam in June 2010. The example of Policy Matrix that had been proposed by JICA’s CCPL scheme as shown in Fig. 3.5.2(iii).
Source: Japan International Cooperation Agency (JICA)
Fig. 3.5.2(iii): Policy Matrix Example proposed by JICA

42
3.5.3 Research Development by Japan Agency for Marine – Earth Science and Technology (JAMSTEC)
Japan Agency for Marine-Earth Science and Technology (JAMSTEC) was inaugurated on April 1, 2004 as one of the independent administrative institutions upon re-organized from its former organization, Japan Marine Science and Technology Center. In context of global climate and related to environmental aspect, JAMSTEC has a wide range of research activities and projects at the international levels around the world. One of their research institutes – “Research Institute of Global Change (RIGC)” that promote international earth observation programs, such as the Global Earth Observation System of Systems (GEOSS), as well as actively participate in the United Nations Intergovernmental Panel on Climate Change (IPCC) is one of the important measures to contribute decision-making on climate change solutions and the enhancement of the earth’s sustainability on a global and human scale, while securing Japan’s presence in the arena of environmental change.
On April1, 2009, the research areas mainly including Institute of Observational Research for Global Change (IORGC) and Frontier Research Center for Global Change (FRCGC) were reorganized as the Research Institute for Global Change (RIGC), and the following seven (7) research programs were established, such;
Ocean Climate Change Research Program
Tropical Climate Variability Research Program
Northern Hemisphere Cryosphere Program
Environmental Biogeochemical Cycle Research Program
Global Change Projection Research Program
Climate Variation Predictability and Applicability Research Program
Advanced Atmosphere-Ocean-Land Modeling Program In particular, the El Nino, the Indian Ocean dipole mode phenomenon, monsoons, and the Madden-Julian Oscillation (MJO) as the major tropical ocean/atmosphere variations - are all mutually interrelated, and have great impact on global weather and short term climate change, hence affect human life and economic activities. Moreover, in the Western Pacific and Indian Ocean, including the Indonesian and Indochina regions, which one of the RIGC’s Program: Tropical Climate Variability Research Program has aims to construct high-precision observation networks of the ocean, atmosphere and land, and to reveal the water cycling mechanism related to the monsoons, from diurnal to annual variability, as well as the mechanism of the Madden-Julian Oscillation (MJO) and its effects. 3.5.3 (i) Promotion at MCCOE by a Japan-Indonesia Collaboration Project In order to clarify the multi-periodic phenomena induced by the land-ocean coexistence, observation networks have been installed both over land and ocean of Indonesian Maritime Continent (IMC) (Fig. 3.5.3(i)(a)) during the two decades under collaborations by Japan Agency for Marine-Earth Science and Technology (JAMSTEC) and Kyoto University in the Japanese side and the Agency for the Assessment and Application of Technology (BPPT), the Indonesian Institute for Space and Aeronautics (LAPAN) and the Meteorological, Climatological and Geophysical Agency (BMKG) in the Indonesian side. This project is coordinated by Professor Manabu D. Yamanaka (JAMSTEC) and his research teams (Yamanaka et al., 2008).

43
Source: Yamanaka et al., 2008
Fig. 3.5.3(i)(a) : Atmospheric and oceanic phenomena generated around Indonesian Maritime Continent (IMC) and affecting global climate. Left panel shows passage of super-could clusters associated with intraseasonal variations (ISV) through IMC. Right panel shows cloud distribution variability dependent on El Niño-Southern Oscillation (ENSO) and Indian-Ocean Dipole Mode (IOD).
On land of IMC, based on several foregoing campaign observations, continuous operations of a radar-profiler network called ‘Hydrometeorological Array for Interaseasonal Variation-Monsoon Automonitoring (HARIMAU)’ have been started (Yamanaka et al., 2008). Over the Indonesian exclusive economic zone (EEZ) surrounding IMC, collaborations of installation and maintenance of buoys, as well as research vessel observations, have been continued as a part of the Global Network of Tropical Ocean Climate Study (TOCS) (Ando et al., 2010).
Source: Yamanaka et al., 2008
Fig. 3.5.3(i)(b): Concept of the Maritime Continent Center of Excellence (MCCOE)

44
Thus, the International Center of Tropical Climatology, Meteorology and Oceanography, called "Maritime Continent Center of Excellence" (MCCOE) (Fig. 3.5.3 (i) (b)) is being started to install in Jakarta, Indonesia by a project under the Science and Technology Research Partnership for Sustainable Development (SATREPS) of Japanese funding agencies (JICA and JST) in year 2010 and will be supported fully by the Indonesian Government after completion in 2014. Besides, the MCCOE has three (3) functions, including the observation center maintaining/operating radar (HARIMAU) and buoy (TOCS) networks, a data center collaborating with BPPT's data integration facility (NEONET), and a research center promoting advanced studies concerning the climatological sciences of IMC together with international visitors. In Advanced Atmosphere-Ocean-Land Modeling Program, JAMSTEC contribute to the prediction of global climate change over the middle and long term. To achieve their aims, they develop extremely precise numerical models which will be able to run on future computers that will emerge over the next five (5) to ten (10) years. The accurate simulation of important processes found in the atmosphere, ocean, and on land had been focused in a way to consider uncertainty that still exists in weather forecasting and the prediction of climate change. In addition, JAMSTEC has set "Leading Project" aside from usual research sections, to focus on research development tasks which the government takes its initiative, e.g., development of real-time monitoring system for massive ocean-trench earthquake, active contribution to the IPCC Fifth Assessment Report (AR5), and research for submarine resources and recyclable energies with upgrading of exploration technologies. Focusing in the Global Warming Projection Research Project for Contribution to AR5 of IPCC, the project is to perform a part of below researches:
Contract Research requested by MEXT: "Innovative Program of Climate Change Projection for the 21st Century" (Fig. 3.5.3(i)(c)).
Contract Research requested by Environment Ministry: "Policy-support to Global Warming and total research which relates to the climate change scenario in order to prevalence and enlightenment"
Source: http://www.jamstec.go.jp/kakushin21
Fig. 3.5.3(i) (c): Official Website of "Innovative Program of Climate Change Projection for the 21st Century"
By using the super computer "Earth Simulator" (Fig. 3.5.3(i)(d)), the researches of sophisticated global warming prediction model, cutting down of prediction uncertainty, and impact assessment of natural disaster are driven forward and are contributed to the IPCC 5th Evaluation Report. Moreover, the Earth Simulator, which was developed, as a National Project of Government of Japan, by the three (3) governmental agencies such as, National Space Development Agency of Japan (NASDA), the Japan Atomic Energy Research Institute (JAERI), and Japan Marine Science and Technology Center (JAMSTEC).

45
Source: Japan Agency for Marine-Earth Science and Technology (JAMSTEC)
Fig. 3.5.3(i) (d): Earth Simulator (ES) - National Project of Japan’s Government

46
Chapter 4 : Malaysia as Developing Country faced the Climate Change 4.1. Malaysia’s Climate Malaysia’s climate is a tropical climate with uniform temperature (maximum = 33C, minimum = 23C) in high humidity where situated in equatorial doldrums area. It is divided into two (2) seasons which are Southwest Monsoon, Northeast Monsoon and two (2) shorter periods of Inter-monsoon seasons. Malaysia (as shown in Fig. 4.1) is geographically located just outside the “Pacific Rim of Fire” and is generally free from severe natural disasters such as earthquake, volcanic eruption and typhoon. Although Malaysia is spared from the threats of severe natural disasters and calamities, Malaysia is nonetheless not spared from other disasters such as flood, man-made disaster, landslide and severe haze.
Fig. 4.1: Map of Malaysia The climate of Malaysia is tropical and humid. It is very much influenced by the mountainous topography and complex land-sea interactions. Intraseasonal and interdecadal fluctuations such as the ENSO, IOD and MJO are known to significantly influence the interannual climate variability of Malaysia. Increase in tropical storms in the South China Sea have contributed to more extreme events of rainfall and gusting in both East and West Malaysia. Annual trend analysis of both temperature and rainfall has been carried out by analyzing both the temperature and rainfall data for Malaysia over the last 40 years (1968-2007). 4.1.1 Temperature Analysis by Malaysian Meteorological Department (METMalaysia) Adaptive from METMalaysia’s Research on Climate Change Scenarios for Malaysia (2001 – 2099), Fig. 4.1.1 (a) shows the annual mean temperature of four meteorological stations all around Malaysia; Kuching, Kota Kinabalu, Kuantan and Petaling Jaya Meteorological Stations that were collected by METMalaysia to represent Sarawak, Sabah, East Peninsular Malaysia and West Peninsular Malaysia respectively. The temperature trends for the stations which also represent the four different geographical locations that were plotted. The climatic data was being able to capture more than 80% of the climate variation for a given region. As a result, all the four stations indicated an increasing temperature trend where most of the stations recorded new surface temperature maximum in 1972, 1982 and 1997. Nevertheless, it indicates consistent significant temporal variation in annual mean temperatures for all the regions. From 1970 to 2004, strong El Niño events were recorded in 1972, 1982, 1987, 1991 and 1997. Thus, Western Peninsular Malaysia and Sabah show higher recorded temperatures than Eastern Peninsular Malaysia and Sarawak.
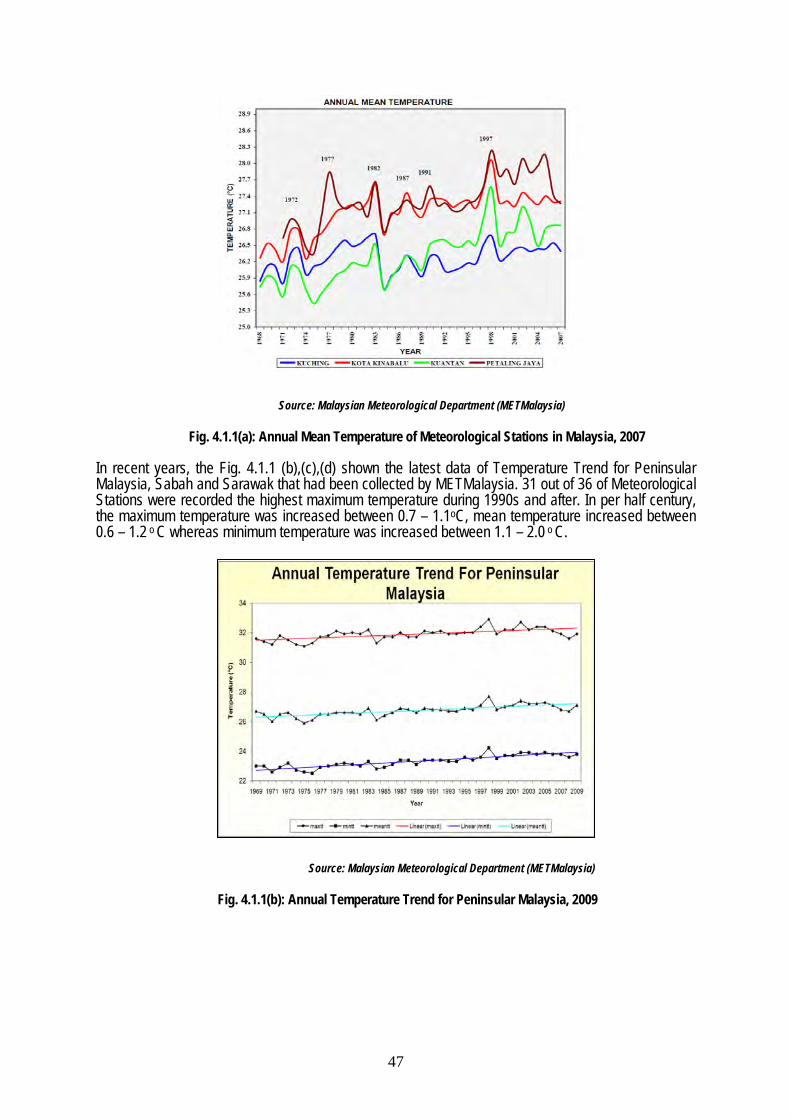
47
Source: Malaysian Meteorological Department (METMalaysia)
Fig. 4.1.1(a): Annual Mean Temperature of Meteorological Stations in Malaysia, 2007
In recent years, the Fig. 4.1.1 (b),(c),(d) shown the latest data of Temperature Trend for Peninsular Malaysia, Sabah and Sarawak that had been collected by METMalaysia. 31 out of 36 of Meteorological Stations were recorded the highest maximum temperature during 1990s and after. In per half century, the maximum temperature was increased between 0.7 – 1.1oC, mean temperature increased between 0.6 – 1.2 o C whereas minimum temperature was increased between 1.1 – 2.0 o C. Source: Malaysian Meteorological Department (METMalaysia)
Fig. 4.1.1(b): Annual Temperature Trend for Peninsular Malaysia, 2009

48
Source: Malaysian Meteorological Department (METMalaysia)
Fig. 4.1.1(c): Annual Temperature Trend for Sabah – East Malaysia, 2009
Source: Malaysian Meteorological Department (METMalaysia)
Fig. 4.1.1 (d): Annual Temperature Trend for Sarawak – East Malaysia, 2009 4.1.2 Rainfall Analysis by Malaysian Meteorological Department (METMalaysia) The rainfall analysis had been studies that were based on meteorological stations data from 1951 to 2005 as shown in the Fig. 4.1.2 (a) and Fig.4.1.2 (b) the standardized rainfall anomaly for Peninsular Malaysia and East Malaysia respectively. This standardized anomaly was obtained by normalizing the annual rainfall anomaly with the standard deviation of the total period considered. The El Niño and La Niña occurrences during this period are also indicated to better understand the impact of these events on the rainfall patterns of Malaysia.

49
In Peninsular Malaysia, reduction in rainfall is recorded for the second half of the period considered above. Dry years observed from 1975 to 2005 are more frequent and intense as compared to those of 1951 to 1975 (Fig. 4.1.2 (a)). Most 13 of the El Niño events as of 1970 have resulted in severely dry years for Peninsular Malaysia. The three driest years for Peninsular Malaysia (1963, 1997 and 2002) have been recorded during El Niño events. Nevertheless, the El Niño phenomenon alone cannot be responsible for dry spells over Peninsular Malaysia, as quite a number of equally relatively dry years have been recorded during the absence of the El Niño. However, most La Nina events have resulted in wet years for Peninsular Malaysia with the exception of 1998 and 1955. Source: Climate Change Scenarios for Malaysia (2001 – 2099), METMalaysia
Fig. 4.1.2(a) : Long Term Standardized Rainfall Anomaly for Peninsular Malaysia Neither an increasing nor decreasing trend for rainfall was found for East Malaysia during the observed 50 years period (Fig. 4.1.2(b)). Nevertheless the intensity and frequency of the dry years as of 1970 have increased when compared to those of the earlier period. Though the dry years are more frequent than the wet years, the intensity of rainfall increase during the wet years is comparable to those of the decrease in rainfall during the dry years. The La Nina phenomenon is responsible for the three wettest years recorded (1984, 1988 and 1999) for East Malaysia. Most of the relatively severe dry spells in East Malaysia were recorded during the El Niño events except 1978, 1990 and 1992. The El Niño events have greater influence in rainfall reduction in East Malaysia as compared to Peninsular Malaysia. Source: Climate Change Scenarios for Malaysia (2001 – 2099), METMalaysia
Fig. 4.1.2(b): Long Term Standardized Rainfall Anomaly for East Malaysia

50
Whereas, the latest data of annual rainfall trend from years of 1951 till year 2010 were collected as shown in Fig. 4.1.2 (c),(d),(e) below for each regions in Malaysia. In conclusion, no overall clear trend of rainfall for the country unless high variability of rainfall probably due to tropical climate. Source: Malaysian Meteorological Department (METMalaysia)
Fig. 4.1.2 (c): Annual Rainfall Trend for Peninsular Malaysia, 2010
Source: Malaysian Meteorological Department (METMalaysia)
Fig. 4.1.2 (d): Annual Rainfall Trend for Sabah – East Malaysia, 2010
0
500
1000
1500
2000
2500
3000
3500
4000
4500
1951
1953
1955 95
7959
1961
1963
1965
1967 96
997 97
3
1975
1977
1979
1981
1983
1985
1987
1989
1991
1993
1995
1997
1999
2001
2003
2005
2007
2009
2011
Rainfall (mm)
Year
Peninsular Malaysia Annual Rainfall Trend(1951 - 2010)
Annual Rainfall Linear (Annual Rainfall)
0500
10001500200025003000350040004500
1951
1953
955
1957
1959
96 1963
1965
1967
1969
97 1973
1975
1977
1979
1981
1983
1985
987
1989
1991
1993
1995
1997
1999
2001
2003
2005
2007
2009
2011
Rainfall (mm)
Year
Sabah Annual Rainfall Trend(1951 - 2010)
Annual Rainfall Linear (Annual Rainfall)
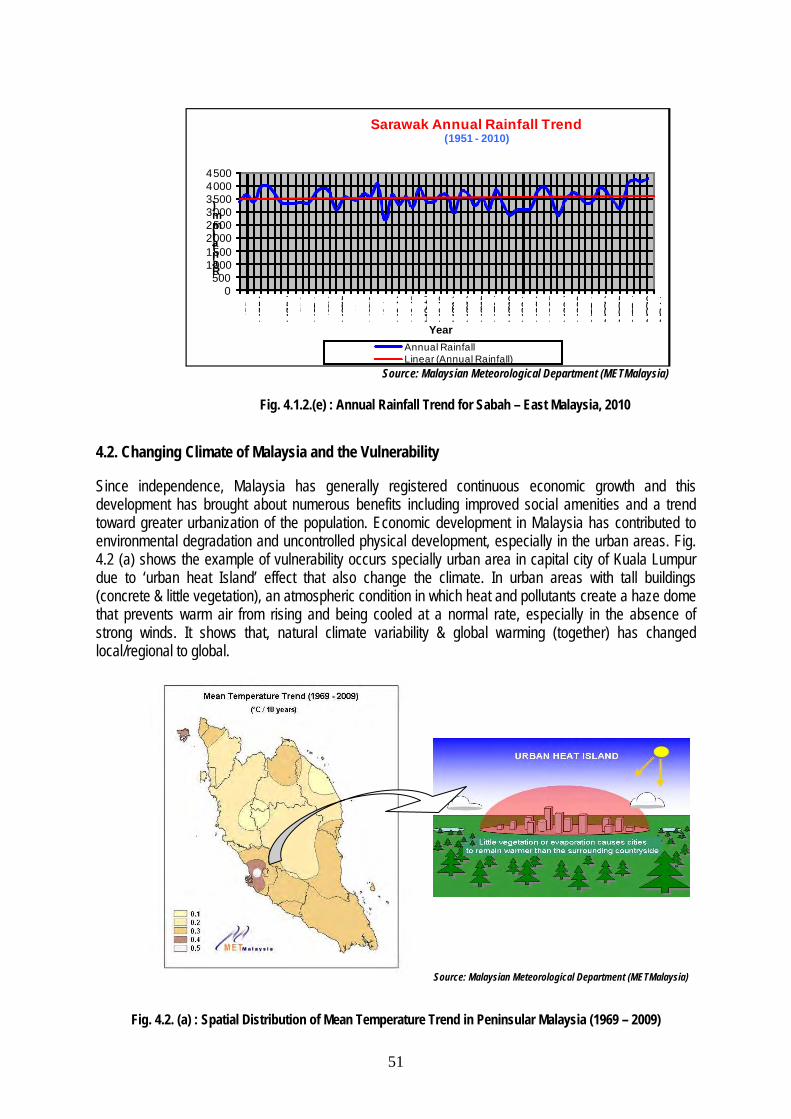
51
Source: Malaysian Meteorological Department (METMalaysia)
Fig. 4.1.2.(e) : Annual Rainfall Trend for Sabah – East Malaysia, 2010 4.2. Changing Climate of Malaysia and the Vulnerability Since independence, Malaysia has generally registered continuous economic growth and this development has brought about numerous benefits including improved social amenities and a trend toward greater urbanization of the population. Economic development in Malaysia has contributed to environmental degradation and uncontrolled physical development, especially in the urban areas. Fig. 4.2 (a) shows the example of vulnerability occurs specially urban area in capital city of Kuala Lumpur due to ‘urban heat Island’ effect that also change the climate. In urban areas with tall buildings (concrete & little vegetation), an atmospheric condition in which heat and pollutants create a haze dome that prevents warm air from rising and being cooled at a normal rate, especially in the absence of strong winds. It shows that, natural climate variability & global warming (together) has changed local/regional to global.
Source: Malaysian Meteorological Department (METMalaysia)
Fig. 4.2. (a) : Spatial Distribution of Mean Temperature Trend in Peninsular Malaysia (1969 – 2009)
0500
10001500200025003000350040004500
95 1953 95
5
1957 95
9
1961 96
3
1965 96
7
1969 97 19
73
1975
1977
1979
1981
1983
1985
1987
1989
1991
1993
1995
1997
1999
2001
2003
2005
2007
2009
2011
Rainfall (mm)
Year
Sarawak Annual Rainfall Trend(1951 - 2010)
Annual RainfallLinear (Annual Rainfall)

52
Protection of the environment has become a necessity rather than a luxury in order to maintain public health and well-being as well as to sustain the economic growth. As in most developing countries, there are many challenges facing the country, especially in urban areas. One major challenge is the increasing occurrence of geological and flood-related disasters, causing property damage and high cost of maintenance as well as loss of lives, in extreme cases like such disasters. In the recent years, the occurrence of extreme weather events in Malaysia has been increased. The winter monsoon of 2006/2007 and 2007/2008 brought in heavy rainfall and caused severe floods in Malaysia. The heavy rainfall during the winter monsoon of 2006/2007 was the worst ever recorded over southern Peninsular Malaysia. Other extreme events such as flash floods, strong winds and waterspouts have become more frequent over the recent years. The socio-economic impacts of these extreme events have been a cause for concern for the country. Thus, the climate change is real and the impacts are being felt in Malaysia e.g. floods, haze which causes losses in revenue and productivity and health risk to the people. As we know that, climate change is due to the increase in GHG emission especially in CO2. CH4, N2O etc which causes changes in ambient temperature, extreme weather events, rise in sea water level; rapid long term changes in weather patterns induced by human activities. Fig. 4.2(b) shows the extreme events that had occurred in various areas in Peninsular Malaysia – severe flood in Johor (2011), haze in Kuala Lumpur (2004), drought in Kelantan (2010) and severe flood in Kedah (2010). At East Malaysia – the water spout had occurred at Kudat (2006) and drought in Sarawak (2009). Source: Malaysian Meteorological Department (METMalaysia)
Fig.4.2 (b): Extreme Weather Occurred in Malaysia
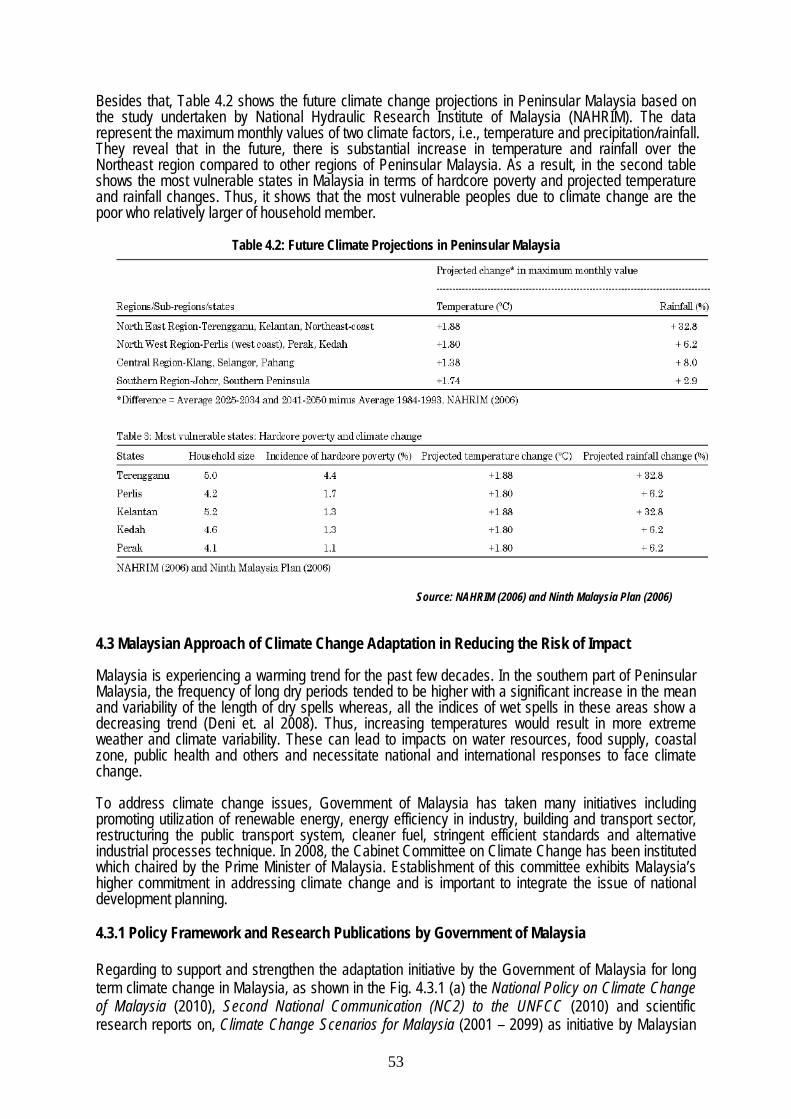
53
Besides that, Table 4.2 shows the future climate change projections in Peninsular Malaysia based on the study undertaken by National Hydraulic Research Institute of Malaysia (NAHRIM). The data represent the maximum monthly values of two climate factors, i.e., temperature and precipitation/rainfall. They reveal that in the future, there is substantial increase in temperature and rainfall over the Northeast region compared to other regions of Peninsular Malaysia. As a result, in the second table shows the most vulnerable states in Malaysia in terms of hardcore poverty and projected temperature and rainfall changes. Thus, it shows that the most vulnerable peoples due to climate change are the poor who relatively larger of household member.
Table 4.2: Future Climate Projections in Peninsular Malaysia
Source: NAHRIM (2006) and Ninth Malaysia Plan (2006)
4.3 Malaysian Approach of Climate Change Adaptation in Reducing the Risk of Impact Malaysia is experiencing a warming trend for the past few decades. In the southern part of Peninsular Malaysia, the frequency of long dry periods tended to be higher with a significant increase in the mean and variability of the length of dry spells whereas, all the indices of wet spells in these areas show a decreasing trend (Deni et. al 2008). Thus, increasing temperatures would result in more extreme weather and climate variability. These can lead to impacts on water resources, food supply, coastal zone, public health and others and necessitate national and international responses to face climate change. To address climate change issues, Government of Malaysia has taken many initiatives including promoting utilization of renewable energy, energy efficiency in industry, building and transport sector, restructuring the public transport system, cleaner fuel, stringent efficient standards and alternative industrial processes technique. In 2008, the Cabinet Committee on Climate Change has been instituted which chaired by the Prime Minister of Malaysia. Establishment of this committee exhibits Malaysia’s higher commitment in addressing climate change and is important to integrate the issue of national development planning. 4.3.1 Policy Framework and Research Publications by Government of Malaysia Regarding to support and strengthen the adaptation initiative by the Government of Malaysia for long term climate change in Malaysia, as shown in the Fig. 4.3.1 (a) the National Policy on Climate Change of Malaysia (2010), Second National Communication (NC2) to the UNFCC (2010) and scientific research reports on, Climate Change Scenarios for Malaysia (2001 – 2099) as initiative by Malaysian

54
Meteorological Department (METMalaysia) were published. This is to ensure climate-resilient development that fulfils the national aspirations for sustainability. The Government recognizes that the impacts of climate change transcend all levels, sectors, stakeholders and major groups. Therefore, institutional capacity for implementation can only be made effective through collaborative participation, based on indigenous and scientific knowledge.
Fig. 4.3.1 (a): Adaptation initiatives by Government of Malaysia Over the years, Malaysia had adopted “precautionary principle” policies with actions to mitigate or adapt to climate change. Therefore, the National Policy on Climate Change was approved by the Cabinet on November 20, 2009 under Ministry of Natural Resources and Environment Malaysia (NRE) to promote
Second National Communication (NC2) to the
UNFCC (2010)
National Policy on Climate Change
(2010)
Modeling on Climate Change Scenarios for Malaysia
(2001 – 2099)
Climate Change on Hydrologic Regime & Water Resource of
Peninsular Malaysia (2006)

55
the implementation of both adaptation and mitigation in an integrated and balanced manner. The National Policy serves as the framework to mobilize and guide government agencies, industry, community as well as other stakeholders and major groups in addressing the challenges of climate change in a concerted and holistic manner. This policy is a product of the Policy Study on Climate Change funded under the Ninth Malaysia Plan jointly implemented by the Conservation and Environmental Management Division (CEMD) and Institute for Environment and Development (LESTARI), Universiti Kebangsaan Malaysia (UKM). The formulation process encompassed five phases of stakeholder consultation involving about 1000 individuals from institutions in Peninsular Malaysia, Sabah and Sarawak. Fig.4.3.1 (b) shows the summarization some of key-points in the National Policy on Climate Change of Malaysia.
Fig.4.3.1 (b): Overall Framework of National Climate Change Policy in Malaysia
In Second National Communication (NC2) to the UNFCC (2010) report in reducing the natural disaster risk, it stated that amendment to government policy and research and development activities are two possible options and paths to be adopted as adaptation measures for coastal and marine sector due to climate change, in particular sea level rise, intensity, duration, & frequency of storms and sea temperature. Besides that, flood is always an issue in water resources sector in Malaysia. Better flood mitigation measures and drainage systems would be one of the adaptation measures. Flood management and design will also be reviewed, thus, the facilities will be able to withstand the climate change especially during extreme weather. Moreover, the structural safety and integrity will also be
Objectives and Principles of National Policy Climate
Change in Malaysia
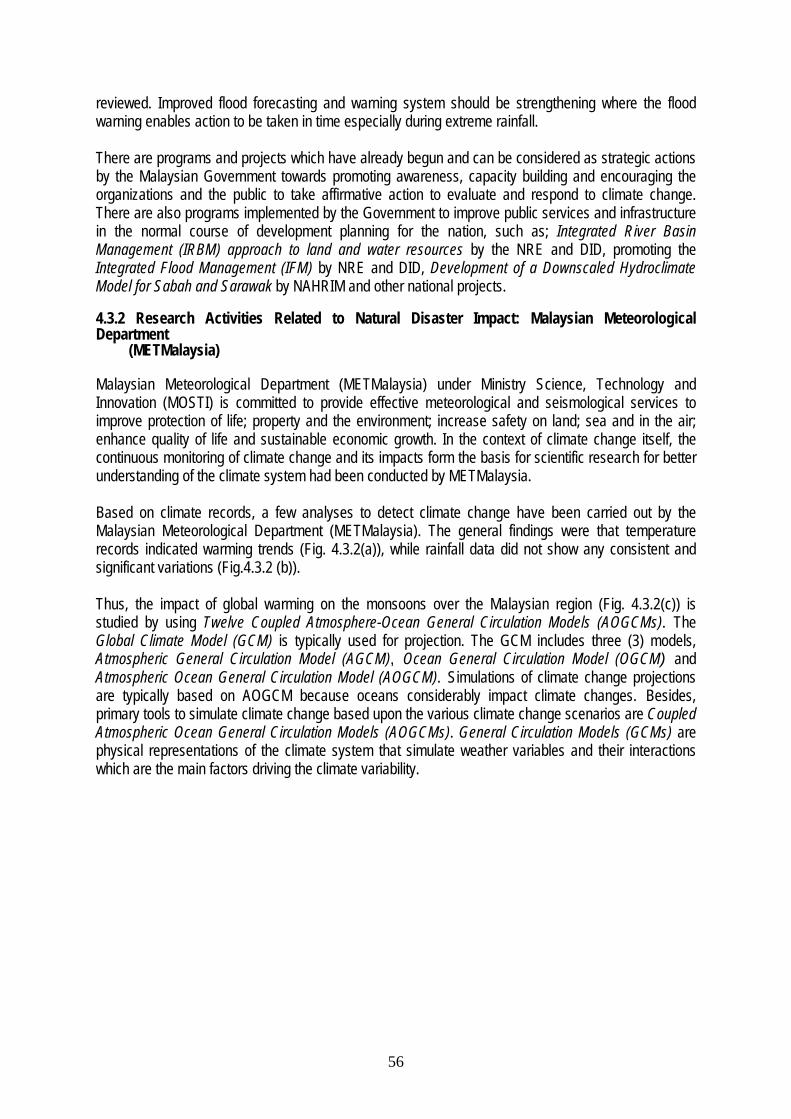
56
reviewed. Improved flood forecasting and warning system should be strengthening where the flood warning enables action to be taken in time especially during extreme rainfall. There are programs and projects which have already begun and can be considered as strategic actions by the Malaysian Government towards promoting awareness, capacity building and encouraging the organizations and the public to take affirmative action to evaluate and respond to climate change. There are also programs implemented by the Government to improve public services and infrastructure in the normal course of development planning for the nation, such as; Integrated River Basin Management (IRBM) approach to land and water resources by the NRE and DID, promoting the Integrated Flood Management (IFM) by NRE and DID, Development of a Downscaled Hydroclimate Model for Sabah and Sarawak by NAHRIM and other national projects. 4.3.2 Research Activities Related to Natural Disaster Impact: Malaysian Meteorological Department (METMalaysia) Malaysian Meteorological Department (METMalaysia) under Ministry Science, Technology and Innovation (MOSTI) is committed to provide effective meteorological and seismological services to improve protection of life; property and the environment; increase safety on land; sea and in the air; enhance quality of life and sustainable economic growth. In the context of climate change itself, the continuous monitoring of climate change and its impacts form the basis for scientific research for better understanding of the climate system had been conducted by METMalaysia. Based on climate records, a few analyses to detect climate change have been carried out by the Malaysian Meteorological Department (METMalaysia). The general findings were that temperature records indicated warming trends (Fig. 4.3.2(a)), while rainfall data did not show any consistent and significant variations (Fig.4.3.2 (b)). Thus, the impact of global warming on the monsoons over the Malaysian region (Fig. 4.3.2(c)) is studied by using Twelve Coupled Atmosphere-Ocean General Circulation Models (AOGCMs). The Global Climate Model (GCM) is typically used for projection. The GCM includes three (3) models, Atmospheric General Circulation Model (AGCM), Ocean General Circulation Model (OGCM) and Atmospheric Ocean General Circulation Model (AOGCM). Simulations of climate change projections are typically based on AOGCM because oceans considerably impact climate changes. Besides, primary tools to simulate climate change based upon the various climate change scenarios are Coupled Atmospheric Ocean General Circulation Models (AOGCMs). General Circulation Models (GCMs) are physical representations of the climate system that simulate weather variables and their interactions which are the main factors driving the climate variability.

57
Source: Climate Change Scenarios for Malaysia (2001 – 2099), METMalaysia
Fig. 4.3.2(a): Annual Mean Temperature Anomaly Relative to 1990 - 1999 Source: Climate Change Scenarios for Malaysia (2001 – 2099), METMalaysia
Fig. 4.3.2 (b): Annual Mean Rainfall Anomaly Relative to 1990 – 1999
Source: Malaysian Meteorological Department (METMalaysia)
Fig. 4.3.2 (c): Results of the climate projection - research studies by METMalaysia

58
The regional climate modeling simulations are done using the Providing Regional Climates for Impacts Studies (PRECIS) RCM where PRECIS RCM, which is developed by the Hadley Centre, United Kingdom Meteorological Office. The HadCM3 AOGCM is based upon the A1B scenario, where A1B scenario describes the direction of technological change in the energy system as being a balance between fossil intensive and non-fossil energy sources. The AOGCMs used in the study are from the contribution of the Coupled Model Inter-comparison Project (CMIP) to the IPCC 4th Assessment Report. As an important role in context of education and awareness related to climate change, METMalaysia was hosted several seminars and international conferences such as; InterRegional Workshop on Policy Aspects of Climate Change, that was held from 19 to 21 April 2010, in Petaling Jaya, Malaysia. The participants included Representatives of Malaysian and International Partner Organizations, Permanent Representatives with WMO, National Meteorological Services (NMSs), and the WMO Secretariat. On October 04, 2011 Malaysian Meteorological Department (METMalaysia) was also organized the National Climate Forum - Winter Monsoon 2011/2012 at the METMalaysia headquarters, Petaling Jaya. 4.3.3 Research Plan Related to Water-Resource Impact: National Hydraulic Research Institute of Malaysia (NAHRIM) The National Hydraulic Research Institute of Malaysia or NAHRIM was setup in September, 1995 under Ministry of Natural Resources and Environment (NRE) with capabilities in both physical and numerical simulations of hydrodynamic, morphological and ecological processes and their interactions with human activities.
Source: www.nahrim.gov.my
Fig. 4.3.3: Logo and National Hydraulic Research Institute of Malaysia (NAHRIM)
NAHRIM has a team of experienced researchers in coastal and river engineering hydraulics, water resources and water environment to meet the challenges that lie ahead. In climate change aspect, they conducted climate change projection for Malaysia using Regional Hydro-Climate. Their research studied on climate change related to water resource, such as;
Study of the Impact of Climate Change on the Hydrologic Regime & Water Resources of Peninsular Malaysia (2006)
Study of the Impact of Climate Change on the Hydrologic Regime & Water Resources of Sabah and Sarawak (2007-2010)
The case study on MUDA and Barat Laut Selangor was focus on impact assessment of climate change on irrigation and water supply scenario using the regional hydrologic-atmospheric model (RegHCM-PM) of Peninsular Malaysia. NAHRIM also has proposed to implement the affirmative climate change programs for duration of 5 years. They also conducted many research paper publications such Technical Research Publication No. 1(TRP No. 1): Derivation of Probable Maximum Precipitation (PMP) for Design Flood in Malaysia, Sg. Selangor Flood Simulation Project (on-going in process),
59
Bunds Breach Analysis for Kerian River Flood, Coastal Zone Stabilization, Restoration and Enhancement through Mangrove Forest Establishment, Drought in Malaysia: A Look at Its Characteristics, Impacts, Related Policies, and Management Strategies and others. Furthermore, NAHRIM offers specialist consultancy services in project planning and impact assessment in all facets of hydraulic engineering encompassing river and coastal engineering, water resources and the water environment. Its main clients involved both the public and private sectors in the water-related industry. Thus, NAHRIM was highlighted on the urgent need to develop a vulnerability and adaptation process and procedures as well as to conduct further research and data collection for a quantified and qualified development of options and decision-making.
4.3.4 Flood Mitigation Projects by Department of Irrigation and Drainage (DID), Malaysia
The responsibility for water resources planning and development in Malaysia is shared by various government agencies, such Ministry of Natural Resources and Environment (NRE), Ministry of Health (MOH), Public Works Department (PWD), Ministry of Housing and Local Government and other water supply companies or privatized. In hydrological context, the Department of Irrigation and Drainage (DID) under Ministry of Natural Resources and Environment (NRE), is responsible for the planning, implementing and operation of irrigation, drainage and flood control projects throughout the country. Besides, DID were taken new and expanded task of River Basin Management and Coastal Zone, Water Resources Management and Hydrology, Special Projects, Flood Management and Eco-friendly Drainage. Related to that, Department of Irrigation and Drainage (DID) has installed and operated 525 telemetric stations in 38 river basins. Additionally, 670 manual river gauges, 1013 stick gauges and 182 flood warning boards have been set up in flood prone areas to provide crucial information during the flood season. Operations of 395 automatic flood-warning sirens are an integral part of the local flood warning system being operated.
An Integrated Flood Forecasting and River Monitoring System (IFFRM) for the Klang Valley inclusive of a flood modelling system is nearing completion. Included in the infrastructure networks which have been completed are 88 new telemetric systems. An Integrated Flood Forecasting and Warning System for the Muda River Basin in Northern Peninsular Malaysia is also being developed simultaneously. This includes developing a radar rainfall analyzer and integrator for Malaysia (RAIM), which feeds information to a real- time flood forecasting system which is already in place in 13 river basins throughout the country. Upon completion, this project will be extended to the Kelantan, Pahang and Johor river basin. On another note, flood forecasting models in the Johor, Muar and Batu Pahat river basins are being upgraded to the real-time computerized HEC-HMS model.
4.3.4 (i) Atmospheric Model-Based Rainfall & Flood Forecasting System (AMRFF) To improve the efficiency of flood forecasting in Malaysia, DID has embarked on the Atmospheric Model-Based Rainfall & Flood Forecasting System (AMRFF) project. This project is to be completed by November 2010. Until January 2011, the progress of the project is 60% had been reported. Furthermore, there are two (2) objectives to implement it, such: To develop real-time flood forecasting based on Atmospheric Model-based Rainfall and Flood
Forecasting (AMRFF) System for providing a real-time flood warning and emergency responses in a convenient lead-time to the Pahang, Kelantan and Johor River Basins.
To develop radar rainfall analyzer and integrator for Malaysia (RAIM) to estimate rainfall distribution and the rainfall magnitude forecast in the Pahang, Kelantan and Johor River Basins.

60
Upon completion, this project will be able to provide a sufficient lead time for flood management in the Pahang, Kelantan and Johor River Basins. 4.3.4. (ii) Flood Forecasting and Warning (Operation) Flood forecasting operations were carried out during the flood seasons by the respective DID state offices with technical assistance from the National Flood Forecasting Centre at DID Head Quarters. The river basins which have been provided with forecasting models are summarized in Table 4.3.4 (ii).
Table 4.3.4 (ii) : The river basins with forecasting models.
Source: Department of Irrigation and Drainage (DID), Malaysia
Besides that, the Stormwater Management and Road Tunnel Project (SMART) in Kuala Lumpur which was completed in July 2007 had successfully reduced flooding incidences in the Kuala Lumpur City Centre. It had successfully managed to divert potential flood waters from the city centre during many severe weather events.

61
4.3.5. Case Study of Iskandar Malaysia as Sustainable Eco Planning City: University Technology of Malaysia, Johor
Malaysia will continue to experience a rapid increase of CO2 emissions. It is expected that emissions will continue at a high rate with relatively high rates of population and economic growth. In order to tackle the issue of CO2 emission, there is a need for global and national strategies for sustainability in urban environment in both existing and newly developments of the country. Thus, planning of sustainable regions involves creation of Low Carbon Society (LCS) by promoting low carbon emission is needed as had been created in Japan. The Low Carbon Society Project has been initiated by Japan/UK collaboration to draw out comprehensive vision. Case study of transforming the Iskandar Malaysia (IM) that situated at Johor state in Malaysia into environmentally sustainable urban region as one the Low Carbon Society (LCS)’s concept had been studied by the researchers of Technology University of Malaysia (UTM), Skudai Johor (C.-S. Ho & W-K.Fong et.,al). In the study, CO2 emissions from energy use in IM have been estimated based on an integrated approach, using the System Dynamics Model (SDM). The Iskandar Malaysia (IM) hopefully in future, could showcase a prototype of a green and sustainable urban region to achieve carbon reduction. Iskandar Malaysia (IM) had been chosen because of the natural and green environment that covers a total of more than 150,000 ha of green spaces including forests, mangrove areas, parks and open spaces as well as a agricultural areas. All the green spaces play an important role as a carbon sink for this region. One of the key thrusts of IM is to create livable communities that encompass quality green building and housing, adequate facilities, quality services and a healthy, safe and lively environment as a new growth centre within the Special Economic Corridor (SEC) in Malaysia. They are three (3) policies stated in the master plan for IM known as Comprehensive Development Plan for South Johor Economic Region (2006 – 2025) which have direct impact on low carbon scenario of the IM development. These policies are energy efficient building, sustainable land use and transportation, natural and green environment.
Fig. 4.3.5 : Iskandar Malaysia (IM) Project Table 4.3.5 below shows as in term of CO2 emissions/per capita, the present level of emission rate is quite low in Iskandar Malaysia (IM) only about 4.9 metric tons per capita, which is well lower than the major cities in the developed countries such as Tokyo (5.8 metric tons per capita) and Greater London (6.9 metric tons per capita).

62
Table 4.3.5: CO2 emissions from energy use in IM in comparison with Tokyo and Greater London, 2005 Source: TMG (2006) Therefore as proactive measure, planning for low carbon city measures should be adopted in the planning and implementation of Comprehensive Development Plan for South Johor Economic Region (2006 – 2025) to ensure a more sustainable urban conurbation in south Johor where the Iskandar Economic Region located.

63
5.0 Recommendation and Future Plan Adaptation of climate change in order to reduce the risk of disaster requires a realistic and competent planning and policies that can be improves the response to the effects of a disaster such climate change in long term period. The policy frameworks have to include the cooperation and network between national level, local government, private sector and community participation in adapting the climate change and disaster preparedness planning. In a way to enhance and strengthen the adaptation, there are five (5) guiding principles that should be understand which consist of sustainable development, resilience, governance, knowledge and information sharing, and economics and financing. Effective adaptation measures should be proposed by investigating the impacts of climate change, conducting investigations from rational, efficient and effective viewpoints, and aiming for minimizing damages, such as avoiding destructive damages. In addition, adaptation measures related to natural disaster in the country should be designed, considering issues and problems; for example of existing flood control structures, to improve flood control measures in country for the safety of the society.
As in the report, we can observed that from the data and prediction results between Japan and Malaysia have shown the trends of increasing temperatures and increased frequencies of heavy precipitation events. Although the phenomena of climate had been changing are not or only partly understood by the prediction of data and climate projection for the future, the National Government must draw up appropriate adaptation measures by asking opinions of experts before it is too late since it is a basic duty of the National Government to seek for the safety and security of the citizens. In some advanced countries like in US, Europe countries, Japan and others, the National Governments have already decided or started investigating adaptation measures. Adaptation measures should be planned using a ‘flexible approach’ by which adaptation measures will be revised based on future observation data and accumulated knowledge about impacts of climate change on sea level, precipitation and river flow. Thorough consideration should also be paid on social conditions, such as population decrease, aging of population, decline of birthrate, and changes in land use, and circumstances related to water-control works, such as available funds, improvement levels of structures, and water-control plans and works taken in the past. As a developing country like Malaysia, we had to face the vulnerability of climate change day by day rather than developed country as Japan. In Malaysia, the integration between disaster risk reduction and climate change adaptation is making a significant progress. The National Policy on Climate Change of Malaysia that was approved on 2009 in order to mainstream the climate resilient development into different levels of Government. In spite of the absence of cap on emission, Malaysian Government has been continuously promoting environmental stewardship in all its development plans. Under 10th Malaysia Plan (2011- 2015) that had been announced in Malaysia Budget Plan on October 07, 2011 by the Prime Minister, the Government of Malaysia will introduced a new tariff called, Feed – in Tariff (FiT) to support renewable energy efforts due to climate change issue. As such, there will be an establishment of a Renewable Energy Fund from the FiT and to be administered by a special agency, the Sustainable Energy Development Authority under the Energy, Green Technology and Water Ministry. The Renewable Energy Act is currently being drafted by the Energy, Green Technology and Water Ministry and the bill is expected to be tabled in Parliament of Malaysia. Moreover, the plan will also be focusing on two (2) main areas; efforts will be made to develop a ’road map’ for climate resilient growth and enhancing conservation of the nation’s ecological assets. A dual strategy in addressing climate change impacts will be adopted through adaptation strategies to protect economic growth and development factors from the impact of climate change and mitigation strategies to reduce emission of greenhouse gases. Thus, more concern study

64
and research activities in the future could be work out on the adaptation itself in order to enhance the lesson as one of important part in disaster risk reduction and disaster management to the country.

65
6.0 Conclusions In conclusions, adaptation to climate change should be taken into account in all development plans of the country. Thus, there are an increasing number of programs and projects addressing climate change adaptation for both countries such Japan as developed country and the developing country like Malaysia. Notwithstanding this in identifying options for adaptation, uncertainties associated with the climate change projection should not be discounted. Younger generation will be the driver in the green agenda in the future. It is hope the in the next 5 to 10 years, society will have a better mindset on this initiatives. However, publicity, awareness and promotion cannot be lacking. Better and enhanced understanding of the interlink ages between environment issues and disaster mitigation at various levels of action, better and enhanced understanding of the need for multi-disciplinarily in disaster management as a whole. Even, the disaster risk management (DRM) and climate change adaptation both need to address processes that define environmental and socioeconomic vulnerabilities in the future. Numerous tools for assessing climate change vulnerabilities and adaptation measures exist that can be linked with/complement DRM methodologies.
66
References 1. Adaptation Strategies for Water and Agricultural Sectors in Southeast Asia, Regional Climate Change
Adaptation Knowledge Platform for Asia (Adaptation Knowledge Platform) – October 2010 2. Jessica Mercer, Disaster Risk Reduction or Climate Change Adaptation: Are We Reinventing the Wheel?.
Journal of International Development J. Int. Dev. 22, 247–264 (2010) Published online in Wiley InterScience (www.interscience.wiley.com) DOI: 10.1002/jid.1677
3. Tearfund. 2008. Linking Climate Change Adaptation and Disaster Risk Reduction. Tearfund: London. 4. Lewis J. 1999. Development in Disaster-prone Places: Studies of Vulnerability. Intermediate Technology
Publications: London. 5. Wisner B, Blaikie P, Cannon T, Davis I. 2004. At Risk: Natural Hazards, People’s Vulnerability and Disasters.
(2nd edn). Routledge: London. 6. Tran P, Shaw R. 2007. Towards An Integrated Approach of Disaster and Environmental Management: A
Case Study of Thua Thien Hue Province in Central Vietnam. Environmental Hazards 7(4): 271–282. 7. United Nations International Strategy for Disaster Reduction (UNISDR). 2004. Terminology: Basic Terms of
Disaster Risk Reduction. UNISDR: Geneva. 8. Statement on Tropical Cyclones and Climate Change - WMO International Workshop on Tropical Cyclones,
IWTC-6, San Jose, Costa Rica, November 2006. 9. IPCC (2007): The Fourth Assessment Report 10. Japan’s Fifth National Communication: Under the United Nations Framework Convention on Climate
Change. The Government of Japan. (2010). 11. Wise Adaptation to Climate Change. The Committee on Climate Change Impacts and Adaptation Research,
Ministry of the Environment Japan. (2008). 12. The Role of Adaptive Measures in the Water-Related Disaster Sector for Climate Change Accompanying
Global Warming (Report). Council for Social Infrastructures, Ministry of Land, Infrastructures, Transport and Tourism Japan. (2008).
13. Practical Guidelines on Strategic Climate Change Adaptation Planning: Flood Disaster. October 2010. River Bureau, Ministry of Land, Infrastructures, Transport and Tourism Japan. (2010).
14. Final Report for Study on Mainstreaming Climate Change Considerations into JICA Operation (Adaptation). (June 2011). Japan International Cooperation Agency (JICA). (2011).
15. Deni, S.M., S. Jamaludin, W.Z.W. Zin and A.A. Jemain, 2008. Tracing Trends in the Sequences of Dry and Wet Days Over Peninsular Malaysia. J. Environ, Sci. Technol., 1: 97 – 110.
16. Scientific Report: Climate Change Scenarios for Malaysia (2001 – 2099) by Malaysian Meteorological Department (MMD), Ministry Science, Technology and Innovation Malaysia (MOSTI)
17. R.A. Begum, C. Siwar, R.D.Z.R.Z. Abidin and Joy Jacqueline Pereira, 2011. Vulnerability of Climate Change and Hardcore Poverty in Malaysia. J. Environ, Sci. Technol.,4(2): 112 – 117
18. National Policy on Climate Change for Malaysia published by 2010. Ministry of Natural Resources and Environment Malaysia (NRE).
19. Sumiani Yusoff, Ph.D. International Institute of Public Policy and Management (INPUMA), University of Malaya, Malaysia. Development of a National Policy on Climate Change: Malaysia’s Experience. Presentation at Mahidol Univ. Bangkok (2010).
20. Ando, K., F. Syamsudin, Y. Ishihara, W. Pandoe, M. D. Yamanaka, Y. Masumoto and K. Mizuno, 2010: Development of new international research laboratory for maritime-continent seas climate research and contributions to global surface moored buoy array. Proceedings of the "OeanObs'09: sustained Ocean Observations and Information for Society" Conference (Annex), Venice, Italy, 21-25 September 2009, Hal, J., D. E. Harrison and D. Stammer (eds), ESA Publication WPP-306.
21. Yamanaka, M. D., S. Mori, Wu P.-M., Hamada J.-I., N. Sakurai, H. Hashiguchi, M. K. Yamamoto, Y. Shibagaki, M. Kawashima, Y.Fujiyoshi, T. Shimomai, T. Manik, Erlansyah, W. Setiawan, B. Tejasukmana, F. Syamsudin, Y. S. Djajadihardia, and J. T. Anggadiredja, 2008: HARIMAU Radar-Profiler Network Over Indonesian Maritime Continent: A GEOSS Early Achievement for Hydrological Cycle and Disaster Prevention. J. Disaster Res., 3, 78-88.
22. C.-S. Ho and W.-K. Fong, University Technology Malaysia. 2011. Eco-City Planning - Policies, Practice and Design: Towards a Sustainable Regional Development in Malaysia. J. Springer., 196 – 219.

67