ad spending in 2014 elections poised to break $1 billion
TRANSCRIPT

Wesleyan Media Project, 10/14/2014: Midterm Election Spending Approaches $1 Billion 1
For Immediate Release:
Ad Spending in 2014 Elections Poised to Break $1 Billion Democrats Hold Slight Lead in Senate Advertising; Interest Groups Account for 40 Percent Senate Airings This Cycle, All-time High. (MIDDLETOWN, CT) October 14, 2014 – Just three weeks out from Election Day 2014, Democrats hold a very slight advantage in the most competitive Senate races. In 10 of the 15 Senate races with the highest volume of advertising, more ads favoring Democrats than ads favoring Republicans aired between September 26 and October 9 (Table 1). Table 1: Ad Volume and Spending in Top Senate Races
State Total Ads
Pro-Dem Ads
Pro-GOP Ads
Dem % Group
GOP % Group
Pro-Dem $s
Pro-GOP $s
NC 14,221 7,552 6,669 30.3% 49.6% $4.6 M $5.7 M IA 13,644 6,666 6,978 29.0% 50.5% $2.2 M $2.8 M KY 11,231 5,177 6,054 0.0% 46.8% $2.1 M $3.5 M CO 9,407 4,822 4,585 23.6% 50.5% $3.3 M $3.6 M LA 7,811 4,682 3,129 0.0% 24.4% $1.7 M $1.5 M AR 7,471 3,549 3,922 23.5% 53.6% $1.6 M $2.2 M AK 6,440 3,517 2,923 26.3% 27.5% $0.4 M $0.4 M MI 6,340 3,446 2,894 21.9% 66.8% $2.4 M $2.5 M GA 5,955 3,719 2,236 8.1% 19.5% $2.6 M $1.5 M VA 5,238 3,082 2,156 17.4% 0.0% $2.1 M $1.7 M KS* 3,684 1,754 1,930 11.1% 36.1% $0.5 M $0.8 M SD** 3,384 2,436 577 41.8% 0.0% $0.5 M $0.2 M OR 3,118 2,088 1,030 0.0% 47.6% $0.7 M $0.5 M NH 2,850 1,638 1,212 13.0% 27.5% $1.2 M $0.9 M WV 2,705 637 2,068 30.3% 49.6% $0.1 M $0.4 M
Figures are from September 26, 2014, to October 9, 2014 (for cycle to date figures, see Table A). Numbers include broadcast television. *Numbers for independent candidate, Greg Orman, are reported in the Democratic columns. **South Dakota independent Larry Pressler aired 371 ads at an estimated cost of $70K. CITE SOURCE OF DATA AS: Kantar Media/CMAG with analysis by the Wesleyan Media Project.

Wesleyan Media Project, 10/14/2014: Midterm Election Spending Approaches $1 Billion 2
Republicans continue to be more reliant on outside group advertising than Democrats. In 13 of the top 15 Senate contests—South Dakota and Virginia being the exceptions—groups sponsored a greater percentage of pro-Republican ads than pro-Democratic ads. In Iowa, Colorado, Arkansas, and Michigan, more than 50 percent of pro-Republican ads were paid for by groups. On the Democratic side, the race with the greatest interest group involvement was in South Dakota, where groups paid for 42 percent of pro-Democratic ads in the past two weeks. “Because Republicans are relying on outside groups to pay for their ads, they are not getting as much bang for the buck as Democrats,” said Michael Franz, co-director of the Wesleyan Media Project. “Sixty days before an election, candidates are entitled to the lowest unit rate from television stations, but that does not apply to the various groups who are funding ads. Still, because political science research suggests outside spending can be more persuasive than ads from candidates, this strategy may pay off for Republicans.” Looking more closely at individual races, the biggest Democratic ad advantages were in Louisiana, Georgia, South Dakota and Oregon, while the biggest Republican ad advantages were in Kentucky and West Virginia. In South Dakota, there were approximately four times as many ads favoring Democrat Rick Weiland as ads favoring Republican Mike Rounds.
Ad Spending Approaches $1 Billion; Groups Air 40% of Senate Ads, Up from 32% in 2012 Since the start of the 2013-14 election cycle, $337 million has been spent to air 728,000 ads in Senate races (Table 2). Spending on gubernatorial races has been even higher, at $426 million, which has purchased just over 700,000 ads. Another $154 million has been spent on House races. All told, across Senate, House and gubernatorial races, spending this election cycle is over $917 million. “Ad spending this election cycle will easily break the $1 billion mark in the next week or two,” said Travis Ridout, co-director of the Wesleyan Media Project. “We also expect to see at least 2 million ad airings in House, Senate and gubernatorial races by Election Day,” Ridout added. Overall airings in U.S. Senate races are up 17.6 percent over the 2012 cycle, and the percentage of Senate ad airings from interest groups increased from 32 percent of all ad airings in 2012 to 40 percent in 2014. Ads in House races are down 8 percent, while the interest group percentage of airings has stayed constant.

Wesleyan Media Project, 10/14/2014: Midterm Election Spending Approaches $1 Billion 3
Table 2: Ad Spending and Airings
2014 2012 Est. Cost Airings % Group Est. Cost Airings % Group
Governor $426 M 703,735 23%US House $154 M 355,353 18% $203 M 387,117 18%US Senate $337 M 728,593 40% $324 M 619,377 32%Total $918 M 1,787,681 29%
Figures are from January 1, 2013, to October 9, 2014 and from January 1, 2011, to October 9, 2012. Numbers include broadcast television. CITE SOURCE OF DATA AS: Kantar Media/CMAG with analysis by the Wesleyan Media Project. Table 3 shows the volume of advertising over the past two weeks and in comparison with the same time frame in 2010. Over 58,000 ads aired over the past two weeks favoring Democratic Senate candidates compared to about 53,000 ads favoring Republican Senate candidates. In the House, pro-Democratic ads continued to outnumber pro-Republican ads, 50,000 to 34,000, while Republican ads outnumbered Democratic ads in races for governor. While groups have been active in Senate races this cycle—and to a lesser extent in gubernatorial races—they have, by and large, stayed out of races for the House. Notably, ad totals are generally down in comparison to the same two-week period in 2010, except for pro-Democratic Senate advertising, which is up over 34 percent.

Wesleyan Media Project, 10/14/2014: Midterm Election Spending Approaches $1 Billion 4
Table 3: Ad Totals by Race Type and Sponsorship (Past Two Weeks) 2010 Midterms
Pro-Democratic Advertising Cand. Party Coord. Group Total
Governor 48,431 13,258 0 7,777 69,466 US House 53,121 9,221 2,117 1,187 65,646 US Senate 31,212 6,885 3,358 2,089 43,544
Pro-Republican Advertising Cand. Party Coord. Group Total
Governor 58,078 7,462 26 10,300 75,866 US House 23,469 13,211 6,782 12,597 56,059 US Senate 31,389 4,396 8,694 13,603 58,082
2014 Midterms Pro-Democratic Advertising
Cand. Party Coord. Group Total % Change Governor 33,391 11,578 0 11,414 56,383 -18.8% US House 31,098 13,702 1,150 4,108 50,058 -23.7% US Senate 32,929 11,982 3,674 9,952 58,537 34.4%
Pro-Republican Advertising Cand. Party Coord. Group Total % Change
Governor 40,185 13,931 0 8,962 63,078 -16.9% US House 17,946 11,861 1,530 2,463 33,800 -39.7% US Senate 27,261 4,557 1,616 19,696 53,130 -8.5%
Figures are from September 26, 2014, to October 9, 2014 and from September 26, 2010, to October 9, 2010. Numbers include broadcast television. CITE SOURCE OF DATA AS: Kantar Media/CMAG with analysis by the Wesleyan Media Project.
Wesleyan Media Project, 10/14/2014: Midterm Election Spending Approaches $1 Billion 5
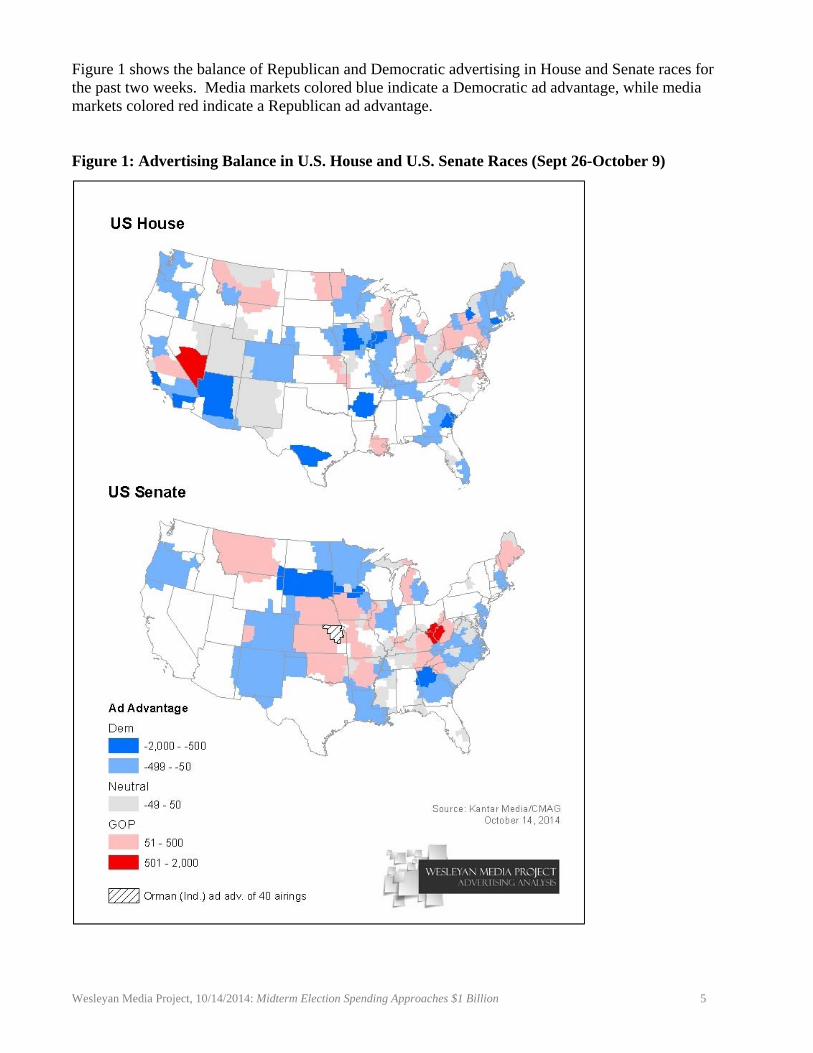
Figure 1 shows the balance of Republican and Democratic advertising in House and Senate races for the past two weeks. Media markets colored blue indicate a Democratic ad advantage, while media markets colored red indicate a Republican ad advantage. Figure 1: Advertising Balance in U.S. House and U.S. Senate Races (Sept 26-October 9)

Wesleyan Media Project, 10/14/2014: Midterm Election Spending Approaches $1 Billion 6
Figure 2 shows the balance of advertising over time in a key Senate race in Iowa. Pro-Democratic ads were slightly more common in the period 9 to11 weeks from Election Day, but pro-Republican ads surged in the following three weeks, eclipsing Democratic advertising. In the past two weeks, the balance of advertising between the parties has been very close. Figure 2: Balance of Democratic/Republican Advertising in North Carolina over Time
*Week 4 only includes Tuesday, Wednesday, and Thursday (10/7 to 10/9)
0
500
1000
1500
2000
2500
3000
3500
4000
4*(3 days)
567891011
Ads Aired
Weeks Until Election
IowaDemocrats Republicans

Wesleyan Media Project, 10/14/2014: Midterm Election Spending Approaches $1 Billion 7
Figure 3 shows the trends in the Hagan/Tillis race in North Carolina. Here too, ad totals for each side are quite balanced in more recent weeks, after periods of Democratic and Republican advantages. Figure 3: Balance of Democratic/Republican Advertising in North Carolina over Time
*Week 4 only includes Tuesday, Wednesday, and Thursday (10/7 to 10/9)
0
500
1000
1500
2000
2500
3000
3500
4000
4*(3 days)
567891011
Ads Aired
Weeks Until Election
N.C.Democrats Republicans
Wesleyan Media Project, 10/14/2014: Midterm Election Spending Approaches $1 Billion 8
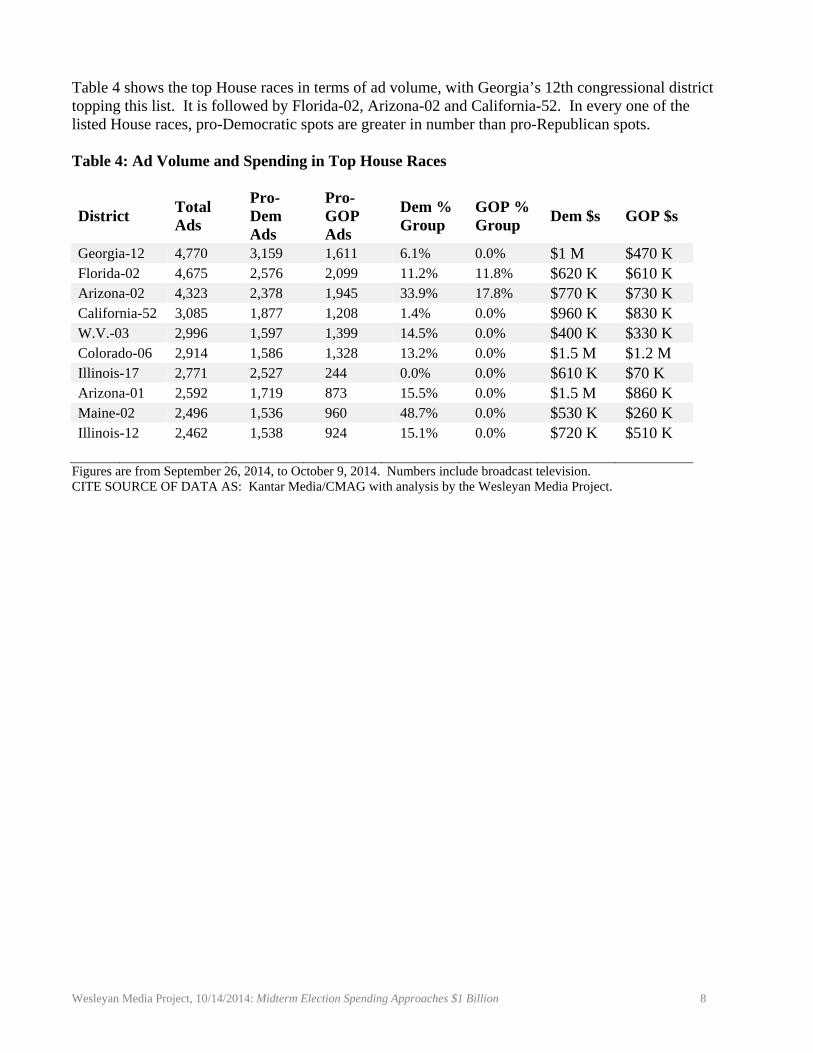
Table 4 shows the top House races in terms of ad volume, with Georgia’s 12th congressional district topping this list. It is followed by Florida-02, Arizona-02 and California-52. In every one of the listed House races, pro-Democratic spots are greater in number than pro-Republican spots. Table 4: Ad Volume and Spending in Top House Races
District Total Ads
Pro-Dem Ads
Pro-GOP Ads
Dem % Group
GOP % Group
Dem $s GOP $s
Georgia-12 4,770 3,159 1,611 6.1% 0.0% $1 M $470 K Florida-02 4,675 2,576 2,099 11.2% 11.8% $620 K $610 K Arizona-02 4,323 2,378 1,945 33.9% 17.8% $770 K $730 K California-52 3,085 1,877 1,208 1.4% 0.0% $960 K $830 K W.V.-03 2,996 1,597 1,399 14.5% 0.0% $400 K $330 K Colorado-06 2,914 1,586 1,328 13.2% 0.0% $1.5 M $1.2 M Illinois-17 2,771 2,527 244 0.0% 0.0% $610 K $70 K Arizona-01 2,592 1,719 873 15.5% 0.0% $1.5 M $860 K Maine-02 2,496 1,536 960 48.7% 0.0% $530 K $260 K Illinois-12 2,462 1,538 924 15.1% 0.0% $720 K $510 K
Figures are from September 26, 2014, to October 9, 2014. Numbers include broadcast television. CITE SOURCE OF DATA AS: Kantar Media/CMAG with analysis by the Wesleyan Media Project.
Wesleyan Media Project, 10/14/2014: Midterm Election Spending Approaches $1 Billion 9
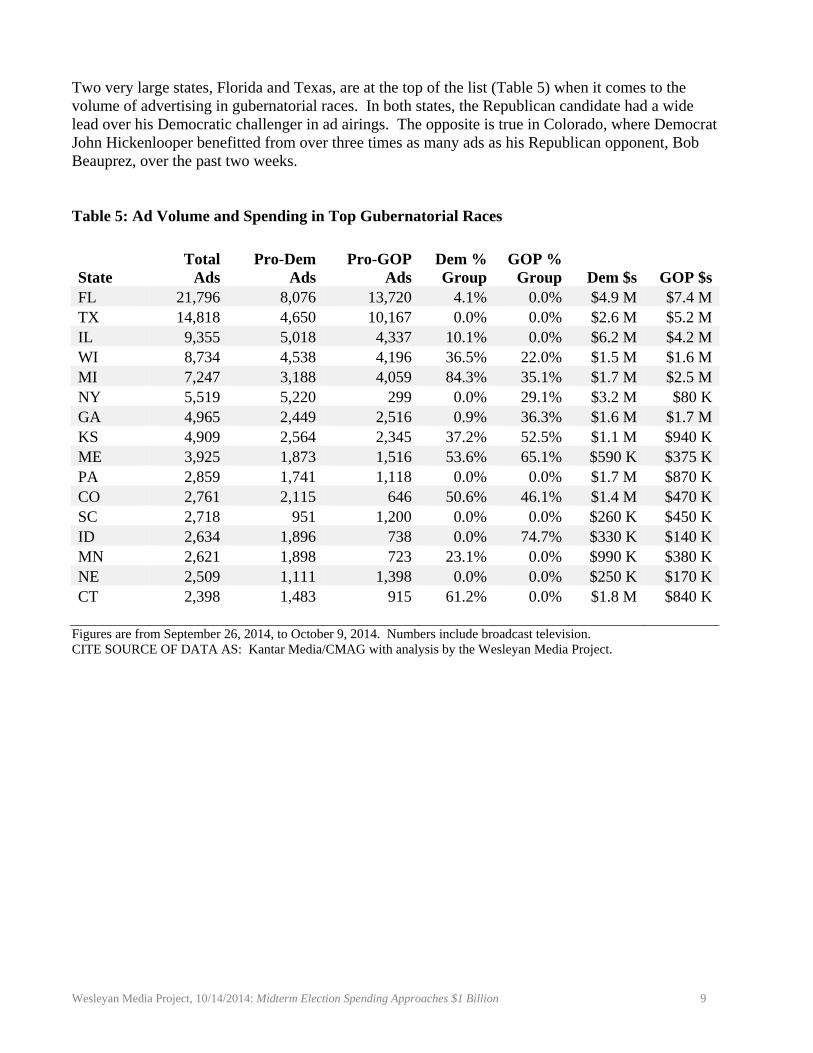
Two very large states, Florida and Texas, are at the top of the list (Table 5) when it comes to the volume of advertising in gubernatorial races. In both states, the Republican candidate had a wide lead over his Democratic challenger in ad airings. The opposite is true in Colorado, where Democrat John Hickenlooper benefitted from over three times as many ads as his Republican opponent, Bob Beauprez, over the past two weeks. Table 5: Ad Volume and Spending in Top Gubernatorial Races
State Total
Ads Pro-Dem
Ads Pro-GOP
AdsDem % Group
GOP % Group Dem $s GOP $s
FL 21,796 8,076 13,720 4.1% 0.0% $4.9 M $7.4 MTX 14,818 4,650 10,167 0.0% 0.0% $2.6 M $5.2 MIL 9,355 5,018 4,337 10.1% 0.0% $6.2 M $4.2 MWI 8,734 4,538 4,196 36.5% 22.0% $1.5 M $1.6 MMI 7,247 3,188 4,059 84.3% 35.1% $1.7 M $2.5 MNY 5,519 5,220 299 0.0% 29.1% $3.2 M $80 KGA 4,965 2,449 2,516 0.9% 36.3% $1.6 M $1.7 MKS 4,909 2,564 2,345 37.2% 52.5% $1.1 M $940 KME 3,925 1,873 1,516 53.6% 65.1% $590 K $375 KPA 2,859 1,741 1,118 0.0% 0.0% $1.7 M $870 KCO 2,761 2,115 646 50.6% 46.1% $1.4 M $470 KSC 2,718 951 1,200 0.0% 0.0% $260 K $450 KID 2,634 1,896 738 0.0% 74.7% $330 K $140 KMN 2,621 1,898 723 23.1% 0.0% $990 K $380 KNE 2,509 1,111 1,398 0.0% 0.0% $250 K $170 KCT 2,398 1,483 915 61.2% 0.0% $1.8 M $840 K
Figures are from September 26, 2014, to October 9, 2014. Numbers include broadcast television. CITE SOURCE OF DATA AS: Kantar Media/CMAG with analysis by the Wesleyan Media Project.
Wesleyan Media Project, 10/14/2014: Midterm Election Spending Approaches $1 Billion 10
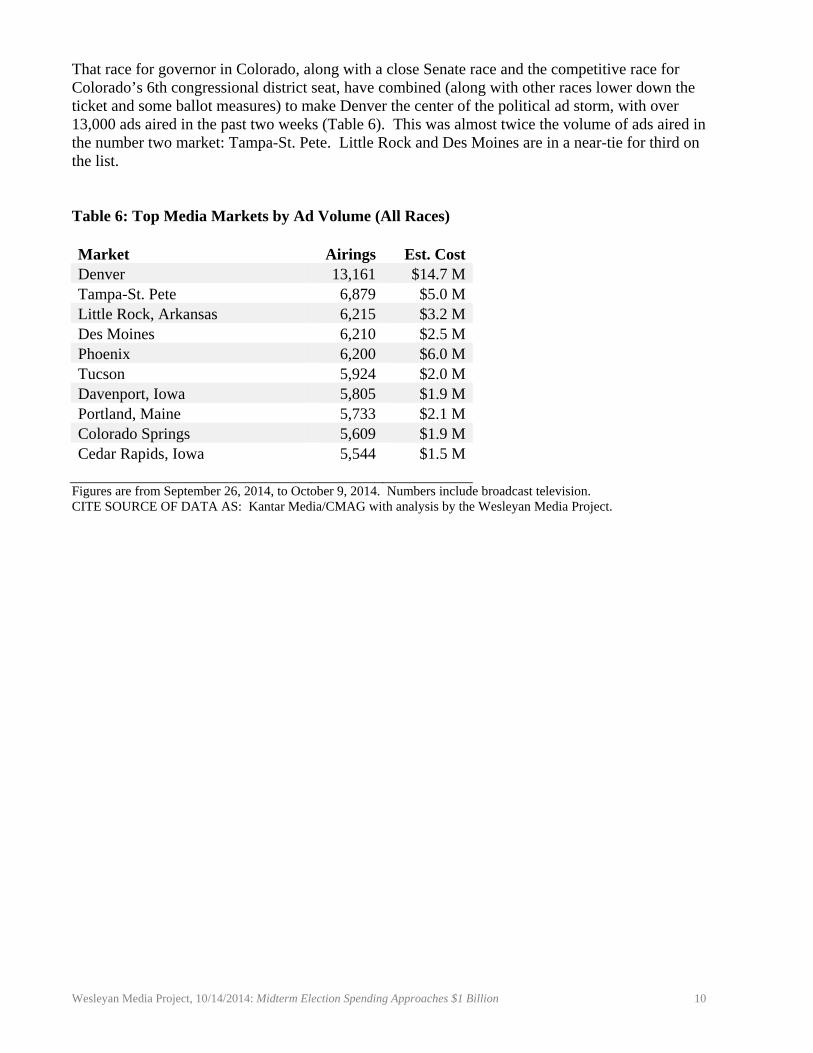
That race for governor in Colorado, along with a close Senate race and the competitive race for Colorado’s 6th congressional district seat, have combined (along with other races lower down the ticket and some ballot measures) to make Denver the center of the political ad storm, with over 13,000 ads aired in the past two weeks (Table 6). This was almost twice the volume of ads aired in the number two market: Tampa-St. Pete. Little Rock and Des Moines are in a near-tie for third on the list. Table 6: Top Media Markets by Ad Volume (All Races) Market Airings Est. CostDenver 13,161 $14.7 MTampa-St. Pete 6,879 $5.0 MLittle Rock, Arkansas 6,215 $3.2 MDes Moines 6,210 $2.5 MPhoenix 6,200 $6.0 MTucson 5,924 $2.0 MDavenport, Iowa 5,805 $1.9 MPortland, Maine 5,733 $2.1 MColorado Springs 5,609 $1.9 MCedar Rapids, Iowa 5,544 $1.5 M
Figures are from September 26, 2014, to October 9, 2014. Numbers include broadcast television. CITE SOURCE OF DATA AS: Kantar Media/CMAG with analysis by the Wesleyan Media Project.
Wesleyan Media Project, 10/14/2014: Midterm Election Spending Approaches $1 Billion 11
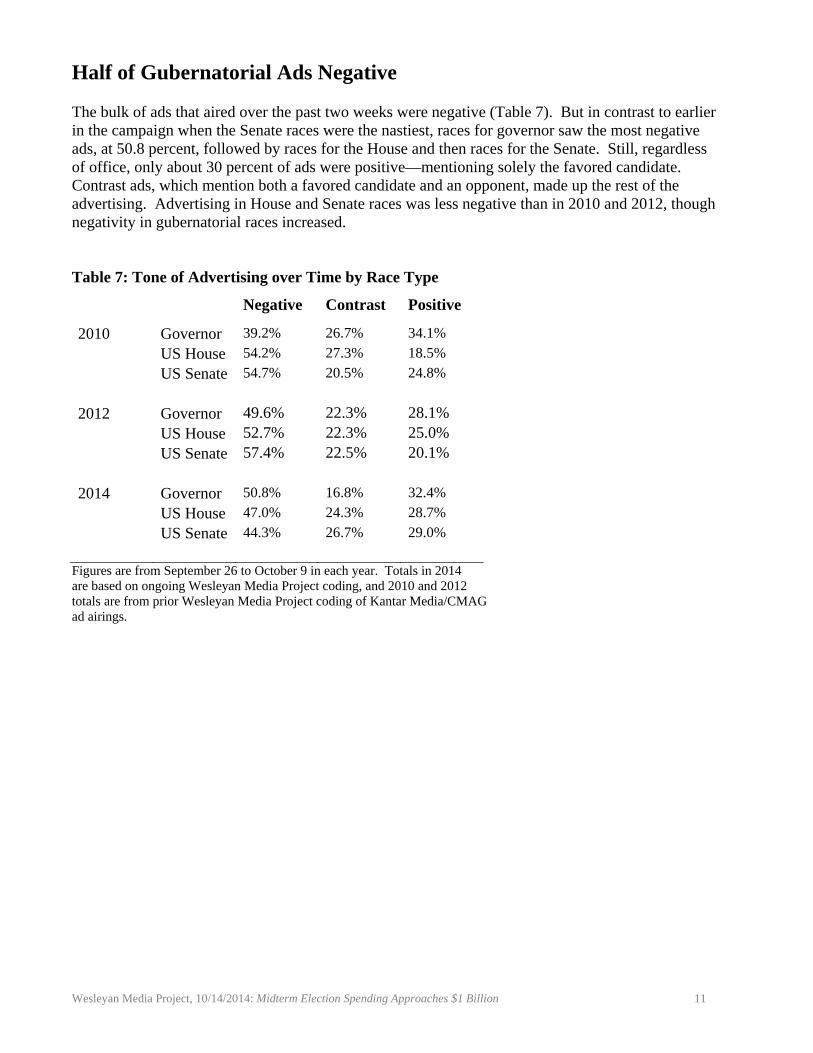
Half of Gubernatorial Ads Negative The bulk of ads that aired over the past two weeks were negative (Table 7). But in contrast to earlier in the campaign when the Senate races were the nastiest, races for governor saw the most negative ads, at 50.8 percent, followed by races for the House and then races for the Senate. Still, regardless of office, only about 30 percent of ads were positive—mentioning solely the favored candidate. Contrast ads, which mention both a favored candidate and an opponent, made up the rest of the advertising. Advertising in House and Senate races was less negative than in 2010 and 2012, though negativity in gubernatorial races increased. Table 7: Tone of Advertising over Time by Race Type
Negative Contrast Positive
2010 Governor 39.2% 26.7% 34.1%
US House 54.2% 27.3% 18.5%
US Senate 54.7% 20.5% 24.8%
2012 Governor 49.6% 22.3% 28.1% US House 52.7% 22.3% 25.0% US Senate 57.4% 22.5% 20.1%
2014 Governor 50.8% 16.8% 32.4%
US House 47.0% 24.3% 28.7%
US Senate 44.3% 26.7% 29.0%
Figures are from September 26 to October 9 in each year. Totals in 2014 are based on ongoing Wesleyan Media Project coding, and 2010 and 2012 totals are from prior Wesleyan Media Project coding of Kantar Media/CMAG ad airings.
Wesleyan Media Project, 10/14/2014: Midterm Election Spending Approaches $1 Billion 12
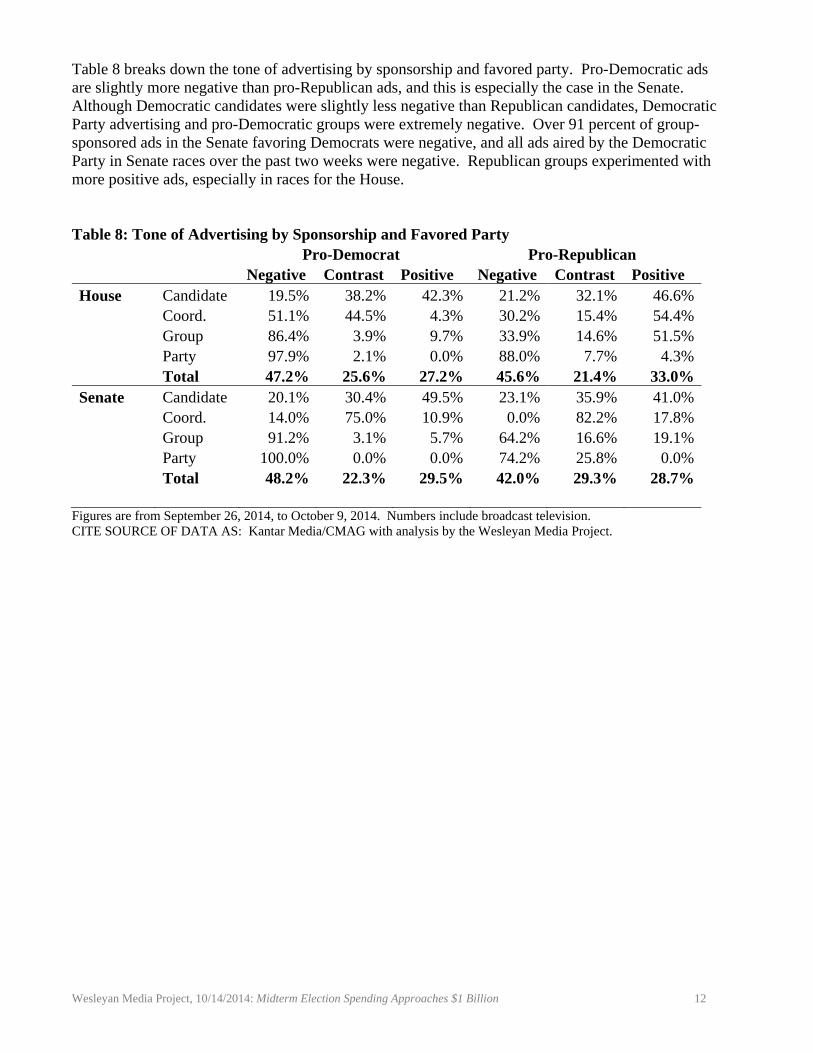
Table 8 breaks down the tone of advertising by sponsorship and favored party. Pro-Democratic ads are slightly more negative than pro-Republican ads, and this is especially the case in the Senate. Although Democratic candidates were slightly less negative than Republican candidates, Democratic Party advertising and pro-Democratic groups were extremely negative. Over 91 percent of group-sponsored ads in the Senate favoring Democrats were negative, and all ads aired by the Democratic Party in Senate races over the past two weeks were negative. Republican groups experimented with more positive ads, especially in races for the House. Table 8: Tone of Advertising by Sponsorship and Favored Party
Pro-Democrat Pro-Republican Negative Contrast Positive Negative Contrast Positive
House Candidate 19.5% 38.2% 42.3% 21.2% 32.1% 46.6%Coord. 51.1% 44.5% 4.3% 30.2% 15.4% 54.4%Group 86.4% 3.9% 9.7% 33.9% 14.6% 51.5%Party 97.9% 2.1% 0.0% 88.0% 7.7% 4.3%Total 47.2% 25.6% 27.2% 45.6% 21.4% 33.0%
Senate Candidate 20.1% 30.4% 49.5% 23.1% 35.9% 41.0%Coord. 14.0% 75.0% 10.9% 0.0% 82.2% 17.8%Group 91.2% 3.1% 5.7% 64.2% 16.6% 19.1%Party 100.0% 0.0% 0.0% 74.2% 25.8% 0.0%Total 48.2% 22.3% 29.5% 42.0% 29.3% 28.7%
Figures are from September 26, 2014, to October 9, 2014. Numbers include broadcast television. CITE SOURCE OF DATA AS: Kantar Media/CMAG with analysis by the Wesleyan Media Project.

Wesleyan Media Project, 10/14/2014: Midterm Election Spending Approaches $1 Billion 13
Table 9 shows the least positive Senate races over the past two weeks. In Kansas, only 4 percent of ads were purely positive, while 48 percent were purely negative. The remaining ads were contrast. Contrast ads predominated in Virginia, while Arkansas had the greatest percentage of purely negative ads, at 69 percent. Table 9: Least Positive U.S. Senate Races State Positive Contrast NegativeKS 4.0% 47.6% 48.4%VA 12.4% 62.9% 24.6%CO 17.1% 25.9% 57.0%LA 17.7% 43.2% 39.1%GA 19.2% 64.3% 16.5%NC 19.6% 30.6% 49.8%AR 20.1% 10.9% 68.9%KY 21.1% 27.9% 51.0%NH 23.4% 31.1% 45.5%NM 33.8% 17.9% 48.3%AK 34.0% 15.7% 50.2%IA 35.5% 14.1% 50.4% Figures are from September 26, 2014, to October 9, 2014. Numbers include broadcast television. CITE SOURCE OF DATA AS: Kantar Media/CMAG with analysis by the Wesleyan Media Project.

Wesleyan Media Project, 10/14/2014: Midterm Election Spending Approaches $1 Billion 14
As Table 10 shows, New Hampshire’s race for governor featured the smallest percentage of positive ads over the past two weeks, just 3 percent. But in terms of the percentage of pure negative ads, Connecticut, Florida and Wisconsin are at the top. Table 10: Least Positive Gubernatorial Races State Positive Contrast NegativeNH 3.1% 59.9% 37.0%CT 5.3% 15.2% 79.5%MI 5.8% 47.0% 47.2%NM 6.6% 35.4% 58.0%AZ 6.8% 36.7% 56.5%IL 7.8% 19.8% 72.5%FL 14.7% 6.1% 79.2%PA 15.1% 22.6% 62.3%WI 20.1% 2.8% 77.1%GA 28.0% 17.7% 54.3%KS 29.0% 7.9% 63.1%MD 33.6% 0.6% 65.8% Figures are from September 26, 2014, to October 9, 2014. Numbers include broadcast television. CITE SOURCE OF DATA AS: Kantar Media/CMAG with analysis by the Wesleyan Media Project.
Wesleyan Media Project, 10/14/2014: Midterm Election Spending Approaches $1 Billion 15
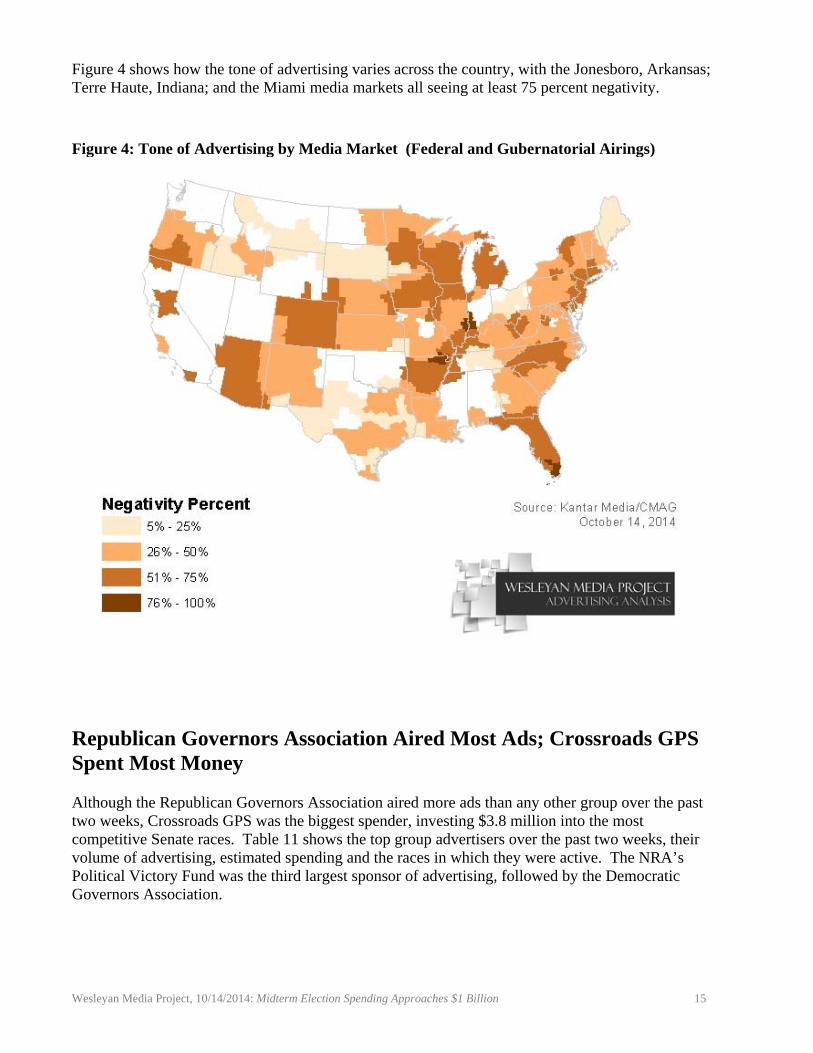
Figure 4 shows how the tone of advertising varies across the country, with the Jonesboro, Arkansas; Terre Haute, Indiana; and the Miami media markets all seeing at least 75 percent negativity.
Figure 4: Tone of Advertising by Media Market (Federal and Gubernatorial Airings)
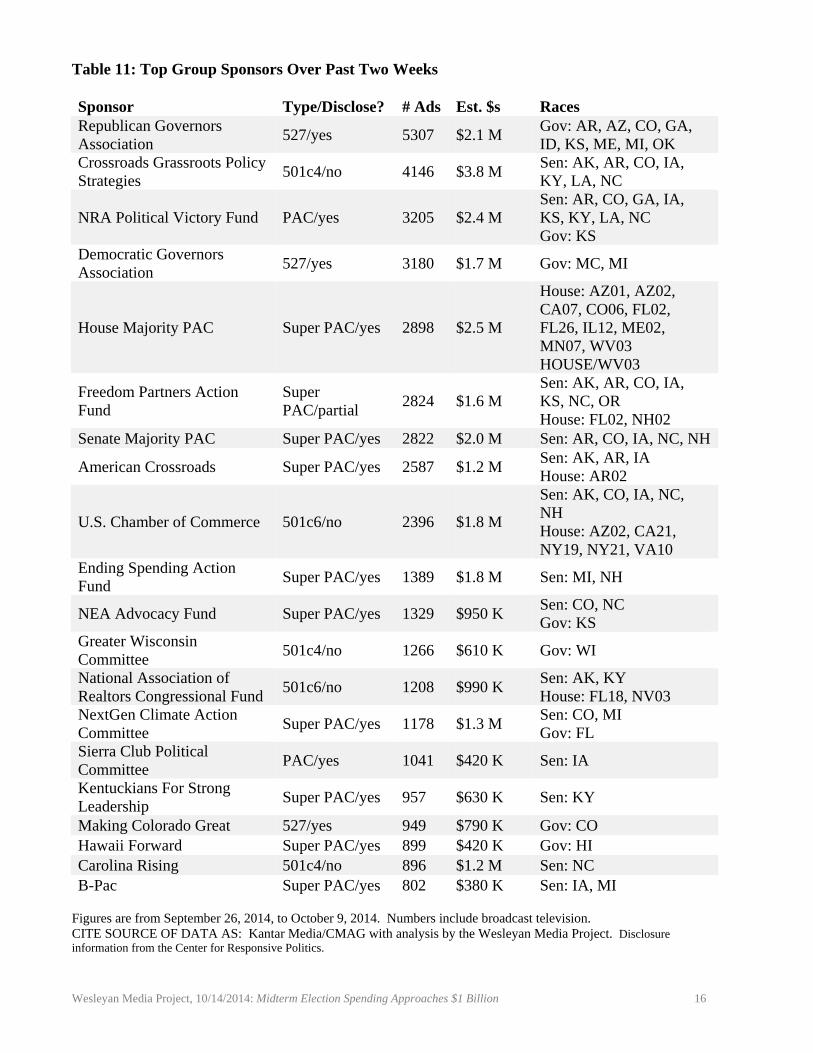
Republican Governors Association Aired Most Ads; Crossroads GPS Spent Most Money Although the Republican Governors Association aired more ads than any other group over the past two weeks, Crossroads GPS was the biggest spender, investing $3.8 million into the most competitive Senate races. Table 11 shows the top group advertisers over the past two weeks, their volume of advertising, estimated spending and the races in which they were active. The NRA’s Political Victory Fund was the third largest sponsor of advertising, followed by the Democratic Governors Association.
Wesleyan Media Project, 10/14/2014: Midterm Election Spending Approaches $1 Billion 16
Table 11: Top Group Sponsors Over Past Two Weeks Sponsor Type/Disclose? # Ads Est. $s Races Republican Governors Association
527/yes 5307 $2.1 M Gov: AR, AZ, CO, GA, ID, KS, ME, MI, OK
Crossroads Grassroots Policy Strategies
501c4/no 4146 $3.8 M Sen: AK, AR, CO, IA, KY, LA, NC
NRA Political Victory Fund PAC/yes 3205 $2.4 M Sen: AR, CO, GA, IA, KS, KY, LA, NC Gov: KS
Democratic Governors Association
527/yes 3180 $1.7 M Gov: MC, MI
House Majority PAC Super PAC/yes 2898 $2.5 M
House: AZ01, AZ02, CA07, CO06, FL02, FL26, IL12, ME02, MN07, WV03 HOUSE/WV03
Freedom Partners Action Fund
Super PAC/partial
2824 $1.6 M Sen: AK, AR, CO, IA, KS, NC, OR House: FL02, NH02
Senate Majority PAC Super PAC/yes 2822 $2.0 M Sen: AR, CO, IA, NC, NH
American Crossroads Super PAC/yes 2587 $1.2 M Sen: AK, AR, IA House: AR02
U.S. Chamber of Commerce 501c6/no 2396 $1.8 M
Sen: AK, CO, IA, NC, NH House: AZ02, CA21, NY19, NY21, VA10
Ending Spending Action Fund
Super PAC/yes 1389 $1.8 M Sen: MI, NH
NEA Advocacy Fund Super PAC/yes 1329 $950 K Sen: CO, NC Gov: KS
Greater Wisconsin Committee
501c4/no 1266 $610 K Gov: WI
National Association of Realtors Congressional Fund
501c6/no 1208 $990 K Sen: AK, KY House: FL18, NV03
NextGen Climate Action Committee
Super PAC/yes 1178 $1.3 M Sen: CO, MI Gov: FL
Sierra Club Political Committee
PAC/yes 1041 $420 K Sen: IA
Kentuckians For Strong Leadership
Super PAC/yes 957 $630 K Sen: KY
Making Colorado Great 527/yes 949 $790 K Gov: CO Hawaii Forward Super PAC/yes 899 $420 K Gov: HI Carolina Rising 501c4/no 896 $1.2 M Sen: NC B-Pac Super PAC/yes 802 $380 K Sen: IA, MI
Figures are from September 26, 2014, to October 9, 2014. Numbers include broadcast television. CITE SOURCE OF DATA AS: Kantar Media/CMAG with analysis by the Wesleyan Media Project. Disclosure information from the Center for Responsive Politics.

Wesleyan Media Project, 10/14/2014: Midterm Election Spending Approaches $1 Billion 17
Dark Money Paid for 26 Percent of Group Ad Airings A Wesleyan Media Project analysis, in partnership with the Center for Responsive Politics, shows that just under 26 percent of ad airings were paid for with dark money; that is from groups who do not have to disclose their donors. Another 7 percent of ad airings had only partial disclosure (i.e., although a group that must disclose its donors, such as a Super PAC, paid for the ad, some of that group’s money came from non-disclosing groups). Over 67 percent of outside group ads were sponsored by organizations that do publicly disclose their donors to either the Federal Election Commission or IRS. Five of the top 20 groups in Table 11 do not disclose their donors, while 14 fully disclose. Table 12: Disclosure Status of Outside Group Advertising
Percentage of Airings
Dark Money 25.8% Partial Disclosure 6.7% Full Disclosure 67.4%
Figures are from September 26, 2014, to October 9, 2014. Numbers include broadcast television. CITE SOURCE OF DATA AS: Kantar Media/CMAG with analysis by the Wesleyan Media Project. Disclosure information from the Center for Responsive Politics.
Wesleyan Media Project, 10/14/2014: Midterm Election Spending Approaches $1 Billion 18
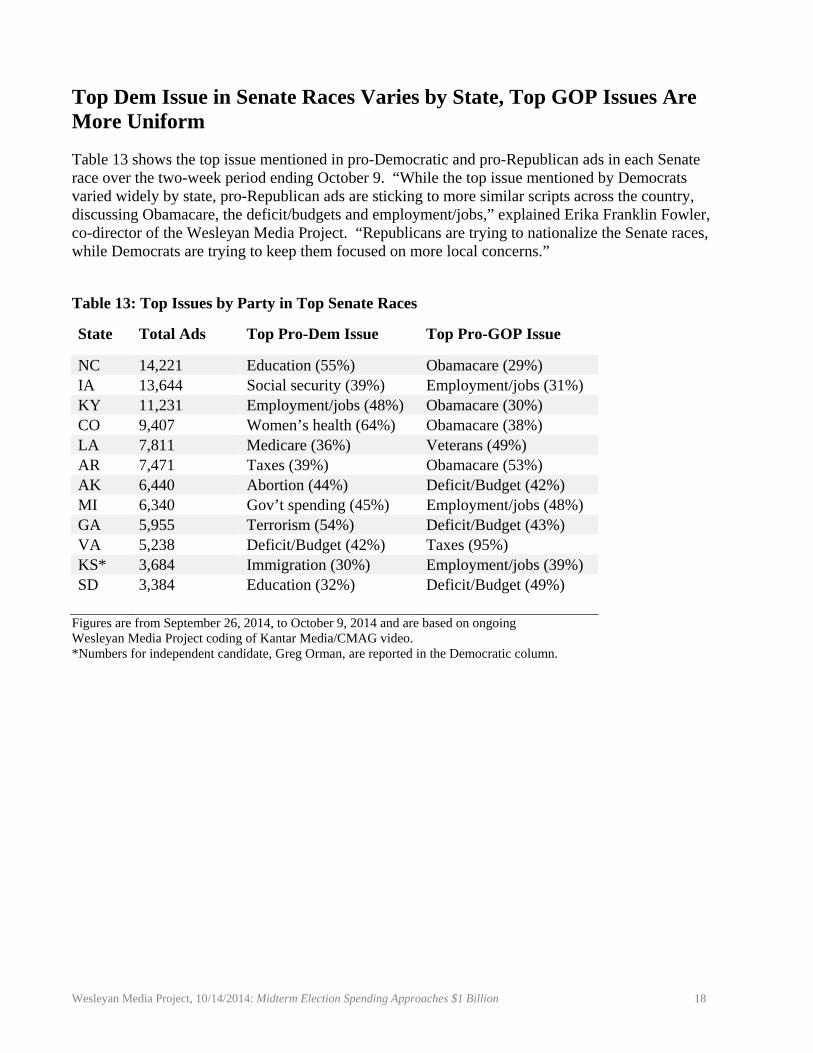
Top Dem Issue in Senate Races Varies by State, Top GOP Issues Are More Uniform Table 13 shows the top issue mentioned in pro-Democratic and pro-Republican ads in each Senate race over the two-week period ending October 9. “While the top issue mentioned by Democrats varied widely by state, pro-Republican ads are sticking to more similar scripts across the country, discussing Obamacare, the deficit/budgets and employment/jobs,” explained Erika Franklin Fowler, co-director of the Wesleyan Media Project. “Republicans are trying to nationalize the Senate races, while Democrats are trying to keep them focused on more local concerns.” Table 13: Top Issues by Party in Top Senate Races
State Total Ads Top Pro-Dem Issue Top Pro-GOP Issue
NC 14,221 Education (55%) Obamacare (29%) IA 13,644 Social security (39%) Employment/jobs (31%) KY 11,231 Employment/jobs (48%) Obamacare (30%) CO 9,407 Women’s health (64%) Obamacare (38%) LA 7,811 Medicare (36%) Veterans (49%) AR 7,471 Taxes (39%) Obamacare (53%) AK 6,440 Abortion (44%) Deficit/Budget (42%) MI 6,340 Gov’t spending (45%) Employment/jobs (48%) GA 5,955 Terrorism (54%) Deficit/Budget (43%) VA 5,238 Deficit/Budget (42%) Taxes (95%) KS* 3,684 Immigration (30%) Employment/jobs (39%) SD 3,384 Education (32%) Deficit/Budget (49%)
Figures are from September 26, 2014, to October 9, 2014 and are based on ongoing Wesleyan Media Project coding of Kantar Media/CMAG video. *Numbers for independent candidate, Greg Orman, are reported in the Democratic column.
Wesleyan Media Project, 10/14/2014: Midterm Election Spending Approaches $1 Billion 19
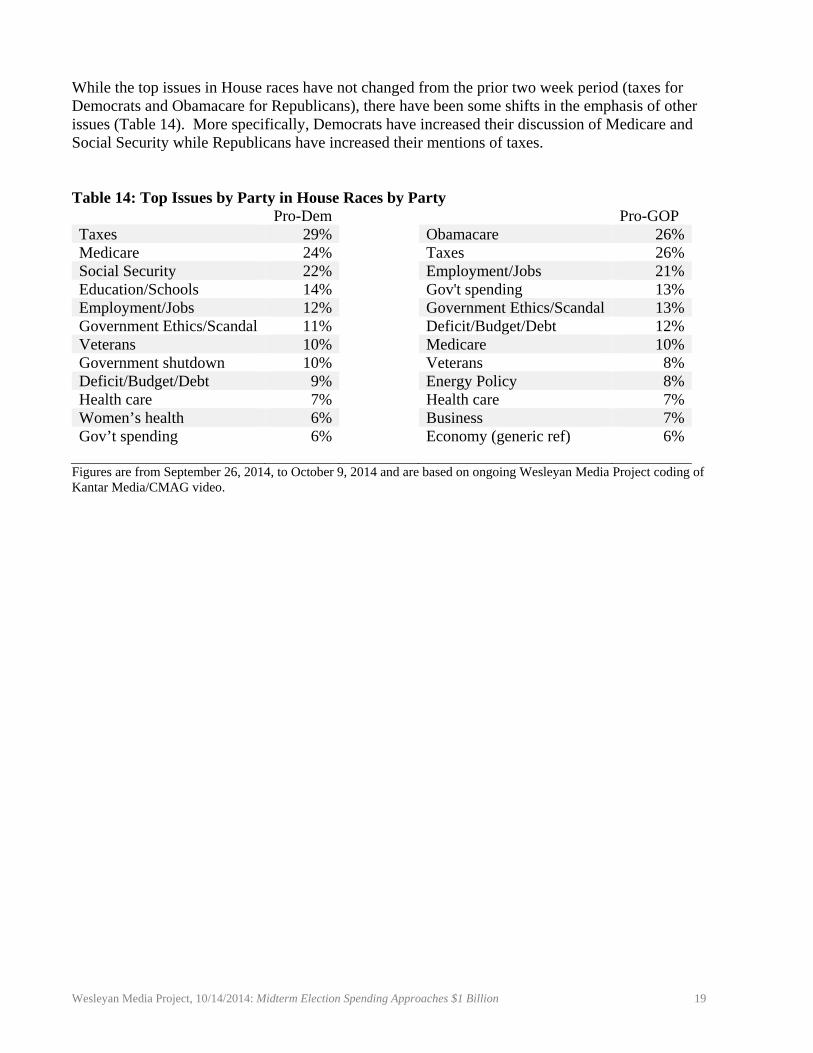
While the top issues in House races have not changed from the prior two week period (taxes for Democrats and Obamacare for Republicans), there have been some shifts in the emphasis of other issues (Table 14). More specifically, Democrats have increased their discussion of Medicare and Social Security while Republicans have increased their mentions of taxes. Table 14: Top Issues by Party in House Races by Party
Pro-Dem Pro-GOP Taxes 29% Obamacare 26%Medicare 24% Taxes 26%Social Security 22% Employment/Jobs 21%Education/Schools 14% Gov't spending 13%Employment/Jobs 12% Government Ethics/Scandal 13%Government Ethics/Scandal 11% Deficit/Budget/Debt 12%Veterans 10% Medicare 10%Government shutdown 10% Veterans 8%Deficit/Budget/Debt 9% Energy Policy 8%Health care 7% Health care 7%Women’s health 6% Business 7%Gov’t spending 6% Economy (generic ref) 6%
Figures are from September 26, 2014, to October 9, 2014 and are based on ongoing Wesleyan Media Project coding of Kantar Media/CMAG video.

Wesleyan Media Project, 10/14/2014: Midterm Election Spending Approaches $1 Billion 20
Affordable Care Act Ads Continue to Rise The number of ads mentioning the Affordable Care Act continues to rise as Election Day approaches, as Figure 5 reveals. The volume of ads attacking the ACA in House and Senate ads rose by nearly half (49 percent) from the previous two-week period to more than 25,000 airings. In races for governor (not pictured), the number of ads attacking the ACA went from 1,200 in the weeks just following Labor Day (Aug 29-Sept 11) to nearly 9,000 in the prior two week period (Sept 12-25) and nearly 12,000 in the past two weeks (Sept 26-Oct 9). Figure 5: Volume of Ads Referencing the Affordable Care Act (House/Senate Airings Only)
Numbers are based on ongoing Wesleyan Media Project coding of Kantar Media/CMAG video of ads aired in House and Senate races.
‐
5,000
10,000
15,000
20,000
25,000
30,000
Aug 1‐14 Aug 15‐28 Aug 29‐Sep 11 Sep 12‐25 Sep 26‐Oct 9
Anti‐ACA Not Anti‐ACA
Wesleyan Media Project, 10/14/2014: Midterm Election Spending Approaches $1 Billion 21
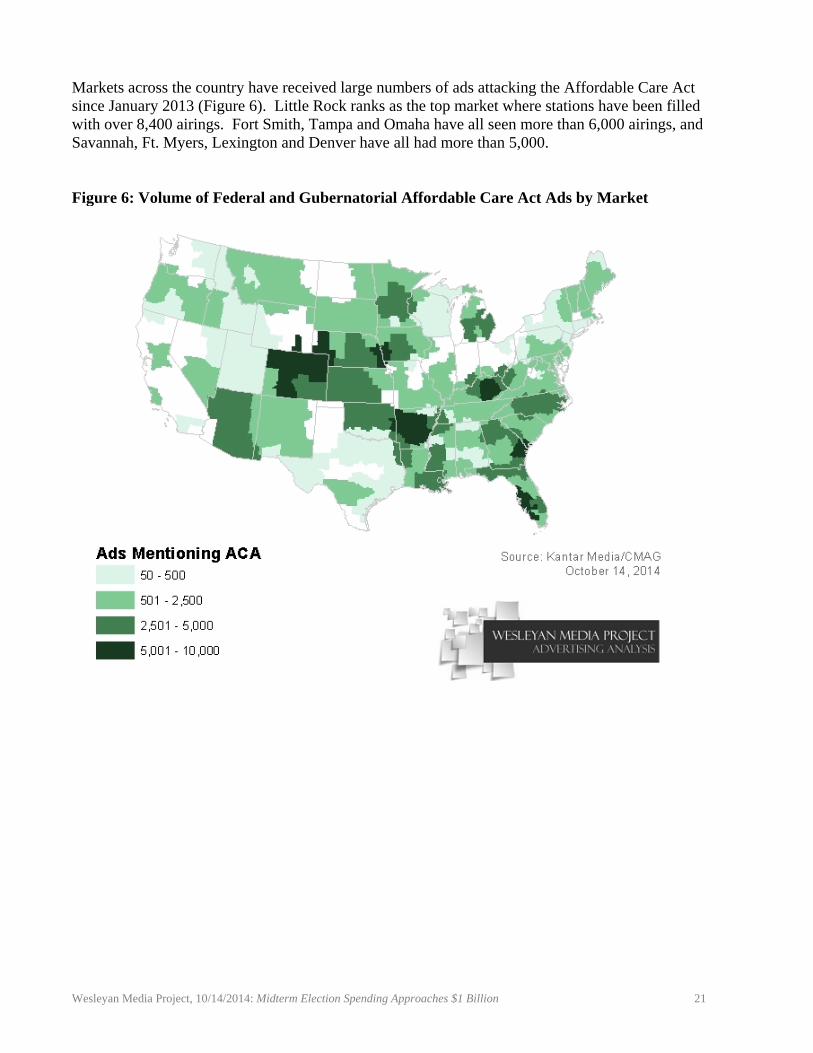
Markets across the country have received large numbers of ads attacking the Affordable Care Act since January 2013 (Figure 6). Little Rock ranks as the top market where stations have been filled with over 8,400 airings. Fort Smith, Tampa and Omaha have all seen more than 6,000 airings, and Savannah, Ft. Myers, Lexington and Denver have all had more than 5,000. Figure 6: Volume of Federal and Gubernatorial Affordable Care Act Ads by Market
Wesleyan Media Project, 10/14/2014: Midterm Election Spending Approaches $1 Billion 22
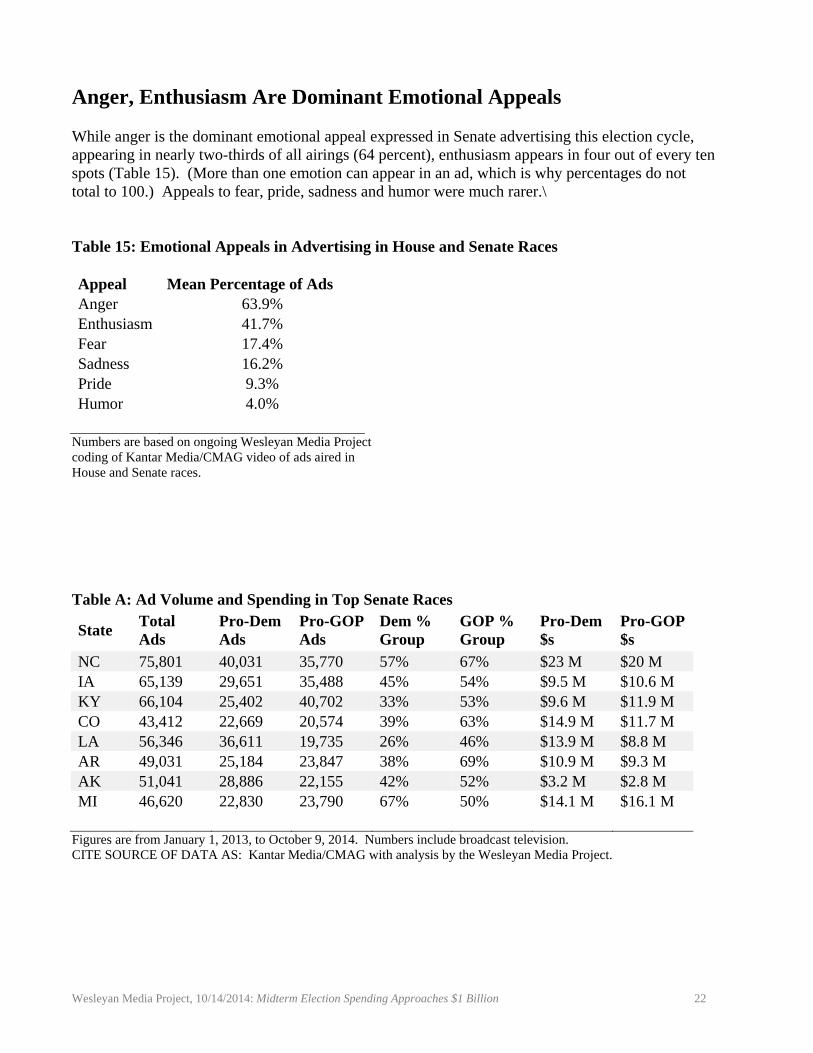
Anger, Enthusiasm Are Dominant Emotional Appeals While anger is the dominant emotional appeal expressed in Senate advertising this election cycle, appearing in nearly two-thirds of all airings (64 percent), enthusiasm appears in four out of every ten spots (Table 15). (More than one emotion can appear in an ad, which is why percentages do not total to 100.) Appeals to fear, pride, sadness and humor were much rarer.\ Table 15: Emotional Appeals in Advertising in House and Senate Races Appeal Mean Percentage of Ads Anger 63.9% Enthusiasm 41.7% Fear 17.4% Sadness 16.2% Pride 9.3% Humor 4.0%
Numbers are based on ongoing Wesleyan Media Project coding of Kantar Media/CMAG video of ads aired in House and Senate races. Table A: Ad Volume and Spending in Top Senate Races
State Total Ads
Pro-Dem Ads
Pro-GOP Ads
Dem % Group
GOP % Group
Pro-Dem $s
Pro-GOP $s
NC 75,801 40,031 35,770 57% 67% $23 M $20 M IA 65,139 29,651 35,488 45% 54% $9.5 M $10.6 M KY 66,104 25,402 40,702 33% 53% $9.6 M $11.9 M CO 43,412 22,669 20,574 39% 63% $14.9 M $11.7 M LA 56,346 36,611 19,735 26% 46% $13.9 M $8.8 M AR 49,031 25,184 23,847 38% 69% $10.9 M $9.3 M AK 51,041 28,886 22,155 42% 52% $3.2 M $2.8 M MI 46,620 22,830 23,790 67% 50% $14.1 M $16.1 M
Figures are from January 1, 2013, to October 9, 2014. Numbers include broadcast television. CITE SOURCE OF DATA AS: Kantar Media/CMAG with analysis by the Wesleyan Media Project.
Wesleyan Media Project, 10/14/2014: Midterm Election Spending Approaches $1 Billion 23
About This Report Data reported here do not cover local cable buys, only broadcast television and national cable buys. All cost estimates are precisely that: estimates. Content information is based on ongoing Wesleyan Media Project coding and analysis of Kantar Media/CMAG video, which is 95% complete for the time period discussed (98% complete for U.S. Senate races and 89% complete for U.S. House races). Intercoder reliability is high for measures of tone (95% agreement and a Kappa score of 0.92). Disclosure categorization information on interest groups comes from the Center for Responsive Politics. The Wesleyan Media Project provides real-time tracking and analysis of all political television advertising in an effort to increase transparency in elections. Housed in Wesleyan’s Quantitative Analysis Center – part of the Allbritton Center for the Study of Public Life – the Wesleyan Media Project is the successor to the Wisconsin Advertising Project, which disbanded in 2009. It is directed by Erika Franklin Fowler, assistant professor of government at Wesleyan University, Michael M. Franz, associate professor of government at Bowdoin College and Travis N. Ridout, associate professor of political science at Washington State University. Laura Baum is the Project Manager. The Wesleyan Media Project is supported by grants from The John S. and James L. Knight Foundation, the MacArthur Foundation and Wesleyan University. Data provided by Kantar Media/CMAG with analysis by the Wesleyan Media Project using Academiclip, a web-based coding tool. The Wesleyan Media Project is partnering in 2014 with both the Center for Responsive Politics, to provide added information on interest group disclosure, and Ace Metrix, to assess ad effectiveness. The Center for Responsive Politics is the nation’s premier research group tracking money in U.S. politics and its effect on elections and public policy. Nonpartisan, independent and nonprofit, the organization aims to create a more educated voter, an involved citizenry and a more transparent and responsive government. CRP’s award-winning website, OpenSecrets.org, is the most comprehensive resource available anywhere for federal campaign contribution and lobbying data and analysis. Periodic releases of data will be posted on the project’s website and dispersed via Twitter @wesmediaproject. To be added to our email update list, click here. For more information contact: Lauren Rubenstein, [email protected], (860) 685-3813
Wesleyan Media Project, 10/14/2014: Midterm Election Spending Approaches $1 Billion 24
About Wesleyan University Wesleyan University, in Middletown, Conn., is known for the excellence of its academic and co-curricular programs. With more than 2,900 undergraduates and 200 graduate students, Wesleyan is dedicated to providing a liberal arts education characterized by boldness, rigor and practical idealism. For more, visit www.wesleyan.edu. About the John S. and James L. Knight Foundation Knight Foundation supports transformational ideas that promote quality journalism, advance media innovation, engage communities and foster the arts. We believe that democracy thrives when people and communities are informed and engaged. For more, visit www.knightfoundation.org. About the MacArthur Foundation The MacArthur Foundation supports creative people and effective institutions committed to building a more just, verdant, and peaceful world. In addition to selecting the MacArthur Fellows, the Foundation works to defend human rights, advance global conservation and security, make cities better places, and understand how technology is affecting children and society. More information is at www.macfound.org.