ad-a258 - apps.dtic.mil · if, !tho~ ',f m-a,' q - ... been a great teacher and...
TRANSCRIPT

AD-A258 546ENTATION PAGE
r,.r..a ,..,,, I... , ,,J ,,"(r01,M , c, n CO .rme• t !r, j h, ,I-. ; e , .
5,t e W24.A rI .AA3C-p-11' If, !thO~ ',f M-A,' -q - 0r. P u , $.Ipe-o' fe,,ý lei,~i WflA*.Ci'de). W.,'
.AGENCY USE ONLY (Ied(v blank) 2. 'EPORT OATE 3. REPORT TYPE AIID DATES COVERED
1992 _______________________
4. TImLE AND SUBTITLE 5. FUNDING NUMBIERSPatterns of Urban Health Utilization in Patan, Nepal
6. AUTHOR(S)
Robert Reber Liu, Captain
7. I'EFORMING ORGANIZATION NAME(S) AND ADURESS(ES) 8. PERFORMING OIGANIZATIOIREPORT NUM0I4I•
AFIT Student Attending: Yale University AFIT/CI/CIA- 92-091
9. SPUNSORING/MONITORING AGENCY NAME(S) AND ADDRESS(E1. SPONSORING.! MNITOKING
AFIT/CI A B O0010. AGENCY REPORT NUMBER
Wright-Patterson AFB OH 45433-6583
11. SUPPLEMENTARY NOTES
. _ _
'.a. DISTMIUUTION:IAVAILABIL;TY STATFMAENT 126. DISTRII;UTION CUO'A-E
"Approved for Public Release lAW 190-1Distributed UnlimitedERNEST A. HAYGOOD, Captain, USAFExecutive Officer
13. ABSTRACT (Maxtmurnr 200 words)
14. SUBJECT TERMS 15. NUMBER V1 PAGtI
32lb, PRICE C Mtt
17, SECURITY CLASSIFICATION ib. SECURITY CLASSIFICATION 19, SECURITY CI,ASSIMCATION '0, LIMITATION Of AB.b•A• 0
OF REPORT OF TII(S PAGE OF ABSTRACT
SNSN 75,10-01. 280-5500
Patterns of Urban Health Utilization in Patan, Nepal
by
Robert Reber Liu
B.S. Columbia University 1980
M.D. Brown University 1984
IA Thesis Presented to
The Faculty of the Department of Epidemiology and Public Health
Yale University Accesion For
NTIS CRA&M
In Candidacy for the Degree of Unannounced
Master of Public Health Justification
1992 By...........
Distribution -
Availability Codes
, .Avail and I orDist Special
, I --/

Abstract ii
Patan Hospital (Nepal) is a 138 bed hospital which is responsible for
primary and secondary care in the city of Patan (population 117,173) and
secondary care in Lalitpur District (population 210,358). The residents of Patan
have under-utilized the hospital's primary care clinic. During the Summer of
1991, 310 door-to-door surveys were administered in Patan to assess patterns of
health-seeking behavior. The major barrier in utilizing the Patan Hospital
Clinic is its long waiting times. In general, as long as the care given is
speedy, the people were willing to pay more to attend a private physician.
People also were willing to pay less and attend a less experienced provider, the
compounder, for their speedy service. However, Patan Hospital Clinic is the most
common second choice, indicating that it is well respected. The Clinic could
consider alleviating the waiting time by redirecting those who attend from
outside their catchment area and using the waiting time constructively.I
I
Dedication
To the United States Air Force
I
iv
Acknowledgements
I wish to thank my wife, and sons (Timmy and David) for sacrificing their
summer and coming to Nepal. I am indebted to my Nepal sponsor Owen Lewis, MBBS
for taking care of us while we were in Nepal. I am grateful to my advisor James
Jekel, MD, MPH at Yale for guiding me on this survey. Eric Mood, MPH at Yale has
been a great teacher and encouragement.
I am grateful to the Committee on International Health in allowing me to
participate in the Down's International Travel Fellowship. I thank the Air Force
Institute of Technology (The United States Air Force) who allowed me to do this
field work in Nepal.

V
Table of Contents
List of Tables .................... ......................... vi
List of Figures ..................... ......................... viii
Chapter 1: Patan Hospital .................. .................... 1
Objectives .................... ........................ 2
Chapter 2: Background ................... ...................... 3
Review of Literature ................ ................... 7
Chapter 3: Door-to-Door Survey .............. ................. 10
Methods .......................... .......................... 10
Results .................... .......................... .. 12
Chapter 4: Clinic Survey .............. .................... 16
Methods .................... .......................... .. 16
Results ................... .......................... .. 16
Chapter 5: Discussion ............... ...................... .. 17
Study Limitations ............... ..................... .. 20
Chapter 6: Conclusions .............. ..................... .. 22
Chapter 7: Recommendations ............ ................... .. 23
Future Studies ................ ..................... .. 24
References and Notes ................ ...................... 25
Bibliography .................... .......................... 28
Appendix I: Survey ................ ....................... 31
Appendix II: Additional Tables .......... ................. .. 32
I
vi
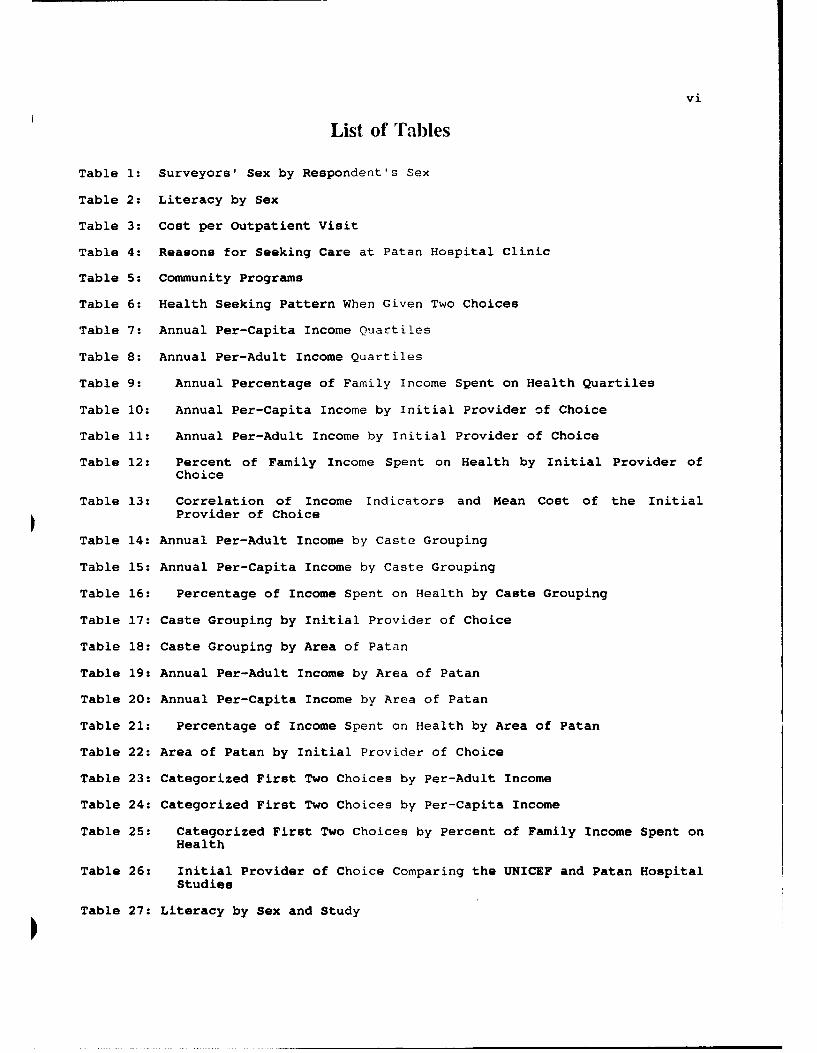
List of Tables
Table 1: Surveyors, Sex by Respondent's Sex
Table 2: Literacy by Sex
Table 3: Cost per Outpatient Visit
Table 4: Reasons for Seeking Care at Patan Hospital Clinic
Table 5: Community Programs
Table 6: Health Seeking Pattern When Given Two Choices
Table 7: Annual Per-Capita Income Quartiles
Table 8: Annual Per-Adult Income Quartiles
Table 9: Annual Percentage of Family Income Spent on Health Quartiles
Table 10: Annual Per-Capita Income by Initial Provider of Choice
Table 11: Annual Per-Adult Income by Initial Provider of Choice
Table 12: Percent of Family Income Spent on Health by Initial Provider ofChoice
Table 13: Correlation of Income Indicators and Mean Cost of the Initial
Provider of Choice
Table 14: Annual Per-Adult Income by Caste Grouping
Table 15: Annual Per-Capita Income by Caste Grouping
Table 16: Percentage of Income Spent on Health by Caste Grouping
Table 17: Caste Grouping by Initial Provider of Choice
Table 18: Caste Grouping by Area of Patan
Table 19: Annual Per-Adult Income by Area of Patan
Table 20: Annual Per-Capita Income by Area of Patan
Table 21: Percentage of Income Spent on Health by Area of Patan
Table 22: Area of Patan by Initial Provider of Choice
Table 23: Categorized First Two Choices by Per-Adult Income
Table 24: Categorized First Two Choices by Per-Capita Income
Table 25: Categorized First Two Choices by Percent of Family Income Spent onHealth
Table 26: Initial Provider of Choice Comparing the UNICEF and Patan Hospital
Studies
Table 27: Literacy by Sex and Study

vii
Table 28: Comparison of Patan Hospital Inpatient and New OutpatientResidencies
Table A: Caste Groupings
Table B: Literacy by Area of Patan
Table C: Combined First Two Choices by Per-Adult Income
Table D: Combined First Two Choices by Per-Capita Income
Table E: Combined First Two Choices by Percent of Family Income Spent onHealth
viii
List of Figures
Figure 1: Patan Hospital Revenue Sources, 1990
Figure 2: Patan Hospital, Inpatient Residencies, 1990
Figure 3: Map of Nepal
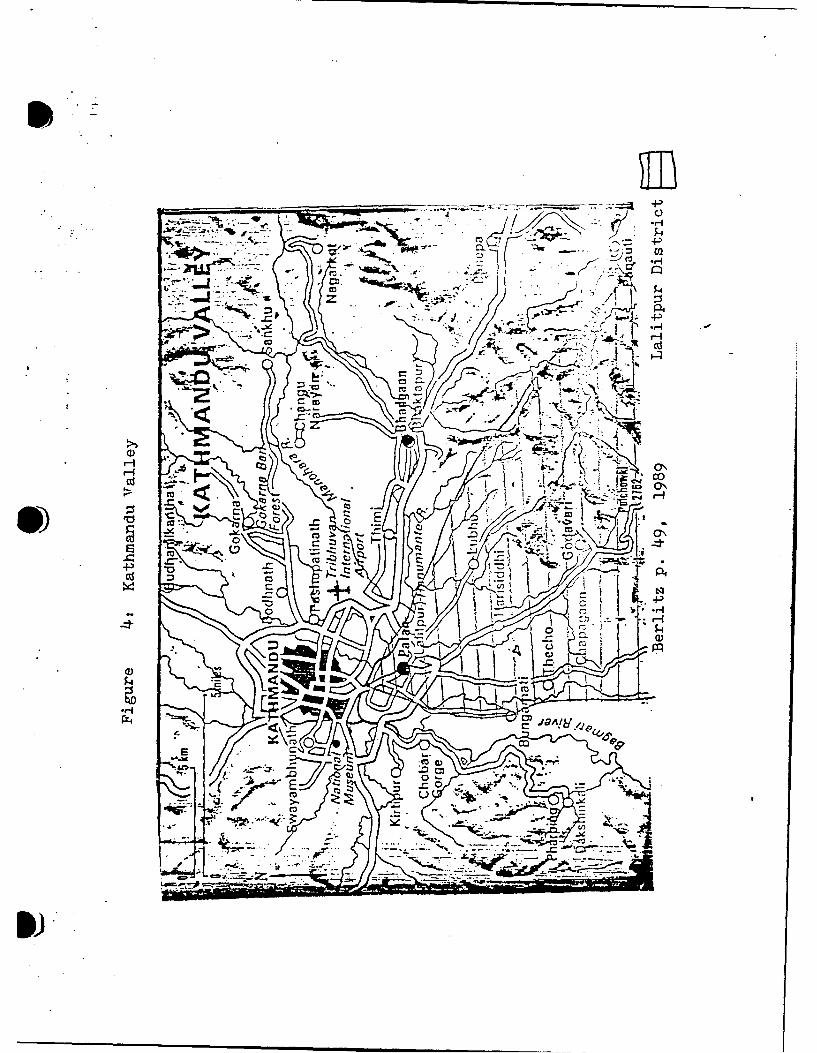
Figure 4: Map of Kathmandu Valley
Figure 5: Initial Provider of Choice, UNICEF Study
Figure 6: Patan's 22 Wards
Figure 7: Area of Patan Surveyed
Figure 8: Caste Grouping
Figure 9: Respondent's Family Position
Figure 10: Initial Provider of Choice
Figure 11: Second Provider of Choice
Figure 12: New Patient's Residencies, 1990
Figure 13: Patan Hospital Clinic, Annual Visits
Figure 14: Outpatient Visits by Month, 1990
Figure A: Ethnic Groups in Survey
Figure B: Castes in Survey

Chapter 1: Patan Hospital
Patan Hospital was founded by Christian missionaries in 1954 when Nepalopened its doors to Western assistance. From the beginning, the hospital has hadan outpatient primary care clinic. Initially the hospital was located in aformer palace but steadily grew to the point where the facility was no longeradequate. So in 1982 it moved to a new building 3 miles from its old site, whereit is today. The hospital is easily accessible from the neighboring cities ofKathmandu and Bhaktapur via buses.
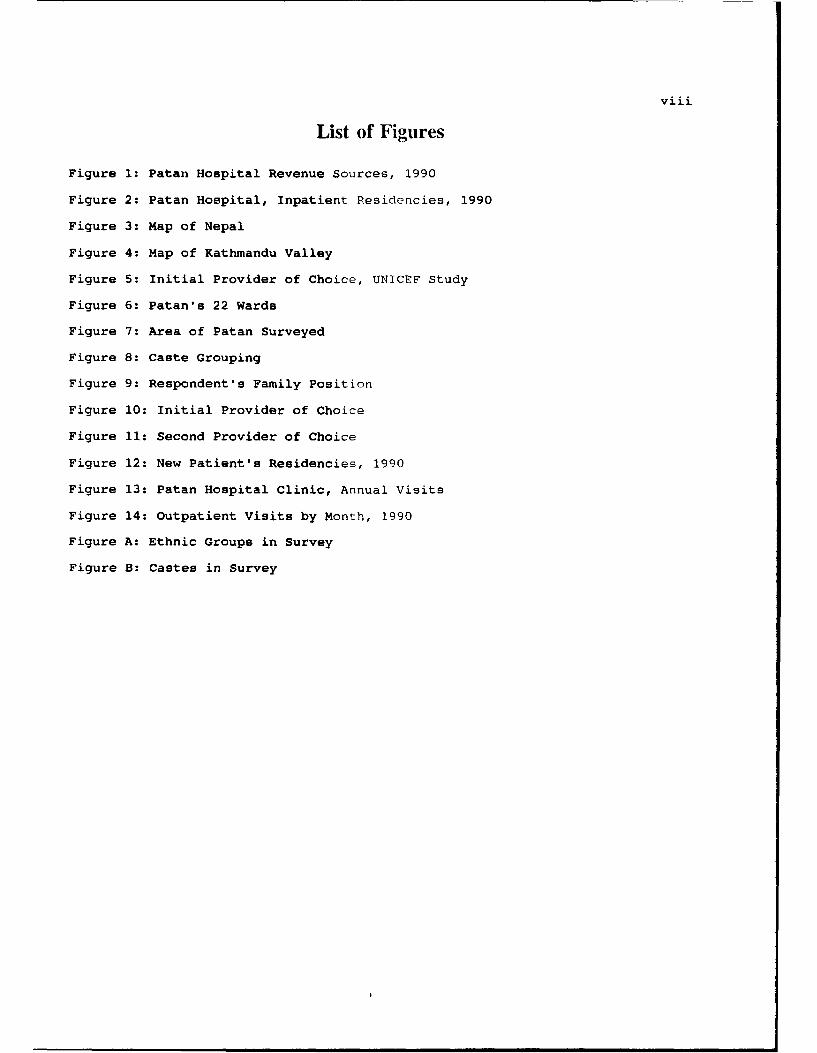
Patan Hospital is managed by Westerners under the umbrella organization ofthe United Mission to Nepal (UMN). This non-governmental developmentorganization is composed of 39 Christian groups from 19 countries. However thehospital's staff is more than two-thirds Nepali, including the medical staff.Many of the Nepali staff are Hindu. In 1990, the UMN contributed 29% of thehospital's operational expenses and the Nepali government contributed 2% (Figure1). Fees provided the remainder of the revenue. Although the inpatient servicesare heavily subsidized, the outpatient services are financially self-sufficient.One of the goals of the UMN is to assure that every project that it initiateswill eventually be turned over to the nationals.
Patan Hospital Clinic
The Patan Hospital Clinic has grown steadily since its founding.Presently, its staff of 40 practitioners consists of 13 physicians (full andpart-time), 13 health assistants, and the other 14 are various ancillary workers.All but three physicians are Nepali. The Clinic's major role is primary care,but it has some secondary referral functions (obstetrics, gynecology, internalmedicine, surgery, dentistry, and pediatrics). The Clinic is open 5 days a week,
Sclcsed Saturdays and Wednesdays. Nationally, most businesses are closedSaturday; Wednesday is their in-service day.
In the morning before seeing a health care provider, a Clinic patient linesup to pay a registration fee and to receive a ticket. The tickets are issuedfrom 8 to 10 am, and typically patients start lining up at 6 am. If one does notreceive a ticket by 10 am, the person must return another day to wait in line.Appointments are not given. Due to waiting in at least three lines(registration, cashier, and pharmacy), a patient commonly may spend his or herentire day at the Clinic. The Clinic has tried alternative registration schemesto relieve these frustrations, but so far without success.
Several crowds wait in a large dimly lit lobby (Picture 1). As patientsnear a practitioner, they are weighed and allowed to wait in a smaller room wherethe practitioner is (Picture 2). In this room, minimal privacy is observed.Patients are easily seen and over-heard explaining their personal medicalconcerns to the practitioner.
The registration fee is 6 Rupees (Rs.) (equivalent to US $0.15; August1991: US $1 = 40 Rs.) and covers the cost of being seen by the provider. If apatient requires laboratory tests (urine, blood, stool, x-rays) or medicines,there is an additional cost. If the patient has been to the Clinic previouslyand has brought his record (records are maintained by the patient), theregistration fee is 1 rupee less.
Reduced fees are given to approximately 7% of the outpatients. There isno overt solicitation by the Clinic staff in promoting lower fees. However ifa patient expresses financial difficulties, they are referred to a social workerwho makes the final determination. The social worker, who is Nepali, hasdifficulty determining those in real need because all Nepalis see themselves aspoor.
Nepal has no national health insurance. In Patan Hospital Clinic, as inmost facilities, patients pay out-of-pocket, usually up-front. Patan Hospitaloffers a local health insurance to the urban and rural communities. About 15%of the families in the urban area and 30% around the rural health posts haveparticipated'.
There are three main primary care clinics: male, female, and under five
BESTAVAILABLE COPY
cri
0
U)
00
.. .... ... ...0. .. ........
co(.... ......0...... ..I.. .....
OL0..... ....... .. .
......... . . . . . . . . . .. . . . . . . ......................~ .....

Picture 2: Paractitioners SreeigPtet
: 7
PaaPictare 2:PractPtioner Neepal 1991nt
2
years. In each clinic daily limits cxist on the total number of patients and newpatients seen. In the male clinic, a rni< imum of 100 patients are seen in themorning and 60 in the afternoon. Th-re an antenatal clinic which sees 40-50patients per day and charges 13 Rs. The secondary referral specialty clinics arerun at various times during the week. The lines for the specialty clinics aremuch shorter. There is another primary care clinic where one can make anappointment several days in advance to see a physician; however, the fees are 10times as much. It is mostly utilized by Westerners and well-to-do Nepalis. Thisclinic sees about 15 patients each day and is under-utilized.
The government has mandated that the Clinic provide primary and secondarycare for the residents of Patan (population: 117,173) and secondary care for theresidents of rural Lalitpur (population 93,185). Patan Hospital is the districthospital for Lalitpur District; Patan 's the district capital. The health postsin rural Lalitpur refer 500-1000 patients annually. However, there are about.150,000 outpatients visits annually, many of whom come from outside the Clinic'scatchment area of Patan and rural Lalitpur. No restrictions exist directingpatients to specific medical facilities.
In 1990, the inpatient records show 31% of the inpatients were from Patanand 42% from their entire catchment area of Patan and rural Lalitpur (Figure 2).Similar figures are not available from the Clinic, although the inpatients comefrom the Clinic and the emergency room.
Community Development and Health Project
Working alongside Patan Hos;pital is the UMN's Lalitpur CommunityDevelopment and Health Project (CDHP). The CDHP has responsibilities incommunity health development in both urban Patan and rural Lalitpur. The CDHP'soffices are in Patan Hospital, and the CDHP's staff often interface with theClinic. Two physicians work half-time in Patan Hospital Clinic and half-time inthe CDHP. In Patan, the CDHP maintains the 4 maternal and child health (MCH)clinics which are staffed by paramedical workers. The MCH clinics are involvedin family planning (depo-provera injections), well child care, and prenatal care.However their services are under-utilized. Showing health videos and doing homevisits are some of their other major activities. During the Spring of 1991, theCHDP staff started teaching community members about chlorination of well water.
Objectives
Even though the Clinic is bein'j overwhelmed with the large crowds seekingcare, the CDHP staff have noted that the people in the immediate community arenot readily attending the Clinic. There seems to be a significant barrier tocare at the Clinic for these people. The Clinic desires to make themselves moreattractive to those in Patan. Therefore the main study objective was toelucidate these barriers and to offrýr suggestions in dealing with them. Lookingat it from another angle, perhaps those unfamiliar with the Clinic preferredother health care providers, so determinants which predicted health-seekingbehavior were sought. Other objectivos wore to quantify the Clinic's growth andto determine where Clinic patients enme from.
Hypotheses
To assess what were the barriers for attending the Patan Hospital Clinic,a door-to-door survey of Patan was done. To assess the Clinic's growth andpatient's home area, a survey of the Clinic's records was done. The majorhypotheses were that cost, langua'le, waiting time, lack of privacy, andWesternism were major barriers to C!inic utilization. Another hypothesis wasthat a large portion of the Clinic'1 rorulation resided outside its catchmentarea.

04
cai
E
CY),-Q)
CD~
Cl).6
coc
0)r
CIOC)L CZ
0
zn

* 3
Chapter 2: Rackground
Global urbanization is changing the strategy of health care delivery. Forrural areas, the World Health Organization (WHO) has designated that the healthpost, staffed by paramedical workers, be the first encounter for medical care.Health posts are strategically planned, so that patients can only attend one ina given locale. However, in the urban areas there is a variety of choices formedical care, due to more abundant health facilities. Typically urban areas havehospitals, clinics, pharmacies, and specialists, luxuries that are lacking inrural areas.
Urbanization has contributed to other health concerns besides utilization,such as sanitation, overcrowding, housing, nutrition, and education. UNICEF ismeeting this challenge through its Urban Basic Services Program which has beenimplemented in about 40 countries to meet the needs of the urban poor. In Indiait has reached national coverage. However in Nepal UNICEF is initiating needs-assessment studies in several urban areas. In 1990, the first UNICEF survey wasdone in a small neighborhood of Patan•.
Nepal
Although Nepal is one of the least urbanized countries in South Asia, ittoo is becoming increasingly urbanized. In 1970, the country only had a 4.0%urban population. The urban population was estimated to be 8.2% in 1986. Thiscontrasts with its neighbor India in which 25% of its population was consideredurban (1987).3 In 1990, 45% of the Lalitpur District's citizens lived in thePatan4 urban area. From 1980 to 1990, the District population grew at annualrate of 4.0%, whereas, the urban area grew at 4.7%. Nepal's population growthfrom 1970 to 1980 was 2.7% annually.
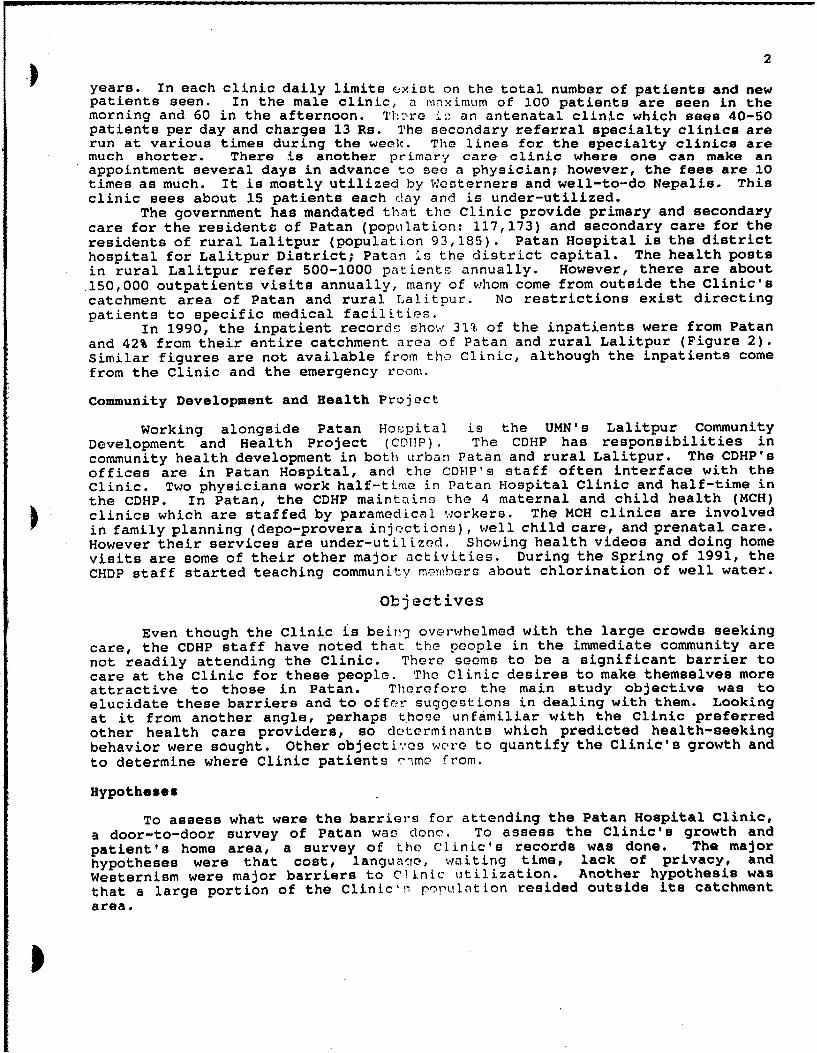
Nepal is a small land locked-country about the area (147,181 sq. km. or56,827 sq. mi.) of the state of Iowa (Figure 3). Yet it is thinner and longer(550 mi. by 100 mi.; 885 km. by 161 km.) than Iowa. India is on its south andTibet/China on its north. It is known for its breath-taking Himalayan mountains.The elevation ranges from 29,000 feet (8848 m.) (Mount Everest) on the north to200 feet (62 m.) on the southern plains area. Its latitude (280 N.) is that ofFlorida. Its climate depends on the elevation. There is a summer monsoon seasonand dry season for the remainder of the year. The majority of the populationlives in the subtropical foothills of the Himalayan mountains (4000 feet; 1220m.). This is where Nepali history started in the first century A.D. As thepopulation has expanded during this century, there has been a significantmigration to the more tropical low-land plains, which is now the most fertile andfastest growing part of Nepal.
The population of Nepal is approximately 18 million. The central hillscontain 62% of the population and the plains contain 38%. The mountainousnorthern area has a very small population. Nepal is composed of about 35 ethnicgroups with about 33 languages. However Nepali is the unifying language. Inthe Kathmandu Valley, the Newars are the major ethnic group.
Patan (elevation 1400 m., 4600 ft.) is one of three cities in the KathmanduValley (Figure 4). Its 1990 population was 117,17367 (population density of 570per sq. km.). It is adjacent to the capital Kathmandu (population of over 1/2million and double the population density of Patan) and another city, Bhaktapur.The population of these three neighb)oring cities is about 1 million, making itthe largest urban area in Nepal. Since 1980, the population has grown by 37,298(4.7% annually). This is evident when one tours the city.
Patan can be divided into three developmental areas, "new", "intermediate",and "old" Patan. The center of the city is in "old" Patan; the highestconcentration of shops is located here. "Intermediate" and "new" Patan surround"old" Patan. "Intermediate" Patan hap housing that is very close together,whereas "new" Patan has many more affluent homes that are farther apart. PatanHospital is in "new" Patan.
From a Western point of view, Nopalis are friendly and obliging. Theirculture is full of family tradition. Tho elders are respected; marriages are
ý44
4 0
4 ( m4&
z ~.0.
0i .
H ) LJ
U-, ..
3
r4z
r4z
-rJ
Z 04
w z. .
Z . . - .
00 u- V
4 -P
-
IDco--
op,
-
- t) &I
r-,,
-~ :7 :L*; K'ca:g
CO A !6 i I-
4
arranged; and children are nurtured. The husband is the head of the household,but the wife is the overworked caretaker. For the most part, extended familiesreside in the same area for generations which contributes to their sense ofbelonging. Buying a house takes priority over education or business. In Patan,the Newari group is especially artistic with wood and metal.
Although the government provides "free" education until 8th grade manypoor families find it too costly to send their children to school. They cannotafford the required uniforms and supplies. In addition, during the planting orharvesting season the children are tahon out of school to work in the fields.The lower castes are allowed to attend schools, but there is significant socialostracism of these castes in school so that they often drop out. ThereforeNepal's literacy for adults over 14 years old is only 8% for females and 30% formales. 3 The urban areas are more affluent and have a significant number ofprestigious private schools available. In the Lalitpur District the reportedliteracy is 20% for females and 46% for males.8 The UNICEF survey (1990)2 showeda 53% literacy among males and 14% literacy among females in their sample inPatan.
Nepal has a rich religious heritage. It is the only country in the worldwhere Hinduism is the state religion (90% adherence). One of the features ofNepal is the plethora of religious Fhrines, some of which date back centuries.In their daily religious practices, shrine offerings become routine. Buddhismand Hinduism are intertwined in Nepal. Hindus will worship in Buddhist templesand vice versa. Buddha was born inico a Hindu Newari family in Nepal, so thissyncretism is long standing. With the caste system, a certain element offatalism exists. However it is different from India's caste system. Nepali lawsprohibit discrimination based on caste.
Nepal is listed among the 5 least developed countries in the world. Itsmain resource, water, is vastly under-utilized for hydro-electric power. About95% of the workers are involved in subsistence agriculture which makes up about70% of the GNP. The average per-capita income is US $160 per year, among thepoorest in the world. A major reason for its underdevelopment is its ruggedtopography, which contributes to rlopal's inadequate roads and lack of railsystem. Nepal is a recipient of much foreign aid. The US, United Kingdom, andJapan are among the largest bilateral contributors. The United Nations has amajor role in multilateral development also.
Nepal's political history is focused on several ruling families. Nepal wasisolated from the West and the 20th century until a revolt in 1951. The newmonarchy then welcomed foreign aid. In the past 3 years, there has been apopular movement from the constituti'nn! monarchy towards democracy. The recentstudent-initiated revolution has been bloodless for the most part. As a result,the king has decided to forego his absolute authority to permit a democraticallyelected congress. A new constitution was written, and elections for congresswere held in the Spring of 1991. There was still minor unrest while this studywas conducted, so the political changes are not yet solidified.
Sanitation is a major problem in the Nepal, particularly in the urbanareas. In 1975, about 17.2% of urban and 0.2% of rural residents were served bysanitation facilities representing 1 .7% of the total population'5 . In Patan, mosthouseholds lack sanitary toilet facilities. Often there are pit toilets that arelocated too close to the household well, causing contamination. Feces arecommonly seen in the street, often frcm young children and animals. Nepalis liketo keep their own living area clean but often dispose of garbage on the street.Chickens and pigs often feed in these transh heaps.
The sewage ditches are adjacent to the city water mains. Since the watermains have many leaks, raw sewage is drawn into the city water because of thefluctuating low pressure. This often happens during the summer monsoons, whenthe sewage ditches are at their fullest. Observations have corroborated that thesummer monsoons are associated with an increase in diarrheal diseases. Thus,poor engineering has contributed to waterborne illnesses.
Due to these and similar problems, Nepal is a country struggling with manyhealth problems that the West has not encountered in decades. Significantinfectious diseases, including diarrheal diseases, acute respiratory diseases,tuberculosis, malaria, leprosy, and neonntal tetanus are commonplace. Maternal
5perinatal complications are a leading cause of morbidity. Clearly, the majorgroups who suffer most are the women and small children.
Providers of Care
Nepalis seek medical care frc:n a .ide variety of health practitioners,ranging from traditional healers to the ',estern allopathic physicians. There isalso an element of self-care. Many times the advice sought depends on thealiment. If there is overt trauma, one may go to the Western hospital emergencyroom. If there are stomach pains, one may seek out the traditional healer.
The traditional healer is known as a jhankri or dhami. These the shamansof the Hindu culture, deal with the spirit world. Boskis are witches who castspells to inflict pain (head, stomach, etc.) in their victims, so the role of thejhankri is to reverse these spirit c.rses. They often use mantras and prayers.At times they go into a trance to accomplish their desired effects. Thesehealers generally practice part-time, while being employed full-time elsewhere.Their numbers are most abundant in the rural areas. In Nepal, at least three-fourths of all illness are treated b'., the traditional healers9 .
The Western allopathic physicians are few compared to the jhankris.Typically, they are concentrated in t~he urban areas. Most of the physicians havebeen trained in India. In the past V) years, Nepal has started a medical schoolwhich graduates less than 50 per year. H[owever Nepalis desire to attend medicalschool outside Nepal, because Nepal's school is not well known. A small groupof Western physicians, many of whom have learned the language, practice in Nepal.
Physicians work at the hospital or in health centers. These are typicallylow-paying government positions, so most of them work in private clinics earlyin the morning or evenings. This is where physicians make substantial money.They maintain their government positions because it is a source of privatepatients, and because they need a hospital affiliation to admit their privatepatients. People attend these private clinics because of accessibility.Typically, one can see a specialist privately first, bypassing the long hospitalreferral process.
Practitioners such as health nisstants, nurses, village health workers,midwives, and compounders are trained in allopathic medicine. A variety oftraining programs have come and gone for these practitioners. For the most part,they require at least an 8th grade education with training lasting from a fewmonths to a few years. The Patan Hospital Clinic uses two health assistants perphysician. Health assistants do the majority of the patient care, referring thedifficult cases to the physicians. Another respected group of practitioners isthe compounders. They were initially trained for giving injections and changingdressings, so their training is leen than that of a health worker. However,through experience, they often treat a number of common medical problems. Someof the health workers and many compounders have their private clinics outside ofthe hospital clinics.
In Nepal the pharmacists have increasingly become providers of care. Theirgovernment training programs do ncL tllow them to give certain medicationswithout prescriptions. However, practically Speaking, these rules are notfollowed. Often patients ask what may be effective for common ailments likecough or diarrhea, and pharmacists nell them a prescription medication'0 . Inorder to increase business, many phirmacies have adjacent examining rooms forprivate physicians or other providers of care.
This liberal dispensing of medications has been suspected of contributingto resistant organisms. For exam.le, in Nepal most salmonella strains areresistant to antibiotics, which are commeonly used to treat it in the West. Thisis probably due to the dispensing of incufficient amounts of medicine, becausepatients cannot afford the full course treatment. Furthermore, the pharmacistsmay be selling the wrong antibiotic because of misdiagnosis.
Near Patan Hospital are two te.'tiary government hospitals (300 beds each),which have primary care and specialty clinics. Both these hospitals are inKathmandu and are Nepal's premiere central hospitals. Bir Hospital" dates back) to the late 1950's. The Teaching Hc'pitai dates back to the late 1970's and isthe hospital affiliated with the mollicnl school. Both of these hospitals are

6
easily accessible from Patan. A pullic bus even stops in front of Patan, Bir,and Teaching Hospitals. The bus ride from Patan Hospital to Bir and TeachingHospitals takes 20 and 30 minutes, respectively.
There are several specialty ho-nitnls nearby. They include eye, leprosy,mental health, maternity, infectious disease, children's and tuberculosishospitals. A class of hospitals know.n as "nursing homes" are not nursing homesas we know them. Essentially they are small (5-30 beds) hospitals for therichest citizens of Nepal.
Women have several options in obstetrical care. Patan Hospital Clinicprovides obstetrical care. There are also 4 MCH clinics affiliated with Patan-Hospital, where women can obtain pr-natal care and deliver in Patan Hospital.There is the government Maternity Hospital, which is about 20 minutes away inKathmandu. Another option is home delivery with a midwife.
Midwives receive a wide range of training. The traditional birth attendant(TBA) has learned her trade from another woman, most likely her mother. Many ofthese TBAs use cultural practices, such as having another woman cut the umbilicalcord several days after birth. Many of these TBAs are illiterate, but they arethe source of much health information. Home deliveries are also performed byWestern trained midwives.
Finally, there are the ayurvedic he:alers who use natural medicines (suchas plants or goat urine). They ar? hncwn as vaidhyas. These practitionersemploy elements of traditional and Western medicine. The nation's medical schoolgraduates about 30 ayurvedic healerc per year. However, most of them are trainedby others in the rural setting. These people are viewed as the generalpractitioners of the village. They place heavy emphasis on pulses of the wrist.They also may use x-rays or consult with the spirits for diagnosis. Treatmentsmay involve reciting a mantra (verse), changing a diet, or giving a medicinalpotion. There is a 50 bed ayurvedic hospital in Patan.
* Community Health Development
Since moving in 1982, Patan Ho5-pital's governing board has had communityrepresentation. Community participation is crucial for development. Too often,over-zealous foreign development hac mnade Nepal more dependent and powerless.Participation increases program coverage, efficiency, and effectiveness. Equityand self-reliance is fostered'2 . This helps realize the UMN's goal of turningthe hospital over to the nationals.
The following illustrates the power of community participation. In one ofthe CHDP's target wards, the community desired a local health clinic. Thoughenthusiastic but without funds, they tore bricks off the sidewalk to build it.This community sensed participation as contribution, organization, andempowerment' 2.
Community involvement fostered at the ward and even block level is mostbeneficial. An example of this involvement is the CDHP'8 chlorination of waterwells program. It has enjoyed sucv-es, in teaching people the proper way tochlorinate their wells. It was found that teenagers were often the mostimportant and reliable participants, andl therefore the community benefitted frompersonal involvement.
Nepal has adopted the WHO's Alm2-Ata'!: concept of primary health carestarting with 816 health posts" with a referral network ending at centralhospitals. There are several levels of health workers, from village healthworkers to physicians. One of primary health care's goals is to maximizecommunity participation, but too often it practices its own programmatic agenda.Therefore, although widespread, primary health care has not fulfilled its desiredimpact. Specifically, the local trepnlis believe that they posses adequatepreventive knowledge, so they desire curative medicine. However, to fulfill oneof primary health care's goals, health education is still preached to the ruralmasses. In its negative view toward indigenous medicine, primary health care hasfailed to integrate fully traditional healers into primary health care's"program". A lesson learned is

7
"that within the traditional system, it is the clients and not thehealers who are in command"'1 4.
Due to these shortcomings, one needs to take a cautious view of what is done inthe name of primary health care.
Review of Literature
The government spends about Us $1.63 per-capita per year on healthservices. The average for Southeast Asia is US $4.12". In 1985, the governmentspent just over 5% of its budget on health, and 65% of that was allocated forprimary health care services'5 . In 1976, the estimated out-of-pocket expenditurefor health services and supplies was 15 to 40 Re. per person per year"representing about 3% of the average annual per-capita income".
In the early 1950's, only 30 physicians existed for the entire country.In 1988, this increased to 879 physicians for the entire country, or onephysician per 20,471 people (or 0.5 per 10,000) with about 18 times as manyphysicians per population in the urban areas. An estimated 60% of Nepal'sphysicians live in the Kathmandu Valley where only 13% of the people reside'5 .By comparison in 1985, the U.S. had one physician per 450 people (or 22 per10,000)"0.
The following are some reported vital statistics17. Nepal's infantmortality rate in 1987 was 106 deaths per 1000 live births. This contrasts withabout 250 deaths per 1000 live births in 1954. A recent average for SoutheastAsia is 69 deaths per 1,000 live births'". The life expectancy at birth in 1988was 54 years for males and 51 years for females. In 1954, it was 27 years formales and 29 years for females. Life expectancy is about 6 years greater amongthe urban population than the rural population. In 1987, the crude birth ratewas 41.6 per 1000 people with a crude death rate of 14.9 per 1000 people. Nepalhas seen an annual population growth rate of 2.7% from 1971 - 1981. Thereforeover-population is a major problem in Mepal. The agricultural productivity hasnot kept pace with the population. Although overt starvation is not evident,there are definite medical problems due to malnutrition. In 1985, an estimated7% of children under 5 years old recei,,ed adequate nutrition'".
Urban hospitals are typically secondary and tertiary referral centers, soit seems antithetical that hospitals participate in primary health care. Aformer medical superintendent of Patan Hospital struggled with this as he notedthe growing crowds at the Clinic. In 1987, he published how ho:ipitals shouldparticipate in primary health care ". Since it is more expensive for hospitalsthan health posts to carry out primary health care, maybe hospitals should limitthemselves to seeing only secondary referrals from health posts. In Patan andLalitpur, there is virtually no control over the utilization of healthfacilities, so hospital clinics may usurp patients from health posts. Since-thisis a common struggle among hospitals, the WHO has published some guidelines tohelp hospitals in their primary health care practices"o. They state thathospitals can accomplish primary health care through integration with the localhealth system and community involvement.
In previous studies, strict adherence to questionnaire administration hasyielded unreliable information in developing countries and Nepal=. Conventionalquestionnaires are probably misunderstood in predominately illiterate non-Westerncultures. Therefore, medical anthropologists employ informal qualitative methodof participant observation for health behavior data gatheringi'.
Conceptual misunderstanding thiough cultural reinterpretation of questionshas contributed to non-sampling errors in survey research. "Non-sampling errors"("measurement error" or "method artifact") is attributed to "courtesy bias" or"response set". In Nepal a conventional fertility survey (knowledge, attitude,and practice) was compared to informil interviews. There were significantdifferences in the data gathered.
"This experiment demonstrated that non-sampling error for the kind ofknowledge and attitudinal variabloo measured in the survey was far greaterthan what is normally computed as a sampling error. One reason for

i 8
inaccuracy concerned the cultural rcintorpretation of survey questions byrespondents. In more general ter-mr it is argued that surveys are limitedby a "contextual bias" (reliar'ce on only one context for gathering data)that may render survey data irnc-urate or misleading."•
The authors recommend that traditional surveys should not be replaced withqualitative methods but that qualitativc' methods and surveys supplement eachother.
Due to the plural medical systom evident in this area of Nepal, it wouldseem that patients typically have an ecloctic view of health care. Classically,medical anthropology has assumed tha' traditional healers are effective on socialand psychological levels of illness, ind Western medicine's strength is dealingwith the pathology of illness. Howcver in over 400 interviews, Skultans (1986)
,concluded,
"in the Kathmandu Valley t!i',7 picture of the healer aspsychotherapist and social nd.Ltr wa- not endorsed, nor was theclaim that a medically plural soci•ty fosters an easy eclecticismaltogether supported."3
Skultans (1986) noted also,
"Most patients are firmly committed to one style of treatment ratherthan eclecticism. "•
Using Andersen's Health Behavi-ral Model 4 in determining health carebehavior, Subedi (1989) surveyed 659 people who went to Western hospitals inKathmanduO. Subedi (1989) observed that these people first used home remedies.
"Next they seek the indigenous health services; it appears that whenthey turn to the modern health srvices, they do so because of theirdissatisfaction with the previouc folk or traditional help providedor because an indigenous health professional advised them to seekmodern hospital services."2
Subedi (1989) concluded:
"The findings show that the presence of medical pluralism is asignificant factor whic4h delays us3 of modern health services."26
On the other hand, some may simultaneously attend the Western practitionerand the traditional healer. It has beon observed that a Nepali may seek carefrom a Western practitioner and the traditional healer for his TB. Their logicis as follows: He believes in the effectiveness of Western medicine, but thereis a need for spiritual cleansing. if ho is the only one of fifteen in a crowdedhousehold who gets TB, then he beli'vo' that he may be cursed. Thus, thisspiritual dimension of disease needs to be addressed by the traditional healer.
The UNICEF (1990)2 survey asked who was the preferred initial provider ofchoice (Figure 5). For their sample of Pntan, the traditional healer (28%) wasthe foremost preferred initial provider of choice, and Patan Hospital Clinic(20%) was next. When the respondents were asked why the people would not usehospital clinics for medical care,
"distance was a factor. This is surprising as the nearest hospital(Patan Hospital] at Lagankhel is about 10 minutes walk away.Other significant reasons for nol: uting hospitals included cost andstaff attitudes."•
Developing countries have found a steep distance-decay gradient, which isespecially pronounced in the rural arons- the further away a person lives fromS health services the less it is utillod. In Uganda the average individualattendance per year halves every 2 miles (3.2 km), and in India it halves every

C-
0-LL. Co o 0LU co (1)-> ~> o
Vam 0C-C
0 0\ E\
0)
0 0o
czz
9
½ mile (0.8 km.)28. Walking long dictancon involves considerable time, effort,and often pain. similarly, waiting time nlI;o may be an important limiting factorto access of care.
In the urban setting, there iq lcq transportation time, but increasedcrowds producing long waiting times. In Port Sudan (Sudan), a city of 250,000people, significant dissatisfaction w"ar expressed at the long waiting times bythe patients of a hospital's (500 b rr) primary care clinic". A recommendationfrom that study was that the hospit-lI clinic see only secondary referrals fromthe city's health centers". This exneri once is duplicated in Western countriesalso. In Los Angeles (USA), low-inconme women prefer more expensive privatephysicians over public clinics for f!zily planning. One factor involved was the-longer waiting room times at the pui!Ac clinics3 '.
In Nigeria (1986)3, long clinic waiiting time hampered health care in thecommunity, particularly preventive rorv"cas. Another study in Nigeria (1984)'demonstrated that adding an immunization rtation in that clinic reduced waitingtime. Additionally, immunization ccve.-nie was improved.
i|

10
Chapter 3: Door-to-Door Survey
Methods
To elucidate the pattern of health care seeking behavior, a door-to-doorsurvey was administered in Patan with particular attention to the poorer areas.The survey (Appendix I) included questions of demography, income and healthexpenses, patterns of utilization, experiences with and impressions of thehospital, and health desires. Respondents were given opportunities to offertheir impressions of and suggestions for Patan Hospital's Clinic. Thereforeentries were both quantitative and qualitative in nature. The survey was pre-tested on 10 people. Three-hundred and ten surveys were done between July 4,1991 and August 7, 1991. The data were entered into Epi Info3 and analyzedusing Epi Info and SAS35 . Alpha was set at 0.05.
Survey Development
Advisory CommitteeIn order to better define the problem and the goals and objectives of the
survey, an advisory committee was organized, which consisted of 10 members3: thehospital medical director, the hospital chief executive officer, the CDHPmanager, the urban services medical consultant, the previous urban servicesmedical consultant, the public health environmental advisor from the medicalschool, the community health advisor from the medical school, the principalinvestigator involved with the UNICEF (1990) survey in Patan, the UMN CDHPdirector, and the investigator.
This group met on June 23, 1991 to review an initial questionnaire. Thegroup discussed whether the interviews should be represented as for a US studentor for Patan Hospital. If the respondents thought it was for Patan Hospital,then they may give answers that Patan Hospital wanted to hear. However, if thesurvey was for a US student, they may not show interest in the survey. ýneadvisory group concluded that it would be more important for the respondents toknow that the surveyors primarily represent the Hospital so to obtain moremotivation from the interviewees.
The majority of the discussion focused on the questions. The initialquestionnaire was quantitative with many yes/no and multiple choice questions.The consensus was that this may not be particularly reliable in Nepal. The groupthought that a more informal dialogue with the individuals would produce moreaccurate information. Therefore, they encouraged more open-ended qualitativequestions.
TranslationThe survey was first written in English and translated into Nepali. The
female surveyor was hired first, and she translated the questionnaire intoNepali. Two other Nepalis reviewed the translation's accuracy.
Although the questionnaire was printed in Nepali, the vast majority of theinterviews were conducted in Newari. Newari is primarily a verbal language, withfew people reading the original language. Both surveyors were Newari but neithercould read or write Newari. However, they had no difficulty in translating theNepali into Newari. The responses were recorded in English.
Surveyors
Two surveyors were hired to conduct the door-to-door verbal interviews.Both of them had a master's degree and were able to speak in Newari (their nativelanguage), Nepali (the national language), and English (the investigator'slanguage). Both of them were Newari and Hindu.
The first hired surveyor was a 30 year old single female 37 . She wasrecommended from a firm who had hired her for some of their surveys. Therefore,her experience was valuable in the translation and pre-tests. Moving fromanother urban area for higher education, she was residing in Kathmandu. She

ii
possessed a master's degree in Nepali literature.The second surveyor8 was hired 2½ weeks after the first surveyor and was
25 year old, single, male, and a native of Kathmandu. He possessed a master'sdegree in economics but had no prior experience in conducting interviews.However his conversational English was better than the first surveyor.
Sampling
Most questions on the initial survey had yes/no responses, so sample sizedetermination was from a binomial distribution. Therefore the formula used was
S.E. = [p(1-p)/n]'where S.E. is the standard error, p is the estimated probability of event, andn is the number needed for one group. For the maximum sample size, theprobability of the event was set at 50% (p = 0.5). S.E. was chosen to be 0.04or 4% (giving a 95% confidence interval within ± 8% in the intermediate range).Solving for n in the formula gives a sample size of 150 for each group. So tocompare two groups 39 , a total sample size of 300 was needed for the survey.
Considerable difficulty was encountered in obtaining accurate populationand geographic data. The recently conducted 1990 census data were not published,so the 1980 census data were used as a start. However, for the recent elections,the election commission went door-to-door asking who in the family was over 18years old. When people heard "family", they included relatives who did notreside at that house. Therefore, their data were known to over-estimate thepopulation. Surprisingly, the city government did not have any records of thepopulation in their wards or detailed street maps. The houses had no streetaddresses. Many of the houses were numbered by the utilities but not enough.
The election commission had population by the wards, so most surveys wereproportionally distributed in the wards of most interest. Once in the ward, thesurveyors tried to administer no more than one survey per block. They tried tobe consistent in which household they approached in each block. Practically,those interviewed were those who were usually at home or in the courtyard.People often do not spend much time in their home due to the overcrowding.Therefore many people socialize in their streets. Due to time and budgetaryconstraints there could not be a more rigorous sampling method.
Patan was first geographically divided by neighborhoods called toles.Subsequently, Patan was divided into 22 wards which included 5 to 17 toles each.Figure 6 shows the ward boundaries in Patan. The ward and tole populations arenot uniform. Some large toles even cross ward boundaries. The city governmentdid not even have a listing of the toles in each ward. Although not completelyaccurate, the hospital had compiled a list of toles in each ward. However, thelocal people knew in which ward and tole they resided.
The 310 surveys were conducted in 14 wards of most interest. The CDHPtargeted 5 wards namely, 6, 7, 8, 9, and 22. These 5 wards are in "intermediate"Patan. Ward 6 was done by a recent UNICEF (1990) survey, so no surveys were donethere. The goal was to do about half of the surveys in the remaining 4 CDHPtarget wards and divide the rest in other areas of "old" and "new" Patan. Thesesurveyed wards encompassed about 109 toles. Stratified sampling was employed,which required administering a set number of questionnaires in each tole.
Other studies done in Nepal have spent considerable time and effort inpre-surveying the area for accurate sampling. The Patan UNICEF (1990) study forUrban Basic Services employed cluster a sample which is good for small areas ofinterest.
Surveys for this essay were conducted as early as possible in the morningbecause the work day did not start until late morning. Sucveying generallystarted at 7 to 8 am and ended about noon. Ten surveys a day for eachinterviewer was the goal.

URBAN PATAN (LALITPUR MUNICIPALITY) BY WARD
Figure 6
Presern, p. 12,
42
20 22
5 22
0 9
Area of Patan Ward :,'umbers
* "New" Patan: 1,2, 3 ,4, 5 ,20 UBS Pocket Area
"Intermediate" Patan: 6,7,8,9,15,22"Old" Patan: 10,11,12,1 3 ,14,16,17,18,19,21 Source: Courtesy of David Stevens, UMN

Results
12
The female interviewer did 219 (71%) of the surveys, and the male did theremaining 91 (29%). The investigator accompanied the female interviewer on 117(53%) of her surveys and the male on 47 (52%) of his surveys. To standardize thetwo interviewers, 10 surveys were done together. There was only one refusal.The average time needed to complete the interview was 17 minutes. Thequestionnaire was written in Nepali, but two-thirds of the interviews wereconducted in local language, Newari.
When accompanied it became obvious that the male interviewer surveyed fewerfemale interviewees than the female interviewer (Table 1). Often when enteringa household, men would answer the survey, especially when the male surveyor wasaccompanied by another male, the investigator.
One-hundred and seventy-eight (57%) of the surveys were done in the 4"target" wards of the CDHP (Figure 7). All of these wards are in "intermediate"Patan. Seventy (23%) of the surveys were done in "new" Patan, wards 1, 2, 3, 4,and 5. Forty-seven (15%) of the surveys were done in "old" Patan, wards 14, 16,17, and 18. The remaining 15 surveys were done in "intermediate" Patan ward 15.Depending on the size of the tole, there were 1 to 8 surveys taken from each ofthe 109 toles surveyed.
Demographics
The respondents ranged in age from 17 to 80 years, with a mean age of 38(standard deviation (s.d.) of 14) years. Males comprised two-thirds of thoseinterviewed. Two hundred and eighteen (71%) claimed literacy. More males wereliterate than females (Table 2), risk ratio 6.0 (95% CI: 3.4, 10.6). Among theliterate 19 (8.7%) had no formal education. Ninety-two (42%) had gone to highschool. Eighty-two (37%) had bachelor's or master's level education.
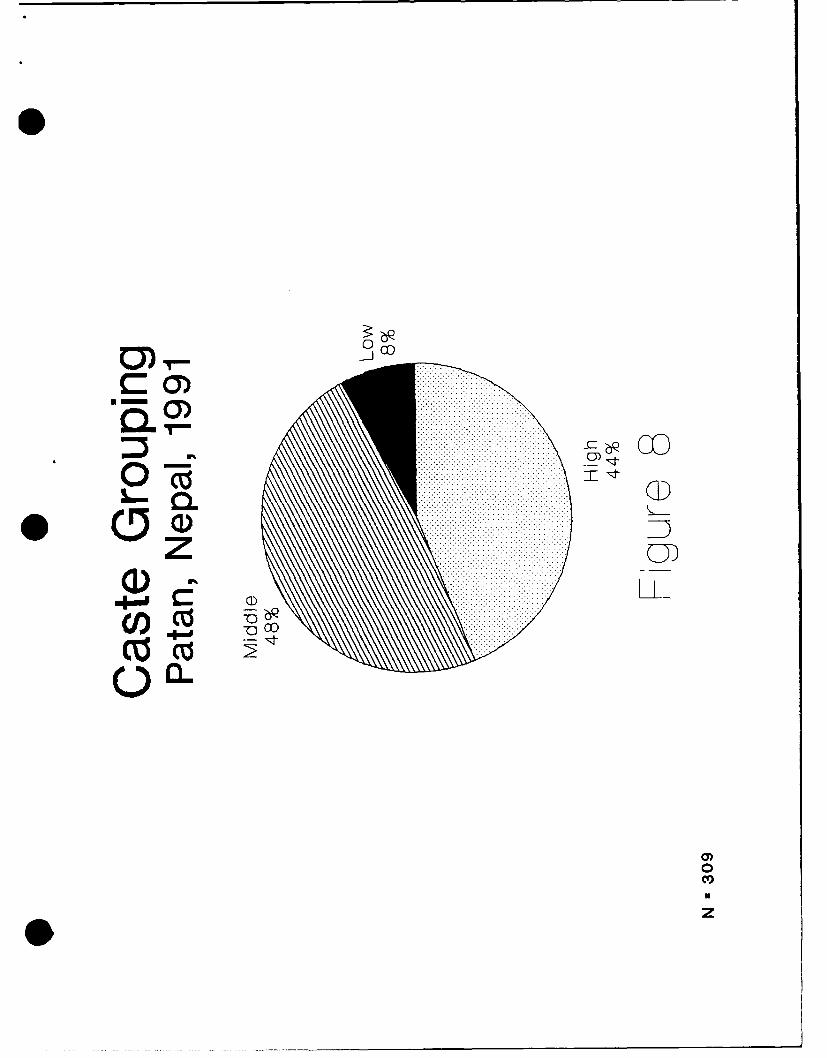
There were 68 castes representing 13 ethnic groups. Newars composed thevast majority surveyed, 249 (80%). The Newars represented 37 castes in thesurvey. The castes were grouped into three strata: low, middle, high. Thepredominant caste group in this sample was middle at 48% (Figure 8).
In gathering the data, the interviewers tried to obtain reliableinformation for the entire household. One hundred and nineteen (39%) of thoseinterviewed were the "head of the household" (Figure 9). Eighty-eight percenthad lived in the same house, or at least in the Patan area, for their entirelife. For those who moved to the area, the average length residing in Patan was7.1 years (s.d. 7.4). The average household consisted of 4.4 adults (range: 1to 15; s.d. 2.4) and 2.6 children-under 15 years old (range: 0 to 13; s.d. 2.0).Hinduism was the family religion of 223 (72%) of the households. Except for oneChristian, Buddhism was practiced by the remainder. Survey data indicated a meanper-capita income of 7093 Rs. (US $177) (s.d. 6839). The mean annual per-adultincome was 11323 Rs. (US $283) (s.d. 9819). The most common primary occupationswere agriculture (38%) and government service (12%). On average, a family spent6% (s.d. 7.3) of their annual income on health. The annual health expenses per-capita ranged from 20 to 2500 Rs. (US $0.50 to $62.50) (N = 296); the median wasabout 205 Rs. (US $ 5.13), and the average was 333 Rs. (US $ 8.33) (s.d. 357).
General Health Questions
When asked if they were satisfied with their family's health, 238 (77%)responded "yes". An open-ended question ascertained what they thought wouldimprove their health. The respondents could list up to three suggestions. Ofthe 448 suggestions, the most common was sanitation (39%) which generally meantridding the streets of garbage. Safe water (25%) was the next most prevalentresponse. However, there were times that the interviewer gave them suggestionsif they were puzzled. Some other suggestions included "clean food" and "balanceddiet". Interestingly, less than 1% of the responses had anything to do withmedical care.
From questions on the usual expenditure per outpatient visit (provider fee,laboratory tests, and medications) for each provider of care, the average cost

Table 1: Surveyor's Sex by Respondent's SexPatan, Nepal, 1991
RESPONDENT'S SEX
SURVEYOR'S SEX MALE FEMALE TOTAL
FEMALE 131 (60) 88 (40) 219 (100)
MALE 74 (81) 17 (19) 91 (100)
TOTAL: 205 (66) 105 (34) 310 (100)
N (Row Percentage)
Chi-square = 13.3; p-value = 0.00027
0
0

0V
(3)>1
ZCNj
Cl)-0)
09,CO:
co
0 --
o0
0
4-,
cz
T0
Cl)
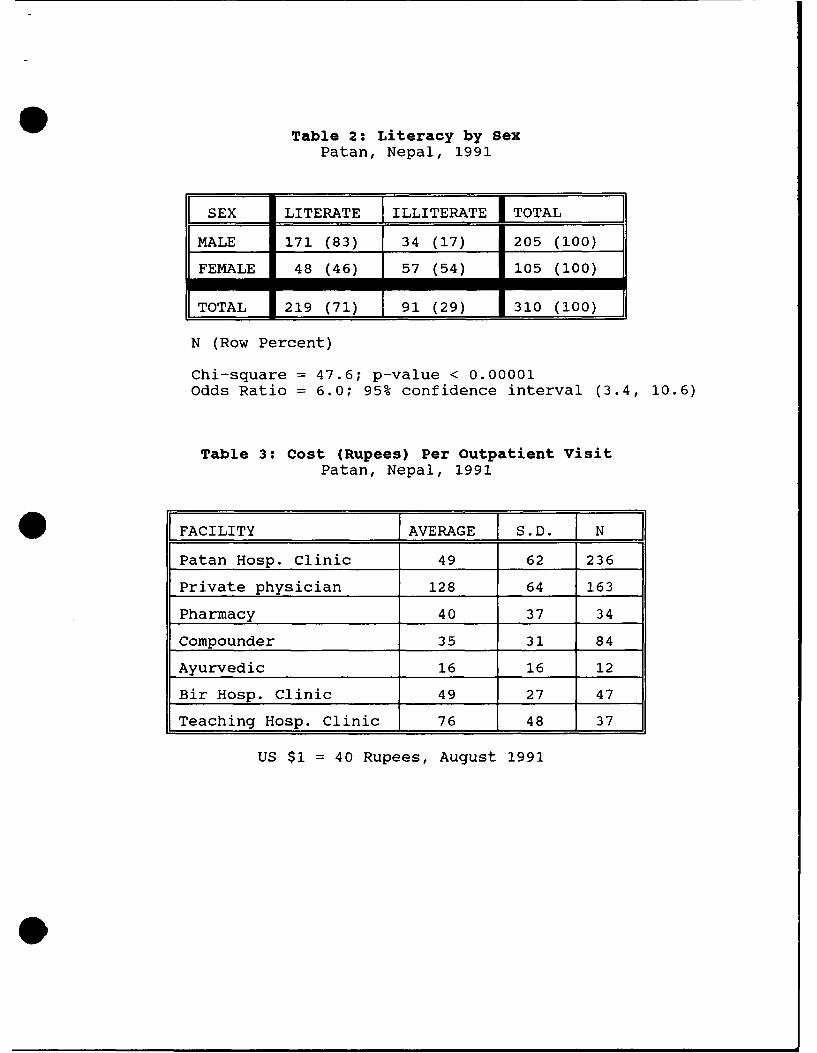
Table 2: Literacy by SexPatan, Nepal, 1991
SEX LITERATE ILLITERATE I TOTAL
MALE 171 (83) 34 (17) 205 (100)
FEMALE 48 (46) 57 (54) 105 (100)
TOTAL 219 (71) 91 (29) 310 (100)
N (Row Percent)
Chi-square = 47.6; p-value < 0.00001Odds Ratio = 6.0; 95% confidence interval (3.4, 10.6)
Table 3: Cost (Rupees) Per Outpatient VisitPatan, Nepal, 1991
IFACILITY 1AVERAGE I S.D. T N
Patan Hosp. Clinic 49 62 236
Private physician 128 64 163
Pharmacy 40 37 34
Compounder 35 31 84
Ayurvedic 16 16 12
Bir Hosp. Clinic 49 27 47
Teaching Hosp. Clinic 76 48 37
US $1 = 40 Rupees, August 1991
0 OD
.........................................................................CY) ............ ......... ............................a CY) .............................................. ........................................................................................I ................ ........................ ................ 030).................... ............. ...................................................................
............................................................................ .......... ........ .............. ................. ............................. ...............................................................
CD............... ..... ......................LL
.......... ........................CO ...........CZ co
0)0CV)
-- ---------

o) -CD CD
co4oO cuD~t
0)0EL 0)
CoZ CD
U.. LL
IOaaoa)/:o
ci)0 CID
0 cf0
a)v
Ut

13
per encounter was calculated (Table 3). The private physician was the mostexpensive (128 Rs.), 2.5 times as expensive as Patan Hospital Clinic (49 Rs.).However, Patan Hospital Clinic was comparable with the closest governmenthospital clinic, Sir Hospital.
Patan Hospital Clinic and the CDHP Services
Two-hundred and forty-seven (80%) of the respondents indicated that eitherthey or a family member had been to Patan Hospital Clinic. The most commonreasons for going were stomach problems (16%), obstetrical care (14%), and highfever (13%) (Table 4). Ninety-one percent were satisfied with the 6 Rs. Clinicregistration fee. Ninety-four percent were satisfied that the Clinic staff couldunderstand them, and the respondents could understand the staff. Ninety-sevenpercent said that they would go back. Being "near" the Clinic was the mostcommon reason for returning (70%). When all of the respondents were asked abouttheir general impression of the Clinic, 68% had a positive response (good, goodtreatment, good service, etc.), 9% had a negative response (expensive, baddoctors, crowded, etc.), 15% had mixed response (good but expensive, good butrude, etc.), and 8% had no impressions.
When utilizing the Clinic, lack of privacy was not a concern to therespondents. When specifically asked about this, some women stated it was notan issue. Many respondents liked the Western medicine practiced at the Clinic.The Christian nature of the Clinic was not a barrier either.
Because payment is due at the time of service, respondents were asked ifthey thought people without enough money would receive treatment at PatanHospital. Only 57 (20%) said that they thought these poor would be treated.This was to ascertain if people thought charity services were available.
The survey concluded with an open-ended question about how the Clinic couldchange so that more people would use it. It was difficult to quantify thesereplies, but 51 (17%) of the 300 respondents stated that they did not know whatthe Clinic could do differently. However, the suggestions primarily focused onthe long wait. About 100 (33%) of the respondents included something concerning
the long wait or overcrowding. Many stated that the quota ticket system shouldbe abolished and the Clinic should be kept opened longer. Many desired somehoweliminating the crowds and having quicker service.
Another general category of responses focused on offering cheap or freetreatment and medicines. About 91 (30%) mentioned this in their suggestions.Some specified that the poor should have cheaper or free medicines and/ortreatment. A few believed that the rich received better treatment than the poor.
About 71 (24%) mentioned that more doctors or better doctors were needed.Some stated that there should be more specialties and more specialists. Othersstated that the health assistants should be replaced with doctors. Some evenpreferred more foreign doctors.
About 22 (7%) stated that the attitude of the staff should be improved.Some observed that the nurses or doctors were not caring or honest. Theysuggested that doctors should spent more time with the patient and not becareless. Outright rude behavior was noted by a few. There were stories inwhich some doctors advised patients to come to their private clinic for moretreatment.
The respondents liked having a well-stocked pharmacy available in theClinic. The retail drug costs are comparable with the pharmacies outside theClinic. By contrast, Bir Hospital does not have a pharmacy, and the nearest onesare ill equipped. Even inpatients at Bir Hospital are responsible for obtainingtheir own medicines in local pharmacies, IV solutions and injectables too.
Although the questions focused on the Clinic, many responses were directedspecifically at the emergency room. Some did not like the prepayment requirementof the emergency room. Also the service was not quick enough, and suggestionsfor more caring doctors were stated. Another suggestion given by some was thata physician be present in the emergency room. In reality, a physician is in theemergency room around the clock, although some respondents perceived otherwise.
One hundred and six respondents (34% of the entire sample) were acquaintedwith at least one of the CDHP programs. For the entire survey, the chlorination
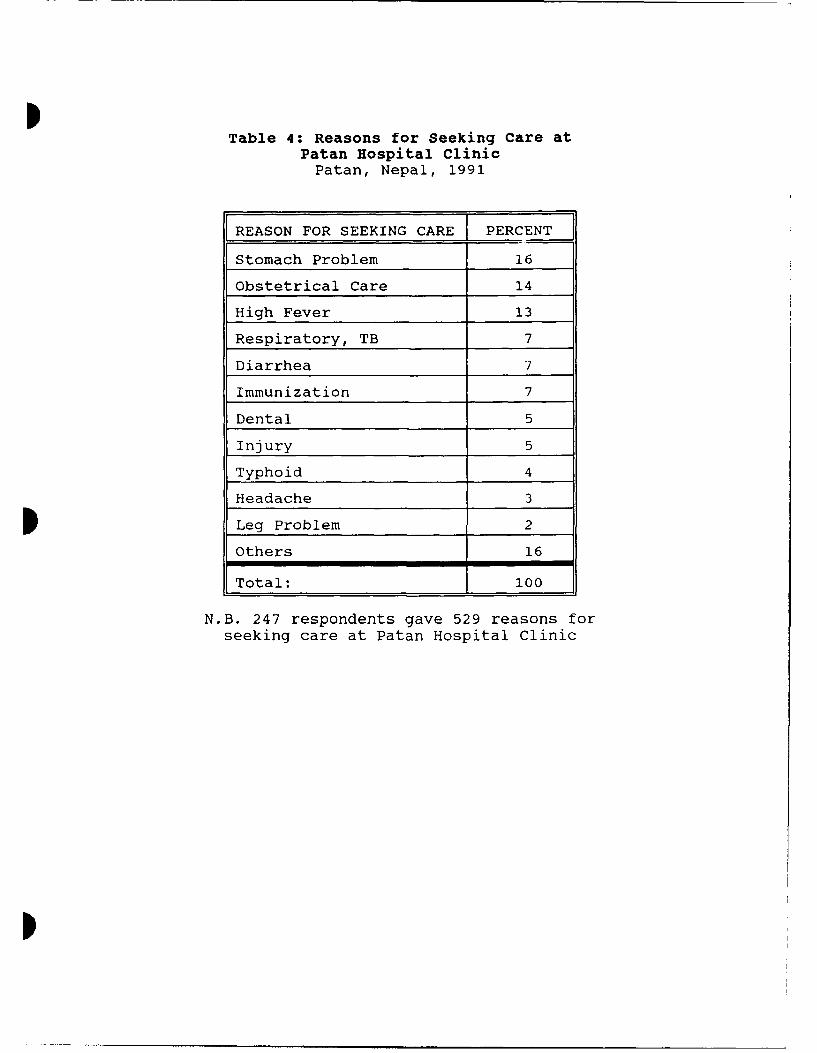
ITable 4: Reasons for Seeking Care at
Patan Hospital ClinicPatan, Nepal, 1991
REASON FOR SEEKING CARE PERCENT
Stomach Problem 16
Obstetrical Care 14
High Fever 13
Respiratory, TB 7
Diarrhea 7
Immunization 7
Dental 5
Injury 5
Typhoid 4
Headache 3
I Leg Problem 2
Others 16
Total: 100
N.B. 247 respondents gave 529 reasons forseeking care at Patan Hospital Clinic
I

14
of well water program was the most widely recognized (67%) with the MCHactivities being mentioned second (Table 5). When one eliminates those who heardabout the chlorination of well water, then only 16% of the respondents for theentire survey and 21% in the CDHP target wards have heard of any CDHP activities.This was of interest because the chlorination of well water was a recent program.When analyzing only the wards where the CDHP had programs, it was surprising thatfewer people had heard about chlorination of well water than for the entiresurvey, since it is only done in those wards. Those who had heard of one of theCDHP programs were asked about their impression of the program in an open-endedquestion. All of the responses were positive ("good" or "good service").
Medical-Seeking Behavior
Questions were asked regarding their medical-seeking behavior. Amonginitial providers of choice, the private physician was first (39%) (Figure 10).The compounder (22%) was the next preference as an initial provider. The PatanHospital Clinic was third (19%). Of the 251 (81%) who did not initially attendPatan Hospital Clinic, 178 (72%) stated that the alternative provider's "quickservice" was the reason not attending Patan Hospital Clinic first.
While asking for the providers of choice it was evident that there werevery few responses for the traditional healer. In one of the interviews, aBrahmin priest was asked about this. He stated that the traditional healer inthe area sees only two patients a month. Even he did not admit seeking care fromthe traditional healer.
Two-hundred and sixty-three indicated at least one other choice, if theirfirst provider of care was unsatisfactory. The Patan Hospital Clinic was themost common (49%) second choice (Figure 11). To assess a pattern of medical-seeking behavior, the first two choices were linked in each survey. The two mostprevalent patterns of preferences were 1) attending a private physician and thenthe Patan Hospital Clinic (N = 73, 24%), and 2) attending a compounder and thenPatan Hospital Clinic (N = 33, 11%) (Table 6).
To assess the pattern of utilization based on the type of medical problem,a question was asked about where the family would go if one was ill or if one wasinjured. During the preteste, it was noted that the responses were the same forthe question on illness and a prior question on provider of choice. So thequestion on illness was dropped but the question on injury was kept. Respondentsinterpreted this as minor injuries. Of the 292 responses, the most common firstresponse was a pharmacy (N = 182, 62%). The next two most common responses werehome (N = 42, 14%), and compounder (N = 27, 9%).
Correlations with socioeconomic indicators
One main purpose of the survey was to see if there was any correlationbetween income and the health care sought, so analysis was done by three incomeindicators: income per-capita, income per-adult, and percent of family incomespent on health. For convenience, each monetary indicator was categorized byquartiles (Tables 7, 8, and 9).
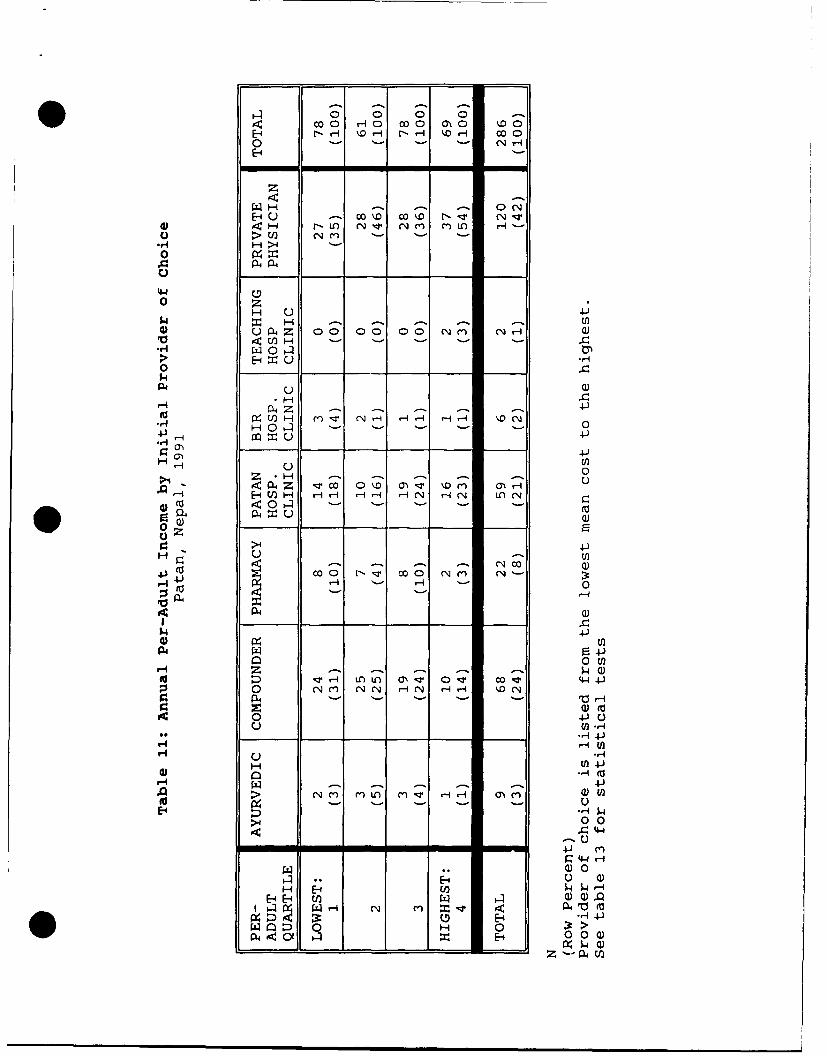
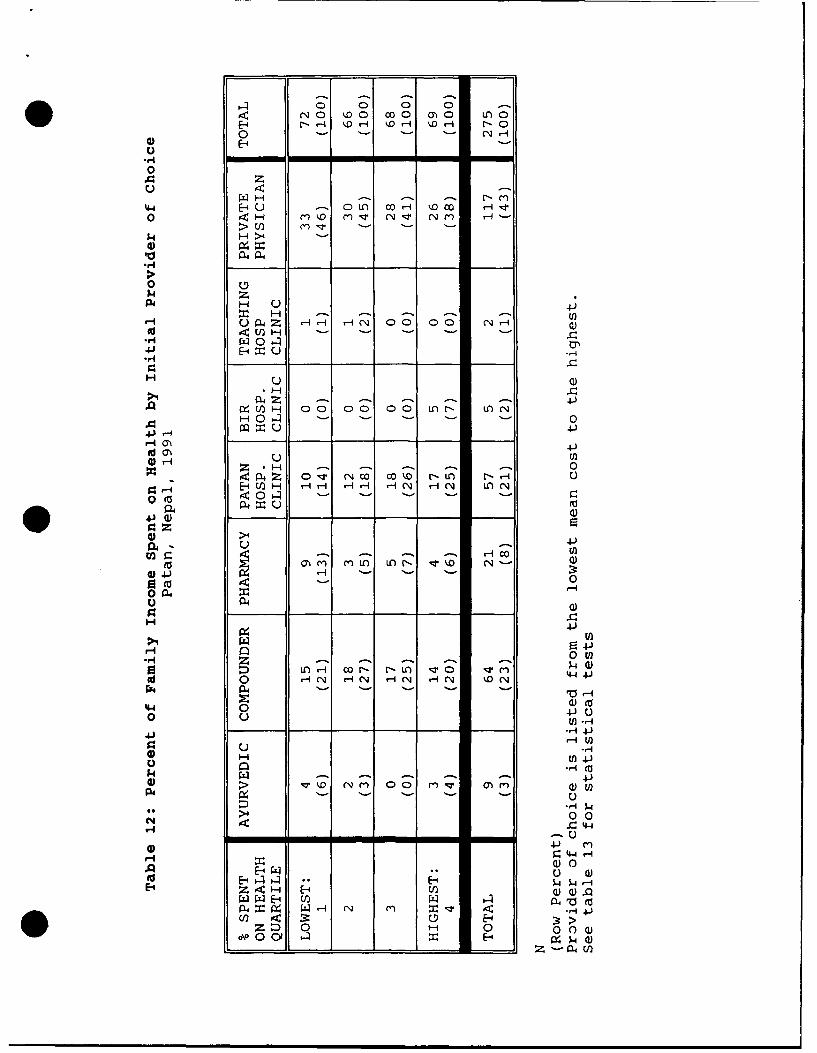
The mean cost of each provider of care was used in correlating the threeincome indicators to the initial provider of choice. Tables 10, 11, and 12 showhow many fell into each provider of care by the three income indicators. Itseems that the lower quartiles attend the cheaper compounder more than expectedand the higher quartiles attend the more expensive private physician more thanexpected. The linear regression model was used4". There were statisticallysignificant positive relationships of per-capita and per-adult income to theinitial provider of choice (Table 13). The more a family earned, the more theyspent on the initial provider of care. However, the model explains less than 3%(R2) of the data. Therefore, the income relationships are weak at best.
Another commonly used proxy for socioeconomic status is caste. The threecaste groups were then compared with the three income indicators and area ofresidence in Patan. There was an association of caste grouping with the annualper-adult and per-capita income quartile, but caste grouping had no relationshipwith the percent of income spent on health (in quartiles) (Tables 14, 15, and
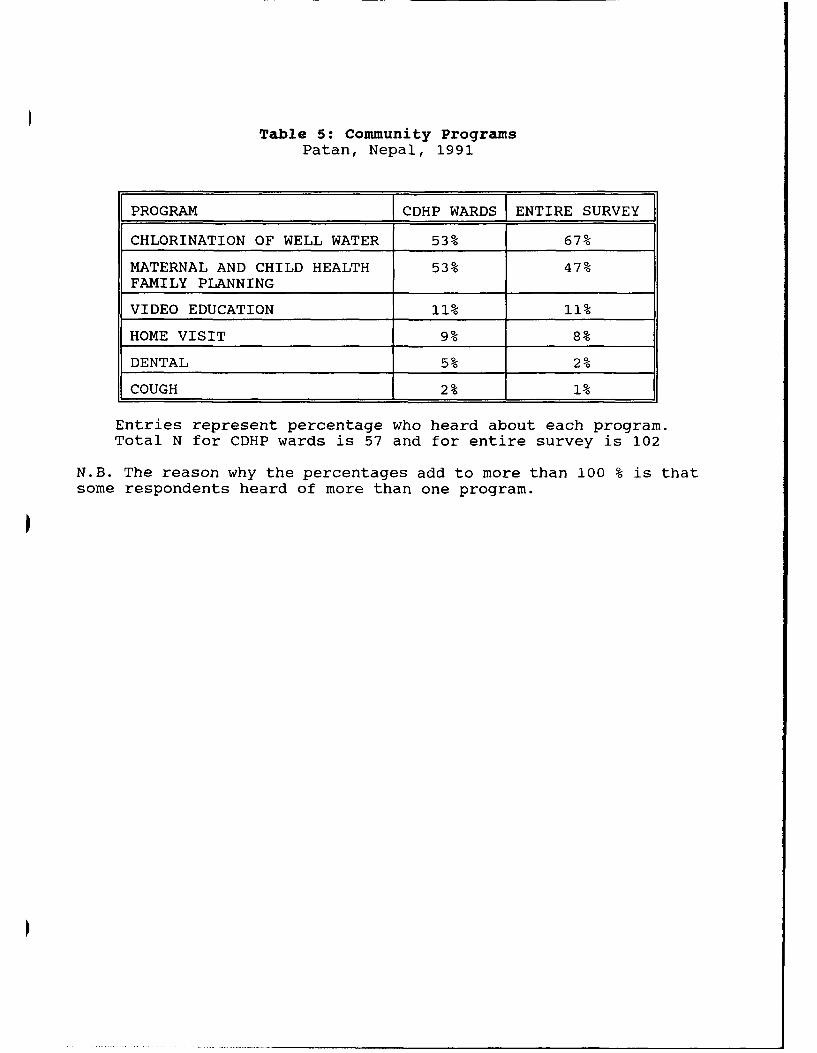
Table 5: Community ProgramsPatan, Nepal, 1991
PROGRAM I CDHP WARDS (ENTIRE SURVEY
CHLORINATION OF WELL WATER 53% 67%
MATERNAL AND CHILD HEALTH 53% 47%FAMILY PLANNING
VIDEO EDUCATION 11% 11%
HOME VISIT 9% 8%
DENTAL 5% 2%
COUGH 2% 1%
Entries represent percentage who heard about each program.Total N for CDHP wards is 57 and for entire survey is 102
N.B. The reason why the percentages add to more than 100 % is thatsome respondents heard of more than one program.
p

Q\j
C:
coo 0)
C';C
0 0
0) L0cco0) co
ci
C\JC0
CL C
CIO4-
000
z

(CL Ca)U0 0
o C-
ECL
yEtm 0 "- DLOUJ
Soo
ia) cL ........ o 0
.. o.• .. . . .
ELL
C C2Cl)
Off•
Co
CL
z

Table 6: Health Seeking Pattern WhenGiven Two ChoicesPatan, Nepal, 1991
HEALTH SEEKING PATTERN N PERCENT)
Private Physician ThenPatan Hosp. Clinic 73 24
Compounder ThenPatan Hospital Clinic 33 11
Patan Hospital ClinicOnly 23 7
Patan Hosp. Clinic ThenPrivate Physician 16 5
Private Physician ThenBir Hosp. Clinic 13 4
Private Physician ThenTeaching Hospital Clinic 12 4
Compounder ThenPrivate Physician 12 4
Pharmacy ThenPatan Hospital Clinic 10 3
Private PhysicianOnly 10 3
Other Combinations 108 35
Total 310 100
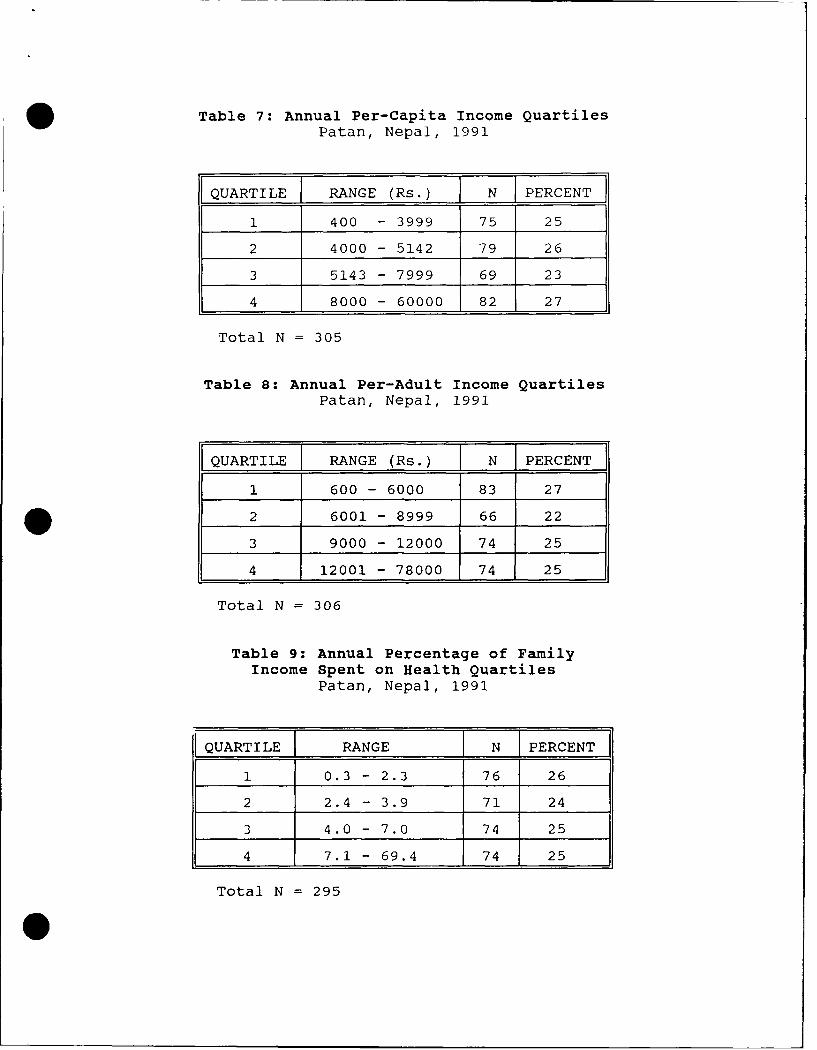
Table 7: Annual Per-Capita Income QuartilesPatan, Nepal, 1991
QUARTILE RANGE (Rs.) I N I PERCENT
1 400 - 3999 75 25
2 4000 - 5142 79 26
3 5143 - 7999 69 23
4 8000 - 60000 82 27
Total N = 305
Table 8: Annual Per-Adult Income QuartilesPatan, Nepal, 1991
[QUARTILE RANGE (Rs.) [ N I PERCENT
1 600 - 6000 83 27
2 6001 - 8999 66 22
3 9000 - 12000 74 25
4 12001 - 78000 74 25
Total N = 306
Table 9: Annual Percentage of FamilyIncome Spent on Health Quartiles
Patan, Nepal, 1991
QUARTILE RANGE N PERCENT
1 0.3 - 2.3 76 26
2 2.4 - 3.9 71 24
3 4.0 - 7.0 74 25
4 7.1 - 69.4 74 25
Total N = 295

0 0LO 0 0 0 Lo
4H NH HO mH C
0 z$4H -u- O~A
H-4 -~ C O ~ '4
01- E-4
P4H u
H N A~ r-A - -C -i -H U)
04 U4 04-) -u 4J- ~
Zr H
P1 P44 o')O r-~ -q mo tD i ~ C luH U-4COH H H Cl r-4AN LO N
0 a)
0
u 4J)
04q (a4
to 04H l Am H l H O'
0 0 La
0~ ~ ~ ~ ~ -- N 4n 4 4I . i
044
H, (f4J
4-I
> n ; m q Cl LO 0 0 m (na)
~4-)Ha) 0
CV H; H 4.jw~HE-i 3:
ri~ H 0 0 0 )E- % H4(
O l 00 0 m0 %D
E-1 ~ ~ N H -r- H 00 O
z
4)4H r- U' C'Ji 14, ( N M m H-
00
H zH H -4-ý- -
P4 UZ 00 00 00 C'JC N .H 0)
> ~E-1 XC-
Hn H -n4T N 1 - -. ,
0 HO-l - '-' - - 0
*4-J
44) z C 0\o o- o '
>4 0~13 U Q
coo0 r 'o COO , NN '-oH- 4- HH' 0
a4 U
(D W3.4 FZ4-)
0 wn
H3 0 N -n -~i (N HN %
0 4-)Jr 0N N H
0o -'- C
H 4-M)nLn M H
>.' 0 0- 44
H) 0
a *-4H 4J
Q 0 H 0>*- 0 0- __ L
o- c- ot' -, 00
0 r-r- r -N
0 z
44' HOA U L 0 0C cH 0 00 '0 < H m~~O ~ (~ Cr
> U)j5.4 H >4
0)
N. z
Id Hl<
H~ r-H ( 0 0 0 00L) - L NH
4-3
r-4J 00 0 0 1NI,
HO24Z '1' Cq0 0 %-D r- 0O r
0. (a. _ 0
>4U
toW z__ H_ c_ _ _
0 P4I
0fH
.14~~~ý Q )-~- ~ ~0 H (N H(4N H (N H C N flN -4
144 004- .4-4)
5.4 -. - %4J41 > v o (N fl 0 0 m v 0) fl
'.4
-~4 -1 - -01 -- 4
IQH Hp W~XZ 4H EUqU)wQ).
W C., HZ~ H 0 0 0
O\E-4 ý -
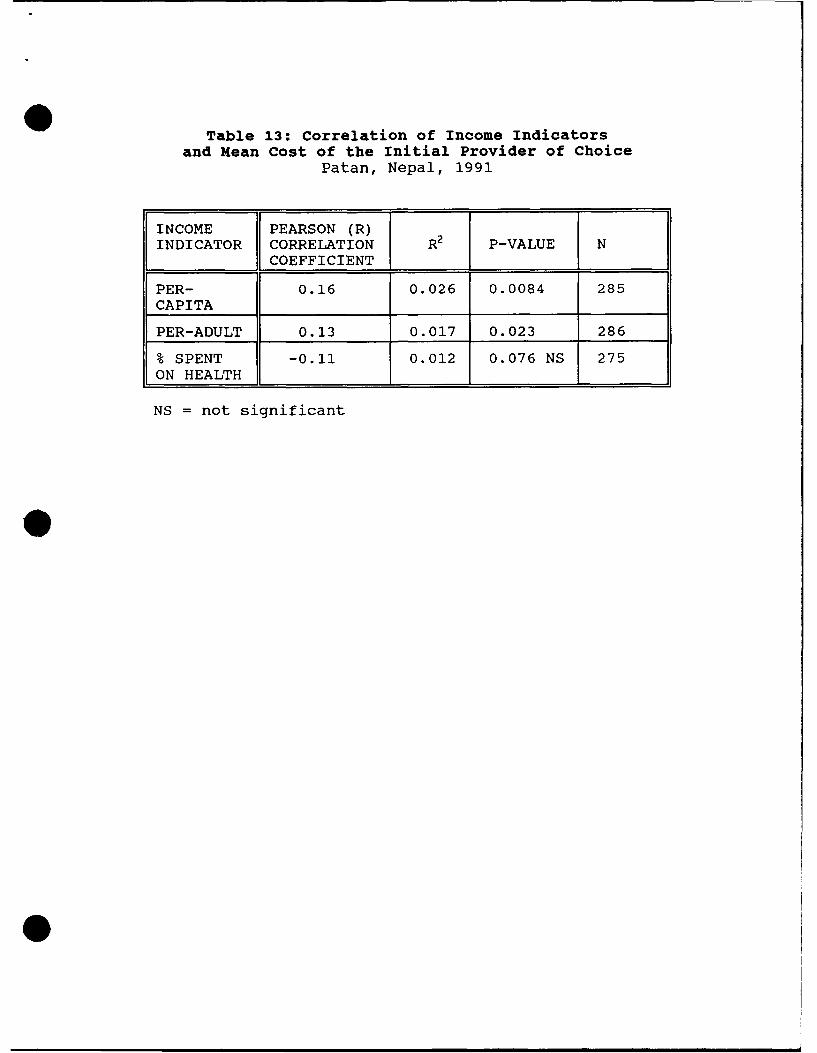
Table 13: Correlation of Income Indicatorsand Mean Cost of the Initial Provider of Choice
Patan, Nepal, 1991
INCOME PEARSON (R)INDICATOR CORRELATION R2 P-VALUE N
COEFFICIENT
PER- 0.16 0.026 0.0084 285CAPITA
PER-ADULT 0.13 0.017 0.023 286
% SPENT -0.11 0.012 0.076 NS 275ON HEALTH
NS = not significant
0
0

Table 14: Annual Per-Adult Income by Caste GroupingPatan, Nepal, 1991
PER LOW MIDDLE HIGHADULT CASTE CASTE CASTE TOTALQUARTILE 1 _ _
LOWEST: 1 8 (31) 46 (32) 29 (22) 83 (27)
2 2 ( 8) 39 (27) 25 (19) 66 (22)
3 11 (42) 41 (28) 33 (25) 85 (28)
HIGHEST: 4 5 (19) 20 (14) 46 (35) 71 (23)
TOTAL: 26 (100) 146 (100) 133 (100) 305 (100)
N (column percentage)
Kendall's Tau-b (95% confidence interval): (0.048, 0.252)Spearman Correlation (95% confidence interval): (0.056, 0.284)
0 Table 15: Annual Per-Capita Income by Caste GroupingPatan, Nepal, 1991
PER LOW MIDDLE HIGHCAPITA CASTE CASTE CASTE TOTALQUARTILE I
LOWEST: 1 10 (38) 37 (26) 28 (21) 75 (25)
2 4 (15) 52 (36) 23 (17) 79 (26)
3 7 (27) 29 (20) 33 (25) 69 (23)
HIGHEST: 4 5 (19) 27 (19) 49 (37) 81 (27)
TOTAL: 26 (100) 145 (100) 133 (100) 304 (100)
N (column percentage)
Kendall's Tau-b (95% confidence interval): (0.074, 0.278)Spearman Correlation (95% confidence interval): (0.084, 0.312)
* 15
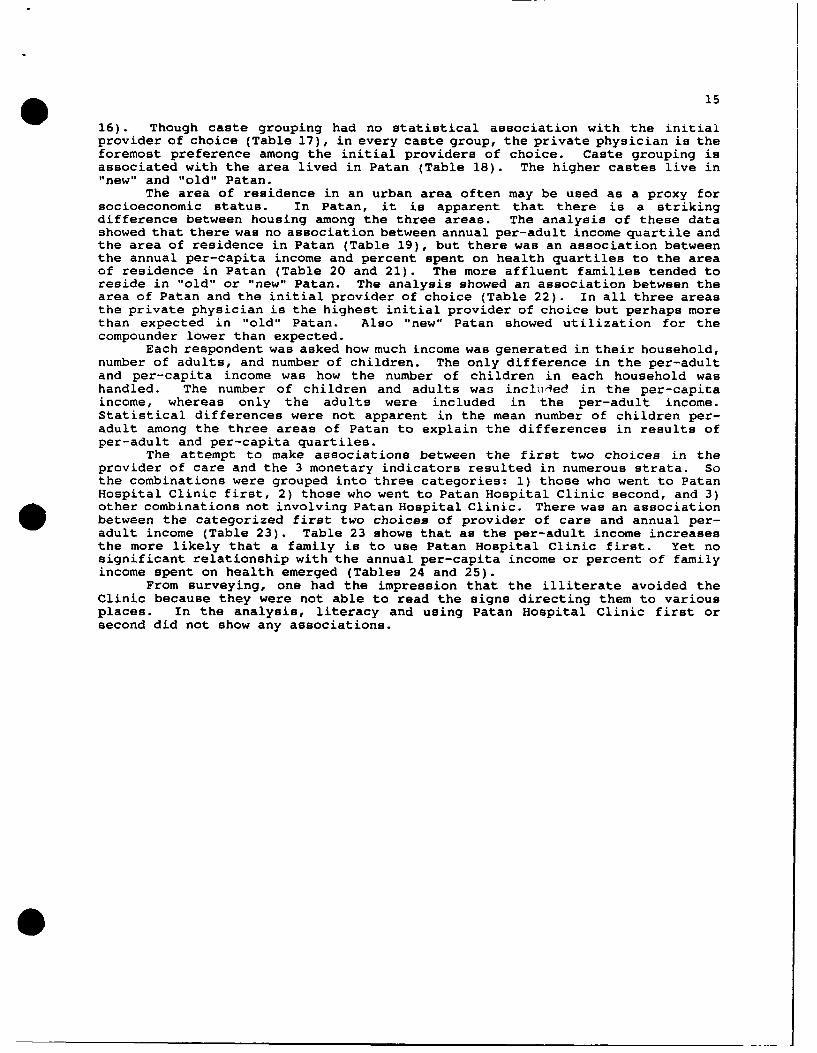
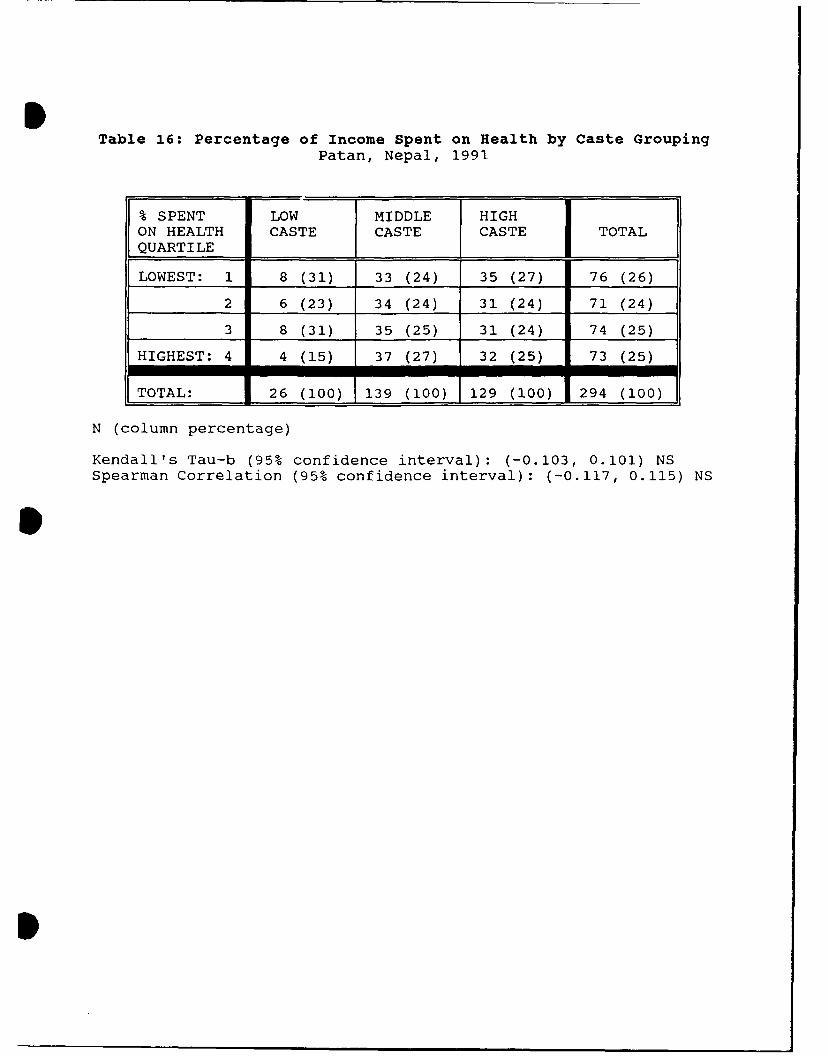
16). Though caste grouping had no statistical association with the initialprovider of choice (Table 17), in every caste group, the private physician is theforemost preference among the initial providers of choice. Caste grouping isassociated with the area lived in Patan (Table 18). The higher castes live in"new" and "old" Patan.
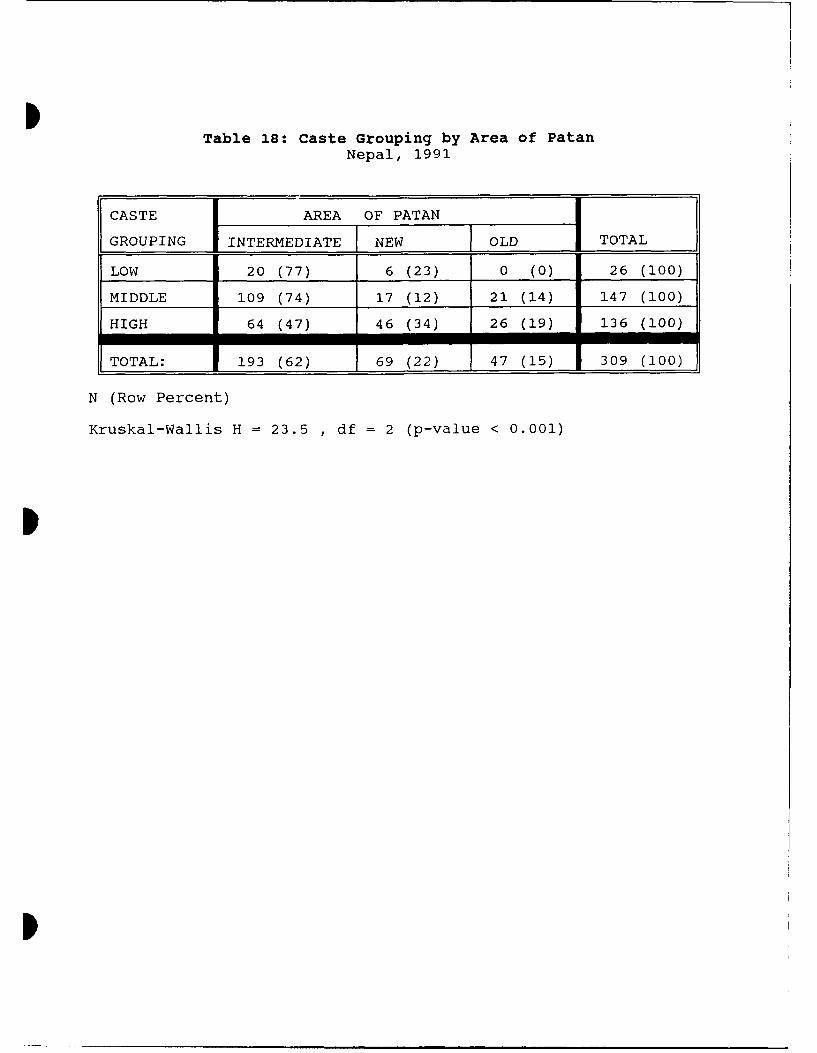
The area of residence in an urban area often may be used as a proxy forsocioeconomic status. In Patan, it is apparent that there is a strikingdifference between housing among the three areas. The analysis of these datashowed that there was no association between annual per-adult income quartile andthe area of residence in Patan (Table 19), but there was an association betweenthe annual per-capita income and percent spent on health quartiles to the areaof residence in Patan (Table 20 and 21). The more affluent families tended toreside in "old" or "new" Patan. The analysis showed an association between thearea of Patan and the initial provider of choice (Table 22). In all three areasthe private physician is the highest initial provider of choice but perhaps morethan expected in "old" Patan. Also "new" Patan showed utilization for thecompounder lower than expected.
Each respondent was asked how much income was generated in their household,number of adults, and number of children. The only difference in the per-adultand per-capita income was how the number of children in each household washandled. The number of children and adults was incluied in the per-capitaincome, whereas only the adults were included in the per-adult income.Statistical differences were not apparent in the mean number of children per-adult among the three areas of Patan to explain the differences in results ofper-adult and per-capita quartiles.
The attempt to make associations between the first two choices in theprovider of care and the 3 monetary indicators resulted in numerous strata. Sothe combinations were grouped into three categories: 1) those who went to PatanHospital Clinic first, 2) those who went to Patan Hospital Clinic second, and 3)other combinations not involving Patan Hospital Clinic. There was an associationbetween the categorized first two choices of provider of care and annual per-adult income (Table 23). Table 23 shows that as the per-adult income increasesthe more likely that a family is to use Patan Hospital Clinic first. Yet nosignificant relationship with the annual per-capita income or percent of familyincome spent on health emerged (Tables 24 and 25).
From surveying, one had the impression that the illiterate avoided theClinic because they were not able to read the signs directing them to variousplaces. In the analysis, literacy and using Patan Hospital Clinic first orsecond did not show any associations.
ITable 16: Percentage of Income Spent on Health by Caste Grouping
Patan, Nepal, 1991
% SPENT LOW MIDDLE HIGHON HEALTH CASTE CASTE CASTE TOTALQUARTILE I
LOWEST: 1 8 (31) 33 (24) 35 (27) 76 (26)
2 6 (23) 34 (24) 31 (24) 71 (24)
3 8 (31) 35 (25) 31 (24) 74 (25)
HIGHEST: 4 4 (15) 37 (27) 32 (25) 73 (25)
TOTAL: 26 (100) 139 (100) 129 (100) 294 (100)
N (column percentage)
Kendall's Tau-b (95% confidence interval): (-0.103, 0.101) NSSpearman Correlation (95% confidence interval): (-0.117, 0.115) NS
S
I

m 0 m10 NO NOrE-4 (NH i4H H- rqr-f co
z
F-4 0) r,) C
P4 =4.4 a4Z Q)H 0 H0
4-)
o <-ri- H - -)
w. U)J H 0 0 (NHr- LO ;l r NNNO 0 0 4.J
u 0o ý
rlE--4CU)H H- CN N CN N Lf) li
04 U Q)N c
4-)
0P0
P4 Q) 0OH-
z -4 >~-' -r- NO %DD LCO 0 cOr 4-4 0
0 t) M NN CNN % CN ý
'-I a)
Uo 4-'-
E-4 U l U4-4
UU
9 ) 4-4 ) N004 0 (IN O(0
a) 4
044- (0 :r H
% 0 :3: > 0U 0 E-40 0
H4 ý4 0)Z -P.
ITable 18: Caste Grouping by Area of Patan
Nepal, 1991
CASTE AREA OF PATAN
GROUPING INTERMEDIATE NEW OLD TOTAL
LOW 20 (77) 6 (23) 0 (0) 26 (100)
MIDDLE 109 (74) 17 (12) 21 (14) 147 (100)
HIGH 64 (47) 46 (34) 26 (19) 136 (100)
TOTAL: 193 (62) 69 (22) 47 (15) 309 (100)
N (Row Percent)
Kruskal-Wallis H = 23.5 , df = 2 (p-value < 0.001)
p
I
I Table 19: Annual Per-Adult Income by Area of Patan
Nepal, 1991
PER-ADULT AREA OF PATANINCOME
QUARTILE INTERMEDIATE NEW OLD TOTAL
LOWEST: 1 55 (29) 20 (29) 8 (17) 83 (27)
2 43 (23) 14 (20) 9 (20) 66 (22)
3 56 (29) 14 (20) 15 (33) 85 (28)
HIGHEST: 4 36 (19) 22 (31) 14 (30) 72 (24)
TOTAL: 190 (100) 70 (100) 46 (100) 306 (100)
N (Column Percent)
Kruskal-Wallis H = 4.5 , df = 2 (p-value = 0.11)
P Table 20: Annual Per-Capita Income by Area of PatanNepal, 1991
PER-CAPITA AREA OF PATANINCOME
QUARTILE INTERMEDIATE NEW OLD TOTAL
LOWEST: 1 51 (27) 19 (27) 5 (11) 75 (25)254 (28) 11 (16) 14 (31) 79 (26)342 (22) 18 (26) 9 (20) 69 (23)
HIGHEST: 4 43 (23) 22 (31) 17 (38) 82 (27)
TOTAL: 190 (100) 70 (100) 45 (100) 305 (100)
N (Column Percent)
Kruskal-Wallis H = 6.1 , df = 2 (p-value = 0.047)
I

Table 21: Percentage of Income Spent on Health by Area of PatanNepal, 1991
% SPENT ON AREA OF PATANHEALTH
QUARTILE INTERMEDIATE NEW OLD TOTAL
LOWEST: 1 40 (22) 19 (27) 17 (39) 76 (26)
2 41 (23) 13 (19) 17 (39) 71 (24)
3 52 (29) 17 (24) 5 (11) 74 (25)
HIGHEST: 4 48 (27) 21 (30) 5 (11) 74 (25)
TOTAL: 181 (100) 70 (100) 44 (100) 295 (100)
N (Column Percent)
Kruskal-Wallis H = 11.9 , df = 2 (p-value = 0.0027)
I

1-0 HO m~ COO
0440 000 '- -. 00
z
r- al o H N4-)
00
C3 ~ H u 4-
0 x H -~ -~ - (n a)r-)P4 00 00 N~c m N H
tw C/2lH - - 4-
E-4 U H ,
-ri *H
> -z - 4-) Vo U) OH 0 0 lz\J C rLC c-CN ~$4 H 0i- (0 0 4
'-4 4,) a
*rHZ * - - 0 $A
41 0) i 024 Z %D cOr00H qtA 00 ~ . 0rl 0) P U H ci m N HC' mc-')
ar-I '.- - -
04)
Qa) C- - - N2 *O0
a- 0 m - % 0 C4Q
P44
___) I) O
m 01, ý 0 coco
00 4N 4.C
4) C-) 024-
r-I (0H0A a)H
.-1 (0 c
~~P...- 0 1iHIZ4:0 00 u)
4u s: -tn____~~~t __ __ _ Z4O~

Table 23: Categorized First Two Choices by Annual Per-Adult IncomePatan, Nepal, 1991
PER-ADULT PATAN PATANQUARTILE HOSPITAL HOSPITAL OTHER TOTAL
FIRST SECOND
LOWEST: 1 7 ( 8) 31 (37) 45 (54) 83 (100)(18) (27) (30) (27)
2 5 ( 8) 28 (42) 33 (50) 66 (100)(13) (24) (22) (22)
3 12 (14) 32 (38) 41 (48) 85 (100)(31) (28) (27) (28)
HIGHEST: 4 15 (21) 25 (35) 32 (44) 72 (100)(38) (30) (21) (24)
TOTAL: 39 (13) 116 (38) 151 ( 4 9) 306 (100)(100) (100) (10o) (100)
N (Row Percent)(Column Percent)
Kruskal-Wallis = 6.4 ; df = 2 ; p-value = 0.041

Table 24: Categorized First Two Choices by Annual Per-Capita IncomePatan, Nepal, 1991
PER-CAPITA PATAN PATANQUARTILE HOSPITAL HOSPITAL OTHER TOTAL
FIRST SECOND I
LOWEST: 1 7 ( 9) 31 (41) 37 (49) 75 (100)(18) (27) (25) (25)
2 10 (13) 28 (35) 41 (52) 79 (100)(26) (24) (27) (26)
3 10 (14) 27 (39) 32 (46) 69 (100)(26) (23) (21) (23)
HIGHEST: 4 12 (15) 30 (37) 40 (49) 82 (100)(31) (26) (27) (27)
TOTAL: 39 (13) 116 (38) 150 (49) 305 (100)_ _ (100) (100) (100) (100)
N (Row Percent)(Column Percent)
Kruskal-Wallis = 1.1 ; df = 2 ; p-value = 0.6
S
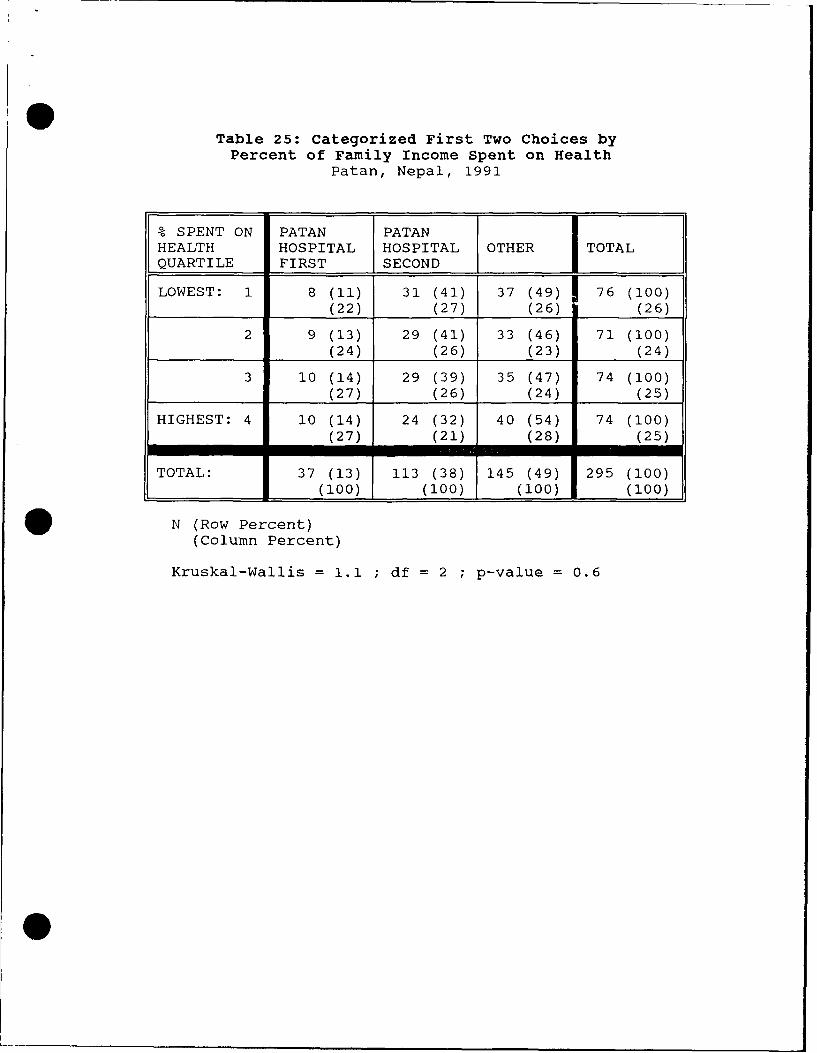
Table 25: categorized First Two Choices byPercent of Family Income Spent on Health
Patan, Nepal, 1991
% SPENT ON PATAN PATANHEALTH HOSPITAL HOSPITAL OTHER TOTAL
QUARTILE FIRST SECOND
LOWEST: 1 8 (11) 31 (41) 37 (49) 76 (100)(22) (27) (26) (26)
2 9 (13) 29 (41) 33 (46) 71 (100)(24) (26) (23) (24)
3 10 (14) 29 (39) 35 (47) 74 (100)(27) (26) (24) (25)
HIGHEST: 4 10 (14) 24 (32) 40 (54) 74 (100)(27) (21) (28) (25)
TOTAL: 37 (13) 113 (38) 145 (49) 295 (100)(100) (100) (100) (100)
N (Row Percent)(Column Percent)
Kruskal-Wallis = 1.1 ; df = 2 ; p-value = 0.6

Chapter 4: Clinic Survey 16
Methods
To determine the number of patients at Patan Hospital Clinic and the localeof their residence, a survey of the Clinic records was done. There are two setsof records: the new patient log and the overall attendance log. Only the totaldaily number of old patients is recorded, and their residence is not recorded onthe log. Moreover, there were no Clinic charts to audit, because the patientshand carry their records. However, the Clinic does log the name, address, age,and sex of the new patients. The "new" patient log contains a number of pastpatients who have forgotten or lost their records. In 199042, there were 42,023new patients. For this study information was obtained from the last entry onevery third page of the log. This gave a sample of 376 new patient entries.Annual patient numbers were taken from the overall attendance log to chart theClinic's growth.
Results
The results show that the new patients were 58.5% female. The age of themales ranged from < 1 to 73 years with an average of 26 years (s.d. 17). The ageof females ranged from 1 to 80 years with an average of 29 years (s.d. 16).Interestingly, only 39% come from the Clinic's catchment area (Figure 12).Thirty-seven percent came from the nearby cities of Kathmandu and Bhaktapur. Ageand sex of those sampled were not associated with residence in the catchmentarea.
The Clinic records show that the patient visits have been growing at a rateof 6% annually in recent years (Figure 13). The peak in the number of visitsoccurred in mid-summer, with the nadir in late fall (Figure 14). In 1990, therewere 168,849 visits, 25% of which were logged as new patients. Thirty-ninepercent of the patients who visited the Clinic in 1990 were male. The Clinicaveraged 166 new patients and 504 old patients each day, giving a total averagepatient load of 670 patients per day.
The Clinic limits the number of patients seen each day. When possible,this cap has been increased each year. However, at present the Clinic isoperating at its maximum due to lack of space.

c oo
oo Z÷ c
0 • •04--4-
© ÷_
E °o::' .. ......-CT
co .... ... ... . . . . .
.. . I . . . .• • . l l l I. , I. . • +00
.............. . . . . . . . .
.... ... .
....... ...... ........0...............L L........
. . . . . .. . . . . ..
czv
CL co
a--
z>C
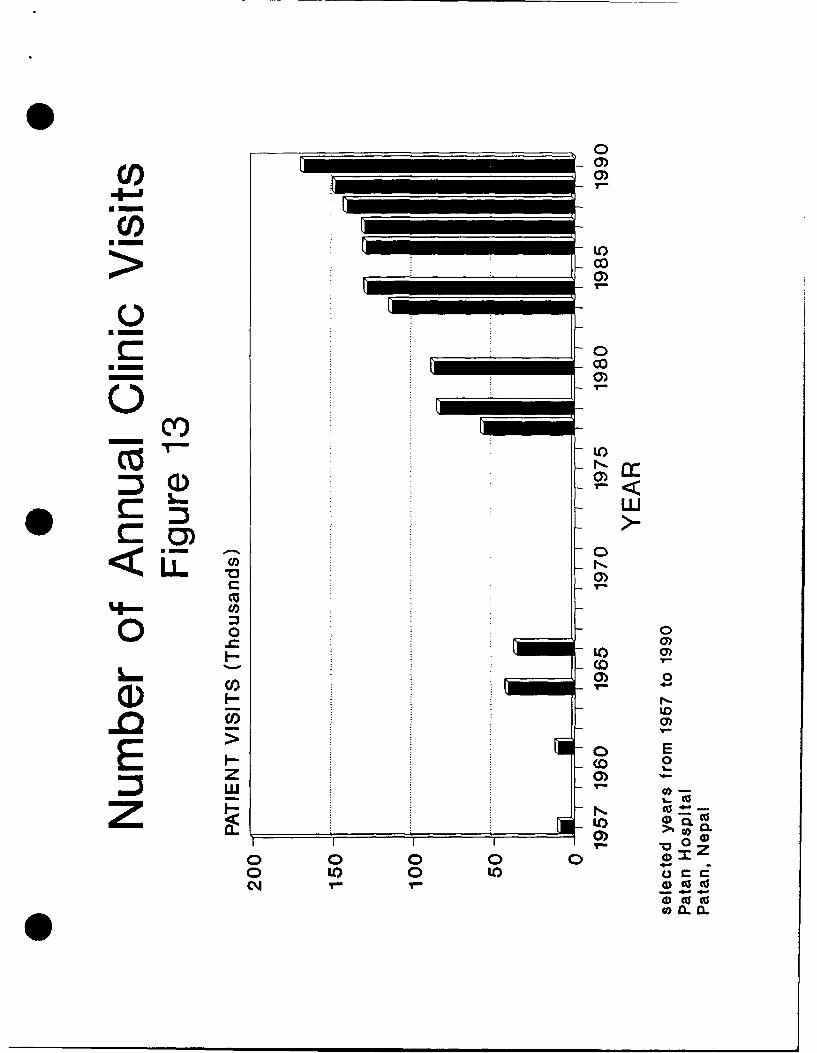
m~0)
00Uc
0)
-O 0)
COC
ww<LL O
*00 0C~ 1Z
0 0
00 LO0tE~ 0 ca co7 0- 4
o 0 0o0 00~c a.) 0 I

CC
CDC'-.4
0, 05
(a P-1 7 a T 0 T J,

* 17
Chapter 5: Discussion
Providers of choice
The preferred initial provider of choice was the private physician. Thesecond preference was the compounder and third preference was Patan HospitalClinic. The average cost of attending the private physician is 250% more thanthe Clinic, and the average compounder costs 30% less than the Clinic. So out-of-pocket expenses were not of primary driving force in determining the initialprovider of choice. Qualifications does not seem to be a driving force indetermining the initial provider of care. Compared to average service one wouldobtain at the Clinic, the private physician would have more qualification and thecompounder would have less qualifications. The predominant reason given for notattending the Clinic initially was the quick service of the alternative provider.Therefore this seems to be the factor determining the initial provider. Localresidents value quick service in their initial provider of choice; expense and/orqualifications of the provider are of lessor importance.
The respondents ranked the Clinic highest in the second provider of choice.This indicates that the Clinic is regarded well as an alternative if the initialprovider of choice is unsatisfactory. The respondents overwhelmingly stated thatthey would return because it was near. The majority had positive generalimpressions of the Clinic. However, when asked for suggestions for improvements,the number one response (a third) had something to do with the crowds and patientflow which produce the long waits. So the medical care delivered seems toadequate but the means of delivery brings dissatisfaction.
Alternative providers
Although self-care was not the focus of the survey, there was a hint ofthis in the responses to "minor injury"0 . People predominantly went to thepharmacy for minor injuries seeking perhaps bandages, antiseptics, andanalgesics. The investigator observed an interview with a 40 year old woman whosaid that she went to Patan Hospital Clinic for care. However, when her handbecame infected from an injury one month prior, she tried home herbal remedieswithout an effect. Although not directly quantified, self-care via home remedieswas evident as Subedi (1989) observed.
The survey allowed for responses of traditional practitioners, but fewpeople indicated much use of them. Previously mentioned surveys in the Kathmanduarea had a much higher percentage preferring the traditional healers2 . Thiscould be due to the fact that the interviewers represented themselves as fromPatan Hospital, thereby making the respondents think of Western medicine. Whena Western expert" on Nepali traditional medicine was asked about the lowresponse to traditional healers, he stated that the Nepalis just did not want toadmit seeing traditional healers. On the other hand, maybe they actually arebecoming less popular in the midst of Westernization.
The scope of UNICEF (1990)2 survey in a neighborhood of ward 6 was muchbroader. The Patan Hospital survey sought to encompass a greater area primarilyfocusing on utilization patterns. Comparing the results, it is surprising thatthe traditional healer as the first practitioner of choice was much higher thanthe Patan Hospital study (Table 26). The literacy rate (Table 27) and otherindicators show a lower socioeconomic profile; therefore, the samples are notcomparable. The area of Patan in which UNICEF (1990) study was done is morerural and less densely populated than the Patan Hospital study.
Patient's residency and priorities
The Clinic survey of new patients showed that the residency profile issimilar to the inpatient residency profile (Table 28). In both cases about 40%reside in the catchment area. About a third come from Kathmandu. These peoplewho are already utilizing the Clinic are willing to spent their entire day at theClinic. Their primary priority in health utilization seems not to be quick

S Table 26: Initial Provider of ChoiceComparing the UNICEF (1990) and Patan Hospital (1991) Studies
Patan, Nepal, 1991
UNICEF PATANPROVIDER OF CARE WARD 6 HOSPITAL
STUDY STUDY
Private Physician 3 39
Compounder 18 22
Patan Hosp. Clinic 20 19
Pharmacy 15 7
Ayurvedic 10 3
Bir Hosp. Clinic 2
Traditional 28 2Healers
Other 6 6
Total percentage 100 100
Numbers represent percentagesN = 310 for Patan Hospital studyN = 156 for UNICEF ward 6 study
Table 27: Literacy by Sex and StudyPatan, Nepal, 1991
SEX PATAN UNICEF PATANHOSP. LITERACY CENSUSLITERACY (1990) 1980(1991)
MALE 83 53 46
FEMALE 46 14 20
Entries represent percent literate

Table 28: Comparison of Patan HospitalInpatient and New Outpatient Residencies
Patan, Nepal, 1990
RESIDENCY L INPATIENT (%) OUTPATIENT (%)
Patan 31 21(catchment area)-
Rural Lalitpur 11 18(catchment area)
Kathmandu 37 30
Bhaktapur 6 7
Other Districts 16 23
Total: 100 100
I

p 18
service. Additionally, the primary priority of the local residents using theClinic may not be quick service either. Perhaps in both cases the Clinic isprimarily utilized because of dissatisfaction with their initial provider ofcare.
These findings are consistent with other studies. The utilization of ahealth facility is inversely proportional to its distance from the user. Also,the longer one has to wait the less that it is primarily utilized. Obviously,other factors beside waiting time play into a facility's utilization. In thiscase, language, Westernization, lack of privacy, Christianity, and physical sizewere not significant factors.
Predicting utilization
Various income indicators (per-capita income, per-adult income, and percentof family income spent on health) were used to predict health utilizationpatterns. The comparisons were mixed. The annual per-adult income quartileseemed more consistent than others in showing associations, but even theseeconomic relationships were weak. For example, the statically significant linearmodel relating annual per-capita quartile to the mean cost of the initialprovider of care explained only 3% of the actual data. The ambiguity andweakness of these income indicators shows that income may not be the bestpredictor of health-seeking behavior. A larger sample or fewer strata may haveshown associations in these non-significant relationships. At present, thehighest R2 is less than 0.03, therefore the model explains less than 3% of thedata. So even though larger studies may find more significant associations, thedata from this survey hint that relationships will not be strong.
The socioeconomic indicator of caste had no bearing on predicting theinitial provider of choice; however, the area of Patan, another socioeconomicindicator, was useful in predicting the initial provider of choice. Stratifiedanalysis showed that the predominant initial provider of choice remained theprivate physician for all three areas of Patan and all three caste groups.
There was some associations among the various socioeconomic indicators: the3 income indicators, caste group, and area lived in Patan. The higher castes andhigher annual per-capita income lived in "new" and "old" Patan. "Old" Patan hada higher than expected amount of those who do not spent much of their income onhealth. Maybe they earn more thereby making health cost a smaller percentage oftheir expenses. The higher castes had higher incomes.
In this study, the percentage of family income spent on health and per-capita health expenditures were higher for Patan than other studies. Also, theper-capita income was higher than the national average. These factors mayreflect the urban influences of this study; whereas, most of Nepal is stillrural.
The foremost reason for seeking care at Patan Hospital Clinic was stomachproblems, which reflects the high amount of gastrointestinal diseases in Nepal.Infectious disease concerns composed 5 of the top 6 reasons for seeking care atthe Clinic. Infectious disease is a major concern in Nepal. However among these6 reasons, obstetrical care was the only non-infectious reason for seeking careat the Clinic; it was second in frequency. The MCH activities of obstetricalcare and immunizations comprise one-fifth of the reasons for utilizing theClinic. Since the MCH clinics are under-utilized, this may indicate that perhapsthe hospital clinics are drawing patients from community clinics.
Reorientation
Clearly the patients who attend the Clinic from outside the Clinic'scatchment area need to be redirected. Since only 21% of new patients come fromPatan, their catchment area for primary care services, redirecting these patientsto the community MCH clinics would affect less than a quarter of the Clinic'sload. Redirecting those from outside their catchment area would have a greaterimpact on the Clinic's burden.
For some reason, many patients from outside the catchment area areattending the Clinic. Even though the long wait is turning the local citizens

p 19
to other practitioners, others from farther distances are willing to wait. Thusthe Patan Hospital Clinic cannot meet the total demand. Inappropriate usage ofthe Clinic from outside their catchment area, and inadequate usage of the Clinicfrom within their catchment area indicates that patients may need reorientating.
Reorientation starts with the patient's expectations. Why do people attendthe Patan Hospital Clinic from distant locations? First, Patan Hospital enjoysa history of being among Nepal's first modern hospitals. When surveying near theoriginal site of the hospital, it was clear that the people had fond memories offormer days when it was smaller and more personal. Perhaps patients from distantareas are dissatisfied with their local services, and Patan Hospital's goodreputation attracts them.
In the Kathmandu Valley, more than 3 hospitals have primary care clinics.Eventually, hospital clinics may have to set and enforce new policies. If PatanHospital Clinic were to practice only secondary care, the other hospital clinicswill be affected. Ultimately, the government will have to involve themselveswith coordinating hospital policies. Hospitals acting independently would onlyunfairly over-burden other clinics.
Health sector reorientation coincides with patient reorientation. TheOttawa Charter for Health Promotion states that health services should reorientthemselves away from curative services toward health promotion4. The UMN hasfound it increasingly difficult to raise donors for hospital-based care. Donorsare realizing the importance of preventive services in relation to curativeservices. The Patan Hospital Clinic does do some health promotion whereeducation about nutrition is their primary emphasis. However, this is smallcompared to its curative services. The Clinic's captive audience could onlyprofit from more health promotion activities.
Patan Hospital's response
It seems clear that the urban health consumer in Nepal prefers seeingphysicians over health assistants. Many suggested replacing the healthassistants at Patan Hospital Clinic with physicians. The Clinic has known ofthis desire and has replaced health assistants with physicians through attrition.Due to this community desire, the role of the hospital in primary health careneeds to be assessed. A former superintendent who had been with Patan Hospitalfrom before its move in 1982, was concerned by the escalating Clinic growth. Thepresent medical superintendent is still faced with this long-standing problem.Should the hospital-based clinic see only secondary referrals? In a letter tothe health minister dated July 1991 the superintendent asked the minister'ssupport in requesting assistance from the WHO for a feasibility study. Thisstudy would develop an "integrated health care system" where patients are firstseen in the community and then, if necessary, referral'. With the under-utilization of their MCH clinics, the CDHP also is interested in increasingutilization.
CDHP
Those who know of the CDHP activities all gave positive responses.Overall, the CDHP activities are not well known. The chlorination of well waterwas a project that started about 3 months before the surveys. If this projecthad not been in existence only 21% of the respondents in the target wards wouldhave known of any CDHP activities. In reality, probably more people know aboutthe CDHP programs. The MCH clinics have been in existence for years. Therefore,many may not recognize the MCH clinic as a CDHP program.
Health development
The health of the Patan community goes beyond the scope of this study onpatterns of utilization. Important issues such as sanitation, sufficientnutrition, safe water, adequate housing, education, and economic resources allof which affect health, need to be addressed. Many of these determinants werestudied by the UNICEF (1990) survey.
20
The medical resources are a relatively small factor in the health of acommunity. Although people may think that access to medical care will improvetheir health, in reality these other determinants will have a greater impact ontheir health. The respondents recognized the importance that sanitation andwater supply had in their health. Some even recognized the need for improveddiet. Interestingly, responses for improved access to medical care were minimal.Yet they were overwhelmingly satisfied with their health status. The schoolsteach the importance of hand washing and boiling water, but even the teachers donot practice it in school. Individual knowledge has not been transformed intoattitudes and practice. Individual change and awareness starts from communitychange and awareness. The WHO believes that improved environmental healthdepends on community action41.
Although hospitals lack the infrastructure to adequately deal with theseissues, they can address these topics by engaging the community. Hospitals canbe partners in community action as the CDHP has been. The CDHP is ideallysituated for this interfacing. Their recent chlorination of well water is asmall but highly visible effort. Showing that oftentimes smaller community-supported projects are more successful than larger projects initiated and fundedby foreigners. Successful community projects usually are simple and locallymanageable. Typically, foreign sponsored projects are not long lasting. Toooften they are executed hastily expecting health improvement in 2 to 3 xears.Slow, careful, and lasting expansion of community health development willfoster a sense of achievement.
Study Limitations
Due to limited resources, systematic informal interviews were notconducted. This would have been useful in validating the data, especiallyregarding the traditional healers. Attempts were made to engage the respondentsby including open ended questions. The male interviewer also found this informalway of data gathering more effective than rotely administering the survey, butthe times that he used it were not quantified. The UNICEF (1990)2 survey ofPatan ward 6 used two surveying methods. In addition to the traditionalquestionnaire, focus group discussions were employed. These groups consisted ofpeople interested in a certain topic such as education.
Since the survey represented Patan Hospital, a "courtesy bias" may haveaffected the responses for providers of care. This could explain the lowresponses to the traditional healers.
Selection basis was of major concern. It soon became apparent that therewere not enough resources to guard against this fully. The sample wasproportionally divided by the wards of interest. However the respondents thenwere chosen by availability. Refusal was not a problem. During the time thesurvey was administered, many were busy planting rice. Some may have been awayfrom home in the field before going to their regular job. Therefore, if no onein a household was home, they had no opportunity to be in the study. In the end,this survey employed stratified, systematic, and availability sampling. TheUNICEF (1990) survey of Patan used cluster sampling.
Recognizing the fact that women are especially valuable in family healthand that more men were being interviewed, the interviewers tried to approach morewomen. In general, Nepali women are known to work longer hours each day thanmen. Observations showed that there were more idle men in the communities, andthey were more interested in the survey. So women were not as numerous as men,producing another source of selection bias.
Therefore this survey cannot claim that the sample's demographic profilerepresents the true population. Yet selection bias will not affect the patternsof health seeking behavior according to specific demographics, which was thefocus of this study. This study can validly correlate socioeconomic indicatorswith patterns for health utilization, so these utilization patterns can begeneralized for the population. Due to the sampling, external validity ispartially compromised.
To minimize interobserver variation, one day of surveying was done together(10 surveys). In addition, attempts were made by the investigator during
21
accompaniment periods to keep them uniform. When the male interviewer usedinformal techniques for his data gathering, this introduced interobservervariation. The association of the interviewer's sex and the respondent's sexindicated interobserver variation.
To observe the living conditions and interviews, the investigatoraccompanied the surveyors on as many as the sessions as possible. The female hadmore experience in asking the questions and asked them more uniformly. Themale's informal approach is consistent with medical anthropological datagathering techniques, but intraobserver variation affects internal validity.Also both of them would, on occasion, ask leading questions. For example, t1-equestion on religion practiced was open ended, but often they would ask, "Hindu?"However they were not always right. Therefore information and interviewer biasmight have entered the study. Even differences in the ability of theinterviewers to translate the responses into English could contribute informationbias.
Interpretation bias became evident in the question about which programs theCDHP respondents were acquainted. When we surveyed out of the target area,respondents may have thought that government well chlorinators were from theCDHP. The investigator noted that these respondents outside the target areashould not have noted any CDHP programs because the CDHP did not qponsor anyprograms outside their target area.
Sample size was initially determined assuming two strata and binominialresponses. There were more than two strata in many analyses and many open-endedquestions were included. This reduced the power to detect significantassociations.
The Clinic survey of patient residencies was of new patients only. Howeverit has been noted that old patients who forgot or lost their records are enteredin the new patient log. Since the new patients comprise 25% of the Clinic'sload, the profile o" ':he new patients resembles the profile for all the Clinicpatients.

22
Chapter 6: Conclusions
In answering the question as to why more people in the target populationdo not utilize Patan Hospital's Clinic, the survey of 310 people revealed thatthe major barrier was its long waiting times. The respondents valued quickservice and were willing to make sacrifices for it. In order to receive quickexservice, people made sacrifices with their money by seeing a more expensiveprivate physician. Although less apparent, they were willing to make sacrificeswith their provider's qualifications for quicker service. However, PatanHospital Clinic was the most popular second alternative, showing they utilizedPatan Hospital Clinic when their initial provider of care was not satisfactory.
Language, Western medicine, lack of privacy, Christianity, and physicalsize were not perceived as significant barriers. Although people said that thereshould be lower charges, people had no problem with the registration cost.However, people had perceived that the Clinic did not give charity for the poor.The average expenditure for attending the Clinic was comparable to the nearbygovernment clinic, Bir Hospital Clinic.
Various socioeconomic indicators that may determine utilization showed weakand ambiguous patterns. In general, for the initial provider of preference, thepeople of lower socioeconomic status tended toward the less expensive compounder,and the people of higher socioeconomic status tended toward the more expensiveprivate physician. The respondents valued nearness and quickness in health careproviders. Cost and qualifications are of secondary importance in Patan.
Over half of those using Patan Hospital Clinic reside outside the Clinic'scatchment area. Also the Clinic is growing at a rate of 6% annually, and isphysically at the limit for space. So for the Clinic to meet effectively itsprimary mandate of providing primary health services to Patan, those residingoutside the catchment area need reorienting.

Chapter 7: Recommendations 23
1. To address the major barrier, the large crowds creating long waiting times,the Clinic could do patient-flow analysis. Areas of the Clinic where the waitsare the longest could be identified and addressed. Perhaps the collection offees could be streamlined. Instead of using several cashier lines, a tally sheetcould be given upon arrival and fees collected upon departure. Those who findthe fees too burdensome could be referred to the social worker.2. However, while the crowds are waiting, media could be used constructivelyto attenuate the frustration of waiting. Presently, television is a fascinationin Nepal and can be afforded only by the more well-to-do. So, videos maycaptivate the attention of bored patients. Monitors could be placed in waitingareas with presentations promoting health objectives such as self-care,sanitation, accident prevention, and smoking cessation. Initially, the CHDPvideos could be shown. These measures could make waiting more tolerable and evenbeneficial.3. The media could also be used innovatively to direct the illiterate who mayfind the large hospital Clinic imposing. To them, written signs directing themto the correct lines are meaningless. Alternative signs could incorporateappropriate drawings to direct the illiterate, thus making the Clinic more user-friendly.4. The Clinic needs to redirect effectively the excessive amounts of patientsfrom outside their catchment area. The media also could be employed in this.To start, merely an audio system could educate the waiting patients in moreappropriate health-seeking behavior. Messages could emphasize more effectivehome remedies and the appropriate practitioner to attend.5. The services at the four MCH clinics could be highlighted by this multi-media approach. Patients who need prenatal or postnatal care, immunizations,depo-provera injections, or well-baby care could be encouraged to attend theselocal clinics. iotentially at least one-fifth of the patients' concerns couldbe dealt with in these MCH clinics. One approach might be to put these asadvertisements interspersed in the health promotion segments.7. To make this more attractive, resident doctors could be rotated throughthese MCH clinics. This would promote a better community image of these clinics,and expand the doctor's experience in urban primary health care. Eventuallythese MCH clinics could be the basis for establishing future urban primary healthcare centers.8. The CDHP could continue on projects that improve the city's sanitation.There is greater potential impact on a community's health from improvingsanitation than from improving most medical care.
Several representatives from each tole could be sought out to ascertaintheir perceived needs and what role they see Patan Hospital and the CDHPcontributing to local health. Even though their desires may be contrary to aWestern thinking, high consideration ought to be placed on achieving them,thereby fostering community participation and empowerment.9. The Patan Hospital Clinic could still function as primary health care site.To make hospital's primary health care less costly, health assistants could bekept instead of replacing them with physicians. However, the physicians couldfunction in a different capacity. Instead of physicians seeing only thedifficult cases, the physicians could see all the patients by briefly going toevery patient the health assistant sees. The physician could concur with thehealth assistant in most cases. By merely "laying hands" on all the patients thephysicians could improve the image of the Clinic. Thereby, all are seen by aphysician without depleting the Clinic's budget on more physicians. Perhaps inthe presence of the health assistant, the temptation for physicians to referClinic patients to their private practices could be lessened.10. Dialogue and networking with other practitioners in the area could beinitiated. This could include the traditional healers, TBAs, compounders,pharmacists, ayurvedic, and even the private physicians. The other hospitals inKathmandu ought to be involved also. Discussion of relations and expectationswould benefit all involved. Referral patterns could become more uniform. The
* 24
practitioners could be enlightened about each other's strengths and weaknesses.Forums of continuing education could be established for the Westernpractitioners.
The traditional healers have their own unique role in the health caresystem addressing different needs than the Western practitioner. So it wouldprudent to train them in Western methods of medical care. However their role inthe heath care network needs to be made clear to the other practitioners, so thata spirit of partnership rather than competition is fostered.11. Finally, once a program is initiated or changed, an on going evaluationprocess ought to be in place to quantitate its impact on utilization.Future studies
A significant barrier to care in the local community is the Clinic's longwaiting times. The Clinic's long waiting time is due in large part to the largenumber of patients from outside of Patan Hospital's catchment area. This raisesquestion as to why some travel significant distances to Patan Hospital Clinic.It is evident that these people are willing to spend their entire day intraveling and waiting to attend the Clinic. Maybe there is a barrier at theirlocal health facility. Maybe these people are more well-to-do than the localcommunity and can afford to miss a day of work.
Therefore, a study elucidating reasons why those outside the catchment areaprefer Patan Hospital rather than their local health facility could be done. TheClinic's waiting patients could be surveyed for this. The results would benefitnot only Patan Hospital but also other health facilities in encouraging thesepeople back.
Another study focusing on the MCH clinics could be done. Factorscontributing to its under-utilization need elucidating. Perhaps the PatanHospital Clinic is usurping patients who could attend there.
Going through other years of the new patient log, one could determine anytrends in the new patient's residencies. This paper only dealt with one year.Perhaps the percentage of new patients from outside the catchment area isdecreasing annually.
25
References and Notes
1. Toohill G. "The District Hospital and Primary Health Care."report of CDHP, UMN, August 1991.
2. Presern C. Urban Basic Services A Community Profile, Lalitpur,Nepal. Nepal: UNICEF, 1990.
3. Presern C. p. 13.
4. Patan is the capital of Lalitpur District. Nepal is composed of75 districts.
5. Berlitz. Berlitz Travel Guide Nepal. Berlitz, Switzerland, 1989.
6. The demographic data were taken in 1990 and not released untilOct. 1991 which was after the survey was completed. So while thesurvey was being planned and taken this was not available.
7. Central Bureau of Statistics, Nepal, 1990 census.
8. Nepal, Ministry of Health. Health Information Bulletin vol. 6,Kathmandu: Policy, Planning, Monitoring and Supervision Division,1990.
. 9. Subedi J. "Modern Health Services and Health Care Behavior: ASurvey in Kathmandu, Nepal." J. of Health and Social Behavior.1989;30:412-420.
10. At the time of this survey, there was a student from theLiverpool School of Tropical Medicine doing a survey of thepharmacies of Patan. He was trying to determine the appropriatenessof the pharmacist's advice and dispensing.
11. Bir Hospital is where the nation's only CAT scanner is.
12. World Health Organization. Community Involvement in HealthDevelopment: Challenging Health Services. Geneva: WHO, (TechnicalReport Series, No. 809), 1991.
13. World Health Organization. "Alma-Ata 1978: Primary HealthCare." Geneva: WHO, (Health for All Series, No.1), 1978.
14. Stone L. "Primary Health Care for Whom? Village perspectivesfrom Nepal." Soc. Sci. Med. 22(1986): 301.
15. Puretz SL. "Health and Health Care in Nepal." New York State J.of Medicine. 1989;89:272-7.

26
16. Lawrence RS and Jonas S. "Ambulatory Care". Kovner AR [ed.],Health Care Delivery in the United States. NY: Springer. 1990.p.107.
17. Nepal, Ministry of Health and WHO. Country Health ProfileNepal. Kathmandu: Policy, Planning, Monitoring and SupervisionDivision, 1988.
18. Dickinson JD. "Primary Health Care in Hospitals." World HealthForum. 1987;8:80-5.
19. World Health Organization. Hospitals and Health for All.Geneva: WHO, (Technical Report Series # 744) 1987;744:1-82.
20. Stone L, Cambell, JG. The Use and Misuse of Surveys inInternational Development: An Experiment from Nepal. HumanOrganization. 1984;43:27-37.
21. Scrimshaw S, Hurtado E. Rapid Assessment Procedures forNutrition and Primary Health Care. Los Angeles, CA: UCLA LatinAmerican Center Publications, 1987.
22. Stone, 1984, p.27.
. 23. Skultans V. "Popular healing in the Kathmandu Valley" Lancet.1986 May 3(1);1025-1026.
24. Andersen RM. A behavioral Model of Families' Use of HealthServices. Chicago: Center for Health Administration Studies, 1968.
25. Subedi, p. 418.
26. Subedi, p. 412.
27. Presern, p. 62.
28. Jolly R, King M. "The Organization of Health Services." King M[ed.]. Medical Care in Developing Countries. Nairobi: Oxford Univ.Press, 1966, chap. 2, section 7.
29. Saeed AA. "Utilization of Primary Health Services in PortSudan, Sudan." Tropical and Geographical Medicine. 1984; 36(3):267-272.
30. A Popline literature review failed to come up with situationswhere near-by hospital based primary care clinics competed forpatients.
31. Radecki SE, Bernstein GS. "Use of Clinic Versus Private FamilyPlanning Care by Low-income Women: Access, Cost, and PatientS Satisfaction." Am. J. of Public Health. 1989; 79(6):692-697.
27
@ 32. Bamisaye A, Ransome KO, Famurewa AA. "Waiting time and itsimpact on service acceptability and coverage at an MCH clinic inLagos, Nigeria." J of Tropical Pediatrics. 1986;32:158-61.
33. Ekunwe EO. "Expanding immunization coverage through improvedclinic procedures." World Health Forum. 1984;5:361-3.
34. Dean AG, Dean JA, Burton AH, Dicker RC. Epi Info, Version 5: Aword processing, database, and statistics program for epidemiologyon microcomputers. Stone Mountain, Georgia: USD, 1990.
35. SAS Institute Inc. Box 8000, SAS Circle, Cary, NC 27512-8000.
36. respectively: Frank Garlick, MBBS, Bir Khawas, Meena Sharma,MCH, Owen Lewis, MBBS, Cynthia Hale, MD, MPH, Mr. Ojha, MPH, Mr.Masha, Carole Presern RN, Mona Bomgaars, MD, MPH, Robert Liu, MD.
37. Niru Laxmi Shrestha
38. Deepak Sharma
39. Initially, there were two groups that were of importance, thegroup within Community Development and Health Project target areaand the group outside the target area.
@ 40. Within the first 31 surveys.
41. The three income indicators (annual per capita income, peradult income, and percentage of income spent on health) were notcategorized into quartiles but were calculated as continuousvariables for each survey.
42. Nepali year 2047.
43. Question 3 in the survey.
44. Father Casper Miller has lived in Nepal since the 1950's andhas done research on Nepali traditional healers.
45. World Health Organization. "Ottawa Charter for HealthPromotion." Ottawa: WHO, 1986.
46. Correspondence from Dr. Frank Garlick to Mr. Ramshah Path, July19, 1992.
47. World Health Organization. Environmental Health in UrbanDevelopment. Geneva: WHO, (Technical Report Series No. 807), 1991.
48. Chabot HT. "Primary health care will fail if we do not changeour approach." Lancet. 1984 Aug 11; 2(8298):340-341.
28
Bibliography
Bamisaye A, Ransome KO, Famurewa AA. "Waiting time and its impact on serviceacceptability and coverage at an MCH clinic in Lagos, Nigeria." J of TropicalPediatrics. 1986;32:158-61.
Berlitz. Berlitz Travel Guide Nepal. Switzerland: Berlitz, 1989.
Bista DB. Fatalism and Development, Nepal's Struqgle for Modernization. Calcutta:Orient Longman, 1991.
Blustain HS. "Levels of Medicine in a Central Nepal Village." Contributions toNepalese Studies. June 1976;3:83-105.
Chabot HT. "Primary health care will fail if we do not change our approach."Lancet. Aug 11, 1984; 2(8298):340-341.
Cooley D. Shanta Bhawan-Palace of Peace. The Story of a Hospital in Kathmandu,Nepal. Kathmandu: United Mission to Nepal, 1982.
Dickinson JD. "Primary Health Care in Hospitals." World Health Forum 1987;8:80-85.
Dhungana SP.. Urban Basic Services A Community Profile, Biratnagar Municipality.Nepal: UNICEF, 1990.
Ekunwe EO. "Expanding immunization coverage through improved clinic procedures."World Health Forum. 1984;5:361-3.
Ewert DM (ed]. A New Agenda for Medical Missions. GA: MAP International, 1990.
Friedericks CW. Over Thirty. Kathmandu: United Mission to Nepal, 1986.
Hale, Thomas. Don't Let the Goats Eat the Loguat Trees, Adventures of anAmerican Surgeon in Nepal. Michigan: Zondervan. 1986.
Jolly R, King M. "The Organization of Health Services." King M fed.]. MedicalCare in Developing Countries. Nairobi: Oxford Univ. Press, 1966, chap 2.
Justice J. "The Bureaucratic Context of International Health: A SocialScientist's View." Soc. Sci. Med.. 1987;25(12):1301-1306.
Justice J. Policies. Plans, & People. Foreign Aid and Health Development. CA: U.
of CA Press, 1986.
Lindell J. Nepal and the Gospel of God. Kathmandu: United Mission to Nepal, 1979.
Miller CJ. Faith-Healers in the Himalayas. Kathmandu: Sahayogi Press, 1979.
Nepal, Ministry of Health and WHO. Country Health Profile Nepal. Kathmandu:Policy, Planning, Monitoring and Supervision Division, 1988.
Nepal, Ministry of Health. Health Information Bulletin. vol. 6, Kathmandu:Policy, Planning, Monitoring and Supervision Division, 1990.
Oswald H. "Are traditional healers the solution to the failures of primary healthcare in rural Nepal?" Soc. Sci. Med.. 1983;17(5):2557.
Parker R, et al. "Self Care in Rural Area of India and Nepal." Cult. Med. andPsychiatry. 1979;3:3-28.
* 29
Presern C. Urban Basic Services A Community Profile. Lalitpur, Nepal. Nepal:UNICEF, 1990.
Puretz SL. "Health and Health Care in Nepal." New York State J. of Medicine.1989;89:272-7.
Radecki SE, Bernstein GS. "Use of Clinic Versus Private Family Planning Care byLow-income Women: Access, Cost, and Patient Satisfaction." Am. J. of PublicHealth. 1989;79(6):692-697.
Saeed AA. "Utilization of Primary Health Services in Port Sudan, Sudan." Tropicaland Geographical Medicine. 1984;36(3):267-272.
Scrimshaw S, Hurtado E. Rapid Assessment Procedures for Nutrition and PrimaryHealth Care. Los Angeles, CA: UCLA Latin American Center Publications, 1987.
Skultans V. "Popular healing in the Kathmandu Valley" Lancet May 3, 1986;1:1025-1026.
Stone L. "Concepts of Illness and Curing in a Central Nepal Village."Contributions to Nepalese Studies. June 1976;3:55-80.
Stone L. "Hierarchy and Food in Nepalese Healing Rituals." Soc. Sci. Med..1983;17(14):971-978.
Stone L. "Primary Health Care for Whom? Village Perspectives from Nepal." Soc.Sci. Med.. 1986;22:293-302.
Stone L, Cambell, JG. The Use and Misuse of Surveys in International Development:An Experiment from Nepal. Human Organization. 1984;43:27-37.
Streefland P. "The Frontier of Modern Western Medicine in Nepal." Soc. Sci.Med.. 1985;11:1151-1159.
Subedi J. "Modern Health Services and Health Care Behavior: A Survey inKathmandu, Nepal." J. of Health and Social Behavior. 1989;30:412-420.
Toohill G. "The District Hospital and Primary Health Care." report of CDHP,United Mission to Nepal, August 1991.
United Mission to Nepal. "Commission on Institutional Implications in HealthCare." Kathmandu: UMN, 1980.
United Mission to Nepal. "Programme, Lalitpur. Programme Proposal 1982-86."
Kathmandu: UMN, undated.
United Mission to Nepal. "Introducing Nepal and the UMN." Kathmandu: UMN, 1988.
United Mission to Nepal. "UMN Health services." Kathmandu: UMN, 1989.
United Mission to Nepal. "UNM 35 Years in Nepal." Kathmandu: UMN, 1989.
Wake CJ. "Health Services and Some Cultural Factors in Eastern Nepal."Contributions to Nepalese Studies. June 1976;3:113-126.
Weiner S. " 'Source Force' and the Nepal Medical Profession." Soc. Sci. Med..1989;29:669-675.
World Health Organization. Alma-Ata 1978: Primary Health Care. Geneva: WHO,(Health for All Series, No. 1), 1978.
30
World Health Organization. Community Involvement in Health Development:Challenging Health Services. Geneva: WHO, (Technical Report Series, No. 809),1991.
World Health Organization. Environmental Health in Urban Development. Geneva:WHO, (Technical Report Series No. 807), 1991.
World Health Organization. Hospitals and Health for All. Geneva: WHO, (TechnicalReport Series, No. 744) 1987:1-82.
World Health Organization. "Ottawa Charter for Health Promotion." Ottawa: WHO,1986.

Appendix I: Survey

a
This questionnaire is to help Patan Hospital Clinic provide betterservices for your neighborhood. Would you help us by answeringthese questions for us? Your answers will be kept. confidential.
Demographic: LanguageCode: Date: Ward: Tole:Caste: Ethnic group: Age: _ Sex:Position in household: How long lived in Patan: __ yrs. from:How many in this house are your family? adults: _ children:Main source of income: other:Annual family income:How much does your family spend on health in a year?Can you read? Yes No Education level:Religion practiced: _
General:These are where some people go for health service in this area: relatives,TBA, dhami, pharm., private clinic, ayurvedic (vaidhyas), homeopath,Patan hosp., compounder, Bir Hosp.1. Where does your family go for health services?
a. How much does it cost?b. Why do you prefer it to Patan Hosp.?What change(s) would improve your family's health?
a. Are you satisfied with your family's health? Yes No _
3. a. Where does your family go to when they get ill?b. Where does your family go when they get injured?
Patan Hospital:4. Has your family ever been to Patan Hospital clinic? Yes No
a. If "Yes", for what reason(s)?
b. Were you satisfied with the fees at the clinic? Yes No1) If not, what is a fair fee?
c. Did you feel that you can fully communicate with the staff? Yes No _
1) If "No", why?d. Would you go back? Yes No Why?
5. Has your family been exposed to any hospital community programs? Yes No _
a. If "Yes", what? well chlorination, video, MCH, home visitother
b. What is your impression of it?6. Do people without enough money get treatment at Patan Hosp.? Yes No _
7. What is your general impression of the clinic?8. What would encourage more people to use the hospital clinic?
aotes:
length of interview in minutes:
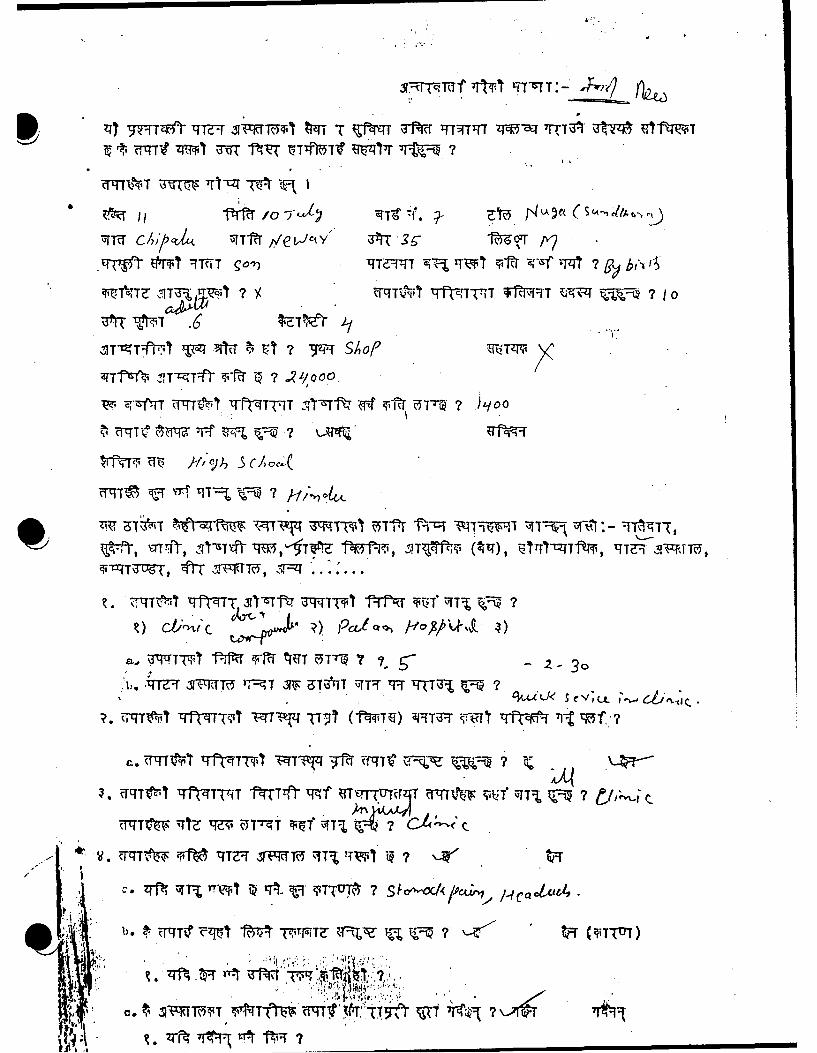
II 75Zf 777-~ ,o-rŽ %rrý',i 9-Rf rrqTT V434q 7TA " Uf
,P~ qtrqr 97fNThF go-)'T -VqTTZ Vq, I-TWI i-v-? i900rlvO t*t
T~te.T ITU h 7r~~ 71T 7T1, 7~~ f-i1 I FT -9 Tr 0
'C SO
.l:* tfli -;,T-qTl'r 5- 7YT3~~~T~T VtTt~~TfzT-rI 'IS-frW i~liT-- 7 - O
?TqT T Rq:L

V. iMI~hi Tft-TThT I-ftnT'(37,P WIT%9fz T,"ttf -TTT 7 ~n
7, -~iTT \,Tt1 M T2R 951-mf V4 I~r(s ýqCt ii-RU, F4z
~~~~~~~~~ bf 29'a cgJtlCVLI4
it .7..*..
ilmrP,7-ft , V .51-~ft .'IfqT TZ 'TV: -t,'qV-:"2

32
Appendix II: Additional Data

Table A: Caste Groupings
CASTE ICASTESGROUP
HIGH Newar: Amatya, Baidhya, Bajracharya, Brajacharya,Joshi, Karmacharya, Malchu, Maleku, Pradhan,Rajbhandari, Shrestha, Rajopadhya, Shakya, Mulmi
______Others: Brahmin, Chetri
MIDDLE Newar: Awali, Chipalu, Kansakar, Malakar, Suwal,Tainrakar, Tandukar, Tuladhar, Silpacar, Benjancar,Bijulicar, Chitracar, Dangol, Maharjan, Prajapati,Ranj it
Others: Gurung, Linibu, Magar, Rai, Tamang
LOW Newar: Khadgi, Napit, Pode, Rajak, Shahi, Nakarmi,
Newa
,Others: Chudra, Darnai, Kaluwar, Razak
Table B: Literacy by Area of PatanNepal, 1991
I AREA OF PATAN
LITERATE [ INTERMEDIATEjNE OLD TOTAL
YES j115 (53) 62 (28) 42 (19) j219 (100)
NO 78 (86) 8 (9) 5 (5) I 91 (100)
ITOTAL: 193 (62) 70 (23) 47 (15) 310 (100)J
N (Row Percent)
Chi-square =30.2 , df =2 (p-value =0.00000028)

M 0 %DO 0 LO NO 0
O H- H H H C4
~H mc~,o c~r 0 c m
0
HH wH
41 z NO ONtC m '( cOLC ml 0H w H( rq (iN H( N -1 N N(Nc
P4>, -T Lo r ~ -n C)
HH
H ýH
04
Q4 (N* H)
V_ 04Pa
$4 a,
4 q5n--t Ln 5" o - m m
a: z Ln NN m " HH (N r
0 :3ý
~xH H-U
ý4 z (N c X z
0 H(' 0 r 0 .c 'HI
z H4

U') 0 0110 COi0 N\0 LO 0H- rO 0O .D 0 coO0 000 H- H H- T- T~-1
co r- c-,)' N oCo0 c,4r- O .4CN( m m ~ C Cq4Cr N N N
0
~z m 0 00 HNC kDCO CN) ;:
a4H~ H HL
4) __ _ NT__-I__ :rý N 1
A4t% HH COC~N
>. >4 N m aN m am
1-4 a4 0-
0 HxH - - -1 C,- :
14 *Z * T c1n Cm 4N 04Jc It ' -I
4* a4 a- aPaa
.H PLH
z .; L qpVI Dr
* E- a4 a a a4
0~( O CC' \~.m 1t r ON r-0 wrý H
UHNZH
aa a0
0E- *0U=
PL Z oH NL - ON H
0u x
H) U)
S0 H 0 0 Z

corH, N- 00 N- r- 0-
rqN (1 () N 0 C'N N r-qc
4) 4 f Q C '.-frj r- - NN ' H ~r~
0
C*L a4 a a
r-4
0 * 0)
o1 ON-N Oc o N
H% Hc NN H H' -'
Fz4 a) ' '
0o'
ýz q q
4-J P4E1P0 ma
0 :Jz c- j o r
0c NO4 E-r- mr H
H z
.rf P4_0F24 4-4
z) ~ H m1 ~lzr ,T CQ -,
0~
UU E- aa a a
0 H H H~
41&4
z < HwU w 12 (
-4 0 0 z____4 I_ __L.'-o\0z

ci
>1 ZR
S0)
t-4-00 1cyDE
LO.
00
= z
0
-cz(5Z
0
- z-
0
1z

a
0
coo
CYU)
>mw(a)
0
* 0o IDZC0 L
COU
co
0 0)
Cll OCfCU
0-
CO L
0134hO
*0

Picture A: Female Interviewer and Investigator
Patan, Nepal 1991