ad-a253 363 :ii i hi l hii iiii •i tlaft · preliminary assessment of primary flight display ......
TRANSCRIPT
WL-TM-92-33' 4
AD-A253 363"III :II II I hi l HII ' Iiii •ItlAft
Preliminary Assessment of Primary Flight Display
Symbology for Electro-optic
Head-Down Displays
John M. Reising D TICLarry C. Butterbaugh EL ECTE
Kristen K. Liggett 1992WQFIPC JUL31June 1991 S C
Approved for pub!ic release. Distribution unlimited.
Cockpit Integration DivisionFlight Dynamics DirectorateWright LaboratoryAir Force Systems CommandWright-Patterson Air Force Base, Ohio 45433 i9 --- 5E3_9#? 2111111 (li~i /Ill 1111111/lii Iifll 11 111jlll
FOREWORD
This Technical Memorandum (T-M) documents the results of an in-house
research effort accomplished for the United States Air Force Wright
Laboratory's Joint Cockpit Office (WL/XPK), Wright-Patterson AFB, Ohio. Thework was performed by Midwest Systems Research, Inc. (MSR) under contract
F33615-88-C-3612. The monitor of this contract is Mr. George Palmer (WLIFIPB).
Program Manager for the effort is Mr. Larry Butterbaugh (WL/FIPC).
Software development and integration was accomplished by Lt. Michae;Cook and Mr. Antonio Ayala of Wright Laboratory's Cockpit Integration Division
(WL/FIP) and Mr. James Stadler of Midwest Systems Research, Inc..
This study is an initial step supporting a USAF program to research and
develop a recommended standard for the presenting primary flightinformation on an electro-optic head-down display. The purpose of this memois to provide the technical community with the Cockpit Integration Division'sassessI•-^^ . . ol I•,o eXisti, pr,-,a-y " . . .piy forrtts thdt have evoived in
commercial transport aircraft based on years of research and operation. ThisTM does not represent official Air Force position, but offers useful information
and creates a data base from which further head-down prirnd;y flight display
symbology development can proceed.
This Technical Memorandum has been reviewed and is approved.
Richard W. Moss, Chief 'erry erson, Deputy DirectorCockpit Development Branch Joint Wo'•kpit OfficeCockpit Integration Division Are".N1.o n For
oonel .Jay R Stretch, Director I J,---6a!.nt 7Cockpit Office t. r ,/
SAv~tlai'blity] codes
I a:AV P1 L ard/or
2 DI-t

"TABLE OF CONTENTS
Page
FOREW ORD ..................................................................................... 2
TABLE OF CONTENTS ........................................................................... 3
LIST OF FIGURES ............................................................................. 4
ABSTRACT ........................................... ..... 5
INTRODUCTION .................................................................................... 6T-Scan Concept ...................................................................... 6Integrated Flight Instrument System ........................ 6
OBJECTIVE ..................................................................................... 11
METHOD .................................................................................... 11Apparatus .............................................................................. 11
Cockpit ................................................................................... 11Display Fo, -nats ...................................................................... 11
Primary Flight Display Key Differences ...................................... 16
Common Features of Both PFDs ............................................... 17
Subjects ................................................................................. 21
Procedure ............................................................................. 21Performance Measures ............. .......................... 23
Subjective Opinion Measures ................................................... 23
RESULTS .................................................................................... 25
CONCLUSIONS AND RECOMMENDATIONS ....................................... 27
REFERENCES ................................................................................. 30
3

LIST OF FI(0URES
PageFigure 1 T- Scan Arrangement of Basic Flight Instruments 8
Figure 2 Airspeed Indicator from IFIS 8
Figure 3 Altitude Indicator from IFIS 8
Figure 4 T-Line Concept of Aircraft Control 9
Figure 5 Boeing 747-400 Display 12
Figure 6 McDonnell Douglas MD-I1 Display 13
Figure 7 Navigation Map Format 14
Figure- 8 Horizontal Situation Indicator Format 15
Figure 9 Evaluation Flight Profile 22
Figure 10 Blend Primary Flight Display 28
4

ABSTRACT
This Technical Memorandum describes a prelimi:•ary study to assess thebasic operational utility and pilot preference for head down primary flightdisplay (PFD) symbology, in order to derive a preferred baseline PFD format forfurther evaluation. The PFD formats used in this study were based on displayformats and symbology developed by Boeing Commercial Airplane Group(B747-400), McDonnell Douglas (MD-11), and concepts developed by theWright Laboratory Cockpit Integration Division (WL/FIP). lhe thrust of theseassessments was to identify a preferred symbology and display format whichwas easy to interpret during irestrument flight, provided attitude awareness tothe pilot during Instrument Meteorological Conditions (IMC), and providedappropriate cues for recovery from •Jnusual attitudes in modern aircraftequipped with glass cockpits. No attempt was made to examine the variousdisplay or symbology enhancements needed for weapon delivery or otherspecial mission activities. The resulting primary flight display, which wasderived through pilot assessments of alternate formats in the MicroprocessorApplication of Giaphics and Inte~r;.tive C.Fmrn;nicati_,-n iI•I/P•.:~ co•t, r;combines preferred features of the various concepts. The resulting baselinePrimary Flight Display concept presented here is applicable, out not necessarilylimited, to use in a transport or cargo type aircraft.

INTRODUCTION
As part of an Air Force effort to standardize aircraft primary flight displays
(PFDs), the Cockpit Integration Division has evaluated various formats for
primary flight. The Air Force's concern for standardization stems from a
proliferation of PFD formats as cockpits have transformed from
electromechanical instruments to electro-optical displays. The resulting "glass"
cockpits afford the designer almost unlimited freedom to create PFD formats,
and a plethora of such formats has been the result. Additionally, there is
concern that the ýmissionization" of the formats, i.e., incorporating mission
related dats and other recent changes into the basic flight format, has
destroyed the T-scan concept and the Integrated Flight Instrument System
arrangement which evolved from the Whole Panel Program conducted by the
Flight Control Laboratory at Wright-Patterson AFB. Flight testing of these
display concepts and systems was performed initially at WPAFB and later, in an
OT&E context, at the Instrument Pilot Instructor School at Randolph AFB
during the late 1950's and throughout the 1960's. (Ref.1)
T-Scan Concept
Electromechanical instrument designs in use today that result from this
work, line up certain control, performance and navigational information items
in an arrangement that places the airspeed indicator, Attitude Director Indicator
and altimeter along a horizontal line and the Attitude Director Indicator and
Horizontal Situation Indicator on a vertical line (Fig. 1). This is known as the 'T
scan concept' and is the recommended instrument arrangement (Ref. 2). The
horizontal line provides information :elated to pitch and power; the vertica! line
provides information related to bank and heading. As a result of this
geometrica' configuration, the critical flight and performance instruments
fo:rned a "T" scan pattern, an easily interpretable, integrated set of information
items.
Integrated Flight Instrument Systemr
in a concurrent development and in support of an anticipated need for
integrating ground, data linked, commands (heading, altiiude and speed) to
6
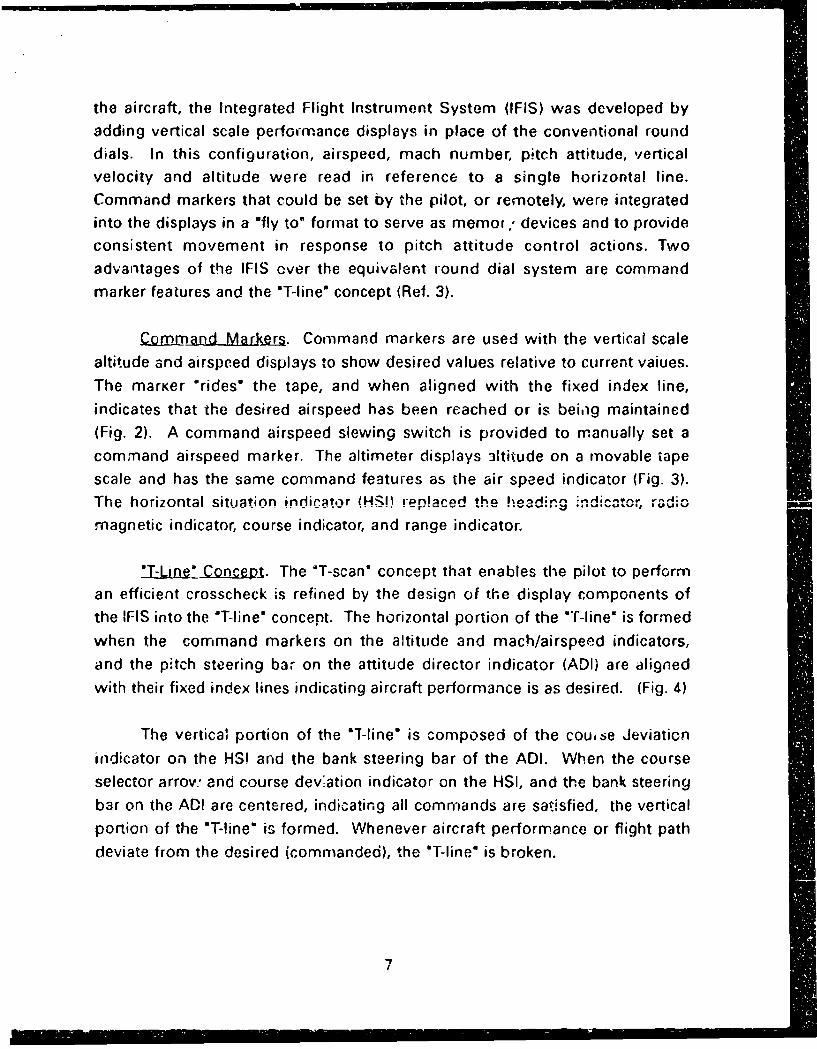
the aircraft, the Integrated Flight Instrument System (IFIS) was developed by
adding vertical scale performance displays in place of the conventional rounddials. In this configuration, airspeed, mach number, pitch attitude, vertical
velocity and altitude were read in reference to a single horizontal line.
Command markers that could be set by the pilot, or remotely, were integratedinto the displays in a 'fly to" format to serve as memo,,, devices and to provide
consistent movement in response to pitch attitude control actions. Two
advantages of the IFIS over the equivalent round dial system are commandmarker features and the "T-line" concept (Ref. 3).
Command Markers. Command markers are used with the vertical scale
altitude and airspeed displ3ys to show desired values relative to current vaiues.
The marKer "rides' the tape, and when aligned with the fixed index line,indicates that the desired airspeed has been reached or is beioig maintained(Fig. 2). A command airspeed slewing switch is provided to manually set a
command airspeed marker. The altimeter displays 31titude on a movable tape
scale and has the same command features as the air speed indicator (Fig. 3).The horizontal situation indicrtr MH.%I1 r-•lra•ce the h-Ce, . .r,. -d;-
magnetic indicator, course indicator, and range indicator.
"7--L=i-e8 Concept. The "T-scan" concept that enables the pilot to performan efficient crosscheck is refined by the design of the display components of
the IFIS into the aT-line" concept. The horizontal portion of the T''-Iine" is formedwhen the command markers on the altitude and mach/airspeed indicators,
and the pitch steering bar on the attitude director indicator (ADI) are aligned
with their fixed index lines indicating aircraft performance is as desired. (Fig. 4)
The vertical portion of the "T-line" is composed of the couse Jeviation
indicator on the HSI and the bank steering bar of the ADI. When the course
selector arrov. and course devation indicator on the HSI, and the bank steering
bar on the ADI are centered, indicating all commands are satisfied, the verticalportion of the T-line" is formed. Whenever aircraft performance or flight path
deviate from the desired (commanded), the "T-line" is broken.
-I|

I~ir I INV
Sifji TWON
0o 0
"T-SCAN" ARRANGEMENT OF BAS:C FLIGHT INSTRUMENTS
FIGURE 1
MACH AIRSPEED RATiE CF BAROMETRICNUMBER CUMS ALTITUDE
• - •100COMMAND-- - _• TITUDE
AIRCRAFT IiRSENT AIRCRAFT tAIRCW•AT •-l
- - FIXED INDEX-" -- AAIRPE kN, LINET(PRESENTASEALTITUDE)
AIRSPEED INDICATOR FROM IFIS SHOWING AL1ITUDE INDICATOR FROM IFIS SHOWINGDESIRED MACHJAIRSPEED ATTAINED PRESLNT ALTITUDE Bf I OW DESIRED ALnlUDE
FIGURE 2 FIGURE 3
I8

T-LINE 'CONCEPT OF AIRCRAFT CONTROLFIGURE 4
9

The strengths of the "T-line coricept" are: minimum time to scan, all
displays are 'fly to', qnd markers serve as memo-y devices.. By using the
comminand features of the system, cross check is simplified and deviations from
the desired are readily detectable. The task of cross-checking is much easier
because the pilot can simultaneously observe the attitude indicator, his most
important instrument, and the proper performance instruments. The "I-line,
first in flight test and later in actual operation in the F-105, F-106, F-111, C- 141,
C-5 and other aircraft, has shown itself to be a significant help to the pilot in
utilizing the primary flight display in Instrument Meteorological Conditions.
The research documented here addressed two key questions: Can the
basic, proven T-scan and the T-line concept of electromechanical cockpits be
incorporated succe.ssfully into glass cockpits of modern multi-purpose display
equipped USAF aircraft, and what symbology and configuration should be
incorp'rated into the display format?
The initial PFD formats examined were not from military transport
cockpits, which are just making the transition to glass cockpits, but rathe. based
o•- commercial transport displays. Since the commercial transport community
has been fly'ng glass PFDs for over 10 years in aircraft such as the Boeing
757f767, and has built up extensive operational experience, it was decided to
examine the latest thinking in the commercial aviation community. Therefore,
the Boeing 747-400 and the McDonnell Douglas MD-11 were chosen a6 the
basis for the formats used in this initial assessment.
Two obvious departures from the original Air Force convention are
presented in these display systems. The first is in number'ng the airspeed scale
in reverse of the IFIS, resulting in a "ily-from" configurntion. The second is the
side-by-side arrangement of the two (vertical and horizontal' situation displays.
In these, one presents attitude and pitch control rel3ted performance
information while the other presents horizontal situation information in the
form of a map or horizontal situation type of format. In this configuration,
lateral and vertical deviation indicators on the "PFD" provide some minimal
navigational information; for navigation situation awareness, however, the
piiot must scan laterally to the adjacent display. This breaks the *T-scan" into
two separate parts.
10

Following this initial assessment of the two PFD formats, the best features
of both were combined to form a blended format. In future studies, this
composite format will be evaluated as a baseline ag3inst a military missioni.
It should be noted that efforts are underway to develop PFDs for fighter
aircraft as weli as transports. Following the completion of that research, it will
be determined if a separate standard i• needed for the two types of aircraft, or
if a single standard vvill be sufficient for both.
OBJECTIVE
The objective of this initial study was to derive, through comparative
assessments, a baseline for head-down display symbology and format for the
presentation of primary flight information. This report documents the results
of this ass;ssment and the derived baseline.
pLMET•HOD
Apparatus
_•_;kpi . rhis study was conducted in a generic single-seat cockpit facility
using a modified F-16 aeromrodel.
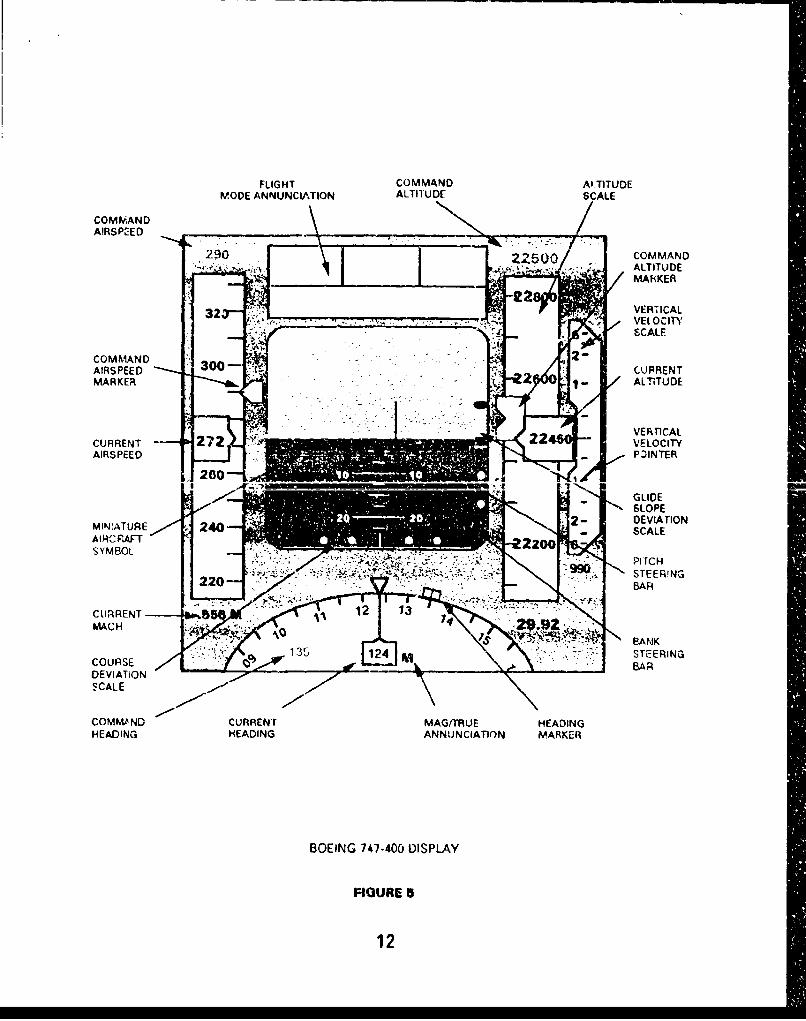
iL01 v Frnts. The two formats used in this study were based on
those of the Boeing 747-400 primary flight display (Ref. 4), as shown in Figure
5, and the McDonnel! Douglas MD-11 primary flight display (Ref. 5), as shown
in Figure 6. These formats are desig,.ed for presentation on 8-inch displays,
and were reproduced to full-srale for this study. The display formats were
programmed using Silicon Graphics IRIS 4Ds. Two additional formats were
provided in order to perform the evaluation flying tasks: a navigatio map
(Figure 7); and a horizontal situatior, indicator (Figure 8). A stop watch with a
second hand was present on one of the displays to time legs of the flight when
required. There was also a touch-activated keypad to enter commanded
airspeeds, altitudes, headings, and courses.
*11
FLIGHT CMADAl.T1TUDEMODE ANNUNCIA.TION ATlLC CL
COMMANDAIRSPEED __________
22500 COMMAND
MAHKER
COMMAND 2AIRSPEED 30 URNMARKER A'TD
ft -ftVERTICALCURRENT - 272 VEOCTAIRSPEED PONE
SLOPE
MIITUE2- DEVIATION
SYMBOL
STEERING
CURRENT12 1....
.,'12 i STEERINGCOURSEBA
SCALE
COMMAND CURRENTr MAG/TIRUE HEADINGHEADING HEADING ANNUNCIATION MARKER
BOEING 747-400 DISPLAY
FIGURE 5
12

FLIGHT MODE COMMANDANNUNCIATiON ALTITUDE
COMMAND 1 2360AIRSPEED - ,X --
VELOCITY
220 1ý4- SCALE
- 2600VERTICAL.COMMAND 200 VELOCriYAIRSPEED IQPOINTERMARKER
AL TITUDE
MARKER
MI ITUE 10 L T DAIRCRAFT ;11 SCALESYMBOL
-. GLIDE SLOPEDEVLATIONSCALE
DEV!TIONPITCHSCALE STEERING BAR
BANKHEADING S!IERING BARMARKER
COMMAND DIRECTION CURRENTHEADING TO TURN HEADING
INDICATORS
M~cDONNELL DOUGLAS MVD-1 1 DISPLAY
PAURE 6
13

61321 9
TR
GRH
336"/
S IRK
M038S.41
IS 14
VOR L Von aIYKM it"ON ?Ll 4U
Navigation Map Format
Figure 7
14

BUGLE3.0"/15 1432.0&F TRKL340 m 2 2.3sM
//
40
/C
-40 -
VOR L VYO RELM ve AST
I,,38.5 l ,s(t) s,42.3
Horizontal Situation Indicator Format
Figure 8
15

Primary Flight Display Key Differences.
A.J. The B747-400 and the MD-11 present the same information usingdifferent formats (See Figures 5 and 6). The MD-1 1 has a rounded ADI displaywith the glideslope and localizer scales and indicators appearing outside of thedisplay window. The B747-400 has a square ADI display with the glideslope andlocalizer scales and indicators appearing inside the ANl viewport.
In each of the formats, the attitude indicator is displayed as thesimulation of a mechanical ADI ball, shown in a clipped window. The ball is
divided by a solid white horizon line extending from one side of the sphere to
the other. The top or "sky' half is colored cyan; the lower or "ground' half is
brown. Pitch reference lines and alphanumerics are colored white. The totaiviewable pitch range is approximately 45'. The pitch reference scale indicates
pitch angle through 90° climb or dive. The pitch lines are graduated in 2 1/20intervals with numerical indications at each 100 of pitch. The 5° tic marks aretwice as long as the 2 1/20 tic marks and the 100 reference lines are twice as longdz; One 5Y tic marks. Characters, pitch scale and horizon rotate and translate in
pitch and roll about the fixed aircraft reference symbol. Bank attitude isindicated by the pcsition of the bank pointer relative to the bank scale located at
the top of the attitude indicator. The scale is marked with 00, 100, 200, and301indices. The B747-400 also has a 450, and the MD-11, a 600 bank index. The
zero degree index is triangular shaped and the thirty degree indices are drawnlonger than the other lines for easy reference. The points of the digital readout
windows on the airspeed and altitude scales can be used for 90 degree bank
reference points. The bank pointer moves in &n arc from the attitude indicator
center. The pointer is triangular shaped, solid white in color, and also serves as
a sky pointer.
Vertical Velocity Indicator. The MD-1 1 presents the vertical velocityindicator outboard of the altitude scale. The "climb/dive' rate is shown by a
black, outlined in white, arrow projecting upward or downward from the "0,
(unlabeled) index on the scale. The usable scale is plus or minus 4000 feet per
16

minute. The B747-400 has a more conventional type moving needle that is read
against a 9inear scale that is usable from plus or minus 6000 feet per minute. It
is located outboaid of the altitude scale. The actual rate of change is digitally
displayed above: if climbing, or below, if descending, the vertical velocity scale.
Command Markers. For both formats the command markers represent
the position of the pilot selected values of airspeed, altitude and heading on the
respective scales. If the selected value is not visible (off scale) the marker rests
at the end of the scale nearest to the point that it will appear. The marker "rides"
the tape, and when aligned with the fixed index line, the commanded value has
been reached or is being maintained. Pilot selected values for airspeed and
altitude are shown in digital form immediately above their respective scales.
Pilot selected headings are shown in digital form on the left side of the compass
rose.
In both formats, the markers are 'fly to* symbols with the exception of
airspeed. The airspeed sca!e has the large numbers on top, thus making it a
"fly from" command. The MD-11 has solid rmagenta colored "bow-ties (W) for
all three parameters. The length of the marker represents 10 knots when used
on the airspeed scale. The markers are the same general shape for each of the
scales. The 8747-400 marker symbols are larger and in outline form (J.<3)when selected and are colored solid magenta when riding the tape. Three
different marker symbols are used with the three different scales.
Heading gots, The MD-11 uses a series of dots around the heading scale
to show the pilot the shortest direction to turn when a ,iew heading is selected.
The B747-400 does not have this feature.
Common Features of Both PFDs.
Informatioo _•_Ls. The airspeed and altitude scales are vertical and
appear on the left and right sides of the display, respectively. Pointers are
provided for each scale to provide an accurate readout. Each scale is provided
with a digital readout of the current value in a window located in the middle of
the scale. Each scale has provisions for a command marker to indicate
reference airspeed, heading and altitude.
17
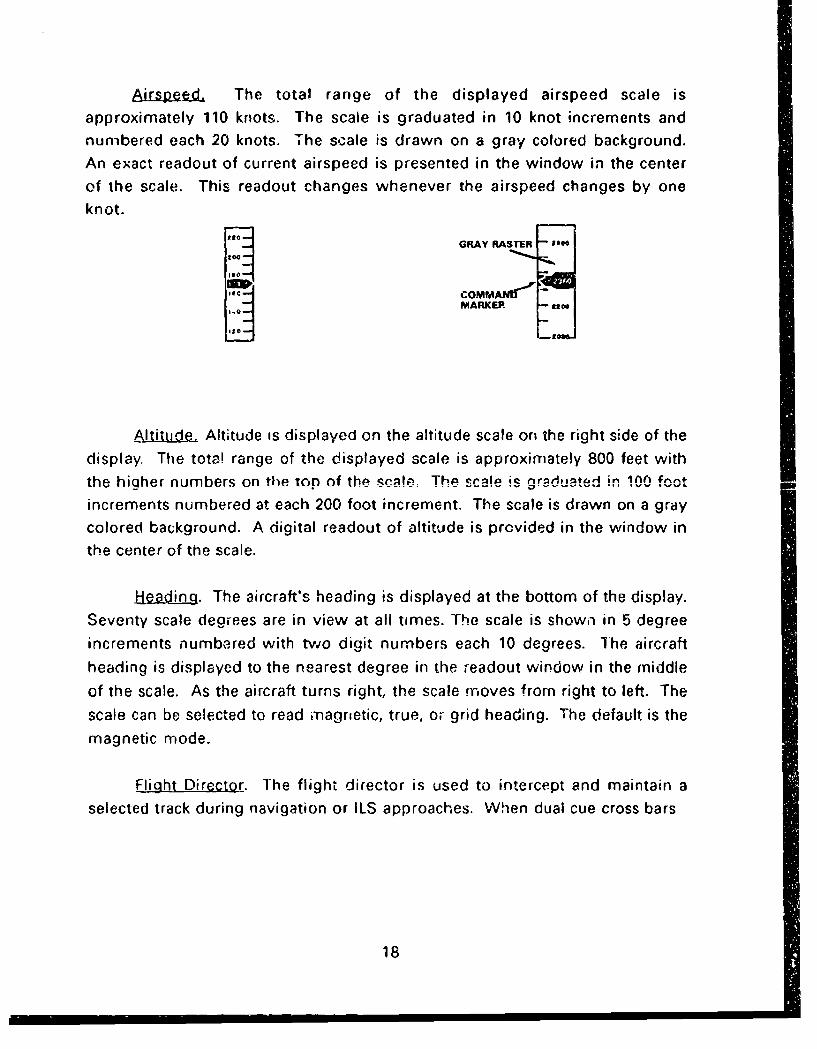
p The total range of the displayed airspeed scale isapproximately 110 knots. The scale is graduated in 10 knot increments andnumbered each 20 knots. The scale is drawn on a gray colored background.
An exact readout of current airspeed is presented in the window in the center
of the scale. This readout changes whenever the airspeed changes by one
knot.
GRAY RASTER *000
ISO-
COMMAN~r"MARKER no
Alt itud. Altitude is displayed on the altitude scale on the right side of the
display. The tota! range of the displayed scale is approximately 800 feet with
the hiqher numbers on the ton of the scae. The scae is nrnduateri in lAO foot
increments numbered at each 200 foot increment. The scale is drawn on a gray
colored background. A digital readout of altitude is provided in the window inthe center of the scale.
Headin_. The aircraft's heading is displayed at the bottom of the display.Seventy scale degrees are in view at all times. The scale is shown in 5 degreeincrements numbered with two digit numbers each 10 degrees. The aircraft
heading is displayed to the nearest degree in the readout window in the middle
of the scale. As the aircraft turns right, the scale mrioves from right to left. The
scale can be selected to read magnetic, true, or grid heading. The default is the
magnetic mode.
Flight Director. The flight director is used to intercept and maintain a
selected track during navigation or ILS approaches. When dual cue cross bars
18

symbology is used for the flight director, the aircraft is flown so that the bank
steering bar and the pitch steering bar are centered over the aircraft symbol.
-n -1--If the bars are centered, the aircraft is either correcting properly or is flying the
desired flight path. The bar are 'fly to" commands and are colored magenta.
A second option is available for both formats. Flight director symbology
is an aircraft symbol with command bars (wings). 9 The command
bars are colored magenta ("fly to') and the aircraft symbol is colored black. The
aircraft is flown so as to nestle the aircraft symbol into the wings to satisfy
commands. For optimum operation a definite, thin open space (line) is viewed
between the command bars and the aircraft symbol when steering commands
are satisfied. The open area will widen or disappear as pitch attitude changes
or cor,,,a•Isd bas,:ý muve to provide a new pitch command. Roll theading
correction) commands are seen as unbalanced line width, the low command
bar side representing the direction of the turn command. Bankinp the airplane
toward the low command bar until the lines on both sides ap,. ar equal
satisfies the bank commar i.
Mach Number. The aircraft mach number is displayed in digital form
immediately below the airspeed scale on the B747-400 and is shown in the
cruise mode, inboard of the airspeed tape, opposite the airspeed pointer on
the MD-I 1.
Sideslip Indicator. The aircraft sideslip is displayed as a trapezoid which
moves relative to the bank pointer. Sideslip is represented by indicator
movement along the bottom of the bank pointer (left or right, in the directionof the acceleration) regardless of the bank angle. The indicator is centered for
zero acceleration. The indicator is white in color. A- ",,
Eight. Path Marker. When selected, the flight path marker (FPM) provides
the pilot with an outside world reference with regard to actual aircraft flight
19

path. It represents the point towards which the aircraft is flying at all times. The
symbol used is a circle with wings and tail. The FPM is aircraft axis stabilized in
roll (the FPM wings stay parallel to th- aircraft wings). This symbol was riot
tested durin-' the study.
Aircraft SyrnbL The aircraft symbols used in both formats are similar
when used with both the dual cue and single cue flight director. This symbol is
displayed at all times. The symbol is analogous to the miniature aircraft symbol
used with the standard attitude indicator and remains fixed at the center of the
display. uI I Aircraft pitch may be determined by reading
the aircraft symbol against the pitch scale.
Pitch Linit. The pitch limit (limiting angle of attack) indicator, is drawn onthe pitch scale of the attitude indicator and represents a 'not to exceed* angle
0 3ttack. Q -J&L The values are determined by the aircraft computer.
The symbol is white in color during normal flight, becomes amber as the pitch
attitude approaches within 2 1/20 of the limit, and changes to red as the limit is
reached... .... T ..... %A,2 o by O Pilot whenI avoidU oII wi nd sheer. Tne
symbol was not tested during the study.
Glide Slope Deviation Reference Scale, Tliis scale with its magenta
diamond shaped indicator show the aircraft's vertical deviation from a
commanded vertical path, such as found with an ILS glideslope, station
keeping equipment or an autonomous landing system.
Course Deviation Reference Scale- A presentation of the primary
guidance lateral deviation is displayed on the scale by a magenta diamond
symbol. It is used to indicate deviation from a commanded path such as found
with the localizer of an ILS approach, station keeping equipment, inertial
navigation systems and TACAN/NOR rsdials.
20

Subjects
For this study, eight pilots were used to e-a!uate the displays.Participation was on a voluntary basis. Their experience varied from between2500 and 7000 flying hours and was mixed between cargo/transport andfighter type aircraft.
Procedure
All subjects received a standardized briefing on: 1) the purpose of the
study, 2) display format information, 3) how to operate the controls in thecockpit, 4) the experimental procedures used during the study, and 5) thesubject's task during the study. Each session lasted approximately 90 minutes.
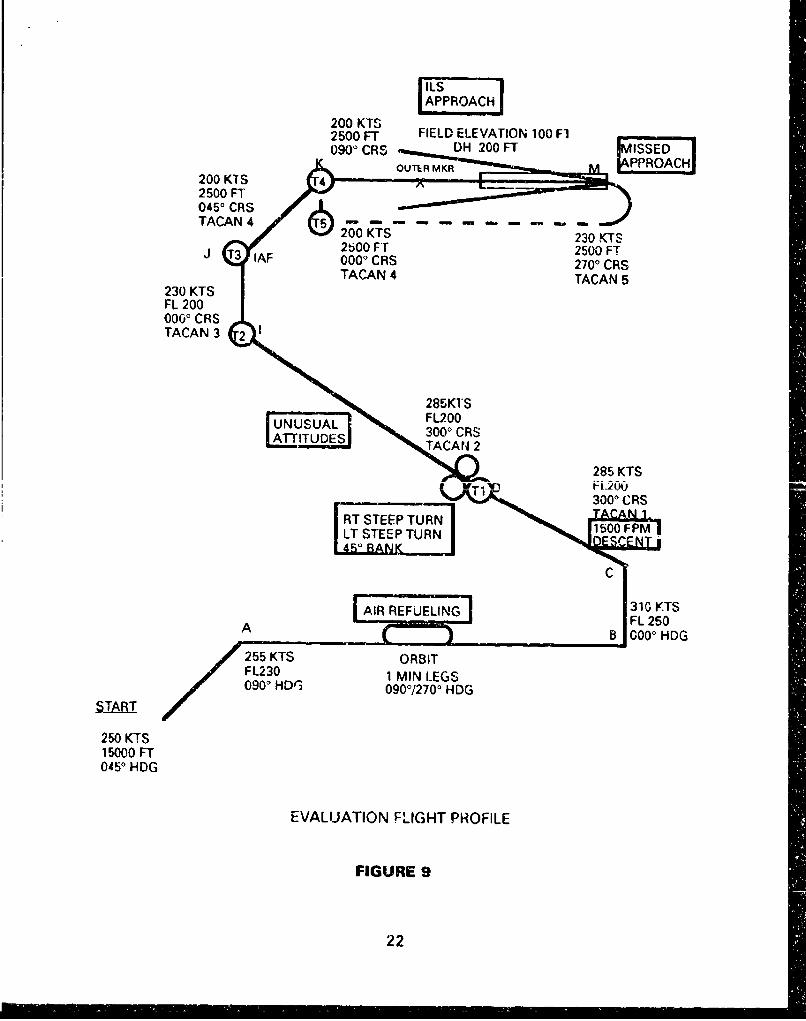
The subject's task was to fly a defined profile with each of the two primaryfhight displays. The profile, shown in Figure 9, consisted of three task
categories. Task 1 (Navigation and Control) contained straight navigation,turns at wavDoints. holding patteros. altitude cantures... Airsnppd rpntuires
constant descents, and steep turns. Task 2 (Unusual Altitude Recovery)consisted of recoveries to straight and level flight from both nose high andnose low attitudes. Task 3 (Precision Approaches) contained two instrumentlanding system (ILS) approaches; the first, a missed approach used one flightdirector steering symbol and the second approach used the other flight
director steering symbol.
Nominal times were established to fly from one point to the next taking
into account the time to make directed changes. The desired airspeed, altitude,and heading for each leg were shown in a 'data receive box" and the computer"beeped" prior to sending new commands. TIhe subject was required toprogram the command markers with the keypad.
21
APPRACH200 KIS2500 FT FIELD ELEVATION 100 Fl
S3IF09000 CRS H 0 2F0 CRISSTACAN4 TACAN5PROC
230 KTS4F2500Fl
03000 CRS
AI 0 EFUELING 330 KTS2600FT 500FLT 53 IAF0000 RS0000 HDG
250 KTS15000 FTS
EVALATIO 3LGH PRFL
2220

Performance Measures
A summary of the objective performance measures used for the flight
profile segments is presented in Table I.
Task 1 - Navigation and Control. Performance measures were used for
the constant rate descent and steep turns portions of this task. During the
constant rate descents, the measure was absolute average vertical velocity
deviation (calculated using absolute maximum and minimum deviations from
the 'nominal vertical velocity value). During the steep turns, the measures were
absolute average airspeed and altitude deviations (calculated using absolute
maximum and minimum deviations from the nominal airspeed and altitude
values). Also calculated for steep turns was the percent time within 10 knots
and 300 feet of the nominal airspeed and altitude values.
Task 2 - Unusual Attitude Recovery. the performance measure for this
task consisted of total recovery time and absolute altitude change (calculated
using absolute maximum and minimum altitude).
"Task 3 - Precision Approach. For the instrument approach and landing
task, the performance measures were separated into two parts: after localizer
capture but before glideslope capture; after both localizer and glideslope
capture. For the pre-glideslope part, the performance measures were
absolute average airspeed deviation (calculated using absolute maximum and
minimum airspeed deviation) and percent time within 1-dot localizer deviation.For the localizer and glideslope part, the performance measures were absolute
average airspeed, percent time within 1-dot localizer deviation, and percent
time within l-dot glideslope deviation.
Subjective Opinion Measures
The pilots were debriefed after the test session regarding what features
of each primary flight display format they liked best, and why. They were also
asked how they would combine the different features of both formats to create
their "ultimate" primary flight display.
23

TABLE I
Performance Measures Summary
Task 1 Variables Units De,, Qion
Precision DescentVertical Velocity Deviation feet/minute Absolute average vertical velocity
deviation from nominal (2000ft/min)
Level TurnsAltitude Deviation feet Absolute average altitude
deviation from nominal (20,000 ft)
Airspeed Deviation knots Absolute average airspeeddeviation from nominal (285)
Percent time within tolerance percernt Percent time within ±300 ft and±10 kts of nominal values
ask 2 Variables Units d p,
Total Recovery Time seconds Elapsed time from UA initiationuntil recovery criteria satisfied
Altitude change feet Absolute average altitudedifference between altitudem•x/min and recovery altitude
Task 3 Variables Unt Uesc.ripti _on
Localizer only
Airspeed Deviation knots Absolute average airspeeddeviation from nominal (200 kts)
Localizer Deviation percent Percent time within ±1 dot (1.25degrees) of nominal localizer
Loralizer and GlideslopeAirspeed Deviation knots Absolute average airspeed
deviation from nominal (200 kts)
Localizer Deviation percent Percent time within ±1 dot (1.25degrees) of nominal localizer
Glideslope Deviation percent Percent time within ±1 dot (.25degrees) of nominal glideslope
24

RESULTS
A summary of the performance data collected is in Table II.
Using these data, the formats were evaluated for various phases of the
mission using the Multivariate Analysis of Variance (MANOVA) StatisticalPackage for Social Sciences (SPSS). The various phases i,'cluded the unusual
attitude recoveries, steep turns, descents, and the instrument landing data.
None of the comparisons reached significance, however, trends indicate that
the MD-11 format produced quicker recoveries from unusual attitudes, while
the 8747-400 showed less altitude change from the initial altitude and the
maximum or minimum altitude during unusual attitude recoveries. Also, the
B747-400 showed less deviation from the desired rate for the descent legs of
the flight. For steep turns, the B747-400 showed a higher percent time within
the commanded 300 feet and 10 knots than the MD-11. The B747-400 also hadless deviations from airspeed and altitude than the MD-1 1. For the ILS data, the
B747-400 had less deviations from commanded airspeed during the ILS but
less percent time within one dot of the localizer than the MD-11 between
TACAN 4 and the outer marker. Along tne same lines, the B747-400 had less
deviations from commanded airspeed during the ILS, but had less percent time
within one dot of the localizer and glideslope than the MD-11 between the
outer marker and the decision point.
Subjective data taken from the pilots after the completion of the flying
part of the study reflect the same findings. Pilots preferred the overall ADIdisplay from the B747-400. Also, the vertical velocity indicator from the B747-
400 was liked better than that of the MD-11. There was no preference forcommand markers. Most pilots preferred the dots located on the heading
scale of the MD-11 that showed the pilot where the commanded heading was.The flight director most liked by the pilots was the pitch and bank steering bars,
although 3 out of 8 preferred the bat's wings.
25

TABLE 11
Performance Data Summary
Format 1 Format 2
Absolute average VV Dev (ft/mi.i,) 751.0 1275.6Absolute average Altitude Dev (it) 152.9 277.7Absolute average airspeed Dev (kts) 8.7 16.2Percent within nominal 59.0 50.0
Total recovery time (seconds) 23.9 23.8Absolute Average Change (feet) 2025.0 2261.0
Format 1 Format 2Single Dual Single Dual
AAASD (knots) 9.4 14.8 11 "2 1 .7Percent wI/, I dot localizer 84.0 90.0 95.0 98.0
AAASD (knots) 3.1 4.7 7.1 4.1Percent w/in 1 dot localizer 100.0 75.0 100.0 100.0Percent w/in 1 dot glidesiope 83.0 76.0 98.0 95.0
26

CONCLUSIONS AND RECOMMENDATIONS
The results of this study show that all of the alternative PFD formats were
adequate to satisfy the basic requirement of flight information for the flying
tasks represented. And further, that no one format was significantly better
overall. Also, the data show there are some performance differences, althoughnot significant, among the formats for specific parameters in specific flight
segments.
Regarding the transition of the T-line concept to multi-purpose displays,
this study has demonstrated that formats are feasible which retain this feature.Further, this information can be integrated into one 8"x8" display area.
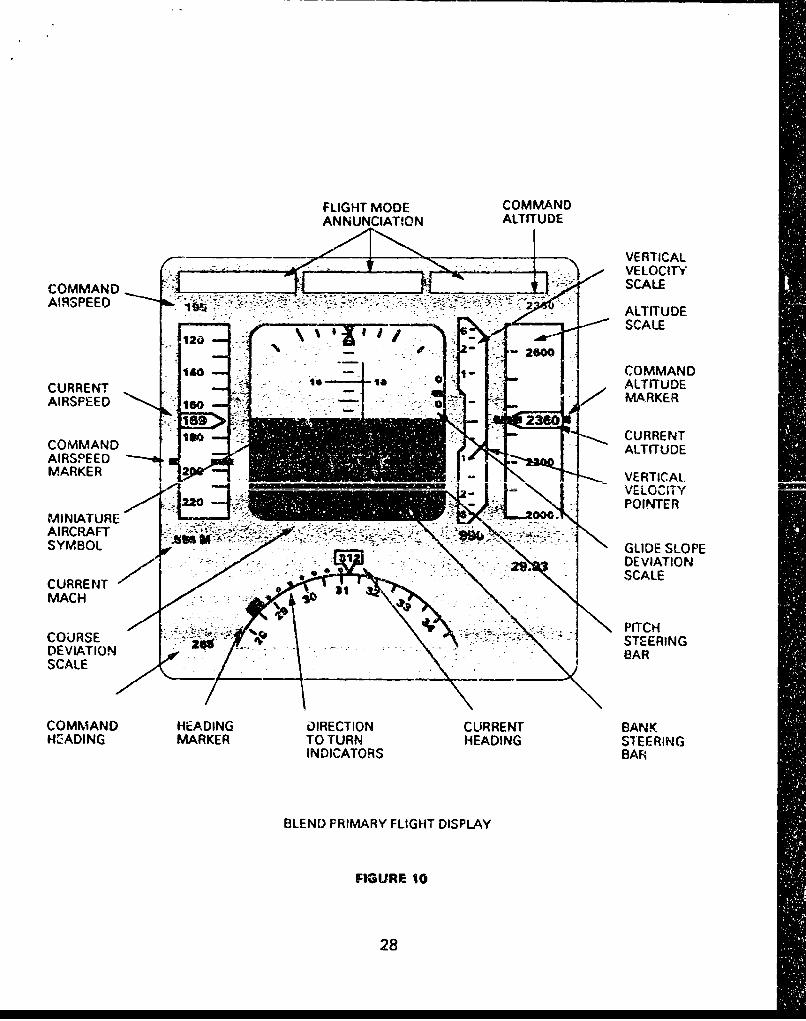
The resulting display format that is recommended as the baselineprimary flight display for the follow-on study is shown in Figure 10. The layout,
symbology and concepts are based on the subjective data and ideas obtained
from the eiqht pilots who participated in this study.
• , tiltude._ir.c.tor Indicator
xlthough unconventional by current USAF standards, the shape of the
ctangular, similar to that of the B747-400. It was chosen in order to
better wings level reference because the horizon line and the side of
display were perpendicular at zero bank angle. Wings level attitude
ermined without reference to the airplane symbol.
,d scale is on the left side of the display with the only change
of the smaller numbers on the top of the scale. This provides
U) .
scale with the addition of the "oirection to turn dots' was,e six of the eight subject pilots preferred this symbology.
27
FLIGHT MODE COMMAND
ANNUNCIATION ALTITUDE
VERTICAL
AIRSPEEDL ALITUDSCALE
COOMMAND
AIRSPEED MRE
169
COMMAN CURRENTAIRRSEED ALTITUDE
MARKERER
AIRCRAED A -0
CURREND SCALREN
ALITCDECOIRSPEEDSTERN
MARKARSCALECA
I4AIGMAKRT2URWEDN POITERiNINDICATORS 0AR
BLENDAF PRIAR FLGTDIPA
SYMBOLGUR GLDE0LP
289

A digital readout of the current heading was included even though verbal
comments of the subject pilots indicated that a lubber line to indicate the
current heading would work just as well, if not better.
Command Markers
There was no clear preference as to which type of command markers
were better to use. Verbal/written responses indicated that in keeping with the
shapes of command markers used with the integrated instrument systems, it
would be best to use the *bar' shaped markers. This allows the solid line
symbology used with the "T' scan concept.
Vertical Velocity Indicator
The format of the vertical velocity indicator is the same as that of the
B747-400, however, the location is changed from outboard to inboard of the
altitude scale.
Flight Director Symbology
The comm.,nation pitch and bank steering bars was the preferred
symbology for the flight director.
29

REFERENCES
1. Svirnonoff, C (1958); The Air Force Integrated Flight Instrument Panel;WADC TR 58-431; October 1958.
2. Mil-Std-1776; Aircrew Station and Passenger Accommodation; 30 Sep 1982
3. Air Force Manual 51-37; Instrument Flying; January 1966
4. 747-400 Flight Deck; Boeing Commercial Airplane Group; November 1989.
5. MD-11 Advanced Flight Deck and Aircraft Systems; McDonnell-Douglas;February 1989.
30