ad-a22 9724 3 jntationpa · field group sub-group in situ testing, cohesive soils, piezocone,...
TRANSCRIPT

U NCLAIT T'-
jNTATIONPA Form Approved
AD-A2 32 9724_ No._________lb. RESTRICTIVE MARKINGS
.6,iFCATON AU r L T 3 DISTRIBUTIONAVAILABILITY OF REPORT
2b. DECLASSIFICATION/DOWNGRAaffSC "Approved for Public Release;
U TO Distribution Unlimited
4. PERFORMING ORGANIZATION NUMBE. S. MONITORING ORGANIZATION REPORT NUMBER(S)U ~~~APOSR.TR. ] , 7
6a. NAME OF PERFORMING ORGANIZATION 6b. OFFICE SYMBOL 7a. NAME OF MONITORING ORGANIZATION
Massachusetts Institute of 1 (If applicable)Technology AFOSR/NA
6c. ADDRESS (City, State, and ZIP Code) 7b. ADDRESS (City, State, and ZIP Code)
77 Massachusetts Ave., Bldg. 410Cambridge, MA 02139 Bolling AFB, DC 20332-6448
Ba. NAME OF FUNDING/SPONSORING ISb. OFFICE SYMBOL 9 PROCUREMENT INSTRUMENT IDENTIFICATION NUMBERORGANIZATION (If applicable)AFOSR NA AFOSR-89-0060
Cc. ADDRESS (City, State, and ZIP Code) 10. SOURCE OF FUNDING NUMBERS
Bldg. 410 PROGRAM PROJECT TASK WORK UNIT
Bolling AFB, DC 20332-6448 ELEMENT NO. NO. NO CCESSON NO.6.1102F
2302 Cl
11. TITLE Onclude Security Classification) (U)
INTERPRETATION OF IN SITU TESTING OF COHESIVE SOILS USING RATIONAL METHODS
12. PERSONAL AUTHOR(S)
Whittle, A.J., Aubeny, C.P., Rafalovich, A., Ladd, C.C. & Baligh, M.M.
13a. TYPE OF REPORT 13b. TIME COVERED 114. DATE OF REPORT (Year, Month, Day) IS. PAGE COUNT
ANNUAL I FROfI15Oct'89TO15Oct'9_ 89-11-15 229
16. SUPPLEMENTARY NOTATION
1.COSATI CODES IS. SUBJECT TERMS (Continue on reverse if necessary and identify by block number)
FIELD GROUP SUB-GROUP IN SITU TESTING, COHESIVE SOILS, PIEZOCONE, DILATOMETER,
FIELD VANE, PRESSUREMETER, STRAIN PATH METHOD, SOIL ,O F, S
19 ASBRACT (Continue on reverse if necessary and identify by block number)
This research uses theoretical analyses to investigate the fundamentals controlling the performance ofcommon in-situ penetration tests (piezocone, pressuremeter, dilatometer, field vane etc.) which are used toestimate the engineering properties of cohesive soils. The mechanics of penetration processes are modeledusing the Strain Path Method together with generalized effective stress soil models. The analyticalpredictions provide a rational basis for establishing how soil properties are related to in situ measurements.Comparisons with field data from well documented sites are used to evaluate the analytical predictions andprovide a basis for more reliable interpretation of engineering properties. Research during the second yearof the project focused on the following topics: 1) the development of analytical methods to predict porepressures around three-dimensional penetrometers; 2) fundamental analytical studies of the mechanics offlat plate penetration; 3) application of analytical predictions for interpreting the undrained shear strengthand preconsolidation pressure from piezocone data; 4) evaluation of contact pressures measured by thedilatometer, and 5) prediction of the disturbance caused by field vane insertion.
20. DISTRIBUTION/AVAILABILITY OF ABSTRACT 21. ABSTRACT SECURITY CLASSIFICATION
[ UNCLASSIFIED/UNLIMITED 0 SAME AS RPT 0 DTIC USERS UNCLASSIFIED
22a. NAME OF RESPONSIBLE INDIVIDUAL 22b TELEPHONE (Include Area Code) 22c. OFFICE SYMBOL
Lt. Col. Steven C. Boyce (202) 767-6963 1 AFOSR/NA
DO Form 1473, JUN 86 Previous editions are obsolete. SECURITY CLASSIFICATION OF THIS PAGE
91 a 0 6 UNCLASSIFIED

Ii
ANNUAL TECHNICAL REPORT
I
IINTERPRETATION OF IN-SITU TESTING OF COHESIVE SOILS USING
RATIONAL METHODS
NTIS t., .ci
by
Andrew J. WhittleB y ... .... .. .. .......... ....... ............ ,
Charles P. Aubeny b.:D,i ~ ~~~~~~~Alexander Rafalovich A.:: ,. :: '.'.
Mohsen M. Baligh Dis-t i ..
I Constructed Facilities Division
Department of Civil Engineering
Massachusetts Institute of Technology
I submitted to:
ILt. Col. Steven C. Boyce
Program Manager, Civil Engineering
I Air Force Office of Scientific Research,
Boiling AFB, Washington D.C. 20322-6448
I November 1990
I

~ii
TABLE OF CONTENTS: Page
1. INTRODUCTION 1
2. PENETRATION PORE PRESSURES FROM STRAIN PATH METHOD 5
2.1 Introduction 5
2.2 Background 5
2.3 Equilibrium Correction 112.4 Proposed Poisson Formulation 12
2.5 The Modified Poisson Formulation 152.6 Formulation for Three Dimensional Geometries 17
2.6.1 Formulation in the y=O Plane 18
2.6.2 Formulation in z=const. Planes 20
2.7 Conclusions 22
3. THE MECHANICS OF PLATE PENETRATION 343.1 Introduction 34
3.2 Previous Studies using the Strain Path Method 343.3 The "Simple Plate" 37
3.3.1 Fundamental Solution for a Finite Line Source 38
3.2.2 Simple Plate Geometry 41
3.3.3 Shear Strains around Simple Plate 423.3.4 Deformation and Strain Paths during Plate Installation 43
3.4 Installation Effective Stresses and Pore Pressures 45
3.4.1 Effective Stresses 46
3.4.2 Excess Pore Pressures 47
3.4.3 Distributions along Blade 48
3.4.4 Effect of Soil Model on Predictions 49
3.5 Uncoupled Dissipation of Excess Pore Pressures 50
4. THE PIEZOCONE 86
4.1 Introduction 86
4.2 Background 87
4.2.1 Cone Design and Testing Procedures 87
4.2.2 Interpretation of Engineering Properties of Clays 91
4.2.2.1 Undrained Shear Strength 91

iii
4.2.2.2 Stress History 92
4.3 Analytical Predictions 95
4.3.1 Introduction 95
4.3.2 Effect of Tip Shape 964.3.3 Effect of Stress History 99
4.3.4 Effect of Soil Model 100
4.3.5 Summary 102
4.4 Interpretation of Engineering Properties from Predictions 103
4.4.1 Undrained Shear Strength 103
4.4.2 Stress History 105
4.5 Comparison with Measured Data 106
5. THE MARCHETI DILATOMETER 150
5.1 Introduction 150
5.2 Interpretation of Contact Pressure, po 151
5.3 Predictions of Disturbance due to Dilatometer Installation 153
5.3.1 The Dilatometer Geometry 153
5.3.2 Effective Stresses and Pore Pressures 154
5.3.3 Evaluation of Contact Pressure from Analytical Solutions 156
5.3.4 Analytical Predictions of Dilatometer Membrane Conditions 157
5.3.4.1 Correlation with Undrained Shear Strength, cuTc 159
5.3.4.2 Correlations with Stress History, OCR 160
5.3.5 Comparisons with Axisymmetric Penetrometers 161
5.4 Comparisons with Measured Data 162
6. FIELD VANE TEST 184
6.1 Introduction 184
6.2 The Standard Field Vane Test 184
6.2.1 Test Procedure 184
6.2.2 Test Interpretation 185
6.2.3 Effects of Vane Insertion 185
6.3 Prediction of Installation Disturbance Due to Field Vane Insertion 186
6.3.1 Strains and Deformations 186
6.3.2 Effective Stresses and Pore Pressures 187
6.4 Pore Pressure Dissipation 189
6.5 Discussion 190I1

I iv
I7. SUMMARY 203
&.REFERENCES 206
APPENDICES 218A. Isoparamnetric interpolation functions 218
B. "Pore pressure fields around piezocone penetrometers installed in clays" 222
by A.J. Whittle & C.P. Aubeny, submitted for publication IACMAG'9 1.

v
1LIST OF TABLES: PageI3.1 Analytic solutions for various penetrometer geometries in the Strain
Path Method 524.1 Input material properties used by the MCC model 1094.2 Input material properties used by the MIT-E3 model 1104.3 Comparison of tip resistance predictions using the Strain Path Method 1114.4 Predictions of piezocone measurements for Ko-consolidated BBC 1124.5 Dimensionless ratios for predicting undrained shear strength 1134.6 Dimensionless ratios for predicting preconsolidation pressure 114
5.1 Predictions at center of dilatometer membrane for Ko-consolidated
Boston Blue Clay 1665.2a Prediction of DMT membrane stresses normalized by cuTc for
Ko-consolidated BBC 1675.2b Prediction of DMT membrane stresses normalized by O'p for
Ko-consolidated BBC 1675.3 Predictions at center of membrane of full displacement pressuremeter
in BBC at z/R=20 1686.1 Pore pressure dissipation following vane installation; linear
uncoupled analysis 191
LIST OF FIGURES: Page
2.1 The Strain Path Method (Baligh, 1985a) 232.2 Strain paths during simple pile penetration (Baligh, 1985) 242.3 Excess pore pressures around cones predicted by different
equilibrium equations using MCC soil model for Ko-normally 25consolidated BBC
2.4 Relative contribution of vertical equilibrum equation during cone
penetration 262.5 Excess pore pressures around cones predicted by modified Poisson
solution using MCC soil model for K0-normally consolidated BBC 272.6 Definition of coordinate frame for plate penetration problems 28
2.7 Excess pore pressures at plate center by different equilibrium equations 292.8 Comparison of simple plate, B/w=6.8 and simple pile excess pore

vi
pressures 302.9 Pore pressures in horizontal plane far above tip for simple
plate, B/w=32.5 312.10 Dissipation of excess pore pressures for different initial conditions
at plate center 32
2.11 Comparison of excess pore pressures predicted in zlw=200 andin y/w=0 planes using proposed Poisson formulation 33
3.1 Examples of in-situ plate penetration devices 533.2 Other plate penetration devices used in geotechnical practice 543.3 Deformation fields for a) Spherical Cavity Expansion, and b)Simple
pile (Baligh; 1985) 55
3.4 Deformation paths for some axisymmetric penetrometers 563.5 Strain paths for axisymmetric penetrometers 57
a) Simple Pile; b) 600 Cone; c) 180 Cone
3.6 Coordinate system for the semi-infinite line source 603.7 Source strength used for simple plate geometry 613.8 Simple Plate with aspect ratio: a) B/w = 6.8; b) B/w = 20; c) B/w = 32.5 623.9 Octahedral shear strain around Simple Plates 653.10 Octahedral shear strain around Simple Plates using Req normalization 663.11 Deformation paths around Simple Plates 673.12 Deformation paths around Simple Plates using Req normalization 683.13 Strain paths of soil elements around Simple Plate in the y/w=) plane:
a) B/w=6.8; b) B/w=20; c) B/w=32.5 69
3.14 Example strain paths for soil elements around Simple Plate, B/w=6.8,with y0/w=6.8 72
3.15 Effect of aspect ratio on predictions of effective stresses and excess pore
pressures around Simple Plates for base case analysis: a) Lateraleffective stresses, (;'xx/'vo; b) ;'yy/d'i0; c) Shear stresses, a'xy/a',o 73
3.16 Effect of aspect ratio on predictions of maximum shear stress in thex-y plane around Simple Plates for base case analysis 76
3.17 Effect of aspect ratio on predictions of shear induced pore pressures inthe x-y plane around Simple Plates for base case analysis 77
3.18 Effect of aspect ratio on predictions of excess pore pressures, Au/odo,
for base case analysis 783.19 Effect of plate aspect ratio on the distribution of excess pore pressures,
normal effective and total stresses along plate blade 79

I iivii
3.20 Normalized excess pore pressures, normal effective and total stress
distributions along plate blade 803.21 Distribution of effective stresses for Ko-normally consolidated BBC
around a Simple Plate, B/w=6.8, using the MIT-E3 model 813.22 Distribution of shear stresses and excess pore pressures for Ko-normally
consolidated BBC around a Simple Plate, B/w=6.8, using the MIT-E3
model 823.23 Effect of plate aspect ratio on dissipation of excess pore pressures at
plate edge, base case analysis 833.24 Effect of plate aspect ratio on dissipation of excess pore pressures at
plate center, base case analysis 843.25 Effect of plate aspect ratio on normalized disssipation of excess pore
pressures at center of plate, base case analysis 854.1a Typical Electrical Cone (Schaap and Zuidberg, 1982) 115
4.1 b Pore pressure probes (Torstensson, 1975; Wissa et al., 1975) 1154.2 Examples of piezocones (Jamiolkowski et al., 1985) 1164.3 Pore pressure filter designs for piezocones 1174.4 Unequal surface areas of cones: a) Battaglio & Maniscaldo (1983);
b) Nyirenda & Sills (1989) 1184.5 Cone resistance factor, Nk: a) Baligh et al. (1980), b) Aas et al. (1986),
c) Aas et al. (1986) 1194.6 Pore pressure factor, N& (Robertson et al., 1986) 120
4.7 Relationships between tip resistance, qT and measured pore
pressures (Mayne et al., 1990) 121
4.8 Evaluation of Bq parameter with OCR: a) Jamiolkowski et al. (1985);b) Robertson et al. (1989) 122
4.9a Correlation between net tip resistance and OCR (Mayne, 1987) 1244.9b Correlation between piezocone pore pressures and OCR (Mayne, 1986) 1254.10a Conceptual distribution of pore pressure around piezocone
(Robertson et al., 1986) 1264.10b Correlation of pore pressure difference with OCR (Sully et al., 1988) 1264.1 la Correlation of pore pressure ratio with OCR: a) Robertson et al. (1989);
b) Mayne et al. (1990) 1274.12a Stress paths of idealized soil elements at cone tip
(Konrad and Law, 1987) 1284.12b OCR from vertical yield stress (Konrad and Law, 1987) 128

viii
I 4.13 Effect of tip shape on predictions of effective stresses and porepressures: a) 'f/o',O; b) o'/o',0; c) (o'rr- oY'00)/2a'vo; d) (u'uo)/O'vo 129I 4.14 Summary of effect of tip shape on distributions of excess pore pressures 133
4.15 Effect of overconsolidation ratio on predictions of effective stressesand pore pressures; a) a'f/o'dO ; b) a'/a'vo; c) (a'ff- a'0e)/2a'vo;d) (u-uo)/A'vo 134
4.16 Predictions of effective stresses and pore pressures using the MIT-E3
model: a) O'/',,O; b) a'/o'vo; c) (o'rr- O'oo)/2a'vO; d) (u-uo)/a',o 1384.17 Effect of soil model on distributions of excess pore pressures 1421 4.18 Definitions used to interpret predictions of piezocone pore pressures 1434.19a Index properties and stress history, Saugus test site (Morrison, 1984) 144
I 4.19b Index properties and stress history, South Boston test site (Ladd, 1990) 1454.20 Comparison of predictions and measured data for net tip resistance
in BBC 146
4.21 Comparison of predictions and measured data for excess pore pressuresin BBC 147
4.22 Comparison of predictions and measured data for the effective tipresistance in BBC 148
4.23 Comparison of predictions and measurements for the Bq ratio in BBC 1495.1 Geometry of the Marchetti dilatometer 1695.2 Empirical Correlations between overconsolidation ratio and
dilatometer contact pressure, p0: a) Marchetti (1980); b) Lacasse &Lunne (1982); c) Lunne et al. (1989); d) Powell & Uglow (1988);
I e) Mayne (1986) 1705.3 Geometry of Simple Plate used to Simulate Dilatometer Geometry 173
5.4 Comparison of Simple Pile Solution to 180 Cone Solution 1745.5 Simple Pile and Simple Plate effective stress and pore pressure solutions,
base case analysis: a) Lateral Effective Stress, O'xx/d'vO;b) Shear Induced Pore Pressures, Au,/',O; c) Cavity Shear Stress,
q,/a'vO; d) Excess Pore Pressures, (u-uo)/O'vo 1755.6 Stress and pore pressure distribtuion around dilatometer membrane 1795.7 Full displacement pressuremeters 1805.8 Comparison of predictions with CA/T data 1815.9 Correlation of dilatometer index KD with OCR for six well
documented sites 1825.10 Correlation of dilatometer index, KD with OCR, Summary 183

I ix
1 6.1 Typical Field Vane geometries 1926.2 Distribution of shear stresses along potential Field Vane failure surface 193
6.3a Cadling & Odenstad (1948) model of disturbance due to vane insertion 1946.3b Observation of disturbance due to vane insertion (LaRochelle et al., 1973) 194
6.3c Measured undrained shear strength as a function of Field Vane
aspect ratio (LaRochelle et al., 1973) 1946.4 Increase in undrained shear strength due to time delay after
vane insertion (Torstensson, 1977) 1956.5 Simulation of Field Vane geometry using Simple Plate solutions 196
6.6 Octahedral shear strains caused by Field Vane installation 1976.7 Vertical retardations of soil elements predicted around Field Vane 198
6.8 Effective stresses and excess pore pressures predicted around the
Field Vane for Ko-normally consolidated BBC, using the MCC model 199
6.9 Effective stresses and excess pore pressures predicted around the
Field Vane for Ko-normally consolidated BBC, using the MIT-E3 model 200
6.10 Excess pore pressure and radial effective stress acting on potentialfailure surface 201
6.11 Dissipation of excess pore pressures around the Field Vane, linear
uncoupled analysis 202

I
1. INTRODUCTION
The principal objective of this research is to provide a more fundamental understanding
of the results obtained by in-situ 'penetration' tests in cohesive soils. Devices of special
interest include flat blade penetrometers (such as the dilatometer), cone penetrometers (suchas the piezocone), pressuremeter and field vane tests. The data from these tests are
currently used to estimate essential engineering properties of clay soils including, a) the in-situ horizontal stress, b) undrained shear strength, c) preconsolidation pressure, d)permeability, and e) coefficient of consolidation.
Current interpretations of these tests rely largely, or solely, on empirical correlationswhich relate the in-situ measurements to some (known) property of the given soil. Such
approaches can be reasonably reliable if the measurement is indeed closely linked to theproperty of interest, or for those soil types which were used to establish the correlation.
More often, the correlation involves minimal measurement-property dependence, a poor
quality data base and/or extrapolation to quite different soil types.
1This research aims to develop more reliable methods for selecting and interpreting in-
situ tests based on a fundamental understanding of the factors which control test results.
'The work focuses on the following tasks:
1. Theoretical analyses to develop a predictive framework for interpreting the performance
of existing types of in-situ test (the piezocone, pressuremeter, dilatometer and field
vane). The analyses are based on two recent developments at MIT: i) the Strain Path
Method (Baligh, 1985; 1986a, b), an analytical tool for quantifying the disturbanceeffects in the soil due to penetrometer installation; and ii) the M1T-E3 model (Whittle,1987; 1989a, b), a generalized effective stress soil model for describing the behavior of
Ioverconsolidated clays and clays under cyclic loading.
2. Comparison of predicted versus measured field performance using data from well
documented field studies. This work will identify limitations in the analyses and in the
experimental data base.3. Improvements in the existing analytical techniques to include, i) the effects of partial
drainage on in-situ measurements, and b) the effects of strain rate on the stress-strain
behavior of cohesive soils.
1This report summarizes the principal research findings for the period November 1989
I1

1 2
j to November 1990:
3 Section 2 describes the development and evaluation of a new method for estimating
the pore pressures which develop around penetrometers during undrained penetration inlow permeability clays. In the Strain Path Method, pore pressures are obtained by
integrating the equations of static equilibrium using the predicted fields of effective
stresses. Due to the analytical approximations in the Strain Path Method, the equilibrium
conditions are not satisfied uniquely and the pore pressures are found to be integration pathdependent. In previous studies, pore pressures ahead of the penetrometer tip were3 estimated from conditions of vertical equilibrium only, while conditions around the shaft oflong axisymmetric penetrometers were found from radial equilibrium. However, this
preferential selection of integration path cannot be used reliably to establish the distribution
of pore pressures around a penetrometer. In this work, the equlibrium equations are
expressed in the form of a single Poisson type equation which is then solved numerically
by finite element methods. The Poisson formulation represents an essential tool a) forunifying the prediction of disturbance caused by penetrometers of different geometries
(piezocone, dilatometer, field vane etc.), and b) for estimating the distribution of pore
pressures around a penetrometer.
Section 3 presents a complete analysis of the stresses, strains and pore pressures
caused by penetration of flat plate penetrometers in clay. The main aim of this section is tocompare and contrast the effects of penetrometer geometry on the disturbance due to
undrained penetration. Strain path analyses are presented for 'simple plate' geometrieswhich are fully characterized by dimensions of length and width. Solutions are presentedfor simple plates with aspect ratios (length/width) similar to existing plate penetrometers
(dilatometer, earth pressure cells and the field vane). Generalized effective stress soilmodels (Modified Cam Clay and MIT-E3) are used to predict effective stresses around theplate penetrometers, while pore pressures are estimated from finite element solutions of the
the Poisson equation described in section 2. Further effects of penetrometer geometry are
clarified from the dissipation of excess pore pressures after installation.
The Piezocone is widely used in geotechnical practice for estimating site stratigraphy and
spatial variability based on simultaneous measurements of tip resistance and pore pressures

3
jobtained during steady penetration. Application of these data to interpret engineeringproperties of clays (undrained shear strength and preconsolidation pressure) has been based
I almost exclusively on empirical correlations. In previous research, Whittle et al. (1989)describe a centerline analysis, using the strain path method, which provides a rational basisfor estimating undrained shear strength from either the measured tip resistance or tip pore
pressure1. However, in practice, the design of the piezocone is not standardized and porepressures are often not measured at the tip of the cone. In section 4, more comprehensive
strain path analyses are used to predict distributions of stresses and pore pressures forpiezocone penetration in normally and lightly overconsolidated clays (OCR<4). Theanalyses are based on generalized effective stress soil models (MCC and MIT-E3) and usethe Poisson formulation developed in section 2. The analytical predictions provide arational basis: a) for establishing which soil properties (undrained shear strength,preconsolidation pressure) can be interpreted from piezocone measurements; b) forevaluating the relative merits of different locations for pore pressure filters; and c) forproviding an independent assessment of the centerline analysis proposed previously. Adetailed evaluation of the analytical predictions is achieved by direct comparison with fielddata obtained in Boston Blue Clay at two well documented sites.
1 The Marchetti Dilatometer has gained considerable popularity since it was first introducedinto the United States in the early 1980's. One of the major applications of the test is the
I empirical interpretation of undrained shear strength in clays using the 'contact pressure'measured by a circular steel diaphragm located on the flat face of the device. Section 5describes a comprehensive analysis of the contact pressure for dilatometer installation inclays. The analyses are based on the solutions described for the simple plate geometry insection 3 and include full descriptions of effective stresses and pore pressures acting on the
i dilatometer membrane. A systematic interpretation of the analytical results is used toevaluate whether the contact pressure can be reliably correlated with engineering properties(undrained shear strength, preconsolidation pressures and/or K0). The results also a)provide valuable insight into how the location of the dilatometer membrane influences themeasured data, and b) enable dilatometer measurements to be compared with lateral stressdata obtained around the shaft of axisymmetric penetrometers (measured by devices such as
1This work is described fully in the PhD Thesis of Elghaib (1989).
!

4
the full displacement pressuremeter test and the Piezo-Lateral Stress cell). The analyticalpredictions are evaluated by direct comparison with field data obtained in Boston Blue Clay(BBC). Field data from other well documented sites are used to confirm trends observed inthe predictions for BBC.
The field vane is the most widely used test for estimating the in-situ undrained shearstrength in clays. It has long been recognized that the insertion of the vane causesdisturbance of the soil and can affect the measured shear strength. Section 6 describes thefirst analytical predictions of disturbance (stresses and pore pressures) caused byinstallation of a standard field vane. The analyses are based on strain path solutions for the
simple plate geometries (section 3) and include a) detailed studies of the effective stressesand excess pore pressures around the vane prior to rotation, and b) calculations of partialdrainage of excess pore pressures due to time delays between vane insertion and rotation.
IF

5
2. PENETRATION PORE PRESSURES FROM STRAIN PATH METHOD
2.1 INTRODUCTION
The undrained penetration of intrusive test devices (e.g. piezocone, field vane,dilatometer etc.) in low permeability clay deposits leads to the development of excess porepressures in the soil. For normally and moderately overconsolidated clays, these pore
Ipressures are large and dominate other soil stresses and hence hold the key to theunderstanding of penetration mechanisms (Baligh, 1986b). Reliable analytical predictions ofpenetration pore pressures are essential if engineering properties of soils are to be interpretedrationally from in-situ measurements, both during penetration and in subsequent activitiessuch as dissipation and holding tests, membrane expansion, vane rotation etc.
Using the Strain Path Method (SPM), the effective (or deviatoric) stresses around apenetrometer are determined from the strain paths of soil elements using an appropriate soil
model. The pore pressures can then be estimated by integrating the equilibrium equationsfrom the known field of effective (or deviatoric) stresses. Due to the approximate nature ofthe strain and stress fields computed from the SPM, equilibrium will not be satisfieduniquely. This chapter discusses the implementation of a method which gives an 'averaged'Ipore pressure field obtained by solving the complete set of equilibrium equations in the formof a Poisson solution.
The method outlined in this chapter has two advantages: 1) it is rational and minimizes
the need for subjective judgement to estimate the distribution of pore pressures; and 2) it can
be used for penetrometers of general shape, and hence can be used to unify the interpretationof installation disturbance for different types of in-situ tests used in geotechnical practice,including axisymmetric and flat plate penetrometers.
2.2 BACKGROUND
Deep penetration problems are commonly modelled as the undrained expansion ofspherical or cylindrical cavities. For cylindrical cavity expansion (Soderberg, 1962;Ladanyi, 1963; Butterfield and Bannerjee, 1970; and Randolph et al., 1978), the soil is
I assumed to deform under plane strain and axisymmetric conditions, and displacements
occur only in the radial direction. In this case the strain components can be obtained solely
I

6
by the kinematics of deformation and are given by:
= +)]; £00=-S.T; ezz=er=0 (2.1)
1Stresses in the soil mass can then be estimated from the known strain field using anappropriate constitutive model.
Baligh (1975, 1984) suggests that the Cavity Expansion Method (CEM) is too simplisticto describe the two-dimensional nature of the problem. Baligh (1985, 1986a, b) alsoproposed the Strain Path Method (SPM), which provides a general analytical framework for
describing the mechanics of quasi-static, steady, undrained deep penetration in saturatedclay. The method assumes that, due to the severe kinematic constraints in deep penetrationproblems, deformations and strains are essentially independent of the shearing resistance ofthe soil, and can be estimated with reasonable accuracy based only on kinematicconsiderations and boundary conditions. By considering the two-dimensional deformations
of soil elements, SPM analyses provide a more realistic framework for describing themechanics of deep penetration problems than one-dimensional (cylindrical or spherical)cavity expansion methods, and can account properly for the effects of non-linear andinelastic soil behavior. On the other hand, the assumptions of strain-controlled behavior
I used in the Strain Path Method greatly simplify the problem of steady deep penetration andavoid the complexity of large scale numerical (finite element) analyses..
I The analysis of steady deep penetration problems using the Strain Path Method (Baligh,1985, 1986a, b) includes the following steps (Figure 2.1):Step 1. Soil deformations are considered in terms of the steady flow of soil around a static
penetrometer. Approximate velocity fields are estimated from potential theory (i.e.,treating the soil as an incompressible, inviscid and irrotational fluid) and aredifferentiated with respect to the spatial coordinates in order to obtain strain rates(eij). For the case of a penetrometer generated by a point source of incompressible
1 material in a uniform flow field (the simple pile), solutions can be obtained in closedform (Baligh, 1985; Teh & Houlsby, 1989). More complex geometries require1 numerical methods such as the method of sources and sinks (Weinstein, 1948;Rouse, 1959) or boundary element methods (Williamson, 1989).
SStep 2. Integration of the strain rates along the streamlines defines the strain paths (histories)for individual soil elements moving around the penetrometer. Baligh (1985) shows

7
that soil elements are subject to complex histories of straining involving reversals ofindividual strain components, as illustrated in Figure 2.2, which shows the strain
paths in the triaxial compression (E1), the pressuremeter (E2), and the simple shear(E3) shearing modes during simple penetration, where El, E2, and E3 are defined in
the figure.In this case both the E1 and E3 components experience reversals, while E2
increases monotonically. SPM predictions by Levadoux and Baligh (1980) showedthat during penetration of 180 and 600 cones reversal of the E2 component also
occur. It can also be seen from this figure that the absence of a particulardeformation mode at the end of penetration does not imply that the soil element didexperience that deformation mode during penetration.
Step 3. Stress fields around the penetrometer estimated from the strain paths using either a)an effective stress approach in which the effective stresses, a'ij, are determined
using a generalized effective stress soil model to characterize the constitutivebehavior of the soil; or b) a total stress approach in which the deviatoric stresses, sij,and the shear-induced pore pressures, Aug, are determined separately using two
constitutive models of soil behavior (Levadoux and Baligh, 1980; Baligh, 1985,1986a, b). The effective stress approach has the advantage that the same model can
be used to study the consolidation process after installation. Input parameters formodels (for both effective stress analysis and total stress analysis) include initial total
stresses and pore pressures in the ground (0i,-, uo), together with (model specific)
material properties. Baligh (1986a,b) shows that ahead of the penetrometer tip the
soil is loaded primarily in a triaxial compression mode with no strain reversals ;consequently, the predicted stress components, sij, are not sensitive to inelasticeffects. By contrast, soil elements located near the penetrometer boundary above thetip have experienced extensive reversals of individual strain components and are
therefore most sensitive to inelastic effects. Predictions in this region thereforerequire more realistic soil models incorporating the effects of anisotropy and strainsoftening. Previous studies (Baligh, 1986b; Whittle & Baligh, 1990) have shownthat realistic predictions of effective stresses acting at the indenter-soil interface canbe achieved using comprehensive soil models (Whittle, 1987, 1990) whichincorporate strain softening, small strain non-linearity and anisotropic properties ofclay.
Step 4. Baligh (1985) shows that, since the effects of gravity on stress changes in deep

8
foundation problems are negligible, the equilibrium equations in a cartesian framecan be expressed in terms of total stresses as:
C-'ij = 0 (2.2)axj
in which xi (=xI, x2, x3) are the coordinates of a material point and repeated indicesimply summation over 1, 2, and 3. By invoking the effective stress principle, aij =
a'ij + 8ij u, I he shows that
au - = gi (2.3)
Alternatively, from a known field of deviatoric stresses, the changes in mean totalstress, Ao, is determined from:
U j (2.4)
whereupon, the excess pore pressure can be computed from:
Au = Aa + Aus (2.5)
IFor axisymmetric problems, the equilibrium equations in terms of effective stresses canbe expressed in a cylindrical coordinate frame as:
Io u ao'Dr 'rz +o'r (2.6a)
" --. =" g =r+ + r
1 where 8 ij is the Kronecker defined by:
I
I

9
In principle, the pore pressures can be calculated by integrating in either the radial orvertical (z) direction (using the known distributions gr, gz, respectively). If the stress fields
are exact, the predicted pore pressure will be independent of the path of integration and the
stress gradients will satisfy the relation:
agz - a- (2.7)k or
This condition is only satisfied if the strain paths are compatible with the model used to
determine the stresses. However, from step 1, the strains are approximated using potentialflow theory and are not compatible with the soil model used in step 3.1 Figure 2.3 illustrates the potential differences in predictions of pore pressures that can
arise by satisfying equilibrium in different directions. The figure shows the distribution of
I excess pore pressures, (u-uo)/a'vO, at points along the surface of 18 and 600 cone
penetrometers and at vertical locations ahead of the penetrometer tip. The initial fields of
effective stresses were predicted using the Modified Cam Clay soil model (MCC; Roscoe &
Burland, 1968) with material properties selected to represent the behavior of Ko-normally
consolidated Boston Blue Clay (Whittle, 1987). This model has the advantage .that it is
formulated in terms of effective stresses; and it is isotropic and has a well defined criticalstate condition, so it can be readily interpreted. Unless otherwise stated, this case is used in
subsequent analyses illustrated in this chapter. The results show the following:1. At the tip of the penetrometers, the excess pore pressures from vertical equilibrium (Auz)
are approximately 50% higher than those from radial equilibrium (Aur). Ahead of the
tip, the distributions of excess pore pressures show similarly large variations due to
integration path. It should also be noted that the vertical equilibrium pore pressures at the
tip of the penetrometer are not affected significantly by the apex angle of the cone.
2. Differences between radial and vertical integration paths are especially significant as soil
elements move past the level of the base of the cone. Vertical equilibrium porepressures, Auz, decrease rapidly and become unbounded (i.e., continue to decrease with
distance along the penetrometer), while Aur reach a steady state solution at a distance,
z/R=10-20 above the tip of the cone.Non-uniqueness of pore pressure (or octahedral stress) fields was first observed by
Levadoux and Baligh (1980) by integrating the equilibrium equations along isochrones and

10
streamlines, where isochrones are lines describing the deformed geometry of originally
horizontal lines in the soil and streamlines correspond to orthogonal lines of the undeformedmesh of soil. Their results for isochronic and streamline integration showed differences
similar to those shown in figure 2.3 for vertical and radial integration. They attributed thedifferences, in large part, to unrealistic predictions in a,,, which contributes significantly to
equilibrium in the vertical direction. Subsequent fields of pore pressure reported byLevadoux and Baligh (1980) were based on isochronic integration only.
The nature of the uncertainty in rz predictions and its impact on vertical integration
solutions are illustrated by considering region far above the penetrometer tip, where Daci/z
=0. In this case Equation 2.6b reduces to
au acy'rz +c,,z g rZ (2.8)
For a steady condition (au/az --0), aO',z/cr must equal -a'rz/r ; however, SPM predictions
(Levadoux, 1980) of O'rz indicate both O'rz/or and a'rz/r to be positive near the
penetrometer boundary far above the tip. This implies that pore pressures will decrease
indefinitely in the vertical direction far above the penetrometer tip. This unreasonable result
shows that vertical integration solutions are unreliable above the cone tip.
To mitigate discrepancies between vertical and radial integration solutions, Chin (1986)integrated the equilibrium equations in a polar direction (the O-direction) in spherical
coordinates, using deviatoric stress fields based an elastic-perfectly-plastic soil model. Hisresults showed that for (z/R)>O polar integration provides a smooth and continuous
transition between the vertical and radial integration. But far above the tip, polar integration
did not match the steady-state radial integration solutions and should therefore be considered
unreliable.
Subsequent studies have shown that:
1. In the region ahead of the cone tip, since the soil is subject to triaxial compression modes
of shearing only, vertical equilibrium can reliably be used to estimate pore pressures at
the tip of a piezocone (Baligh, 1986b; and Elghaib, 1989).
2. Far behind the penetrometer tip, predictions of excess pore pressures can be obtained
from radial equilibrium. Predicted stresses in this region are very susceptible to inelastic
effects (Baligh 1986a) due to reversal of individual strain components. Consequently,
predicted pore pressures will be strongly influenced by complex aspects of soil behavior
U
I
1 11
including anisotropy, strain softening and rate dependence.
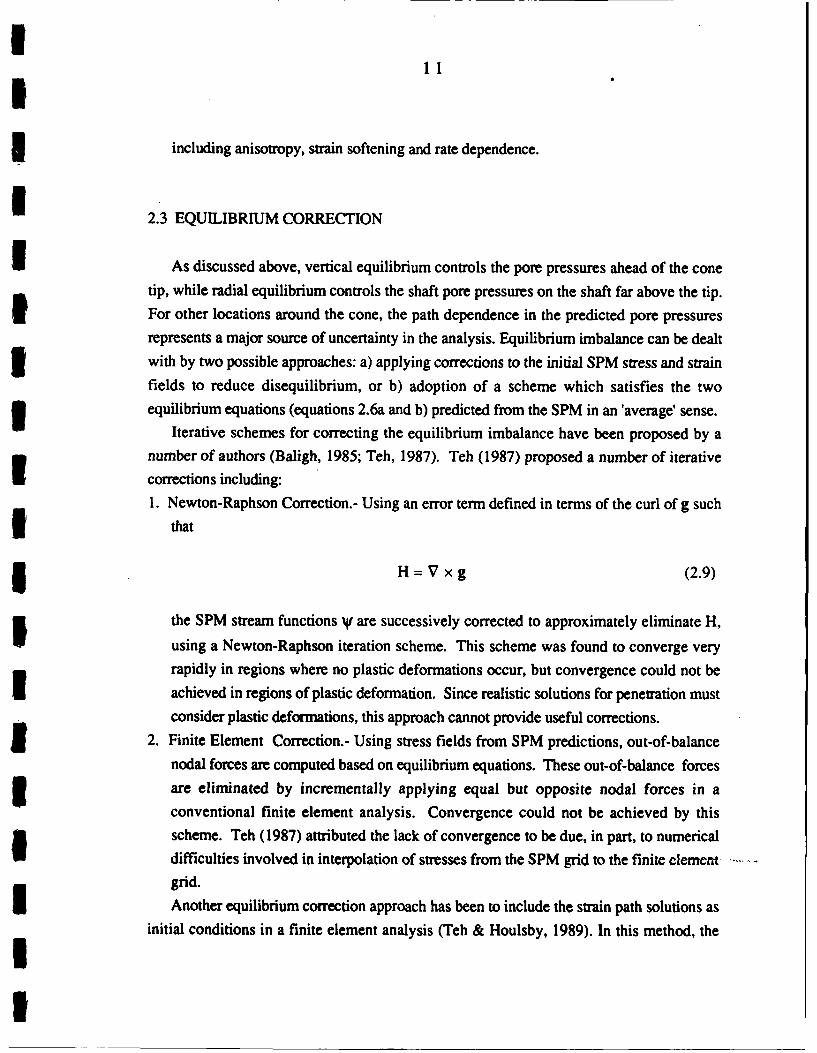
2.3 EQUILIBRIUM CORRECTION
As discussed above, vertical equilibrium controls the pore pressures ahead of the conetip, while radial equilibrium controls the shaft pore pressures on the shaft far above the tip.For other locations around the cone, the path dependence in the predicted pore pressuresrepresents a major source of uncertainty in the analysis. Equilibrium imbalance can be dealtwith by two possible approaches: a) applying corrections to the initial SPM stress and strainfields to reduce disequilibrium, or b) adoption of a scheme which satisfies the twoequilibrium equations (equations 2.6a and b) predicted from the SPM in an 'average' sense.
Iterative schemes for correcting the equilibrium imbalance have been proposed by anumber of authors (Baligh, 1985; Teh, 1987). Teh (1987) proposed a number of iterativecorrections including:1. Newton-Raphson Correction.- Using an error term defined in terms of the curl of g such
that
H = V x g (2.9)
the SPM stream functions V are successively corrected to approximately eliminate H,
using a Newton-Raphson iteration scheme. This scheme was found to converge veryrapidly in regions where no plastic deformations occur, but convergence could not beachieved in regions of plastic deformation. Since realistic solutions for penetration mustconsider plastic deformations, this approach cannot provide useful corrections.
2. Finite Element Correction.- Using stress fields from SPM predictions, out-of-balance
nodal forces are computed based on equilibrium equations. These out-of-balance forcesare eliminated by incrementally applying equal but opposite nodal forces in a
conventional finite element analysis. Convergence could not be achieved by thisscheme. Teh (1987) attributed the lack of convergence to be due, in part, to numerical
difficulties involved in interpolation of stresses from the SPM grid to the finite clementgrid.
- Another equilibrium correction approach has been to include the strain path solutions asinitial conditions in a finite element analysis (Teh & Houlsby, 1989). In this method, the
I
I

12
deviatoric stresses during an increment of penetration are computed based on a SPMsolution. The out-of-balance forces occurring during this penetration increment are thencomputed based on equilibrium considerations. While holding the cone fixed, the initialSPM displacements are modified by incrementally applying nodal forces equal and oppositeto the out-of-balance forces. This process is then repeated for the next increment of conepenetration. Some disadvantages to this approach include:1. The large strains involved in this analysis require a large strain formulation, which
increases the complexity of the analysis.2. Computation of the out-of-balance forces requires an arbitrary selection regarding which
equilibrium equation is correct (radial or vertical). In situations where vertical and radialequilibrium solutions differ significantly from one another, such an arbitrary selectioncan conceivably have a significant effect on the final result. The arbitrary selection ofone equilibrium equation to be correct is particularly unattractive when the SPM isextended to penetrometers of general geometry (plates, vanes,etc.), as a different set ofassumptions will be required for each different geometry that is analyzed.
2.4 PROPOSED POISSON FORMULATION
An alternative approach (Baligh, 1985), which can ameliorate the difficulties associatedwith path dependent pore pressures, is to solve both equlibrium equations by taking the
divergence of eqn. 2.3:
V2u =-V.g =-q (2.10)
In this case the scalar pore pressure field is determined as the solution of a Poissonequation using standard finite element techniques. In general, Poisson pore pressure fieldswill not satisfy either equilibrium equation exactly. However, the Poisson solution does notrely upon an arbitrary selection of an integration path; it therefore provides a flexiblemethod for extending SPM solutions to penetrometers of general shape.
The Poisson solution was first implemented by Chin and Whittle (1984) for simple pilepenetration in a bilinear soil model. They reported results which were in reasonableagreement with radial integration solutions, except near at the tip and face of the pile. The

13
inaccuracies near the tip were probably due to a) innacuracies of the numerical differentiationin regions of high stress gradients, and b) an improperly formulated boundary condition atthe indenter interface. Teh (1987) subsequently implemented a Poisson solution (also using
a bilinear model) with a properly formulated boundary condition; however, his predicted
distribution of mean stress ahead of the tip was much too low, being much less than his
predicted mean stress distributions obtained by radial and vertical integration.
In principle, the flux term, q, is calculated by numerical differentiation (first and second
derivatives) of the stress components from the strain path method. However, accurate
numerical evaluation of second derivatives is very difficult to achieve, especially in regions
of high stress gradients. Considerable simplifications in computing can be achieved using
the divergence theorem to estimate an average flux within a given finite element:
fI jdV =jfA n dS (2.11)
n
4V= (g'n ) AS1 (2.12)i= 1
where; = average q within elementV = volume of element
g = pore pressure gradient vector on side i
of the n-sided element
n = unit vector normal to side i of the elementSi = Surface area of side i of the element
The numerical procedure for evaluating derivatives of stress components (g) is based on
the construction of nine node isoparametric elements (Bathe, 1982),where three closely
spaced streamlines are used to define a nine-node element around the point of interest. Anisoparametric differentiation scheme permits data points from the streamlines (see Section
2.2, steps 2 and 3) to be used directly without intermediate interpolation onto a finite
difference grid. A natural coordinate system (s,t) is introduced to enable standard
isoparametric interpolation of the stress derivatives at the point (Bathe, 1982):

I14I
as -- ~-' =a ij (2.13)
where h, are the interpolation functions shown in Appendix A, and a'ijn are the effective
stresses computed at the nodal points. The derivatives in the (r,z) coordinate frame are
obtained through a Jacobian transformation:
az aaz (2.14)
I Boundary conditions for the Poisson equation (locations A,B,C,D are shownschematically in fig. 2.3) include: 1) au/ar=0, due to symmetry, along the centreline (OD);3 2) u--0, along BCD (assuming soil behavior is linear far from the penetrometer); and 3)
au/az=O, to satisfy steady state conditions along AB. The most difficult boundary conditionIf is that at the penetrometer boundary (OA), as it has no simple physical interpretation and
there is no reason to assume that no pore pressure gradients normal to this boundary
(au/an*O). This boundary is treated in an approximate manner by computing the gradientsadjacent to the indenter interface (gr and gz) and imposing the condition:
gn = grnr + gznz (2.15)
Poisson solutions for normalized excess pore pressure, (u-uo)/a',O, during 180 and 600
cone penetration in the Ko-normally consolidated BBC described in section 2.2.1 are shown
-- in figure 2.3. These solutions show:1. At the base of the cones the normalized excess pore pressures predicted from the Poisson
solutions are 10 to 20% greater than those predicted from radial integration. As a steadyIstate is approached, the Poisson solutions match the radial integration solutions.2. The excess pore pressures at the tip of the 600 cone predicted from the Poisson solutionIis approximately 25% less than that predicted by the vertical integration solution. On the
centerline ahead of the cone tip the differences between the Poisson solution and the
vertical integration solution become more significant.
3. For the 180 cone, there are large differences between the Poisson pore pressures andvertical integration solutions both at the tip of the penetrometer and in the soil ahead of
the tip.
II

15
These observations suggest the following conclusions:1. Far above the cone tip, the Poisson solutions match the radial integration solutions.
Since radial integration solutions are considered to be very reliable in this region, thePoisson solutions can accordingly be considered to be reliable in this area.
2. On the cone face and on the centerline ahead of the cone tip, the Poisson solutions differsubstantially from the vertical integration solutions. The differences between thePoisson solutions and the vertical intregration solutions increase with decreasing coneangle. The discrepancies between Poisson and vertical integration solutions ahead of thetip are serious for two reasons: a) the vertical equilibrium equation is considered to bereliable ahead of the tip, and b) the Poisson solutions imply that tip angle has a majorinfluence on magnitudes of tip pore pressures, which is contrary to measured data(Levadoux and Baligh, 1980). Accordingly, the excess pore pressures on the cone faceand ahead of the cone tip predicted from the Poisson solution cannot be consideredreliable, particularly for sharp cone angles.
2.5 THE MODIFIED POISSON FORMULATION
Since the vertical equilibrium equation is considered to be more reliable ahead of thecone tip, the Poisson solutions described in the previous section can be improved byconsidering only the vertical equilibrium equation in the region ahead of the tip. If the porepressure field uz is computed based on vertical integration using Equation 2.6b, the fluxterm q based solely on vertical equilibrium can then be determined by computing theLaplacian of uz
q = V2uz (2.16)
For implementation in a finite element solution, the equivalent nodal loads corresponding toEquation 2.16 are required. These can be computed by a simple matrix multiplication
( qe )=[K] ( uz ) (2.17)
where [K] is the system conductivity matrix which is used in the solution of the Poisson
equation.

16
To implement the modified Poisson solution, a rational means is required for identifyingthe extent of the zone ahead of the tip which is dominated by vertical equilibrium equation.To assess the contribution of the radial and vertical equilibrium equations to the total value
of q defined in equation 2.10, the following scalar terms were defined
Radial Equilibrium Contribution: qr = Er g (2.18a)r Rair
Vertical Equilibrium Contribution: qZ = azz (2.18b)Vrc
where q=qr+qz. A simple measure of the relative contribution of the vertical equilibriumequation can be defined as:
Rz = qz/(I qz . qr[) (2.19)
When vertical equilibrium dominates Rz will be unity, and when radial equilibriumpredominates, Rz will be zero. Contours of Rz for 180 and 600 cone penetration are shownin Figure 2.4. These results indicate three regions:1. Below line OA the vertical equilibrium is dominant (Rz=l); except near the tip (z/R<3).2. Above line OB radial equilibrium the radial equilibrium is dominant (RzO).3. The area between OA and OB is a transition region where both equilibrium equations
influence the solution (0<Rz<l).In order to eliminate the influence of the unreliable radial equilibrium equation near the
face and tip of the cone, the following modified Poisson procedure was adopted:1. Subdivide the problem into two regions, which are separated by a line OA.2. In the upper region compute q based on both equilibrium equations using Equation 2.10.3. In the lower region compute q based solely on the vertical equilibrium equation using
Equation 2.16.
Modified Poisson solutions for 180 and 600 cone penetration in Ko-normallyconsolidated BBC based on effective stress fields from the MCC soil model are shown inFigure 2.5. Comparison to the integration solutions described in Section 2.2 and themodified Poisson solution described in Section 2.5 indicates:1. For both cone angles, the normalized excess pore pressure near the cone tip predicted
from the modified Poisson solution matches the vertical integration solution to within
I

17
5%. On the centerline ahead of the cone tip the modified Poisson solution agrees verywell with the vertical integration solution.
2. On the shaft above the base of the cone the modified Poisson solutions are quite similar
to the Poisson solutions, with the normalized excess pore pressures predicted from themodified Poisson solutions being a maximum of 15% greater than those predicted from
the Poisson solutions. Far above the cone tip (z/R>15-20), the modified Poissonsolutions closely match the radial integration solutions.The modified Poisson solutions therefore agrees with integration solutions in two
important areas:1. Ahead of the the cone tip they agree with solutions based on the vertical equilibrium
equation, which have proved reliable in past studies (Elghaib, 1989).2. Far above the cone tip they agree with radial integration solutions, which are most
reliable in the steady state region far above the cone tip.
2.6 FORMULATION FOR THREE-DIMENSIONAL GEOMETRIES
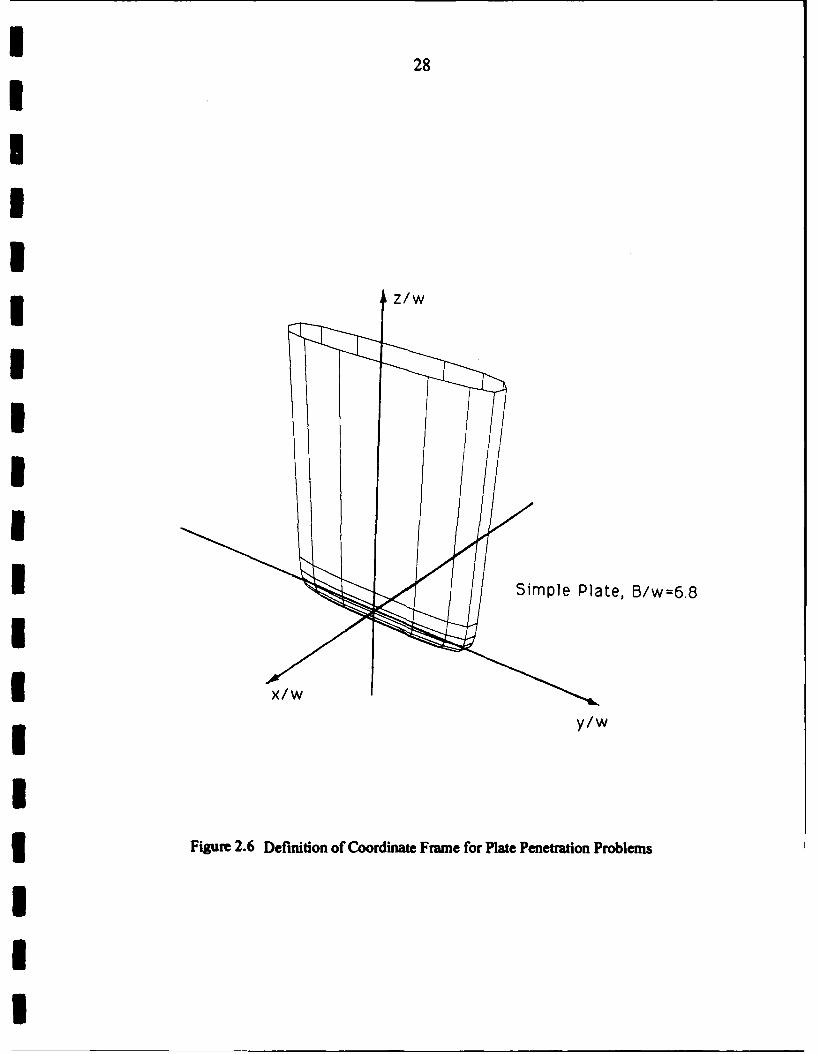
Plate penetration problems can be described in a three-dimensional cartesian frame as
shown in Figure 2.6, where the z-direction is vertical, the y-direction is parallel to the major(wide) axis of the plate, and the x-direction is parallel to the minor (thin) axis of the plate.
Strain and stress field predictions during plate penetration are discussed in detail in Sections
3.3 and 3.4 respectively. In a three-dimensional cartesian frame the equilibrium equations
Iu a 'XX a 0'xy a 'Xz"- -gx - + jY + "- (2.20a)
axax + +az
a gY =c +_ + ayz (2.20b)ay Y ax ay az
au aa', __'yz __'zz
- =-gz = x+--y +- (2.20c)
In principle, Equations 2.20 can be substituted into Equation 2.12, and pore pressures
can be determined as the solution of a Poisson equation in three dimensions; however, thecomplexity and cost of three-dimensional finite element analyses can be avoided by using
Im

18
simplified two-dimensional analyses in two orthogonal planes; namely: a) the y=0 plane,and b) z=constant planes. The y--O plane corresponds to a vertical plane on the centerline ofa blade penetrometer. Physical measurements are often made in this plane during platepenetration; for example, the center of the membrane of the dilatometer and the porepressure filter in the piezoblade are located in this plane. Predictions in this plane are
accordingly quite important for validation of predictions and for assessing the verticalvariation in pore pressures and total stresses along the dilatometer membrane duringpenetration. Predictions in z=constant (horizontal) planes are important for predicting thehorizontal variation in pore pressures and total stresses along the blade; for example, inassessing the horizontal variation in total horizontal stress along the membrane of a
dilatometer.
2.6.1 Formulation in the y=0 Plane
In the y--O plane, the two relevant equilibrium equations become equations 2.20a and c.
i Derivatives of stress components in the x and z directions can be computed numericallyusing Equations 2.13 and 2.14. The y--O plane is a plane of anti-symmetry with respect tothe crxy and Oyz stress components, therefore, the partial derivatives with respect to these
stress components cannot be assumed to be zero and must be evaluated numerically. Partialderivatives of these stress components with respect to y at a point (x*, z*) can be evaluatedby the following steps:1. Compute the stresses along three streamlines whose initial positions far ahead of the tip
I are offset a distance Ay from the y=0 plane. Ay is selected to be equal to the initial
streamline spacing within the y=0 plane. This is typically Ay/w=Ax/w =0.1, where
w=plate half-thickness.2. Evaluate the stress components (oij)y--.y at x*, z* by interpolation.3. Evaluate the partial derivative by a first order finite difference approximation
_____ (O'ij)YAy - (a'ij)y=O (2.21)ay Ay
With g, and g, thus evaluated, excess pore pressures in the y=0 plane can be predictedby direct integration of the equilibrium equations as discusssed in section 2.2 or by the!
!

I19!
Imodified Poisson solution discussed in section 2.5. Figure 2.7 illustrates the potentialdifferences in predictions of pore pressures that can arise amongst these three solutions. Thefigure shows the distribution of excess pore pressures, (u-u0)/O'v0, at points along the
surface and at vertical locations ahead of the tip of a simple plate penetrometer having anaspect ratio B/w=6.8; where B is the half-length and w is the half-thickness of the plate.The simple plate is the penetrometer geometry defined by a line source of incompressiblematerial of length 2B in a uniform flow field. The geometry of the simple plate is describedIin detail in section 4.2. This aspect ratio corresponds to the aspect ratio of the Marchettidilatometer described in Chapter 5. The results show the following:1. At the tip of the plate, excess pore pressures predicted from the modified Poisson
solution match the vertical solution to within 10%. On the centerline ahead of the tip themodified Poisson solution closely matches the vertical integration solution. Thehorizontal integration solution underpredicts the vertical integration solution byapproximately 20% at the plate tip. The horizontal integration solution substantiallyunderpredicts the vertical integration and modified Poisson solutions on the centerlineahead of the plate tip.
2. Far above the plate tip the Poisson solution matches the horizontal integration solution.The two solutions begin to converge at approximately z/w=40-50.
3. Above the plate tip, vertical equilibrium pressures, Auz, decrease rapidly and become
unbounded (i.e. continue to decrease with distance along the penetrometer), whilehorizontal equilibrium pressures reach a steady state solution at z/w=40-50.
These observed trends are qualitatively quite similar to the trends observed foraxisymmetric penetrometers which were discussed in sections 2.2 and 2.5. A major
difference is the distance above the tip at which a steady condition is achieved. This is dueto the fact that the plate in this example displaces a larger volume of soil than theIaxisymmetric penetrometers discussed in sections 2.2 through 2.5; that is, the plate has across-sectional area far above the tip equal to 4Bw, while the cone penetrometers have across-sectional area equal to xR2. This difference can be accounted for by normalizing theplate coordinates by an equivalent radius, Rq, which is defined as
RIfa (2.22)Figure 2.8 shows predictions of excess pore pressure around a plate after normalizing
the plate coordinates by Rq. Figure 2.8a shows the predicted distribution in the y=O plane
I

20
on the plate boundary and on the centerline ahead of the plate tip, and figure 2.8b shows thepredicted lateral distribution of excess pore pressures far above the plate tip. Comparing theplate predictions to the predicted distribution of pore pressures during simple pile (B/w=0)
penetration indicates:I . The normalized distance above the penetrometer tip at which a steady state pore pressure
distribution is reached is l0-20z/Rq for both the simple pile and the simple plate.2. The predicted pore pressures at the penetrometer tips for the two penetrometer shapes
match to within 15%. The predicted pore pressure distributions ahead of the tip pore arealso quite similar to one another.
I 3. The lateral distribution of pore pressure far above the penetrometer tip for the simpleplate and simple pile match quite closely, with the predicted pore pressures at thepenetrometer boundaries agreeing to within 3%.These observations imply:
1. Penetrometer geometry (aspect ratio) has a relatively small influence on magnitudes of tipand shaft pore pressures.
2. The extent of the zone of disturbance is strongly influenced by the volume of soil
displaced during penetration. Penetrometer geometry does not significantly alter theextent of the zone of disturbance.
2.6.2 Formulation in z=constant Planes
In a horizontal plane the relevant equilibrium equations are equations 2.20a and b. For
the special case of a plane located far above the plate tip these equations reduce to
au g aaXX + aoyxy (2.23a)ax a-- x a
au _ y'xy + a yy (2.23b)a - -y - - -x ay
The derivatives of the stress components in Equations 2.23 were evaluated using a 4-nodeisoparametric interpolation scheme (Bathe, 1982), where four closely spaced streamlines areused to define an element around the point of interest. A description of numerical
differentiation using isoparametric functions is contained in section 2.4, and a listing ofisoparametric functions and their derivatives for four-node elements is contained in

21
Appendix A.Equations 2.23 can be substituted into Equation 2.12, and pore pressures can be
determined as a solution of a Poisson equation in the x-y plane. Pore pressure contoursduring installation of a B/w=32.5 plate as computed by integration solutions and thePoisson equation are shown in Figure 2.9. This figure indicates significant (on the order of
25%) differences between the two integration solutions. It further shows that the Poissonsolution generally provides an 'average' between the two integration solutions in the vicinityof the penetrometer; although, in the far field in the x-direction, the Poisson solutionpredicts a greater zone of disturbance than either the x- or y-integration solutions. Table 2.1compares Poisson pore pressure predictions to integration solutions far above the plate tip(large z/w) at the plate center and at the edge of penetrometers having an aspect ratiosB/w=6.8, 20, and 32.5. This table indicates that at the plate center the pore pressurepredicted from the Poisson solution is intermediate between the two integration solutions.The predicted pore pressures at the edge of the plate also lie between the two integration
solutions at the higher aspect ratios of 20 and 32.5. For B/w=6.8 the Poisson prediction isslightly lower (approximately 5-10%) than both integration solutions. In general, thePoisson solution appears to provide a reasonable 'average' of the two integration solutionsat the penetrometer boundary for a wide range of aspect ratios.
Uncoupled dissipation (see Chapter 3.5) solutions at the plate center is shown in Figure2.10. It can be seen that the dissipation solutions based on the pore pressure distributionpredicted from the Poisson equation gives a reasonable average in all cases. The practical
implication of this result is that, although the Poisson installation pore pressures are not an'average' of the two integration solutions at all points within the field (note the reference
above to the zone of disturbance in the x-direction), the dissipation curves for Poisson porepressures at the plate center nevertheless lie intermediate between the dissipation curves forthe two integration solutions.
The Modified Poisson solutions presented in Section 2.6.1 were based on equilibrium in
the x-z plane, while the Poisson solutions presented in this section are based on equilibriumin the x-y plane. To assess the consequences of the simplification of the analyses from athree-dimensional problem to a 2-dimensional problem within a particular plane of interest,these two solutions are compared to one another in Figure 2.11, which shows the predicteddistributions of pore pressure along the x-axis (on the plate centerline) far above the tip of a
simple plate having an aspect ratio B/w=6.8. This figure indicates that the pore pressuredistributions along the x-axis are in good agreement, with the predicted excess pore

22
pressures at the plate boundary agreeing to within 10%.
2.7 CONCLUSIONS
1. The Poisson solution provides a reliable means for predicting pore pressure distributionwithout requiring arbitrary assumptions regarding the path of integration. This makesthe method particularly suitable for application to more complex penetrometer geometriessuch as the field vane, the dilatometer, spade cells, etc.
2. The Poisson solution was evaluated by comparing it to: a) the radial integration solution
far above the tip, where radial integration provides the most reliable solution, and b) thevertical integration solution ahead of the tip, where vertical integration provides the most
reliable solution. It was found that: a) far above the tip, the Poisson solution matchesthe reliable radial integration solution, and b) ahead of the tip, the Poisson solutionseriously underpredicts the vertical integration solution.
3. The Modified Poisson solution, which a) considers only vertical equilibrium ahead of thetip (below line OA in Figure 2.4) and b) considers both equilibrium equations above lineOA , provides excellent agreement with vertical integration solutions. Line OA in Figure2.4 was established by assessing the relative contribution of the gradient terms gr and gzto the flux term q in the Poisson equation.
4. The modified Poisson formulation enforces the more reliable vertical equilibrium
I equation ahead of the tip; therefore, in this study, it will be used to make predictions forthe following types of penetration problems in which vertical equilibrium is important:1) piezocone penetration, 2) the push-in pressuremeter test (based on open-ended pile
solutions), and 3) the Marchetti dilatometer test (based on plate solutions in a verticalplane). Analysis of pore pressure distribution in horizontal planes far above thepenetrometer tip do not involve the vertical equilibrium equation; therefore, the originallyproposed Poisson formulation described in Section 2.4 should be implemented for such
I cases. In this study, such cases will include predictions of pore pressure distribution inhorizontal planes around: 1) single plates, and 2) the field vane (i.e. superpostion of twoplates rotated at 900).

23
INITIAL SOILSTRESSES. 2- VELOCITIES.
0 Vioi. o
4-STRAINRATES
3- DEFORMATIONS
STRAIN PATH5- Ci ALONG
STREAMLINES
I iE 6.A EFFECTIVE STRESS APPROACH 6.8 TOTAL STRESS APPROACH
MODEL: EFFECTIVE IMODEL: DEVIATORIC MODEL: SHEAR INDUCEDI ESS vs. STRAIN STRESS vs. STRAINS PORE PRESSURES vs.
STRAINS
DEVIATORIC SHEAR INDUCEDSTRESSES PORE PRESSURES
Si' USII - - I
em EFFECTIVESTRESSES,
EQUILIBRIUM
7- POREPRESSURES.
U
8- TOTAL
STRESSES.
I Fig. 2.1 The Strain Path Method (Baligh, 1985)

1 24CYLINDRICAL EXPANSION STRAIN, E2 %
0 20 40 60 80 1OO 120 140 160I i Range of Trioxial -9
* A Extension Test
F Range of TriaxiolICompression Test
z -6
1 5-J 60 4
Soil Element G 2100-
120 ~rj-0
, -Range of Pressuremeter Test 0~-I0ARange of Laboratory -
Direct S imple Shear Test F20A
-4I
Deviotoric Strains H orizontal Soil VerticalLo Location Symbol
/R z/R
0.5~ 1/2
CL 1/2 (tipl 0
I SoilElement G-
I1801 1-.0 20 40 60 80 100 120 140 160
I Figure 2.2 Strain Paths During Simple Pile Penetration (Baligh, 1985)

25
3 z/RCo L 0 LO a LO) 0
0' IMc) Cc CV)
3> Q Ccmi-o~- 0ic-
0 20 .
00
00
I 0-C. CV)'mO 5-. C1bo
0 0 0 in Uc~ 1*. w
I ~H/z

26
10 0n Ct 0 ItO 0
C*4Jaa
00)
* 04
* f OL 0
C~t* .~J. U

27
I z/Ro oO 0 L 0 to 0
C~C
cu.u
00
0 .
>U
C.40CI:
IU 0
tt
I 4I
U 00 0 0CJ 1 ~ w
U /z. - C)oICI
Uq
28
I/
SipePaeI/ =.
I/I/
Fiue26DfntoIfCodnt FaefrPaePntainPolm

29
20 1 1
15 Vertical
10 Integration
1--Modified5 ,,Poisson
* 0
-5 - HorizontalIntegration
-10 1 1
0 1 2 3 4(U-Uo) /'v0
-- Figure 2.7 Excess Pore Pressures at Plate Center by Different Equilibrium Equations
I

30
* 1.4
1.2 MC B3Simple Plate CI1 B/w=6.8
b0.B8
' 0.6 -SimplePile
10.40.2 _
010 100
r/R and x/R e
b) Lateral Distribution far above Tip1201115 MOO, 880
10 OOR=1
cc9 5
-5 Simple Plate
U-101110 1 2 3 43(u-u 0) /aY V0
a) Along Centerline and Plate Boundary
Figure 2.8 Comparison of Simple Plate, B/w-6.8, and Simple Pile Excess Pore Pressures

3160 1
8/w.32.550 x-lntegration
Contours ofI40 (u-u0) /'vO0
30300.1
2 0 .230. 0 610 .8
3 00 10 20 30 40 50 60
xlwa) x-Direction integration
60 1 1
B/w.32.550 -y-integrationI Contours of
40 (u-u0) /oYVO
30
20 4 - .2
I10 1 .
00 10 20 30 40 50 60
b) y-Direction Integration60 1 1
B/w-32. 550 -Poisson Solution
Contours of40 (u-u0 ) /dO' 0
300.1
20 0. 0.4 0.2
110 6
010 10 20 30 40 50 60U X/w
c) Poisson Solution
1 2.9 Pore Pressures in Horizontal Plane Far Above Tip for Simple Plate, B/w-32.5

32
jTime Factor, T ct
120.01 0.1 1 to too
I ~---y dirI integration
0 0.8 PoissonSolution
dir ~.o0.6 integration
j 0.4
0.2 6
1 1.2
integration
0.8 Poisson
> Solution
integration
'~0.4
0.8
o
0.6
0.4 integration
0.01 0P1is0 s 10TimesFlctor, souto
3 F~~gure 2.1~0 D0.6to fEcs oePrsue o ifrn ntalCniin tPaeCne
xIli

I
33II
C)
o
-6C
..
j ..VC CD
_0 CI IiIiI00
CLOn
CM co CD 't 0M
1~0 0 0q 0O -n

34
I 3. MECHANICS OF PLATE PENETRATION
3.1 INTRODUCTION
There are a variety of penetrometer devices, currently used to estimate in-situengineering properties of clays, whose geometry can be characterized by a flat plate (or
plates; Fig. 3.1). These include: a) the dilatometer (Marchetti, 1980), which measures total
lateral stresses acting on a membrane inflated against the soil; b) earth pressure (spade) cells
(Tedd and Charles, 1982; Germaine, 1980; Tavenas et al. 1975); c) Iowa stepped blade
(Handy et al. 1982); and d) field vanes (Chandler, 1988), which are inserted and then
rotated against the soil. In this chapter, the Strain Path Method (SPM; Baligh, 1985a) is
used to describe the mechanics of flat plate penetration. The analyses are based on a'simple' plate geometry which is characterized by a width to thickness 'aspect ratio', B/w.
The analyses provide a complete framework for predicting the stresses and pore pressures
around penetrometers of different aspect ratio (B/w - 6 to 30). The results are then used:
a) to estimate how in-situ penetration measurements are related to soil properties (e.g. forthe dilatometer, chapter 5), and b) estimate initial stress conditions in the soil prior tosubsequent testing operations (e.g. prior to field vane rotation, chapter 6). The results have
3 further applications in other areas of geotechnical practice, including the disturbance due to
H-pile, sheet pile, and wick drain mandrel installation (Fig. 3.2).
3.2 PREVIOUS STUDIES USING THE STRAIN PATH METHOD
The strain path method was introduced by Baligh (1985) to provide an approximate
analytical framework for describing the deep, quasi-static penetration of a rigid
penetrometer in a saturated, homogeneous clay. The key assumption of the analysis is that
the deep penetration problem is heavily kinematically constrained such that the deformationand strain fields can be estimated from a velocity field which satisfies the conservation ofvolume requirement and boundary conditions (i.e. strains are obtained independent of the
shearing resistance of the soil). Figure 2.1 describes the necessary steps to obtain
solutions by means of the Strain Path Method:
1. Estimate the in-situ stress and pore pressure conditions before penetration.
2. Estimate a velocity field that satisfies the conservation of mass requirement and the
boundary conditions. The velocity field describes the velocity of soil particles relative
to the indenter.
3. Determine soil deformations by integrating the velocity field.

135
1 4. Compute strain rates by differentiating the velocity field:1 avi av.)
EiJ = 2 + -J)
2 = j + i )(3.1)
5. Integrate the strain rates to determine the strain paths of different soil elements.
6. At this stage, the effective stresses can be determined from the strain path (or history) of
various elements by either a) an effective stress approach utilizing an effective stress vs.
strain model, or b) a total stress approach utilizing two models: the first model
determines the deviatoric stresses, and the second estimates the shear induced pore
pressures. In this chapter the effective stress approach is used throughout. This is
because a) the effective stress models used herein are based on fundamental concepts of
soil behavior, b) in subsequent studies the effective stresses will control the soil'sconsolidation and strength behavior, and c) to evaluate differences in predictions from
Idifferent soil models (which capture different aspects of measured soil behavior).7. Given the effective stresses ('ij) the excess pore pressures are computed from1 equilibrium considerations. In this chapter, approximate fields of excess pore
pressures are obtained using the finite element solutions of the Poisson equation
presented in chapter 2.
In the simplest application of the strain path method, the velocity field is estimated fromthe steady, irrotational (potential) flow of an incompressible, inviscid fluid around the
penetrometer. Simple penetrometer geometries are obtained by combining fundamentalsolutions for singularities with uniform flows. For example, Baligh (1985a) describes a
blunt axisymmetric penetrometer, referred to as a "simple pile", which is obtained bycombining the solution of a 3-D point source with a uniform flow (Fig. 3.3). Table 3.1summarizes other basic geometries that have been reported previously, including a) the
open ended pile or hollow sampling tube, and b) the "simple wall" (Chin, 1986). In each
case the geometry is defined using a singularity (infinite line source, ring source etc; Tab.
3.1) with a uniform flow. The major advantage of these simple solutions is that closedform expressions can be derived for the velocity, strain rate and strain fields during steady
penetration (Baligh, 1985a, 1986a; Teh, 1987; Teh & Houlsby, 1987).More realistic penetrometer geometries can be developed from the basic solutions using
methods of superposition. The "method of sources and sinks" (Weinstein, 1948; Rouse,1959) enables the geometry of axisymmetric bodies to be simulated by a distribution ofsources and sinks along the centerline of the body. In this case, the total potential
flowfield, 0, is written as a linear combination of the potentials for each of the sources, Oi:

36
4D' ci Oi (3.2)
where, ci are constant coefficients and correspond to the strengths of the individual
I sources. For specified source locations and penetrometer geometry, the values of ci aredetermined (by an inversion process) from the boundary conditions of zero flux normal tothe solid boundary.
Using the method of sources and sinks, the contribution of the individual sources/sinksto the overall velocities and strain rates in the soil can be expressed analytically. However,
the method has a number of limitations:
1. The number of possible source configurations to describe a given geometry (i.e., the
number and locations of sources along the penetrometer axis) is infinite and numerous
trials are necessary to establish reliable and accurate solutions for a specified geometry.
Also, numerical instability can result if the sources are too closely spaced.
2. The method is best suited to slender bodies and becomes numerically inaccurate when
the geometry includes discontinuities of slope 1. The 600 cone probably represents the
maximum cone angle that can be treated by this method without the need for a ringsource located at the slope of the discontinuity (Levadoux and Baligh, 1980).
Levadoux and Baligh (1980) report results for 180 and 600 degree cone penetrometersusing the method of sources and sinks. Figure 3.4 compares the deformation paths for soil
elements located at radial distances, 1_ r0/R 5 , described by the strain path method for a)
the simple pile, b) 600 cone, and c) 180 cone. Radial displacements of the soil elements are
controlled primarily by the conservation of volume requirement (due to soil
incompressibility during penetration) and are not significantly influenced by tip geometry.
In the vertical direction, the soil is initially pushed downwards in the direction of
penetration and is then squeezed upwards after passage of the base of the penetrometer.
The magnitude of vertical soil deformations reduces with increasing sharpness of the tip.j This reflects differences in the shearing mechanism in the immediate vicinity of the tip that
can be described as "pushing" of the soil for the simple pile (blunt penetrometer) and"cutting" of the soil for the 180 (sharp) cone.
For axisymmetric penetration, the strain path (history) of soil elements around the
penetrometer is fully described by three independent components of shear strain, El, E 2 ,
1 For example, at the transition between the cone and the shaft of the penetrometer, Levadoux and Baligh(1980) introduce a circular arc approximation to the geometry. Tumay et al. (1985) propose the use ofconformal mapping using Schwartz-Cristoffel transformations to alleviate the problem.

37
E32 that correspond to shearing in triaxial, pressuremeter and simple shear modes
respectively. Figure 3.5 shows the strain paths of soil elements close to the centerline (0.2
!5 ro/R <1.0) for the three axisymmetric penetrometers. These results show the following:1. Tip geometry does not have a significant effect on, a) the overall magnitudes of the E2
strain experienced by soil elements close to the penetrometer, or b) the reversals of
strain direction experienced by the soil elements.2. The magnitudes of the E1 and E3 strain components reduce significantly with increasing
tip sharpness for soil elements located close to the penetrometer (r0/R < 1.0).Two possible approaches can be considered in the study of penetration mechanics for
flat plate penetrometers (such as the dilatometer, spade cells, field vane, etc.) to obtain the
velocity field in step 2 of the strain path method:
1. Numerical methods that model the surface geometry of the penetrometer. For three
dimensional penetrometer geometries, boundary element formulations such as the panel
method are widely used by aeronautical engineers and hydrodynamicists. The first use
of the panel method within the framework of the strain path method was proposed by
Huang (1989) using the formulation of Hess and Smith (1962, 1964). In previous
work, Williamson (1989) (Whittle et al., 1989) also implemented a potential basedpanel method to study the disturbance due to dilatometer installation. However, due tothe complexities associated with modeling real surface geometries, it is difficult to gaininsight about the basic penetration mechanics. Williamson (1989) (Whittle et al., 1989)
I used a potential based panel method to study the strain paths due to dialtometer
penetration. These studies showed that results from panel method computations requirevery careful evaluation in order to establish their reliability and accuracy for a givenI surface discretization.
2. Simple solutions using fundamental analytical solutions. These analyses provide
considerable insight into the basic mechanics of penetration but do not closely model
the surface geometry of a particular penetrometer. In this chapter fundamental solutions
are presented for a "simple plate" geometry in order to study the effects of plate aspect
ratio on strains, effective stresses, and pore water pressures during installation.
3.3 THE SIMPLE PLATE
2 Where, E1 - ezz; E2 - (ep-ee)fr3 ; E3 -2erzN'3". These measures are transformed deviatoric strains thatwere originally introduced by Levadoux and Baligh (1980) in order to gain physical insights into themechanics of penetration.

38
Analytical solutions for the fields of velocity and strain rate due to steady penetration
are established by considering the flow of soil elements around a stationary penetrometer
using fundamental potential flow solutions (Tab. 3.1). This chapter introduces a 'simple
plate' geometry which is characterized by the length of a finite line source, 2B, and its
strength, Q' (rate of volume discharged per unit length), superimposed in a uniform
flowfield (of velocity, ut). For the particular case when B=>O, the simple plate reduces to
a simple pile geometry (Baligh, 1985a), while for B=>-, the simple wall is obtained. The
following sections describe the mechanics of flat plate penetration based on the simple plate
geometry.
3.3.1 Fundamental Solution for a Finite Line Source
A single point source, discharging volume at a rate, V (volume per unit time), produces
a velocity that acts radially away from the source (Fig. 3.6). Assuming that the emitted
fluid occupies a spherical cavity, the radius of the cavity, R(t), can be related to the rate ofI discharge by:
I R(t) = 3 (3.3a)
The radial location of a soil element, r(t), is then related to its initial location, po, by the
incompressibility constraint:
3 p(t) - (p 3o+ R3(t) )I/3 (3.3b)
Hence, if the radius of the cavity is defined at time, t, all deformations and strains are
fully determined. The velocity of soil elements due to a point source located at the origin of
the reference coordinate frame can then be written:
A = - Spherical (3.4a)P 4xtP 2
v? = Vsin0 v9 = Vcos Cylindrical (3.4b)4Xtp2 41cp 2
vR = vrcos 0 ; v9 = VPsin 0 Cartesian (3.4c)
where, p =(x2 + y2 + z2)I/2, r =(x2 + y2)1I2, =tan- 1 -and 0 = tanY
If the cartesian frame is translated (Fig. 3.6b) such that x'=x, y'=y+t, z'=z, then the

39
velocity components (x',y',z') due to a source at y'=4 are given by:
v0= V sin cos 04xp 2
v~' V sin 0 sin 0= 4.p= (3.4d)
w 4-p 2
0. VCos 0
If the point source is then treated as a line source of elemental length, d4; then, V =Q'dt, where Q' is the source strength per unit length. Hence the velocity components for aline source of finite length ( 41 5 4 -2 ) can be obtained by direct integration:
vi, = v1(4)d4 (3.5)
where v9f are the velocity components given by equation 3.4d.For the particular case of a semi-infinite line source ( 0 _ _ oo) (Fig. 3.6c), the
velocity components are given by:
I Q, cos 0' 1V= 47tr, p, -
VY' = Q (3.6)V 4. x p'
Q' sin O'll Y
where, r' = (x' 2 + Z'2)1/2 p' = (x' 2 + y,2 + z,2)1/2, and O' = tan-1 .I xWhen the sign of the strength (Q') is negative, the results (eqn. 3.6) describe the flow3 field for a semi-infinite sink. Hence, the solution for a line source of finite length can be
obtained by superposition using the fundamental solutions for a semi-infinite source.The strain rate components of the flow field described by eqn. 3.6 are obtained by
differentiating the velocities with respect to the spatial coordinates (see eqn 3. 1). This leadsto the following expressions for the strain rates of a semi infinite line source:
II o

40
i t n V2 -t4r , 2P3yy -- 47cp,3
•ie= ,i+ 1 Y '2 (1 +) z'2yj4 Q'x ' r'4 P') r'2p'31 (3.7)
QxEX'y' 4xP'3
• - Q 'z'I =~~~~£yz --- iz.l+Y)X''i 47cp ' 3
1
x'z' {4X r,4 P r'2 P
The 'simple plate' geometry is then obtained by superimposing a uniform flow of
velocity, Uz, with the semi-infinite line source result. For example, the velocity field
around a line source of finite length 2B can be written:
vX = vX (+Q'; 0, -B, 0) + vx (-Q'; 0, +B, 0)Vy = vy (+Q'; 0, -B, 0) + vy (-Q'; 0, +B, 0) (3.8)vz = uz + vz (+Q'; 0, -B, 0) + vz (-Q'; 0, +B, 0)
where, vi (Q'; x,y,z) describes the velocity component (vx, vy, or vz) due to a semi-infinite
source of strength Q' that originates at (x, y, z) and extends to (x, ., z). The uniform flow
velocity (uz) is equivalent to the rate of penetration of the penetrometer. Applying eqn. 3.8
to eqn. 3.6 yields the following velocity field for a 'simple plate':
vX - Q'cos { p((y-B)- P2(Y+B))
V =y - - PI- P2 (3.9)
vz = uz + Q ' sinG fpl(y-B)- p2(y+B)}
4ntr ( PiP2
where, Pi = (x2+ (y+B) 2 + z2)i(2, and P2 = (x2+ (y-B) 2 + z2) 1/2
Using similar superposition arguments, the strain rates for a 'simple plate' of length 2B
are given by:

41
Q' p1(y-B) - 2
i x x = -Q _ _P;(Y4B ) " - p2 (y + B ) ) ( i - (y r2_ P_ P_ Y_ _ _ _ _
-- [(P~z (z py.yB) pp(y+B))1+B
•Y =. Q'4x 1 3p 3PIP2
S Q [rp(y-B) - p2(y+B) 2xz) xzPi(y-B) - p(y+B)
4cPP2 r2 r4 r2" 3f 3
I Due to the condition of incompressibility, (exx + + czz = 0 ), there are only five
independent shear strain rate components. These are conveniently expressed by
transformed measures of deviatoric strain rates :
p P(3.11)
IIP
These measures are introduced to enable comparisons with axisymmetric penetrometers.
The overall magnitude of shear strain in the soil is described by the second invariant of thedeviatoric strain rates, 33
1= E + !+2 EI+E +E~ (3.12)
IIP
Using the fundamental solutions for velocity and strain rate components, the framework of
the strain path method can then be inedto there estrain paths of soil elements
due to steady penetration.
h 3.3.2 Simple ae intrGeometry
i The maximum thickness of the simple plate, 2w, for a given length, 2B, is controlled
II

42
by the magnitude of the source strength Q' relative to the velocity of penetration, uz. In
order to enable comparisons of simple plate solutions with those of the simple pile, the
source strength is selected so that all dimensions of the problem can be normalized by the
half thickness of the plate (w). Hence the geometry of the a simple plate can be fully
described by the aspect ratio, B/w. Figure 3.7 is a dimensionless plot that shows the
relationship between source strength (Q') and plate aspect ratio (B/w).
Surface geometries of the simple plate are shown for three different aspect ratios in
figures 3.8a-c. An aspect ratio, B/w= 6.8 was selected because of its similarity to a
standard Marchetti dilatometer (Marchetti, 1980; chapter 5), while the plate with B/w=32.5
closely resembles the standard dimensions of one blade of a field vane (Chandler, 1988).
Figures 3.8a-c show three sections through each simple plate a) the longitudinal section
(x=0 plane), b) the central or lateral section (y=O plane), and c) a horizontal section far
above the tip of the plates, which is subsequently referred to as the 'steady state' plane1 (in
this case z/w=200). The location of the line source is included to illustrate its relationship
with the geometry of the solid body. The following aspects of the simple plate geometry
should be noted:
1. The simple plate is symmetric about the x=O and y=O planes. Its surface exhibits a
slight curvature in all directions. Soil elements that are initially located in the y=O plane
remain in that plane during shearing. Hence, these elements experience no out of planestraining and their strain histories can be described by a reduced set of 3 shear strains.
2. All of the plates exhibit actual aspect ratios (L/w) greater than the aspect ratio of the line
source used to generate the plate, B/w. The ratio L/B varies as a function of B, as
shown in figures 3.8a-c.It is important to emphasize that the 'simple plate' geometry is introduced in order to
elucidate basic disturbance mechanisms during flat blade penetration, but does not exactly
model the physical geometry of an earth pressure cell or dilatometer.
3.3.3 Shear Strains around Simple Plate
Figures 3.8a-c also show contours of octahedral shear strain, E= 1, 5, 10 and 20% in
the three cross sections of the simple plates. In the central (y=O) plane of the simple platesit can be seen that, for all of the plates, soil elements initially located at lateral distances
xjw < 3 experience strain levels that are larger than those imposed in conventional
1The steady state plane is defined by the assymptotic condition that there are no further changes in the fieldvariables (deformations, strains and stresses) with vertical elevation. The results in figure 3.8 are shown at anominal steady state condition, z/w=200.
Ii
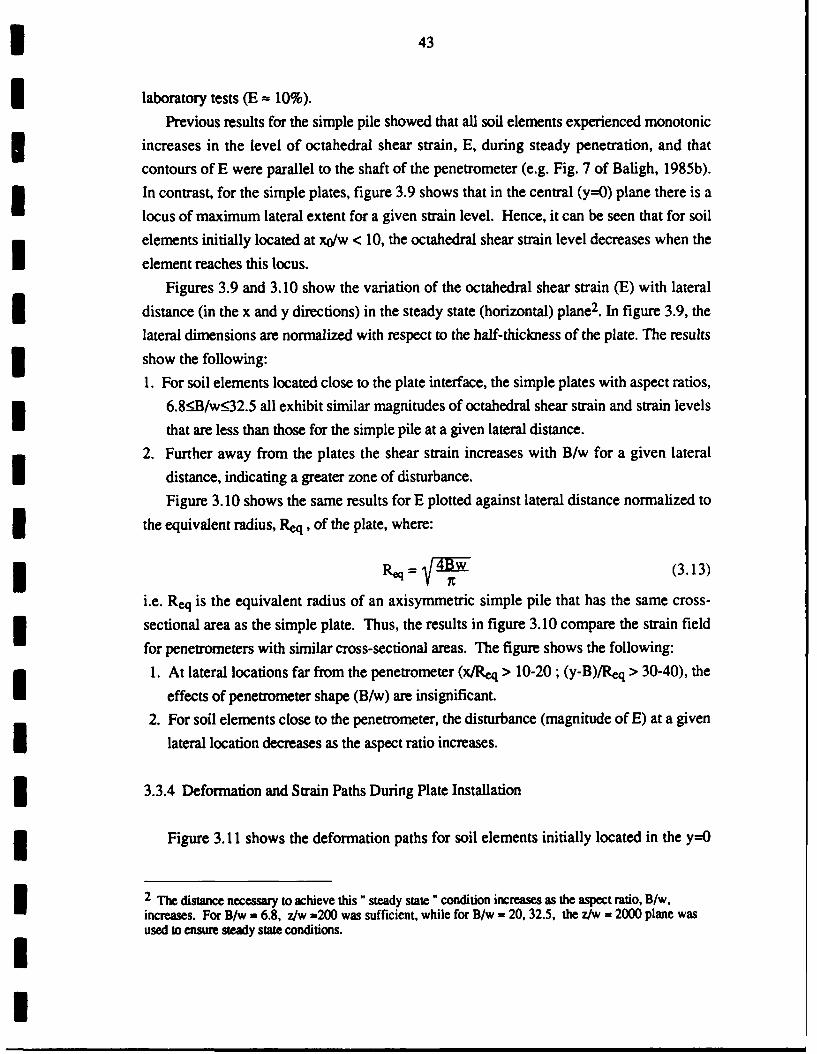
43
laboratory tests (E - 10%).
Previous results for the simple pile showed that all soil elements experienced monotonicincreases in the level of octahedral shear strain, E, during steady penetration, and that
contours of E were parallel to the shaft of the penetrometer (e.g. Fig. 7 of Baligh, 1985b).
In contrast, for the simple plates, figure 3.9 shows that in the central (y=O) plane there is a
locus of maximum lateral extent for a given strain level. Hence, it can be seen that for soil
elements initially located at xO/w < 10, the octahedral shear strain level decreases when the
element reaches this locus.
Figures 3.9 and 3. 10 show the variation of the octahedral shear strain (E) with lateral
distance (in the x and y directions) in the steady state (horizontal) plane 2. In figure 3.9, the
lateral dimensions are normalized with respect to the half-thickness of the plate. The results
show the following:
1. For soil elements located close to the plate interface, the simple plates with aspect ratios,
6.8<_B/w<32.5 all exhibit similar magnitudes of octahedral shear strain and strain levels
that are less than those for the simple pile at a given lateral distance.
2. Further away from the plates the shear strain increases with B/w for a given lateral
distance, indicating a greater zone of disturbance.Figure 3.10 shows the same results for E plotted against lateral distance normalized to
the equivalent radius, Req, of the plate, where:
R,= f -W (3.13)
i.e. Req is the equivalent radius of an axisymmetric simple pile that has the same cross-
sectional area as the simple plate. Thus, the results in figure 3.10 compare the strain field
for penetrometers with similar cross-sectional areas. The figure shows the following:
1. At lateral locations far from the penetrometer (x/Req > 10-20 ; (y-B)/Req > 30-40), the
effects of penetrometer shape (B/w) are insignificant.
2. For soil elements close to the penetrometer, the disturbance (magnitude of E) at a givenU lateral location decreases as the aspect ratio increases.
3 3.3.4 Deformation and Strain Paths During Plate Installation
Figure 3.11 shows the deformation paths for soil elements initially located in the y--0
2 The distance necessary to achieve this" steady state" condition increases as the aspect ratio, B/w,
increases. For B/w = 6.8, z/w =200 was sufficient, while for B/w = 20, 32.5, the z/w = 2000 plane wasused to ensure steady state conditions.I
U

44
I plane at lateral locations, xo/w= 1, 2, 3, 4, and 5 for the simple plates (B/w=6.8, 20 and32.5) and simple pile geometries. It can be seen that the soil elements are displacedvertically downwards and then laterally outwards to accomodate the volume occupied by
the penetrometer. As the plate aspect ratio increases, the amount of total vertical and radialmovement for a given soil element (i.e. at fixed xO/w) also increases and reflects the
different volumes of soil displaced by the different geometries. In figure 3.12, the
deformation paths are plotted for the same geometries for radial locations, x0/Rm= 1, 2, 3,
4 and 5. In this case, it can be seen that, for plates of equal displaced volume, soildisturbance reduces with increased aspect ratio.
The total amount of vertical deformation experienced by soil elements due to
penetrometer installation is one measure of disturbance which has been measured in
3laboratory (e.g. Rourk, 1961) and field tests (e.g. Karlsrud & Haugen, 1985). In the
context of the strain path method, total vertical soil deformation, or retardation, is calculated
by comparing the elevations of two soil elements initially located in the same horizontal
plane 3:
I Retardation = Az = (z -z-) (3.14)
3 where z is the vertical coordinate at a lateral distance (x, y) from the center of the
penetrometer and z' is the vertical coordinate of a soil element far from the penetrometer
(x,0, y..).Figure 3.11 shows retardation curves for soil elements located in the y=0 plane at
steady state conditions for the three simple plates and simple pile geometries. The
retardation curves (final elevations in Fig. 3.11) are very similar for the higher aspect ratio
plates (B/w = 20, 32.5), but differ in form from the B/w = 6.8 plate and simple pile
curves. This suggests that for long, thin penetrometers the plate thickness (w) controls the
form of the retardations. However, as the plate aspect ratio decreases (say B/w _< 6.8)
other factors such as plate width B exert some influence over the retardations.
The strain paths of soil elements in the central plane (y=0) are shown in figures 3.13a,
3 b and c for various initial locations, xo/w. The strain history of these elements is fully
described by the following transformed measures of strain 4:
3 Isochronic lines are curves showing the location of soil elements relative to the indenter at a particularII time step.
4 Note that in the central plane exy = eyz = 0.
Im

I 45
El E=e ;z E2 = oxx - Eyy) ; Ezx = A-ezx (3.15)
For all three of the plates considered, soil elements initially located at lateral distances
far away from the plate surface experience strain paths that are qualitatively similar to those
of the simple pile (Fig. 3.5):
1. Ahead of the penetrometer, straining is primarily in the El direction (vertical
compression). As the element moves past the tip of the penetrometer, this component
reverses in sign (vertical extension). The E5 component (shear strain on the vertical
plane) increases to a maximum close to the level of the penetromeor: tip and then
reverses direction. The E2 component increases monotonically throughout the strain
path and controls the magnitude of the shear strains behind the plate tip (where E5 => 0I and E2 => 0).
2. For a given x0/w, soil elements close to the plate experience an increasing amount of
negative E2 straining as the B/w ratio increases. In fact, Whittle et al. (1989) show that
for a plate with B/w = 10 and x0/w <- 1 the E2 component remains negative during an
element's entire strain path. This behavior is associated with a condition in which both
the length, 2B, and width, 2w, affect the strain history of soil elements. Very similar
results were reported previously for open-ended pile penetration (Chin, 1986).
For initial soil element locations that are not in the central plane the strain paths becomevery complex, and involve all five strain components. Figures 3.14a, b,c, and d show
one example of strain paths for a simple plate with B/w = 6.8 and soil elements initiallylocated at y0/w = 6.8 and xo/w =0.5, 1, 3, 5. The soil elements have three degrees of
freedom (i.e., 3 components of displacement). It can be seen that, for the element furthest
from the penetrometer (xo/w = 10), the strain path is qualitatively similar to that described
for the y = 0 plane (Fig. 3.13a) but includes additional shear components E3 and E4 . For
the element closest to the plate (xo/w = 0.5) the behavior is strongly influenced by thedisplacement out of the y/w = 6.8 plane. This causes a reversal in the sign of the E2, E3
and E5 strain components. For intermediate soil elements, the strain paths reflect directly
the distortion of the soil around the edge of the plate.I3.4 INSTALLATION EFFECTIVE STRESSES AND PORE PRESSURES
In the strain path method, fields of effective stresses are determined from the strain
paths of soil elements around the penetrometer using a generalized effective stress soil
model. Excess pore pressures are then estimated from equilibrium considerations by finite
I

46
element solution of the Poisson equation using the methods presented in chapter 2.Of particular interest in this section is the effect of plate aspect ratio (B/w) on the
I resulting stress and pore pressure solution. The analysis in this section is confined to asteady state plane where stresses and pore pressures no longer change in the vertical
1 direction.
3.4.1 Effective Stresses
In order to establish a base case for determining the effect of aspect ratio on plate1 installation, effective stresses are computed using the Modified Cam Clay Model (MCC;
Roscoe & Burland, 1968). The input parameters selected for this model are those for Ko-normally consolidated Boston Blue Clay (BBC) (Ko=0.48; Whittle, 1987). This base case
analysis was selected for the following reasons:1. The MCC model is relatively easy to conceptualize, making interpretation of its
predictions straightforward.2. Predictions of the model (with the same input parameters for BBC) have been
extensively studied in conjunction with previous penetration studies (piles; Whittle,1987; open-ended penetrometers; Chin, 1986). Full details and evaluation of MCC
predictions for BBC are presented by Whittle (1987).
3. The model is an effective stress model, allowing results to be used directly inconsolidation studies and/or subsequent test procedures involving soil drainage.
4. Boston Blue Clay is a low plasticity (Ip-2 1%) marine clay of moderate sensitivity (st-3
to 7) which has been extensively studied at MIT over a period of 30 years. Input
parameters to describe the clay are based on high quality laboratory test data for
resedimented clay (Whittle, 1987).Figures 3.15a, b and c show the in plane effective stresses (a'xx, a'yy, 'XY)
normalized to the initial effective vertical stress ( O0 ) for the axisymmetric simple pile and
three plates. The pile and plate geometries are also shown on each figure for reference.Based on the plate installation results reported in previous sections, the spatial coordinatesare normalized by the equivalent radius of the penetrometer (Req = (4Bt/t)0.5). This
provides a valuable normalization that reveals similar behavior for all plates in the far field(i.e. for x/Req >>1 ; y/Req >1, the strain history of soil elements are independent of the
plate geometry). The figures show the following:1. In the far field, the normal stresses o'xx, y'yy approach the K0 condition of a'xx/'v0 =
Gtyy/ctv0 = 0.48.
2. For all plate aspect ratios ( 1 < B/w ! 32.5 ) the normal effective stresses ('xx/ao'v0,

47
I ('yy/e'vo) do not vary significantly in magnitude or direction for locations along theflat surface of the plate.
I 3. The effect of plate shape can be seen clearly by the increased elongation of the stresscontours in the region x/Req < 3; y/Req < 5 as the aspect ratio (B/w) increases.
4. The magnitude of the peak in-plane shear stress a'xy shows no dependence on theplate's aspect ratio. However, O'xy is symmetric about the x=y plane for the simplepile, and increasingly deviates from that condition as the aspect ratio increases.Figure 3.16 shows contours of the maximum shear stress, qh/O'vo 5 in the horizontal
(x,y) plane for these same geometries. For axisymmetric penetrometers, such as the simplepile, previous studies have shown that the peak value of qoa'vo occurs at r/Req = 6.5
(Whittle, 1987; Baligh, 1986a). Closer to the penetrometer the strain path method predictsreductions in q/a',0 due to rotations of principal stresses. With respect to the plates,
figure 3.16 shows the following:1. For all of the geometries considered, the maximum shear stress, qaod0-0.3 occurs at a
lateral distance x/Rq=3-5 (along y=O).2. In the near field, the shear stress reaches a local minimum on the central plane (y=O) at
x/Req - 1-2 for the two thinnest plates (B/w = 20, 32.5). This trend is not noted with
either the B/w=6.8 plate, or the simple pile.U3.4.2 Excess Pore Pressures
i The excess pore pressures (Au = (u-uo)/a'vo) arise due to changes in a) changes inmean octahedral total stress (Aa), and b) shear induced pore pressure (Au,), so that:
Au = AO + Aus (3.16)
The shear induced pore pressure is solely determined by the constitutive model, and isnot a function of the method of equilibrium solution6, while changes in mean stress aredominated by equilibrium considerations. Contours of shear induced pore pressure for thebase case analysis are shown in figure 3.17. It is clear from the figure that the magnitudeof Au/dOv0 does not change with plate aspect ratio, and for all cases, Au./o'v 0 0.16 close
%= y2 2+ 4e
6 In the MCC model, the shear induced pore pressures are related to changes in mean effective stressaccording to: Aus = - Ad'oct

48
to the shaft of the penetrometer. The shape of the Audc'vo contours do becomeincreasingly elliptical as the plate aspect ratio increases. The total excess pore pressure
solutions for the simple pile and three plates are shown in figure 3.18:1. The excess pore water pressure at the plate boundary is not affected significantly by the
aspect ratio of the plate (Au5/a'v0=1.0-1.2, at y=0).
2. There is an appreciable difference in the distribution of excess pore pressures due toaspect ratio. As B/w increases, a region of small negative pore pressures develops in azone well beyond the edge of the plate.
3. For the 'base case' analysis, the shear induced pore pressures (figure 3.17) represent arelatively small fraction (10-20%) of the total excess pore pressure.
3.4.3 Distributions Along Blade
Based on the above analyses, the distributions of pore pressure, normal effective stress(O'n), and normal total stress (an-uo) along the three plate blades can be summarized for
the base case analysis. Figure 3.19 illustrates these distributions for the three plate aspectratios (B/w = 6.8, 20, 32.5). The figure also tabulates values at two key locations on theplate: a) on the plate center, where measurements (u, an) are typically made, and b) at the
plate edge, where results are most strongly affected by the plate aspect ratio. The followingcomments can also be made regarding the figure:1. The form of the distributions are similar for all three plates: Over the central section of
the plate, the pore pressures and stresses do not deviate significantly from the centerlinevalues. Near the plate tips, the pore pressures decrease by approximately 20%
(independent of aspect ratio) while the normal effective stresses increase slightly. Thishas an interesting effect on the distribution of total normal stress which exhibits aminimum value close to the edge of the plates.
2. As the aspect ratio increases, the magnitudes of the pore pressure and normal stresses
decrease slightly at the plate center. For example, the excess pore pressure varies from(u-u0)/d'v0 - 1.1 for B/w = 6.8 to 1.02 for B/w = 32.5 (a 10% variation).
Normalization of the pore pressures and stresses by the centerline values (location 1),and normalization of the plate coordinate by the plate width B gives some insight into the
variables that control the stress and pore pressure distributions along the blade. Figure
3.20 shows that over the central half of the plate (y/B 0.5) the pore pressure and totalnormal stress distributions fall in a narrow band. Thus for a given centerline value ofstress or pore pressure, the plate width (B) is the controlling variable over the centralregion.

49
I Overall, these results show that plate shape (aspect ratio, B/w) has a relatively minor
influence on the stresses measured on the surface of the blade. This result is, of course,I subject to the limitations of the analysis (i.e., steady state conditions, MCC model for Ko-
normally consolidated BBC). However, the implication of these results is that
measurements/predictions of installation pore water pressure and total normal stress (i.e.,
dilatometer Po) acting on the blade of flat penetrometers will not be significantly different
from those measured/predicted for an axisymmetric penetrometer, such as the piezocone.This establishes for the first time the commonality of installation disturbance between flat
blade and axisymmetric penetrometers.I3.4.4 Effect of Soil Model on Predictions
In order to show some of the possible limitations of the MCC base case analysis, amore complex effective stress model, MIT-E3 (Whittle, 1987) was used to generate
effective stress and pore pressure results for the B/w = 6.8 plate. This model extends the
basic concepts of the MCC model by incorporating: a) anisotropic stress-strain-strength
behavior; b) small strain non-linearity; and c) strain softening. Input parameters for themodel have previously been selected to describe Ko-consolidated BBC and detailed
evaluations have demonstrated the predictive capabilitie and limitations of the model
(Whittle, 1987). Whittle and Baligh (1990) have shown that MIT-E3 is capable of making
reliable predictions of effective stresses acting on a model pile shaft in BBC.
Figures 3.21 a, b, and c show the in-plane effective stresses predicted by MIT-E3.
Comparison with figures 3.15 (a - c) shows that the MIT-E3 model predicts much lower
(up to 50%) effective stresses than the MCC model. The MIT-E3 model also shows that theregion of soil influenced by the installation, as shown by the region where stresses deviate
from the K0 condition, is larger than the region predicted by MCC.Shear induced pore pressure (Aud/o&), peak in plane shear stress (qh/o',,o) and total
excess pore pressure, (u-u0)/o'd,, predictions using the MIT-E3 model are shown in figure
3.22:1. The shear induced pore pressures are substantially higher than the MCC predictions
(Fig. 3.17), and extend over a much larger range: The MIT-E3 model predicts
Auda',o 0.5 along the plate blade (compared to Au/'=O.--. 16 obtained using
MCC). These differences can be attributed, in large part, to strain softening behavior
described by MIT-E3 in undrained shear.2. The peak in-plane shear stress contours are slightly smaller for MIT-E3 than for MCC
(q/O',0i0.2 compared to 0.3 for MCC; c.f. Fig. 3.16).

1 50
1 3. The predicted magnitude of the total pore pressure along the plate blade is similar forboth models (c.f. Fig. 3.18). However, the distribution of pore pressure throughoutthe soil is markedly different, with MIT-E3 model predicting a much greater lateralextent of excess pore pressures around the plate 3. It is also important to note that shearinduced pore pressures account for approximately 50% of the excess pore pressures
acting at the plate boundary for the MIT-E3 predictions.
3.5 UNCOUPLED DISSIPATION OF EXCESS PORE PRESSURES
1 Baligh and Levadoux (1980, 1986) have shown that the dissipation of excess porepressures around cone penetrometers can be well estimated from linear-uncoupledconsolidation analyses 4 in which the diffusion rate is controlled by the horizontalcoefficient of consolidation, Ch, of the clay. Previous analyses (e.g. Baligh & Levadoux,1980) have shown that the dissipation of excess pore pressures (for a given Ch) depends
primarily on the initial distribution of excess pore pressures around the penetrometer, and isnot related to the magnitude of the pore pressures acting at the surface of the penetrometer.
In this section, linear uncoupled consolidation analyses are presented for the simple plategeometries in order to establish the effects of plate aspect ratio (B/w) on the consolidation
behavior after penetrometer installation.The linear uncoupled diffusion equation is solved in the steady state horizontal plane
using the finite element program ADINAT:
2 a211 a 2u auCh h _ _- (3.17)a x2 ay2 &
where the soil is assumed isotropic and homogeneous.
In order to unify the interpretation of the results for plates with different aspect ratios
and for different values of ch5, a dimensionless time factor, T, is introduced:
T~ (3.18)
3It is important to note that it is the distribution of pore pressure, and not the shaft pore pressure, thatcontrols rates of pore pressure dissipation (consolidation).4Kavvadas (1982) and Whittle (1987) show that modeling of soil non-linearities is essential in predictingchanges in effective stresses aound pile shafts. Hence non-linear, coupled consolidation analyses are requiredin order to estimate reliably the changes in effective stresses in the soil.5The value of ch actually depends on the soil stiffness and permeability.

51
where R is the equivalent radius (eqn. 3.13) and t is the time.
Solutions of the linear-uncoupled consolidation have been obtained using the initialSconditions from the base case analysis (i.e. inital excess pore pressures are obtained using
the MCC model with input parameters corresponding to Ko-normally consolidated BBC;
3 Fig. 3.18). Figures 3.23 and 3.24 show the dissipation of excess pore pressures predicted
at a) the edge (locations B, C, D; Fig. 3.23), and b) the center (E; Fig. 3.24) of the three
simple plate geometries (B/w=6.8, 20 and 32.5):
1. For all three plate geometries, the excess pore pressures decrease monotonically at all
points around the surface of the plates.
2. Disspation occurs more rapidly at the edges of the plates (B, C, D; Fig. 3.23) than for
locations at the center (E; Fig. 3.24). However, for time factors, T>1 the differences in
the magnitude of excess pore pressures between the edge and center of the plate
become very small.
Figure 3.25 compares the predictions of the excess pore pressure ratio, (u-uo)/(ui-uo) at
the center of simple plates (E; Fig. 3.24), with solutions for the simple pile. The figure
show that the excess pore pressure ratio is effectively independent of the shape of the
plates (for B/w:932.5) using the time factor, T (eqn. 3.18). Thus these preliminary results
imply that the dissipation of excess pore pressures is controlled by the volume of soil
displaced by the penetrometer (RPq) and by the coefficient of consolidation, ch. Hence,
dissipation of excess pore pressures can be estimated from existing solutions foraxisymmetric penetrometers. Further research is now in progress to establish the generality
of these results.
IIIIII

II
u ~ ~ --:O
a CA
-S . ~ q -E:6
0 0 0 J9
;iI-14+
MIr
-. CL
CAC C

53_____
N- m
m en
*- - - - -%n- _ _
%I
U C04
co u
___________4_________
61~'~.P&g
NT C4

I 54
I
(.4 (.4
U 'K*H 0
I.1 - U
~.o ~3*2~* AII ~; .~.
v-i 0I~, I. 0
0
(.4 -3 3:
* 0
U* 0
NI i0
T* I 0 ~
IUI

U 55
II
I~~ I If 4
II
I T .1 I I
L I L* I TT' T
If
II
I40 IfII

1 56
.,eo A ' ~ af i i
3Low- (DU. Ti _
VA S C 0b
-~6.-
64fta__
I~ ~ La.MM"
Fiur 3'.4Deomtopahfo xs mercpntoee

I 57
CYLINDRICAL EXPANSION MTAIN. Es00 20 40 60 so 00o 20 140 160
' A Isam" ev
0I
4.
Soil Elemnt 2
I00Iol of oloohIW0Slwrw.I2
040 1-
5~6 206600204
It
12

1 58
20.00
I -~ 0.00
1 ~-0. 00 ---
0.00 40 00 60.00 120.00 140.00 200.00
E2 mE) %
0.00.- -
-40.00 --
-F
-80.00 -
NN
-1200.00-
I0.00 40.00 S0.00 120.00 160.00 200.00E2 J-L(~E.,E)t m%
Figure 3.5b. Strain paths for axisymmetric penetrometers: 600 Cone

I59I
50.00 b-.
30.00 -
S10.00I-10. 00 1
-30.00
0.00 40.00 80.00 120.00 160.00 200.00
E2 = --E---E ), (m)
0.00 -
-20.00 F
3 -40.00 G"" HMonzonoli Sa.il'
Locatio Element-60.00 ,* / •
U 1.0 A I/t-O.O
U j -8 0 .0 0 - 0 5 F , / -- 3 b .. , .0.I o f-
-100.001LO :j
0.00 40.00 12'0.00 16'0. 00 200.00
I-2 = 1 m
Figure 3.5c. Strain paths for axisynneuic penetrometers: 180 Cone

a) Point Source Located at Oricin 6
V,
I -V
I Point Source
3b) Point Scurco Locaed at Y.
zz
IP
IX .zz
- Serni-infinito Line Source3 Source Strength per Unit Length
V,. =d
U Figure 3.6. Coordinate system for the scmi-inflnitc line source (Whittle et al. 1989)
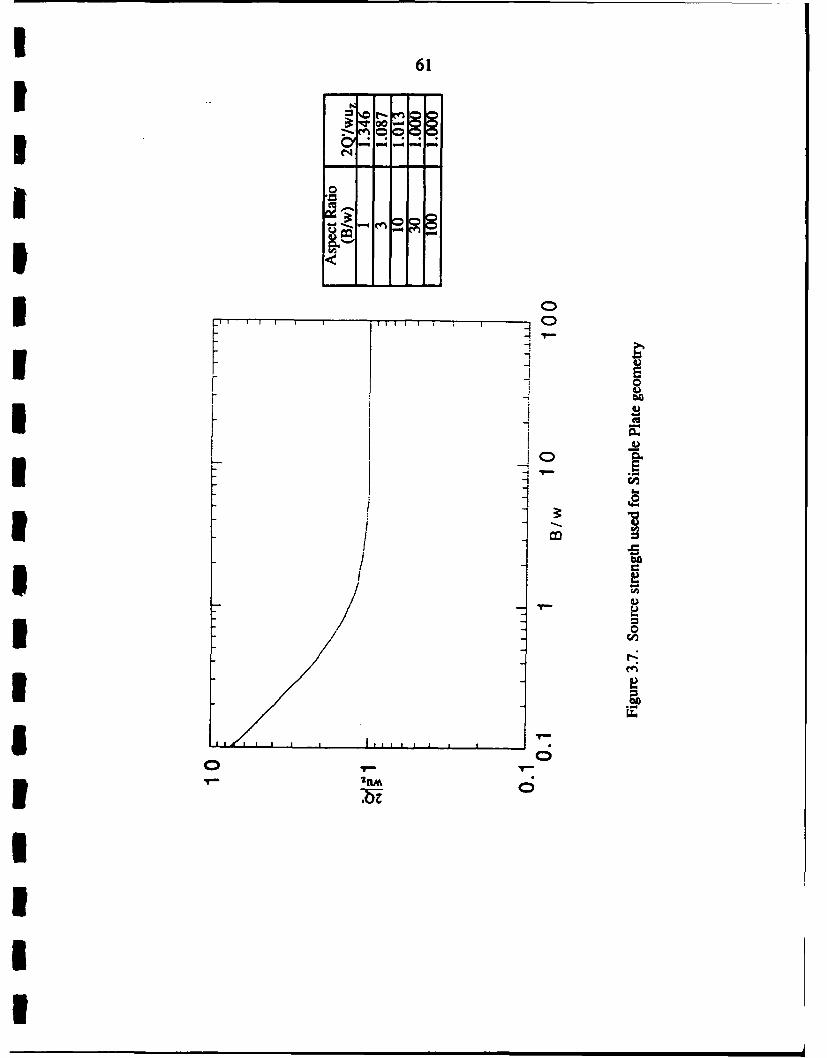
I61
D ,-
I , -
00
IIi I I i | I i 0
I J-F 0
1 I
II ~~I I I ! I
*
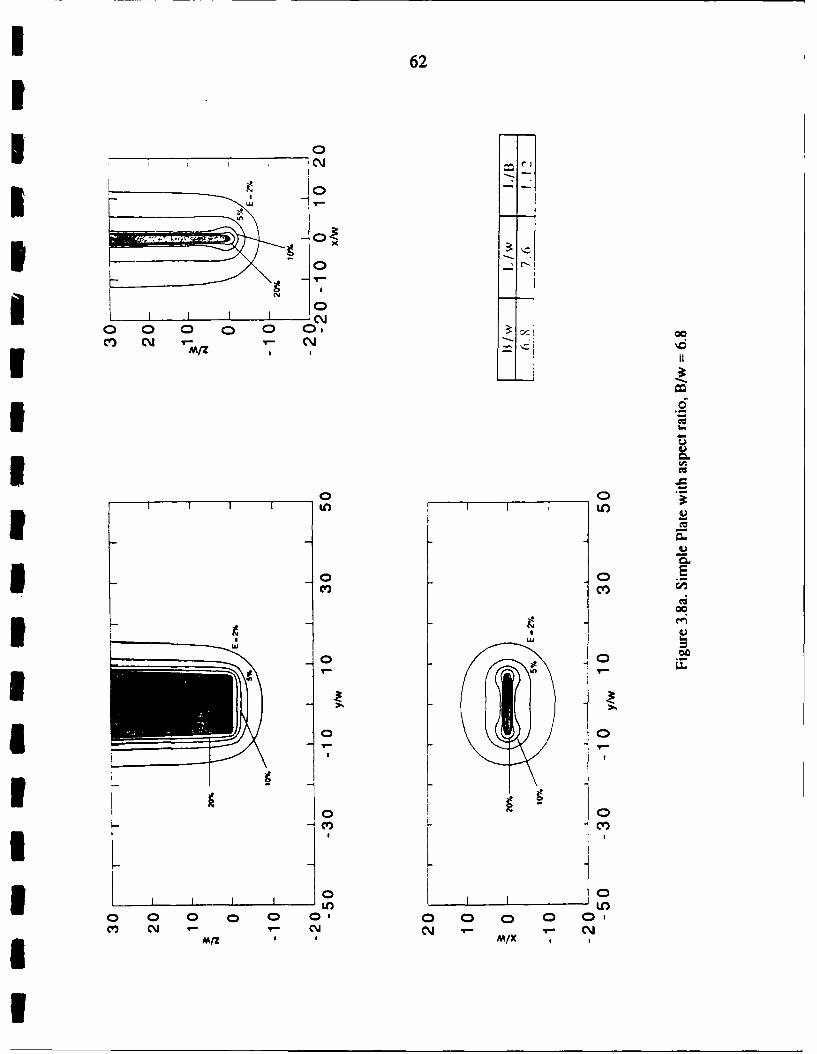
U 62
1 t I 0l0 C) N
I - -
0
CDI
0 0
cv, c ,MIZ M/0

1 63
Ia
_ _ _ H]
M/Z
LU E
0f Cf
l LOto I lo) C
CYv~ cm NJC.
I-'. MIX

64
I\
10 C) a c
0 C
~Cr.
I I I -~ I
CD 0'm CYCYC
oZ _ _ _ _ _

1 65
I* 0
0V.' 0
1 0 a.0
'a.
@0 II
~60 VN
II Jo
Vi.1 ~.. 'I -
3 0 0 - - C
2 - 230 0I (%) ~ 0
I_______ o3 02rn III~I .~ =la, bOI LJ Lr
0I -
I I* m
I t1 @040.
II.3.Ea1 0 0 - - -
2 (~) l@03 01 0
I

3 66
I9* 0 r
I I-* 0*
I Um
1~- A 0 - 19
0<

3 67
> CV)ifU a1'Io co

I 68
,0.05I g 0.1
1 0.15
0.2
1.1 1.2 1.3 1.4 1.5
03 0
0.05
I0.15 1-
0.2
0.252 2. 2.2 , eR 2.3 2.4 2.5
S. A B C DSimple Pile B/w = 6.8 /w = 20 B/w 32.50.1 Iplate plate plate1 .15
0.2
I0.250.L
3 3.1 3.2 .1%3. 3 -3.5
0
0.05
j0.1
3 0.15
0.2
i ~ ~~~~~~0.25........... ..4 4.1 4.2 / 4.3 4.4 4.5
0 A
0. 05C
1 0.1O.1S
0.2
0.25 -- - I -- . . . . . .5 5.1 5 .2 ,,tm 5.3 5.4 5.5
Figure 3.12. Deformation paths around Simple Plates using Req normalization
II

1- 69
I0
-10 BC1 5 -
FF-25 A)
Simple Plate-30 Btw=6.8
S5 y = 0 plane
-4 I I I I I-40
-20-15-10- 5 0 5 10 15 20
I A B Cxo/W 1.0 3.0 5.0
1 -20 , , ,
-15Simple Plate
B/w - 6.8
-5 - y .O0planls
0
10
1 1520 I I
-20-15-10-5 0 5 10 15 20E2 (%)
I Figure 3.13a. Strain paths of soil elements around Simple Plate in the y/w = 0 plane,
B/w=6.8
iI

1 70II
0 B-5 0
-20
-25 ,\ -
- 30 ' Simple Plate: -1i B/w = 20 |
-35 y= 0 planei
-4 0 1 ! , ! _
-20-15-10-5 0 5 10 15 20
A B CxO/w 1.0 3.0 5.0
-20 A I i
-15
Simple Plate-10 B/w=20
5 y =0 plane5 _ _ B0
5
10
15
20 I I I
-20-15-10-5 0 5 10 15 20
Figure 3.13b. Strain paths of soil elements around Simple Plate in the y/w =0 plane,
B/w=20
1i

1 71
0 I
-5
-10
1 5I A,,-20
1 -25
-30 'Simple Plate
-35 y Oplanel
.4 0 I I
-20- 15-10-5 0 5 10 15 20
iA B C
xo/w 1.0 3.0 5.0
-2 0 I 1 I
-15
3 -0 Simple PlateB/w = 32.5 A
I -5 y = 0 plane B
0 ""
1 5-
10
3 15-
20 I I I
--20-15-10- 5 0 5 10 15 20
Figure 3.13c. Strain paths of soil elements around Simple Plate in the y/w =0 plane,B/w=32.5
II

I _____6_____te ___ __72 15 _ _ _ __ _ _ _ __ _ _ _
0 10 m .6 .pate
B5
5* ~ F A 2 PA
30 Yo w = .
- 35 5- 5-30 2-5 20 15 -10 5 0 5
20 ;2 = /3(x c y)yxx yy %1 -20 !A o D -yY
-251 8/w =6.8 plate
-30 y 0 'w= 6.8
-300-25520-015511-055005
=)( y ) %)
I i
0 \0 O 25r
5 A / w'
* Fg36.8 l .1n B/w =6.8 plate / C
1 5 y = 6.88YO/W6.8- -30 -25 -20 -1 *1 -s 0 55 1
E 2 (1/4)(c x- y ) (%)
.,w .5 1 3 5 -5 I I-3 0-25- 20-1 510 5 0 5
E2= (114 3) (e -x E (0/)
I Figure 3.14 Example strain laths for soil elements around Simple Pla~te, B/w = 6.8,
wihy/ 1

I 73
1 0r
cc a:
- 0 b.
* I *0
CI Cjculo
N~ 0 0
02
cv
- en
IY c o CbeUAb /

74
0 'b co 'b
co co
Ib ca
co c0
-cc0 N
-2cs.U~ (D- , *
(x OO
E___ ________ 0 cn______
- I
cm co0CY c*Y bo ACYbt
.. .. ....

75
; ~0
0 Nr
0003 oz 0 0 AIo 0 CIJ .-
HiA UI. .
'0'
0 c0
cc c
40 to bcm co
o Y c o V Yb *bet A

76
0 (0
CLu
Ico
0 D C oC o 1 0
CYC
Cv
Cc .90~
CdC
3Y c 0 N co
C4 be A Y .1

77
IIcI L L -
w (%J co CV
U~c c'o %, ~
* 0j
CY be kj1 CV bCeJ A I
IY -( 0 0~
CL a* 0,0
ICIYC
IQ

78
IV I 0 N
o cc co
-. CO -'CO $
0.
o o 0
0 o iD n O0o C N 04 Cco O - 06
I 0.I
I- CU10CYboi

79II -. "-
• - d " "~
I 0 C 000Ci 0 - 0
t^ 0n 00 0%n ~
II C C
0 0 o u
0~~ ci 73 - - -
""I oq _4
(°.) ^4(° "
CV 00 00
I<
ICV)
'-)
L
I-inC~~~~uj CYGoCD YGo0
ic
O A o f 0 " 0 C) 0 .0n - o
mm0
I~~

80
0
00
IOUu
>
0I
-IV
I 0! 0 0 Ic ,
In -/n (n-n O ) o .

81
ICIC
0CD-
a (D CY cuC)wU
040
be (01 00 0I~) '& o.
(00 00
IY -be IAA n
0c
*Y co
AL
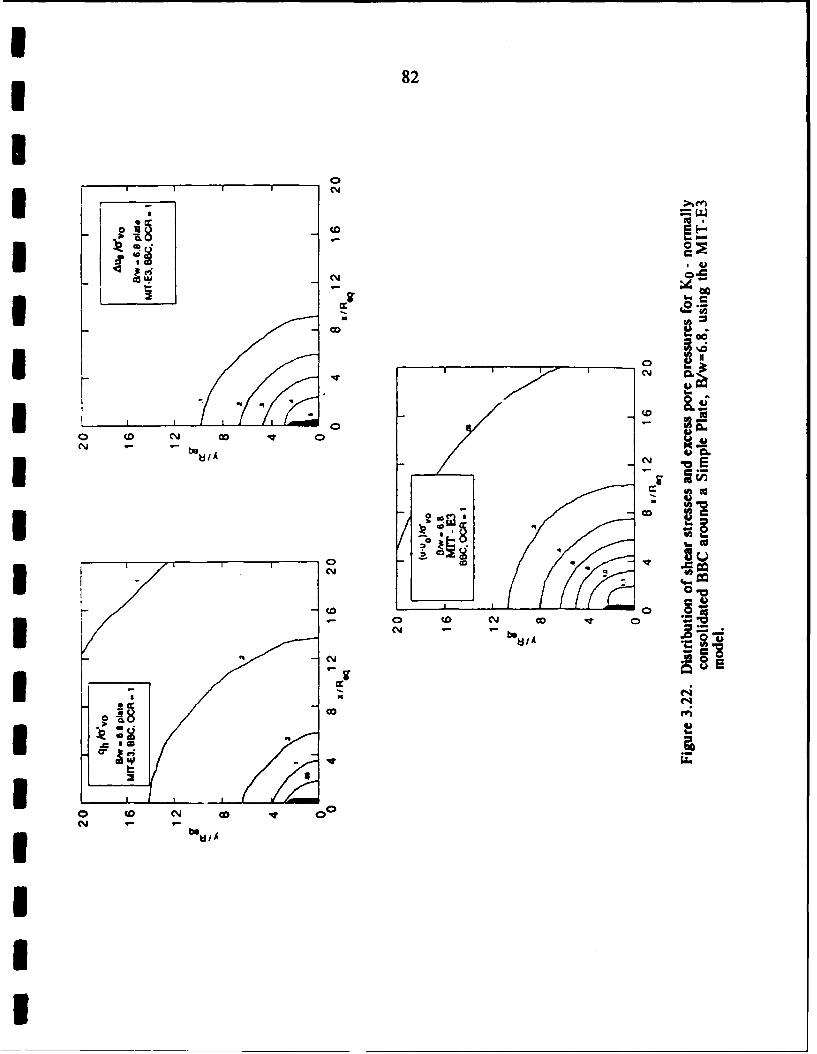
1 82
a o U C3 co
04 --
be '0Skj1 '.0S
IS
cc uoY q 0
1 0-0
N bet A
NcUC C-
i~.C4
0 co 0N -3ei

83
00
* 0;C; Cu
3 0
u, l I 0 a
0 °
S(on - n) o (O n
3
0
0 CM
Iw0 0 acIm co co 0.c
OA o/e n Ao/(n-n

84
UQ
* 00C Vc c
OA 62 i6l-
400
* Id 0I)j
cm C R ll cm oc
OAp n -n /( on - n)

85
I2
0
0
CO AIC
78 .9
Ic n
9 ca
*o _ _q 0
(On - !n)/(On - n)

86
4. THE PIEZOCONE
1 4.1 INTRODUCTION
The piezocone penetrometer (CPTU; Janbu & Senneset, 1974; Baligh et al., 1981;DeRuiter, 1981) combines the measuring capabilities of: a) the electrical cone penetrometer
(CPT; DeRuiter, 1971 Fig. 4.1a), which provides continuous measurement of tip
B resistance, qc, and local skin friction, fs, (acting along a friction sleeve); and b) the porepressure probe (PPP, Fig. 4.1b), which measures pore pressures, u, both during
5 penetration and in subsequent dissipation tests (Wissa, 1975; Torstensson, 1975). The
simultaneous measurement of pore pressure and tip resistance gives the piezocone unique3 capabilities for estimating soil stratification and spatial varilbility (Baligh et al., 1980; Jones
et al., 1981; Senneset & Janbu, 1984; Campanella & Robertson, 1988). The test is alsowidely used to estimate engineering properties using various empirical correlations. In
clays, measurements of tip resistance and pore pressures during penetration are correlated
with undrained shear strength and stress history; while pore pressure dissipation data are
1 used to estimate consolidation and permeability properties. This chapter focuses on the
prediction and interpretation of engineering properties during cone penetration.
In previous studies, the Strain Path Method (SPM; Baligh & Levadoux, 1980; Baligh,
1985a, b) has provided a rational framework for predicting piezocone penetration in clays,5and hence establishing a basis for interpretation of the measured data. The previous studies
have included the following:
1. Baligh and Levadoux (1980) presented predictions of the stresses and pore pressures
around 600 and 180 cone penetrometers: Shear stresses in the soil were obtained using
a total stress, itiulti-surface plasticity model (MIT-Ti), with input parameters selected
U for KO-normally consolidated Boston Blue Clay. Changes in mean total stress were
estimated from radial equilibrium (c.f. Chapter 2 of this report), while a separate model
3 was introduced for shear induced pore pressures.2. Baligh (1985a) obtained upper bound, closed form expressions for the penetration
resistance of 'simple pile' geometry, qsp, based on the energy required to achieve
steady penetration. These studies showed that the undrained point resistance at aparticular depth depends on a) the level of total confining stress (C0 , in-situ), b) the
undrained shear strength of the clay, c) the shear strain at yield, and d) the shear
IU

* 87
I1 stiffness at small strain levels. Preliminary comparisons of the predicted point
resistance indicated reasonable agreement with typical cone measurements; however,
the analysis does not consider important aspects of soil behavior in the plastic region
around the penetrometer and hence cannot be used for more detailed, site specific
evaluations (Whittle et al., 1989).
3. Baligh (1986b) and Elghaib (1989)1 have presented predictions of stress conditions atthe tip of a 'simple pile' penetrometer 2 based on the strain history of soil elements along3 the centerline (ahead of the advancing penetrometer). For these assumptions, a
simplified 'centerline analysis' was developed in order to predict the 1reistnce and
I tip during steady penetration, based on known soil properties. From
these analyses, Elghaib (1989) has shown that the undrained shear strength, c.Tc (intriaxial compression) can be interpreted from measurements of either the tip resistance or
tip pore pressures. The proposed interpretation method was shown to predict cTC to
within ±25% using data from nine well documented sites.
In this chapter, comprehensive strain path predictions of effective stresses and pore
pressures are presented for piezocone penetration in normally and lightly overconsolidated3clays (OCR_4). In the current work, distributions of effective stresses are obtained from
generalized soil models 3 (MCC and MIT-E3); while excess pore pressures are found using1the finite element solutions of the (modified) Poisson equation (described in Chapter 2). A
detailed interpretation of the predictions then provides a basis for establishing possiblecorrelations between piezocone measurements and soil properties. The predictions are also
compared directly with measured data from well documented sites in order to establish thei capabilities and limitations of the strain path analyses.
4.2 BACKGROUND34.2.1 Cone Design and Testing Procedures
The basic geometry of the standard electrical cone (Fig. 4.1) comprises a
17his work has been summarized in Whittle et al. (1989).21n this case the tip resistance, qc(zz)tip.3Iese same effective stress soil models will also be used in subsequent analysis of pore pressuredissipation and membrane expansion procedures (e.g. pressuremeter, etc.).
II

* 88
Ipenetrometer with 10 cm 2 base area (i.e., shaft radius, R - 1.78 cm) and apex angle, 8 =
600. The friction sleeve is located immediately behind the cone and has a surface area
A,= 150 cm 2 . The cone is installed at a standardized penetration rate, u-2 cm/sec. Baligh
(1986c) has presented preliminary analyses which show that for the standard cone test
penetrated at a velocity of 2cm/sec (i.e., u/R=1.1 sec-1 ):
1. In low permeability clays (k<10 -7 cm/sec), there is effectively no migration ofexcess pore water pressure during steady cone penetration (i.e., undrained).
2. In clean sands (<10% by weight smaller than ASTM sieve no.200) with
permeability, 104 < k < 10-1 cm/sec, there is no measureable excess pore pressureI during penetration due to the free migration of pore fluid (i.e., fully drained).
3. For intermediate classes of soils such as silt and 'dirty sands'4 (with 10- < k5 104
cm/sec) partial dissipation of excess pore pressures will occur during penetration.Continuous penetration of the cone is generally possible over Im intervals, separated
by short delays (At=15 to 90 sec) during which the next push rod is assembled. Thesedelays introduce small discontinuities in the tip and pore pressure profiles due to partialdissipation of pore pressures.3There is currently no standardized design for either the dimensions or location of the
porous filter elements used to measure penetration pore pressures (Fig. 4.2). However,3 most piezocones used in practice have a single porous element located either at the base or
on the face of the cone (Fig. 4.3). Baligh and Levadoux (1980) have shown both
experimentally and theoretically (based on strain path analyses) that there are large spatialvariations in the excess pore pressures which develop around the cone during steadypenetration. Thus, variations in the location of porous elements have provided a majorsource of confusion in the interpretation of engineering properties using piezocone porepressures. The debate over optimal filter location is still unresolved.3 Baligh (1986c) concludes that pore pressure measurements at the cone tip are reliableand repeatable, and provide the most sensitive indicators of soil stratification. Based on3 strain path analyses, the tip pore pressures are primarily controlled by a small number ofsoil properties (from centerline analyses; Elghaib, 1989; Whittle et al., 1989) and can beused to interpret undrained shear strength in clays. There are two main disadvantages of
the tip location: a) the porous element is vulnerable to damage and abrasion; and b) the
U 4i.e., high proportion of fine materials.
IU

* 89
USmeasured pore pressure response can be significantly affected by the compressibility of the
filter element (Battaglio et al. 1986). Many authors now support the view that mid-coneU filter locations offer almost as reliable a profiling capability, but are less vulnerable to
damage.
Tavenas et al. (1982), and Robertson and Campanella (1984) advocate the filterlocated at the base of the cone (especially for soil profiling). This location is veryconvenient for making essential corrections to the measured tip resistance (as discussed3 below). However, previous experimental and theoretical results have shown that there are
large pore pressure gradients acting around the base of the cone5. Thus, the repeatability of
5 base pore pressures is an important consideration in the piezocone design.
Wroth (1984) postulated that pore pressures measured at z/R=5-6 above the base of3 the cone provide the best indicator of stress history. This recommendation was based on
the assumption that shear induced pore pressures contribute a significant percentage of themeasured pore pressure around the shaft. In contrast, strain path analyses (Baligh, 1986b;Whittle, 1987) show that predictions of shaft pore pressures are strongly influenced bymore complex aspects of soil behavior. Thus it is difficult to establish how measured porepressures are related to soil properties.
In addition to the problems created by non-standardization of piezocone geometry,3 there are also a number of hardware design issues which have an important influence on the
measured/reported data.
1. Load cell resolution:
Almost all electrical cones are instrumented with a single load cell which can measure
penetration resistance in soils ranging from very soft clays to very dense sands (i.e.
100 < qc < 30,000 kPa). Thus, it is clear that measurements in soft clays suffer fromlow resolution of the load cell readings which can have a very significant influence on3 the reliability of reported tip resistance. More sophisticated designs using two loadcells with different ranges have been described by Ridgen et al. (1982) but are not3 common in practice.
2. Correction of tip resistance:3 When a piezocone is subjected to hydrostatic pressure, a shift occurs in the zero reading
I 5Particularly erratic measurements are obtained for highly overconsolidated clays; e.g. Powell & Uglow(1988).
Ii

* 90
Uof the load cell (and hence the implied tip resistance6, DeRuiter, 1981, 1982; Campanella etal., 1982). This is due to unequal areas on which the pore water pressure is acting aroundthe cone (Fig. 4.4a). Therefore the measured tip resistance, q,, and the sleeve friction, f5,do not measure the actual resistance offered by the surrounding soil. Correction of the tipresistance is difficult to achieve due to the non-uniformity of pore pressures acting aroundthe cone in soil. Current correction procedures involve: a) estimating the 'apparent' areacorrection, a=AN/AT (Fig. 4.4a) for a given cone design, and b) adjusting the coneresistance reading form test data, q, using the penetration pore pressure measured at the
base of the cone, Ub, (Fig. 4.4a). Hence the corrected tip resistance is generally reportedI as:qT = qc + (1-a) Ub
(4.1)
I If pore pressures are not measured at the base of the cone, further empirical
modification factors are required7. The correction factor can increase the reported tip
I resistance by up to 20-30% in soft clays.It is important to note that the apparent area factor is also subject to potential errors.3For example, Nyirenda and Sills (1989) have correctly demonstrated that a*AN/AT, but is
controlled by the equilibration of forces acting on the cone as shown in figure 4.4b. This3 figure indicates that the design of the friction sleeve and its O-ring seal can significantly
affect the calculation of the correction factor. Thus the most reliable method for correcting
tip resistance is to calibrate the cone in a pressurized water chamber.8
3. Response of the porous elementsThe reliability (accuracy and response rate) of the monitored pore pressures dependsU largely on the rigidity of the measuring system. In practice, this can be achieved by
using a small volume for the measuring 'fluid' and by ensuring that the filter is fully de-3 aired. Filter materials should contain small pores (-2pm in diameter; Smits, 1982) to
ensure that the filter can sustain external tension forces (i.e., due to negative pore3pressures in the soil). Battaglio et al. (1986) have also shown that the compressibility
of the filter element located at the tip of the cone can lead to erroneous pore pressures,
especially in stiff clays. This problem can be circumvented by re-locating the filter onto
6This also occurs in the load cell for the friction sleeve.7 For example, Baligh et al. (1980) assume that 0.3 u=ip - (1-a)ub.8 Even this process may not account for compression of the friction sleeve which occurs in the soil.
I

I --_ 91
the face of the cone.
4.2.2 Interpretation of Engineering Properties of Clays
There are numerous empirical correlations reported in the literature in which piezocone
penetration measurements (or ratios of measurements) are correlated with undrained shearstrength and/or stress history of cohesive soils. The following paragraphs provide a brief
3 summary of these existing correlations.
5 4.2.2.1 Undrained Shear StrengthThe undrained shear strength, cu, is commonly estimated from the cone resistance, qc,
3 (or corrected cone resistance qT, equation 4.1) using the following equation9 :
CU or cu = qT -r0 (4.2)S = vNk NkT
where ao0 is the total overburden pressure, and Nk, NkT are empirical cone factors.
--I The magnitudes of NkT (or Nk) are backfigured by comparing cone resistance
measurements (qT or q) with some reference profile of undrained shear strength. ForI example, Baligh et al. (1980) report Nk=10-20 (Fig. 4.5a) for uncorrected tip resistance,
q, correlated with field vane strengths, 9CuFV (where g± is a 'standard' correction factor5 introduced by Bjerrum (1972) based on plasticity index, Ip). Aas et al. (1986) report
similar ranges for NkT correlated with CuDSS (i.e. undrained shear strength from laboratory3 direct simple shear tests10) based on data from five sites in Norway, with 1 : OCR < 8.However, the same authors report much higher values of NkT (up to 40) for
overconsolidated clay when the net cone resistance (qT - avo) is normalized with the field
-- vane strength (in this case the field vane strength has been corrected using a factor toaccount for anisotropy, PA; Fig. 4.5c). This discrepancy is loosely attributed to 'strain rate
m3, affects'. Other researchers (Kjekstad et al., 1978; Lunne et al., 1981, 1985; Thomburn et
al., 1981; Rad & Lunne, 1988) report NkT=5- 20 using undrained triaxial compression
9 1n principle, the corrected tip resistance is preferred. However, due to the uncertainties in the reportedcorrection factors, it may be just as satisfactory to use qc and accept the intrinsic bias that then exists in themeasred data.10From recompression type tests.
I

*92
data.Undrained shear strength is also estimated from measured pore pressures using an
empirical pore pressure factor, NAU:
Cu = u - UO (4.3)NAu
where u is the pore pressure measured at some (fixed) reference location on the cone.
Lunne et al. (1985) report values 4 < N, u- 12 from tests on North Sea clays with pore
pressures measured at the base of the cone and undrained shear strength, cuTc (from CAUCtests). Robertson et al. (1988) have reported 0:< NAU <20 from test data in the Vancouver
area. However, the authors do not specificy the source/type of their reference cu profile.
ITheir results (Fig. 4.6) also produce similar ranges of NkT (5 < NkT < 17) as reported
previously by Baligh et al. (1980).3 A third dimensionless cone factor, Nk., was introduced by Senesset et al. (1982) using
both tip resistance and pore pressure measurements:Cu=qT- u (4.4)I Nkc
where u is the pore pressure measured at the base of the cone. The authors report values ofNke --9±3.
In concept, the difference (qT - u) represents some measure of the effective stress
acting in the soil close to the cone. In practice, calculated values of Nke are likely to exhibit3significant scatter especially in soft clays where qT - u, and where there are potentially large
errors in the reported magnitude of qT. Mayne et al. (1990) have recently compiled data
3 from 83 sites in which they show that (for non-fissured clays), u--0.53qT to 0.73qr (forintact clays; Figs. 4.7ab), where u is measured either on the face or at the base of the3I cone. These results suggest that (qr - u) = 0.27q.r to 0.47qT, and hence imply that cu isproportional to the measured cone resistance qT!
3 4.2.2.2 Stress History
The most widely used correlation for OCR is based on the ratio of excess pore
pressure to net tip resistance, Bq, proposed by Senneset et al. (1982), and Jones and Rust(1982):
IBq= u-uo (4.5)qTr - ao0
IU

* 93
U3 In the standard definition of Bq, u is measured at the base of the cone, while qT is the
corrected tip resistance. Wroth (1984) attempts to rationalize the use of Bq by making theanalogy between the shearing of the soil due to cone penetration and the failure of soil in
laboratory shear tests using the following reasoning:
1. OCR is well correlated with the invariant pore pressure parameter, af measured atfailure in laboratory undrained shear tests (Henkel, 1960)11, where:
af =(Au - Au )/Ar = AuJAr (4.6)Au, is the shear induced pore pressure, Aa is the change in mean total stress, and AT is
the change in octahedral shear stress.3 2. For cone penetration, Wroth asserts that the maximum shear stress should be specifiedas a difference of two total stresses and hence advocates (qT - trO) to estimate
undrained shear strength. He also speculates that AuJ/Au reaches a maximum value atlocations above the base of the cone.
3. The parameter Bq is then presented as a 'best available' ratio which is conceptuallysimilar to af.These arguments are, however, misleading for two main reasons: a) at low OCR (<4-18), Au, is only a small proportion of the total excess pore pressure (Au/Au -20-30%;
Baligh, 1986b); while b) (qT - aO0) is controlled by the shear stress at failure (rf) and not by3 the change in shear stress (At).Based on these arguments, there is not a strong fundamental basis for correlating Bq to
OCR, and the published correlations should be regarded as purely empirical. Janiolkowski
et al. (1985) and Robertson et al. (1986, 1988) have evaluated Bqcorrelations from anumber of sites (e.g. Fig. 4.812) and concluded that the value of Bq reflects changes of
I OCR within a soil deposit (e.g. Fig. 4.8a). However, due to differences in sensitivity, andpre-consolidation mechanism, there is no unique relationship between Bq and changes in
3 OCR.
Mayne (1986, 1987) has prescnted direct correlations for OCR using: a) net normalized1 tip resistance, (qc - v0)/O'vo (uncorrected tip resistance; Fig. 4.9a); and b) normalizedexcess pore pressures, (u-uo)/a',o (Fig. 4.9b). Assuming that natural soils exhibit
1 laf is a generalized version of the A parameter introduced by Skempton (1954) for triaxial shear tests.12 The data in figure 4.8b show that 0.3 Bq!1.0. However, the same authors (fig. 4.6) report much higher
Bq values (up to 1.6) in other published work from the same sites. Thus there appear to be discrepancies inthe measured data reported in the literature.
II

94
I
I normalized shear strength properties 13 (as used in SHANSEP analysis, Ladd & Foott,1974); or critical state soil mechanics, Schofield & Wroth, 1968), then:
qT O vo =al(OCR)m (4.7a)'V 0
* orof uu0 = a2(OCR)m (4.7b)0'vO
where al, a2 are empirical coefficients backfigured from test data and m--0.8+0.05 (Ladd,
1989).However, Mayne (1987) implicitly assumes m=1 14 and reports Ic=1/al--0.2 to 0.6
-- (Fig. 4.9a). These results are consistent with previous correlations for undrained strength(i.e. using Nkt=5 to 15, and S=(cuTc/d'v,)Nc--0. 3 ).3 A third type of correlation proposed for OCR uses pore pressures measuredconcurrently at two locations on the cone. For example, Robertson et al. (1986) sketch'conceptual' pore pressure distributions around the cone based on comparisons of datafrom two highly overconsolidated clays (London clay and Taranto clay) with typical resultsfor a 'normally consolidated clay' (Fig. 4.10a). These results prompted Sully et al. (1987)
to correlate (ut - Ub)/Uo with OCR with surprising apparent success at low OCR15 (Fig.4.10b) and huge scatter at high OCR (Fig. 4.10c), while Robertson et al. (1989) haveadopted ut/ub (Fig. 4.1 la) whose true scatter is revealed by Mayne et al. (1990) (Fig.4.1 lb).3U Finally, Konrad and Law (1987) have presented a semi-empirical interpretation of tipresistance and tip pore pressures, (based on similar concepts to the centerline analysis
3- described by Whittle et al, 1989). Konrad and Law estimate that the vertical effective stressat yield, o'yc (i.e. the vertical stress at the elasto-plastic boundary) is identical to the verticaleffective stress at the tip of the cone, (',)tip (Fig. 4.12a). However, in order to use base
pore pressures, Ub, to estimate o'y, they introduce additional correction factors to accountfor cone geometry and interface friction:
13 i.e. For normalized soil behaviour. al=SNkt and az=SNj., where S=(cJs'vc)Nc is the undrained strengthratio of the normally consolidated clay.14Absolute values of m are masked by the scatter in the empirical factors al, a2.15The source of the reported OCR values is not given.
Ia

1 95
3' y¢ qT- alUb (4.8)
1 + M tano'cot2
where O' is the friction angle for shearing of normally consolidated clay at large strain
levels, 8/2 is the half apex angle, M is an interface friction factor and a is used to correctthe base pore pressures (the authors propose M=0.5 to 1.0 and cc=1.0 to 1.33; but actuallyuse M=1.0, a=1.0). Finally, a'yc is correlated directly with u'p obtained from laboratory
oedometer tests on five sensitive Canadian clays (Fig. 4.12b). The results of the study(Fig. 4.12c) show 0.8 5 c'yjO'p < 1.2, for 1 5 OCR <_5. For a given site, the OCR canIbe estimated by iteration using the results from Fig. 4.12b. Preliminary assessment ofequation 4.8 by Jamiolkowski et al. (1989) has been generally positive. However, the3 success of the method depends on the reliability of the measured values of qT and Ub.
34.3. ANALYTICAL PREDICTIONS
4.3.1 Introduction
The previous sections have shown that there are currently a multiplicity of correlationsto estimate undrained shear strength and stress history from piezocone measurements. Theauthors believe that these divergent correlations and the resulting confusion reflect two3 problems. One arises due to the lack of standardization of the piezocone design and testingtechniques. This problem contributes to excessive scatter in reported tip resistance (i.e.,measured versus corrected for unequal area effects) and penetration pore pressures (i.e.,location and size of porous filters and their response times). The second problem arises dueto lack of understanding of the fundamentals affecting piezocone data, even during fullyundrained penetration. That is, which soil properties are most relevant and how should theresponse vary with tip geometry and location of the porous filter?
In previous analyses (using the Strain Path Method), Baligh (1986b), Elghaib (1989),and Whittle et al. (1989) have proposed that tip resistance and tip pore pressures can beU used to estimate the undrained shear strength of clays. In this section, the analyses areextended to include detailed predictions of the stress and pore pressure distributions arounda piezocone penetrometer as a function of overconsolidation ratio and of the soil modelused to represent clay behavior. The aims of the analysis are: a) to provide insight into
I

* 96
I5 possible relationships (and interrelationships) between piezocone measurements and soil
properties (c., OCR); and, b) to evaluate more fully the assumptions used in previous3 centerline solutions. Predictions of effective stresses around the piezocone are achieved
using two generalized effective stress soil models:1. The Modified Cam Clay model (MCC; Roscoe & Burland, 1968) is used as a 'base
--- case' against which the results of a more complex model (MIT-E3) can be compared.Table 4.1 summarizes the input parameters used by MCC and gives specific values3 (Whittle, 1987, 1990) to describe the behavior of Ko -consolidated Boston Blue Clay.
2. The MIT-E3 model (Whittle, 1987, 1990) was developed to describe more realistically3 the behavior of Ko-normally and moderately overconsolidated (OCR < 8) claysobserved in laboratory tests. The MIT-E3 model describes a) strain-softening of clays5 in undrained shearing, b) anisotropic stress-strain-strength, and c) small strain non-linearity for overconsolidated clays. Table 4.2 summarizes the input parameters used
by the model together with selected values for Boston Blue Clay. Detailed evaluations
of model predictions have been shown elsewhere (Whittle, 1990b,c).Finite element solutions of the modified Poisson formulation (Section 2.5) are used to
obtain predictions of excess pore pressures around the penetrometers.
1 4.3.2 Effect of Tip Shape
3 The tip geometry of the standard piezocone has an apex angle, 2&=600. This geometry
was adopted to be consistent with earlier standards for the electrical cone (DeRuiter, 1971).However, apart from the early work at MIT (Baligh et al., 1980; Vivatrat, 1978), there
have been no detailed studies to evaluate the effects of tip geometry on piezocone
predictions.
1 In recent analytical work (Baligh, 1985, 1986a,b; Elghaib, 1989) it has been assumedthat the simple pile geometry can provide a good approximation for the standard 600 cone.3A major advantage of this assumption is that the soil strains can be obtained in closed form(Baligh, 1985; Teh & Houlsby, 1989). Thus, numerical approximations 16 can be avoidedand higher accuracy achieved in the predictions of effective stresses and pore pressures.
Figures 4.13a to d compare strain path predictions of effective stresses and excess pore
3 16 These include the method of 'sources and sinks' (Baligh and Levadoux, 1980), boundary elementAmnel
methods (Williamson, 1989) or finite differences (Teh, 1987).
I

97
pressures for; a) simple pile, b) (standard) 600 cone, and c) the 180 cone1 7. The solutionsare presented for a 'base case analysis' using the MCC model with input parameterscorresponding to Ko-normally consolidated BBC (Ko = 0.48). The figures show the
following:
1. Predictions of radial effective stress d',r/',O Fig. 4.13a) show similar patterns for allthree tip geometries. There are large gradients of Od/O'vo in the immediate vicinity of
the tip (I'rr/d 0- 0.2 at the tip for all three shapes) and immediately above the base ofthe cone. The radial effective stress reaches a maximum value, a'r/d'vO = 0.8, and is
almost constant along the upper face of the cone. Along the shaft, o'f/O'vo - 0.2-0.3for all three tip shapes 18, and are significantly less than KO = 0.48 which exists far
from the penetrometer.2. For the selected base case analysis, changes in the mean effective stressl 9 , a'/a'vo
(Fig. 4.13b) are controlled exclusively by the magnitude of the octahedral shear strain,due to the isotropic yield behavior of the MCC model 20. As a result, there are nochanges in the shear induced pore pressures predicted around the surface of the
penetrometer for the three geometries considered.3. The cavity shear stress (Orr. - (J'eo)/ 2 0'vO (i.e. qh, the maximum shear stress acting in a
horizontal (r, 0) plane) (Fig. 4.13c) reaches a maximum value (qh/'O = 0.3) close to
the base of the 600 cone and simple pile tip. However, for the 180 cone, maximum
cavity shearing occurs over the full face of the cone. At locations above the base,
qh/O''0 - 0 for the simple pile, while qj/a',,O < 0 for the 180 and 600 cones. These
reductions in qh around the shaft can be attributed to details of the strain paths (seeSection 3.2)21.
4. Figure 4.13d shows that large excess pore pressures (u-uo)/a'o > 2-3 are predicted
close to the tips of the penetrometers for all three geometries. For locations around theshaft (e.g. z/R - 15-20) the magnitude (Au/o',O - 1.2 at the shaft) and distribution of
excess pore pressures are very similar and are not affected by tip geometry. For
17The 180 cone was used extensively in field tests presented by Baligh et al. (1980). The standarddilatometer (Chapter 5) also has an apex angle 8 = 18-200.ISAt locations close to the shaft, small differences in effective stresses (Fig. 4.13a) may be due tonumerical errors associate with the 180 and 600 cones.19Tbe shear induced pore pressure, ,AUs a -Ad.20 For the base case analysis, a'/dvo = 0.653 at KO conditions and 0.475 at critical state conditions.

98
locations closer to the tip, there are very high gradients of excess pore pressures which
make interpretation of the contours very difficult. However, it can be seen from the
shape of the contours that the excess pore pressures are approximately constant
between the tip of the penetrometer and the base of the cones. The distribution of
excess pore pressures are very similar at all locations for the simple pile and 600 cones.
For the 180 cone, however, the distribution of excess pore pressures is significantlydifferent. These results imply that the simple pile solutions cannot be used to simulate
conditions around the tip of a sharp cone.Figure 4.14 compares in more detail the excess pore pressures predicted for the three
geometries for three different overconsolidation ratios of the soil (OCR = 1, 2, ant-' 1). Theexcess pore pressures are reported at locations a) along the centerline (ahead of the tip) andsurface of the three penetrometer geometries, and b) radially around the shaft of the
penetrometers at steady state conditions (far above the tip of the penetrometer):1. Distributions of excess pore pressure, predicted for the simple pile and 600 cone
geometries, are very similar at all locations 22: the maximum excess pore pressuresoccur at the tip of the penetrometers and match to within 1% at all OCR's. Theseresults show that prediction of standard piezocone tip pore pressures can be reliablyestimated from simple pile solutions, and confirms the hypothesis used in the centerlineanalyses presented by Elghaib (1989).
2. There are small variations in excess pore pressures (10± %) at locations around the faceof the 600 cones and simple pile. Thus, the pore pressures measured by a filter locatedon the face of the standard piezocone should measure very similar pore pressures to onelocated exactly at the tip.
3. For the 600 cone, there are severe gradients of excess pore pressures predicted close tothe base of the cone (z/R - 1.7). These effects become more pronounced as OCR
increases. In contrast, for the simple pile, there is a more gradual decrease in excesspore pressures in this same region. This result indicates that pore pressures measured3at or close to the base of a 600 cone can exhibit significant scatter depending on the
exact location and size of the porous filter.4. For the 180 cone, excess pore pressures are approximately constant over the face of the
cone for z/R > 1.5 (Aum/ 'v0 occurs close to the base of the cone, z/R - 6.3) and are
" 22 Differences up to 15% reported around the shaft may be due, in part, to numerical errors for the 600 cone.
I

99
similar in magnitude to the maximum pore pressures predicted by the 600 cone and
simple pile geometry. There are large gradients of excess pore pressures very close to
the tip of the 180 cone (0 < z/R < 1.5). Thus, tip pore pressures (at z/R = 0) for the 180
cone will be less reliable than those measured on the face of the cone.
The results in figures 4.13 and 4.14 have shown the similarity of effective stresses
and excess pore pressures for the simple pile and 600 cone geometries. Based on these
predictions, it can be expected that the tip resistance 23, qc, will be similar for the two
geometries:
qc (pn sin ot + pt cosa)I(. ot) dA(4.9)
ixR2 fwhere Pn, Pt are the normal and tangential (total) interface tractions acting around the
penetrometer face; (x is the cone half-angle; and A is the surface area of the face.
The distributions of interface tractions are computed from the predicted effective
stresses and pore pressures (e.g., Fig. 4.13 for OCR = 1 case). Table 4.3 summarizes thenormalized net cone resistance (q, - ao)/ o'vo for: a) the simple pile, b) the 600 cone
penetrometer, and c) the centerline analyses, q, = ((;.)tip, used by Elghaib (1989) (for a
simple pile geometry). The results show that the tip resistance of the simple pile is typically
5 - 10 % larger than the tip resistance of the 600 cone. For the base case analyses,
centerline solutions compute a tip resistance which is approximately the average of theg simple pile and 600 cone values. These results show that the much simpler centerline
approximation can be used to provide reasonable estimates of tip resistance. However, this
conclusion from analyses using the MCC soil model needs to be checked for a more
realistic soil model (such as MIT-E3).
Based on the above comparisons, the simple pile geometry can be used reliably to
3 estimate the performance of a standard piezocone with 600 apex angle. Hence, the simple
pile geometry is used throughout the remainder of this chapter.
I 4.3.3 Effect of Stress History
I Figures 4.15a to d show predictions of the effective stresses and pore pressures around
I 23Note: qc a qT in analytical predictions.
I

1 100
I5 the simple pile for the base case analysis (MCC model, Ko-consolidated BBC) at OCR's =
1, 2 and 4. The results show the following:1. Excess pore pressures, Au/ O',0 (Fig. 4.15d) increase very significantly with OCR. At
the tip of the simple pile, excess pore pressures increase from Au/ O',o = 2.7 at OCR =1, to 6.2 at OCR = 424. More modest changes occur at locations around the pile shaft(Au/ a',0 = 1.2 at OCR = 1, to 2.3 at OCR = 4)25. These results show clearly that
filter locations on the tip or face of the piezocone should be more sensitive to changes in
OCR in a particular deposit than filters located on the shaft. More detailed study of the
predictions in figure 4.15d shows that as OCR increases the zone of disturbance (i.e. of3 excess pore pressures) decreases. This result can be attributed, in large part, to linear
pre-yield behavior of the MCC model26.2. Contours of radial effective stress, a'rr/',o (Fig. 4.15a) show spatial variations that
are qualitatively similar for all OCR's. Maximum values of o',/A',0 occur on thepenetrometer at z/R- 0 to 0.5. For locations around the shaft (at z/R > 10), the radialeffective stress is lower than K0 at OCR=1 (i.e. a',,/a',0 = 0.3 vs. K0 = 0.48), but ishigher than K0 at OCR = 4 (i.e. o'n/a',o = 1.1 vs. Ko = 0.75). It is also important to
3_ note that there are large variations in radial effective stresses in the region 0 < z,/R < 7.5where the friction sleeve is located in standard cone designs. These results mayI] account for some of the scatter observed in measurements of f.
3. Changes in mean effective stress (i.e. shear induced pore pressures) are related to thecritical state conditions described by the MCC model. The magnitude of 07 O',0I- increases substantially with OCR, but is approximately constant at all locations around
the simple pile as the large strains produce critical state conditions. Similarly, contoursof cavity shear stress, qh/o',0 (Fig. 4.15c) are qualitatively similar for all OCR's.
3- 4.3.4 Effect of Soil Model
Whittle (1987, 1990b) has shown that more realistic predictions of the behavior of Ko-consolidated BBC (with 1< OCR < 8) measured in laboratory tests can be achieved usingI the MIT-E3 soil model. Figures 4.16a to d show predictions of the effective stresses and
2lThere are also large increases in tip resistance as shown in Table 4.3.25Similar results are also obtained for 180 and 600 cones in Fig. 4.14.2 6i.e. for E < Ey, the yield strain, MCC predicts no excess pore pressures in the soil.
U!

1 101I
3excess pore pressures around the simple pile for OCR's = 1, 2 and 4. When compared
with the predictions for the MCC model (Fig. 4.15) the following effects of soil model can
be observed:
1. At a given OCR, the MIT-E3 model predicts much lower values of radial effectivestress, a'r/O ,o (Fig. 4.16a) acting on the penetrometer than MCC. At OCR's = 1 and2, (;'n/a'v0 < 0.3 at all locations around the simple pile. At OCR = 4, the pattern ofradial effective stress contours is similar for both MIT-E3 and MCC soil models.
i These results are due primarily to strain-softening described by MIT-E3.2. For MIT-E3, the mean effective stress, o'/'vo (Fig. 4.16b) decreases from a
Smaximum value at the tip of the pile, to a minimum value on the pile shaft. Hence, the
maximum shear-induced pore pressures are along the pile shaft. These results reflect3anisotropic behavior of the MIT-E3 model27. These predictions are significantly more
complex than results from the MCC model for which 'critical state' conditions are
uniquely defined (at a given OCR).
3. Distributions of cavity shear stress, qh/a'vo (Fig. 4.16c) predicted by MIT-E3 are
qualitatively similar to results for the MCC model and reflect the strain history for thesimple pile geometry. Differences in magnitudes of qd/o reflect anisotropic shear
strength of MIT-E3 (i.e. for shearing in the r-0 plane). Along the shaft (z/R > 5),
qh/a''o =>O for both soil models and 1:< OCR 4.4. For OCR's = 1 and 2, the M1T-E3 model predicts that maximum excess pore pressures
(Fig. 4.16d) occur at locations along the face of the cone (excess pore pressures on the
face are up to 20% larger than tip pore pressures). These results are shown more
clearly in figure 4.17. The excess pore pressures around the face (-0.5 < z/R < 1.7) are
up to 40% lower for the MIT-E3 model as compared to MCC results. Thesedifferences are due primarily to strain softening and anisotropic behavior of MIT-E3, as3 described above 28. At locations far above the tip, however, the two soil models givevery similar predictions of excess pore pressures acting on the shaft of the3 penetrometer. The MIT-E3 model also predicts a much larger zone of disturbance(excess pore pressure) around the penetrometer, due primarily to small strain non-
271n this case, a'/a'vo is no longer uniquely defined at critical state conditions. Similar results were alsopresented by Baligh and Levadoux (1980) for the anisotropic MIT-TI total stress soil model.28 The predictions shown in Fig. 4.16d also imply limitations in the centerline analyses which require~further investigation.

102
linearity. At OCR = 4, the maximum excess pore pressures predicted by MIT-E3 areonly 10% lower than those for the MCC model. In this case, strain softening effects are
minimized and inelastic behavior occurs much closer to the pile, hence differences
between the two soil models become less significant.
4.3.5 Summary
The analytical predictions described in the previous sections provide a basis for
evaluating which engineering properties of cohesive soils can be estimated from piezocone
measurements and what interpretation techniques are best suited for making these
estimates. Table 4.4 summarizes the analytical predictions of net tip resistance and excess
pore pressures for Ko-consolidated BBC using the two effective stress soil models (MCC
and MIT-E3) at OCR's 1, 2 and 4. The assumptions used to construct this table are as
follows:
1. The simple pile geometry can be used to simulate stresses and pore pressure
distributions around a 600 cone penetrometer (Fig. 4.18). Partial predictions for the1 600 cone are included for comparison.
2. The (net) tip resistance is estimated by integrating the surface tractions from equation
U4.9.3. Four representative locations of pore pressure filter are considered (ul, u2, u3, u4; Fig.
4.18). It is assumed that the pore pressures measured at the tip or on the face of the
cone are very similar in magnitude (ul) and are equal to the maximum pore pressures
predicted analytically.4. The pore pressure, u2, is measured at z/R = 1.73 for both the simple pile and 600
cones. Table 4.4 compares simple pile and 600 cone predictions for (u2-u0)/a'V0 using
3the MCC model. For the 60( cone, a range of values must be specified due to the
severe gradients of excess pore pressures in this region (Fig. 4.14).3 5. Pore pressure measurements U3 and u4 correspond to positions approximately at the
top of the standard friction sleeve and at steady state conditions around the shaft,
respectively.
Table 4.4 also summarizes ratios of the predicted measurements which have been used
previously in empirical correlations (see section 4.2.3).

1[ 103
p4.4 INTERPRETATION OF ENGINEERING PROPERTIES FROM PREDICTIONS
i In this section, the correlations between undrained shear strength and OCR are
compared systematically with (predicted) piezocone measurements.
Correlations can be classified according to: a) the functional relationship between the
measurement and soil property of interest; and, b) the range of applicability of thecorrelation (range of measurements, soil properties and soil types). For an 'ideal'Icorrelation, the measurement is directly proportional to the engineering property of interestand the correlation is universally applicable. Correlations of this type can be evaluateddirectly from the predictions in table 4.4. However, the existence of more complexfunctional relationships between the measurement and the soil property can only be3 evaluated by comparing predictions directly with field data from well-documented sites, as
discussed in Section 4.5.It is important to emphasize that the interpretations described in this section are based
on the predictions in table 4.4 and contain certain limitations: a) the analyses have beenperformed for one particular type of soil (BBC), with 1 < OCR 5 4; and b) predictions ofpore pressures around the piezocone using strain path analyses are obtained by approximatemethods (Chapter 2). Differences in predictions from the two soil models can be attributed
to complex aspects of soil behavior (e.g., strain softening, anisotropy, etc)29, and provideinitial insight into the effects of soil type on piezocone measurements 30.
14.4.1 Undrained Shear StrengthFrom the results shown in table 4.4, it can be seen that changes in the undrained
strength ratio, cUTC/'v0 correlate most closely with the net tip resistance, (qt - av0)/a'v0,
and tip pore pressures, (ut - uo)/d'o. Excess pore pressures measured at other locations3_-- around the cone (u2, u3, u4) are much less sensitive to changes in undrained shear strength.
Table 4.5 summarizes the predicted ratios3 1 , (qt - avo)/cuTc = Nk; (uI - uo)/cuTc = N 1u) ;
and (u2 - uo)/cuTc N2 . For an ideal correlation, Nk (or NiA should be constant for all
29However, both MCC and M1T-E3 assume normalized clay behavior and neither describes rate effectsI (creep or suain rate dependent properties).30Further studies are currently in progress to generate solutions for different types of soil. having stress-strain characteristics quite different from BBC.S31 The notation Nk, N&u 0 1, 2, ...) is consistent with previous empirical correlations, see section 4.2.
I

*i 104
pIOCR's and for both soil models. The results show the following:
1. For the MCC model, Nk = 7.75 ± 0.25, which is within the lower range of values
quoted previously from empirical correlations (e.g. Rad & Lunne, 1988) and from thecenterline analyses (Elghaib, 1989). The MIT-E3 model predicts much lower tip
I resistance factors; Nk = 4.9 ± 0.5. Differences between MCC and M1T-E3 are due, inlarge part, to the strain softening (sensitive) clay behavior modeled by MIT-E3. Theseresults are consistent with field data reported by Ladanyi and Eden (1969)32 and
m others, and also with centerline analyses of Elghaib (1989) (also discussed by Whittleet al., 1989). Overall, the predictions in table 4.5 suggest that undrained shear strengthcan be correlated directly with the net tip resistance (qt - o0) for a given soil. Thus, tip
resistance measurements can be used to estimate variations in undrained shear strengthwithin a particular soil deposit. However, the analytical predictions imply that themagnitudes of the undrained shear strength can be affected significantly by soil
3sensitivity.2. The predicted tip pore pressure factors, Nau (Tab. 4.5), are similar in magnitude for
I both MCC and MIT-E3 models33 (N u = 7.2 ± 1.2 for MCC, Nu = 5.0 ± 0.6 forMIT-E3). This result confirms earlier observations (Baligh, 1986b) that shear inducedpore pressures represent a small fraction of the excess pore pressures at the tip of the
penetrometer; hence, the ratio (u, - uO )/( qt - cr0 ) (Tab. 4.4) varies over a very small
range (1.29 to 0.77).
3. Excess pore pressures measured at the base of the cone (u2 - uo ) are 10 to 40% smallerthan tip pore pressures (Tab. 4.4). Direct correlations with undrained shear strength
2are significantly less reliable (e.g. NAU = 5.0 ± 1.3 for MCC model) than thosepredicted for tip pore pressures or net tip resistance.3 Further direct correlations can be considered from differences in the measured tip
resistance and pore pressures; (qt - ui)/CuTc = NL (following the notation of Senesset at al.,1982). In this case, results from the MCC model (Tab. 4.5) suggest that cuTc can be
estimated from either N 1 = 2.55 ± 0.05 or N 2 = 4.9 ± 0.1. However, these predictions
m3 2 For sensitive Canadian clays33 The predictions actually show more scatter in the N'u values than in Nk. In practice, however, errorsin correcting the tip resistance (qc=> qT ) may make ul a more reliable measurement.
i
I

105
can be directly linked to assumptions of critical state behavior in the MCC model. ForI[ MIT-E3, values of Nke are more variable due to the anisotropic properties described in
section 4.3.4. However, N2e values have the same variation as N I" Thus, if base pore
pressures are measured, (qt - u2) provides a somewhat better correlation for undrained
i shear strength than (u2 - uo ) according to the MIT-E3 predictions.
4.4.2 Stress History
Using similar reasoning to the previous section, ideal correlations would show thatpiezocone measurements are proportional to the preconsolidation pressure, u'p. In table1 4.6, the (predicted) piezocone measurements are normalized by a' to form a set ofdimensionaless ratios ( Mix, comparable to Ni developed in Tab. 4.5 for CuTC). Inspection
of these results shows the following:
1. Qualitatively, the results presented in tables 4.5 and 4.6 are very similar. Hence, (qt -•O o) and (uI - uo ) are the most reliable measurements to estimate O'p.
2. For a given piezocone measurement (e.g. tip pore pressures, ul), there is a greaterscatter in the corresponding dimensionless ratio for a'p than for cuTC (i.e. there is more
I scatter in M!,u than in N' ). Thus, for a given soil deposit, the piezocone is a more
sensitive indicator of changes in undrained shear strength, cuTc, than of changes inpreconsolidation pressure, op. However, the use of ratios such as Bq, to estimate
OCR, can only be considered by comparison with measured data, as discussed in the
3 next section.
3 4.5 COMPARISON WITH MEASURED DATA
In this section, the analytical predictions of piezocone measurements (Tab. 4.4) are
I compared directly with field data for Boston Blue Clay from two separate sites. Thesecomparisons: a) illustrate capabilities and limitations of the strain path analyses for3 predicting the tip resistance and pore pressure measured by a piezocone; and b) enable the
correlations proposed in the previous section to be evaluated.Piezocone data have been obtained at two test sites containing deep layers of relatively
uniform BBC:3 1. Station 246 of the 1-95 test embankment in Saugus, Massachusetts. This site has been

106
extensively studied in conjunction with the development of in-situ test devices (e.g.Baligh et al., 1978; Vivatrat, 1978; Morrison, 1984). Extensive field and laboratorytesting has been carried out at the site to establish stratigraphy and engineering
properties 34 of the site. Figure 4.19a shows the soil profile, index properties andstress history at the site. In-situ overconsolidation ratios range from OCR = 7 at depth
d = 30 ft. to OCR = 1.23 at d = 120 ft. However, soil conditions are most uniformfrom d = 75 to 120 ft. in which the in-situ OCR ranges from 1.2 to 1.35 (Morrison,1984). Piezocone data at the site, reported by Vivatrat (1978), Baligh et al. (1980),include a) the uncorrected tip resistance, q,, and b) the tip pore pressures, ul. Baligh etal. (1981) subsequently corrected the tip resistance using the tip pore pressures:
qT =qc+ 0.3ul (4.11)The corrected tip resistance is presented in this section. Baligh et al. (1980) also report
pore pressures at four filter locations around an 180 cone penetrometer. These data
have been discussed by Whittle and Aubeny (1990) (Appendix B) and are not
considered further in this section.2. South Boston Special Test Program for the Central ArteryfThird Harbor Tunnel (CAM
project 35. This site, located in South Boston immediately adjacent to the proposedroute of a thrird harbour tunnel has been extensively studied by Haley and Aldrich, Inc.and by on-going research at MIT36. Figure 4.19b summarizes the index properties andstress history at the test site obtained from extensive oedometer and continuous loading
consolidation tests37. In-situ OCR's at the site range from OCR - 5 at elevation 38 El.= 65 ft. to OCR = 1.1 at El. = -20 ft. The soil is significantly more sensitive belowelevation, El. = 20 ft. Piezocone data were obtained at two locations and include: a)
corrected tip resistance; and b) pore pressures at the base of the cone, u2.Figures 4.20a, b compare analytical predictions of the net tip resistance with the
measured data, (qT - ar 0)/ o',o at the two sites:
1. The reported measurements are average values recorded over 5 ft. intervals from the
34 Unfortunately, there are no data for CuTC at this site.35For the South Boston site, both the piezocone data and the OCR profile are based on preliminaryanalyses that are currently being refined and show less scatter than indicated in Fig. 4.19b. These datashould not be used or reproduced by other persons.36This project is supported by a contract with Haley & Aldrich, Inc., Cambridge, MA.37Laboratory shear strength tests are currently in progress.38Elevations in the figure are quoted with respect to Boston City Base (BCB).
I

107
original penetration records. Error bars represent maximum and minimum measureddata (over the same interval). Scatter in the overconsolidation ratio is based on thelaboratory test datashown in figure 4.19.
2. The analytical predictions are directly from table 4.4. Input parameters for the MCCand MIT-E3 models (Tabs. 4.1 and 4.2, respectively) are based primarily on laboratorytest data on resedimented BBC.
3. The most noticeable observation from figure 4.20 is that the test data from the two sitesare not consistent. The net tip resistance (at a given OCR) is significantly (30 - 50%)higher at the Saugus site than at South Boston. The source of these differences may bepartly attributed to uncertainties in the 'true' tip resistance at the Saugus site. Furtherinvestigation is required to establish other possible causes of this discrepancy.
4. The analytical predictions using the MCC model match the measured data veryconsistently at the Saugus site, while MIT-E3 underpredicts the net tip resistance. AtSouth Boston, good agreement is found using the MIT-E3 model, while MCCoverpredicts the measured data. If both sets of measurements are reliable, then thesetrends suggest significant differences in soil properties at the two sites (either sensitivityor stiffness). In both cases, the net tip resistance increases significantly with OCR aspredicted from the strain path analyses.Figures 4.2 1a and b compare the analytical predictions with the measured excess pore
pressures at the two sites. At the Saugus site the MCC model gives excellent agreementwith tip pore pressures (u, - uo)/a',0, while MIT-E3 underpredicts the measurements by
up to 50% for OCR :5 2. The measured data confirm the sensitivity of the tip porepressures to changes in overconsolidation ratio, as predicted by the strain path analyses. AtSouth Boston, the base pore pressures show very little variation with OCR and henceconfirm previous assessments that preconsolidation pressures cannot be reliably estimatedfrom the (u2 - uo) data. Analytical predictions for both soil models underpredict themeasured data at OCR 4.
The differences in tip resistance and piezocone pore pressures (i.e. (qT-uj)/a'v0 fromSaugus and (qT-u2)/a'vO from South Boston; Fig. 4.22) both show well defined trends
with OCR. Analytical predictions from the MCC model are in excellent agreement with the
data at Saugus, but significantly overpredict the behavior measured at South Boston. Incontrast, MIT-E3 gives better matching with South Boston data and does not describecorrectly the trends measured at Saugus.

_ 108
Finally, the ratios of excess pore pressure to net tip resistance are considered in figures4.23a and b. The data from the Saugus site (BA ; using tip pore pressures) show a
consistent decrease with OCR and range from Bq 1.1 at OCR-1.2 to 0.8 at OCR = 4.
Predictions using the MCC model again show excellent agreement with these data, while
MIT-E3 gives a consistently higher value of BI. At South Boston, the B2 ratio (this is the
more common ratio presented in empirical correlations after Senneset et al., 1982) shows
much larger changes with OCR, ranging from Bq2 = 1.7 at OCR = 1.1, to 0.6 at OCR - 5.
In this case both the MCC and MIT-E3 models significantly underpredicts the measured
ratio at OCR < 2. However, MIT-E3 predicts higher values of B2 and is more consistent
with the trends in the measured data.
Overall, the results in figure 4.23 are consistent with earlier observations that BBC atthe South Boston site may exhibit significantly different properties to the materialunderlying the Saugus site. In particular, the clay at South Boston appears to be moresensitive at low OCR and is therefore better described by the MIT-E3 analyses. More
definitive results are expected as further test data become available.

109
I
Test Type Parameter/ Physical contribution/ Boston Blue
ISymbol meaning Clay
eo Void ratio at reference stress on virgin 1.12consolidation line
I Oedometer or CRS Compressibility of virgin normally 0.184consolidated clay
I Compressibility of overconsolidated clay 0.034
I Undrained Triaxial O'TC Critical state friction angles in b'iaxial 33.40
compression(OCR=l; CKoUC)
K0 -oedometer or 2G/K Ratio of elastic shear to bulk modulus 1.05o -(Poisson's ratio for intial unload)K0 -4iaxial _ __put M i o e dC oI
i Table 4.1 Input Material Properties used by the MCC Model
IIIIII

I 110
Uq %O'S 00 1 0
0* 0 0
Ij Cc
.14
IV
.g CA~
IV CA.z
06
be --
:D II I
CO __ _ _ __ _ _ t

Predictions of Net Tip Resistance, qt cTvo
UOCR Simple Pile 600 Cone CenterlineU Analysis
31.0 2.65 2.50 2.61
2.0 4.77 4.44 4.66
4.0 8.43 7.71 F 8.07
H *Effective stresses from MCC model for Ko-consolidated BBC
Pore pressures from modified Poisson formulation
Table 4.3 Comparison of tip resistance predictions using the Strain Path Method

112
0n 0% 0%05 ON6 0r0 W
3 0- wl t-* % 00
or- 0 0 r 0 WO 0 0 0
r- 00 0' 0 - %
000
ON 00* _It 00 ON'0 e
0
100 N%'0
*00
"- r 00 Ifn 0%
00) _ _ _0 r-
00 00 C-I~ U6l 6' 4 S6oo8

113
cr00 0 0
z
06 ( rI vi r i'4 - r 0 q
00 WO x" 00 C
9o II
Z *
0~
00 0 o- V 0 - V
( Cl
c~0

114
U+
e 0 00 0 cn
0 - t 00 r- UI
en tn m i
> 0

3 115
WATER SEAL- SOIL SEAL
UFRICTION SLEEVE BEARING
LOAD CELL LOAD CELL
Figure 4. Ia. Typical Electrical Cone (Schaap and Zuidberg, 1982)
IbFiue43b oepeuepoe Trtn n 95 is ta. 95

116
PRESSURE TRANSDUCER
IT~N4A)GSA-MFOR TIP LOAD CELL
PRESSURE TRANSDUCER
IE1 / STRAIN GAUGES
FOR TIP LOAD CELL
PRESSURE TRANSDUCER
FOR TIP LOAD CELLSTN
Figure 4.2 Examples of piezocones

117
ONN
00 ON 0
r- r- m) Z;0
CON (I) -
) m w
1- CLu) - E
o m -0
I - ' U)a) 4) a) a) >
L-j
4-)
a) U-0m 0 r
I~4 4__ _ P__ _ _ _ _ _ _ _ _ _ _ _ _ _ _ _ a)
mI2U)UI

118
SLEEVE. A,
U WATER4 SEALS
NETAIWA RAT8O. A,
FWPJII VIE LedeOUA&L END AA
Figure 4.4a. Unequal surface areas of cones (Battagio and Mamascaldo, 1983)
Fr-Cf.04, S-e~e
3 \Co'e w.)
U Figure 4.4b Unequal surface area of cones (Sills et al., 1989)

119
U I$
|o---------------I, T,
3 0,
to . lieea MLly TES T I0 $!!t; ~ j~:
x 1"4O ll" A Scr l. III&Ii I *SIOOA
a I t 0o 40 Z0 ,O 10 goPLASTICITY INOME, Pt %
a) su = psu (FV) (From Baligh et al., 1980)
Y15T SIT9 l*t/. TEST SIrE IR I
vestfhsse 3.7 Orfe. 3 23-3230 smerstd 3-10 "es I 3S-tSOrsoage t 7-12 On~ey [ 3-.
Nags 12.10 0se1 I t0-S@
ON_ _ I O.sey I 1.0
IS 200 . s 0%b) sus,-. aB,(S (From 'a et,. a., 1986)
"'"-. - . .,.l.'.-
10 O -
hl}i/)eue -.IUEE
20
0 10 20 30 tO Sg IIV.I,
b) s = s(LAB)=s(DSS) (From Aas et al., 1986)F
20 - _ !. .. ..
oS 10 20 30 40 50 I' 1/)
I C) Su = PA Su(FV) (From Asu et al., 1986)
I- Figure 4.5 Cone resistance factor, Nk
I

120
a 02 . as 0 1 U0
POEWHU MEPAWE.I I%
N A,4G v ersus Bq(rm apn aadRoeton 98
Fiue46 PrUrsuefcor &(oeto ta. 96

121.3 Intact
bu u/qT:O.53 4
(n,166, r2=0.897,Ledo SO= 0. 148)
/behind ublqT%0. 5 3 7 -
2-pU~ (n=70. rZzO.912. 0 -t lP, ubi
U6 0 SD*0.091) 1o 1 Old
00
0 +0 -L
I o ,++ (~ f+ Microfissured
Silts Fissured
0 I 2 3 4 5Corrected Cone -Tip Resistance, q T (MPG)
Ledo
3- ut/qT=0.639 0(n=24, rZ:0.977, 1100,•S ... S 0.079) - "I/
, Inta ct L 01 I'llSut/qT =0.728
c, 2 (nz 166 r =0955,RSDO0. 167)I - - a
al V19/ , MicrofissuredI
0 m[,L"L -~~Fissured
midtip 0
(/6(! =0II I II ! I L I
0 2 3 4 5
Corrected Cone-Tip Resistance, qT(MPo)Figure 4.7 Relationships between tip resistance, qT and measured pore pressures
(Mayne et al., 1990)

122
OVERCONSOLIDATION PORE PRESSURERATIO OCR COEFFICIENT Bq
62 3 4 5 7 0.4 0.8 1.2 1.6
8 8, Bqm~u
12 - 12,/5E 14 14) : '
-16 16
S18 -- -1U022- 22 22--
24 24
-262I28 8 '
12 " - 0 STANDAR D TIP *
30' - umax MEASUREDI AT CONE TIP
32 w 1 32 -Qt.Qc*o. 2 Urix
z1m) z m)
a) BBC site
OVERCONSOLIDAnON PORE PRESSURERATIO OCR COEFFICIENT Bq
01 3 -5 7 i 0 0.5 0.7 0.9
- -q -- II V
10 12 _W 12 ' 12 .X"t 14 4 -
l ;- 1 ,,6M 18 U 1 LvmMw#
20 0,
zcmV z~m)
I* THE WRITERS ARE NOT AWARE IF Qc U eb HAS ALREAOC89EN CORRECTED OR 4u EFFECT
b) Ons~y site
Figure 4.8a Evaluation of Bq parameter with OCR (Jarniolkowski et al., 1985)

1 123
1 0 Inc easing
*.~*semlSt" Range prea.cted
06%IEIn 0 02
o 4 Increasing
Sltresrto0'CRi
I OC 10<)Gloujcester
<m VarennesU (72 NRC f KOnrad & La.. 1987
3 St Marcel
Figure 4.8b Evaluation of Bq parmneter With OCR (Robertson et al., 1989)

124
I0
zK0
100:-
50 OCR06
C, ,O.
* P I I ,,, '
* 0
z / '2 /
(q:--rO=, .) •NORMALIZED NET CONE
Um 20- 010
* ( M
II Figure 4.9a correlation between net tip resistance and OCR (Mayne, 1987)
IUIU

125
C-)
o x 0
WO 23 -Jc
gO 0 <:D*to Mt
U
<lb
0 C
UUxCw0
I oI
0 .- i n .
0 a:
SIS31
I NOIIVOI'1OSNOO WO(NJ~

126
London Clay -cVme.tt :321 -U
Normnally Tratra
Heavilysensrtlvelclay
over consoi-daled Clay Heavily over cl) sc.Oa~tO
Below 8m Aoove 8 m Bl-
I00u U
Figure~~ 4.1O ocpuldsrbuino oepesr run izc Rbrsne
al., 1986
6 /
3 -
3 0 1 2*- 3-
$0 LONONCL ut0
4 YV(
40
So- ~ 1 I * 1
Figure 4. l0b. Correation of pore pressure difference with OCR (Sully et al., 1987)

127
5 0
1.0/F
IV /
r 4
Intact M500.4 0j
1 0 1 05 0OCR *
Figure 4.1 a Correlation of pore pressure ratio with OCR (Robeto et al., 199)

128
0[
080
0-0 Glocete
0 0 a o c e l e r
02 3 46
* St Marce
Figure 4. 2b O C R fro m ver ical yield t ve s tK ores adsa , 9 7
I~h B
p (a,
A-
(aI.+U , + 7, 0
UOla +eisa Aug eQb
Fi u e .12 tr s at s ofi eai ed s i ee ens atc netp (K n ad a d a ,09 7I(I O

__ __ _ __ _ _ __ __ _129 __ _ _ _
IIC\j
- o
C) 0
I I>*0b 06 2
0 0C0
020
> CL0
OICICPI0t
I~_ _ _ _ _ _ _ _ _ _ .t

130 _ _ _
0 a I
>~ 00
IIC*%D
o> (O&
b______
U,)
TU
I00 00
U)I t
C)I _______4
*8/Z
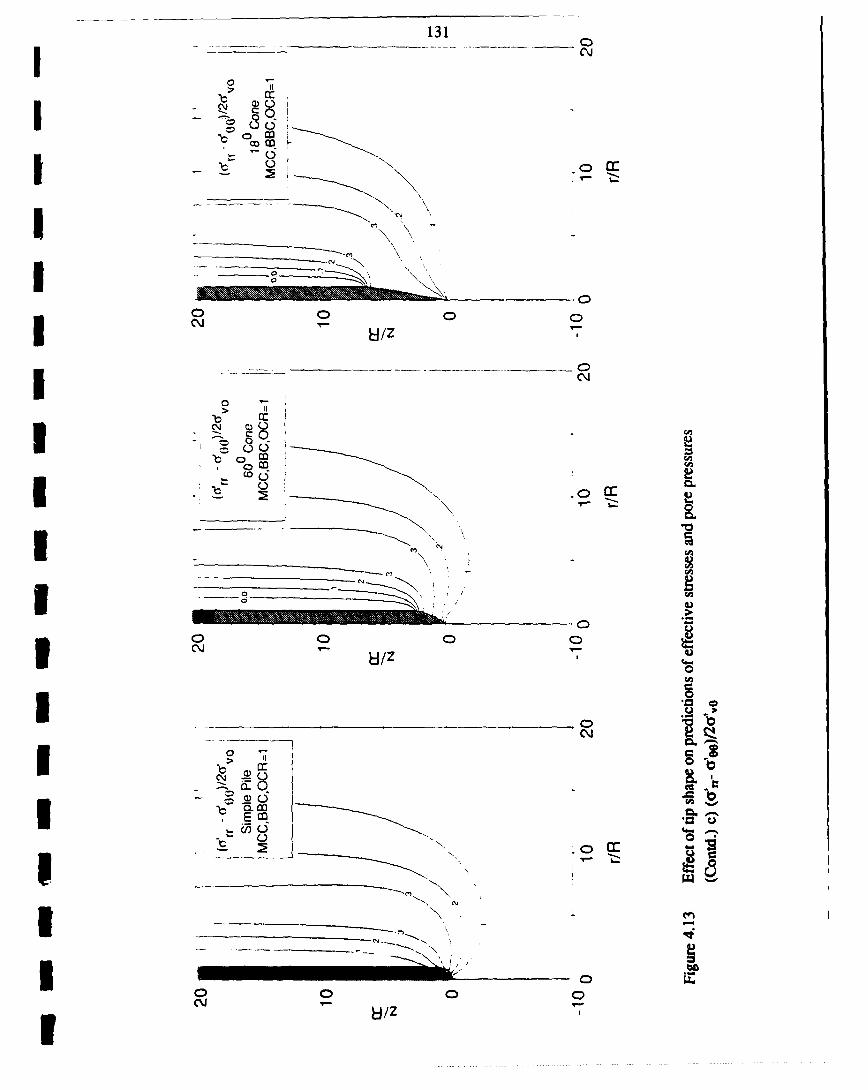
0 7
a ND
coC
(4o -)
c- o
IMI,0 L,
0I C\J 4.
01 _ _ _ _ _ _ _ _ _ _ _ _ _ _ _ _ _ .7a
U -
-C c'~ 8/Z

132
-0
o0 0 0
CM~
* 0 cr
C)C-
0 co
00
1 10
> 0
L CO\81E coC:

I 133
z/R
0 In 0 LO 0 n 0
0 (sA Vco
o~C o*0 Q ~c.
C-)-
0 -Y 0II0 4M
00
IU 04>C.
OD
a C O c o
CLN
I 0.
7 0U)~~W > ) i
C 0 - nInaE~I0
.......I ..

I ______134
ci,
CNC
CC~J
0
0 /U
U/
I 0
0) 0
C~CC

1 - 135_ _ _
_______C\j
I cE cio
CL..1 1/Z
II
00"&_ __ _ U CO
CCC
I U/

136
0
a - .
I _ -COC
.,.-coo.- .. . .................
0 C 00
a- o
I Gno o
iE co >Iz o
000
>Co
0 cc 0
ID cc eI'
gU
I~ /

13
I>o
C)
c'J u/zC\J
0
0 ) a:.4
(L 00 0 0
E CO
C~ 0I 8/Z

_ _ 138
.o 0
> CL
00 00
(8/J
cJ
c4.)__ __ __ __ __ __ __ _ cca
0 0
_____8/_

113
a:&
CL Co
-b E
0 C0 0 0
S~ C1
C: I
0/ a.

140 __ _ _
00
00
o
C/
.~CC
-~ CD
- CDH/~c I-j
00I 0 0 0>C\J C)
CO~I _ _ _ _ _ _ _ _ _ _ _ _ _ __oclIIIub-~0c-
Id/0 a /
CL II _ _ _ _ _ _ /l/
UI W -00 0 0a0
C'J 1I u/z
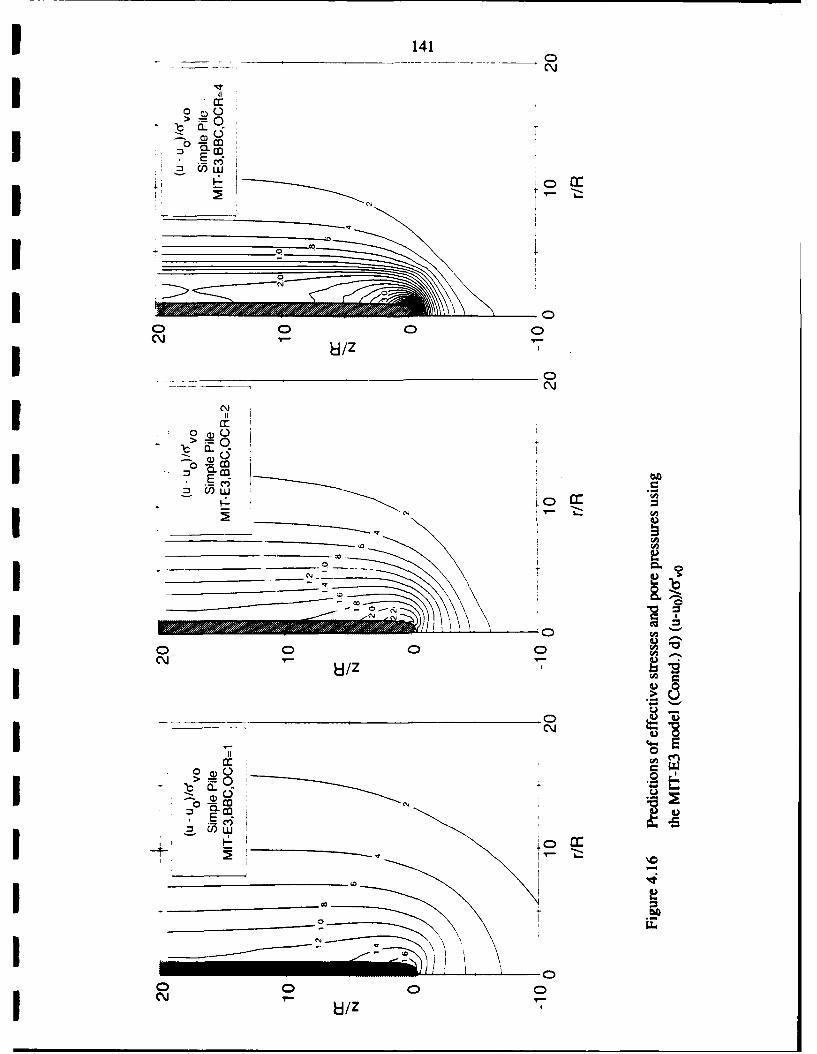
1 1410
cc'0 )
1E 0
00
o C)
> 0
0 CL 0
C'J 0
0 C00
I CCLE0
ICIO? I/

142
I2.52.12 Simple Pile OCR=4 .'OCR-
1. MCBBC Simple Pile 20 CBC2 2 MIT-E3, BBC"0 > 15 %.I
0.5 -.
02
15- MCC,BB BBC 15
10- OCR= 10
ccOCR=OC=5-OCR=2 5
N OR=4.../ R=4 30 ...... 0
1 -5
1 __ __10_ _ __ __ _ -108 7 6 543 210 01 23 45 67 8I(u-u
0) /d vo (u-u0) /e
IFigure 4.17 Effect of soil model on distributions of excess pore pressures

143
I z/R
60 0CnN,, simple Pile
1 12.5 UIaR R
7.5
IU 7
U Face/tip) r/R
IFigure 4.18 Definitions used to interpret predictions of piezocone pore pressures

144
IW 4& Hd3(]
I r .
o u - ~- - -00
>IIFW
co
I 01zU
ILz 11111
~0
I~ 'H.ld30

145
IO
00E'b- >
b .
o u
00IZo 0e
0 05 <5 5 5
- 2cc M
0 _
>7
11 14CII
0
co o M 0 00m0,UCO ~l WO M

146
10.Piezocono Data-BBC-SaugusMA MOC
8 (Vivatrat.1978)
IfI
2
1 OCR 1
~~10
South Boston (BBC)18 (Ladd. 1990)MC
-6
1 1
II-E

147
10
Piezocone DataBBC-Saugus, MA
8 (Vivatrat, 1978)
011b_> 6
0
CMCC
2
0 1 0 . I I
OCR 1
pressursin (BBC

148
1 5Piezocone Data1 4 BBC, Saugus, MA'0-(Vivatrat, 1978)
I32 1
II-E
OC1 10
>3
II-E
Piezocone Data0 South Boston (BBC)
(Ladd, 1990)
1 1OCR 10
Figure 4.22 Comparison of predictions and measured data for the effective tip resistancein BBC

149
2
Piezocon. Data1.6 BBC-Saugus,MA1.6 (Vivatrat, 1978)
Icr1.2 MrE
I 0.8
I 0.4 MOC
1 10OCR
1 2Piezocone DataS1 .6 South Boston (BBC)
(Ladd. 1990)
1 pP? 1.2
I N MIT-E30.8
0.4
0
1OCR 10
IFigure 4.23 Comparison of predictions and measurements for the Bq ratioin BBC

150
5. THE MARCHETTI DILATOMETER
I5.1 INTRODUCTION
The dilatometer (Fig. 5.1) was developed in Italy by Marchetti (1980) and introducedinto the United States in 1982 (Schmertmann, 1982). It has gained considerable popularity
due to its operational simplicity, repeatibility of measurements and low cost. The deviceconsists of a flat blade with overall thickness, 2w=14mm, aspect ratio B/w=6.8, andcutting edge with apex angle 28=180. The dilatometer is instrumented with a flexible
Icircular steel diaphragm to measure the lateral pressure. The diaphragm has a total surface
area, AD=2800mm 2. The standard dilatometer (DMT) procedure involves the following
steps (Schmertmann, 1986):1. The blade is jacked vertically into the ground (at a steady rate, u-1-2 cm/sec) over a
standard interval (10-20cm)
2. Immediately on interruption of jacking, the internal 'contact pressure', Po, required todisplace the membrane is measured.
3. The membrane is then inflated to a prescribed displacement (A=lmm), at which the
pressure P, is recorded.
4. Membrane pressure is released prior to subsequent jacking and a closure pressure, P2,is obtained when the membrane recontacts the plane of the plate (Luttenegger and
I Kabir, 1988),.
More elaborate procedures have recently been proposed, including a) measurement of
p(t) from holding tests (Marchetti et al., 1986; Robertson et al., 1988), and b) measurement
of pore pressures in conjunction with the lateral stress diaphragm, (Robertson et al., 1988,Boghrat, 1982).
In the original development of the dilatometer, Marchetti (1980) combined the measuredpressures P0 and P, with the known (estimated a priori) in-situ pore pressure, uO, andeffective overburden stress, ' 0 , to form a set of three dimensionless indices:
ID = Material Index = Pi - 1o (5.1a)Po - uo
KD = Horizontal Stress Index = PO -uo (5.1 b)O'v0
ED - Dilatometer Modulus = 34.7 (Pi - p0) (5. Ic)
Empirical correlations were then developed (Marchetti, 1980) to provide estimates of

151
the following characteristics and properties:1. From ID, a soil classification that is 'closely related' to the prevailing grain size fraction.2. From KD, the in-situ lateral pressure ratio, K0= O'0/G'v0, and OCR =a'p/a',0 (for
both granular and cohesive soils.) The undrained shear strength of cohesive soils isthen estimated using the SHANSEP procedure relating cu/a'vo to OCR (Ladd and
Foott, 1974).
3. From ED, (together with ID and KD), the I-D constrained modulus, M=1/mv, for bothgranular and cohesive soils.
It is apparent from the correlations that the contact pressure, P0, (used in KD) is mostimportant in estimating engineering properties of cohesive soils (K0 , OCR, cu.) In this
chapter, the fundamental solutions for installation stresses and pore pressures described in
chapters 2 and 3 are applied to the predictions of contact pressure, po, measured by thedilatometer. The analytical solutions provide a rational basis: a) for estimating the effects of
membrane geometry (size and location) on the measurement of po, b) for comparing powith lateral stress measurements for axisymmetric devices such as full-displacement
pressuremeter tests, and c) for interpretation of test measurements.Analytical predictions of effective stresses and excess pore pressures around the
dilatometer are obtained using: a) strain paths for an equivalent simple plate geometry
(chapter 3); b) generalized effective stress soil models (MCC and MIT-E3) with input
parameters corresponding to K0-consolidated Boston Blue Clay (BBC) with Il<OCR<4(Tables 4.1, 4.2); and c) finite element solutions of the Poisson equation (chapter 2). Thepredictions are evaluated by comparison with measured data from a test site in South
Boston for which the preconsolidation history has been determined from an extensive
laboratory test program (Ladd, 1990). Further comparisons with data from a number ofwell-documented test sites suggest severe limitations of the KD index for estimating OCR in
soft clays.
5.2 INTERPRETATION OF CONTACT PRESSURE, po
Although dilatometer tests in saturated cohesive soils provide (empirical) estimates of
several engineering parameters, the discussion in this chapter is focused on the predictionof undrained shear strength and stress history. Predictions of stress history are particularlyimportant as the actual in-situ OCR (or preconsolidation pressure, 'p) can be obtained
quite reliably from laboratory oedometer or CRSC tests (if performed on high quality

152
samples)!. Hence, the analytical predictions of contact pressures can be evaluated bycomparison with measurements from well documented sites.
Based on data from 9 test sites in Italy (Fig. 5.2a), Marchetti (1980) proposed the
following corelation for OCR
OCR = a KDm (5.2)
where a--0.34 and m=1.56.
Subsequent work by Lacasse and Lunne (1988) and Powell and Uglow (1988) based
on data from well documented sites in Norway and the U.K., respectively, show that thecorrelation originally proposed by Marchetti can underpredict or overpredict the actual OCRby a factor of 3-4. Figure 5.2b shows the correlation reported by Lacasse and Lunne(1982) based on data from seven well documented marine clay sites. From these results,
the authors propose revised correlations for OCR using equation 5.2 with m=1.35 to 1.67.However, more detailed investigation of the data for Onsoy (section 6.3, Whittle et al.,1989) has shown possible discrepancies in the reported correlations. Subsequently, Lunne
et al. (1989) have presented separate correlations for 'young' and 'old' clays, figure 5.2c,
following the suggestion of Powell and Uglow (1988). Even with this subdivision, it isclear that there is a wide scatter in predictions of OCR from the KD index.
Figure 5.2d shows the correlations presented by Powell et al. (1988) from four sites inthe U.K. In this case, the correlations between the different sites are radically different
from one another and do not match the correlations developed by Marchetti (1980). In
large part, these differences might be explained by the types of clay at these sites:
1. Brent Cross (London Clay) and Madingley (Gault Clay) are sites with ancient clayswhich have been heavily overconsolidated. Preconsolidation pressures, u'p, are very
difficult to estimate from oedometer tests (e.g. Bond, 1990). For example, at Brent
Cross, Jardine and Bond (1990) report OCR=20 to 70+ from oedometer tests, while
geological history suggests OCR=10-20 (Burland, 1990).2. For the Cowden till similar difficulties may be associated with the deposition of the clay
at low water content as a 'lodgement till' (Hight, 1983).3. Finally the Grangemouth clay is a recent low plasticity alluvial clay of moderate
sensitivity (Powell and Uglow, 1988) and similar to a number of clays considered byMarchetti (1980).
IIn comparison, reported values of undrained shear strength depend on the mode of shearing, consolidationprocedure etc.I
I

153
4. In addition, Section 6.3 of Whittle et al. (1989) pointed out large discrepancies betweenthe cj/O',o values quoted by Powell et al. (1988) compared with the OCR values
shown in figure 5.2c.Finally, Mayne (1987) suggests a simple correlation between OCR and KD based
on data from the 29 sites shown in figure 5.2e:
1p = 1 (5.3a)
or
OCR = KD (5.3b)8
where 8 = 1 to 3.
More recently, Robertson et al. (1988) have shown that the 'closure pressure', P2, is
approximately equal to the penetration pore pressure2. Although this method has not been
evaluated in detail, it is likely to give a large scatter in predicted OCR as the lateral effectivestress is small compared to either P0 or P2 (i.e. it suffers the same limitations previously
reported for the piezocone using (qt-u) (see Chapter 4).
5.3 PREDICTIONS OF DISTURBANCE DUE TO DILATOMETER INSTALLATION
5.3.1 The Dilatometer Geometry
The standard (Marchetti) dilatometer (Fig. 5.1) has an approximate aspect ratioB/w=6.8 (95mm/14mm) and a tip apex angle, 8=18-200. Lateral stresses are measured in
a 60mm diameter flexible steel membrane centered at a vertical location z/w=13
(90mnv7mm) above the tip of the blade. Accurate modeling of the surface geometry of the
dilatometer can be achieved by numerical boundary element methods (panel methods).This approach was first proposed by Huang (1989) and has been investigated in detail byWilliamson (1989) and Whittle et al. (1989). This study has shown that although the panelmethod can be used to model accurately the surface geometry, numerical accuracy of the
strain paths is very difficult to achieve. Thus the results of panel method computations
require careful evaluation in order to establish their reliability and accuracy for a given
discretization of the surface. This imposes severe restrictions on the practical use of the
2Thus the difference, (po-p2) - dxx, the lateral effective stress.

154
panel method for estimating stresses and pore pressures around the dilatometer.
In this work, the dilatometer geometry is approximated using a simple plate of the sameoverall aspect ratio (B/w=6.8) as described in Chapter 3. Figure 5.3 shows the simple plategeometry. Differences in geometry between the simple plate and the dilatometer include:1. The simple plate has a 'blunt' tip geometry as compared to the sharp apex angle (6=18-
200) of the dilatometer.
2. The simple plate has smooth curved edges in the horizontal plane, while the dilatometer
is square cut.3. The dilatometer extends to a finite vertical elevation z/w=34, while the simple plate is
infinite in vertical extent.
The approximations of tip geometry have been studied in detail for axisymmetric conepenetrometers in Chapter 3. These results have shown that the stresses and pore pressures
above the base of the conical tip are very similar for the simple pile, 180 and 600 cones andgood matching of the solutions can then be achieved by adjusting the reference vertical
location of the simple pile with respect to the location of tip of the 180 cone. Figure 5.4shows that if a point source is located at the elevation of the base of the cone (i.e., at
z/R=6.5 as shown in figure 5.4) the corresponding simple pile solution matches closely the180 cone solution for all locations above the base of the cone. This result suggests thatreliable predictions of the stresses and pore pressures on the dilatometer membrane can be
achieved using the simple plate solution (B/w=6.8) with the source at the elevation of thebase of the 200 dilatometer tip (z/w=5.7). In this case the center of the membrane on a
standard dilatometer will be located at z/w=7.2. Note that the dilatometer has an equivalentradius (RN=-4Bw/t) of 20.5mm; therefore, the normalized equivalent diameter of theDMT membrane shown in figure 5.4 is 60/20.5-2.9.
5.3.2 Effective Stresses and Pore Pressures
Figure 5.5 (a,b,c,d) presents a complete picture of the stresses (a'rr, a', qh3) and
excess pore pressures (Au) generated around the simple plate dilatometer during
installation. The results correspond to the 'base case' analysis (presented in previous
3 The cavity shear stress is defined as the maximum shear stress acting in a horizontal plane; i.e.
C1, (CF. 0)2. _W ; Dilatometer
q = (of - o.)/2; Cone
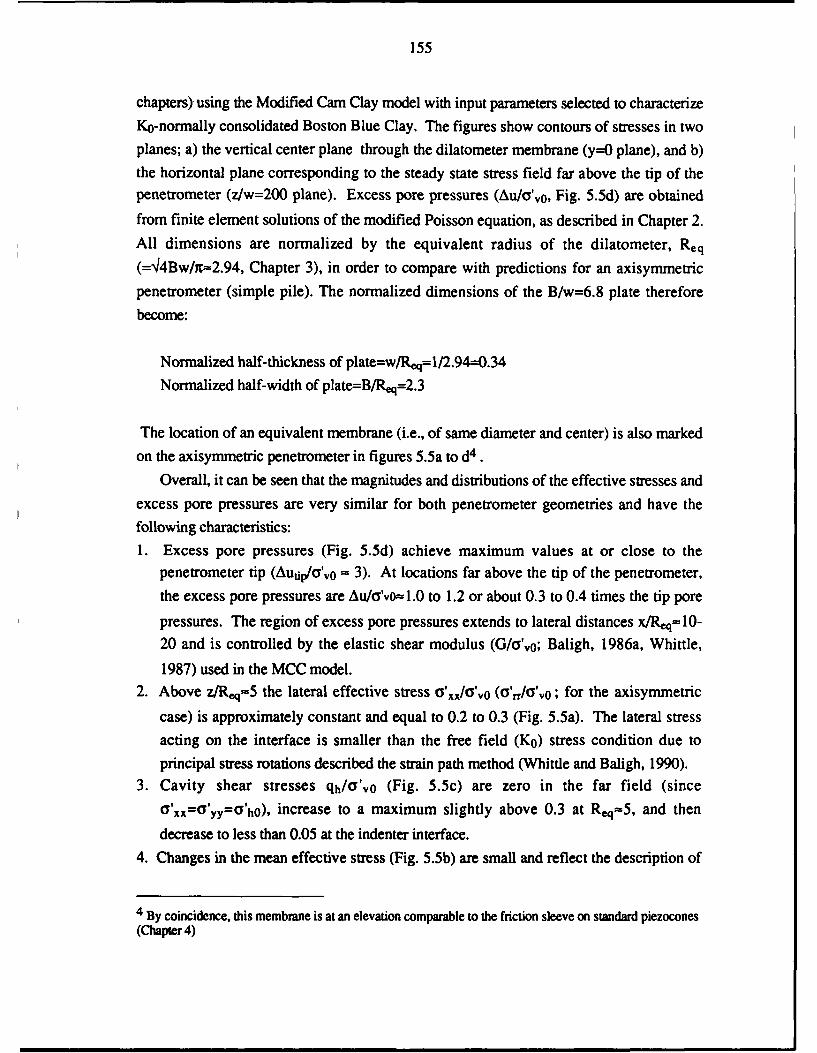
155
chapters) using the Modified Cam Clay model with input parameters selected to characterize
Ko-normally consolidated Boston Blue Clay. The figures show contours of stresses in twoplanes; a) the vertical center plane through the dilatometer membrane (y=0 plane), and b)
the horizontal plane corresponding to the steady state stress field far above the tip of thepenetrometer (z/w=200 plane). Excess pore pressures (Au/o'vO, Fig. 5.5d) are obtained
from finite element solutions of the modified Poisson equation, as described in Chapter 2.
All dimensions are normalized by the equivalent radius of the dilatometer, Req(=44Bw/x-2.94, Chapter 3), in order to compare with predictions for an axisymmetric
penetrometer (simple pile). The normalized dimensions of the B/w=6.8 plate therefore
become:
Normalized half-thickness of plate=w/Rq=l/2.94--0.34
Normalized half-width of plate=B/Rq=2.3
The location of an equivalent membrane (i.e., of same diameter and center) is also marked
on the axisymmetric penetrometer in figures 5.5a to d4 .
Overall, it can be seen that the magnitudes and distributions of the effective stresses and
excess pore pressures are very similar for both penetrometer geometries and have the
following characteristics:1. Excess pore pressures (Fig. 5.5d) achieve maximum values at or close to the
penetrometer tip (Autip/o',0 =- 3). At locations far above the tip of the penetrometer,
the excess pore pressures are Au/o'vo0l.0 to 1.2 or about 0.3 to 0.4 times the tip pore
pressures. The region of excess pore pressures extends to lateral distances x/Req--10-20 and is controlled by the elastic shear modulus (G/o'vo; Baligh, 1986a, Whittle,
1987) used in the MCC model.2. Above z/R, 1 5 the lateral effective stress a',I/o',0o (a'IO/',0; for the axisymmetric
case) is approximately constant and equal to 0.2 to 0.3 (Fig. 5.5a). The lateral stressacting on the interface is smaller than the free field (K0) stress condition due to
principal stress rotations described the strain path method (Whittle and Baligh, 1990).3. Cavity shear stresses qh/a'vo (Fig. 5.5c) are zero in the far field (since
'XX=C'Iyy=O'hO), increase to a maximum slightly above 0.3 at Req=5, and then
decrease to less than 0.05 at the indenter interface.4. Changes in the mean effective stress (Fig. 5.5b) are small and reflect the description of
4 By coincidence, this membrane is at an elevation comparable to the friction sleeve on standard piezocones(Chapter 4)

156
'critical state' conditions (a'/O'vo is uniquely defined at large strains for all modes of
shearing) used in the MCC model.
Apart from the overall similarities, a more detailed comparison of the stresses in the
vicinity of the dilatometer membrane shows:1. Excess pore pressures acting at the dilatometer boundary vary by up to 30% along the
membrane (Au/a'-0--l.8-2.4; also shown in Fig. 5.5d). Similar magnitudes and
variations are predicted at the same locations on the axisymmetric penetrometer.2. The lateral effective stresses acting at the center of the dilatometer membrane,
O'xx/&',0=0. 2 l, is significantly smaller than that for the equivalent axisymmetricmembrane (a'rr/O',o=Oxx/a',0=0.6 at the membrane center z/Req=2.45).
3. The effective stresses, O'xx/O'vO=0. 2 1 (see also Fig. 5.6), are much smaller than the
excess pore pressures at all locations around the membrane. Thus measurements oftotal lateral pressures obtained using the standard dilatometer are controlled by excess
pore pressures, as observed by Luttenegger (1988) and Robertson et al.(1988).
5.3.3 Evaluation of Contact Pressure from Analytical Solutions
In general, the net contact pressure, po-uo, measured by the dilatometer can be equatedwith the net average total normal stress acting on the membrane:
(P0 - u0) = (oxx - uo)avg = A (5.4)
In principle, predictions of po-uO require a complete knowledge of the three-dimensional effective stress fields around the dilatometer to estimate pore pressures fromequilibrium. Figure 5.6 shows the distributions of lateral stresses and excess porepressures acting at the surface of the simple plate dilatometer: a) along the vertical centerlineof the device (y/w=0 plane); and b) in a horizontal steady state plane (z/w=200) 5:
1. The lateral pressures are almost constant across the width of the ('equivalent')membrane (Fig. 5.6b), with variations in horizontal effective stresses and porepressures being less than 5%.
2. In the vertical plane (Fig. 5.6a), there in a fairly significant (25%) decrease in net totallateral stress (oxx-uo) moving from the bottom to the top of the membrane. Horizontal
51n this case, it is assumed that the steady state plane can be used to assess the lateral variations in stressesand pore pressures across the membrane.

157
effective stresses are very nearly constant with respect to the vertical coordinate. Thefact that pore pressure, and hence total stress, vary significantly along the membrane isa potential source of scatter in DMT correlations.Based on the results in figure 5.6, the dilatometer contact pressure can be calculated
assuming no variation in Y,,, in the y-direction (at any given z) as follows:
_ j~axxuo)2 i~i d
(po - uO) = (5.5)itr~
where rm is the membrane radius and zc is the elevation of the membrane center.Application of Equation 5.5 to the results in figure 5.6 gives KD=(pO-uo)/a'o=2.23,
which is essentially equal to the lateral stress acting at the center of the membrane is (p0-u0)/a',0=2 .2 l. This result suggests that the contact pressure can be reliably estimated for
the purposes of analysis from the total lateral stress acting at the center of the membrane;however, further analyses based on more realistic soil models at varying OCR's arerequired to verify this tentative conclusion.
5.3.4 Analytical Predictions of Dilatometer Membrane Conditions
This section presents predictions of total lateral stress and pore pressure conditions atthe center of a dilatometer membrane immediately following undrained penetration.Assuming that the total lateral stress at the center of the DMT membrane closely
approximates the contact pressure, p0, measured in the standard dilatometer test (section5.3.3). While not a standard DMT measurement, predictions of pore pressures at the
center of the membrane are also considered in this section to assess whether installationpore pressures can be used to improve the interpretion of dilatometer test results. Such
pore pressure measurements could be obtained directly from a filter located at the center ofthe membrane as described by Robertson et al. (1988). Based on the assumptionsdescribed in previous sections, table 5.1 presents a summary of analytical predictions forplate dilatometer contact pressures. The table shows results for two soil models (MCC andM1T-E3) with input parameters selected for Boston Blue Clay with initial OCR's of 1, 2,
and 4.
The aim of these predictions is to address the following questions regardinginterpretation of DMT measurements in cohesive soils:

158
1. Which soil parameter(s) is being measured, i.e. which soil parameter provides the most
suitable basis for correlation with DMT results? While many soil parameters will
undoubtedly affect a DMT measurement, the aim is to identify one which has a
dominating role to be used as a basis for correlations. Soil parameters which will beconsidered in this section are a) OCR (y'p/a'v0) because it controls the undrained
behavior of cohesive soils, and b) undrained shear strength cu because it has been
shown to provide a reliable basis for correlation in other penetration tests (e.g. thecorrelation between (qc-av0) and cu in the piezocone test; chapter 4). Since cu is
dependent upon shearing mode, correlations should use a consistent reference shearstrength (TC, DSS, or TE). In this section cuTc will be used as the reference shear
strength.
2. Which DMT measurement provides the most reliable basis for estimating soilproperties? Consideration will first be given to the KD parameter measured in the
standard DMT, defined by equation 5. 1b; KD = (P0 - u0Yo0'0. If pore pressures aremeasured at the center of the membrane, a number of additional parameters may be
considered as a means for estimating soil properties, which can include:
u - u0 = Normalized excess pore pressure'v 0
PO - u = Normalized effective lateral stressa'v0
u - uo = Ratio of excess pore pressure to total lateral stressP0U -u
Finally, the normalized net change in horizontal total lateral stress; (po-aho)/C'o at
the membrane will be considered. Although this parameter would be of limitedpractical value, as aho is generally unknown, it will be considered for the purpose of
understanding the mechanics of plate penetration (i.e., do soil properties relate to totalstresses or to net stresses acting on the penetrometer?).
3. How do DMT measurements vary with soil properties? The first type of relationshiplinking soil parameter (OCR, cuTC) to DMT measurement (KD, etc.) that will beconsidered is that of a direct proportion between soil parameter and DMT measurement:
(soil parameter) = a x (DMT measurement) 5.6
where 'a' is a constant. This type of relationship is desirable as it clearly relates soil

159
parameter to measurement in a way that can be readily interpreted. Using MCC and
MIT-E3 model predictions, a number of DMT measurements (KD, pore pressure, etc.)
will be used evaluated to determine whether they can be directly related (approximately)
to either OCR or Cu.
If no direct relationships relating soil property to measurement can be identified, then
more complex functions, such as a power function of the form proposed by Marchetti
(1980) (see also equation 5.2):
(Soil Property) = a x (DMT measurement) m (5.7)
(where 'a' and 'i' are constants) must be considered. While such relationships tend to
be highly empirical and difficult to understand, they may prove necessary if no simple
relationship can be identified relating DMT measurements to soil properties.
4. What is the range of applicability of a correlation? This question can be considered in
two parts: a) can meaningful site-specific correlations be developed (i.e., over what
range of OCR and for what conditions of soil variability will a correlation be valid at a
specific site?) and b) can such correlations be extrapolated to other sites, i.e., are
reliable universal correlations possible for a wide range of soils? These questions can
be addressed by comparing model predictons of DMT measurements for a series of
differing soil types (with respect to sensitivity, plasticity, etc.) to assess the influence ofvariations in soil type. As of this writing, these predictons are not complete; however,
some tentative conclusions on this issue are possible by comparing MCC (insensitive
soil, i.e., no strain softening) predictions to MIT-E3 (moderate sensitivity) predictions
for BBC.
5.3.4.1 Correlation with Undrained Shear Strength, CuTCTable 5.2a shows predictions of DMT membrane pore pressures and stresses
normalized membrane stresses and pore pressures normalized by the undrained shear
strength, CuTC. This table indicates:
1. Predictions of (u-u0)/cuTC, (po-u0)/cuTc, and (p0-oho)/cuTc based on both the MCC andMIT-E3 models all vary substantially (30-50%) as the OCR increases from 1 to 4; i.e.
these ratios cannot be considered to be even approximately constant over the range of
OCR considered. This result implies that (u-uo), (po-uo), and (Po-aho) cannot be
directly correlated to undrained shear strength, CuTC, in a manner described by equation
5.6.2. The normalized effective lateral stresses acting on the membrane, a',/CuTC, predicted

160
from the MCC model are approximately constant with OCR; however, the MIT-E3
model shows this ratio to vary substantially with OCR (by a factor of over 3). The
different trends predicted from the two models can be attributed to the strain-softeningbehavior in the MIT-E3 model. In any event, this result implies that under realisticconditions involving strain softening, effective lateral stresses, , cannot be reliably
correlated the undrained shear strength, CuTC in a manner described by equation 5.6.The fact that DMT membrane measurements can not be linearly correlated to undrained
shear strength suggests that it is not worthwhile to pursue simple correlations betweenDMT measurements and undrained shear strength. While some authors (Lacasse and
Lunne, 1988; Marchetti, 1980) propose more complex KD-Cu correlations of the type
described by equation 5.7, it appears preferrable to correlate DMT measurements to OCR,
because a) stress history profiles (from oedometer tests) can be more reliably defined than
shear strength profiles, and b) shear strength is dependent upon shearing mode, which
complicates correlations.
5.3.4.2 Correlations with Stress History, OCR
Table 5.2b shows MCC and MIT-E3 predictions of DMT membrane pore pressuresand stresses normalized by preconsolidation pressure a'p. Again it can be seen that (u-
uo)/A'p, (po-uo)/a'p, and (pOch0)/O'p, all vary substantially (by up to a factor of 2) with
OCR. This implies that direct correlation (of the type defined by equation 5.6) betweenDMT membrane measurements and preconsolidation pressure cannot be considered even
as an approximation.The ratio of excess pore pressure to total stress, (u-uo)/ (po-uo), merits discussion,
since similar correlations to predict OCR have been proposed (e.g. Bq, Senneset et al.,
1982) in the piezocone test. The results in Table 5.1 show that both the MCC and the MIT-E3 models predict very little variation in this ratio with OCR, i.e. a slight decrease of only 5
to 10% as OCR increases from 1 to 4. The analyses therefore indicate that DMT
measurements of (u-uo)/(po-uo) cannot provide a reliable basis for correlations with OCR,
especially given the likely scatter in actual DMT test data.
The above observations imply:
1. Simple linear correlations between DMT measurements and OCR do not appear feasible;
therefore, there is no alternative to the empirical power function relationships (equations
5.2 and 5.7) proposed by Marchetti (1980).2. Membrane pore pressure measurements will not simplify the interpretation of the
dilatometer test; therefore, no compelling reason exists for abandoning the KD
parameter in favor of pore pressure or effective stress measurements. However, pore

161
pressure data might be useful for other purposes, such as for soil classification or for
estimation of consolidation behavior.Table 5.1 presents MCC and M1T-E3 model predictions of KD versus OCR. These
predictions suggest that, for a given set of soil parameters, a unique relationship existsbetween OCR and KD; therefore, a correlation of the type proposed equation by 5.2 ispossible. Second, recalling that the MCC predictions represent an insensitive soil whilethe MIT-E3 predictions 6 represent a moderately sensitive soil, it can be seen that thelocation and slope of the KD-OCR curve in log(KD)-log(OCR) space is sensitive tovariations in soil sensitivity. This second conclusion should be considered tentative untilmodel predicitons with soil input parameters for a wider range of soil types are completed.The implications of these observations on practical use of the DMT are:1. Site specific log(KD)-log(OCR) correlations can probably be developed from DMT test
in soils exhibiting a) normalized behavior (no cementation, etc.) and b) minimalvariation in soil type. This conclusion is based on the model predictons showing thatfor a given set of (normalized) soil properties a unique KD-OCR relation can beestablished.
2. It is unlikely that a general, universal, correlation between DMT KD and OCR can beestablished. This conclusion is based on the apparent sensitivity of the location andtrend of the KD-OCR curve to variations in soil type. A corollary to this conclusion isthat, at sites exhibiting substantial variations in soil type, even site specific correlationscannot be reliably established.
5.3.5 Comparisons with Axisymmetric Penetrometers
The full displacement pressuremeter test (FDPMT) combines a cone penetrometer witha pressuremeter. Devices described by Baguelin and Jezequel (1983), Withers et al.(1986), and Briaud and Shields (1979) are shown in figure 5.7. For the device describedby Withers et al., the center of the expandible membrane is located a normalized verticaldistance z/R-43 above the cone tip, and has a length LIR-21. As discussed in chapter 2, asteady state condition occurs above z/R- 15-20 during cone penetration; therefore, the entiremembrane can be considered to be located in the steady state zone. The initial total stress,pi, measured in this test corresponds to the average total lateral stress acting on themembrane and is therefore analgous to the contact pressure, po, measured in the dilatometertest. Since the membrane is located entirely in the steady state zone, pi can be taken to be
6With input parameters describing Ko-consolidated BBC

162
equal to the steady state total lateral stress.MCC and MIT-E3 predictions of pi (=aFt-u 0) are shown in Table 5.3. Comparison of
these predictions with the dilatometer predictions in Table 5.1 indicate that MCCpredictions of total lateral stress at the FDPMT membrane are 15-30% less than the DMTpredictions. This can be largely attributed to the fact that the FDPMT membrane is locate inthe steady state zone, while the DMT membrane is located nearer to the tip. MIT-E3predictions indicate the FDPMT pi to be roughly 10-20% less than the corresponding DMTpredictions. Comparisons by Luttenegger and Blanchard (1990) of the measured FDPMTpi and DMT po at eight sites generally confirm the MIT-E3 predicted trends.
5.4 COMPARISONS WITH MEASURED DATA
In this section the model predictions presented in section 5.3 are compared withmeasured data in order to determine:1. The capabilities and limitations of the analytical predictions for describing a) the
magnitude of KD, and b) variations in KD with stress history.2. The validity of the preliminary conclusions drawn in the previous section: a) KD cannot
linked to OCR by a simple direct proportion; b) that well-defined trends can beestablished between KD and OCR at sites exhibiting normalized behavior (nocementation, etc.) and minimal variability in soil type; c) a universal correlation relatingKD to OCR for all soils is not feasible; and d) at sites showing extensive soil variability
or non-normalized behavior, even site-specific cannot be reliably obtained.In this section, seven well-documented sites are reviewed to assess the relationship
between DMT KD and OCR. The OCR profiles are based on either oedometer or constantrate of strain consolidaton (CRSC) tests. A description of the geotechnical characteristics
of each of the seven sites is described below:
1. South Boston test site (associated with the Central Artery/Third harbour tunnel project;
CA/T). This site (index properties and stress history are shown in figure 4.19b; Ladd,
1990) includes a deep stratum of Boston Blue Clay between elevations 7 74ft and -29ft,with in-situ OCR's ranging from OCR - 5 at elevation z = 65 ft. to OCR = 1.1 at z = -
20 ft. The soil is significantly more sensitive below elevation z = 20 ft.
2. Potomac River Alluvium. This site (Mayne, 1987) consists of organic silty clay having
7Elevations in the figure are quoted with respect to Boston City Base (BCB); elevation +100ft is mean sealevel.

163
an average liquid limit, WL= 8 3 % and an average plasticity index, Ip-3 7 %. Below a
depth of 11 m the liquidity index generally ranges, IL=0.5 to 0.8. Above 1 Im, theliquidity index is highly variable, IL=0. 4 to 1.6. Below 12m depth the soil has a
relatively constant OCR in the range of approximately 1.2 to 1.7. Above 12m OCR's
decrease from approximately 3 to 1.5.3. Porto Tolle. This site located on the delta of the Po River is described by Ghionna et al
(1981) and Jamiolkowski et al. (1982). The stratum of interest for the dilatometer
evaluation is the soft silty clay between depths of 10 to 28m. This stratum containsfrequent seams and lenses of fine silty sand, which never exceed a few centimeters
thickness. The liquid limit within the stratum, wL=5 2 .3 ±2 .2 , and the mean plasticity
index, Ip=30.5+1. 6 %. The sensitivity measured from field vane tests ranges from 2 to
3. The entire statum has a slight, uniform OCR ranging from 1.2 to 1.3.4. Drammen. The Drammen site (Lacasse and Lunne, 1982) is a marine deposit consisting
of sand and clay (0-Sm) overlying a 5m layer of plastic clay (5-10m) and 35m of lean
clay (10-45m). In the plastic layer (5-10m) the liquid limit ranges, wL=50- 7 0% and
plasticity index ranges, Ip=2 5- 30%; while in the lean clay layer (below 10m), Ip=10-
15%. The sensitivity (based on field vane data) ranges from 6-8 in the plastic clay layer
and from 4-7 in the lean clay layer. The OCR is relatively uniform in both layers, with
an OCR from 1.3-1.5 in the plastic layer and from 1.1-1.2 in the lean clay layer.
5. Onsoy. The Onsoy site (Lacasse and Lunne, 1982) is a soft to medium marine clay
deposit extending to 45m depth. Liquid limit and plasticity indices range from 55-75%
and 20-35%, respectively. In the upper 2-6m the OCR decreases from 15 to 1.3.
Below 6m the OCR is essentially constant at 1.3, and the sensitivity based on field vane
data ranges from 5-6.6. Florence Lake. This deposit is an oxbow lake of the nearby Missouri River, consisting
of plastic alluvial clay (Whittle et al., 1989.) The plasticity index increases with depth
to approximately 60% at a depth of 2oft, and then decreases with depth to a value of
about 25% at a depth of 40 ft. The liquidity index, IL=0.6-0.9 throughout the deposit,with no observable trend with depth. The oedometer data indicate an OCR profile withthree zones: a) a normally consolidated zone below 2oft, b) a nearly constant
preconsolidation pressure from 10-2oft, and c) a crust below the surface with scattered
OCR's ranging from approximately 1.5-10. Sensitivity measured from field vane testsranges from 3-4 at depths greater than 10ft.
7. New Jersey Varved Clay. This site is described in detail by Whittle et al. (1989).Preconsolidaton pressure data indicate a desiccation crust within the top 15-2oft andthen a constant amount of preconsolidation ('p-',,O) within the lower 40ft.

164
For the purpose of establishing whether the model predictions realistically portray
actual DMT behavior, MCC and M1T-E3 predictions of KD for BBC are compared to DMT
measurements taken from the South Boston test site (BBC), as presented in figure 5.8.The solid lines show the predictions at the center of the membrane, while the dashed lines
show the predicted lateral stresses at the top and bottom of the membrane. This
comparison shows:
1. For OCR>2 and for low OCR, the MCC and MIT-E3 predictions compare well to
measured data. For 1.2<OCR<_2, the predictions do not match measurements with
respect to either magnitudes or trend with varying OCR. However, application of
Marchetti's (1980) technique to obtain OCR's from the measured KD values predict a
more or less constant preconsolidation pressure within the upper 65 ft of clay, which
contradicts the actual O'p profile. Other interpretation techniques could not remove this
serious discrepancy. Moreover, preliminary data indicate that the clay at this site doesnot exhibit normalized behavior (Ladd, 1990). Such behavior cannot be modelled byeither the MIT-E3 or MCC models, which may further contribute to the discrepancybetween model predictions and measured KD.
2. The width of the scatter band is comparable to the width of the band defined by thepredicted total lateral stresses at the top and bottom of the membrane. This suggests
that the data scatter may be related to the variability of total stresses and pore pressurealong the DMT membrane.Plots of KD versus OCR on a log-log scale for the remaining six sites are shown in
figure 5.9. From these plots it can be seen that:1. At three sites, Onsoy, Potomac, and Florence Lake, the data show a clearly defined KD-
OCR (site-specific) relationship. In all three cases, the data show that for a given OCR,the scatter in KD is less than 25%. Such trends are consistent with model predictionsindicating that reliable site-specific trends are possible in deposits exhibiting minimalheterogeneity and (presumably) normalized behavior.
2. The Dramnen data indicate a much wider scatter band (factor of 2 variation in KD at agiven OCR). This could be linked to the heterogeneity of the deposit and supports thesuggestion that the relationship of KD versus OCR is heavily influenced by variations in
soil properties.
3. The New Jersey varved clay data shows KD to be virtually independent of OCR forOCR>2. This could be a consequence of the unique behavior of varved clays.Evaluation of these data in light of model predictions is not feasible, as neither model iscapable of realistically simulating a varved clay. However, as discussed in Section6.5.3 of Whittle et al. (1989), the DMT data completely "missed" the high

165
preconsolidaton within the upper desiccated crust of the deposit for reasons that still
remain unknown.
4. All data sets indicate that a complex relationship exists between KD and OCR; that is,KD cannot be correlated (even approximately) to OCR by a simple direct proportion
(note that a 1:1 slope on a log-log plot implies that a directly proportional relationship
exists). This further reinforces the notion that KD is related to OCR in a very complex
manner that can only be treated within an empirical framework.
Finally all seven data sets are superimposed in figure 5.10. The wide scatter band
demonstrates that a universal KD-OCR relationship cannot be established. This suggests
that extrapolation of site-specific relatonships to new sites cannot be considered a reliableprocedure.

166
soil OCR KO I (- --) %, xx Po- UO* M PO0Ch0OYvO j7O ao Iv #OU
Model v Yv Yv Ou v
1.0 0.48 10.32 2.0 0.2 2.2 0.9 1.7MCC 2.0 0.57 0.58 2.3 0.4 2.7 0.9 2.1
4.0 0.75 1.05 3.3 0.7 3.9 0.8 3.2
1.0 0.48 0.33 1.4 0.05 1.5 1.0 1.0M1T-E3 2.0 0.57 0.54 12.2 10.1 2.3 1.0 1.
____ 4.0 10.75 1.05 2.8 0.5 13.4 0.9 2.
*KDNote: All predictions based on stresses at center of membrane; po=cyx
Table 5.1 Predictions at center of dilatometer membrane for IKo-consolidated Boston BlueClay

167
Soil OCR K0 -Cm (u-uo) 'xx POuO PO-YhO#vo CUTC CuTC CcModel
1.0 0.48 0.32 6.3 0.7 6.9 5.4
MCC 2.0 0.57 0.58 4.0 0.6 4.7 3.7
4.0 0.75 1.05 3.1 0.6 3.7 3.0
1.0 0.48 0.33 4.3 0.2 4.5 3.0
M1T-E3 2.0 0.57 0.54 4.0 0.2 4.2 3.2
4.0 0.75 1.05 2.7 0.5 3.2 1.9
Table 5.2a Prediction of DMT membrane stresses normalized by curcfor Ko-consolidated BBC
Soil OCR Ko CUM (u-uo) oxx Po-uo P0-OhoModel Yvo p ap 'p ',p
1.0 0.48 0.32 2.0 0.2 2.2 1.7
MCC 2.0 0.57 0.58 1.2 0.2 1.4 1.1
4.0 0.75 1.05 0.8 0.2 1.0 0.8
1.0 0.48 0.33 1.4 0.05 1.5 1.0
MIT-E3 2.0 0.57 0.54 1.1 0.06 1.2 0.9
4.0 0.75 1.05 0.7 0.3 0.8 0.5
Table 5.2b Prediction of DMT membrane stresses normalized by 'pfor Ko-consolidated BBC

168
Soil OCR KO* (u-uo) a I . I-uoa'v0 a'0 'v0 a'v0 rr-u0 a'v0
Model
1.0 0.48 0.32 1.3 0.3 1.5 0.8 1.1
MCC 2.0 0.57 0.58 1.7 0.5 2.2 0.8 1.6
4.0 0.75 1.05 2.3 1.0 3.2 0.7 2.5
1.0 0.48 0.33 1.2 0.1 1.4 0.9 0.9
MIT-E3 2.0 0.57 0.54 1.7 0.2 1.9 0.9 1.4
4.0 0.75 1.05 2.0 0.7 2.7 0.7 1.9
+ Ko=J'ro/a'vo* i.e. Lift-off pressure, pi = On
Table 5.3 Predictions at center of membrane of full displacement pressuremeterin BBC at z/R=20

169
WIRE
PNEUMATICTUBING
4- 0
In4- 4-
o FLEXIBLE -
U, ME MBRANE
B FLEXIBLE.s MEMBRANE
N
26 18 IS-20*
Figure 5-1: Geometry of the Marchetti Dihatometer

17050 .. MA
ETC. IN .S 4E (JLNWA "
2C---'-"---- -. r-1 .
-SS
-i//II6
04.3 - CRVSKIS
.Ott.•-40COTES 10)
2
sdi'u .i
a) Marchetti (1980)
31353 Verde sand
,; [ 4 61before compactwon___._________Ke a 2 NT s 4.0
after coapactiga
SIOnseyA _____ "398 ag (uncertain OCR)
I I $ 4 -4O OratOee
E berg£I ZOsNiTA NTH sites0 Ster"a
Oqsoy i~rn ckjrj
02 OCQiI a '-ur
HOZOTAL STRM 5651 K a
b) Lacasse and Lunne (1982)
Figure 5.2. Empirical correlations between overconsolidation ratio and dilatometer contactpressure,po: a) Marchetti (1980); b) 1a-.asse and Lunne (1982); c) Lunne etal. (1989); d) Powell and Uglow (1988); e) Mayne (1986)

17160 _ _ _ -
40 -
10Clid claysi
20 -
O~OC t ou'hll,11e"
m 0
9.
~. OCRvsdOR orlto rdltmtR ts
3- --
4 3 4
100- - J
00 Wen coo *i- it 1 5N0eaingi gUS bd
GO Poweand Ugo(98
i gemue -2 cn.

172
C- WoSJh.ngton, D C 20 0 Yorktown17 0 NumtofO, Italy 14 0 Gloucester 517 Conco del Fucino 14 D~ Mosa 17 Montolto 14 f Roquette River1,
(X16 A Santo Barbara 27 '1 Phiiladelphia YL7 A Su'ttld. MO 4 3 New Orleans / 0
U) 20 V Newport News, VA /w 1000 -8' Lanham, MO /to
25 p Tampa. FL0
5 4 Fort Frames 5ze5 4Thunder Bay 1 ~,
00
11t9 Onsoy 2- 1259 Drommen 4w 9 9 Porto Tolle /100
tOO -0ea5sa
o..0 £Ref No/
E 8:1.02
/ 3ISO1 l000
Po - * EFFECTIVE CONTACT PRESSUREFROM ONT (kR3)
e) Mayne (1986)
Figure 5-2 (cont.)

173
Dilatometer Membrane
Simple Plate, B/w=6.8
Xy/w
Figure 5-3 Geometry of Simple Plate Used to Simulate Dilatometer

z/R 174AD In 0 n 0 n 0
C~CD
.0 0 0D
2 0
0 > '0
E x
0
CC
.2
030
-a 5
Ccu3~k1 EIZ

17520 1 20
arr~cvo o* Io*V
1 6 SimplePile 16 - ak a8.8plateMCC. BBC. OCR a I MCC, BBC. OCR1
12z4 R200 Plane 12- .4LW200 Plan:
.3 M -
8 8.2
6 .6
7 .7
0 0--I0 4 8 X/Rq1 2 16 20 0 4 8 I/R ' 2 16 20
16 Simple PileMCC,BBCOCR1i 16 .3 B/W = 6.8 plate
y=O planeMCC.BBC,OCRi14 .= lae4 y=O plane
12 61
7 .6
8 8 1
c0*04 4
0 0
-4 35 -4 35-
-8 4 -8 4
-12 -12 -0 4 8 W 12 16 200 4 8 Y) q12 16 2
a) Lateral Strewne
Figure 5-5 Simple Pile and Simple Plate Stress and Pore Pressure Contours

17620 20 120 1
AUIG 1o - -Acl U'v Au 1 /0o -*
16 -Simple Pile 16 - Bw - .8 plateMCC, BBC, OCR a 1 MCC, BBC, OCR a 1
z/R*200 Plane zM-200 Plans
12 -m- 12Imm
8 a8
4 .4
0 00 4 8 x/ q12 16 20 0 4 8 xR 12 16 20
AU VO Idm&7/VOAUsI o&Ol vo
16 Simple Pile 16 MBC=6.8Rlat
MCC,BBC,OCR1 CBBCO.Cplat
y=O plane y=O plane
12 12
8 8
0 0
10 1
-4 14- 12 /-4 08?08 1
/ d206
-806 02.0 -8 0
-12 -120 4 8 12 16 20 0 4 8 12 16 2D
vi1 Aeq eq
Figure 5-5 (coot.) b) Shear-Induced Pore Presures
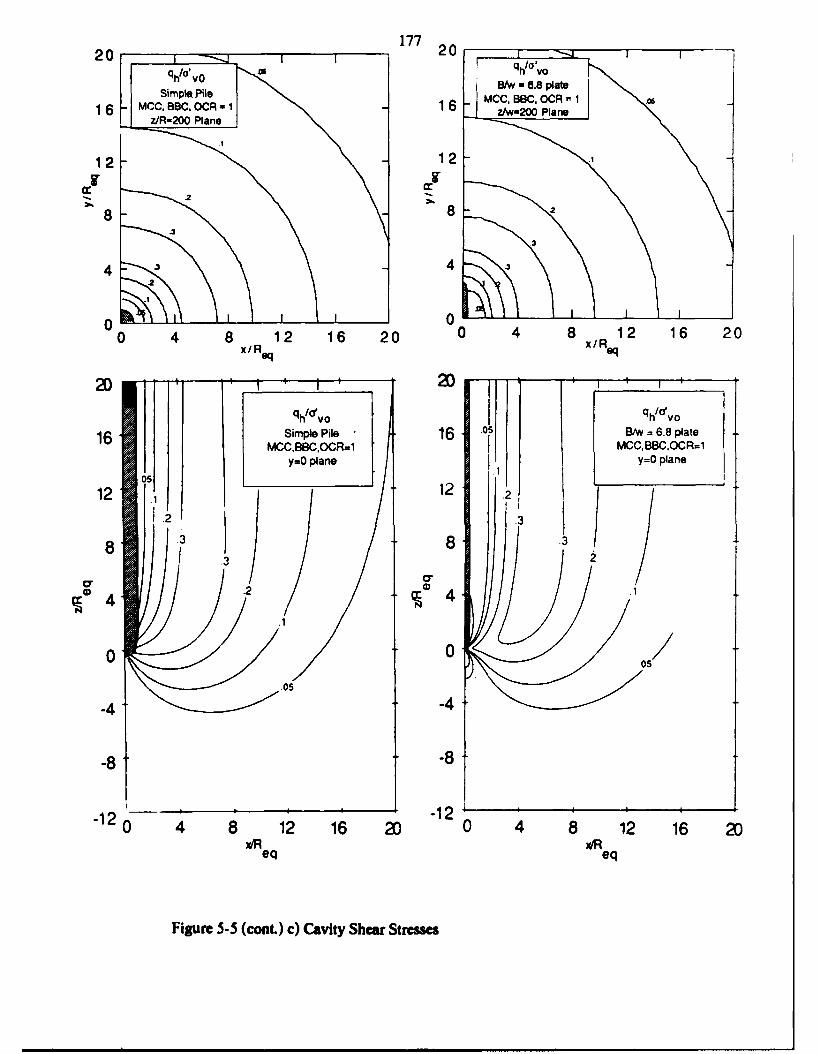
20 177 v 20 1 q I Io'V0qhoI as -8.8 plate
Simple Pile 6 MCC. BBC OCR -116- MCC, BBC. OCR - 1 16 V-20o Plan.-z/R=200 Plane
12 -12 .
8 28 .2
.3.3
4 .3 4 .3
.2
0 00 4 8 xI q12 16 20 0 4 8 X/ q12 16 20
16Simple Pile 16 -o B/ = 6.8 plate16MCcBBc'OCIR=1 MCCBBCOCR=ly.0 plane y=O plane
.o.1
12. .3
8 33cr .2
~G4
0 05
-4 -
-8 -
-1 - -12 I
0 4 8 12 16 20 0 4 8 12 16 20WReq WReq
Figure 5-5 (cont.) c) Cavity Shear Stresses

17820 1 20 1
16(U-uo)/o'Vo (u-u0)Ido16Simple Pile 16 Btw - .8 plateMCC, BBC. OCR - 1 CBC C
z/R-200 PlaneMCBCOC=1dw-200 Plans
12 12__ __
88 8
442 Is2
tO .6 A 2
000 4 8 12 16 20 0 4 8 1R2 16 20
X/Re 0 e
-t-
(U-u0)/o'V0 7 uu 0)/'o16 smplePile- 16Simple Plate Bmw 6.8
MC le BBC ORe MCC. BBC OCR I
16 2 CC.0 Plane OCR 116 \ \I y/R- Plan s
12.12 12
8 .88 1.4\.8
1.6\4 .84
0 .2
00
0 4 8 1 16 2 120 4 8 12 1xqeq xleq16 2
Figure 5-5 (cont.) d) Excess Pore Pressures

179
12-
10 Id Simple Platexx voB/w=6.8
MCC, BBCOCR--l8 (u- u0) Idv
S6 Limits of Membrane
4-
2 \.
00 1 2 3 4 5
Normalized Stress, Pore Pressurea) y=O Plane
2 . . .I
Simple PlateB/W-6.8
S1.6 MCC, BBC(a~ -u )1odooc=L Z/W-200
001.2
O0.8Edeo
S0.4 d/XX vo Blade
0 1 2 3 4 5 6 7 8y/W
b) VW-20O Plane
Figure 5-6 Stress and Pore Presure Distribution Along Dilatomneter Membrane

180QUICK CONNECTOR
SELEVE VALVER 23 CHN
RING
CINENG HOLAFR NJETE WTE
MLE LEE MuE MEMNAN
CHINES LANTERN
MEMBIIANI --
AlI" COI14I
SI AIN GAIUGLU
2 STRA I N EIAWA~S AT120' SPACILNG
MEMIIRANi-N
M EMBRANECLAMP RING
CHINESE LANTERN -
CO-N t HACrIONRING T -
CONE SPACE R AND CONE
b) Withers et al. ( 1986)
Figure 5-7 Full Displacement Preusuremeters

181
0 0
FL0CcJ
(D-
HO0
........2 ..

182
10 .10
C hb~Mrchefti (1980)-.
Marchei (1950)
11 10 ~1 10
10010 • .10
New ,Jerey Varved 0ly
10
+ Marchetti (1980
M chetti (1980)
1 10K 1 1 KD 10
10 10
Marchefi (1960) ±Marcheli (1960)
1 10 1 10KD KD
Figure 5-9 Correlation of Dilatometer Index, KD, with OCR for Six Well-DocumentedSites

I183
IIII
________________ 0I I I I I I I I *1-~ Cu
2IE
F I1I
2
I .2
II 0
II 0I rJ..
I I I 1~
0IHODI
III

184
6. THE- FIELD VANE TEST
6.1 INTRODUCTION
The field vane test (FVT) is the most widely used test for estimating the in-situundrained shear strength (Cu) of cohesive deposits. The test has many advantages,
including, relative simplicity, inexpensive testing procedure and a large empirical data base.
The field vane first gained extensive worldwide use in the late 1940's (Carlson, 1948;
Cadling and Odenstad, 1948) and has been widely correlated with shear strength measuredin laboratory shear tests (Chandler, 1988). The undrained shear strength (CuFv) is usually
determined directly from the maximum torque, M, measured during rotation, and empirical"correction factors" are widely used to modify the reported strength. For example,
Bjerrum (1973) introduced a correction factor based on plasticity index in order to achieve abetter correlation between undrained strength measured from a field vane (CUFv) and
undrained strength back calculated from embankment failures. Other factors have been
proposed to account for a) anisotropy ( Wroth, 1984); b) rotation rate (Torstensson, 1977);rand c) time delay between vane insertion and rotation ( Roy & Leblanc, 1988).
In this chapter the analytical procedures developed for flat plate penetration (chapter 3)are applied to the geometry of the field vane. These results provide quantitative guidance
on the disturbance caused by field vane insertion, and provide initial distributions of
Istresses and pore pressures to be used in subsequent analyses of vane rotation.
r6.2 THE STANDARD FIELD VANE TEST
6.2.1 Test Procedure
Figure 6.1 shows examples of typical field vane geometries, with either a rectangular or
Itapered end. Typical dimensions are given by Chandler (1988) and are summarized in the
figure. The standard procedure for performing a field vane test (ASTM D 2573, 1972)
consists of the following steps:
1. The vane is advanced from the bottom of the bore hole, or to the depth at which the test
is to be conducted.
2. The vane is rotated by applying a torque at a rate, 0 0.10 /sec. The maximum torque,
M is recorded. Typically, there ia a short delay (At - 5 minutes) between insertion and
rotation.
II

185
3. The vane is then rotated through a minimum of 10 revolutions in order to estimate theremoulded strength of the soil.
6.2.2 Test Interpretation
I The conventional method of field vane interpretation relates the undrained shear
strength of the soil (Cu) to the peak torque (M) via the equation (Chandler, 1988):
c =x3 (6.1)7D 3
where x is typically taken as x=0.86. This conventional interpretation assumes that: a) the
shear stress distribution is uniform on both the vertical and horizontal surfaces that definethe cylindrical surface traced out by a rotating vane (Fig. 6.2), and b) the soil is isotropicwith respect to undrained shear strength.
Donald et al. (1977) present a three dimensional elastic finite element study of the stress
distributions along the potential field vane failure surface. Their results showed that the
shear stress distribution is far from uniform along the top and bottom failure surfaces (Fig.
6.2). This result is consistent with laboratory measurements presented by Menzies and
Merrifield (1980). By fitting a polynomial approximation to the elastic shear stressdistribution, Wroth (1984) suggests that the conventional interpretation for undrained
Istrength is conservative and proposes that x = 0.94 provides a more realistic estimate forcuFv. Since the factor x is the ratio of the total torque acting on the vertical failure surface
1to the total applied torque, this result suggests that the shearing resistance of the soil actingon the vertical section of the failure surface will dominate the strength result.
16.2.3 Effects of Vane Insertion
IIt has long been recognized that insertion of the field vane causes disturbance in claysand that this distribution affects the measured field vane strength (Chandler, 1988). Based
on visual observations, Cadling and Odenstad (1948) interpret a zone of disturbance
around the blades of the field vane as shown in figure 6.3a. The effect of disturbance isthen quantified using a perimeter ratio (a - 8w/2nB), which implies that the proportion of
the failure surface affected by disturbance is controlled by the thickness of the blades. LaRochelle et al. (1973) conducted a systematic study to evaluate the effects of vane thickness
on the measured strength. Their work includes: a) photographic techniques that confirm a
II

186
similar pattern of disturbance to that reported by Cadling and Odenstad (Fig. 6.3b), and b)measurements of cuFv from laboratory tests as a function of vane thickness (perimeter ratio)
(Fig. 6.3c). Their results showed that the undrained shear strength decreases as the vane
thickness increases from 1.6 to 4.7 mm.Vane insertion also generates excess pore pressures in the soil. There are no direct field
measurements of the magnitudes of these pore pressures. However, significant increases
in undrained shear strength (up to 50%) have been observed when the rest period (prior tovane rotation) is increased and have been attributed to dissipation of installation pore
pressures (a process of 'set up' similar to that observed for driven piles in clay). Forexample, figure 6.4 shows measured data for cuv as a function of time after vane insertion
for two sensitive Scandinavian clays (Torstensson, 1977). It can be seen that most of thestrength increase occurs in the first four hours after vane insertion. Data reported in theliterature suggest that the strength increase is most pronounced for highly sensitive clays.
6.3 PREDICTION OF DISTURBANCE DUE TO FIELD VANE INSERTION
The geometry of a standard rectangular field vane can be simulated by superimposing
simple plate solutions (Fig. 6.5). This section describes analytical predictions of strain,
effective stresses, and excess pore pressures due to the installation of a standard field vane.The aspect ratio for each blade of the vane is taken as B/w = 32.5 (refer to Fig. 3.1). The
stress and pore pressure predictions are only considered in a 'steady state' horizontal x-yplane. This corresponds to a plane far above the cutting edge of the vane. These solutions
can be considered representative of disturbance effects acting around the potential vertical
failure surface.
6.3.1 Strains and Deformations
Figure 6.6 shows the magnitude of the octahedral shear strain (E) versus lateral
distance normalized to the equivalent radius (Req) for a vane, where:
R, -- B (6.3)
Along two planes of symmetry (x=y plane, x=O plane), the results are compared with
solutions presented previously for the simple pile and B/w = 32.5 plate. This figure shows
the following:
|I

187
1. Far from the blade, strain levels in the soil are not affected by the shape of thepenetrometer, but are controlled by the volume of soil displaced (i.e., by Req).
2. Near the indenter, the magnitude of Eoct is smaller for the field vane than for a B/w -32.5 plate on the x=0 plane.
3. Along the x=y plane, a local region of minimum E occurs at a radial distance ranging
from about 1-2. This suggests that a small region of soil elements sandwiched betweenthe two blades of the vane will experience less shearing than surrounding soil elements.Contours of final retardation are shown in figure 6.7. Comparison of this result with
the observations shown in figure 6.3 reveal striking similarities, and suggest that what is
I really being shown in figure 6.3 are retardation, or drawdown contours for soil elementsinitially located on a horizontal plane. The visually observed region is where soil elements
I have undergone detectable amounts of net vertical motion during installation.
6.3.2 Effective Stresses and Pore Pressures
Predictions of effective stresses and pore pressures around the field vane are obtained
using the procedures described in previous chapters. Figures 6.8 a, b and c illustratetypical predictions of effective stresses using the MCC model with input parameterscorresponding to KO-normally consolidated BBC, while figure 6.8d shows the excess porepressures from finite element solutions of the Poisson equation. The lateral dimensions in3 the figures are normalized by the equivalent radius (Req = 9 mm for a standard field vane)to enable direct comparison with predictions for other geometries (e.g. simple platesolutions presented in chapter 3). It should also be noted that the results are presented forone quadrant of the field vane, although the geometry imposes additional symmetry aroundthe x=y plane. The figures show the following:1. The lateral effective stress (a'xx) is almost uniform along the surface of the field vane
(d'xx/d v - 0.2 on OB in Fig. 6.8a) and is significantly lower than the free field stress3 ratio, KO = 0.48, but is identical to the stress predicted previously for a simple plate ofsimilar aspect ratio (B/w = 32.5, Fig 3.16d).
2. The in plane shear stress, &'xy/Ov0 (Fig. 6.8b) is symmetric about the x=y plane, and
the predicted magnitudes are similar to those predicted previously for the simple plate.3. The maximum horizontal shear stress, qb/OXvO, gives an indication of the shear stresses
that exist around the field vane prior to vane rotation. Maximum shear stresses occur atlocations r/Rq - 5-7, outside the zone of interest for vane rotation. Along the potentialfailure surface (AB), ch/a'vo - 0.1.
4. Excess pore pressures (Fig. 6.4d) achieve maximum values, (u-uo)/a'vo - 1.1 at
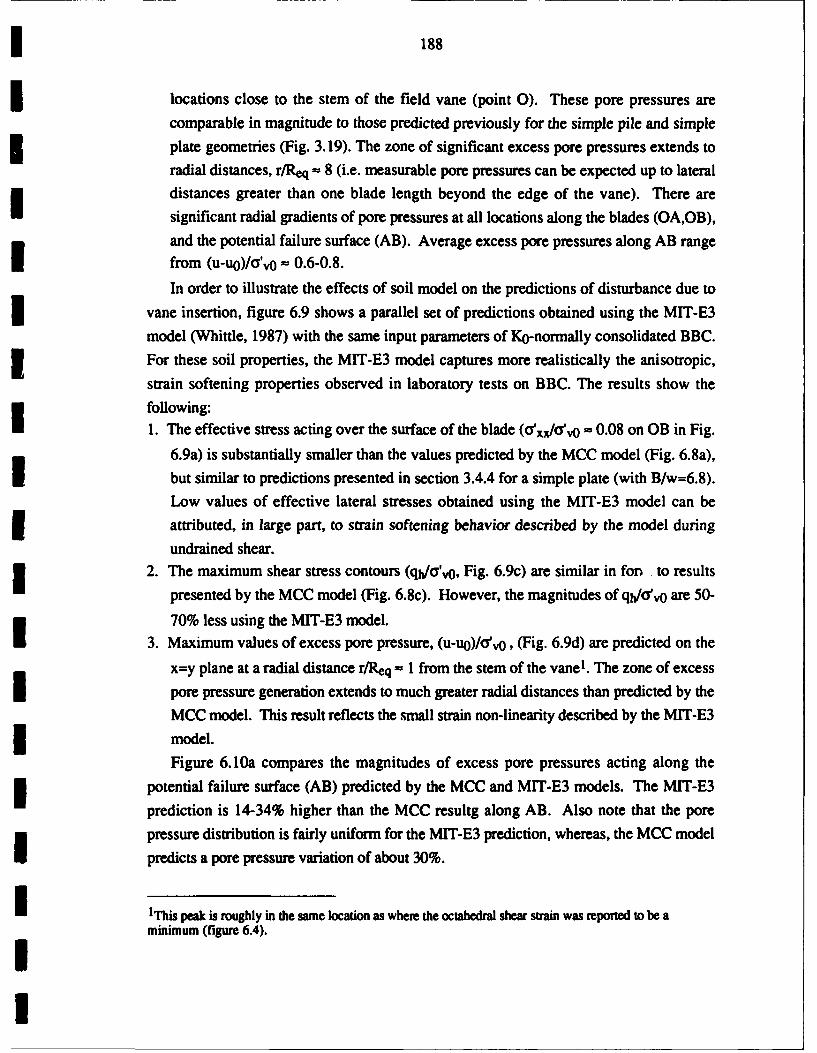
188
locations close to the stem of the field vane (point 0). These pore pressures are
comparable in magnitude to those predicted previously for the simple pile and simple
plate geometries (Fig. 3.19). The zone of significant excess pore pressures extends to
radial distances, r/Req - 8 (i.e. measurable pore pressures can be expected up to lateral
distances greater than one blade length beyond the edge of the vane). There are
significant radial gradients of pore pressures at all locations along the blades (OA,OB),
and the potential failure surface (AB). Average excess pore pressures along AB rangefrom (u-uo)/'v0 - 0.6-0.8.
In order to illustrate the effects of soil model on the predictions of disturbance due to
vane insertion, figure 6.9 shows a parallel set of predictions obtained using the MIT-E3
model (Whittle, 1987) with the same input parameters of Ko-normally consolidated BBC.3 For these soil properties, the MIT-E3 model captures more realistically the anisotropic,
strain softening properties observed in laboratory tests on BBC. The results show the
following:1. The effective stress acting over the surface of the blade (oxx/a',0 = 0.08 on OB in Fig.
6.9a) is substantially smaller than the values predicted by the MCC model (Fig. 6.8a),
but similar to predictions presented in section 3.4.4 for a simple plate (with B/w=6.8).Low values of effective lateral stresses obtained using the MIT-E3 model can be
attributed, in large part, to strain softening behavior described by the model during
undrained shear.2. The maximum shear stress contours (qha'vo, Fig. 6.9c) are similar in fon to results
presented by the MCC model (Fig. 6.8c). However, the magnitudes of q1 O/v0 are 50-
70% less using the MIT-E3 model.3. Maximum values of excess pore pressure, (u-uo)/o'vo, (Fig. 6.9d) are predicted on the
x=y plane at a radial distance r/Req - I from the stem of the vane1. The zone of excess
I pore pressure generation extends to much greater radial distances than predicted by theMCC model. This result reflects the small strain non-linearity described by the MIT-E3
* model.Figure 6.10a compares the magnitudes of excess pore pressures acting along the
potential failure surface (AB) predicted by the MCC and MIT-E3 models. The MIT-E3
prediction is 14-34% higher than the MCC resultg along AB. Also note that the pore
pressure distribution is fairly uniform for the MIT-E3 prediction, whereas, the MCC model
predicts a pore pressure variation of about 30%.
IThis peak is roughly in the same location as where the octahedral shear strain was reported to be a
minimum (figure 6.4).

189
Figure 6.10b compares the radial effective stresses ( o'rr/G'vo ) acting normal to the
potential failure surface (AB) for the MCC and MIT-E3 predictions. These results are of
critical interest in subsequent predictions of undrained shear strength from vane rotation.
The results show:1. For the MCC model, &'rr/c',o values range from 0.45 to 0.55 and hence are similar in
magnitude to the initial K0 =0.48 condition. These predictions support earlier
assumptions of Aas et al. (1986) and Wroth (1984) that vane insertion does not affect
the lateral effective stress acting on the potential failure surface.2. For the MIT-E3 model, O'nr/''v0= 0.2 to 0.25, which represents a significant reduction
in effective stress due to vane insertion. This result can be attributed, in large part, tostrain softening (sensitive) behavior described by the model.
6.4 PORE PRESSURE DISSIPATION
Using initial conditions generated from the 'base case' analysis, linear, uncoupledconsolidation analyses were performed in order to provide preliminary estimates of the
effects of partial drainage in standard field vane test procedures. Figure 6.11 shows thedissipation of excess pore pressure where, u is the current pore pressure, ui is the initialpore pressure after insertion, and uo is the in-situ pore pressure prior to installation. The
results are reported for a dimensionless time factor defined by:
T = cht (6.4)
The dissipation curves are presented for two points: "0", located near the stem of the vaneblade, and "C" located on the x=y plane at a radial distance of r/w = 342. The results show
the following:1. At the stem of the vane (0) dissipation is initially slow, because the initial gradient of
excess pore pressure is small (Fig. 6.8d).2. At C the excess pore water pressure initially rises, leading to a delay in pore water
pressure decay. The normalized pore water pressure dissipation (Au/Aui, Fig. 6.9b)
shows that 50% dissipation will occur at a time factor, T - 6, at the vane stem (0), butwill not occur until T - 15 on the failure surface at point C. Thus, more than twice the
time is required to achieve 50% consolidation on the failure surface.In order to interpret the practical importance of the results presented in figure 6.9, the
2 i.e. on the potential cylindrical failure surface A-B.

190
dissipation times must be scaled using a) the dimensions of a standard field vane (Req - 9mm, and b) typical values of the horizontal coefficient of consolidation (ch). Baligh and
Levadoux (1986) report values of ch for Boston Blue Clay ranging from; ch = 0.01 - 0.04cm 2/sec.
Using this information along with figure 6.11, dissipation times may be calculated,and are reported in table 6.1. These results show the following:1. The typical rest period (At = 5 minutes) between insertion and rotation allows less than
20% consolidation on the potential failure surface. Even slower consolidation can be
expected for sensitive clays, based on initial pore pressure fields presented for MIT-E3.
Hence, partial drainage is not expected to be a significant factor using standard field
vane test procedures in low permeability clays.
2. For points on the potential failure surface (e.g C; Tab. 6.1), 50% consolidation occurs
for 'rest periods' between 0.6 and 1.5 hours. These results suggest that significant
drainage of excess pore pressures will occur in the time frame of 1-10hours and
provides preliminary evidence to explain the increases in undrained shear strengthreported by Torstensson (1977) (Fig. 6.4).
6.5 DISCUSSIONIThe results presented in this chapter represent the first quantitative explanation of
disturbance that occurs during field vane installation, and have shown the following:
1. The visually observed region of disturbance (Fig. 6.3) corresponds to areas of soil
deformation (retardation), but does not provide a measure of the extent of excess pore
water pressure development.
2. Vane installation can lead to significant reductions in the effective normal stress acting
along the potential failure surface, especially for strain softening (sensitive) soils.
3. Very little drainage (less than 20%) occurs during the typical 5 minute rest period
between vane insertion and rotation.
The next step in the field vane research will use the installation conditions presented in
this chapter as initial conditions in the analysis of field vane rotation.

191
0. Near the center of the vane blade:
Excess Pore Pressure Ratio: Time, t (minutes) Time, t (minutes)U = (u - uO)l(u i - uO) ch = 0.01 cm 2/sec Ch = 0.04 cm2/sec
80% 2.0 8.0
60% 5.4 21.6
40% 12.2 48.8
20% 40.5 162
i C. On the potential failure surface:
Excess Pore Pressure Ratio: Time, t (minutes) Time, t (minutes)
U = (u - uo)/(ui - uO) Ch = 0.01 cm 2/sec Ch = 0.04 cm2/sec3 80% 5.4 21.6
60% 11.5 46.0
40% 27.0 108.0
20% 74.3 297.2
Table 6.1. Pore pressure dissipation following vane installation; linear uncoupled analysis

I192
III
II
I
I 5
I accu¢TN"ua, VANE tAPCRO VAK
*D D65 mmH =130 mmt=2 mm
II Figure 6.1. Typical Field Vane geometries
II

193
hea stress on vone periphery. tI /I t!4;i
00 ~ ~ ',Merizies&MerrifieldI f 0 ~Ion B-B)__ n et a-
(on A -A)
I Equilvolentelevation -a rectaculu
distribuo
I%
PLAN
3 Figure 6.2. Distribution of shear stresses along potential Field Vane failure surface

I 1940
3 Per wnter ratio.
Figure 6.3a. Cadling and Odenstad (1948) model of disturbance due to vane insertion
Lob Yane inlI 4Z11 C' -
3 Figure 6.3b. Observation of disturbance due to vane insertion (LaRochelle ct al., 1973)
~B/w 32.5 20 1050 "
\~rn depth 4m
3 - e l.6 9 1.95 3.10 * 4.0mrn05 10 153 Penmeter ratio, cL, %
Figure 6.3. Measured undrained shear strength as a function of Field Vane aspect ratio3 (La Rochelle et al. 1973)

195
1.Tskim
lp:8090%S,--12
0\.Bibckebolle I 0 -65%; St 20-3
5min 2Dmin Ihour 4 hours 1iday 7daysLength of 'rest' period
Figure 6.4. Increase in undrained shear strength due to time delay after vane insertionI (Torstensson, 1977)

196
z
nr
Ix
Figure 6.5. Simulation of Field Vane geometry using Simple Pline solutions

197
looW 0
aN6
cc 8
CDU
CL)

198
50
30 (z-zyw= .05~
10
- 10
-30
-50 II-50 -30 -10 10 30 50
IFigure 6.7. Vertical retardations of soil elements predicted around Field Vane

199
>0 9
0o c o0 m c 0 T
(0 *W N 0*WA
N w
rd-
00 D w0 N 0o 0
Nl V- WA b*WA
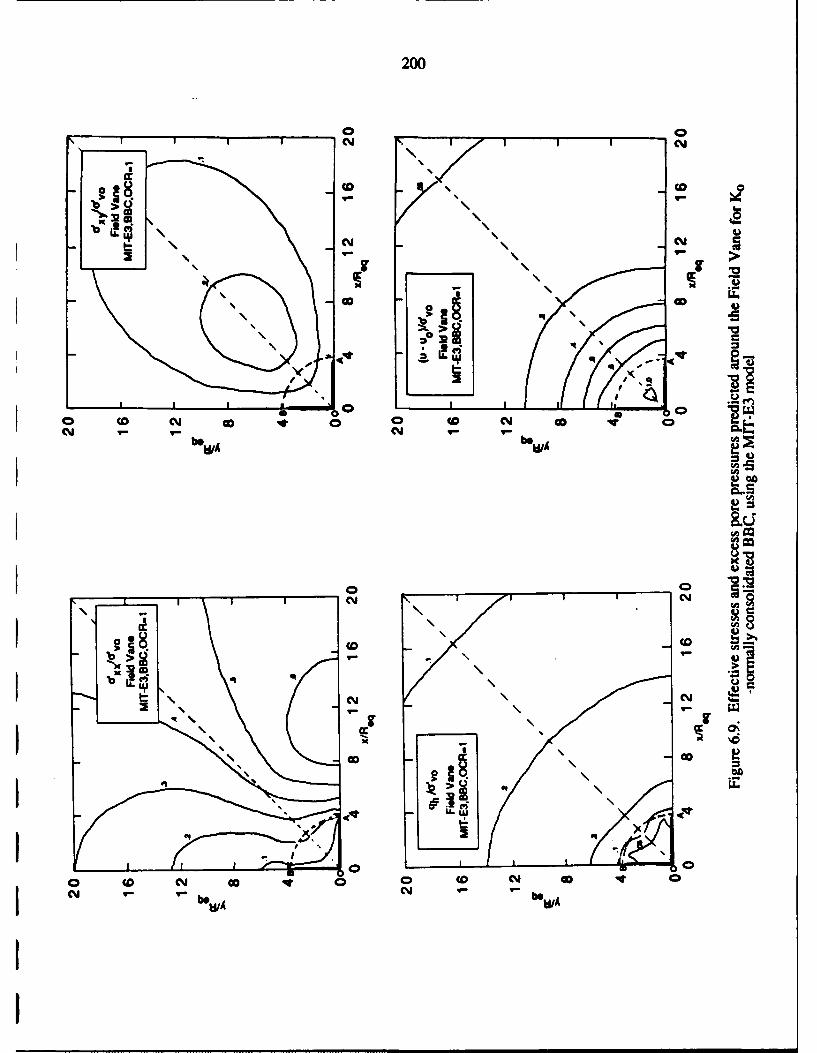
200
00
lu g.6cc -
2 %& I ,
eq %0
co~~~ (D c c
CY C0bN
9- 9-
> 0 m
CY~ 9*AC - be W

201
1 2
1 1.60
-o M IT -__ _ _ _ __E 3_
S0.8MC
0 -04
0 10 20 30 40 50 60 70 80 90
o (degrees)
1.60 1 A01.2
I0.4 MIT.- E3
0 10 20 30 40 50 60 70 80 90I 0 (degrees)
Figure 6. 10. Excess pore pressure and radial effective stress acting on potential failure surface

I 202
00.8
-b0.6
0.4
* 0.2
00.01 0.1 1 10 100 1000
TimieFactor, T -Q-
31.20U 1
~ 0.8 Auj~dvo from MCC model
U ~0. 60 Ik,= 9mm for a standard Field Vane3 ~ 0.4
* 0.2
00.01 0.1 1 10 100 1000
Time Factor, T = -IR3Figure 6.11. Dissipation of excess pore pressures around the Field Vane, linear uncoupled
analysis

203
7. SUMMARY
The research achievements during the second year of the project have included thefollowing:
1. The development and evaluation of reliable numerical methods for estimating porepressure distributions around penetrometers from the Strain Path Method. In theproposed method, equilibrium conditions are satisfied by numerical solution of aPoisson equation. This formulation avoids arbitrary assumptions regarding the path ofintegration and is particularly suitable for more complex penetrometer geometries. Animportant modification of the Poisson formulation is introduced to enforce verticalequilibrium conditions ahead of the tip of the penetrometer. The proposed formulation
has been used to estimate distributions of excess pore pressures for piezoconepenetrometers (section 4), the Marchetti dilatometer (section 5) and the field vane(section 6).
2. The mechanics of flat plate penetration have been clarified using the fundamentalanalytical solutions for a simple plate geometry. It has been shown that plate geometrycan be understood in terms of two parameters: a) the aspect ratio, B/w, (i.e., the ratio of3 the length to width of the plate), and b) the equivalent radius, Rq, which is a measure ofthe volume of soil displaced by the penetrometer. The equivalent radius controls thelateral extent of disturbance caused by the plate installation (e.g., at locations far from
the surface of the penetrometer, soil strains and displacements depend only on thevolume of soil displaced). The aspect ratio controls the distribution of stresses and porepressures in the soil around the penetrometer. The magnitudes of effective stresses andexcess pore pressures acting at the center of the plate are similar to predictions presented3 previously for axisymmetric penetrometers and are not significantly affected by theaspect ratio of the plate (for the aspect ratios considered in this study; 6.8<B/w<32.5)3 Excess pore pressures acting at the edge of the plate are typically 20-25% smaller than atthe center of the plate. Dissipation of excess pore pressures measured at the center ofplate penetrometers are controlled by the equivalent radius of the penetrometer.
3. Comprehensive strain path analyses have been used to predict the stresses and porepressures acting around a piezocone penetrometer in normally and lightlyoverconsolidated clays (OCR.4). The analyses have demonstrated the effects of tipgeometry, soil modeling and stress history of the soil on piezocone measurements

204
during steady penetration:The results have confirmed that net tip resistance and tip pore presssures (measured
either at the tip of the 600 cone or on the face of the cone) are the measurements whichcorrelate most closely with undrained shear strength (or preconsolidation pressure) ofthe soil1 . However, interpretation of undrained shear strength using either of thesemeasurements contains a number of uncertainties which have yet to be resolved: 1) Thepredicted tip resistance factor is affected by other soil properties such as strain softening,which have yet to be investigated in detail; 2) the measured tip resistance is often notreliable due to the difficulty in correcting for unequal area effects; 3) the analyticalsolutions generally underpredict the measured pore pressures. This result is probablydue to strain rate dependent behavior of the clay which is not described by the existingsoil models.
The predictions show that pore pressures measured at the base of the cone aredifficult to interpret due to the large gradients of the excess pore pressures in the soil.Pore presssures measured at the base or at locations along the shaft of the piezocone arealso much less sensitive to changes in undrained shear strength or preconsolidationpressure than those obtained on the face of the cone.
Comparisons of analytical predictions with field data from piezocone tests inBoston Blue Clay at two sites have shown that the analytical predictions can describe
accurately trends in the measured data. However, consistent differences in the data at thetwo sites suggests differences in the soil properties at the two sites which require further
investigation.4. Using the analytical developments described in sections 2 and 3, strain path analyses of
the Dilatometer contact pressure, po, have been presented for normally and lightly
overconsolidated clays (OCR.54). The analyses show that the stresses acting on thedilatometer membrane are not uniform due to the proximity of the membrane to the tip ofthe penetrometer. A systematic study of the predicted contact pressure has found thatthere are no simple linear correlations between the po and the undrained shear strength orpreconsolidation pressure of the soil. Furthermore, the predictions show that even whenpore pressures are measured on the dilatometer membrane (as proposed by a number of
authors) there is still no simple interpretation of engineering properties from contactconditions. Thus, the analyses imply serious limitations of the dilatometer for estimating
IThese results support the use of the centerline analyses presented by Whittle et al. (1989).

205
engineering properties of clays. A direct comparsion of analytical predictions with
measured data in Boston Blue Clay confirms that stress history cannot be reliably
estimated from the contact pressure. Further studies of data from seven well documented
test sites has shown that dilatometer contact pressures exhibit significant scatter and that
site specific correlations for estimating the preconsolidation pressure vary significantly
for different types of clay.5. Based on the results in section 6, the disturbance caused by field vane installation has
been clarified: In contrast to existing hypotheses, the analyses show that disturbance of
the stress and pore pressures fields is not limited to the soil immediately adjacent to the
blades of the vane. Large excess pore pressures are predicted at points along thepotential failure surface (Au/d',0=0.8 to 1.0; for Ko-normally consolidated BBC),
while significant reductions in effective stresses occur for sensitive clays (less than K0
conditions). Preliminary calculations of pore pressure dissipation show that there there islittle dissipation of the installation pore pressures during a typical rest period (prior to
vane rotation), however, almost complete dissipation occurs within 1 to 5 hours after
vane insertion.

206
8. REFERENCES
Aas, G., Lacasse, S., Lunne, T. & Hoeg, K. (1986) "Use of in-situ tests for foundation
design on clay," Proc. ASCE Specialty Conference on Use on In Situ Tests in
Geotechnical Engineering (in-Situ '86), Blacksburg, VA., pp 1-30.
ASTM (1972) "Standard Test Method for Field Vane Shear Test in Cohesive Soil" ASTMStandard D 2573-72
Azzouz, A.S., Baligh, M.M. & Ladd, C.C. (1982), "Cone penetration and engineering
properties of soft Orinoco clay," MIT Sea Grant Report, MITSG-82-11, 53p.
Azzouz, A.S. & Baligh, M.M. (1984) "Behavior of friction piles in plastic Empire clays,"
Research Report R84-14, Dept. of Civil Engineering, MIT, Cambridge, MA.,
619p.Azzouz, A.S. & Lutz, D.G. (1986) "Shaft behavior of a model pile in plastic Empire
clays," ASCE. Journal of Geotechnical Engineering. Vol. 112, No. GT4, pp. 389-
406.
Baguelin, F.J. & Jezequel, J.F. (1983) "The LPC pressiopenetrometer," Proc,.ASCE
Conf. on Geotechnical Practice in Offshore Engineering, Austin, TX, pp. 203-219.Baligh, M.M. (1975), "Cavity expansion in sands with curved envelopes," ASCE. Jounal
of Geotechnical Engineering, Vol. 102, GT1 1, pp. 1131-1146.
Baligh, M.M. (1985a), "Strain Path Method," ASCE. Journal of Geotechnical
Engineering, Vol. 111, No. GT9, pp. 1108-1136.Baligh, M.M. (1985b), "Fundamentals of deep penetration, I: Shear stresses," MIT Report
R85-9, Order No. 776, 64p.
Baligh, M.M. (1985c), "Fundamentals of deep penetration, II: Pore pressures," MITReport R85-10, Order No. 777, 78p.
Baligh, M.M. (1986a) "Undrained deep penetration: 1. Shear stresses," ,hnique,
Vol. 36, No. 4, pp. 471-485.
Baligh, M.M. (1986b) "Undrained deep penetration: II. Pore pressures," G,
Vol. 36, No. 4, pp. 487-501.
Baligh, M.M. (1986c) "Dervation and development of piezocone penetrometer data
interpretation methods," Report submitted to the US Bureau of Mines, 3 Vols.
Baligh, M.M. & Levadoux, J-N. (1980), "Pore pressure dissipation after cone
penetration," MIT Report No. 80-11, Order No. 662, Dept. of Civil Engrg., MIT,
Cambridge, MA.Baligh, M.M. & Levadoux, J-N (1986), "Consolidation after undrained piezocone
penetration II: Interpretation," ASCE Journal of Geotechnical Engineering, Vol.
1 207
1112, No. GT7, pp. 727-745.Baligh, M.M., Vivatrat, V. & Ladd, C.C. (1980) "Cone penetration in soil profiling,"
I ASCE Journal of Geotechnical Engineering, Vol. 106, GT4, pp. 447-461.
Baligh, M.M., Azzouz, A.S., Wissa, A.E.Z., Martin, R.T. & Morrison, M.J. (1981)
"The Piezocone Penetrometer," Prc. Symposium on Cone Penetration Testing and
Experience, ASCE Natl. Convention, St. Louis, MO., pp. 247-263.
Bathe, K.J. (1982), Finite Element Procedures in Engineering Analysis, Prentice-Hall,
I N.J.
Bathe, K.J. (1987) A Finite Element Program for Automatic Dynamic Incremental
Nonlinear Analysis of Temperatures, Report ARD 87-2, ADINA R&D, Inc.,
Watertown,MA.
I Battaglio, M. & Maniscaldo, R. (1983) "I1 piezocono: Esecuzione ed interpretazione,"
Report No. 607, Politecnico di Torino.
I Battaglio, M., Bruzzi, D., Jamiolkowski, M. & Lancellotta, R. (1986) "Interpretation of
CPT's and CPTU's," Proc. 4th Intl. Geotechnical Seminar on Field
Instrumentation and in Situ Measurements, Singapore.
Berg, A.P.v.d. (1982)"Latest development in static cone penetrometers ans other soil
testing equipment," ELQ.L, 2nd European Symposium on Penetration Testing,
Amsterdam, Vol. 2, pp. 447-455.
Bjerrum, L. (1972) "Embankments on soft ground," Proc. ASCE Spec. Conf. on
I Performance of Earth and Earth Supported Structures, Lafayette, Ind., Vol. 2, pp.
1-54.
Boghrat, A. (1982) "The design and construction of a piezoblade and evaluation of the
Marchetti dilatometer in some Florida soils," PhD Thesis, Univ. of Florida,
Gainsville, FL.1Bond, A.J. (1990) "Behaviour of displacement piles in overconsolidated London Clay,"
PhD Thesis, University of London, 725p.5 Briaud, J.L. & Shields, D. (1979) " A special pressuremeter and pressuremeter test for
pavement evaluation and design," ASTM Geotechnical Testing Journal, Vol. 2,
No. 3, pp. 143-151.Burland, J.B. (1990) "On the compressibility and shear strength of natural clays,"
i tchbni=im, Vol. 40, No.3, pp 329-378.
Butterfield, R. & Bannerjee, P.K., (1970), "The effect of pore water pressure on the
ultimate bearing capacity of driven piles," Proceedings. 2nd S.E. Asia Conf. on
I Soil Enineering, Singapore, pp 385-394.
Cadling, L. & Odenstad, S. (1948) "The Vane Borer," Proc Royal Swedish GeotechnicalII

208
Insitut, No. 2.Campanella, R.G. & Robertson, P.K. (1988) "Current status of the piezocone test", DQg.
ISOPT-1, Orlando, FL., Vol. 1, pp. 93-117.
Campanella, R.G., Gillespie, D. & Robertson, P.K. (1982), "Pore pressure during cone
penetration," Pro. ESO=lj, Amsterdam, Vol. 2, pp. 507-512.
Carlson, L. (1948) "Determination in situ of the shear strength of undisturbed clay bymeans of a rotating auger," Proc. 2nd Intl. Conf. on Soil Mechs. & Fdn. Eng'g.,
Rotterdam, Vol. 1, pp 265-270.Chandler, R.J. (1988) "The in-situ measurement of the undrained shear strength of clays3 using the field vane", Vane Shear Testing in Soils: Field and Lab. Studies, ASTM
STP 1014, pp. 13-44.
Chin, C.T & Whittle, A.J. (1984) "The use of ADINAT to solve a Poisson equation: Thesolution of the octahedral stress field caused by penetration of a 2-D axisymmetric
indenter," Unpublished Project, MIT, Cambridge, MA.
Chin, C.T. (1986), "Open-ended pile penetration in saturated clays," PhD Thesis, MIT,
Cambridge, MA, 296p.
Cleveland, W.S. (1979), "Robust locally weighted regresion and smoothing scatterplots",Journal of the American Statistical Association. Vol. 74, No. 368, Theory andMethods Section, pp 829-836.
DeGroot, D.J. (1989) "The Multi-Directional Simple Shear Apparatus with application to3 the design of offshore Arctic structures," PhD Thesis, MIT, Cambridge, MA.
de Ruiter J. (1971) "Electrical penetrometer for site investigation", ASCE Journal for Soil
Mechs. & Fdn. Engrg., Vol 97, No. SM2, pp. 457-472.
de Ruiter J. (1981) "Current Penetrometer Practice", Proc. Symposium on ConePenetration Testing and Experience, ASCE Natl. Convention, St. Louis, MO., pp.
3 1-48.
de Ruiter J. (1982) "The static cone penetration test State-of the-Art Report", Proc.3 ESOI-II, Vol. 2, Amsterdam, pp 389-405.Donald, I.B., Jordan, D.O., Parker, R.J. & Toh, C.T. (1977) "The Vane Test- A critical
3 appraisal," Proc. 9th Intl. Conf. on Soil Mechs. & Fdn. Engrg., Tokyo, Vol. 1, pp
81-88.Draper, N., & Smith H. (1981), Applied Regression Analysis, John Wiley & Sons, New
York.Elghaib, M.K. (1989), "Prediction and interpretation of piezocone tests in clays, sands and
3 silts," PhD Thesis, MIT, Cambridge, MA, 404p.
Germaine, J.T. (1980) "Evaluation of self-boring pressuremeter tests in soft cohesiveII

209
soils," SM Thesis, MIT, Cambridge, MA.
Handy, R.L., Remmes, B., Moldt, S. & Lutenegger, A.J. (1982) "In-situ stress
determination by Iowa stepped blade," ASCE Journal of Geotechnical Eng1neerins,
Vol. 108, No. GT11, pp. 1405-1422.Henkel, D.J. (1960) "The relationships between the effective stresses and water content in
saturated clays," . bnc, igl,. , Vol. 10, pp. 41-54.Hess, J.L. & Smith, A.M.O. (1962), "Calculation of non-lifting potential flow about
arbitrary three dimensional bodies," Douglas Aircraft Company Report No. ES-
40622.
Hess, J.L. & Smith, A.M.O. (1964), "Calculation of non-lifting potential flow about
arbitrary three dimensional bodies, Journal of Ship Research, Vol. 8, No. 2, pp.
22-44.
Hight, D.W., Gens, A., & Symes, M.J. (1983) "The development of a new hollow
cylinder apparatus for investigating the effects of principle stress rotation in soils,"
Goshni=, Vol. 33 No. 4, pp. 385-396.Huang, A-B. (1989), "Strain path analyses for arbitrary 3-D penetrometers", Intl J. for
Anal. & Num. Meth. in Geomech., Vol. 13, No. 5, pp. 551-564
Jamiolkowski, M., Ladd, C.C., Germaine, J.T. & Lancellotta, R. (1985) "New
developments in field and laboratory testing of soils, Theme Lecture 2," r1. IIthIntl. Conf. on Soil Mechs. & Fdn. Engrg., San Fransisco, Vol. 1, pp. 57-153.
Jamiolkowski, M., Battaglio, M. & Bruzzi, D. (1989) "Discussion, Session 3," Eo..Conf. on Penetration Testing in the UK, Birmingham, pp. 180-183.
Janbu, N. & Senneset, K. (1974) "Effective stress interpretation of in-situ static
penetration tests," Pr .E -, Stockholm, Vol. 2.2, pp. 181-193.
Jardine, R.J. & Bond, A.J. (1989) "Behaviour of displacement piles in heavily
overconsolidated clay," Proc. 12th Intl. Conf. on Soil Mechs. & Fdn. Engrg., Rio
de Janiero, Vol. 2, pp. 1147-1152.
Jones, G.A. & Rust, E. (1982) "Piezometer penetration testing," Proc. ESOPT-Il,
Amsterdam, Vol. 2, pp. 607-613.
Jones, G. A., Van Zyl, D. & Rust, E. (1981) "Mine tailings characterization by piezometer
cone", Proc. Symposium on Cone Penetration Testing and Experience, ASCE Natl.
Convention, St. Louis, MO., pp. 303-324.
Karlsrud, K. & Haugen, T. (1985) "Axial statsic capacity of steel model piles in
overconsolidated clay," Proc. 1 lth Intl. Conf. on Soil Mechs. & Fdn. Enug.,San
Fransisco, Vol. 3, pp. 1401-1406.
Kjekstad, 0., Lunne, T., and Clausen, C.J.F. (1978) "Comparison between in-situ coneII

210
resistance and laboratory strength for overconsolidated North Sea Clays", MarineG, Vol. 3, No. 1, pp. 23-36.
Konrad, J.M. & Law, K.T. (1987) "Preconsolidation pressure from piezocone tests inmarine clays," jG jji , Vol. 37, No. 2, pp. 177-190.
Lacasse, S. (1979) "Effect of load duration on undrained behaviour of clay and sand,"NGI Internal Report, No. 40007-2.
Lacasse, S. & Lunne, T. (1982) "Dilatometer tests in two soft marine clays," Proc. Conf.
on Updating Subsurface Sampling of Soils and Rocks and their In-situ Testing,Santa Barbara, CA., 8p. (also NGI Report No. 146)
Lacasse, S. & Lunne, T. (1988) "Calibration of dilatometer correlations," EPr,,.I.SQE-1,Orlando, FL., Vol. 1, pp. 539-548.
Ladanyi, B. & Eden, W.J. (1969) "Use of the deep penetration test in sensitive clays,"Proc. 7th Intl. Conf. on Soil Mechs. & Fdn. Engrg., Mexico City, Vol. 1, pp.225-230.
Ladd, C.C. (1989) "Stability evaluation during staged construction," 22nd Terzaghi
Lecture, to be published in ASCE Journal of Geotechnical Engineering.
Ladd, C.C. (1990) Unpublished report submitted to Haley & Aldrich, Cambridge, MA.Ladd, C.C. & Foott, R. (1974) "New design procedure for stability of soft clays," ASCE.
Journal of Geotechnical Engineern, Vol. 100, No. GT7, pp. 763-786.Ladd, C.C. & Foott, R. (1977) "Foundation design of embankments constructed on
varved clays," FHWA Report No.TS-77-214, US Dept of Transportation, 234p.
Ladd, C.C., Foott, R., Ishihara, K., Schlosser, F. & Poulos, H.G. (1977) "Stress-
deformation and strength characteristics, State-of-the-Art Paper," Proc. 9th Intl.
Conf. on Soil. Mechs. & Fdn. Enmg., Tokyo, Vol. 2, pp. 421-494.LaRochelle, P., Roy, M. & Tavenas, F. (1973) "Field measurements of cohesion in
Champlain clays," Proc. 8th Intl. Conf. on Soil Mechs. & Fdn. Engrg., Moscow,
Vol. 1, pp. 229-236.Levadoux, J-N. (1980) "Pore pressures in clays due to cone penetration," PhD Thesis,
MIT, Cambridge, MA., 752p.
Levadoux, J-N. & Baligh, M.M. (1980), "Pore pressures in clays due to cone
penetration," Research Report R80-15, Order No. 666, Dept. of Civil Engrg.,MIT, Cambridge, MA.
Levadoux, J-N, Baligh, M.M. (1986), "Consolidation after undrained piezoconepenetration. I: Prediction", ASCE. Journal of Geotechnical Engineering,Vol. 112,
No. GT7, pp 707-726.Lee, J.T. (1987) "A potential based panel method for the analysis of marine propellers inI
I

211
steady flow," PhD Thesis, MIT, Cambridge, MA.Lunne, T., Myrvoll, F., & Kjekstad, 0. (1981) "Observed settlements of five North Sea
gravity platforms, NGI Technical Report No. 524 10/s-6.Lunne, T., Christoffersen, H.P., & Tjelta, T.I. (1985) "Engineering use of the piezocone
test in North Sea Clays," Proc. 11Ith Intl. Conf. on Soil Mechs. & Fdn. Engrg.,San Fransisco, Vol. 2, pp. 907-912.
Lunne, T. , Lacasse, S., Rad, N.S. & Decourt, L. (1989) "SPT, CPT, Pressuremetertesting and recent developments on in-situ testing: General Report Session 2,"Proc. 12th Intl. Conf. on Soil Mechs. & Fdn. Engrg., Rio de Janeiro, 65p.
Lutenegger, A.J. (1988) "Current status of the Marchetti dilatometer," Prc SP-Orlando, FL, Vol. 1, pp. 137-155.I Lutenegger, A.J. & Kabir, M.G. (1988) "Dilatometer C-reading to help determinestratigraphy," It ISOPT-1, Orlando, FL., Vol. 1, pp. 549-554.
Luttenegger, A.J. & Blanchard, K.C. (1990) "A comparison between full displacement
pressuremeter tests and dilatometer tests in clay," Proc. 3rd Intl, Conf. onPrsueeerTsig Oxford, pp. 309-320.
Lutenegger, A.J., Timian, D.A. (1986) "In-situ tests with KO-Stepped Blade," Proc.ASCE Conf. on Use of In-situ Tests in Geotechnical Engineering. (In-situ '86),
1 Blacksburg, VA, pp 730-751.Marchetti, S. (1980) "In-situ tests by flat dilatometer," ASCL, Journal of GeotechnicalI Engineeing, Vol. 106, No. GT3, pp. 299-321.Marchetti, S., Totani, G., Campanella, R.G. & Robertson, P.K. (1986) "The DMT aHlC
method for piles driven in clay," Proc.. ASCE Conf. on Use of In-Situ Tests in
Geotechnical Engineering. (ln-situ '86), Blacksburg, VA., pp. 765-779.Mayne, P.W. (1986), "CPT indexing of in-situ OCR in clays," Proc.. ASCE Conf. onI Use of In-Situ Tests in GeotechnicaI Engineering. (In-situ '86), Blacksburg, VA.,
pp. 780-793.Mayne, P.W. (1987) "Determining preconsolidation stress and penetration pore pressures
from DMT contact pressures," ASTM Geotechnical Testing Journal,, Vol. 10, No.I 3, pp. 146-150.Mayne, P.W., Kulhawy, F.H. & Kay, J.N. (1990) "Observations on the development of
pore-water stresses during piezocone penetration in clays," Canadian GeotechnicalI Journal. Vol. 27, pp. 4 18-428.Menzies, B.K& Merrifield, C.M. (1980) " Measurements of shear stress distribution on
Ithe edges of a shear vane blade" Gdtehnique, Vol. 30, No. 2, pp. 314-318.
Morino, L. & Kuo, C-C. (1974), "Subsonic aerodynamics for complex configurations,"

212
AAA J. urna Vol. 12, No. 2, pp. 191-197.
Morrison, M.J. (1984) " In situ measurements on a model pile in clay," PhD Thesis, M1T,
Cambridge, MA., 700p.Newman, J.N. (1986) "Distributions of sources and normal dipoles over a quadrilateral
panel," Journal of Engineering Mathematics, Vol. 20, pp. 113-126.
Nyirenda, Z.M. & Sills, G.C. (1989) "Discussion, Session 3," Proc. Conf. on Penetration
Testing in the UK, Birmingham, pp. 183-184.
Powell, J.J.M. & Uglow, I.M. (1988) "Marchetti dilatometer testing in UK soils," ErQISOI-I, Orlando, FL., Vol. 1, pp. 555-562.
Powell, J.J.M., Quartermain, R.S.T. & Lunne, T. (1989) "Interpretation and use of the
piezocone test in UK clays," Proc. Conf. on Penetration Testing in the UK,
Birmingham, pp. 151-156.
Rad, N. S. & Lunne, T. (1988) "Direct correlations between piezocone test results and
undrained shear strength of clay," erc LSQP-1, Orlando, FL., Vol. 2, pp. 911-
918.
Randolph, M.F., Carter, J.P. & Wroth, C.P. (1978), "Driven piles in clay: Effects of
installation and subsequent consolidation," Qoitehnigi, Vol. 29, No. 4, pp. 361-
393.
Ridgen, W.I., Thorburn, S., Marsland, A. & Quartermain, R.S.T. (1982) "A dual load
range cone penetrometer," Pro ESOT-I, Amsterdam, Vol. 2, pp. 787-796.
Robertson, P.K. & Campanella, R.G. (1983), "Interpretation of cone penetration tests, II:
Clays," Canadian Geotechnical Journal, Vol. 20, No. 4, pp. 734-745.
Robertson, P.K., & Campanells, R.G. (1984) "Guidelines for use and interpretation of the
electronic cone penetration test", Soil Mechanics Series No.69, Dept. of C.E., The
University of British Columbia, Vancouver.
Robertson, P.K., Campanella, R.G., Gillespie, D., & Greig, J. (1986) "Use of
piezometer cone data" Proc. ASCE Conf. on Use of In-situ Tests in Geotechnical
Engineering. (In-situ '86), Blacksburg, VA, pp. 1263-1280.
Robertson, P.K., Campanella, R.G., Gillespie, D. & By, T. (1988) "Excess pore
pressures and the flat dilatometer test," Pr.Lj,,-, Orlando, FL., Vol. 1, pp.
567-576.
Roscoe, K.H., Burland, J.B. (1968) "On the generalized stress-strain behaviour of 'Wet'
clay", Engineering Plasticity , Ed. J. Heyman and F.A. Leckie, Cambridge
University Press, pp. 535-609.
Rourk, T.L. (1961) "Model studies of a pile failure surface in a cohesive soil, " MSThesis, Georgia Inst. of Tech., Atlanta.

213
Rouse, H. (1959) Advanced Mechanics of Fluids, Wiley & Sons, New York.
Roy, M & Leblanc, A. (1988) "Factors affecting the measurement and interpretation of the
vane strength in soft sensitive clays," Vane Shear Testing in Soils: Field and Lab
Studie, ASTM STP 1014, pp. 117-130.
Schaap, L.H.J. & Zuidberg, H.M. (1982) "Mechanical and electrical aspects of the
electrical cone penetrometer tip," Prc. ESOPT-II, Amsterdam, Vol. 2, pp. 841-
851.
Schmertmann, J.H. (1982) "A Method for determining the friction angle in sands from theMarchetti dilatometer test," Proc. 2nd European Symp. on Penetration Testing.
I LESOEL2), Amsterdam, Vol. 1, pp. 853-861.
Schmertmann, J. (1986) "Suggested method for performing the flat dilatometer test,"
IASTM Geotechnical Testing Journal, Vol. 9, No. 2, pp. 93-101.
Senneset, K., Janbu, N. & Svan0, G. (1982), "Strength and deformation parameters fromJcone penetration tests, "Ptr., 2nd European Symposium on Penetration Testing,Amsterdam, Vol. 2, pp. 863-870.
Senneset, K. & Janbu, N. (1984), "Shear strength parameters obtained from static cone
penetration tests, "ASTM STP No. 883. pp. 41-54.
Skempton, A.W. (1954) "The pore pressure coefficients A and B," Gc hni , Vol. 4,
INo. 4, pp.143-152.
Smits, F.P. (1982) "Penetration pore pressure measured with piezometer cones", Erc.
ESOPT-II, Amsterdam, Vol. 2, pp. 887-881.
Soderberg, L.O., "Consolidation theory applied to foundation pile time effects,"
G, Vol. 12, pp. 217-225.
Sully, J.P., Campanella, R.G. & Robertson, P.K. (1987), "Overconsolidation ratio of
clays from penetration pore pressures," ASCE Journal of Geotechnical
Engacring , Vol. 114, No. GT2, pp. 209-216.
Tavenas, F., Blanchette, G., Leroueil, S., Roy, M. & LaRochelle, P. (1975) "Difficulties
Iin the in-situ determination of K0 in soft sensitive clays" (1975) Proceedings: In-
Situ Measurement of Soil Properties, Raleigh, NC, pp. 450-476.
ITavenas, F., Leroueil, S., and Roy, M. (1982) "The piezocone test in clays: Use and
limitations" Proc. Ei, ]], Amsterdam, Vol. 2, pp. 889-894.
Tedd, P. & Charles, J.A. (1981) "In-situ measurement of horizontal stress in
overconsolidated clay using push-in spade-shaped pressure cells," G,Vol. 31, No. 4, pp. 554-558.
ITeh, C-I (1987), "An analytical investigation of the cone penetration test," PhD Thesis,
University of Oxford.
I

214
Teh, C-I Houlsby, G.T. (1987), "Undrained deep penetration, I. Shear stresses;
Discussion of Paper by M.M. Baligh," Gi1ebnigue, Vol. 37, No. 4, pp. 525-I[ 527.
Teh, C-I & Houlsby, G.T. (1989) "An analytical study of the cone penetration test in
clay," Oxford University Soil Mechanics Report, No. OUEL 1800/89.
Thornburn, S., Laird, C.L., & Reid, W.M., (1981) "The importance of stress histories of
cohesive soils and the cone penetration test", The Structural Engineer, 59A, pp. 87-
92.Torstensson, B.A. (1975) "Pore pressure sounding instrument," Proc. ASCE Conf. on In-
situ Measurement of Soil Properties. Rayleigh, NC, Vol. 1, pp. 48-54.
Torstensson, B.A. (1977) "Time-dependent effects in the field vane test," Imiu monU..SfLaCy, Bangkok, pp 387-397.
Torstensson, B.A. (1982) "A combined pore pressure and point resistance probe," Erm.,ESOPT-II, Amsterdam, Vol. 2, pp. 903-908.
Tumay, M.T., Acar, Y.B., Cekirge, M. & Ramesh, N. (1985) "Flow field around cones
in steady penetration," ASCE. Journal of Geotechnical Engineering, Vol. 111, No.IGT2, pp. 325-342.Vivatrat, V. (1978) "Cone penetration in clays," PhD Thesis, MIT, Cambridge, MA.,
1427p.Weinstein, A. (1948) "On axially symmetric flows," Quarterly of Applied Mathematics,
IVol. 5, No. 4, pp. 429-434.
Whittle, A.J. (1987) "A constitutive model for overconsolidated clays with application to
the cyclic loading of friction piles," ScD Thesis, MIT, Cambridge, MA. 641p.
Whittle, A.J. (1989a), "A model for overconsolidated clays: I Formulation," submitted
submitted for publication, December 1989
Whittle, A.J. (1989a), "A model for overconsolidated clays: II Evaluation," submitted for
publication, December 1989.
I Whittle, A.J. (1990), "A constitutive model for overconsolidated clays," MIT Sea Grant
Report No. MITSG90-15.
I Whittle, A.J., Ladd, C.C., Baligh, M.M. (1989) "Interpretation of in-situ testing of
cohesive soils using rational methods", Annual Technical Report submitted to AirForce Office of Scientific Research Report, November.
Whittle, A.J. & Baligh, M.M. (1990), "Prediction and evaluation of pile shaft behaviour in
lightly overconsolidated clays," submitted for publication.
IWhittle, A.J. & Aubeny, C.P. (1991) "Pore pressure fields around piezocone
penetrometers installed in clays," Proc. IACMAG'91 Cairns, Australia, May.II

1 215
I Williamson, A.E. (1989) "Use of a panel method to predict disturbance due topenetrometer installation in clays", SM Thesis, M1T, Cambridge, MA, 143p.
I Wissa, A.E.Z., Martin, R.T. & Garlanger, J.E. (1975) "The Piezometer Probe," Pro,ASCE Conf. on In-situ Measurement of Soil Properties. Rayleigh, NC, Vol. 2,pp. 536-545.
Withers, N.J., Schapp, B.L., and Dalton C. (1986) "The development of the fulldisplacement pressuremeter," The Pressuremeter and its Marine Applications,ASTM STP No. 950, pp. 38-56.
Woodward-Clyde Consultants (1989) "Analysis of instrumentation data, Arthur C. StorzExpressway, Omaha, Nebraska," Final Report to HDR Engrs. Inc., 2 Vols.
Wroth, C.P. (1984), "The interpretation of in-situ soil tests," . h , Vol. 34, No.4, pp. 449-489.
Zuidberg, H.M., L.H.J.Schapp, and F.L. Beringen (1982) "A penetreometer forsimultaneous measuring of cone resistance, sleeve friction, and dynamic porepressure," Pro,. 2nd European Symposium on Penetration Testing, Amsterdam,Vol. 2, pp. 963-970.

1 216
i LIST OF THESES IN PROGRESS OR COMPLETED
3. PhD theses:Majid K. Elghaib (1989) "Prediction and Interpretation of Piezocone Data duringUndrained, Drained and Partially Drained Penetration" completed July 1989.
Charles P. Aubeny: thesis in progress, expected completion December 1991.I pore pressures due to penetrometer installation
3, Youssef Hashash: thesis in progress, expected completion September 1991
non-linear finite element modeling
Thomas C. Sheahan: Thesis in Progress
rate effects in soils
Masters Theses:
Anne E. Williamson (1989) "Use of a Panel Method to Predict Distrurbance due toPenetrometer Installation in Clays", completed August 1989.
Alexander Rafalovich "The Mechanics of Plate Penetration in Clays," expected completion
-- date, February 1991.
LIST OF PAPERS SUBMITTED
Um A.J. Whittle "A Model for Predicting the Behaviour of Overconsolidated Clays: IFormulation, submitted to Giotechnique, December 1989
A.J. Whittle "A Model for Predicting the Behaviour of Overconsolidated Clays: I3 Evaluation, submitted to G~otechnique, December 1989
A.J. Whittle (1991a) "An interpretation of pile load tests at the Haga site," Proc. OMAE'91, Stavangar, Norway, June.
UA.J. Whittle (1991b) "MIT-E3: A constitutive model for overconsolidated clays," Proc.IACMAG'91, Cairns, Australia, May.
U

217
UA.J. Whittle & C.P. Aubeny (1991) "Pore pressure fields around piezocone penetrometers3 installed in clays," Proc. [ACMAG'91, Cairns, Australia, May.
3IUIIIIIII -. - -.
IUIIII

218
Appendix A
Isoparametric Interpolation Functions
List Table
A. 1 Isoparamnetric Interpolation Functions and Their Derivatives for 9-Node IsoparametricElement
A.2 Isoparametric Interpolation Functions and Their Derivatives for 4-Node IsoparametricElement
* List f Fegures
A. 1 Isoparametric Element Definition Sketch
HI
II*U
*
IIIII
I I

I 219
h _a_ h____I.as at
S1 + 41t 1t (14-2s) s (1+s) (1+2t)
2 1St(1-S) (1+t) - -1 tl)(1-2s) -L 1 (1-)(1+2t)4 4 4(+t
4 ~ 44
4 1 t1S(-) --Ltlt(+s s(l-s) (1-2t)4 ~ 44
1 1 _(-2)1t 1 s(1+) (1-)12t)
6 t1+SO-) 1-t2) - tL(1-t') (1-2s) 4tUS
7 1. t(1-s2 ) (1+t) -st(1t) 1 II 12 t
2 2
2 2
9 (1S ) (1-t2) - (1-t2)(2) - 2st(1S
Table A. 1 Isopamametric Interpolation Functions and Their Derivatives for 9-Node
Isoparmmetric Element

I 220
Table A.2 Interpolation Functions and Their Derivatives for a Four-Node Isoparametric
(1+s)(l+t)/4 (1+t)/4 (1+s)/4
(I-s)(1~)4 (+t)/4 (1-s)/4
(1+s)(1-t)/4 (1-t)/4 -Is/
3 *Nodal point locations are illustrated in Figure A. 1.

I 221
BIIII 0 0
II 6
- -
IIIIIIU Figure A. I Isopammetric Element Definition Sketch
IIII

222
Appendix B
Publications Submitted
A.J. Whittle and C.P Aubeny, 'Pore pressure fields around piezocone penetrometersinstalled in clays', submitted to Seventh Conference of the International Association forComputer Methods and Advances in Geomechanics, Cairns, Australia, October, 1990.
II
i
Ii
II
I
I
II

223Pore pressure fields around piezocone penetrometers installed in clays
Andrew J. Whittle & Charles P. Aubeny,Massachusetts Institute of Technology
Ir
ABSTRACT: This paper describes a numerical method for estimating the pore pressures that are generated around a penetrometerduring steady, deep, undrained penetration in a uniform deposit of low permeability clay. Using the Strain Path Method, theeffective stresses around the penetrometer are first determined from the strain paths of soil elements using an appropriate soilmodel. The pore pressures are then obtained by integrating the equilibrium equations using the known fields of effective stresses.However, due to the approximate nature of the Strain Path Method, the equilibrium equations are not satisfied uniquely, such thatthe pore pressures are integration path dependent. In the proposed method, an approximate, 'averaged' pore pressure field isobtained by solving the complete set of equilibrium equations in the form of a Poisson equation. An accurate numerical procedureis presented to solve this equation.
The proposed method has two advantages: 1) it is rational and needs no subjective judgemer' to estimate the distributions ofpore pressures. and 2) it can be used for penetrometers of general shape, and hence can be user, to unify the interpretation ofinstallation disturbance for different types of in-situ test used in geotechnical practice. Examples illustrate the capabilities of theproposed method for pore pressure distributions around axisymmetric and flat plate penetrometers.
INTRODUCTION Assuming that effective stresses control soil behavior,then the excess pore pressures during steady penetration are
The undrained penetration of intrusive test devices (e.g. obtained from equilibrium considerations. However, due topiezocone, field vane, dilatometer etc.) in low permeability the approximate nature of the analysis, the equilibriumclay deposits leads to the development of excess pore equations are not satisfied exactly and hence predictions ofpressures in the soil. For normally and moderately excess pore pressures around the penetrometer are not unique.overconsolidated clays, these pore pressures are large and This paper shows that by combining the equilibriumdominate other soil stresses and hence hold the key to the equations, an 'average' field of pore pressures can be obtainedunderstanding of penetration mechanisms (Baligh, 1986b). from the solution of a Poisson type equation. This approachReliable analytical predictions of penetration pore pressures reduces the uncertainities in the predicted pore pressures andare essential if engineering properties of soils are to be is especially useful for non-axisymmctric penetrometers.interpreted rationally from in-situ measurements, both duringpenetration and in subsequent activities such as dissipationand holding tests, membrane expansion, vane rotation etc. EQUILIBRIUM IN THE STRAIN PATH METHODThe Strain Path Method (SPM; Baligh, 1985, 1986a, b)provides a general analytical framework for describing the The analysis of steady deep penetration problems usingmechanics of quasi-static. steady, undrained deep penetration the Strain Path Method (Baligh. 1985, 1986a, b) includes thein saturated clay. The method assumes that, due to the severe following steps:kinematic constraints in deep penetration problems, 1. Soil deformations are considered in terms of the steadydeformations and strains are essentially independent of the flow of soil around a static penetrometer. Approximateshearing resistance of the soil, and can be estimated with velocity fields are estimated from potential theory (i.e.reasonable accuracy based only on kinematic considerations treating the soil as an incompressible, inviscid andand boundary conditions. By considering the 2-dimensional irrotational fluid) and are differentiated with respect to thedeformations of soil elements, SPM analyses provide a more spatial coordinates in order to obtain strain rates (ij)" Forrealistic framework for describing the mechanics of deep simple geometrites e solutions can be obtained inpenetration problems than one-dimensional (cylindrical or closed form (Baligh, 1985; Teh & Houisby, 1989) whilespherical) cavity expansion methods, and can account cloer alih. a95 rc e f H oub 18,wleproperly for the effects of non-linear and inelastic soil numerical methods are required for more complexbehaviour. On the other hand, the assumptions of strain- geometries (methods of sources and sinks, boundarycontrolled behaviour used in the strain path method greatly element methods ec).simplify the problem of steady deep penetration and avoid the 2. Integration of the strain rates along the streamlines definesomplexity of large scale numerical (finite element) analyss. othe strain paths (histories) for individual soil elementsI copleityof lrgescae nuerial finie eemet) aalyes.around the penetrometer. Baligh (1986a) shows that soil
II

~224
elements are subject to complex histories of straining the tip, the distributions of excess pore pressures shoAinvolving reversals of individual strain components, similarly large variations due to integration path.
3. Effective stress fields around the penetrometer are estimated 2. Differences between radial and vertical integration paths arefrom the strain paths using a generalized effective stress especially significant as soil elements move past the levelsoil model to charactcrize the constitutive behavior of the of the base of the cone. Vertical equilibrium pressures.soil. Input parameters for the model include, initial Au z , decrease rapidly and become unbounded (i.e.
0stresses and pore pressures in the ground (G° , u0). continue to decrease with distance along thetogether with (model specific) material properties. penetrometer) while Aur reach a steady state solution at a
Previous studies (Baligh, 1986b; Whittle & Baligh, 1990) distance z/R=l0-20 above the tip of the cone. Levadoux &
have shown that realistic predictions of effective stresses Baligh (1980) attribute this behavior, in large part. toacting at the indenter-soil interface can be achieved using unrealistic predictions in Cn'rz, which contributecomprehensive soil models (Whittle, 1990) which significantly to equilibrium in the vertical direction.incorporate strain softening, small strain non-linearity andanisotropic properties of clay. Figure 1. Pore pressures predicted around a 600 cone by
4. Using the known field of effective stresses, pore pressures different equilibrium equationsare obtained from equilibrium equations:
a u = , =( 1 ) 2 0 AI' gravi..ly 1 5..xj xj .. ..
where it is assumed that changes in stresses due to gravity 60 Coneforces are negligible (Baligh, 1985). For axisymmetric 15 MCC, BBC, OCR=problems, the equations can be expressed in a cylindricalcoordinate frame as: 10
adial IntegrationI Fz 'rr - 006 cu a a( rr OG 'rz +~ r"O e (2a) 5--r- = gr = T + -- r a Poisson Solutionau',z arzMC
-z +-r + r (2b)
In principle, the pore pressures can be calculated by /e"-Vertical Integrationintegrating in either the radial or vertical (z) direction (using - 5the known distributions gr, gz respectively). If the stressfields are exact, the predicted pore pressure will be -o1 0 '. . . 'independent of the path of integration and the stress gradients 0 1 2 3 4 5will satisfy the relation:
Au /dvog, = agz (3)
az ar Subsequent studies have shown that:1. In the region ahead of the cone tip, the soil is subject to
This condition is only satisfied if the strain paths are triaxial compression modes of shearing only and hencecompatible with the model used to determine the stresses. vertical equilibrium can be used reliably to estimate poreHowever, from step 1, the strains are approximated using pressures at the tip of a piezocone (Elghaib, 1989).potential flow theory and are not compatible with the soil 2. Far behind the penetrometer tip, predictions of excess poremodel used in step 3. pressures can be obtained from radial equilibrium.
Figure 1 illustrates the potential differences in predictions However, the magnitudes of the predicted pore pressuresof pore pressures that can arise by satisfying equilibrium in are strongly influenced by complex aspects of soildifferent directions. The figure shows the distribution of behavior (Whittle & Baligh. 1990).excess pore pressures, (u-uo)/OGvo, at points along the surface For other locations around the cone, the path dependence
of a 600 cone penetrometer and at vertical locations ahead of in the predicted pore pressures represents a major source ofthe penetrometer tip. The initial fields of effective stresses uncertainty in the analysis. Iterative schemes for correcting thewere predicted using the Modified Cam Clay soil model equilibrium imbalance have been proposed by a number of(MCC; Roscoe & Burland, 1968) with material properties authors (Baligh, 1985; Teh, 1987). However, none of theseselected to represent the behavior of KO-normally has been successfully implemented to date. Another approachconsolidated Boston Blue Clay. The results show the has been to include the strain path solutions as initialfollowing: conditions in a finite element analysis (Teh & Houlsby.i. At the tip of the penetrometer, the excess pore pressures 1989). In this way, equilibrium imbalance can be directly
from vertical equilibrium (Au z) are approximately 50% removed from the solution by adjusting the out of balanceequilibrium (Au). Ahead of body forces. Further computations of steady state conditions
higher than those from radial equcan then be achieved with appropriate assumptions regarding
If

225
indenter interface properties. au/-=o, due to symmetry along the centreline (OD); 2) u=0.along BCD (assuming soil behavior is linear far from the
Table 1. Predictions of Excess Pore Pressures around a 600 penetrometer); and 3) au/az=O, to satisfy steady stateCone Penetrometer conditions along AB. The most difficult boundary condition is
that at the penetrometer boundary (OA). which cannot beEquilibrium Condition obtained by physical reasoning. This boundary is treated in an
Location: zR Vertical Radial Poisson approximate manner by computing the gradients adjacent toTip 0 2.86 2.00 2.77 the indenter interface (gr and g.) and imposing the condition:%Mid-Cone 0.87 2.77 2.10 2.63 gn = grn, + gznz (7)Cone Base 1.73 2.30 2.17 2.48Mid-Friction Sleeve 7.5 - 1.28 1.40 where nr, nz are the components of the unit vector normal toTop Friction Sleeve 12.5 - 1.20 1.27 the interface. Detailed numerical studies have demonstrated theShaft >50 - 1.10 .10 numerical accuracy and stability of the proposed Poisson
using MCC soil model equation solutions (Aubny, 1990).
Figure 1 compares the pore pressures computed using the=330, Xor K mco lt sn u Poisson equation with those reported from radial and vertical
TC= equilibrium. Table I summarizes the numerical values at fiveeo=l.12, G/o',O=22, K0,NC=0.48 locations where pore pressure have been measured in
conjunction with penetrometer tests:1. Ahead of the cone, pore pressures from the Poisson
THE POISSON FORMULATION equation are similar in magnitude to those calculated fromvertical equilibrium. This result confirms the importance
An alternative approach, which can ameliorate the of vertical equilibrium ahead of the penetrometer.difficulties associated with path dependent pore pressures, is 2. All three methods predict severe gradients of pore pressuresto solve both equlibrium equations by taking the divergence of around the base of the cone. This result implies thateqn. 2: rational interpretation of soil properties using base pore
pressures involves significant uncertainties.V2u =-g q (4) 3. For locations above the base of the cone. differences
between Poisson and radial equilibrium pore pressures areless than 20%. Poisson solutions always satisfy the steady
In this case the scalar pore pressure field is determined as conditions far above the cone tip.the solution of a Poisson equation using standard finite Overall, the results in figre 1 show that the excess poreelement techniques. In principle, the flux term, q. is pressures computed from the Poisson equation reflect: a) thecalculated by numerical differentiation (first and second dominant mode of vertical equilibrium ahead of the tip; b)derivatives) of the stress components from the strain path recover the steady state from radial equilibrium along themethod. However, accurate numerical evaluation of second shaft; and c) provide a rational basis for estimating thederivatives is very difficult to achieve, especially in regions of magnitude and distribution of pore pressures at intermediatehigh stress gradients. Considerable simplifications in locations around the cone.computing can be achieved using the divergence theorem toestimate an average flux within a given finite element:
EFFECT OF SOIL PROPERTIES & TIP SHAPE
qdU =f g'n dS (5) Extensive studies have been conducted to evaluate thef effects of soil properties and indenter geometries on die excess
pore pressures during penetration using the Poissonn formulation. Figures 2a, b illustrate the effects of tip geometry
4 V = 7 (g-n I AS, (6) by comparing predictions for the 600 cone wi th solutions for aI blunt ended penetrometer referred to as a 'simple pile'(Baligh. 1985). The shape of the simple pile is generated by a
where; q = average q within element point source in a uniform flow field such that closed formV = volume of element expressions are available for the strains around theg = pore pressure gradient vector on side i penetrometer (Baligh, 1985; Teh & Houlsby. 1989). As a
of the n-sided element result, effective stresses and pore pressures can be computedn = unit vector normal to side i of the element with higher accuracy than is possible for geometries (such asSi = Surface area of side i of the element the 60" cone) in which the strain paths are evaluated
The numerical procedure for evaluating derivatives of numerically. The figures also report excess pore pressuresstress components (g) is based on the construction of nine corresponding to OCR's=l. 2 and 4 for Ko-consolidatednode isoparametric elements (Bathe, 1982). Boston Blue Clay obtained using the MCC model.
Boundary conditions for the Poisson equation (locations The results show that the magnitudes and distributions ofA.B,CD are shown schematically in fig. I) include: 1) excess pore pressures are very similar for the simple pile and
III

226Figure 2a. Excess pore pressures around a simple pile Figure 2b. Excess pore pressures around a 6Y ) cone
2.5 - 5-Pore Pressures Pore Pressure
2 in Soil OCR -.n S=.4Sinole Pile 6CR i ... ,____ .D0 MCC BBC ! C .5 . . K, CC. BBC .
j 1 .5 OCR27 ..-~OCRq=
OC 1
0 .. . -.. ., , , 10
100 10 1 1 10 100
r/R 20 /R
2 Pr e sPo2e P0esues i
OP r R Pessures 10 in Soil1 -" al Interlace t 5 Ii: . o
OC OCR 4
8 7 6 5 4 2 1 01 2 4 5 7patllyietcl iM all cae (Tbl ), whl hf or .Telres xespr prsue ccur at (o eycls o
I prssrsuAsf la'vo 02%hge o ipe tetpo h peer uees Ti porepesrs(u~f~o
pile. Small changes in excess pore pressures are predicted for also increase very significantly with OCR and are primarily
locations z/RAl above the tip. Further comparisons between controlled by the undrained shear strength of the soil (C Tc, inlS the two geometries can be made by computing the tip triaxial compression, table 2).rresistance. qc, using the effective stresses from the strain path
togehcrwiththepor presurs fom fgur 2:Table 2. Predicted Excess Pore Pressures and Tip Resistance
~around Cone Peneterometers and Simple Pile
=t2 __1_ {__it+p o t}d 8qC R t nA OCR I Ey Autip A ConeTip~ ) .Factor.
S where Pn' Pt, are the total tractions normal and tangential to 0 G 0 Gv Nk
the indenter interface, respectively; at is the cone half-angle; I 0.32 0.01 2.71 2.49 1. 10 7.81
and A is the surface area of the tip. (2.71) (2.57) (1.22) (8.28)
SThe normalized tip resistance factors, Nkt=(qc-G )/cuTC, 2 0.58 0.84 4.05 3.60 1.49 7.65
(where cute is the undrained shear strength in triaxial (4.05) (3.80) (1.67) (8.23)compression) are then shown in table 2. Simple pile tip 4 1.05 1.75 6.15 5.34 1.92 7.34resistance factors are consistently 5-10% larger than those (6.18) (5.77) (2.27) (8.03)
S predicted for the 600 cone.1From these comparisons, it is clear that the simple pile ( )Simple Pile Geometrygeometry provides a very good approximation for more Eyis the octahedral yield strain (= l/#"IEy. measured indetailed studies of the performance of standard piezocones undrained triaxial shear test)
S (with 600 cone angles) (Elghaib, 1989).
I0
The results in figure 2 also illustrate some of the effects of
III

2272. Pore pressures along the shaft of the pcnetrometers Figure 3. Evaluation of predicted excess pore pressures(zdR> 15) are much smaller than at the tip (AUshaft/AUtp=0. 3 to around an 180 cone penetrometer in Boston Blue Clay0.4) and show much smaller changes with OCR. Hence porepressure filters located in this region are lcss sensitive tochanges in soil properties.3. There are relatively small changes (10±3%) in the porepressures predicted for locations along the face of cone (or 30 ,.simple pile). This implies that pore pressures measured at the F .tip or on the face of the cone will not be greatly affected byvariations in filter location or thickness. 020 " .
15 J.
EVALUATION WITH MEASURED DATA O
> 5 Pi
Baligh et al. (1979) report measurements of excess pore 0
pressures at six locations around an 180 cone penetrometer ooinstalled in Boston Blue Clay with in-situ OCR in the range . 'v Al 1o
1.3_OCR_<4. Figure 3 compare these measured data (reported 2 3 4 5 2 3 4 5 6at 4ft intervals for four locations) with predictions of excess 40
pore pressures, (u-u0)/Y',O, using the effective stress fields s,3 0from the MCC model (as above) together with the proposed 0Poisson formulation: 60 0 11. For position Pl. on the face of the cone, the predicted pore -
pressures agree well with the measured data (within 10%) in E 7 0 0
the lower clay (below 60ft) where soil conditions are mostuniform. Between 40 and 6Oft. there is more scatter in themeasured data (attributed to sand seams in the clay, Baligh et 1al., 1979), but the agreement is still reasonable. 0 02. At the base of the cone (P2) the predicted pore pressures 100 tmatch closely the measured data at depths greater than 60ft.However, in the uppper material predictions overestimate themeasured pore pressures. 40 ,3. Along the shaft (P3 and P4), the predictions underestimate P3 0 P4
the measured data at all depths by up to 50%. This so 0
discrepancy is consistent with previous observations of pore 0 0pressures around model pile shafts (Azzouz & Morrison, 0 g0 o1988; Whittle & Baligh. 1990) and reflects the sensitivity of E 0 0
CIL70 0the predictions to complex aspects of soil behavior. 06 00 080 0 0
0 0
EFFECT OF PENETROMETER SHAPE 90 0 o
0The path dependence of pore pressures predicted from the 10°
strain path method is also important for non-axisymmetric Au I , A4 Id 20penetrometers such as dilatometers, spade cells, field vane etc.Figure 4 shows Poisson equation pore pressures at steadystate conditions (i.e. far behind the penetrating tip, penetration Table 3. Values of Excess Pore Pressure, (u-u0)/__'_,_ aroundis in the z-direction) around one quadrant of a thin plate Plate Penetrometer with B/t=32.5penetrometer with aspect ratio, B/tff32.5. The predictions arepresented for the case of Ko-normally consolidated BBC Equilibrium Directionusing the MCC soil model (as in fig. 1). Table 3 compares the PLATE; x y Poissonmagnitude of the pore pressures at the center (A) and edge (B) Bt=32.5of the plate estimated by satisfying equilibrium in the x and y A 0.84 1.14 1.02directions separately. The table shows that due to the B 0.50 0.76 0.59inequilibrium of strain path solutions, the predicted porepressures can vary by 30-50%, while Poisson pore pressures The lengths in figure 3 are normalized by the radius of anaverage out the effects of the path dependence.. equivalent simple pile, Rq (where Req is obtained by matching
the areas of the two sections; Rq = VIRRTR). The results showthat:
II
I

2281. The magnitudes of the pore pressures around the thin plate achieved by satisfying equilibrium in the form of a Poisson
are 10-50% smaller than those predicted from the simple equation.This method ameliorates the path dependencepile. observed by integrating equilibrium equations directly. and
2. Around the face of the plate. the lateral extent of the excess provides a formulation which can be applied to generalpore pressures is similar for both the thin plate and the penetrometer geometries. Numerical solutions have beensimple pile. This implies that the zone of distrubance in presented to illustrate the flexibility and applications of thefront of the plate is controlled primarily by the volume of proposed formulation.soil displaced during penetration. Around the edge of theplate, the zone of excess pore pressures is significantlyreduced. ACKNOWLEDGEMENTS
This work was sponsored by the Air Force Office of
Figure 4. Comparison of excess pore pressures around a thin Scientific Research through grant AFOSR-89-06.
plate and a simple pile shaftREFERENCES
xeq Aubeny, C.P. (1990) PhD Thesis in progress.
0 2 4 6 8 10 Azzouz, A.S. & Morrison, M.J. (1988) "Field measurements1 0, on model pile in two clay deposits," ASCE Journal of
Geotechnical Engineering. 108. GTI, pp. 104-121.Plate: Bt=32.5 1 Baligh, M.M. (1985), "Strain path method," ASCE, Journal
8 LCu - of Geotechnical Engineering, 111, GT9, pp. 1108-1136.MCC. BBC OGR=1 iBaligh, M.M. (1986a) "Undrained deep penetration: I. Shear6CR' stresses," Gdotechnique. 36, No. 4, pp. 471-485.
2 -Baligh, M.M. (1986b) "Undrained deep penetration: II. Pore2- pressures," Gdotechnique, 36, No. 4, pp. 487-501.
4Baligh, M.M., Vivatrat, V. & Ladd, C.C. (1980) "Cone4- penetration in soil profiling," ASCE Journal of
6 Geotechnical Engineering, 106, GT4, pp. 447-461.2 8\ Bathe, KJ. (1982), Finite Element Procedures in Engineerine
2 AnaIysi. Prentice-Hall, N.J.Elghaib, M.K. (1989) "Prediction and interpretation of
0_ piezocone data during undrained, drained and partiallydrained penetration," PhD Thesis, MIT.dLevadoux, J-N. & Baligh M.M. (1980), "Pore pressures
Sduring cone penetration in clays" Research Report R80-1. .815, Dept. of Civil Engrg., MIT, Cambridge, MA.
Roscoe, K.R. & Burland, J.B. (1968) "On the generalized1stress-strain behaviour of wet clays," in Enineering
lasticity, eds. J. Heyman & F.A. Leckie, CambridgeUniversity Press.Teh, C-I (1987), "An analytical investigation of the cone
>. penetration test," PhD Thesis, University of Oxford.
Teh, C-I & Houlsby, G.T. (1989) "An analytical study of the,cone penetration test in clayo" Oxford University Soil
8JMechanics Report, No. OUEL 1800/89.
Simple Pile Whittle. A.J. (1990). "A constitutive model forMCC, BBC, OCR7.l overconsolidated clays," MIT Sea Grant Report No.
10 ______ c__ MITSG90-15.0 2 4 xR6 8 10O Whittle, A.J. & Baligh, M.M. (1990). "Prediction andx/Req evaluation of pile shaft behaviour in lightly
overconsolidated clays," submitted for publication.These results have important applications in the
interpretation of soil properties from flat plate penetrometersand is estimating the disturbance around non-axisyemmetricsection piles.
CONCLUSIONS
Using the Strain Path Method. reliable predictions ofexcess pore pressures during steady penetration can be
III