actuarial study of unpaid losses and alae as of june …
TRANSCRIPT

ACTUARIAL STUDY OF UNPAID LOSSES AND ALAE AS OF JUNE 30, 2015 CITY OF VIRGINIA BEACH AUGUST 19, 2015

ACTUARIAL STUDY AS OF JUNE 30, 2015
CITY OF VIRGINIA BEACH
OLIVER WYMAN
i
CONTENTS
1. Executive Summary .................................................................................................... 1 • Purpose and Scope ............................................................................................... 1 • Actuarial Findings .................................................................................................. 2 • Relevant Comments .............................................................................................. 3
2. Background ................................................................................................................. 5
3. Data............................................................................................................................. 6
4. Methodology................................................................................................................ 7
5. Distribution and Use .................................................................................................... 9
6. Considerations and Limitations ................................................................................. 10
7. Acknowledgement of Qualifications .......................................................................... 12
8. Glossary .................................................................................................................... 13
ACTUARIAL STUDY AS OF JUNE 30, 2015
CITY OF VIRGINIA BEACH
OLIVER WYMAN
1
1 Executive Summary Purpose and Scope
Oliver Wyman Actuarial Consulting, Inc. (Oliver Wyman) was requested by Marsh USA, Inc. (Marsh) and City of Virginia Beach (CVB) to conduct an examination of CVB’s retained workers compensation (WC), general liability (GL), and automobile liability (AL) exposures. As part of our analysis, we have estimated the following by line of business:
• Actuarial central estimates of retained unpaid losses and ALAE as of June 30, 2015 based on data evaluated as of June 30, 2015, including amounts for incurred but not reported (“IBNR”) claims
• Current (short-term) liability as of June 30, 2015 • Projected ultimate loss and ALAE for the fiscal year 2015/16 • Cash flow projections of unpaid loss and ALAE as of the next fiscal year-end as well as
expected payments during the fiscal year
The term “unpaid losses and ALAE” refers to our actuarial estimates of the obligation for future payment resulting from claims due to past events. The unpaid estimates and prospective loss rates presented in this report are intended to represent actuarial central estimates which, consistent with the applicable actuarial standard of practice, we define as the expected value over the range of reasonably possible (as opposed to all conceivable) outcomes. Our estimates of ultimate loss are based on loss and ALAE data evaluated as of June 30, 2015 and additional information provided to us through August 10, 2015. All estimates are limited to CVB’s per-occurrence retentions, and are net of salvage and subrogation recoveries. CVB’s retentions are summarized in the Background section of the report. We understand there are seven open WC claims for accidents occurring prior to July 1, 1985, with case reserves of $27,770 to cover future prescription drug costs. For these claims, we have added in the case reserves to our figures, but have not calculated any additional IBNR. Throughout this report, all references to losses include ALAE unless otherwise specified. Also, unless otherwise stated, any reference to the terms “incurred”, “paid plus case outstanding”, and “reported” refer to the same type of data and have been used interchangeably throughout the report.

ACTUARIAL STUDY AS OF JUNE 30, 2015
CITY OF VIRGINIA BEACH
OLIVER WYMAN
2
Actuarial Findings
Projected Unpaid Losses as of June 30, 2015 We have estimated unpaid losses and ALAE for CVB’s self-insurance program as of June 30, 2015. The table below presents the unpaid estimates by line of business and in total on an undiscounted basis. All estimates reflect CVB’s retentions. In addition, we have calculated the current (or short-term) liability as of June 30, 2015. The current liability is defined as the expected payments over the next twelve months for accidents occurring through June 30, 2015. Please see Exhibit 1, Sheet 1 of each line of business section for detail by fiscal year.
Unpaid Losses and ALAE as of June 30, 2015
Line of Business Case ReserveIBNR
Reserve Total Unpaid Loss & ALAE
Workers Compensation $11,627,022 $17,146,134 $28,773,156
General Liability 301,968 905,482 1,207,450
Automobile Liability 230,185 646,803 876,988
All Lines Combined $12,159,175 $18,698,419 $30,857,594
Current (Short-term) Liability as of June 30, 2015
Line of Business Current Liability
Workers Compensation $5,392,726 19%
General Liability 491,485 41%
Automobile Liability 507,081 58%
All Lines Combined $6,391,293 21% The percentages in the above table represent the short-term liability divided by the total unpaid loss and ALAE as of June 30, 2015.

ACTUARIAL STUDY AS OF JUNE 30, 2015
CITY OF VIRGINIA BEACH
OLIVER WYMAN
3
Funding Estimate for Fiscal Year 2016 At CVB’s request, we have estimated ultimate losses and ALAE by line of business for fiscal year, including accidents occurring from July 1, 2015 through June 30, 2016. These future estimates rely heavily on projected exposures, as estimated by CVB. For details of the forecast calculations, please see Exhibit 3, Sheet 1 of each line of business.
Funding Estimate of Ultimate Loss and ALAE
for Fiscal Year 2016
Line of Business Funding Estimate
Workers Compensation $11,187,072
General Liability 687,481
Automobile Liability 762,419
All Lines Combined $12,636,972
Projections of Payments and Unpaid Losses Projections of unpaid loss and ALAE as of the end of fiscal year 2016 as well as expected payments during the fiscal year can be found on Exhibit 1, Sheet 1 of each section.
Relevant Comments
Comparison with Prior Report The comparisons below are based on data evaluated as of June 30, 2015 in our current report and data evaluated as of April 30, 2013 in our prior report. Our comparisons are made to the prior actuarial central estimate, adjusted for changes in estimated exposures and changes in retentions since our prior report. Workers Compensation Actual retained reported losses on fiscal years July 1, 1990 through June 30, 2013 have increased $8.664 million since our prior report using data as of April 30, 2013 compared to our projected increase of approximately $6.279 million. Our estimated ultimate loss and ALAE for these periods has increased by $4.017 million. Details of actual versus expected emergence can be found in Exhibit 8. CVB has changed third-party administrators (TPAs) several times during the past ten years for WC claims handling. From 1990 through June 30, 2007, CVB utilized CMI Octagon (CMI) as their TPA. From July 1, 2007 through October 30, 2008, CVB used Schaffer Companies. Beginning November 1, 2008, CVB switched to Sedgwick CMS (Sedgwick). Beginning November 1, 2012, CVB switched to CorVel. Whenever there is a switch in TPAs, there is additional uncertainty in our estimates as the new TPA may have a different philosophy for reserving and settling claims than the prior TPA. For instance, when CVB began utilizing Schaffer, we noted decreases in case reserves of approximately $1.5 million in the loss runs provided by CorVel compared to our report completed one year prior when the claims were

ACTUARIAL STUDY AS OF JUNE 30, 2015
CITY OF VIRGINIA BEACH
OLIVER WYMAN
4
being handled by CMI. Ratios of paid-to-incurred losses were materially higher for fiscal years 2006/07 and 2007/08, which we offered could be attributable to weakened case reserve adequacy as compared to prior years under CMI’s claims management. In contrast, during the first two years after Sedgwick took over claims handling, they increased case reserves by $10.9 million compared to the case reserves under Schaffer. In the following two reports, we observed favorable development. In this report, we have observed adverse development, especially in medical costs and ALAE costs. We will continue to monitor the development as more data becomes available. The change in administrators increases the uncertainty of the underlying loss development data as well. General Liability Reported retained losses on fiscal years July 1, 2004 through June 30, 2013 have increased $832 thousand since our prior report using data as of April 30, 2013 compared to our projected increase of $637 thousand. The adverse development is due to one late reported claim in fiscal year 2009. Our estimated ultimate loss and ALAE for these periods has increased by $291 thousand since our prior report. Automobile Liability Reported retained losses on fiscal years July 1, 2004 through June 30, 2013 have decreased $52 thousand since our prior report using April 30, 2013 data compared to our projected increase of approximately $841 thousand. Several older claims have decreased and closed since our prior analysis. Our estimated ultimate loss and ALAE for these periods has decreased by $823 thousand since our prior report due to the favorable development.

ACTUARIAL STUDY AS OF JUNE 30, 2015
CITY OF VIRGINIA BEACH
OLIVER WYMAN
5
2 Background City of Virginia Beach retains a significant portion of its workers compensation, general liability and automobile liability exposure. The retained limits of liability differ by line of business and by policy period, but range from $200,000 to $2,000,000 on a per occurrence basis. For all years and lines of business, ALAE combines with loss to erode the retention.
Historical Program Retentions
Policy Period Workers
CompensationGeneral Liability
Automobile Liability
7/1/1985 – 6/30/1987 $200,000 $1,000,000 $1,000,000 7/1/1987 – 6/30/1988 $250,000 $1,000,000 $1,000,000 7/1/1988 – 6/30/1989 $300,000 $1,000,000 $1,000,000 7/1/1989 – 6/30/1990 $400,000 $1,000,000 $1,000,000 7/1/1990 – 6/30/1992 $450,000 $1,000,000 $1,000,000 7/1/1992 – 6/30/2005 $500,000 $2,000,000 $2,000,000 7/1/2005 – 6/30/2006 $750,000 $2,000,000 $2,000,000 7/1/2006 – 6/30/2007 $750,000* $2,000,000 $2,000,000 7/1/2007 – 6/30/2012 $850,000 $2,000,000 $2,000,000 7/1/2012 - 6/30/2013 $1,000,000 $2,000,000 $2,000,000 7/1/2013 – 6/30/2015 $1,250,000 $2,000,000 $2,000,000 * The WC retention changed from $750,000 to $850,000 on March 1, 2007.
Though CVB has deductible exposure back to 1985 for GL and AL, we are only including policy years back to 2004/05 in our analysis for GL and AL since all claims are closed in prior policy years.

ACTUARIAL STUDY AS OF JUNE 30, 2015
CITY OF VIRGINIA BEACH
OLIVER WYMAN
6
3 Data Loss data was provided by CVB. For WC, the data is net of non-insurance recoveries such as subrogation. For automobile liability and general liability, the data is gross of recoveries due to systems issues where recoveries could not be removed consistently. The loss data includes ALAE and is valued as of June 30, 2015. We also received AL, GL, and WC loss runs as of 4/30/14 and 4/30/15 to update our triangles. The exposure data includes payroll, revenue and vehicle count and is presented on a consistent basis as the loss data defined above.

ACTUARIAL STUDY AS OF JUNE 30, 2015
CITY OF VIRGINIA BEACH
OLIVER WYMAN
7
4 Methodology To determine our estimate of ultimate loss and ALAE for AL, GL, and WC, we applied a number of generally accepted actuarial techniques. These include the following methods:
Paid development method
Reported development method
Case reserve development method
Reported Bornhuetter-Ferguson method
Paid Bornhuetter-Ferguson method Under the reported development method, the historical reporting pattern is applied directly to the reported loss and ALAE (case reserves plus cumulative paid loss and ALAE) to estimate ultimate loss and ALAE. Paid to date loss and ALAE are then deducted from the estimated ultimate loss and ALAE to produce the estimated total outstanding unpaid. The incurred but not reported (IBNR) reserve equals the total outstanding loss and ALAE reserves minus the case reserves. We selected loss development patterns based on an analysis of CVB and insurance industry loss development experience. Loss development patterns were selected at the various per occurrence retentions. For WC, we estimated insurance industry loss development factors based on information from NCCI for the State of Virginia. For GL and AL, we estimated insurance industry countrywide loss development factors based on information from AM Best. The advantages of the reported development method are that reported loss and ALAE provide a larger statistical data base than paid loss and ALAE (since case reserves are used in addition to payments) and that reported loss and ALAE provide more current information (since payments lag behind the establishment of case reserves). A disadvantage of the reported development method is that its predictive accuracy is dependent on consistent case reserving practices and philosophies. Under the paid development method, a mathematical procedure similar to the reported development method is used. Paid loss and ALAE are used in place of reported loss and ALAE and historical payment patterns are used in place of reporting patterns. Under the case reserve development method, a historical reporting and payment pattern is used to estimate the ratio of unreported loss and ALAE to the case reserves as of the evaluation date. This ratio is then multiplied by the actual case reserves to produce estimated unreported loss and ALAE. Estimated ultimate loss and ALAE equals the sum of the actual paid loss and ALAE, the actual case reserves, and the estimated unreported loss and ALAE. This method is

ACTUARIAL STUDY AS OF JUNE 30, 2015
CITY OF VIRGINIA BEACH
OLIVER WYMAN
8
helpful where there are few open claims or where the history of cumulative paid loss and ALAE is deemed unreliable. Under the reported Bornhuetter-Ferguson method, an historical reporting pattern is used to estimate the percentage of ultimate loss and ALAE which is unreported as of the evaluation date. This percentage is then multiplied by an initial expected ultimate loss and ALAE to produce estimated unreported loss and ALAE. The initial expected ultimate loss and ALAE are based on our review of historical loss costs. Estimated unreported loss and ALAE is also known as IBNR. Estimated ultimate loss and ALAE equals the sum of the actual reported loss and ALAE and the estimated unreported loss and ALAE. The advantage of the reported Bornhuetter-Ferguson method is that estimates of ultimate loss and ALAE tend to be more stable than estimates produced by the reported development method. This is because the estimates based on the reported Bornhuetter-Ferguson method are a weighted average between the estimate based on the reported development method and the expected ultimate loss and ALAE. A disadvantage of the Bornhuetter-Ferguson method is that the estimates are slow to react to changes in reserving practices and are sensitive to a priori estimates of ultimate loss and ALAE. Under the paid Bornhuetter-Ferguson method, a mathematical procedure similar to the reported Bornhuetter-Ferguson method is used. Paid loss and ALAE is used in place of reported loss and ALAE and historical payment patterns are used in place of reporting patterns.
ACTUARIAL STUDY AS OF JUNE 30, 2015
CITY OF VIRGINIA BEACH
OLIVER WYMAN
9
5 Distribution and Use This report was prepared for the sole use of CVB’s management in their process of establishing a liability estimate for their WC self-insured program for internal and external financial reporting. All decisions in connection with the implementation or use of advice or recommendations contained in this report are the sole responsibility of CVB. Oliver Wyman’s consent to any distribution of this report (whether herein or in the written agreement pursuant to which this report has been issued) to parties other than CVB does not constitute advice by Oliver Wyman to any such third parties and shall be solely for informational purposes and not for purposes of reliance by any such third parties. Oliver Wyman assumes no liability related to third party use of this report or any actions taken or decisions made as a consequence of the results, advice or recommendations set forth herein. This report should not replace the due diligence on behalf of any such third party.

ACTUARIAL STUDY AS OF JUNE 30, 2015
CITY OF VIRGINIA BEACH
OLIVER WYMAN
10
6 Considerations and Limitations For our analysis, we relied on data and information provided by CVB without independent audit. Though we have reviewed the data for reasonableness and consistency, we have not audited or otherwise verified this data. It should also be noted that our review of data may not always reveal imperfections. We have assumed that the data provided is both accurate and complete. The results of our analysis are dependent on this assumption. If this data or information is inaccurate or incomplete, our findings and conclusions may need to be revised. The prospective fiscal year estimates developed in this analysis are based on estimated loss costs and the projected exposures. It should be noted that prospective period loss and ALAE estimates are directly related to the projected exposures. Therefore, if actual exposures differ from the projection, prospective fiscal year estimates would need to be adjusted accordingly. Where CVB’s own historical data was either (i) not available, (ii) not appropriate or (iii) not sufficiently credible to develop our actuarial assumptions, we supplemented it with external information, as we deemed appropriate. Although we believe these external sources may be more predictive of future CVB experience than any other data of which we are aware, the use of external data adds to the uncertainty associated with our projections. The change in administrators for WC increases the uncertainty in our WC estimates. The volatility in GL and AL due to high retentions and a lack of statistical credibility of historical large losses increases the uncertainty in our estimates for GL and AL. The scope of the project does not include the estimation of any costs other than those described herein. Such ancillary costs may include unallocated loss adjustment expenses (ULAE); excess insurance premiums; the costs of trustee, legal, administrative, risk management and actuarial services; fees and assessments; and costs for surety bonds or letters of credit pertaining to claim liabilities. All excess insurance is considered to be valid and fully collectible. We made no assessment, and do not express any opinion, concerning the collectability of any excess insurance. We have not evaluated the financial strength, claims paying ability or any other factors with regard to CVB’s past, current, and/or prospective excess insurers. We have not included any provision for losses exceeding the policy limits of the coverage provided by excess insurers. We have not examined, nor do we express any opinion regarding, the assets, if any, that are used to provide for the payment obligations associated with the estimates of unpaid costs presented in this report.

ACTUARIAL STUDY AS OF JUNE 30, 2015
CITY OF VIRGINIA BEACH
OLIVER WYMAN
11
Our models may retain more digits than those displayed. In addition, the results of certain calculations may be presented in the exhibits with more or less digits than would be considered significant. As a result, it should be recognized that (i) there may be rounding differences between the results of calculations presented in the exhibits and replications of those calculations based on displayed underlying amounts, and (ii) calculation results may not have been adjusted to reflect the precision of the calculation. Our conclusions are based on an analysis of the CVB data and on the estimation of the outcome of many contingent events. Future costs were developed from the historical claim experience and covered exposure, with adjustments for anticipated changes. Our estimates make no provision for extraordinary future emergence of new classes of losses or types of losses not sufficiently represented in historical databases or which are not yet quantifiable. The sources of uncertainty affecting our estimates are numerous and include factors internal and external to CVB. Internal factors include items such as changes in claim reserving or settlement practices. The most significant external influences include, but are not limited to, changes in the legal, social, or regulatory environment surrounding the claims process. Uncontrollable factors such as general economic conditions also contribute to the variability. While this analysis complies with applicable Actuarial Standards of Practice and Statements of Principles, users of this analysis should recognize that our projections involve estimates of future events, and are subject to economic and statistical variations from expected values. We have not anticipated any extraordinary changes to the legal, social, or economic environment that might affect the frequency or severity of claims. For these reasons, no assurance can be given that the emergence of actual losses will correspond to the projections in this analysis. The Medicare, Medicaid and SCHIP Extension Act of 2007 (the Act) was enacted in part to ensure that Medicare does not pay medical benefits for beneficiaries whose medical treatments arise out of a liability or work-related accident. While Medicare has always been a secondary payer of these benefits, Medicare’s rights to reimbursement have not been frequently exercised in the past. New reporting requirements under the Act enable Medicare to enforce its liens against primary payers and effectuate the reimbursement process. The ability of liability and workers compensation insurers to procure full and final medical settlements may be diminished under this Act. The passage of this Act increases the uncertainty in any estimate of unpaid losses and we have not attempted to quantify the impact of this Act on CVB’s unpaid claims.

ACTUARIAL STUDY AS OF JUNE 30, 2015
CITY OF VIRGINIA BEACH
OLIVER WYMAN
12
7 Acknowledgement of Qualifications The undersigned actuary is a Fellow of the Casualty Actuarial Society (FCAS), a Member of the American Academy of Actuaries (MAAA), and meets the Qualification Standards of the American Academy of Actuaries to provide the actuarial analysis contained herein.
OLIVER WYMAN ACTUARIAL CONSULTING, INC.:
___________________________ Dana F. Joseph, FCAS, MAAA 100 North Tryon Street, Suite 3600 Charlotte, NC 28202 (704) 374-8413 [email protected]

ACTUARIAL STUDY AS OF JUNE 30, 2015
CITY OF VIRGINIA BEACH
OLIVER WYMAN
13
8 Glossary
Accident Period
The period in which the event giving rise to a claim occurred, regardless of when the claim is actually reported.
Accounting Date
The point in time at which the estimate of unpaid loss and ALAE is evaluated.
Actuarial Central Estimate
An estimate that represents an expected value over the range of reasonably possible outcomes. Such range of reasonably possible outcomes may not include all conceivable outcomes.
Allocated Loss Adjustment Expense (ALAE)
Expense costs associated with the handling and settling of an individual claim that can be directly attributed to the particular claim. Fees paid to outside defense attorneys and investigation firms are examples of this expense cost.
Case Reserves
The unpaid claim estimates established by adjusters on an individual claim basis.
Claim
A demand for payment under the coverage provided by a plan or contract. As used throughout this Glossary, it also includes suits, potentially compensable events, notifications, and unasserted claims.
Claim Frequency
The number of claims that occur over a period of time per unit of exposure.
Claim Reporting Pattern
The rate at which claims are assumed to be reported over time.
Claim Severity
The average cost per claim.
Confidence Level
The probability that the outcome of a random process will not exceed an associated estimate. For example, a 75% confidence level for an unpaid claim estimate of $10 million would indicate

ACTUARIAL STUDY AS OF JUNE 30, 2015
CITY OF VIRGINIA BEACH
OLIVER WYMAN
14
that there is a 75% probability that the actual claim payments will be less than or equal to $10 million. The estimate is defined in the context of the risks modeled in our analysis and may not consider all factors contributing to variability of outcomes.
Credibility
A measure of the predictive value of a body of data.
Development
The change between valuation dates in the observed values of certain fundamental quantities that may be used in the unpaid claim estimation process. For example, the number of reported claims associated with events occurring within a particular period will change from one valuation date to the next until all claims have been reported. In a similar fashion, the paid claim amounts for events occurring within a particular period will change from one valuation date to the next until all claims have been reported and closed. The change in the number of reported claims or the change in the paid claim amounts is referred to as development. The concept of development also applies to reported losses.
Discounted Unpaid Loss Estimate
The unpaid loss amount estimate presented on a basis that reflects the time value of money. In other words, how much would need to be invested as of the accounting date such that principal and interest would be equal to the expected future claim payments as they come due.
Estimated Ultimate Losses
The estimated cost of claims during a period. Ultimate reported losses represent the total of paid claim amounts, case reserves, and IBNR.
Event
The incident or activity that triggers potential for claim or allocated claim adjustment expense payment.
Exposure
A measure of the underlying potential for claim costs.
IBNR
The unpaid claim estimate for: (a) events that have occurred for which claims have not been reported as of the accounting date, (b) future development of the case reserves, (c) claims that have been reported but not yet recorded in the loss listing, and (d) claims that have been closed but that will be reopened.
Loss
The cost associated with a claim. The cost may or may not include loss adjustment expenses.

ACTUARIAL STUDY AS OF JUNE 30, 2015
CITY OF VIRGINIA BEACH
OLIVER WYMAN
15
Loss Adjustment Expenses
The costs of administering, determining coverage for, settling, or defending claims. Loss adjustment expenses include allocated loss adjustment expenses and unallocated loss adjustment expenses.
Loss Cost
The loss amount per exposure unit.
Method
The systematic procedure for developing an actuarial estimate.
Model
A mathematical or empirical representation of a specified phenomenon.
Model Risk
The risk that the methods are not appropriate to the circumstances or the models are not representative of the specified phenomenon.
Paid Losses
The total aggregate dollar amount paid on all reported claims as of a certain date.
Parameter Risk
The risk that the assumptions or parameters used in the methods or models are not representative of future outcomes.
Payment Pattern
The rate at which claims are paid over time.
Process Risk
The uncertainty associated with the projection of future contingencies that are inherently variable, even when the parameters are known with certainty.
Range of Reasonable Estimates
A range of estimates that could be produced by appropriate actuarial methods or alternative sets of assumptions that the actuary judges to be reasonable; a range of reasonable estimates usually does not represent the range of all possible outcomes.
Recorded Claim Reserve or Liability
The provision for unpaid claim amounts shown in a published financial statement or in an internal statement of financial condition.
Report Date
The date on which the claim is first reported or recorded.
ACTUARIAL STUDY AS OF JUNE 30, 2015
CITY OF VIRGINIA BEACH
OLIVER WYMAN
16
Reported Loss Amount
The total of paid claim amounts and case reserves.
Review Date
The date through which information is considered in the unpaid claim estimate analysis.
Risk Margin
An amount that may be added to the unpaid claim estimate to recognize the uncertainty in the estimate.
Salvage
Recoveries due to the sale of damaged or recovered property.
Subrogation
Recoveries from a third party responsible for the event for which a claim has already been paid.
Unallocated Loss Adjustment Expense (ULAE)
Loss adjustment expenses that cannot be attributed to an individual claim. Typically includes salaries, utilities, and rent apportioned to the claim adjustment expense function but not readily assignable to specific claims.
Undiscounted Unpaid Loss Estimate
The unpaid loss estimate presented on a basis that does not reflect the time value of money.
Unpaid Loss and ALAE Estimate
The estimate of the obligation for future payments resulting from losses and ALAE due to past events.
Valuation Date
The date through which transactions are included in the data used in the unpaid claim estimate analysis.

Exhibit 1Sheet 1
City of Virginia BeachAnalysis of Unpaid Loss & ALAE at June 30, 2015
Workers CompensationData as of June 30, 2015
Loss & ALAE Limited to Retention
Summary of Unpaid Loss & ALAE as of June 30, 2016
Selected Total Unpaid % Paid % Paid Expected Total UnpaidUltimate Loss Loss & ALAE Loss & ALAE Loss & ALAE Paid Between Loss & ALAE
Fiscal & ALAE as of as of as of as of 6/30/15 and as ofYears 6/30/15 6/30/15 6/30/15 6/30/16 6/30/16 6/30/16
(1) (2) (3) (4) (5) (6)
prior to 7/1/85 na 27,770 99.5% 99.5% 2,541 25,2297/1/85-6/30/86 136,354 21,247 99.5% 99.5% 1,944 19,3027/1/86-6/30/87 190,894 24,302 99.4% 99.5% 2,223 22,0787/1/87-6/30/88 1,131,437 31,272 99.1% 99.2% 2,713 28,5597/1/88-6/30/89 29,612 22,077 98.5% 98.6% 1,495 20,5837/1/89-6/30/90 0 0 97.3% 97.5% 0 07/1/90-6/30/91 1,934,394 154,409 96.6% 96.8% 8,362 146,0477/1/91-6/30/92 1,847,884 56,132 96.4% 96.6% 3,037 53,0957/1/92-6/30/93 2,233,888 0 95.5% 95.8% 0 07/1/93-6/30/94 2,794,882 80,593 95.3% 95.5% 4,136 76,4567/1/94-6/30/95 2,695,902 167,948 95.0% 95.3% 8,608 159,3407/1/95-6/30/96 1,896,549 18,687 94.8% 95.0% 956 17,7317/1/96-6/30/97 2,242,028 21,679 94.5% 94.8% 1,108 20,5717/1/97-6/30/98 1,950,673 15,808 94.2% 94.5% 796 15,0137/1/98-6/30/99 2,146,793 41,212 93.9% 94.2% 2,107 39,1057/1/99-6/30/00 2,466,296 63,465 93.5% 93.9% 3,668 59,7977/1/00-6/30/01 3,883,465 181,002 93.1% 93.5% 11,852 169,1507/1/01-6/30/02 3,852,207 236,212 92.5% 93.1% 16,203 220,0087/1/02-6/30/03 3,205,156 114,264 91.9% 92.5% 9,386 104,8797/1/03-6/30/04 6,667,887 388,167 91.0% 91.9% 37,888 350,2797/1/04-6/30/05 8,156,167 670,219 90.0% 91.0% 64,529 605,6907/1/05-6/30/06 7,267,964 1,041,685 87.6% 89.3% 143,662 898,0227/1/06-6/30/07 5,872,087 960,151 84.0% 87.5% 209,454 750,6977/1/07-6/30/08 8,232,887 1,789,006 79.3% 83.6% 367,154 1,421,8527/1/08-6/30/09 7,051,063 1,346,498 74.4% 79.3% 257,525 1,088,9737/1/09-6/30/10 5,450,158 1,356,949 69.0% 74.4% 239,971 1,116,9777/1/10-6/30/11 7,868,317 2,278,267 63.4% 69.0% 346,393 1,931,8747/1/11-6/30/12 6,702,846 1,694,074 57.2% 63.4% 246,151 1,447,9237/1/12-6/30/13 9,510,821 3,074,509 47.7% 56.7% 528,420 2,546,0897/1/13-6/30/14 11,827,623 4,886,620 38.5% 47.4% 707,445 4,179,1757/1/14-6/30/15 10,406,753 8,008,932 15.7% 38.5% 2,165,539 5,843,3937/1/15-6/30/16 11,187,072 0 0.0% 15.7% 1,759,516 9,427,556
Total 140,840,059 28,773,156 7,154,784 32,805,444
Current (Short-term) Liability (excludes FY2016)**: 5,392,726as a percent of 6/30/15 Liability: 18.7%
Notes:Column (1) is from Exhibit 1, Sheet 4, Column (9).Column (2) is from Exhibit 1, Sheet 3, Column (6).Columns (3) and (4) are based on Exhibit 6, Sheets 2, 4, 6, and industry data.Column (5) equals Column (2) x [Column (4) - Column (3)] / [1.0 - Column (3)].Column (6) equals Exhibit 1, Sheet 4, Column (9) - Exhibit 1, Sheet 4, Column (7) - Column (5).** Current (Short-term) liability is calculated as the expected payments during the next 12 months for accidents occurring through the current evaluation date only.
Oliver Wyman Actuarial Consulting, Inc.
17

Exhibit 1Sheet 2
City of Virginia BeachAnalysis of Unpaid Loss & ALAE at June 30, 2015
Workers CompensationData as of June 30, 2015
Loss & ALAE Limited to Retention
Summary of Reported Loss & ALAE and IBNR as of June 30, 2016
Selected Total % Reported % Reported Expected TotalUltimate Loss IBNR Loss & ALAE Loss & ALAE Rpt Between IBNR
Fiscal & ALAE as of as of as of as of 6/30/15 and as ofYears 6/30/15 6/30/15 6/30/15 6/30/16 6/30/16 6/30/16
(1) (2) (3) (4) (5) (6)
prior to 7/1/85 na 0 99.9% 99.9% 0 07/1/85-6/30/86 136,354 10,000 99.9% 99.9% 1,323 8,6777/1/86-6/30/87 190,894 20,000 99.9% 99.9% 2,646 17,3547/1/87-6/30/88 1,131,437 20,000 99.8% 99.8% 2,615 17,3857/1/88-6/30/89 29,612 16,000 99.6% 99.7% 1,701 14,2997/1/89-6/30/90 0 0 99.2% 99.3% 0 07/1/90-6/30/91 1,934,394 20,720 98.9% 99.0% 1,674 19,0467/1/91-6/30/92 1,847,884 32,801 98.8% 98.9% 2,648 30,1527/1/92-6/30/93 2,233,888 0 98.5% 98.6% 0 07/1/93-6/30/94 2,794,882 45,034 98.4% 98.5% 3,469 41,5657/1/94-6/30/95 2,695,902 47,061 98.3% 98.4% 3,622 43,4397/1/95-6/30/96 1,896,549 11,948 98.1% 98.3% 919 11,0297/1/96-6/30/97 2,242,028 14,728 98.0% 98.1% 1,129 13,6007/1/97-6/30/98 1,950,673 12,501 97.8% 98.0% 937 11,5657/1/98-6/30/99 2,146,793 22,263 97.6% 97.8% 1,737 20,5267/1/99-6/30/00 2,466,296 40,229 97.4% 97.6% 3,137 37,0927/1/00-6/30/01 3,883,465 81,201 97.1% 97.4% 7,737 73,4647/1/01-6/30/02 3,852,207 102,347 96.8% 97.1% 11,116 91,2307/1/02-6/30/03 3,205,156 92,029 96.4% 96.8% 9,814 82,2157/1/03-6/30/04 6,667,887 189,397 96.0% 96.4% 19,784 169,6137/1/04-6/30/05 8,156,167 313,716 95.5% 96.0% 32,793 280,9237/1/05-6/30/06 7,267,964 352,536 94.4% 95.0% 34,901 317,6367/1/06-6/30/07 5,872,087 373,783 93.6% 94.3% 41,956 331,8277/1/07-6/30/08 8,232,887 575,461 92.6% 93.4% 65,002 510,4597/1/08-6/30/09 7,051,063 448,979 91.5% 92.6% 58,930 390,0497/1/09-6/30/10 5,450,158 557,876 89.8% 91.5% 93,446 464,4297/1/10-6/30/11 7,868,317 1,014,735 87.1% 89.8% 209,338 805,3977/1/11-6/30/12 6,702,846 1,186,667 82.3% 87.1% 322,237 864,4307/1/12-6/30/13 9,510,821 2,348,734 75.0% 82.0% 654,399 1,694,3357/1/13-6/30/14 11,827,623 3,138,313 68.1% 74.6% 640,529 2,497,7837/1/14-6/30/15 10,406,753 6,057,076 42.4% 68.1% 2,700,390 3,356,6857/1/15-6/30/16 11,187,072 0 0.0% 42.4% 4,746,952 6,440,120
Total 140,840,059 17,146,134 9,676,883 18,656,323
Notes:Column (1) is from Exhibit 1, Sheet 4, Column (9).Column (2) is from Exhibit 1, Sheet 3, Column (5).Columns (3) and (4) are based on Exhibit 6, Sheets 1, 3, 5, and industry data.Column (5) equals Column (2) x [Column (4) - Column (3)] / [1.0 - Column (3)]Column (6) equals Exhibit 1, Sheet 4, Column (9) - Exhibit 1, Sheet 4, Column (6) - Column (5).
Oliver Wyman Actuarial Consulting, Inc.
18

Exhibit 1Sheet 3
City of Virginia BeachAnalysis of Unpaid Loss & ALAE at June 30, 2015
Workers CompensationData as of June 30, 2015
Loss & ALAE Limited to Retention
Summary of Reserves as of June 30, 2015
Reported Paid Case IBNR Total UnpaidSelected Loss & ALAE Loss & ALAE Reserves Reserves Loss & ALAE
Fiscal Ultimate as of as of as of as of as ofYears Loss & ALAE 6/30/15 6/30/15 6/30/15 6/30/15 6/30/15
(1) (2) (3) (4) (5) (6)
prior to 7/1/85 na na na 27,770 na 27,7707/1/85-6/30/86 136,354 * 126,354 115,107 11,247 10,000 21,2477/1/86-6/30/87 190,894 * 170,894 166,592 4,302 20,000 24,3027/1/87-6/30/88 1,131,437 * 1,111,437 1,100,165 11,272 20,000 31,2727/1/88-6/30/89 29,612 * 13,612 7,535 6,077 16,000 22,0777/1/89-6/30/90 0 * 0 0 0 0 07/1/90-6/30/91 1,934,394 1,913,674 1,779,984 133,690 20,720 154,4097/1/91-6/30/92 1,847,884 1,815,083 1,791,752 23,331 32,801 56,1327/1/92-6/30/93 2,233,888 2,233,888 2,233,888 0 0 07/1/93-6/30/94 2,794,882 2,749,848 2,714,289 35,559 45,034 80,5937/1/94-6/30/95 2,695,902 2,648,840 2,527,954 120,887 47,061 167,9487/1/95-6/30/96 1,896,549 1,884,601 1,877,862 6,740 11,948 18,6877/1/96-6/30/97 2,242,028 2,227,300 2,220,350 6,950 14,728 21,6797/1/97-6/30/98 1,950,673 1,938,172 1,934,865 3,307 12,501 15,8087/1/98-6/30/99 2,146,793 2,124,530 2,105,581 18,949 22,263 41,2127/1/99-6/30/00 2,466,296 2,426,067 2,402,831 23,236 40,229 63,4657/1/00-6/30/01 3,883,465 3,802,264 3,702,464 99,800 81,201 181,0027/1/01-6/30/02 3,852,207 3,749,860 3,615,996 133,865 102,347 236,2127/1/02-6/30/03 3,205,156 3,113,127 3,090,891 22,236 92,029 114,2647/1/03-6/30/04 6,667,887 6,478,490 6,279,720 198,770 189,397 388,1677/1/04-6/30/05 8,156,167 7,842,451 7,485,948 356,503 313,716 670,2197/1/05-6/30/06 7,267,964 6,915,428 6,226,280 689,148 352,536 1,041,6857/1/06-6/30/07 5,872,087 5,498,304 4,911,936 586,369 373,783 960,1517/1/07-6/30/08 8,232,887 7,657,426 6,443,881 1,213,545 575,461 1,789,0067/1/08-6/30/09 7,051,063 6,602,084 5,704,565 897,519 448,979 1,346,4987/1/09-6/30/10 5,450,158 4,892,282 4,093,209 799,073 557,876 1,356,9497/1/10-6/30/11 7,868,317 6,853,582 5,590,050 1,263,532 1,014,735 2,278,2677/1/11-6/30/12 6,702,846 5,516,179 5,008,772 507,407 1,186,667 1,694,0747/1/12-6/30/13 9,510,821 7,162,088 6,436,312 725,775 2,348,734 3,074,5097/1/13-6/30/14 11,827,623 8,689,311 6,941,003 1,748,307 3,138,313 4,886,6207/1/14-6/30/15 10,406,753 4,349,678 2,397,822 1,951,856 6,057,076 8,008,932
Total 129,652,987 112,506,853 100,907,602 11,627,022 17,146,134 28,773,156
Notes:Column (1) is from Exhibit 1, Sheet 4, Column (9).Columns (2) and (3) provided by City of Virginia Beach.Column (4) equals Column (2) - Column (3). For periods prior to 7/1/1985, we are including case reserves for open claims only, as reported by City of Virginia Beach. Column (5) equals Column (1) - Column (2).Column (6) equals Column (4) + Column (5).* For fiscal years 1986 through 1990, only open claims were provided and are estimated here
Oliver Wyman Actuarial Consulting, Inc.
19

Exhibit 1Sheet 4
City of Virginia BeachAnalysis of Unpaid Loss & ALAE at June 30, 2015
Workers CompensationData as of June 30, 2015
Loss & ALAE Limited to Retention
Estimate of Ultimate Loss & ALAE
Reported Paid Reported Paid Reported Paid Implied OpenLoss & ALAE Loss & ALAE Bornhuetter- Bornhuetter- Case Loss & ALAE Loss & ALAE Implied Open and IBNR Selected Implied
Fiscal Development Development Ferguson Ferguson Development as of as of and IBNR Claim Counts Ultimate Loss & ALAEYears Method Method Method Method Method 6/30/15 6/30/15 Claim Counts within Retention Loss & ALAE Cost
(1) (2) (3) (4) (5) (6) (7) (8a) (8b) (9) (10)
7/1/85-6/30/86 na na na na 129,257 126,354 * 115,107 * 1 1 136,354 * na 7/1/86-6/30/87 na na na na 172,071 170,894 * 166,592 * 1 1 190,894 * na 7/1/87-6/30/88 na na na na 1,114,708 1,111,437 * 1,100,165 * 5 1 1,131,437 * na 7/1/88-6/30/89 na na na na 15,708 13,612 * 7,535 * 2 2 29,612 * na 7/1/89-6/30/90 na na na na 0 0 * 0 * 0 0 0 * na 7/1/90-6/30/91 1,934,394 1,843,315 na na 1,974,233 1,913,674 1,779,984 3 2 1,934,394 na 7/1/91-6/30/92 1,836,482 1,859,286 na na 1,826,102 1,815,083 1,791,752 1 1 1,847,884 na 7/1/92-6/30/93 2,267,611 2,338,257 na na 2,233,888 2,233,888 2,233,888 0 0 2,233,888 na 7/1/93-6/30/94 2,794,882 2,848,302 na na 2,768,368 2,749,848 2,714,289 2 2 2,794,882 na 7/1/94-6/30/95 2,695,902 2,659,862 na na 2,714,509 2,648,840 2,527,954 2 2 2,695,902 na 7/1/95-6/30/96 1,920,929 1,981,425 na na 1,888,423 1,884,601 1,877,862 1 1 1,896,549 na 7/1/96-6/30/97 2,273,871 2,349,780 na na 2,231,414 2,227,300 2,220,350 2 1 2,242,028 na 7/1/97-6/30/98 1,982,053 2,053,998 na na 1,940,213 1,938,172 1,934,865 1 1 1,950,673 na 7/1/98-6/30/99 2,176,801 2,242,666 na na 2,136,791 2,124,530 2,105,581 1 1 2,146,793 na 7/1/99-6/30/00 2,490,941 2,569,531 2,513,157 2,619,773 2,441,651 2,426,067 2,402,831 3 3 2,466,296 12.607/1/00-6/30/01 3,914,964 3,978,669 3,908,063 3,957,605 3,872,966 3,802,264 3,702,464 4 4 3,883,465 18.757/1/01-6/30/02 3,875,002 3,907,217 3,881,170 3,919,051 3,852,207 3,749,860 3,615,996 2 2 3,852,207 17.447/1/02-6/30/03 3,229,885 3,364,068 3,275,834 3,456,390 3,130,968 3,113,127 3,090,891 3 3 3,205,156 13.607/1/03-6/30/04 6,750,999 6,900,698 6,676,457 6,721,050 6,640,183 6,478,490 6,279,720 8 5 6,667,887 26.847/1/04-6/30/05 8,212,660 8,313,793 8,083,825 8,019,133 8,137,336 7,842,451 7,485,948 12 9 8,156,167 31.087/1/05-6/30/06 7,321,837 7,106,347 7,255,890 6,985,897 7,475,193 6,915,428 6,226,280 11 10 7,267,964 26.177/1/06-6/30/07 5,872,087 5,850,553 5,927,560 5,993,819 5,883,979 5,498,304 4,911,936 17 17 5,872,087 20.087/1/07-6/30/08 8,269,620 8,122,691 8,207,047 7,978,362 8,334,669 7,657,426 6,443,881 15 14 8,232,887 26.867/1/08-6/30/09 7,217,079 7,662,877 7,273,001 7,716,661 7,051,063 6,602,084 5,704,565 12 11 7,051,063 22.507/1/09-6/30/10 5,450,158 5,936,165 5,723,476 6,614,268 5,285,322 4,892,282 4,093,209 16 16 5,450,158 17.507/1/10-6/30/11 7,868,317 8,818,916 7,934,037 8,657,451 7,540,661 6,853,582 5,590,050 15 15 7,868,317 25.337/1/11-6/30/12 6,702,846 8,762,304 7,067,256 8,761,833 5,873,596 5,516,179 5,008,772 22 22 6,702,846 21.407/1/12-6/30/13 9,545,661 13,500,530 9,475,982 11,285,111 7,824,585 7,162,088 6,436,312 40 40 9,510,821 30.207/1/13-6/30/14 12,760,108 18,021,823 11,827,623 12,989,455 10,574,696 8,689,311 6,941,003 82 81 11,827,623 36.967/1/14-6/30/15 10,250,821 15,245,442 10,406,753 11,264,647 8,557,362 4,349,678 2,397,822 256 256 10,406,753 31.51
Total 129,615,908 148,238,514 109,437,131 116,940,507 123,622,119 112,506,853 100,907,602 540 524 129,652,987
7/1/15-6/30/16 11,187,072 33.0
Notes:Column (1) is from Exhibit 2, Sheet 1, Column (3).Column (2) is from Exhibit 2, Sheet 3, Column (3).Column (3) is from Exhibit 2, Sheet 5, Column (5).Column (4) is from Exhibit 2, Sheet 6, Column (5).Column (5) is from Exhibit 2, Sheet 7, Column (6).Columns (6) and (7) provided by City of Virginia Beach.Column (8a) is from Exhibit 4, Sheet 1, Column (6).Column (8b) based on Column (8a) and individual claim detail.Column (9) based on Columns (1) through (8b) and actuarial judgment, fiscal year 7/1/15-6/30/16 is from Exhibit 3, Sheet 1, Column (7).Column (10) equals Column (9) / Payroll (000's).* For fiscal years 1986 through 1990, only open claims were provided and are estimated here.
Oliver Wyman Actuarial Consulting, Inc.
20

Exhibit 2Sheet 1
City of Virginia BeachAnalysis of Unpaid Loss & ALAE at June 30, 2015
Workers CompensationData as of June 30, 2015
Reported Loss & ALAE Development Method
Reported IndicatedLoss & ALAE Age to Ultimate Loss & ALAE
Fiscal as of Ultimate Loss & ALAE CostYears Retention 6/30/15 Factors (1) x (2) Payroll (000's) (3) / (4)
(1) (2) (3) (4) (5)
7/1/85-6/30/86 200,000 na 1.001 na na na 7/1/86-6/30/87 200,000 na 1.001 na na na 7/1/87-6/30/88 250,000 na 1.002 na na na 7/1/88-6/30/89 300,000 na 1.004 na na na 7/1/89-6/30/90 400,000 na 1.008 na na na 7/1/90-6/30/91 450,000 1,913,674 1.011 1,934,394 na na 7/1/91-6/30/92 450,000 1,815,083 1.012 1,836,482 na na 7/1/92-6/30/93 500,000 2,233,888 1.015 2,267,611 na na 7/1/93-6/30/94 500,000 2,749,848 1.016 2,794,882 na na 7/1/94-6/30/95 500,000 2,648,840 1.018 2,695,902 na na 7/1/95-6/30/96 500,000 1,884,601 1.019 1,920,929 na na 7/1/96-6/30/97 500,000 2,227,300 1.021 2,273,871 na na 7/1/97-6/30/98 500,000 1,938,172 1.023 1,982,053 na na 7/1/98-6/30/99 500,000 2,124,530 1.025 2,176,801 na na 7/1/99-6/30/00 500,000 2,426,067 1.027 2,490,941 195,789 12.77/1/00-6/30/01 500,000 3,802,264 1.030 3,914,964 207,170 18.97/1/01-6/30/02 500,000 3,749,860 1.033 3,875,002 220,877 17.57/1/02-6/30/03 500,000 3,113,127 1.038 3,229,885 235,632 13.77/1/03-6/30/04 500,000 6,478,490 1.042 6,750,999 248,418 27.27/1/04-6/30/05 500,000 7,842,451 1.047 8,212,660 262,426 31.37/1/05-6/30/06 750,000 6,915,428 1.059 7,321,837 277,717 26.47/1/06-6/30/07 800,000 * 5,498,304 1.068 5,872,087 292,480 20.17/1/07-6/30/08 850,000 7,657,426 1.080 8,269,620 306,475 27.07/1/08-6/30/09 850,000 6,602,084 1.093 7,217,079 313,390 23.07/1/09-6/30/10 850,000 4,892,282 1.114 5,450,158 311,357 17.57/1/10-6/30/11 850,000 6,853,582 1.148 7,868,317 310,681 25.37/1/11-6/30/12 850,000 5,516,179 1.215 6,702,846 313,282 21.47/1/12-6/30/13 1,000,000 7,162,088 1.333 9,545,661 314,878 30.37/1/13-6/30/14 1,250,000 8,689,311 1.468 12,760,108 320,036 39.97/1/14-6/30/15 1,250,000 4,349,678 2.357 10,250,821 330,239 31.0
Total 111,084,557 129,615,908 4,460,846
Notes:Columns (1) and (4) provided by City of Virginia Beach.The age to ultimate factors in Column (2) are based on Exhibit 6, Sheets 1, 3, and 5, and industry data* Retention changes from $750,000 to $850,000 at 3/1/2007.
Loss & ALAE Limited to Retention
Oliver Wyman Actuarial Consulting, Inc.
21

Exhibit 2Sheet 2
City of Virginia BeachAnalysis of Unpaid Loss & ALAE at June 30, 2015
Workers CompensationData as of June 30, 2015
Reported Loss & ALAE Development Method
Section I - Reported Loss & ALAE Limited to $250,000
Reported Estimated IndicatedLoss & ALAE Age to Ultimate Loss & ALAE
Fiscal as of Ultimate Loss & ALAE CostYears 6/30/15 Factors (1) x (2) Payroll (000's) (3) / (4)
(1) (2) (3) (4) (5)
7/1/99-6/30/00 2,426,067 1.011 2,453,853 195,789 12.57/1/00-6/30/01 3,802,264 1.013 3,853,345 207,170 18.67/1/01-6/30/02 3,632,552 1.016 3,689,542 220,877 16.77/1/02-6/30/03 3,077,799 1.018 3,133,871 235,632 13.37/1/03-6/30/04 5,103,117 1.021 5,210,506 248,418 21.07/1/04-6/30/05 5,856,405 1.024 5,998,289 262,426 22.97/1/05-6/30/06 4,792,293 1.028 4,926,286 277,717 17.77/1/06-6/30/07 4,888,357 1.033 5,047,359 292,480 17.37/1/07-6/30/08 4,707,073 1.039 4,892,171 306,475 16.07/1/08-6/30/09 4,542,747 1.050 4,769,202 313,390 15.27/1/09-6/30/10 4,312,944 1.068 4,604,891 311,357 14.87/1/10-6/30/11 5,161,249 1.091 5,633,277 310,681 18.17/1/11-6/30/12 4,602,495 1.121 5,159,248 313,282 16.57/1/12-6/30/13 6,577,777 1.174 7,719,193 314,878 24.57/1/13-6/30/14 7,692,473 1.284 9,878,844 320,036 30.97/1/14-6/30/15 4,349,678 1.914 8,323,950 330,239 25.2
Total 75,525,290 85,293,827 4,460,846
Section II - Reported Loss & ALAE Limited to $500,000
Reported Estimated IndicatedLoss & ALAE Age to Ultimate Loss & ALAE
Fiscal as of Ultimate Loss & ALAE CostYears 6/30/15 Factors (1) x (2) Payroll (000's) (3) / (4)
(1) (2) (3) (4) (5)
7/1/99-6/30/00 2,426,067 1.027 2,490,941 195,789 12.77/1/00-6/30/01 3,802,264 1.030 3,914,964 207,170 18.97/1/01-6/30/02 3,749,860 1.033 3,875,002 220,877 17.57/1/02-6/30/03 3,113,127 1.038 3,229,885 235,632 13.77/1/03-6/30/04 6,478,490 1.042 6,750,999 248,418 27.27/1/04-6/30/05 7,842,451 1.047 8,212,660 262,426 31.37/1/05-6/30/06 6,521,849 1.053 6,868,741 277,717 24.77/1/06-6/30/07 5,430,335 1.061 5,759,723 292,480 19.77/1/07-6/30/08 6,695,787 1.070 7,164,631 306,475 23.47/1/08-6/30/09 5,767,189 1.081 6,236,282 313,390 19.97/1/09-6/30/10 4,892,282 1.100 5,383,250 311,357 17.37/1/10-6/30/11 6,483,055 1.133 7,347,298 310,681 23.67/1/11-6/30/12 5,227,709 1.178 6,159,247 313,282 19.77/1/12-6/30/13 6,856,327 1.278 8,764,835 314,878 27.87/1/13-6/30/14 8,289,311 1.404 11,635,178 320,036 36.47/1/14-6/30/15 4,349,678 2.174 9,457,245 330,239 28.6
Total 87,925,781 103,250,880 4,460,846
Section III - Reported Loss & ALAE Limited to $750,000
Reported Estimated IndicatedLoss & ALAE Age to Ultimate Loss & ALAE
Fiscal as of Ultimate Loss & ALAE CostYears 6/30/15 Factors (1) x (2) Payroll (000's) (3) / (4)
(1) (2) (3) (4) (5)
7/1/99-6/30/00 2,426,067 1.031 2,501,878 195,789 12.87/1/00-6/30/01 3,802,264 1.035 3,933,524 207,170 19.07/1/01-6/30/02 3,749,860 1.038 3,893,935 220,877 17.67/1/02-6/30/03 3,113,127 1.043 3,246,085 235,632 13.87/1/03-6/30/04 6,581,651 1.047 6,893,646 248,418 27.87/1/04-6/30/05 8,236,061 1.053 8,669,641 262,426 33.07/1/05-6/30/06 6,915,428 1.059 7,321,837 277,717 26.47/1/06-6/30/07 5,498,304 1.067 5,865,762 292,480 20.17/1/07-6/30/08 7,509,801 1.076 8,083,459 306,475 26.47/1/08-6/30/09 6,429,173 1.089 7,003,701 313,390 22.37/1/09-6/30/10 4,892,282 1.110 5,429,276 311,357 17.47/1/10-6/30/11 6,853,582 1.143 7,833,380 310,681 25.27/1/11-6/30/12 5,505,041 1.208 6,651,831 313,282 21.27/1/12-6/30/13 7,106,327 1.318 9,365,442 314,878 29.77/1/13-6/30/14 8,589,311 1.446 12,423,577 320,036 38.87/1/14-6/30/15 4,349,678 2.309 10,042,957 330,239 30.4
Total 91,557,957 109,159,929 4,460,846
Notes:Columns (1) and (4) provided by City of Virginia Beach.The age to ultimate factors in Column (2) are based on Exhibit 6, Sheets 1, 3, and 5.
Oliver Wyman Actuarial Consulting, Inc.
22

Exhibit 2Sheet 3
City of Virginia BeachAnalysis of Unpaid Loss & ALAE at June 30, 2015
Workers CompensationData as of June 30, 2015
Paid Loss & ALAE Development Method
Paid IndicatedLoss & ALAE Age to Ultimate Loss & ALAE
Fiscal as of Ultimate Loss & ALAE CostYears Retention 6/30/15 Factors (1) x (2) Payroll (000's) (3) / (4)
(1) (2) (3) (4) (5)
7/1/85-6/30/86 200,000 na 1.005 na na na 7/1/86-6/30/87 200,000 na 1.006 na na na 7/1/87-6/30/88 250,000 na 1.009 na na na 7/1/88-6/30/89 300,000 na 1.015 na na na 7/1/89-6/30/90 400,000 na 1.028 na na na 7/1/90-6/30/91 450,000 1,779,984 1.036 1,843,315 na na 7/1/91-6/30/92 450,000 1,791,752 1.038 1,859,286 na na 7/1/92-6/30/93 500,000 2,233,888 1.047 2,338,257 na na 7/1/93-6/30/94 500,000 2,714,289 1.049 2,848,302 na na 7/1/94-6/30/95 500,000 2,527,954 1.052 2,659,862 na na 7/1/95-6/30/96 500,000 1,877,862 1.055 1,981,425 na na 7/1/96-6/30/97 500,000 2,220,350 1.058 2,349,780 na na 7/1/97-6/30/98 500,000 1,934,865 1.062 2,053,998 na na 7/1/98-6/30/99 500,000 2,105,581 1.065 2,242,666 na na 7/1/99-6/30/00 500,000 2,402,831 1.069 2,569,531 195,789 13.17/1/00-6/30/01 500,000 3,702,464 1.075 3,978,669 207,170 19.27/1/01-6/30/02 500,000 3,615,996 1.081 3,907,217 220,877 17.77/1/02-6/30/03 500,000 3,090,891 1.088 3,364,068 235,632 14.37/1/03-6/30/04 500,000 6,279,720 1.099 6,900,698 248,418 27.87/1/04-6/30/05 500,000 7,485,948 1.111 8,313,793 262,426 31.77/1/05-6/30/06 750,000 6,226,280 1.141 7,106,347 277,717 25.67/1/06-6/30/07 800,000 * 4,911,936 1.191 5,850,553 292,480 20.07/1/07-6/30/08 850,000 6,443,881 1.261 8,122,691 306,475 26.57/1/08-6/30/09 850,000 5,704,565 1.343 7,662,877 313,390 24.57/1/09-6/30/10 850,000 4,093,209 1.450 5,936,165 311,357 19.17/1/10-6/30/11 850,000 5,590,050 1.578 8,818,916 310,681 28.47/1/11-6/30/12 850,000 5,008,772 1.749 8,762,304 313,282 28.07/1/12-6/30/13 1,000,000 6,436,312 2.098 13,500,530 314,878 42.97/1/13-6/30/14 1,250,000 6,941,003 2.596 18,021,823 320,036 56.37/1/14-6/30/15 1,250,000 2,397,822 6.358 15,245,442 330,239 46.2
Total 99,518,203 148,238,514 4,460,846
Notes:Columns (1) and (4) provided by City of Virginia Beach.The age to ultimate factors in Column (2) are based on Exhibit 6, Sheets 2, 4, and 6, and industry data* Retention changes from $750,000 to $850,000 at 3/1/2007.
Loss & ALAE Limited to Retention
Oliver Wyman Actuarial Consulting, Inc.
23

Exhibit 2Sheet 4
City of Virginia BeachAnalysis of Unpaid Loss & ALAE at June 30, 2015
Workers CompensationData as of June 30, 2015
Paid Loss & ALAE Development Method
Section I - Paid Loss & ALAE Limited to $250,000
Paid Estimated IndicatedLoss & ALAE Age to Ultimate Loss & ALAE
Fiscal as of Ultimate Loss & ALAE CostYears 6/30/15 Factors (1) x (2) Payroll (000's) (3) / (4)
(1) (2) (3) (4) (5)
7/1/99-6/30/00 2,402,831 1.029 2,472,936 195,789 12.67/1/00-6/30/01 3,702,464 1.033 3,825,800 207,170 18.57/1/01-6/30/02 3,584,472 1.038 3,720,649 220,877 16.87/1/02-6/30/03 3,055,563 1.044 3,189,466 235,632 13.57/1/03-6/30/04 5,041,966 1.051 5,301,457 248,418 21.37/1/04-6/30/05 5,813,460 1.060 6,163,181 262,426 23.57/1/05-6/30/06 4,790,968 1.071 5,132,131 277,717 18.57/1/06-6/30/07 4,586,298 1.087 4,984,449 292,480 17.07/1/07-6/30/08 4,456,483 1.115 4,968,390 306,475 16.27/1/08-6/30/09 4,264,710 1.152 4,911,513 313,390 15.77/1/09-6/30/10 4,001,572 1.198 4,791,926 311,357 15.47/1/10-6/30/11 4,971,339 1.260 6,261,957 310,681 20.27/1/11-6/30/12 4,286,243 1.362 5,839,732 313,282 18.67/1/12-6/30/13 5,880,551 1.550 9,114,225 314,878 28.97/1/13-6/30/14 6,341,154 1.911 12,115,311 320,036 37.97/1/14-6/30/15 2,397,822 4.324 10,367,666 330,239 31.4
Total 69,577,897 93,160,788 4,460,846
Section II - Paid Loss & ALAE Limited to $500,000
Paid Estimated IndicatedLoss & ALAE Age to Ultimate Loss & ALAE
Fiscal as of Ultimate Loss & ALAE CostYears 6/30/15 Factors (1) x (2) Payroll (000's) (3) / (4)
(1) (2) (3) (4) (5)
7/1/99-6/30/00 2,402,831 1.069 2,569,531 195,789 13.17/1/00-6/30/01 3,702,464 1.075 3,978,669 207,170 19.27/1/01-6/30/02 3,615,996 1.081 3,907,217 220,877 17.77/1/02-6/30/03 3,090,891 1.088 3,364,068 235,632 14.37/1/03-6/30/04 6,279,720 1.099 6,900,698 248,418 27.87/1/04-6/30/05 7,485,948 1.111 8,313,793 262,426 31.77/1/05-6/30/06 6,086,738 1.131 6,886,195 277,717 24.87/1/06-6/30/07 4,911,936 1.176 5,775,080 292,480 19.77/1/07-6/30/08 5,803,669 1.233 7,156,807 306,475 23.47/1/08-6/30/09 5,269,166 1.306 6,879,452 313,390 22.07/1/09-6/30/10 4,093,209 1.393 5,702,043 311,357 18.37/1/10-6/30/11 5,590,050 1.493 8,347,800 310,681 26.97/1/11-6/30/12 4,762,556 1.655 7,883,622 313,282 25.27/1/12-6/30/13 6,130,551 1.945 11,925,279 314,878 37.97/1/13-6/30/14 6,591,154 2.401 15,827,447 320,036 49.57/1/14-6/30/15 2,397,822 5.648 13,542,979 330,239 41.0
Total 78,214,701 118,960,678 4,460,846
Section III - Paid Loss & ALAE Limited to $750,000
Paid Estimated IndicatedLoss & ALAE Age to Ultimate Loss & ALAE
Fiscal as of Ultimate Loss & ALAE CostYears 6/30/15 Factors (1) x (2) Payroll (000's) (3) / (4)
(1) (2) (3) (4) (5)
7/1/99-6/30/00 2,402,831 1.076 2,586,456 195,789 13.27/1/00-6/30/01 3,702,464 1.082 4,005,489 207,170 19.37/1/01-6/30/02 3,615,996 1.088 3,934,249 220,877 17.87/1/02-6/30/03 3,090,891 1.096 3,388,323 235,632 14.47/1/03-6/30/04 6,284,376 1.107 6,958,460 248,418 28.07/1/04-6/30/05 7,764,984 1.120 8,693,083 262,426 33.17/1/05-6/30/06 6,226,280 1.141 7,106,347 277,717 25.67/1/06-6/30/07 4,911,936 1.188 5,837,138 292,480 20.07/1/07-6/30/08 6,343,881 1.250 7,928,111 306,475 25.97/1/08-6/30/09 5,676,817 1.330 7,547,767 313,390 24.17/1/09-6/30/10 4,093,209 1.433 5,866,896 311,357 18.87/1/10-6/30/11 5,590,050 1.558 8,708,332 310,681 28.07/1/11-6/30/12 5,008,772 1.727 8,649,958 313,282 27.67/1/12-6/30/13 6,380,551 2.052 13,093,863 314,878 41.67/1/13-6/30/14 6,841,154 2.535 17,342,112 320,036 54.27/1/14-6/30/15 2,397,822 6.165 14,783,006 330,239 44.8
Total 80,332,014 126,429,590 4,460,846
Notes:Columns (1) and (4) provided by City of Virginia Beach.The age to ultimate factors in Column (2) are based on Exhibit 6, Sheets 2, 4, and 6.
Oliver Wyman Actuarial Consulting, Inc.
24

Exhibit 2Sheet 5
City of Virginia BeachAnalysis of Unpaid Loss & ALAE at June 30, 2015
Workers CompensationData as of June 30, 2015
Loss & ALAE Limited to Retention
Reported Bornhuetter-Ferguson Method
Expected Reported EstimatedEstimate Age to Loss & ALAE Ultimate Indicated
Fiscal of Ultimate Ultimate Unreported as of Loss & ALAE Loss & ALAEYears Loss & ALAE Factors Loss & ALAE 6/30/15 (3) + (4) Cost
(1) (2) (3) (4) (5) (6)
7/1/99-6/30/00 3,343,958 1.027 87,090 2,426,067 2,513,157 12.87/1/00-6/30/01 3,675,253 1.030 105,799 3,802,264 3,908,063 18.97/1/01-6/30/02 4,066,001 1.033 131,309 3,749,860 3,881,170 17.67/1/02-6/30/03 4,500,981 1.038 162,707 3,113,127 3,275,834 13.97/1/03-6/30/04 4,904,332 1.042 197,967 6,478,490 6,676,457 26.97/1/04-6/30/05 5,354,611 1.047 241,374 7,842,451 8,083,825 30.87/1/05-6/30/06 6,133,739 1.059 340,462 6,915,428 7,255,890 26.17/1/06-6/30/07 6,743,558 1.068 429,256 5,498,304 5,927,560 20.37/1/07-6/30/08 7,424,377 1.080 549,621 7,657,426 8,207,047 26.87/1/08-6/30/09 7,873,333 1.093 670,918 6,602,084 7,273,001 23.27/1/09-6/30/10 8,120,336 1.114 831,194 4,892,282 5,723,476 18.47/1/10-6/30/11 8,377,911 1.148 1,080,455 6,853,582 7,934,037 25.57/1/11-6/30/12 8,761,203 1.215 1,551,078 5,516,179 7,067,256 22.67/1/12-6/30/13 9,266,611 1.333 2,313,894 7,162,088 9,475,982 30.17/1/13-6/30/14 9,837,190 1.468 3,138,313 8,689,311 11,827,623 37.07/1/14-6/30/15 10,521,690 2.357 6,057,076 4,349,678 10,406,753 31.5
Total 108,905,082 17,888,510 91,548,621 109,437,131
Notes:Column (1) is from Exhibit 3, Sheet 1, Column (9)The age to ultimate factors in Column (2) are based on Exhibit 6, Sheets 1, 3, and 5, and industry dataColumn (3) equals Column (1) x [1.0 - 1.0 / Column (2)]Column (4) provided by City of Virginia Beach.Column (6) equals Column (5) / Payroll (000's)
Oliver Wyman Actuarial Consulting, Inc.
25

Exhibit 2Sheet 6
City of Virginia BeachAnalysis of Unpaid Loss & ALAE at June 30, 2015
Workers CompensationData as of June 30, 2015
Loss & ALAE Limited to Retention
Paid Bornhuetter-Ferguson Method
Expected Paid EstimatedEstimate Age to Loss & ALAE Ultimate Indicated
Fiscal of Ultimate Ultimate Unpaid as of Loss & ALAE Loss & ALAEYears Loss & ALAE Factors Loss & ALAE 6/30/15 (3) + (4) Cost
(1) (2) (3) (4) (5) (6)
7/1/99-6/30/00 3,343,958 1.069 216,942 2,402,831 2,619,773 13.47/1/00-6/30/01 3,675,253 1.075 255,141 3,702,464 3,957,605 19.17/1/01-6/30/02 4,066,001 1.081 303,056 3,615,996 3,919,051 17.77/1/02-6/30/03 4,500,981 1.088 365,499 3,090,891 3,456,390 14.77/1/03-6/30/04 4,904,332 1.099 441,330 6,279,720 6,721,050 27.17/1/04-6/30/05 5,354,611 1.111 533,185 7,485,948 8,019,133 30.67/1/05-6/30/06 6,133,739 1.141 759,617 6,226,280 6,985,897 25.27/1/06-6/30/07 6,743,558 1.191 1,081,884 4,911,936 5,993,819 20.57/1/07-6/30/08 7,424,377 1.261 1,534,481 6,443,881 7,978,362 26.07/1/08-6/30/09 7,873,333 1.343 2,012,096 5,704,565 7,716,661 24.67/1/09-6/30/10 8,120,336 1.450 2,521,059 4,093,209 6,614,268 21.27/1/10-6/30/11 8,377,911 1.578 3,067,401 5,590,050 8,657,451 27.97/1/11-6/30/12 8,761,203 1.749 3,753,061 5,008,772 8,761,833 28.07/1/12-6/30/13 9,266,611 2.098 4,848,799 6,436,312 11,285,111 35.87/1/13-6/30/14 9,837,190 2.596 6,048,452 6,941,003 12,989,455 40.67/1/14-6/30/15 10,521,690 6.358 8,866,826 2,397,822 11,264,647 34.1
Total 108,905,082 36,608,828 80,331,679 116,940,507
Notes:Column (1) is from Exhibit 3, Sheet 1, Column (9)The age to ultimate factors in Column (2) are based on Exhibit 6, Sheets 2, 4, and 6, and industry dataColumn (3) equals Column (1) x [1.0 - 1.0 / Column (2)]Column (4) provided by City of Virginia Beach.Column (6) equals Column (5) / Payroll (000's)
Oliver Wyman Actuarial Consulting, Inc.
26

Exhibit 2Sheet 7
City of Virginia BeachAnalysis of Unpaid Loss & ALAE at June 30, 2015
Workers CompensationData as of June 30, 2015
Loss & ALAE Limited to Retention
Case Development Method
CasePaid Outstanding Percent Percent Incurred
Loss & ALAE Loss & ALAE of Ultimate of Ultimate But Not Estimated IndicatedFiscal as of as of Loss & ALAE Loss & ALAE Reported Ultimate Loss & ALAEYears 6/30/15 6/30/15 Reported Paid Loss & ALAE Loss & ALAE Cost
(1) (2) (3) (4) (5) (6) (7)
7/1/85-6/30/86 * 115,107 11,247 99.9% 99.5% 2,903 129,257 na 7/1/86-6/30/87 * 166,592 4,302 99.9% 99.4% 1,177 172,071 na 7/1/87-6/30/88 * 1,100,165 11,272 99.8% 99.1% 3,271 1,114,708 na 7/1/88-6/30/89 * 7,535 6,077 99.6% 98.5% 2,096 15,708 na 7/1/89-6/30/90 * 0 0 99.2% 97.3% 0 0 na 7/1/90-6/30/91 1,779,984 133,690 98.9% 96.6% 60,559 1,974,233 na 7/1/91-6/30/92 1,791,752 23,331 98.8% 96.4% 11,019 1,826,102 na 7/1/92-6/30/93 2,233,888 0 98.5% 95.5% 0 2,233,888 na 7/1/93-6/30/94 2,714,289 35,559 98.4% 95.3% 18,520 2,768,368 na 7/1/94-6/30/95 2,527,954 120,887 98.3% 95.0% 65,668 2,714,509 na 7/1/95-6/30/96 1,877,862 6,740 98.1% 94.8% 3,821 1,888,423 na 7/1/96-6/30/97 2,220,350 6,950 98.0% 94.5% 4,114 2,231,414 na 7/1/97-6/30/98 1,934,865 3,307 97.8% 94.2% 2,041 1,940,213 na 7/1/98-6/30/99 2,105,581 18,949 97.6% 93.9% 12,260 2,136,791 na 7/1/99-6/30/00 2,402,831 23,236 97.4% 93.5% 15,584 2,441,651 12.57/1/00-6/30/01 3,702,464 99,800 97.1% 93.1% 70,702 3,872,966 18.77/1/01-6/30/02 3,615,996 133,865 96.8% 92.5% 102,347 3,852,207 17.47/1/02-6/30/03 3,090,891 22,236 96.4% 91.9% 17,841 3,130,968 13.37/1/03-6/30/04 6,279,720 198,770 96.0% 91.0% 161,692 6,640,183 26.77/1/04-6/30/05 7,485,948 356,503 95.5% 90.0% 294,885 8,137,336 31.07/1/05-6/30/06 6,226,280 689,148 94.4% 87.6% 559,765 7,475,193 26.97/1/06-6/30/07 4,911,936 586,369 93.6% 84.0% 385,674 5,883,979 20.17/1/07-6/30/08 6,443,881 1,213,545 92.6% 79.3% 677,243 8,334,669 27.27/1/08-6/30/09 5,704,565 897,519 91.5% 74.4% 448,979 7,051,063 22.57/1/09-6/30/10 4,093,209 799,073 89.8% 69.0% 393,040 5,285,322 17.07/1/10-6/30/11 5,590,050 1,263,532 87.1% 63.4% 687,079 7,540,661 24.37/1/11-6/30/12 5,008,772 507,407 82.3% 57.2% 357,417 5,873,596 18.77/1/12-6/30/13 6,436,312 725,775 75.0% 47.7% 662,497 7,824,585 24.87/1/13-6/30/14 6,941,003 1,748,307 68.1% 38.5% 1,885,386 10,574,696 33.07/1/14-6/30/15 2,397,822 1,951,856 42.4% 15.7% 4,207,684 8,557,362 25.9
Total 100,907,602 11,599,252 11,115,266 123,622,119
Notes:Columns (1) and (2) provided by City of Virginia Beach.The factors in Column (3) equal 1.0 / Exhibit 2, Sheet 1, Column (2).The factors in Column (4) equal 1.0 / Exhibit 2, Sheet 3, Column (2).Column (5) equals Column (2) x [1.0 - Column (3)] / [Column (3) - Column (4)].Column (6) equals Column (1) + Column (2) + Column (5).Column (7) equals Column (6) / Payroll (000's).* Fiscal years 1986 through 1990 only include open claims.
Oliver Wyman Actuarial Consulting, Inc.
27
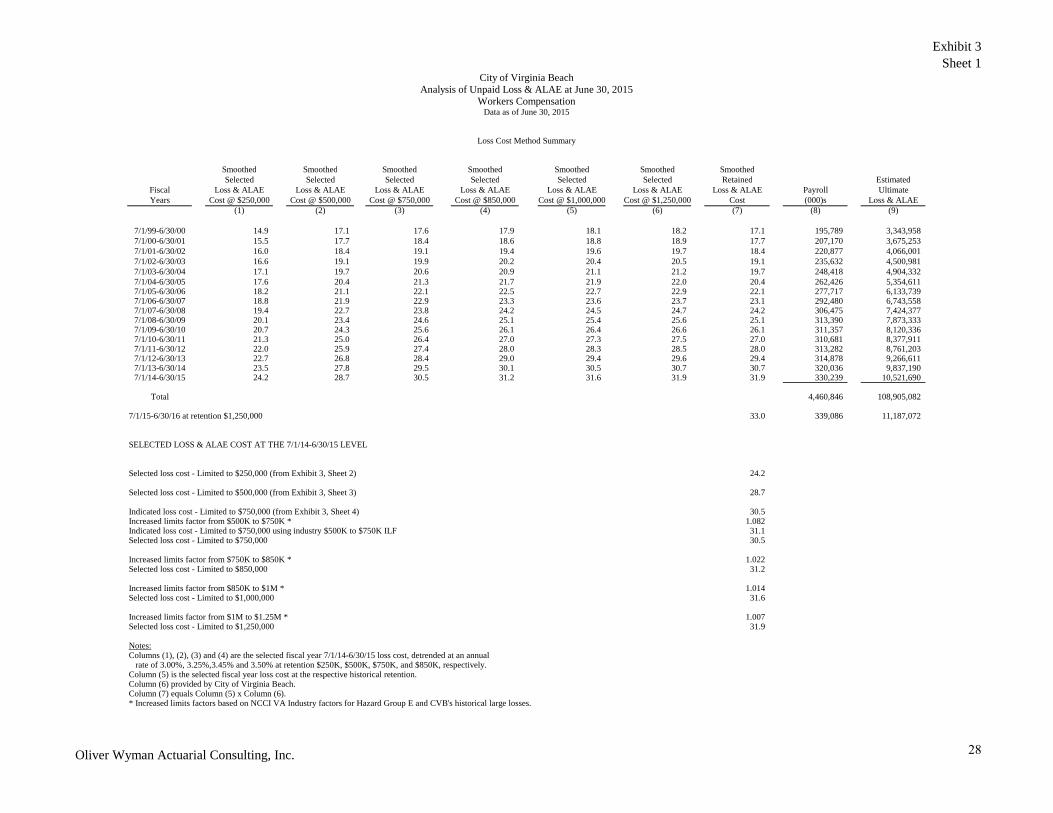
Exhibit 3Sheet 1
City of Virginia BeachAnalysis of Unpaid Loss & ALAE at June 30, 2015
Workers CompensationData as of June 30, 2015
Loss Cost Method Summary
Smoothed Smoothed Smoothed Smoothed Smoothed Smoothed SmoothedSelected Selected Selected Selected Selected Selected Retained Estimated
Fiscal Loss & ALAE Loss & ALAE Loss & ALAE Loss & ALAE Loss & ALAE Loss & ALAE Loss & ALAE Payroll UltimateYears Cost @ $250,000 Cost @ $500,000 Cost @ $750,000 Cost @ $850,000 Cost @ $1,000,000 Cost @ $1,250,000 Cost (000)s Loss & ALAE
(1) (2) (3) (4) (5) (6) (7) (8) (9)
7/1/99-6/30/00 14.9 17.1 17.6 17.9 18.1 18.2 17.1 195,789 3,343,9587/1/00-6/30/01 15.5 17.7 18.4 18.6 18.8 18.9 17.7 207,170 3,675,2537/1/01-6/30/02 16.0 18.4 19.1 19.4 19.6 19.7 18.4 220,877 4,066,0017/1/02-6/30/03 16.6 19.1 19.9 20.2 20.4 20.5 19.1 235,632 4,500,9817/1/03-6/30/04 17.1 19.7 20.6 20.9 21.1 21.2 19.7 248,418 4,904,3327/1/04-6/30/05 17.6 20.4 21.3 21.7 21.9 22.0 20.4 262,426 5,354,6117/1/05-6/30/06 18.2 21.1 22.1 22.5 22.7 22.9 22.1 277,717 6,133,7397/1/06-6/30/07 18.8 21.9 22.9 23.3 23.6 23.7 23.1 292,480 6,743,5587/1/07-6/30/08 19.4 22.7 23.8 24.2 24.5 24.7 24.2 306,475 7,424,3777/1/08-6/30/09 20.1 23.4 24.6 25.1 25.4 25.6 25.1 313,390 7,873,3337/1/09-6/30/10 20.7 24.3 25.6 26.1 26.4 26.6 26.1 311,357 8,120,3367/1/10-6/30/11 21.3 25.0 26.4 27.0 27.3 27.5 27.0 310,681 8,377,9117/1/11-6/30/12 22.0 25.9 27.4 28.0 28.3 28.5 28.0 313,282 8,761,2037/1/12-6/30/13 22.7 26.8 28.4 29.0 29.4 29.6 29.4 314,878 9,266,6117/1/13-6/30/14 23.5 27.8 29.5 30.1 30.5 30.7 30.7 320,036 9,837,1907/1/14-6/30/15 24.2 28.7 30.5 31.2 31.6 31.9 31.9 330,239 10,521,690
Total 4,460,846 108,905,082
7/1/15-6/30/16 at retention $1,250,000 33.0 339,086 11,187,072
SELECTED LOSS & ALAE COST AT THE 7/1/14-6/30/15 LEVEL
Selected loss cost - Limited to $250,000 (from Exhibit 3, Sheet 2) 24.2
Selected loss cost - Limited to $500,000 (from Exhibit 3, Sheet 3) 28.7
Indicated loss cost - Limited to $750,000 (from Exhibit 3, Sheet 4) 30.5Increased limits factor from $500K to $750K * 1.082 Indicated loss cost - Limited to $750,000 using industry $500K to $750K ILF 31.1Selected loss cost - Limited to $750,000 30.5
Increased limits factor from $750K to $850K * 1.022 Selected loss cost - Limited to $850,000 31.2
Increased limits factor from $850K to $1M * 1.014Selected loss cost - Limited to $1,000,000 31.6
Increased limits factor from $1M to $1.25M * 1.007Selected loss cost - Limited to $1,250,000 31.9
Notes:Columns (1), (2), (3) and (4) are the selected fiscal year 7/1/14-6/30/15 loss cost, detrended at an annual rate of 3.00%, 3.25%,3.45% and 3.50% at retention $250K, $500K, $750K, and $850K, respectively.Column (5) is the selected fiscal year loss cost at the respective historical retention.Column (6) provided by City of Virginia Beach.Column (7) equals Column (5) x Column (6).* Increased limits factors based on NCCI VA Industry factors for Hazard Group E and CVB's historical large losses.
Oliver Wyman Actuarial Consulting, Inc.
28

Exhibit 3Sheet 2
City of Virginia BeachAnalysis of Unpaid Loss & ALAE at June 30, 2015
Workers CompensationData as of June 30, 2015
Loss Cost Method, Loss & ALAE Limited to $250,000
Initial AdjustmentEstimated to FY2015 Adjustment Adjusted Trended
Fiscal Ultimate Benefit to FY2015 Payroll (000's) Indicated to FY2015Years Loss & ALAE Level Payroll (000's) Exposure (3) x (4) Loss Cost Loss Cost
(1) (2) (3) (4) (5) (6) (7)
7/1/99-6/30/00 2,447,687 1.040 195,789 1.000 195,789 13.0 20.37/1/00-6/30/01 3,867,308 1.033 207,170 1.000 207,170 19.3 29.27/1/01-6/30/02 3,667,660 1.028 220,877 1.000 220,877 17.1 25.17/1/02-6/30/03 3,123,982 1.023 235,632 1.000 235,632 13.6 19.37/1/03-6/30/04 5,163,321 1.022 248,418 1.000 248,418 21.2 29.47/1/04-6/30/05 5,914,901 1.021 262,426 1.000 262,426 23.0 30.97/1/05-6/30/06 4,792,293 1.018 277,717 1.000 277,717 17.6 22.97/1/06-6/30/07 5,047,359 1.015 292,480 1.000 292,480 17.5 22.27/1/07-6/30/08 4,882,253 1.012 306,475 1.000 306,475 16.1 19.87/1/08-6/30/09 4,699,524 1.010 313,390 1.000 313,390 15.1 18.17/1/09-6/30/10 4,604,891 1.007 311,357 1.000 311,357 14.9 17.37/1/10-6/30/11 5,633,277 1.008 310,681 1.000 310,681 18.3 20.67/1/11-6/30/12 5,159,248 1.006 313,282 1.000 313,282 16.6 18.17/1/12-6/30/13 7,719,193 1.003 314,878 1.000 314,878 24.6 26.17/1/13-6/30/14 9,878,844 1.001 320,036 1.000 320,036 30.9 31.87/1/14-6/30/15 8,323,950 1.000 330,239 1.000 330,239 25.2 25.2
Total 84,925,690 4,460,846 4,460,846
AVERAGES AT THE 7/1/14-6/30/15 LEVEL
Average of fiscal years 7/1/99-6/30/00 through 7/1/13-6/30/14: 23.4Average of fiscal years 7/1/99-6/30/00 through 7/1/13-6/30/14 excluding extremes: 23.2Weighted average of fiscal years 7/1/99-6/30/00 through 7/1/13-6/30/14: 23.2Weighted average of fiscal years 7/1/03-6/30/04 through 7/1/13-6/30/14: 23.2Weighted average of fiscal years 7/1/10-6/30/11 through 7/1/13-6/30/14: 24.2Selected 7/1/14-6/30/15 loss & ALAE cost: 24.2
Notes:Column (1) based on the reported and paid development methods from Exhibit 2, Sheet 2, Column (3
and Exhibit 2, Sheet 4, Column (3), respectively, and actuarial judgmentColumn (2) based on the latest published NCCI Statistical BulletinColumn (3) provided by City of Virginia Beach.Column (4) not used in this study.Column (6) equals Column (1) x Column (2) / Column (5)Column (7) equals Column (6) x the selected loss cost trend of 3.00%
Oliver Wyman Actuarial Consulting, Inc.
29

Exhibit 3Sheet 3
Initial AdjustmentEstimated to FY2015 Adjustment Adjusted Trended
Fiscal Ultimate Benefit to FY2015 Payroll (000's) Indicated to FY2015Years Loss & ALAE Level Payroll (000's) Exposure (3) x (4) Loss Cost Loss Cost
(1) (2) (3) (4) (5) (6) (7)
7/1/99-6/30/00 2,466,296 1.040 195,789 1.000 195,789 13.1 21.27/1/00-6/30/01 3,883,465 1.033 207,170 1.000 207,170 19.4 30.37/1/01-6/30/02 3,852,207 1.028 220,877 1.000 220,877 17.9 27.27/1/02-6/30/03 3,205,156 1.023 235,632 1.000 235,632 13.9 20.47/1/03-6/30/04 6,667,887 1.022 248,418 1.000 248,418 27.4 39.07/1/04-6/30/05 8,156,167 1.021 262,426 1.000 262,426 31.7 43.77/1/05-6/30/06 6,873,105 1.018 277,717 1.000 277,717 25.2 33.67/1/06-6/30/07 5,759,723 1.015 292,480 1.000 292,480 20.0 25.87/1/07-6/30/08 7,162,675 1.012 306,475 1.000 306,475 23.7 29.67/1/08-6/30/09 6,003,014 1.010 313,390 1.000 313,390 19.3 23.47/1/09-6/30/10 5,383,250 1.007 311,357 1.000 311,357 17.4 20.47/1/10-6/30/11 7,347,298 1.008 310,681 1.000 310,681 23.8 27.17/1/11-6/30/12 6,159,247 1.006 313,282 1.000 313,282 19.8 21.87/1/12-6/30/13 8,764,835 1.003 314,878 1.000 314,878 27.9 29.87/1/13-6/30/14 11,134,506 1.001 320,036 1.000 320,036 34.8 36.07/1/14-6/30/15 9,457,245 1.000 330,239 1.000 330,239 28.6 28.6
Total 102,276,076 4,460,846 4,460,846
AVERAGES AT THE 7/1/14-6/30/15 LEVEL
Average of fiscal years 7/1/99-6/30/00 through 7/1/13-6/30/14: 28.6Average of fiscal years 7/1/99-6/30/00 through 7/1/13-6/30/14 excluding extremes: 28.1Weighted average of fiscal years 7/1/99-6/30/00 through 7/1/13-6/30/14: 28.6Weighted average of fiscal years 7/1/03-6/30/04 through 7/1/13-6/30/14: 29.6Weighted average of fiscal years 7/1/10-6/30/11 through 7/1/13-6/30/14: 28.7Selected 7/1/14-6/30/15 loss & ALAE cost: 28.7
Notes:Column (1) based on the reported and paid development methods from Exhibit 2, Sheet 2, Column (3
and Exhibit 2, Sheet 4, Column (3), respectively, and actuarial judgmentColumn (2) based on the latest published NCCI Statistical BulletinColumn (3) provided by City of Virginia Beach.Column (4) not used in this study.Column (6) equals Column (1) x Column (2) / Column (5)Column (7) equals Column (6) x the selected loss cost trend of 3.25%
Loss Cost Method, Loss & ALAE Limited to $500,000
City of Virginia BeachAnalysis of Unpaid Loss & ALAE at June 30, 2015
Workers CompensationData as of June 30, 2015
Oliver Wyman Actuarial Consulting, Inc.
30
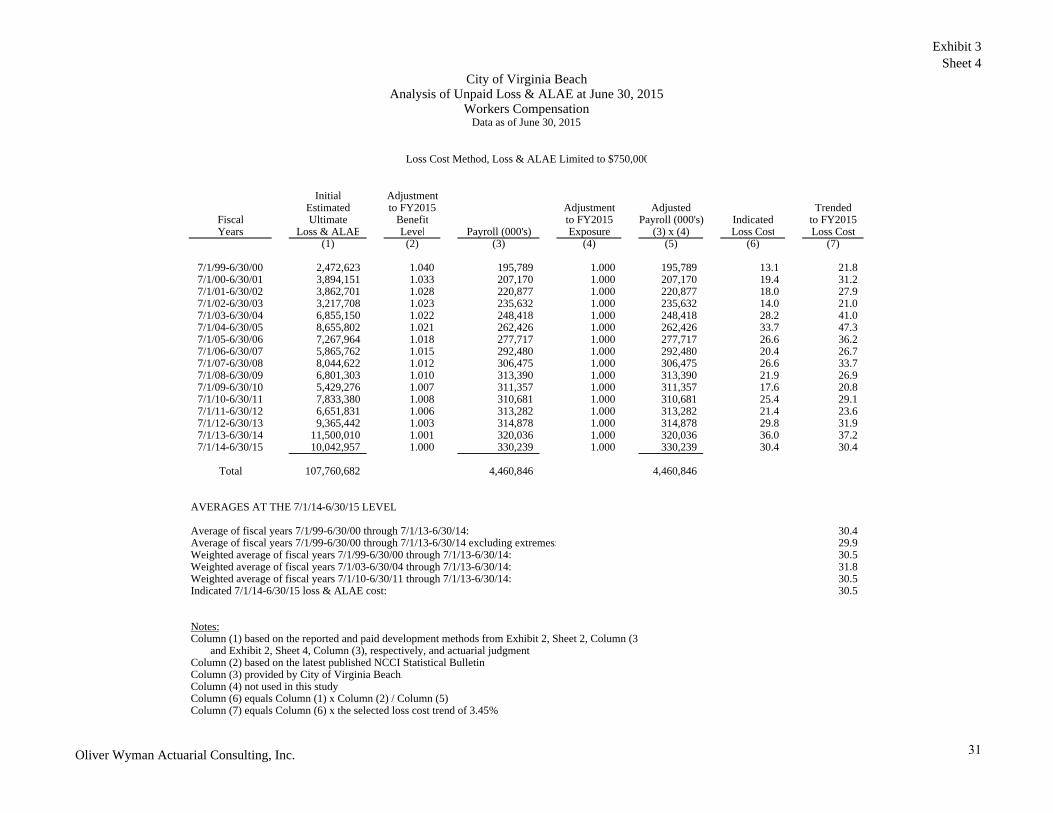
Exhibit 3Sheet 4
Initial AdjustmentEstimated to FY2015 Adjustment Adjusted Trended
Fiscal Ultimate Benefit to FY2015 Payroll (000's) Indicated to FY2015Years Loss & ALAE Level Payroll (000's) Exposure (3) x (4) Loss Cost Loss Cost
(1) (2) (3) (4) (5) (6) (7)
7/1/99-6/30/00 2,472,623 1.040 195,789 1.000 195,789 13.1 21.87/1/00-6/30/01 3,894,151 1.033 207,170 1.000 207,170 19.4 31.27/1/01-6/30/02 3,862,701 1.028 220,877 1.000 220,877 18.0 27.97/1/02-6/30/03 3,217,708 1.023 235,632 1.000 235,632 14.0 21.07/1/03-6/30/04 6,855,150 1.022 248,418 1.000 248,418 28.2 41.07/1/04-6/30/05 8,655,802 1.021 262,426 1.000 262,426 33.7 47.37/1/05-6/30/06 7,267,964 1.018 277,717 1.000 277,717 26.6 36.27/1/06-6/30/07 5,865,762 1.015 292,480 1.000 292,480 20.4 26.77/1/07-6/30/08 8,044,622 1.012 306,475 1.000 306,475 26.6 33.77/1/08-6/30/09 6,801,303 1.010 313,390 1.000 313,390 21.9 26.97/1/09-6/30/10 5,429,276 1.007 311,357 1.000 311,357 17.6 20.87/1/10-6/30/11 7,833,380 1.008 310,681 1.000 310,681 25.4 29.17/1/11-6/30/12 6,651,831 1.006 313,282 1.000 313,282 21.4 23.67/1/12-6/30/13 9,365,442 1.003 314,878 1.000 314,878 29.8 31.97/1/13-6/30/14 11,500,010 1.001 320,036 1.000 320,036 36.0 37.27/1/14-6/30/15 10,042,957 1.000 330,239 1.000 330,239 30.4 30.4
Total 107,760,682 4,460,846 4,460,846
AVERAGES AT THE 7/1/14-6/30/15 LEVEL
Average of fiscal years 7/1/99-6/30/00 through 7/1/13-6/30/14: 30.4Average of fiscal years 7/1/99-6/30/00 through 7/1/13-6/30/14 excluding extremes: 29.9Weighted average of fiscal years 7/1/99-6/30/00 through 7/1/13-6/30/14: 30.5Weighted average of fiscal years 7/1/03-6/30/04 through 7/1/13-6/30/14: 31.8Weighted average of fiscal years 7/1/10-6/30/11 through 7/1/13-6/30/14: 30.5Indicated 7/1/14-6/30/15 loss & ALAE cost: 30.5
Notes:Column (1) based on the reported and paid development methods from Exhibit 2, Sheet 2, Column (3
and Exhibit 2, Sheet 4, Column (3), respectively, and actuarial judgmentColumn (2) based on the latest published NCCI Statistical BulletinColumn (3) provided by City of Virginia Beach.Column (4) not used in this study.Column (6) equals Column (1) x Column (2) / Column (5)Column (7) equals Column (6) x the selected loss cost trend of 3.45%
Loss Cost Method, Loss & ALAE Limited to $750,000
City of Virginia BeachAnalysis of Unpaid Loss & ALAE at June 30, 2015
Workers CompensationData as of June 30, 2015
Oliver Wyman Actuarial Consulting, Inc.
31

Exhibit 3Sheet 5
City of Virginia BeachAnalysis of Unpaid Loss & ALAE at June 30, 2015
Workers CompensationData as of June 30, 2015
Loss & ALAE Limited to $250,000
Average Severity Method
Initial Adjustment Trended EstimatedEstimated to FY2015 Selected Indicated to FY2015 Ultimate Indicated
Fiscal Ultimate Benefit Ultimate Average Average Fitted Loss & ALAE Loss & ALAEYears Loss & ALAE Level Claim Counts Severity Severity Severity (3) x (6) Cost
(1) (2) (3) (4) (5) (6) (7) (8)
7/1/99-6/30/00 2,447,687 1.040 788 3,230 5,031 6,099 4,806,130 24.57/1/00-6/30/01 3,867,308 1.033 762 5,245 7,934 6,320 4,815,700 23.27/1/01-6/30/02 3,667,660 1.028 862 4,375 6,426 6,542 5,639,168 25.57/1/02-6/30/03 3,123,982 1.023 729 4,385 6,252 6,772 4,936,721 21.07/1/03-6/30/04 5,163,321 1.022 782 6,749 9,343 6,982 5,459,955 22.07/1/04-6/30/05 5,914,901 1.021 745 8,108 10,896 7,199 5,363,026 20.47/1/05-6/30/06 4,792,293 1.018 814 5,994 7,821 7,437 6,053,635 21.87/1/06-6/30/07 5,047,359 1.015 814 6,294 7,973 7,683 6,253,949 21.47/1/07-6/30/08 4,882,253 1.012 747 6,615 8,135 7,937 5,929,099 19.37/1/08-6/30/09 4,699,524 1.010 680 6,980 8,335 8,192 5,570,343 17.87/1/09-6/30/10 4,604,891 1.007 724 6,405 7,425 8,463 6,127,027 19.77/1/10-6/30/11 5,633,277 1.008 771 7,365 8,289 8,708 6,713,799 21.67/1/11-6/30/12 5,159,248 1.006 774 6,706 7,328 8,987 6,956,004 22.27/1/12-6/30/13 7,719,193 1.003 740 10,456 11,093 9,284 6,874,988 21.87/1/13-6/30/14 9,878,844 1.001 798 12,394 12,766 9,582 7,645,393 23.97/1/14-6/30/15 8,323,950 1.000 755 11,024 11,024 9,879 7,459,622 22.6
Total 84,925,690 12,285 96,604,559
AVERAGES AT THE 7/1/14-6/30/15 LEVEL
Average of fiscal years 7/1/99-6/30/00 through 7/1/13-6/30/14: 8,336Average of fiscal years 7/1/99-6/30/00 through 7/1/13-6/30/14 excluding extremes 8,250Weighted average of fiscal years 7/1/99-6/30/00 through 7/1/13-6/30/14: 8,323Weighted average of fiscal years 7/1/07-6/30/08 through 7/1/13-6/30/14: 9,090Weighted average of fiscal years 7/1/10-6/30/11 through 7/1/13-6/30/14: 9,879Selected 7/1/14-6/30/15 severity: 9,879
Notes:Column (1) based on the reported and paid development methods from Exhibit 2, Sheet 2, Column (3
and Exhibit 2, Sheet 4, Column (3), respectively, and actuarial judgmentColumn (2) based on the latest published NCCI Statistical BulletinColumn (3) is from Exhibit 4, Sheet 1, Column (3).Column (4) equals Column (1) x Column (2) / Column (3)Column (5) equals Column (4) x the selected severity trend of 3.00%Column (6) for all fiscal years is the selected fiscal year 7/1/14-6/30/15 severity
detrended at an annual rate of 3.00%, and adjusted to the appropriate benefit levelColumn (8) equals Column (7) / Payroll (000's).
Oliver Wyman Actuarial Consulting, Inc.
32

Exhibit 3Sheet 6
City of Virginia BeachAnalysis of Unpaid Loss & ALAE at June 30, 2015
Workers CompensationData as of June 30, 2015
FREQUENCY TREND
SEVERITY TREND
LOSS COST TREND
Notes:The selected frequency trend is 0.00%.The selected severity trend is 3.00%.The selected loss cost trend is 3.00%.The severity and loss cost trends (for both Indicated and Fitted lines) are shown at a $250,000 per occurrence limit.
0.00
0.50
1.00
1.50
2.00
2.50
3.00
3.50
4.00
4.50
2000 2001 2002 2003 2004 2005 2006 2007 2008 2009 2010 2011 2012 2013 2014 2015
FREQ
UEN
CY
0
2,000
4,000
6,000
8,000
10,000
12,000
14,000
2000 2001 2002 2003 2004 2005 2006 2007 2008 2009 2010 2011 2012 2013 2014 2015
SEVER
ITY
0.0
5.0
10.0
15.0
20.0
25.0
30.0
35.0
2000 2001 2002 2003 2004 2005 2006 2007 2008 2009 2010 2011 2012 2013 2014 2015
LOSS COST
FISCAL YEAR ENDING
Indicated Fitted
Oliver Wyman Actuarial Consulting, Inc.
33

Exhibit 4Sheet 1
City of Virginia BeachAnalysis of Unpaid Loss & ALAE at June 30, 2015
Workers CompensationData as of June 30, 2015
Estimate of Ultimate Claim Counts
Reported Reported Closed Implied OpenClaim Bornhuetter- Selected Claim Counts and IBNR
Fiscal Development Ferguson Ultimate Implied as of Claim CountsYears Method Method Claim Counts Frequency 6/30/15 (3) - (5)
(1) (2) (3) (4) (5) (6)
7/1/85-6/30/86 na na na na na 17/1/86-6/30/87 na na na na na 17/1/87-6/30/88 na na na na na 57/1/88-6/30/89 na na na na na 27/1/89-6/30/90 na na na na na 07/1/90-6/30/91 na na 541 na 538 37/1/91-6/30/92 na na 639 na 638 17/1/92-6/30/93 na na 659 na 659 07/1/93-6/30/94 na na 670 na 668 27/1/94-6/30/95 na na 689 na 687 27/1/95-6/30/96 na na 665 na 664 17/1/96-6/30/97 na na 566 na 564 27/1/97-6/30/98 na na 610 na 609 17/1/98-6/30/99 na na 700 na 699 17/1/99-6/30/00 788 788 788 4.02 785 37/1/00-6/30/01 762 762 762 3.68 758 47/1/01-6/30/02 862 862 862 3.90 860 27/1/02-6/30/03 729 729 729 3.09 726 37/1/03-6/30/04 782 782 782 3.15 774 87/1/04-6/30/05 745 745 745 2.84 733 127/1/05-6/30/06 814 814 814 2.93 803 117/1/06-6/30/07 814 814 814 2.78 797 177/1/07-6/30/08 747 747 747 2.44 732 157/1/08-6/30/09 680 680 680 2.17 668 127/1/09-6/30/10 724 724 724 2.33 708 167/1/10-6/30/11 771 771 771 2.48 756 157/1/11-6/30/12 774 774 774 2.47 752 227/1/12-6/30/13 740 740 740 2.35 700 407/1/13-6/30/14 798 798 798 2.49 716 827/1/14-6/30/15 755 756 755 2.29 499 256
Total 12,285 12,286 18,024 2.75 17,493 540
Notes:Columns (1) and (2) are from Exhibit 4, Sheet 2, Columns (3) and (8), respectively.Column (3) based on Columns (1) and (2), actual reported claims, and actuarial judgment.Column (4) equals Column (3) / Payroll (000's) x 1,000.Column (5) provided by City of Virginia Beach.Column (6) for fiscal years 1986 through 1990 is equal to actual open claims as of 6/30/15.
Oliver Wyman Actuarial Consulting, Inc.
34
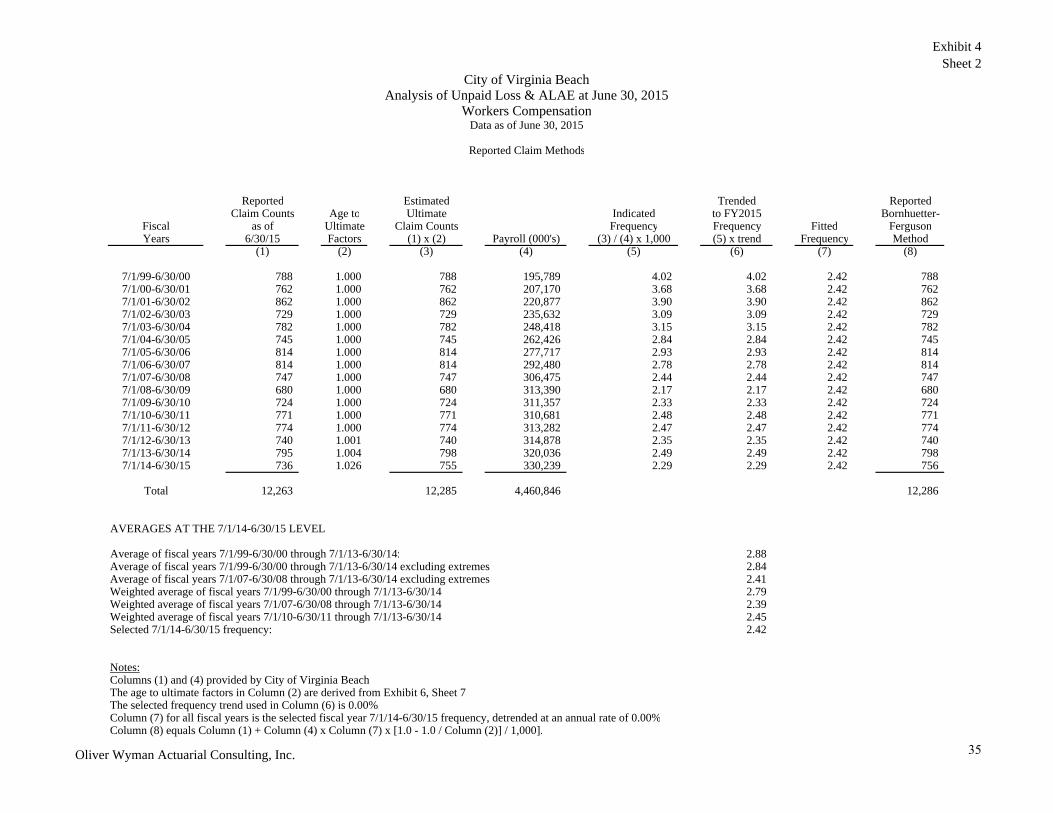
Exhibit 4Sheet 2
City of Virginia BeachAnalysis of Unpaid Loss & ALAE at June 30, 2015
Workers CompensationData as of June 30, 2015
Reported Claim Methods
Reported Estimated Trended ReportedClaim Counts Age to Ultimate Indicated to FY2015 Bornhuetter-
Fiscal as of Ultimate Claim Counts Frequency Frequency Fitted FergusonYears 6/30/15 Factors (1) x (2) Payroll (000's) (3) / (4) x 1,000 (5) x trend Frequency Method
(1) (2) (3) (4) (5) (6) (7) (8)
7/1/99-6/30/00 788 1.000 788 195,789 4.02 4.02 2.42 7887/1/00-6/30/01 762 1.000 762 207,170 3.68 3.68 2.42 7627/1/01-6/30/02 862 1.000 862 220,877 3.90 3.90 2.42 8627/1/02-6/30/03 729 1.000 729 235,632 3.09 3.09 2.42 7297/1/03-6/30/04 782 1.000 782 248,418 3.15 3.15 2.42 7827/1/04-6/30/05 745 1.000 745 262,426 2.84 2.84 2.42 7457/1/05-6/30/06 814 1.000 814 277,717 2.93 2.93 2.42 8147/1/06-6/30/07 814 1.000 814 292,480 2.78 2.78 2.42 8147/1/07-6/30/08 747 1.000 747 306,475 2.44 2.44 2.42 7477/1/08-6/30/09 680 1.000 680 313,390 2.17 2.17 2.42 6807/1/09-6/30/10 724 1.000 724 311,357 2.33 2.33 2.42 7247/1/10-6/30/11 771 1.000 771 310,681 2.48 2.48 2.42 7717/1/11-6/30/12 774 1.000 774 313,282 2.47 2.47 2.42 7747/1/12-6/30/13 740 1.001 740 314,878 2.35 2.35 2.42 7407/1/13-6/30/14 795 1.004 798 320,036 2.49 2.49 2.42 7987/1/14-6/30/15 736 1.026 755 330,239 2.29 2.29 2.42 756
Total 12,263 12,285 4,460,846 12,286
AVERAGES AT THE 7/1/14-6/30/15 LEVEL
Average of fiscal years 7/1/99-6/30/00 through 7/1/13-6/30/14: 2.88Average of fiscal years 7/1/99-6/30/00 through 7/1/13-6/30/14 excluding extremes 2.84Average of fiscal years 7/1/07-6/30/08 through 7/1/13-6/30/14 excluding extremes 2.41Weighted average of fiscal years 7/1/99-6/30/00 through 7/1/13-6/30/14: 2.79Weighted average of fiscal years 7/1/07-6/30/08 through 7/1/13-6/30/14: 2.39Weighted average of fiscal years 7/1/10-6/30/11 through 7/1/13-6/30/14: 2.45Selected 7/1/14-6/30/15 frequency: 2.42
Notes:Columns (1) and (4) provided by City of Virginia Beach.The age to ultimate factors in Column (2) are derived from Exhibit 6, Sheet 7The selected frequency trend used in Column (6) is 0.00%.Column (7) for all fiscal years is the selected fiscal year 7/1/14-6/30/15 frequency, detrended at an annual rate of 0.00%Column (8) equals Column (1) + Column (4) x Column (7) x [1.0 - 1.0 / Column (2)] / 1,000].
Oliver Wyman Actuarial Consulting, Inc.
35

Exhibit 5Sheet 1
City of Virginia BeachAnalysis of Unpaid Loss & ALAE at June 30, 2015
Workers CompensationData as of June 30, 2015
Summary of Loss Data Valued as of June 30, 2015
Reported* Open Unlimited Loss & ALAE Loss & ALAE Excess of $250K Loss & ALAE Excess of $500K Loss & ALAE Excess of $750KFiscal Claim Claim CaseYears Retention Counts Counts Paid Reserves Reported Paid Reported Paid Reported Paid Reported
(1) (2) (3) (4) (5) (6) (7) (8) (9) (10) (11)
7/1/85-6/30/86 ** 200,000 1 1 115,107 11,247 126,354 0 0 0 0 0 07/1/86-6/30/87 ** 200,000 1 1 166,592 4,302 170,894 0 0 0 0 0 07/1/87-6/30/88 ** 250,000 5 5 1,495,645 23,119 1,518,765 395,480 407,328 0 0 0 07/1/88-6/30/89 ** 300,000 2 2 7,535 6,077 13,612 0 0 0 0 0 07/1/89-6/30/90 ** 400,000 0 0 0 0 0 0 0 0 0 0 07/1/90-6/30/91 *** 450,000 541 3 1,779,984 153,918 1,933,902 84,819 220,228 0 0 0 07/1/91-6/30/92 450,000 639 1 1,791,752 23,331 1,815,083 40,276 40,276 0 0 0 07/1/92-6/30/93 500,000 659 0 2,233,888 0 2,233,888 41,864 41,864 0 0 0 07/1/93-6/30/94 500,000 670 2 2,714,289 35,559 2,749,848 189,130 210,445 0 0 0 07/1/94-6/30/95 500,000 689 2 2,527,954 120,887 2,648,840 17,597 17,597 0 0 0 07/1/95-6/30/96 500,000 665 1 1,877,862 6,740 1,884,601 78,598 78,598 0 0 0 07/1/96-6/30/97 500,000 566 2 2,220,420 96,426 2,316,846 250,070 339,546 70 89,546 0 07/1/97-6/30/98 500,000 610 1 1,934,865 3,307 1,938,172 0 0 0 0 0 07/1/98-6/30/99 500,000 700 1 2,105,581 18,949 2,124,530 0 0 0 0 0 07/1/99-6/30/00 500,000 788 3 2,402,831 23,236 2,426,067 0 0 0 0 0 07/1/00-6/30/01 500,000 762 4 3,702,464 99,800 3,802,264 0 0 0 0 0 07/1/01-6/30/02 500,000 862 2 3,615,996 133,865 3,749,860 31,524 117,308 0 0 0 07/1/02-6/30/03 500,000 729 3 3,090,891 22,236 3,113,127 35,328 35,328 0 0 0 07/1/03-6/30/04 500,000 782 8 6,284,376 297,274 6,581,651 1,242,410 1,478,534 4,656 103,160 0 07/1/04-6/30/05 500,000 745 12 7,767,668 710,689 8,478,358 1,954,209 2,621,953 281,721 635,907 2,684 242,2977/1/05-6/30/06 750,000 814 11 6,226,280 696,736 6,923,016 1,435,311 2,130,722 139,541 401,167 0 7,5887/1/06-6/30/07 800,000 # 814 17 4,911,936 586,369 5,498,304 325,638 609,947 0 67,970 0 07/1/07-6/30/08 850,000 747 15 6,446,770 1,504,346 7,951,116 1,990,287 3,244,043 643,101 1,255,329 102,889 441,3157/1/08-6/30/09 850,000 680 12 5,704,565 976,820 6,681,385 1,439,855 2,138,637 435,399 914,196 27,748 252,2117/1/09-6/30/10 850,000 724 16 4,093,209 799,073 4,892,282 91,637 579,338 0 0 0 07/1/10-6/30/11 850,000 771 15 5,590,050 1,263,532 6,853,582 618,711 1,692,333 0 370,527 0 07/1/11-6/30/12 850,000 774 22 5,008,772 507,407 5,516,179 722,529 913,684 246,216 288,469 0 11,1377/1/12-6/30/13 1,000,000 740 40 6,436,312 725,775 7,162,088 555,761 584,311 305,761 305,761 55,761 55,7617/1/13-6/30/14 1,250,000 795 79 6,941,003 2,294,830 9,235,833 599,849 1,543,360 349,849 946,523 99,849 646,5227/1/14-6/30/15 1,250,000 736 237 2,397,822 1,951,856 4,349,678 0 0 0 0 0 0
Total 18,011 518 101,592,418 13,097,705 114,690,123 12,140,883 19,045,380 2,406,314 5,378,554 288,931 1,656,832
Loss & ALAE Limited to $250,000 Loss & ALAE Limited to $500,000 Loss & ALAE Limited to $750,000 Loss & ALAE Limited to RetentionFiscal Case Case Case CaseYears Paid Reserves Reported Paid Reserves Reported Paid Reserves Reported Paid Reserves Reported
(12) (13) (14) (15) (16) (17) (18) (19) (20) (21) (22) (23)
7/1/85-6/30/86 ** 115,107 11,247 126,354 115,107 11,247 126,354 115,107 11,247 126,354 115,107 11,247 126,3547/1/86-6/30/87 ** 166,592 4,302 170,894 166,592 4,302 170,894 166,592 4,302 170,894 166,592 4,302 170,8947/1/87-6/30/88 ** 1,100,165 11,272 1,111,437 1,495,645 23,119 1,518,765 1,495,645 23,119 1,518,765 1,100,165 11,272 1,111,4377/1/88-6/30/89 ** 7,535 6,077 13,612 7,535 6,077 13,612 7,535 6,077 13,612 7,535 6,077 13,6127/1/89-6/30/90 ** 0 0 0 0 0 0 0 0 0 0 0 07/1/90-6/30/91 *** 1,695,165 18,509 1,713,674 1,779,984 153,918 1,933,902 1,779,984 153,918 1,933,902 1,779,984 133,690 1,913,6747/1/91-6/30/92 1,751,476 23,331 1,774,807 1,791,752 23,331 1,815,083 1,791,752 23,331 1,815,083 1,791,752 23,331 1,815,0837/1/92-6/30/93 2,192,024 0 2,192,024 2,233,888 0 2,233,888 2,233,888 0 2,233,888 2,233,888 0 2,233,8887/1/93-6/30/94 2,525,158 14,244 2,539,403 2,714,289 35,559 2,749,848 2,714,289 35,559 2,749,848 2,714,289 35,559 2,749,8487/1/94-6/30/95 2,510,357 120,887 2,631,244 2,527,954 120,887 2,648,840 2,527,954 120,887 2,648,840 2,527,954 120,887 2,648,8407/1/95-6/30/96 1,799,264 6,740 1,806,003 1,877,862 6,740 1,884,601 1,877,862 6,740 1,884,601 1,877,862 6,740 1,884,6017/1/96-6/30/97 1,970,350 6,950 1,977,300 2,220,350 6,950 2,227,300 2,220,420 96,426 2,316,846 2,220,350 6,950 2,227,3007/1/97-6/30/98 1,934,865 3,307 1,938,172 1,934,865 3,307 1,938,172 1,934,865 3,307 1,938,172 1,934,865 3,307 1,938,1727/1/98-6/30/99 2,105,581 18,949 2,124,530 2,105,581 18,949 2,124,530 2,105,581 18,949 2,124,530 2,105,581 18,949 2,124,5307/1/99-6/30/00 2,402,831 23,236 2,426,067 2,402,831 23,236 2,426,067 2,402,831 23,236 2,426,067 2,402,831 23,236 2,426,0677/1/00-6/30/01 3,702,464 99,800 3,802,264 3,702,464 99,800 3,802,264 3,702,464 99,800 3,802,264 3,702,464 99,800 3,802,2647/1/01-6/30/02 3,584,472 48,080 3,632,552 3,615,996 133,865 3,749,860 3,615,996 133,865 3,749,860 3,615,996 133,865 3,749,8607/1/02-6/30/03 3,055,563 22,236 3,077,799 3,090,891 22,236 3,113,127 3,090,891 22,236 3,113,127 3,090,891 22,236 3,113,1277/1/03-6/30/04 5,041,966 61,151 5,103,117 6,279,720 198,770 6,478,490 6,284,376 297,274 6,581,651 6,279,720 198,770 6,478,4907/1/04-6/30/05 5,813,460 42,946 5,856,405 7,485,948 356,503 7,842,451 7,764,984 471,077 8,236,061 7,485,948 356,503 7,842,4517/1/05-6/30/06 4,790,968 1,325 4,792,293 6,086,738 435,111 6,521,849 6,226,280 689,148 6,915,428 6,226,280 689,148 6,915,4287/1/06-6/30/07 4,586,298 302,059 4,888,357 4,911,936 518,399 5,430,335 4,911,936 586,369 5,498,304 4,911,936 586,369 5,498,3047/1/07-6/30/08 4,456,483 250,590 4,707,073 5,803,669 892,118 6,695,787 6,343,881 1,165,920 7,509,801 6,443,881 1,213,545 7,657,4267/1/08-6/30/09 4,264,710 278,037 4,542,747 5,269,166 498,023 5,767,189 5,676,817 752,356 6,429,173 5,704,565 897,519 6,602,0847/1/09-6/30/10 4,001,572 311,371 4,312,944 4,093,209 799,073 4,892,282 4,093,209 799,073 4,892,282 4,093,209 799,073 4,892,2827/1/10-6/30/11 4,971,339 189,910 5,161,249 5,590,050 893,005 6,483,055 5,590,050 1,263,532 6,853,582 5,590,050 1,263,532 6,853,5827/1/11-6/30/12 4,286,243 316,252 4,602,495 4,762,556 465,153 5,227,709 5,008,772 496,269 5,505,041 5,008,772 507,407 5,516,1797/1/12-6/30/13 5,880,551 697,225 6,577,777 6,130,551 725,775 6,856,327 6,380,551 725,775 7,106,327 6,436,312 725,775 7,162,0887/1/13-6/30/14 6,341,154 1,351,318 7,692,473 6,591,154 1,698,156 8,289,311 6,841,154 1,748,156 8,589,311 6,941,003 1,748,307 8,689,3117/1/14-6/30/15 2,397,822 1,951,856 4,349,678 2,397,822 1,951,856 4,349,678 2,397,822 1,951,856 4,349,678 2,397,822 1,951,856 4,349,678
Total 89,451,535 6,193,208 95,644,743 99,186,104 10,125,466 109,311,570 101,303,487 11,729,804 113,033,291 100,907,602 11,599,252 112,506,853
Notes:Columns (1) through (23) provided by City of Virginia Beach.* Reported claim counts exclude claims closed without payment.** Fiscal years 1986 through 1990 only include open claims.*** Fiscal year 1990 only included claims with date of loss 8/1/1990 and later.# Retention changes from $750,000 to $850,000 at 3/1/2007.
Oliver Wyman Actuarial Consulting, Inc.
36
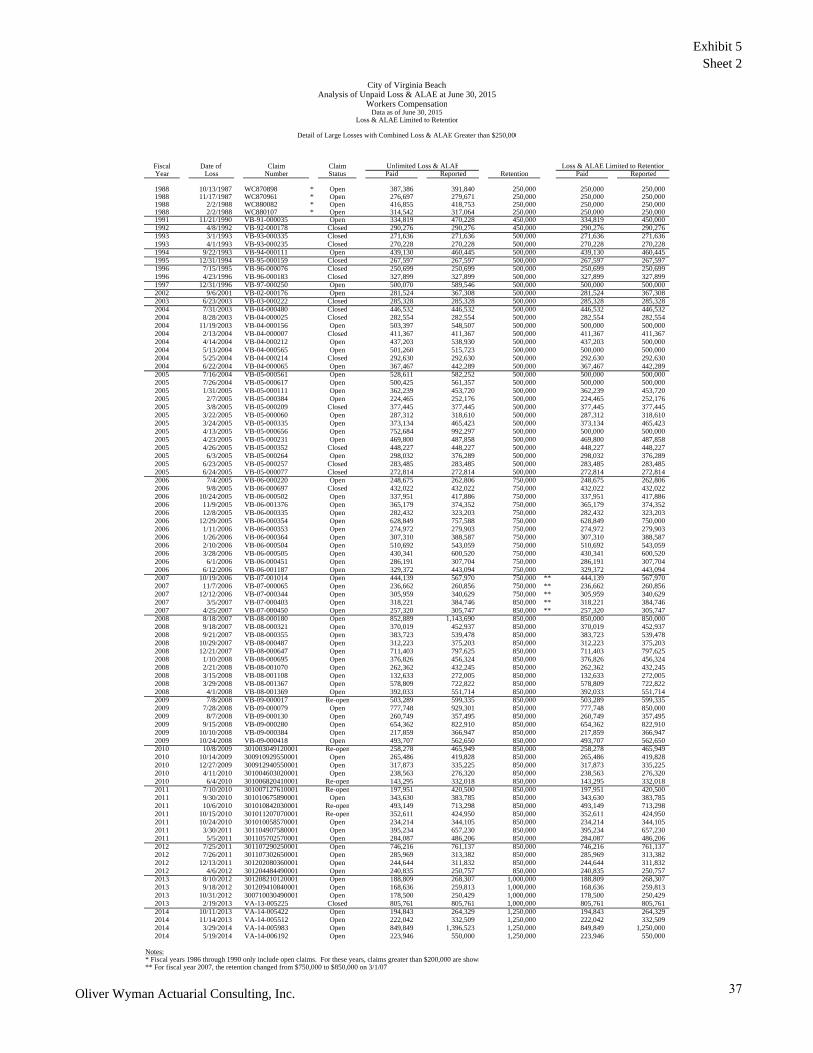
Exhibit 5Sheet 2
Fiscal Date of Claim ClaimYear Loss Number Status Paid Reported Retention Paid Reported
1988 10/13/1987 WC870898 * Open 387,386 391,840 250,000 250,000 250,000 1988 11/17/1987 WC870961 * Open 276,697 279,671 250,000 250,000 250,000 1988 2/2/1988 WC880082 * Open 416,855 418,753 250,000 250,000 250,000 1988 2/2/1988 WC880107 * Open 314,542 317,064 250,000 250,000 250,000 1991 11/21/1990 VB-91-000035 Open 334,819 470,228 450,000 334,819 450,000 1992 4/8/1992 VB-92-000178 Closed 290,276 290,276 450,000 290,276 290,276 1993 3/1/1993 VB-93-000335 Closed 271,636 271,636 500,000 271,636 271,636 1993 4/1/1993 VB-93-000235 Closed 270,228 270,228 500,000 270,228 270,228 1994 9/22/1993 VB-94-000111 Open 439,130 460,445 500,000 439,130 460,445 1995 12/31/1994 VB-95-000159 Closed 267,597 267,597 500,000 267,597 267,597 1996 7/15/1995 VB-96-000076 Closed 250,699 250,699 500,000 250,699 250,699 1996 4/23/1996 VB-96-000183 Closed 327,899 327,899 500,000 327,899 327,899 1997 12/31/1996 VB-97-000250 Open 500,070 589,546 500,000 500,000 500,000 2002 9/6/2001 VB-02-000176 Open 281,524 367,308 500,000 281,524 367,308 2003 6/23/2003 VB-03-000222 Closed 285,328 285,328 500,000 285,328 285,328 2004 7/31/2003 VB-04-000480 Closed 446,532 446,532 500,000 446,532 446,532 2004 8/28/2003 VB-04-000025 Closed 282,554 282,554 500,000 282,554 282,554 2004 11/19/2003 VB-04-000156 Open 503,397 548,507 500,000 500,000 500,000 2004 2/13/2004 VB-04-000007 Closed 411,367 411,367 500,000 411,367 411,367 2004 4/14/2004 VB-04-000212 Open 437,203 538,930 500,000 437,203 500,000 2004 5/13/2004 VB-04-000565 Open 501,260 515,723 500,000 500,000 500,000 2004 5/25/2004 VB-04-000214 Closed 292,630 292,630 500,000 292,630 292,630 2004 6/22/2004 VB-04-000065 Open 367,467 442,289 500,000 367,467 442,289 2005 7/16/2004 VB-05-000561 Open 528,611 582,252 500,000 500,000 500,000 2005 7/26/2004 VB-05-000617 Open 500,425 561,357 500,000 500,000 500,000 2005 1/31/2005 VB-05-000111 Open 362,239 453,720 500,000 362,239 453,720 2005 2/7/2005 VB-05-000384 Open 224,465 252,176 500,000 224,465 252,176 2005 3/8/2005 VB-05-000209 Closed 377,445 377,445 500,000 377,445 377,445 2005 3/22/2005 VB-05-000060 Open 287,312 318,610 500,000 287,312 318,610 2005 3/24/2005 VB-05-000335 Open 373,134 465,423 500,000 373,134 465,423 2005 4/13/2005 VB-05-000656 Open 752,684 992,297 500,000 500,000 500,000 2005 4/23/2005 VB-05-000231 Open 469,800 487,858 500,000 469,800 487,858 2005 4/26/2005 VB-05-000352 Closed 448,227 448,227 500,000 448,227 448,227 2005 6/3/2005 VB-05-000264 Open 298,032 376,289 500,000 298,032 376,289 2005 6/23/2005 VB-05-000257 Closed 283,485 283,485 500,000 283,485 283,485 2005 6/24/2005 VB-05-000077 Closed 272,814 272,814 500,000 272,814 272,814 2006 7/4/2005 VB-06-000220 Open 248,675 262,806 750,000 248,675 262,806 2006 9/8/2005 VB-06-000697 Closed 432,022 432,022 750,000 432,022 432,022 2006 10/24/2005 VB-06-000502 Open 337,951 417,886 750,000 337,951 417,886 2006 11/9/2005 VB-06-001376 Open 365,179 374,352 750,000 365,179 374,352 2006 12/8/2005 VB-06-000335 Open 282,432 323,203 750,000 282,432 323,203 2006 12/29/2005 VB-06-000354 Open 628,849 757,588 750,000 628,849 750,000 2006 1/11/2006 VB-06-000353 Open 274,972 279,903 750,000 274,972 279,903 2006 1/26/2006 VB-06-000364 Open 307,310 388,587 750,000 307,310 388,587 2006 2/10/2006 VB-06-000504 Open 510,692 543,059 750,000 510,692 543,059 2006 3/28/2006 VB-06-000505 Open 430,341 600,520 750,000 430,341 600,520 2006 6/1/2006 VB-06-000451 Open 286,191 307,704 750,000 286,191 307,704 2006 6/12/2006 VB-06-001187 Open 329,372 443,094 750,000 329,372 443,094 2007 10/19/2006 VB-07-001014 Open 444,139 567,970 750,000 ** 444,139 567,970 2007 11/7/2006 VB-07-000065 Open 236,662 260,856 750,000 ** 236,662 260,856 2007 12/12/2006 VB-07-000344 Open 305,959 340,629 750,000 ** 305,959 340,629 2007 3/5/2007 VB-07-000403 Open 318,221 384,746 850,000 ** 318,221 384,746 2007 4/25/2007 VB-07-000450 Open 257,320 305,747 850,000 ** 257,320 305,747 2008 8/18/2007 VB-08-000180 Open 852,889 1,143,690 850,000 850,000 850,000 2008 9/18/2007 VB-08-000321 Open 370,019 452,937 850,000 370,019 452,937 2008 9/21/2007 VB-08-000355 Open 383,723 539,478 850,000 383,723 539,478 2008 10/29/2007 VB-08-000487 Open 312,223 375,203 850,000 312,223 375,203 2008 12/21/2007 VB-08-000647 Open 711,403 797,625 850,000 711,403 797,625 2008 1/10/2008 VB-08-000695 Open 376,826 456,324 850,000 376,826 456,324 2008 2/21/2008 VB-08-001070 Open 262,362 432,245 850,000 262,362 432,245 2008 3/15/2008 VB-08-001108 Open 132,633 272,005 850,000 132,633 272,005 2008 3/29/2008 VB-08-001367 Open 578,809 722,822 850,000 578,809 722,822 2008 4/1/2008 VB-08-001369 Open 392,033 551,714 850,000 392,033 551,714 2009 7/8/2008 VB-09-000017 Re-open 503,289 599,335 850,000 503,289 599,335 2009 7/28/2008 VB-09-000079 Open 777,748 929,301 850,000 777,748 850,000 2009 8/7/2008 VB-09-000130 Open 260,749 357,495 850,000 260,749 357,495 2009 9/15/2008 VB-09-000280 Open 654,362 822,910 850,000 654,362 822,910 2009 10/10/2008 VB-09-000384 Open 217,859 366,947 850,000 217,859 366,947 2009 10/24/2008 VB-09-000418 Open 493,707 562,650 850,000 493,707 562,650 2010 10/8/2009 301003049120001 Re-open 258,278 465,949 850,000 258,278 465,949 2010 10/14/2009 300910929550001 Open 265,486 419,828 850,000 265,486 419,828 2010 12/27/2009 300912940550001 Open 317,873 335,225 850,000 317,873 335,225 2010 4/11/2010 301004603020001 Open 238,563 276,320 850,000 238,563 276,320 2010 6/4/2010 301006820410001 Re-open 143,295 332,018 850,000 143,295 332,018 2011 7/10/2010 301007127610001 Re-open 197,951 420,500 850,000 197,951 420,500 2011 9/30/2010 301010675890001 Open 343,630 383,785 850,000 343,630 383,785 2011 10/6/2010 301010842030001 Re-open 493,149 713,298 850,000 493,149 713,298 2011 10/15/2010 301011207070001 Re-open 352,611 424,950 850,000 352,611 424,950 2011 10/24/2010 301010058570001 Open 234,214 344,105 850,000 234,214 344,105 2011 3/30/2011 301104907580001 Open 395,234 657,230 850,000 395,234 657,230 2011 5/5/2011 301105702570001 Open 284,087 486,206 850,000 284,087 486,206 2012 7/25/2011 301107290250001 Open 746,216 761,137 850,000 746,216 761,137 2012 7/26/2011 301107302650001 Open 285,969 313,382 850,000 285,969 313,382 2012 12/13/2011 301202080360001 Open 244,644 311,832 850,000 244,644 311,832 2012 4/6/2012 301204484490001 Open 240,835 250,757 850,000 240,835 250,757 2013 8/10/2012 301208210120001 Open 188,809 268,307 1,000,000 188,809 268,307 2013 9/18/2012 301209410840001 Open 168,636 259,813 1,000,000 168,636 259,813 2013 10/31/2012 300710030490001 Open 178,500 250,429 1,000,000 178,500 250,429 2013 2/19/2013 VA-13-005225 Closed 805,761 805,761 1,000,000 805,761 805,761 2014 10/11/2013 VA-14-005422 Open 194,843 264,329 1,250,000 194,843 264,329 2014 11/14/2013 VA-14-005512 Open 222,042 332,509 1,250,000 222,042 332,509 2014 3/29/2014 VA-14-005983 Open 849,849 1,396,523 1,250,000 849,849 1,250,000 2014 5/19/2014 VA-14-006192 Open 223,946 550,000 1,250,000 223,946 550,000
Notes:* Fiscal years 1986 through 1990 only include open claims. For these years, claims greater than $200,000 are shown** For fiscal year 2007, the retention changed from $750,000 to $850,000 on 3/1/07
Loss & ALAE Limited to Retention
Unlimited Loss & ALAE Loss & ALAE Limited to Retention
Detail of Large Losses with Combined Loss & ALAE Greater than $250,000
City of Virginia BeachAnalysis of Unpaid Loss & ALAE at June 30, 2015
Workers CompensationData as of June 30, 2015
Oliver Wyman Actuarial Consulting, Inc.
37

Exhibit 6Sheet 1
City of Virginia BeachAnalysis of Unpaid Loss & ALAE at June 30, 2015
Workers CompensationData as of April 30, 2015
Reported Loss & ALAE Limited to $250,000
Accident Evaluation Date in MonthsPeriod 12 24 36 48 60 72 84 96 108 120 132 144 156 168 180 192 204 216 228 240 252 264 276 288
5/1/91-4/30/92 936,812 1,214,137 1,352,861 1,426,252 1,544,650 1,398,081 1,396,104 1,424,835 1,425,712 1,438,978 1,476,430 1,482,465 1,497,926 1,565,030 1,567,387 1,568,167 1,611,486 1,604,235 1,811,713 1,849,709 1,770,761 1,776,250 1,767,606 1,847,4405/1/92-4/30/93 969,218 1,378,685 1,632,525 1,801,081 1,921,256 1,972,814 2,003,634 2,068,863 2,076,184 2,201,150 2,056,319 2,073,523 2,077,828 2,161,165 2,127,897 2,129,410 2,089,990 2,153,504 2,166,828 2,144,009 2,183,336 2,181,065 2,156,8965/1/93-4/30/94 1,266,182 1,808,478 2,395,393 2,454,681 2,349,404 2,357,247 2,359,566 2,360,105 2,361,351 2,335,107 2,334,730 2,338,056 2,339,183 2,341,768 2,341,729 2,354,954 2,363,950 2,363,950 2,363,950 2,363,950 2,364,511 2,364,5115/1/94-4/30/95 1,673,811 2,389,470 2,450,652 2,388,412 2,330,120 2,409,244 2,614,289 2,618,862 2,382,887 2,384,717 2,386,732 2,388,188 2,426,948 2,461,935 2,427,615 2,428,055 2,428,055 2,428,790 2,449,592 2,432,258 2,490,7115/1/95-4/30/96 1,109,632 1,755,865 1,931,460 1,970,950 1,970,192 1,961,291 1,993,524 1,988,579 1,991,067 2,007,456 2,010,535 2,013,379 2,019,044 2,031,220 2,059,405 2,059,405 2,036,796 2,036,796 2,036,796 2,040,6645/1/96-4/30/97 1,497,887 1,381,514 1,577,227 1,825,874 1,972,664 1,902,133 1,911,838 1,891,075 1,892,548 1,893,192 1,894,174 1,909,998 1,983,733 1,987,865 1,995,736 1,989,519 1,999,291 1,999,291 1,994,6485/1/97-4/30/98 1,003,751 1,511,637 1,690,686 1,855,109 1,797,172 1,809,200 1,805,381 1,822,872 1,814,948 1,839,803 1,832,381 1,842,046 1,855,860 1,855,860 1,839,822 1,839,822 1,839,822 1,845,3225/1/98-4/30/99 1,363,785 1,574,781 1,689,546 1,740,234 1,632,496 1,621,919 1,576,585 1,565,108 1,582,650 1,582,650 1,606,607 1,596,105 1,613,504 1,634,270 1,661,770 1,644,096 1,650,8855/1/99-4/30/00 1,585,841 2,576,377 2,664,405 2,601,794 2,725,815 2,702,414 2,710,717 2,729,134 2,735,872 2,767,035 2,781,809 2,784,840 2,764,380 2,759,627 2,769,023 2,793,8235/1/00-4/30/01 1,905,896 3,145,250 3,065,770 3,133,992 3,204,129 3,213,235 3,179,263 3,209,905 3,304,654 3,418,842 3,436,793 3,420,573 3,421,823 3,428,248 3,431,5805/1/01-4/30/02 2,292,857 2,987,477 3,308,284 3,312,775 3,317,606 3,432,740 3,462,156 3,725,883 3,824,358 3,824,567 3,736,776 3,729,942 3,729,942 3,729,9425/1/02-4/30/03 2,103,988 3,008,545 2,969,860 2,909,661 2,979,080 3,012,250 3,058,522 3,017,399 3,011,498 3,025,997 3,082,510 3,126,595 3,280,3375/1/03-4/30/04 2,643,060 4,331,133 4,266,034 4,419,019 4,426,189 4,613,897 4,494,164 4,536,589 4,539,666 4,560,407 4,582,689 4,571,0965/1/04-4/30/05 2,669,225 4,006,360 4,659,169 4,717,470 5,319,405 5,576,937 5,648,303 5,499,807 5,502,631 5,511,709 5,504,1645/1/05-4/30/06 2,337,408 3,976,286 4,605,392 4,960,075 5,180,584 5,112,163 5,167,883 5,286,661 5,293,706 5,287,3265/1/06-4/30/07 2,818,007 3,308,555 4,416,555 4,849,694 4,752,832 4,835,045 4,883,529 4,924,234 5,062,2485/1/07-4/30/08 1,856,168 4,440,784 4,866,275 4,744,164 4,775,535 4,856,779 4,952,878 5,028,2185/1/08-4/30/09 3,252,668 4,081,596 4,112,193 4,164,522 4,241,502 4,354,481 4,475,3385/1/09-4/30/10 2,252,596 3,224,685 3,734,218 3,803,711 3,800,000 3,934,2775/1/10-4/30/11 2,327,560 3,486,122 4,641,502 4,796,784 4,973,1475/1/11-4/30/12 3,206,990 4,321,717 4,680,838 4,976,9135/1/12-4/30/13 3,511,291 5,247,235 5,600,7385/1/13-4/30/14 4,434,878 7,035,7725/1/14-4/30/15 5,885,338
Accident Period 12-24 24-36 36-48 48-60 60-72 72-84 84-96 96-108 108-120 120-132 132-144 144-156 156-168 168-180 180-192 192-204 204-216 216-228 228-240 240-252 252-264 264-276 276-288 288-ULT
5/1/91-4/30/92 1.296 1.114 1.054 1.083 0.905 0.999 1.021 1.001 1.009 1.026 1.004 1.010 1.045 1.002 1.000 1.028 0.996 1.129 1.021 0.957 1.003 0.995 1.0455/1/92-4/30/93 1.422 1.184 1.103 1.067 1.027 1.016 1.033 1.004 1.060 0.934 1.008 1.002 1.040 0.985 1.001 0.981 1.030 1.006 0.989 1.018 0.999 0.9895/1/93-4/30/94 1.428 1.325 1.025 0.957 1.003 1.001 1.000 1.001 0.989 1.000 1.001 1.000 1.001 1.000 1.006 1.004 1.000 1.000 1.000 1.000 1.0005/1/94-4/30/95 1.428 1.026 0.975 0.976 1.034 1.085 1.002 0.910 1.001 1.001 1.001 1.016 1.014 0.986 1.000 1.000 1.000 1.009 0.993 1.0245/1/95-4/30/96 1.582 1.100 1.020 1.000 0.995 1.016 0.998 1.001 1.008 1.002 1.001 1.003 1.006 1.014 1.000 0.989 1.000 1.000 1.0025/1/96-4/30/97 0.922 1.142 1.158 1.080 0.964 1.005 0.989 1.001 1.000 1.001 1.008 1.039 1.002 1.004 0.997 1.005 1.000 0.9985/1/97-4/30/98 1.506 1.118 1.097 0.969 1.007 0.998 1.010 0.996 1.014 0.996 1.005 1.007 1.000 0.991 1.000 1.000 1.0035/1/98-4/30/99 1.155 1.073 1.030 0.938 0.994 0.972 0.993 1.011 1.000 1.015 0.993 1.011 1.013 1.017 0.989 1.0045/1/99-4/30/00 1.625 1.034 0.977 1.048 0.991 1.003 1.007 1.002 1.011 1.005 1.001 0.993 0.998 1.003 1.0095/1/00-4/30/01 1.650 0.975 1.022 1.022 1.003 0.989 1.010 1.030 1.035 1.005 0.995 1.000 1.002 1.0015/1/01-4/30/02 1.303 1.107 1.001 1.001 1.035 1.009 1.076 1.026 1.000 0.977 0.998 1.000 1.0005/1/02-4/30/03 1.430 0.987 0.980 1.024 1.011 1.015 0.987 0.998 1.005 1.019 1.014 1.0495/1/03-4/30/04 1.639 0.985 1.036 1.002 1.042 0.974 1.009 1.001 1.005 1.005 0.9975/1/04-4/30/05 1.501 1.163 1.013 1.128 1.048 1.013 0.974 1.001 1.002 0.9995/1/05-4/30/06 1.701 1.158 1.077 1.044 0.987 1.011 1.023 1.001 0.9995/1/06-4/30/07 1.174 1.335 1.098 0.980 1.017 1.010 1.008 1.0285/1/07-4/30/08 2.392 1.096 0.975 1.007 1.017 1.020 1.0155/1/08-4/30/09 1.255 1.007 1.013 1.018 1.027 1.0285/1/09-4/30/10 1.432 1.158 1.019 0.999 1.0355/1/10-4/30/11 1.498 1.331 1.033 1.0375/1/11-4/30/12 1.348 1.083 1.0635/1/12-4/30/13 1.494 1.0675/1/13-4/30/14 1.586
All Years Average 1.468 1.117 1.037 1.019 1.008 1.009 1.009 1.001 1.009 0.999 1.002 1.011 1.011 1.000 1.000 1.001 1.004 1.024 1.001 1.000 1.001 0.992 1.045All Years Weighted 1.473 1.110 1.032 1.021 1.014 1.010 1.009 1.003 1.008 0.998 1.002 1.011 1.009 1.000 1.001 1.000 1.004 1.019 1.000 1.002 1.001 0.992 1.0455 Years Weighted 1.482 1.118 1.020 1.008 1.015 1.016 1.005 1.006 1.002 1.000 1.001 1.010 1.002 1.003 1.000 0.999 1.001 1.003 1.0002 Years Weighted 1.546 1.074 1.048 1.020 1.031 1.024 1.012 1.014 1.000 1.001 1.004 1.022 1.001 1.002 1.002 1.002 1.001 0.999 0.997 1.012 1.000 0.992Industry 1.323 1.114 1.045 1.017 1.014 1.010 1.008 1.007 1.004 1.004 1.003 1.003 1.002 1.002 1.002 1.002 1.002 1.001 1.001 1.001 1.001 1.001 1.000 1.003Prior (4/30/13) 1.369 1.139 1.049 1.022 1.015 1.012 1.009 1.007 1.005 1.004 1.004 1.003 1.003 1.002 1.002 1.002 1.002 1.001 1.001 1.001 1.001 1.001 1.000 1.002
Selected 12-24 24-36 36-48 48-60 60-72 72-84 84-96 96-108 108-120 120-132 132-144 144-156 156-168 168-180 180-192 192-204 204-216 216-228 228-240 240-252 252-264 264-276 276-288 288-ULT
Age to Age 1.490 1.094 1.047 1.027 1.022 1.017 1.010 1.007 1.004 1.004 1.003 1.003 1.002 1.002 1.002 1.002 1.002 1.001 1.001 1.001 1.001 1.001 1.000 1.003Age to Ultimate 1.914 1.284 1.174 1.121 1.091 1.068 1.050 1.039 1.033 1.028 1.024 1.021 1.018 1.016 1.013 1.011 1.010 1.008 1.007 1.006 1.005 1.004 1.004 1.003
Notes:Not all averages are shown. Selected age to age factors are based on a review of all averages and actuarial judgment.
Oliver Wyman Actuarial Consulting, Inc.
38

Exhibit 6Sheet 2
City of Virginia BeachAnalysis of Unpaid Loss & ALAE at June 30, 2015
Workers CompensationData as of April 30, 2015
Paid Loss & ALAE Limited to $250,000
Accident Evaluation Date in MonthsPeriod 12 24 36 48 60 72 84 96 108 120 132 144 156 168 180 192 204 216 228 240 252 264 276 288
5/1/91-4/30/92 504,616 846,060 1,161,776 1,268,208 1,329,541 1,351,581 1,367,158 1,385,902 1,401,089 1,412,737 1,427,942 1,437,068 1,458,475 1,509,123 1,523,339 1,525,835 1,547,401 1,559,619 1,738,743 1,744,125 1,763,135 1,764,381 1,765,649 1,823,9745/1/92-4/30/93 394,760 828,953 1,154,592 1,308,902 1,479,816 1,628,503 1,702,747 1,774,947 1,847,618 1,943,913 1,987,189 2,020,601 2,060,040 2,124,586 2,127,897 2,129,122 2,089,990 2,132,480 2,138,417 2,144,009 2,154,119 2,154,119 2,156,8965/1/93-4/30/94 470,300 1,005,549 1,556,782 1,870,343 2,077,123 2,156,089 2,227,475 2,269,214 2,294,814 2,319,208 2,334,730 2,338,056 2,339,183 2,341,160 2,341,729 2,342,107 2,344,883 2,345,192 2,345,541 2,347,411 2,348,834 2,349,9805/1/94-4/30/95 576,064 1,626,859 1,848,250 1,996,137 2,082,499 2,188,243 2,243,821 2,299,633 2,338,567 2,366,265 2,372,965 2,388,188 2,418,293 2,424,297 2,427,615 2,428,055 2,428,055 2,428,055 2,431,063 2,432,258 2,468,0275/1/95-4/30/96 556,265 1,170,931 1,593,085 1,800,584 1,832,141 1,865,023 1,907,140 1,941,068 1,969,984 2,007,456 2,010,535 2,013,379 2,016,257 2,017,910 2,019,497 2,021,026 2,022,556 2,025,785 2,027,994 2,033,4215/1/96-4/30/97 407,426 970,219 1,187,310 1,443,546 1,799,305 1,859,495 1,868,161 1,874,841 1,878,630 1,881,655 1,885,027 1,897,388 1,983,733 1,987,865 1,988,883 1,989,519 1,993,824 1,994,526 1,994,6485/1/97-4/30/98 341,378 894,269 1,214,936 1,484,589 1,687,091 1,719,293 1,744,778 1,770,533 1,794,609 1,813,676 1,816,005 1,818,903 1,820,767 1,822,844 1,824,761 1,826,943 1,830,654 1,834,5035/1/98-4/30/99 574,676 1,006,372 1,360,115 1,489,850 1,552,377 1,548,540 1,559,722 1,565,108 1,567,860 1,570,154 1,574,656 1,577,995 1,582,413 1,589,075 1,606,901 1,618,819 1,631,3705/1/99-4/30/00 629,178 1,868,128 2,338,779 2,501,918 2,608,680 2,701,018 2,710,717 2,719,134 2,728,313 2,732,296 2,735,569 2,739,043 2,751,667 2,753,469 2,757,188 2,769,8645/1/00-4/30/01 771,580 1,870,273 2,871,947 3,050,298 3,104,821 3,136,231 3,173,921 3,200,845 3,216,626 3,242,840 3,267,230 3,284,874 3,300,434 3,313,975 3,329,2085/1/01-4/30/02 858,597 2,441,755 2,933,060 3,110,835 3,166,841 3,223,419 3,283,283 3,310,713 3,474,654 3,520,088 3,584,701 3,623,340 3,658,646 3,678,6035/1/02-4/30/03 1,055,296 2,513,818 2,831,288 2,874,462 2,894,530 2,940,553 2,952,614 2,973,292 2,992,383 3,016,444 3,061,623 3,096,194 3,258,6495/1/03-4/30/04 1,177,136 2,385,241 3,408,654 3,733,345 3,977,609 4,123,214 4,265,225 4,358,257 4,414,387 4,451,061 4,494,436 4,510,5585/1/04-4/30/05 1,006,224 2,478,778 3,286,135 4,063,014 4,458,149 4,761,248 4,989,814 5,181,494 5,294,698 5,414,840 5,460,0995/1/05-4/30/06 1,044,583 2,033,625 2,864,221 3,550,012 4,018,740 4,432,727 4,766,587 5,004,500 5,185,844 5,255,2325/1/06-4/30/07 1,195,394 2,392,915 2,984,844 3,431,025 3,735,610 4,056,893 4,350,711 4,554,673 4,755,4055/1/07-4/30/08 1,157,022 2,717,756 3,428,045 3,810,988 4,153,203 4,409,516 4,611,026 4,747,9675/1/08-4/30/09 1,252,004 2,707,367 3,450,106 3,728,993 3,869,572 4,034,330 4,195,2075/1/09-4/30/10 1,218,792 2,419,866 2,842,546 3,164,351 3,478,778 3,716,9845/1/10-4/30/11 1,329,218 2,764,808 3,729,969 4,336,362 4,664,2215/1/11-4/30/12 1,925,777 3,347,720 4,140,980 4,668,0745/1/12-4/30/13 1,787,588 4,190,375 4,928,2725/1/13-4/30/14 2,545,665 5,929,7195/1/14-4/30/15 3,243,964
Accident Period 12-24 24-36 36-48 48-60 60-72 72-84 84-96 96-108 108-120 120-132 132-144 144-156 156-168 168-180 180-192 192-204 204-216 216-228 228-240 240-252 252-264 264-276 276-288 288-ULT
5/1/91-4/30/92 1.677 1.373 1.092 1.048 1.017 1.012 1.014 1.011 1.008 1.011 1.006 1.015 1.035 1.009 1.002 1.014 1.008 1.115 1.003 1.011 1.001 1.001 1.0335/1/92-4/30/93 2.100 1.393 1.134 1.131 1.100 1.046 1.042 1.041 1.052 1.022 1.017 1.020 1.031 1.002 1.001 0.982 1.020 1.003 1.003 1.005 1.000 1.0015/1/93-4/30/94 2.138 1.548 1.201 1.111 1.038 1.033 1.019 1.011 1.011 1.007 1.001 1.000 1.001 1.000 1.000 1.001 1.000 1.000 1.001 1.001 1.0005/1/94-4/30/95 2.824 1.136 1.080 1.043 1.051 1.025 1.025 1.017 1.012 1.003 1.006 1.013 1.002 1.001 1.000 1.000 1.000 1.001 1.000 1.0155/1/95-4/30/96 2.105 1.361 1.130 1.018 1.018 1.023 1.018 1.015 1.019 1.002 1.001 1.001 1.001 1.001 1.001 1.001 1.002 1.001 1.0035/1/96-4/30/97 2.381 1.224 1.216 1.246 1.033 1.005 1.004 1.002 1.002 1.002 1.007 1.046 1.002 1.001 1.000 1.002 1.000 1.0005/1/97-4/30/98 2.620 1.359 1.222 1.136 1.019 1.015 1.015 1.014 1.011 1.001 1.002 1.001 1.001 1.001 1.001 1.002 1.0025/1/98-4/30/99 1.751 1.352 1.095 1.042 0.998 1.007 1.003 1.002 1.001 1.003 1.002 1.003 1.004 1.011 1.007 1.0085/1/99-4/30/00 2.969 1.252 1.070 1.043 1.035 1.004 1.003 1.003 1.001 1.001 1.001 1.005 1.001 1.001 1.0055/1/00-4/30/01 2.424 1.536 1.062 1.018 1.010 1.012 1.008 1.005 1.008 1.008 1.005 1.005 1.004 1.0055/1/01-4/30/02 2.844 1.201 1.061 1.018 1.018 1.019 1.008 1.050 1.013 1.018 1.011 1.010 1.0055/1/02-4/30/03 2.382 1.126 1.015 1.007 1.016 1.004 1.007 1.006 1.008 1.015 1.011 1.0525/1/03-4/30/04 2.026 1.429 1.095 1.065 1.037 1.034 1.022 1.013 1.008 1.010 1.0045/1/04-4/30/05 2.463 1.326 1.236 1.097 1.068 1.048 1.038 1.022 1.023 1.0085/1/05-4/30/06 1.947 1.408 1.239 1.132 1.103 1.075 1.050 1.036 1.0135/1/06-4/30/07 2.002 1.247 1.149 1.089 1.086 1.072 1.047 1.0445/1/07-4/30/08 2.349 1.261 1.112 1.090 1.062 1.046 1.0305/1/08-4/30/09 2.162 1.274 1.081 1.038 1.043 1.0405/1/09-4/30/10 1.985 1.175 1.113 1.099 1.0685/1/10-4/30/11 2.080 1.349 1.163 1.0765/1/11-4/30/12 1.738 1.237 1.1275/1/12-4/30/13 2.344 1.1765/1/13-4/30/14 2.329
All Years Average 2.245 1.306 1.128 1.077 1.043 1.029 1.021 1.018 1.013 1.008 1.006 1.014 1.008 1.003 1.002 1.001 1.005 1.020 1.002 1.008 1.000 1.001 1.033All Years Weighted 2.213 1.284 1.125 1.073 1.048 1.034 1.024 1.021 1.013 1.008 1.006 1.015 1.007 1.003 1.002 1.000 1.004 1.015 1.002 1.008 1.000 1.001 1.0335 Years Weighted 2.118 1.237 1.120 1.077 1.072 1.056 1.038 1.026 1.014 1.011 1.006 1.016 1.003 1.003 1.003 1.002 1.001 1.001 1.0022 Years Weighted 2.335 1.203 1.144 1.086 1.055 1.043 1.038 1.040 1.018 1.009 1.007 1.029 1.005 1.003 1.006 1.005 1.001 1.001 1.001 1.008 1.000 1.001Industry 2.046 1.277 1.131 1.070 1.043 1.030 1.018 1.014 1.011 1.009 1.007 1.007 1.006 1.005 1.004 1.004 1.003 1.003 1.003 1.001 1.001 1.001 1.001 1.014Prior (4/30/13) 2.028 1.283 1.121 1.089 1.071 1.050 1.028 1.016 1.012 1.010 1.009 1.008 1.007 1.006 1.005 1.004 1.004 1.003 1.003 1.002 1.002 1.002 1.001 1.005
Selected 12-24 24-36 36-48 48-60 60-72 72-84 84-96 96-108 108-120 120-132 132-144 144-156 156-168 168-180 180-192 192-204 204-216 216-228 228-240 240-252 252-264 264-276 276-288 288-ULT
Age to Age 2.263 1.233 1.138 1.082 1.052 1.040 1.033 1.026 1.015 1.010 1.008 1.007 1.006 1.005 1.004 1.003 1.003 1.003 1.003 1.001 1.001 1.001 1.001 1.012Age to Ultimate 4.324 1.911 1.550 1.362 1.260 1.198 1.152 1.115 1.087 1.071 1.060 1.051 1.044 1.038 1.033 1.029 1.026 1.023 1.020 1.017 1.016 1.015 1.013 1.012
Notes:Not all averages are shown. Selected age to age factors are based on a review of all averages and actuarial judgment.
Oliver Wyman Actuarial Consulting, Inc.
39

Exhibit 6Sheet 3
City of Virginia BeachAnalysis of Unpaid Loss & ALAE at June 30, 2015
Workers CompensationData as of April 30, 2015
Reported Loss & ALAE Limited to $500,000
Accident Evaluation Date in MonthsPeriod 12 24 36 48 60 72 84 96 108 120 132 144 156 168 180 192 204 216 228 240 252 264 276 288
5/1/91-4/30/92 936,812 1,214,137 1,352,861 1,426,252 1,544,650 1,398,081 1,396,104 1,424,835 1,425,712 1,438,978 1,476,430 1,482,465 1,497,926 1,565,030 1,567,387 1,568,167 1,611,486 1,604,235 2,061,713 2,186,433 1,861,675 1,867,164 1,807,882 1,887,7165/1/92-4/30/93 969,218 1,408,339 1,664,179 1,832,736 1,952,910 2,005,470 2,037,158 2,102,387 2,109,709 2,234,675 2,077,956 2,203,759 2,209,220 2,291,689 2,258,173 2,259,350 2,131,855 2,195,368 2,208,692 2,185,873 2,225,200 2,222,929 2,198,7605/1/93-4/30/94 1,287,182 1,904,393 2,491,308 2,550,596 2,424,319 2,432,161 2,434,062 2,610,105 2,611,351 2,499,170 2,493,434 2,496,761 2,497,887 2,500,472 2,500,434 2,581,128 2,613,950 2,613,950 2,574,395 2,574,395 2,574,957 2,574,9575/1/94-4/30/95 1,697,311 2,412,970 2,474,152 2,403,821 2,330,120 2,409,244 2,645,814 2,656,181 2,388,681 2,402,187 2,404,329 2,405,785 2,444,545 2,479,532 2,445,212 2,445,652 2,445,652 2,446,387 2,467,189 2,449,855 2,508,3085/1/95-4/30/96 1,109,632 1,835,010 2,016,326 2,165,571 2,047,812 2,039,190 2,071,424 2,067,322 2,069,811 2,086,054 2,089,133 2,091,977 2,097,642 2,109,818 2,138,003 2,138,003 2,115,394 2,115,394 2,115,394 2,119,2625/1/96-4/30/97 1,507,098 1,491,156 1,720,676 1,969,323 2,116,113 2,059,950 2,069,654 2,086,912 2,088,385 2,123,634 2,124,616 2,143,701 2,233,733 2,237,865 2,245,736 2,239,519 2,249,291 2,249,291 2,244,6485/1/97-4/30/98 1,003,751 1,511,637 1,690,686 1,855,109 1,797,172 1,809,200 1,805,381 1,822,872 1,814,948 1,839,803 1,832,381 1,842,046 1,855,860 1,855,860 1,839,822 1,839,822 1,839,822 1,845,3225/1/98-4/30/99 1,363,785 1,574,781 1,689,546 1,740,234 1,632,496 1,621,919 1,576,585 1,565,108 1,582,650 1,582,650 1,606,607 1,596,105 1,613,504 1,634,270 1,661,770 1,644,096 1,650,8855/1/99-4/30/00 1,585,841 2,576,377 2,664,405 2,601,794 2,725,815 2,702,414 2,710,717 2,729,134 2,735,872 2,767,035 2,781,809 2,784,840 2,764,380 2,759,627 2,769,023 2,793,8235/1/00-4/30/01 1,923,174 3,160,944 3,065,770 3,133,992 3,204,129 3,213,235 3,179,263 3,209,905 3,304,654 3,418,842 3,436,793 3,420,573 3,421,823 3,428,248 3,431,5805/1/01-4/30/02 2,292,857 2,987,477 3,308,284 3,312,775 3,317,606 3,432,740 3,462,156 3,975,883 4,162,351 4,162,560 3,829,584 3,835,750 3,866,250 3,855,7505/1/02-4/30/03 2,103,988 3,008,545 2,969,860 2,909,661 2,979,080 3,012,250 3,058,522 3,017,399 3,011,498 3,025,997 3,082,510 3,126,595 3,280,3375/1/03-4/30/04 2,698,686 4,385,402 4,335,475 4,870,116 4,750,820 5,396,247 5,454,696 5,515,490 5,506,939 5,533,123 5,557,350 5,496,5595/1/04-4/30/05 2,669,225 4,042,068 5,317,083 5,239,408 6,646,716 7,668,522 7,773,418 7,647,149 7,828,861 7,771,591 7,792,5415/1/05-4/30/06 2,343,150 4,186,013 4,851,419 5,815,175 6,671,273 6,603,153 6,676,273 6,916,192 6,980,850 6,945,3375/1/06-4/30/07 2,904,332 3,378,167 4,665,863 5,634,376 5,540,066 5,558,972 5,617,732 5,662,537 5,836,8195/1/07-4/30/08 1,856,168 5,271,637 6,528,959 6,331,981 6,490,330 6,845,493 6,941,592 7,016,9325/1/08-4/30/09 3,449,457 5,050,559 5,093,708 5,283,055 5,485,728 5,522,670 5,699,7805/1/09-4/30/10 2,252,596 3,354,785 3,921,266 3,990,759 4,055,767 4,431,5975/1/10-4/30/11 2,327,560 3,687,844 5,208,964 5,778,614 6,121,6275/1/11-4/30/12 3,456,990 4,704,060 5,139,961 5,806,4035/1/12-4/30/13 3,511,291 5,523,882 5,879,2885/1/13-4/30/14 4,434,878 7,382,6105/1/14-4/30/15 6,135,338
Accident Period 12-24 24-36 36-48 48-60 60-72 72-84 84-96 96-108 108-120 120-132 132-144 144-156 156-168 168-180 180-192 192-204 204-216 216-228 228-240 240-252 252-264 264-276 276-288 288-ULT
5/1/91-4/30/92 1.296 1.114 1.054 1.083 0.905 0.999 1.021 1.001 1.009 1.026 1.004 1.010 1.045 1.002 1.000 1.028 0.996 1.285 1.060 0.851 1.003 0.968 1.0445/1/92-4/30/93 1.453 1.182 1.101 1.066 1.027 1.016 1.032 1.003 1.059 0.930 1.061 1.002 1.037 0.985 1.001 0.944 1.030 1.006 0.990 1.018 0.999 0.9895/1/93-4/30/94 1.480 1.308 1.024 0.950 1.003 1.001 1.072 1.000 0.957 0.998 1.001 1.000 1.001 1.000 1.032 1.013 1.000 0.985 1.000 1.000 1.0005/1/94-4/30/95 1.422 1.025 0.972 0.969 1.034 1.098 1.004 0.899 1.006 1.001 1.001 1.016 1.014 0.986 1.000 1.000 1.000 1.009 0.993 1.0245/1/95-4/30/96 1.654 1.099 1.074 0.946 0.996 1.016 0.998 1.001 1.008 1.001 1.001 1.003 1.006 1.013 1.000 0.989 1.000 1.000 1.0025/1/96-4/30/97 0.989 1.154 1.145 1.075 0.973 1.005 1.008 1.001 1.017 1.000 1.009 1.042 1.002 1.004 0.997 1.004 1.000 0.9985/1/97-4/30/98 1.506 1.118 1.097 0.969 1.007 0.998 1.010 0.996 1.014 0.996 1.005 1.007 1.000 0.991 1.000 1.000 1.0035/1/98-4/30/99 1.155 1.073 1.030 0.938 0.994 0.972 0.993 1.011 1.000 1.015 0.993 1.011 1.013 1.017 0.989 1.0045/1/99-4/30/00 1.625 1.034 0.977 1.048 0.991 1.003 1.007 1.002 1.011 1.005 1.001 0.993 0.998 1.003 1.0095/1/00-4/30/01 1.644 0.970 1.022 1.022 1.003 0.989 1.010 1.030 1.035 1.005 0.995 1.000 1.002 1.0015/1/01-4/30/02 1.303 1.107 1.001 1.001 1.035 1.009 1.148 1.047 1.000 0.920 1.002 1.008 0.9975/1/02-4/30/03 1.430 0.987 0.980 1.024 1.011 1.015 0.987 0.998 1.005 1.019 1.014 1.0495/1/03-4/30/04 1.625 0.989 1.123 0.976 1.136 1.011 1.011 0.998 1.005 1.004 0.9895/1/04-4/30/05 1.514 1.315 0.985 1.269 1.154 1.014 0.984 1.024 0.993 1.0035/1/05-4/30/06 1.786 1.159 1.199 1.147 0.990 1.011 1.036 1.009 0.9955/1/06-4/30/07 1.163 1.381 1.208 0.983 1.003 1.011 1.008 1.0315/1/07-4/30/08 2.840 1.239 0.970 1.025 1.055 1.014 1.0115/1/08-4/30/09 1.464 1.009 1.037 1.038 1.007 1.0325/1/09-4/30/10 1.489 1.169 1.018 1.016 1.0935/1/10-4/30/11 1.584 1.412 1.109 1.0595/1/11-4/30/12 1.361 1.093 1.1305/1/12-4/30/13 1.573 1.0645/1/13-4/30/14 1.665
All Years Average 1.523 1.136 1.060 1.030 1.022 1.012 1.020 1.003 1.008 0.995 1.006 1.012 1.010 1.000 1.003 0.998 1.004 1.047 1.009 0.973 1.001 0.979 1.044All Years Weighted 1.531 1.137 1.062 1.042 1.036 1.013 1.018 1.008 1.004 0.993 1.004 1.012 1.008 1.000 1.004 0.997 1.004 1.034 1.008 0.976 1.000 0.980 1.0445 Years Weighted 1.542 1.131 1.050 1.025 1.025 1.016 1.009 1.014 0.998 0.991 0.999 1.012 1.001 1.003 1.000 0.999 1.001 0.999 1.0082 Years Weighted 1.624 1.077 1.119 1.042 1.043 1.022 1.010 1.019 0.994 1.003 0.998 1.026 0.999 1.002 1.002 1.002 1.001 0.999 0.997 1.012 1.000 0.980Industry 1.323 1.119 1.051 1.020 1.017 1.013 1.011 1.008 1.007 1.006 1.005 1.004 1.004 1.004 1.003 1.002 1.002 1.002 1.002 1.001 1.001 1.001 1.001 1.014Prior (4/30/13) 1.445 1.195 1.055 1.026 1.018 1.015 1.012 1.009 1.008 1.007 1.006 1.005 1.005 1.004 1.003 1.002 1.002 1.002 1.002 1.002 1.001 1.001 1.001 1.011
Selected 12-24 24-36 36-48 48-60 60-72 72-84 84-96 96-108 108-120 120-132 132-144 144-156 156-168 168-180 180-192 192-204 204-216 216-228 228-240 240-252 252-264 264-276 276-288 288-ULT
Age to Age 1.549 1.098 1.085 1.040 1.030 1.018 1.011 1.009 1.007 1.006 1.005 1.004 1.004 1.004 1.003 1.002 1.002 1.002 1.002 1.001 1.001 1.001 1.001 1.014Age to Ultimate 2.174 1.404 1.278 1.178 1.133 1.100 1.081 1.070 1.061 1.053 1.047 1.042 1.038 1.033 1.030 1.027 1.025 1.023 1.021 1.019 1.018 1.016 1.015 1.014
Notes:Not all averages are shown. Selected age to age factors are based on a review of all averages and actuarial judgment.
Oliver Wyman Actuarial Consulting, Inc.
40

Exhibit 6Sheet 4
City of Virginia BeachAnalysis of Unpaid Loss & ALAE at June 30, 2015
Workers CompensationData as of April 30, 2015
Paid Loss & ALAE Limited to $500,000
Accident Evaluation Date in MonthsPeriod 12 24 36 48 60 72 84 96 108 120 132 144 156 168 180 192 204 216 228 240 252 264 276 288
5/1/91-4/30/92 504,616 846,060 1,161,776 1,268,208 1,329,541 1,351,581 1,367,158 1,385,902 1,401,089 1,412,737 1,427,942 1,437,068 1,458,475 1,509,123 1,523,339 1,525,835 1,547,401 1,559,619 1,778,828 1,784,209 1,803,305 1,804,657 1,805,925 1,864,2505/1/92-4/30/93 394,760 828,953 1,154,592 1,308,902 1,479,816 1,628,503 1,702,747 1,774,947 1,847,618 1,956,001 2,008,825 2,042,237 2,081,676 2,152,226 2,163,013 2,168,917 2,131,855 2,174,344 2,180,281 2,185,873 2,195,983 2,195,983 2,198,7605/1/93-4/30/94 470,300 1,005,549 1,556,782 1,870,343 2,077,123 2,156,089 2,227,475 2,278,670 2,331,607 2,396,879 2,417,512 2,426,235 2,430,645 2,437,886 2,444,920 2,452,610 2,468,351 2,477,196 2,486,628 2,499,029 2,515,224 2,536,2465/1/94-4/30/95 576,064 1,626,859 1,848,250 1,996,137 2,082,499 2,188,243 2,243,821 2,299,633 2,338,567 2,375,042 2,390,562 2,405,785 2,435,889 2,441,894 2,445,212 2,445,652 2,445,652 2,445,652 2,448,660 2,449,855 2,485,6245/1/95-4/30/96 556,265 1,170,931 1,593,085 1,817,238 1,909,762 1,942,922 1,985,039 2,018,967 2,047,884 2,086,054 2,089,133 2,091,977 2,094,855 2,096,508 2,098,095 2,099,624 2,101,154 2,104,383 2,106,592 2,112,0195/1/96-4/30/97 407,426 970,219 1,200,706 1,496,682 1,896,007 1,985,234 1,993,899 2,020,421 2,042,903 2,065,754 2,088,792 2,121,584 2,233,733 2,237,865 2,238,883 2,239,519 2,243,824 2,244,526 2,244,6485/1/97-4/30/98 341,378 894,269 1,214,936 1,484,589 1,687,091 1,719,293 1,744,778 1,770,533 1,794,609 1,813,676 1,816,005 1,818,903 1,820,767 1,822,844 1,824,761 1,826,943 1,830,654 1,834,5035/1/98-4/30/99 574,676 1,006,372 1,360,115 1,489,850 1,552,377 1,548,540 1,559,722 1,565,108 1,567,860 1,570,154 1,574,656 1,577,995 1,582,413 1,589,075 1,606,901 1,618,819 1,631,3705/1/99-4/30/00 629,178 1,868,128 2,338,779 2,501,918 2,608,680 2,701,018 2,710,717 2,719,134 2,728,313 2,732,296 2,735,569 2,739,043 2,751,667 2,753,469 2,757,188 2,769,8645/1/00-4/30/01 771,580 1,870,273 2,871,947 3,050,298 3,104,821 3,136,231 3,173,921 3,200,845 3,216,626 3,242,840 3,267,230 3,284,874 3,300,434 3,313,975 3,329,2085/1/01-4/30/02 858,597 2,441,755 2,933,060 3,110,835 3,166,841 3,223,419 3,283,283 3,310,713 3,474,654 3,520,088 3,584,701 3,623,340 3,658,646 3,703,4505/1/02-4/30/03 1,055,296 2,513,818 2,831,288 2,874,462 2,894,530 2,940,553 2,952,614 2,973,292 2,992,383 3,016,444 3,061,623 3,096,194 3,258,6495/1/03-4/30/04 1,177,136 2,385,241 3,408,654 3,733,345 4,024,033 4,252,003 4,514,214 4,791,409 5,028,371 5,214,024 5,347,141 5,372,0765/1/04-4/30/05 1,006,224 2,478,778 3,286,135 4,113,876 4,748,606 5,236,262 5,791,286 6,342,682 6,709,959 7,172,244 7,418,1915/1/05-4/30/06 1,044,583 2,033,625 2,864,221 3,577,604 4,111,467 4,612,137 5,081,510 5,612,493 6,132,562 6,499,1735/1/06-4/30/07 1,195,394 2,392,915 2,984,844 3,431,025 3,755,363 4,127,228 4,461,911 4,774,028 5,159,3795/1/07-4/30/08 1,157,022 2,915,935 3,667,675 4,248,084 4,653,642 5,167,017 5,655,936 6,060,5865/1/08-4/30/09 1,252,004 2,707,367 3,594,795 4,120,200 4,521,976 4,880,623 5,178,5275/1/09-4/30/10 1,218,792 2,419,866 2,842,546 3,164,351 3,503,495 3,794,6815/1/10-4/30/11 1,329,218 2,764,808 3,754,746 4,609,950 5,209,2255/1/11-4/30/12 1,925,777 3,426,724 4,258,913 5,128,2025/1/12-4/30/13 1,787,588 4,440,375 5,178,2725/1/13-4/30/14 2,545,665 6,179,7195/1/14-4/30/15 3,243,964
Accident Period 12-24 24-36 36-48 48-60 60-72 72-84 84-96 96-108 108-120 120-132 132-144 144-156 156-168 168-180 180-192 192-204 204-216 216-228 228-240 240-252 252-264 264-276 276-288 288-ULT
5/1/91-4/30/92 1.677 1.373 1.092 1.048 1.017 1.012 1.014 1.011 1.008 1.011 1.006 1.015 1.035 1.009 1.002 1.014 1.008 1.141 1.003 1.011 1.001 1.001 1.0325/1/92-4/30/93 2.100 1.393 1.134 1.131 1.100 1.046 1.042 1.041 1.059 1.027 1.017 1.019 1.034 1.005 1.003 0.983 1.020 1.003 1.003 1.005 1.000 1.0015/1/93-4/30/94 2.138 1.548 1.201 1.111 1.038 1.033 1.023 1.023 1.028 1.009 1.004 1.002 1.003 1.003 1.003 1.006 1.004 1.004 1.005 1.006 1.0085/1/94-4/30/95 2.824 1.136 1.080 1.043 1.051 1.025 1.025 1.017 1.016 1.007 1.006 1.013 1.002 1.001 1.000 1.000 1.000 1.001 1.000 1.0155/1/95-4/30/96 2.105 1.361 1.141 1.051 1.017 1.022 1.017 1.014 1.019 1.001 1.001 1.001 1.001 1.001 1.001 1.001 1.002 1.001 1.0035/1/96-4/30/97 2.381 1.238 1.247 1.267 1.047 1.004 1.013 1.011 1.011 1.011 1.016 1.053 1.002 1.000 1.000 1.002 1.000 1.0005/1/97-4/30/98 2.620 1.359 1.222 1.136 1.019 1.015 1.015 1.014 1.011 1.001 1.002 1.001 1.001 1.001 1.001 1.002 1.0025/1/98-4/30/99 1.751 1.352 1.095 1.042 0.998 1.007 1.003 1.002 1.001 1.003 1.002 1.003 1.004 1.011 1.007 1.0085/1/99-4/30/00 2.969 1.252 1.070 1.043 1.035 1.004 1.003 1.003 1.001 1.001 1.001 1.005 1.001 1.001 1.0055/1/00-4/30/01 2.424 1.536 1.062 1.018 1.010 1.012 1.008 1.005 1.008 1.008 1.005 1.005 1.004 1.0055/1/01-4/30/02 2.844 1.201 1.061 1.018 1.018 1.019 1.008 1.050 1.013 1.018 1.011 1.010 1.0125/1/02-4/30/03 2.382 1.126 1.015 1.007 1.016 1.004 1.007 1.006 1.008 1.015 1.011 1.0525/1/03-4/30/04 2.026 1.429 1.095 1.078 1.057 1.062 1.061 1.049 1.037 1.026 1.0055/1/04-4/30/05 2.463 1.326 1.252 1.154 1.103 1.106 1.095 1.058 1.069 1.0345/1/05-4/30/06 1.947 1.408 1.249 1.149 1.122 1.102 1.104 1.093 1.0605/1/06-4/30/07 2.002 1.247 1.149 1.095 1.099 1.081 1.070 1.0815/1/07-4/30/08 2.520 1.258 1.158 1.095 1.110 1.095 1.0725/1/08-4/30/09 2.162 1.328 1.146 1.098 1.079 1.0615/1/09-4/30/10 1.985 1.175 1.113 1.107 1.0835/1/10-4/30/11 2.080 1.358 1.228 1.1305/1/11-4/30/12 1.779 1.243 1.2045/1/12-4/30/13 2.484 1.1665/1/13-4/30/14 2.428
All Years Average 2.265 1.310 1.144 1.091 1.054 1.039 1.034 1.030 1.023 1.012 1.007 1.015 1.009 1.004 1.002 1.002 1.005 1.025 1.003 1.009 1.003 1.001 1.032All Years Weighted 2.247 1.287 1.145 1.091 1.063 1.052 1.047 1.040 1.031 1.016 1.007 1.015 1.008 1.003 1.002 1.001 1.005 1.018 1.003 1.009 1.003 1.001 1.0325 Years Weighted 2.184 1.246 1.174 1.106 1.099 1.089 1.081 1.062 1.045 1.023 1.007 1.016 1.005 1.003 1.003 1.002 1.001 1.002 1.0032 Years Weighted 2.451 1.200 1.215 1.121 1.081 1.078 1.071 1.087 1.065 1.031 1.007 1.029 1.008 1.003 1.006 1.005 1.001 1.001 1.001 1.011 1.004 1.001Industry 2.056 1.277 1.135 1.072 1.045 1.033 1.022 1.017 1.014 1.011 1.009 1.008 1.008 1.006 1.005 1.004 1.004 1.003 1.003 1.003 1.003 1.003 1.003 1.049Prior (4/30/13) 2.068 1.290 1.146 1.115 1.099 1.077 1.065 1.028 1.015 1.014 1.012 1.011 1.010 1.009 1.008 1.007 1.006 1.005 1.005 1.004 1.004 1.003 1.003 1.024
Selected 12-24 24-36 36-48 48-60 60-72 72-84 84-96 96-108 108-120 120-132 132-144 144-156 156-168 168-180 180-192 192-204 204-216 216-228 228-240 240-252 252-264 264-276 276-288 288-ULT
Age to Age 2.352 1.234 1.175 1.108 1.072 1.067 1.059 1.049 1.039 1.019 1.011 1.010 1.007 1.006 1.005 1.004 1.003 1.003 1.003 1.003 1.003 1.003 1.002 1.044Age to Ultimate 5.648 2.401 1.945 1.655 1.493 1.393 1.306 1.233 1.176 1.131 1.111 1.099 1.088 1.081 1.075 1.069 1.065 1.062 1.058 1.055 1.052 1.049 1.047 1.044
Notes:Not all averages are shown. Selected age to age factors are based on a review of all averages and actuarial judgment.
Oliver Wyman Actuarial Consulting, Inc.
41

Exhibit 6Sheet 5
City of Virginia BeachAnalysis of Unpaid Loss & ALAE at June 30, 2015
Workers CompensationData as of April 30, 2015
Reported Loss & ALAE Limited to $750,000
Accident Evaluation Date in MonthsPeriod 12 24 36 48 60 72 84 96 108 120 132 144 156 168 180 192 204 216 228 240 252 264 276 288
5/1/91-4/30/92 936,812 1,214,137 1,352,861 1,426,252 1,544,650 1,398,081 1,396,104 1,424,835 1,425,712 1,438,978 1,476,430 1,482,465 1,497,926 1,565,030 1,567,387 1,568,167 1,611,486 1,604,235 2,186,050 2,310,771 1,861,675 1,867,164 1,807,882 1,887,7165/1/92-4/30/93 969,218 1,408,339 1,664,179 1,832,736 1,952,910 2,005,470 2,037,158 2,102,387 2,109,709 2,234,675 2,077,956 2,203,759 2,209,220 2,291,689 2,258,173 2,259,350 2,131,855 2,195,368 2,208,692 2,185,873 2,225,200 2,222,929 2,198,7605/1/93-4/30/94 1,287,182 1,904,393 2,491,308 2,550,596 2,424,319 2,432,161 2,434,062 2,660,426 2,661,672 2,499,170 2,493,434 2,496,761 2,497,887 2,500,472 2,500,434 2,581,128 2,666,568 2,666,568 2,574,395 2,574,395 2,574,957 2,574,9575/1/94-4/30/95 1,697,311 2,412,970 2,474,152 2,403,821 2,330,120 2,409,244 2,645,814 2,656,181 2,388,681 2,402,187 2,404,329 2,405,785 2,444,545 2,479,532 2,445,212 2,445,652 2,445,652 2,446,387 2,467,189 2,449,855 2,508,3085/1/95-4/30/96 1,109,632 1,835,010 2,016,326 2,165,571 2,047,812 2,039,190 2,071,424 2,067,322 2,069,811 2,086,054 2,089,133 2,091,977 2,097,642 2,109,818 2,138,003 2,138,003 2,115,394 2,115,394 2,115,394 2,119,2625/1/96-4/30/97 1,507,098 1,491,156 1,720,676 1,969,323 2,116,113 2,059,950 2,069,654 2,086,912 2,088,385 2,123,634 2,124,616 2,143,701 2,395,525 2,465,600 2,473,471 2,467,163 2,476,934 2,468,342 2,335,5235/1/97-4/30/98 1,003,751 1,511,637 1,690,686 1,855,109 1,797,172 1,809,200 1,805,381 1,822,872 1,814,948 1,839,803 1,832,381 1,842,046 1,855,860 1,855,860 1,839,822 1,839,822 1,839,822 1,845,3225/1/98-4/30/99 1,363,785 1,574,781 1,689,546 1,740,234 1,632,496 1,621,919 1,576,585 1,565,108 1,582,650 1,582,650 1,606,607 1,596,105 1,613,504 1,634,270 1,661,770 1,644,096 1,650,8855/1/99-4/30/00 1,585,841 2,576,377 2,664,405 2,601,794 2,725,815 2,702,414 2,710,717 2,729,134 2,735,872 2,767,035 2,781,809 2,784,840 2,764,380 2,759,627 2,769,023 2,793,8235/1/00-4/30/01 1,923,174 3,160,944 3,065,770 3,133,992 3,204,129 3,213,235 3,179,263 3,209,905 3,304,654 3,418,842 3,436,793 3,420,573 3,421,823 3,428,248 3,431,5805/1/01-4/30/02 2,292,857 2,987,477 3,308,284 3,312,775 3,317,606 3,432,740 3,462,156 4,087,487 4,273,955 4,274,164 3,829,584 3,835,750 3,866,250 3,855,7505/1/02-4/30/03 2,103,988 3,008,545 2,969,860 2,909,661 2,979,080 3,012,250 3,058,522 3,017,399 3,011,498 3,025,997 3,082,510 3,126,595 3,280,3375/1/03-4/30/04 2,698,686 4,385,402 4,335,475 4,870,116 4,750,820 5,399,967 5,541,293 5,603,587 5,594,976 5,623,133 5,637,736 5,583,9965/1/04-4/30/05 2,669,225 4,042,068 5,317,083 5,239,408 6,706,917 8,391,381 8,523,168 8,367,100 8,485,287 8,259,146 8,201,8745/1/05-4/30/06 2,343,150 4,186,013 4,851,419 6,020,607 6,876,705 6,809,184 6,886,481 7,206,269 7,374,428 7,338,9155/1/06-4/30/07 2,904,332 3,378,167 4,665,863 5,949,171 5,854,860 5,709,291 5,768,051 5,730,507 5,904,7885/1/07-4/30/08 1,856,168 5,521,637 6,829,073 6,831,981 7,240,330 7,649,073 7,736,800 7,830,9465/1/08-4/30/09 3,449,457 5,280,945 5,528,574 5,717,921 5,968,748 6,022,670 6,263,8905/1/09-4/30/10 2,252,596 3,354,785 3,921,266 3,990,759 4,055,767 4,431,5975/1/10-4/30/11 2,327,560 3,687,844 5,208,964 5,841,892 6,393,1885/1/11-4/30/12 3,706,990 4,704,060 5,139,961 6,056,4035/1/12-4/30/13 3,511,291 5,773,882 6,129,2885/1/13-4/30/14 4,434,878 7,632,6105/1/14-4/30/15 6,185,338
Accident Period 12-24 24-36 36-48 48-60 60-72 72-84 84-96 96-108 108-120 120-132 132-144 144-156 156-168 168-180 180-192 192-204 204-216 216-228 228-240 240-252 252-264 264-276 276-288 288-ULT
5/1/91-4/30/92 1.296 1.114 1.054 1.083 0.905 0.999 1.021 1.001 1.009 1.026 1.004 1.010 1.045 1.002 1.000 1.028 0.996 1.363 1.057 0.806 1.003 0.968 1.0445/1/92-4/30/93 1.453 1.182 1.101 1.066 1.027 1.016 1.032 1.003 1.059 0.930 1.061 1.002 1.037 0.985 1.001 0.944 1.030 1.006 0.990 1.018 0.999 0.9895/1/93-4/30/94 1.480 1.308 1.024 0.950 1.003 1.001 1.093 1.000 0.939 0.998 1.001 1.000 1.001 1.000 1.032 1.033 1.000 0.965 1.000 1.000 1.0005/1/94-4/30/95 1.422 1.025 0.972 0.969 1.034 1.098 1.004 0.899 1.006 1.001 1.001 1.016 1.014 0.986 1.000 1.000 1.000 1.009 0.993 1.0245/1/95-4/30/96 1.654 1.099 1.074 0.946 0.996 1.016 0.998 1.001 1.008 1.001 1.001 1.003 1.006 1.013 1.000 0.989 1.000 1.000 1.0025/1/96-4/30/97 0.989 1.154 1.145 1.075 0.973 1.005 1.008 1.001 1.017 1.000 1.009 1.117 1.029 1.003 0.997 1.004 0.997 0.9465/1/97-4/30/98 1.506 1.118 1.097 0.969 1.007 0.998 1.010 0.996 1.014 0.996 1.005 1.007 1.000 0.991 1.000 1.000 1.0035/1/98-4/30/99 1.155 1.073 1.030 0.938 0.994 0.972 0.993 1.011 1.000 1.015 0.993 1.011 1.013 1.017 0.989 1.0045/1/99-4/30/00 1.625 1.034 0.977 1.048 0.991 1.003 1.007 1.002 1.011 1.005 1.001 0.993 0.998 1.003 1.0095/1/00-4/30/01 1.644 0.970 1.022 1.022 1.003 0.989 1.010 1.030 1.035 1.005 0.995 1.000 1.002 1.0015/1/01-4/30/02 1.303 1.107 1.001 1.001 1.035 1.009 1.181 1.046 1.000 0.896 1.002 1.008 0.9975/1/02-4/30/03 1.430 0.987 0.980 1.024 1.011 1.015 0.987 0.998 1.005 1.019 1.014 1.0495/1/03-4/30/04 1.625 0.989 1.123 0.976 1.137 1.026 1.011 0.998 1.005 1.003 0.9905/1/04-4/30/05 1.514 1.315 0.985 1.280 1.251 1.016 0.982 1.014 0.973 0.9935/1/05-4/30/06 1.786 1.159 1.241 1.142 0.990 1.011 1.046 1.023 0.9955/1/06-4/30/07 1.163 1.381 1.275 0.984 0.975 1.010 0.993 1.0305/1/07-4/30/08 2.975 1.237 1.000 1.060 1.056 1.011 1.0125/1/08-4/30/09 1.531 1.047 1.034 1.044 1.009 1.0405/1/09-4/30/10 1.489 1.169 1.018 1.016 1.0935/1/10-4/30/11 1.584 1.412 1.122 1.0945/1/11-4/30/12 1.269 1.093 1.1785/1/12-4/30/13 1.644 1.0625/1/13-4/30/14 1.721
All Years Average 1.533 1.138 1.069 1.034 1.026 1.013 1.023 1.003 1.005 0.992 1.006 1.018 1.013 1.000 1.003 1.000 1.004 1.048 1.008 0.962 1.001 0.979 1.044All Years Weighted 1.543 1.139 1.076 1.049 1.043 1.015 1.020 1.009 1.000 0.989 1.004 1.017 1.011 1.000 1.004 1.000 1.004 1.029 1.008 0.963 1.000 0.980 1.0445 Years Weighted 1.549 1.137 1.068 1.042 1.021 1.017 1.008 1.015 0.992 0.983 0.999 1.012 1.001 1.003 1.000 0.999 1.000 0.984 1.0082 Years Weighted 1.687 1.076 1.150 1.063 1.043 1.024 1.004 1.026 0.984 0.997 0.999 1.026 0.999 1.002 1.002 1.002 0.999 0.971 0.997 1.012 1.000 0.980Industry 1.324 1.119 1.051 1.020 1.017 1.013 1.011 1.009 1.008 1.006 1.005 1.005 1.004 1.004 1.003 1.003 1.002 1.002 1.002 1.002 1.002 1.001 1.001 1.016Prior (4/30/13) 1.451 1.204 1.056 1.027 1.019 1.016 1.012 1.009 1.008 1.007 1.006 1.006 1.005 1.004 1.004 1.003 1.003 1.002 1.002 1.002 1.002 1.001 1.001 1.012
Selected 12-24 24-36 36-48 48-60 60-72 72-84 84-96 96-108 108-120 120-132 132-144 144-156 156-168 168-180 180-192 192-204 204-216 216-228 228-240 240-252 252-264 264-276 276-288 288-ULT
Age to Age 1.596 1.098 1.091 1.057 1.030 1.019 1.012 1.009 1.008 1.006 1.005 1.005 1.004 1.004 1.003 1.003 1.002 1.002 1.002 1.002 1.002 1.001 1.001 1.016Age to Ultimate 2.309 1.446 1.318 1.208 1.143 1.110 1.089 1.076 1.067 1.059 1.053 1.047 1.043 1.038 1.035 1.031 1.029 1.026 1.024 1.022 1.021 1.019 1.017 1.016
Notes:Not all averages are shown. Selected age to age factors are based on a review of all averages and actuarial judgment.
Oliver Wyman Actuarial Consulting, Inc.
42
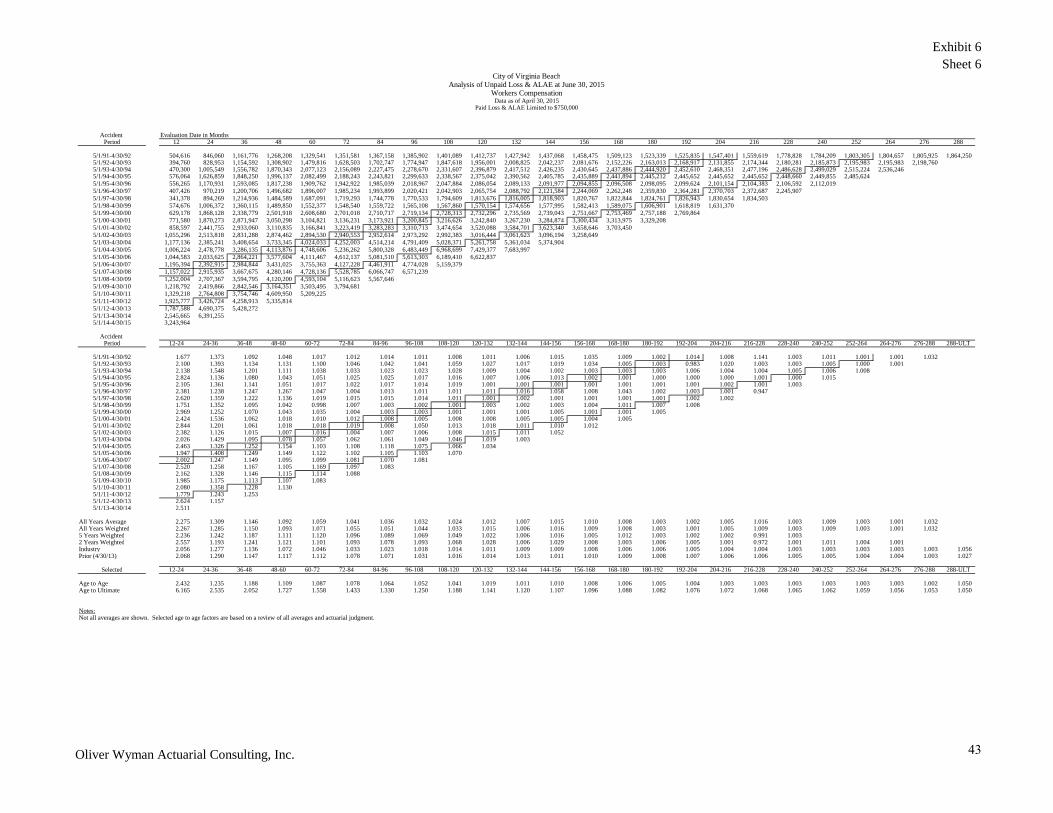
Exhibit 6Sheet 6
City of Virginia BeachAnalysis of Unpaid Loss & ALAE at June 30, 2015
Workers CompensationData as of April 30, 2015
Paid Loss & ALAE Limited to $750,000
Accident Evaluation Date in MonthsPeriod 12 24 36 48 60 72 84 96 108 120 132 144 156 168 180 192 204 216 228 240 252 264 276 288
5/1/91-4/30/92 504,616 846,060 1,161,776 1,268,208 1,329,541 1,351,581 1,367,158 1,385,902 1,401,089 1,412,737 1,427,942 1,437,068 1,458,475 1,509,123 1,523,339 1,525,835 1,547,401 1,559,619 1,778,828 1,784,209 1,803,305 1,804,657 1,805,925 1,864,2505/1/92-4/30/93 394,760 828,953 1,154,592 1,308,902 1,479,816 1,628,503 1,702,747 1,774,947 1,847,618 1,956,001 2,008,825 2,042,237 2,081,676 2,152,226 2,163,013 2,168,917 2,131,855 2,174,344 2,180,281 2,185,873 2,195,983 2,195,983 2,198,7605/1/93-4/30/94 470,300 1,005,549 1,556,782 1,870,343 2,077,123 2,156,089 2,227,475 2,278,670 2,331,607 2,396,879 2,417,512 2,426,235 2,430,645 2,437,886 2,444,920 2,452,610 2,468,351 2,477,196 2,486,628 2,499,029 2,515,224 2,536,2465/1/94-4/30/95 576,064 1,626,859 1,848,250 1,996,137 2,082,499 2,188,243 2,243,821 2,299,633 2,338,567 2,375,042 2,390,562 2,405,785 2,435,889 2,441,894 2,445,212 2,445,652 2,445,652 2,445,652 2,448,660 2,449,855 2,485,6245/1/95-4/30/96 556,265 1,170,931 1,593,085 1,817,238 1,909,762 1,942,922 1,985,039 2,018,967 2,047,884 2,086,054 2,089,133 2,091,977 2,094,855 2,096,508 2,098,095 2,099,624 2,101,154 2,104,383 2,106,592 2,112,0195/1/96-4/30/97 407,426 970,219 1,200,706 1,496,682 1,896,007 1,985,234 1,993,899 2,020,421 2,042,903 2,065,754 2,088,792 2,121,584 2,244,069 2,262,248 2,359,830 2,364,281 2,370,703 2,372,687 2,245,9075/1/97-4/30/98 341,378 894,269 1,214,936 1,484,589 1,687,091 1,719,293 1,744,778 1,770,533 1,794,609 1,813,676 1,816,005 1,818,903 1,820,767 1,822,844 1,824,761 1,826,943 1,830,654 1,834,5035/1/98-4/30/99 574,676 1,006,372 1,360,115 1,489,850 1,552,377 1,548,540 1,559,722 1,565,108 1,567,860 1,570,154 1,574,656 1,577,995 1,582,413 1,589,075 1,606,901 1,618,819 1,631,3705/1/99-4/30/00 629,178 1,868,128 2,338,779 2,501,918 2,608,680 2,701,018 2,710,717 2,719,134 2,728,313 2,732,296 2,735,569 2,739,043 2,751,667 2,753,469 2,757,188 2,769,8645/1/00-4/30/01 771,580 1,870,273 2,871,947 3,050,298 3,104,821 3,136,231 3,173,921 3,200,845 3,216,626 3,242,840 3,267,230 3,284,874 3,300,434 3,313,975 3,329,2085/1/01-4/30/02 858,597 2,441,755 2,933,060 3,110,835 3,166,841 3,223,419 3,283,283 3,310,713 3,474,654 3,520,088 3,584,701 3,623,340 3,658,646 3,703,4505/1/02-4/30/03 1,055,296 2,513,818 2,831,288 2,874,462 2,894,530 2,940,553 2,952,614 2,973,292 2,992,383 3,016,444 3,061,623 3,096,194 3,258,6495/1/03-4/30/04 1,177,136 2,385,241 3,408,654 3,733,345 4,024,033 4,252,003 4,514,214 4,791,409 5,028,371 5,261,758 5,361,034 5,374,9045/1/04-4/30/05 1,006,224 2,478,778 3,286,135 4,113,876 4,748,606 5,236,262 5,800,328 6,483,449 6,968,699 7,429,377 7,683,9975/1/05-4/30/06 1,044,583 2,033,625 2,864,221 3,577,604 4,111,467 4,612,137 5,081,510 5,613,303 6,189,410 6,622,8375/1/06-4/30/07 1,195,394 2,392,915 2,984,844 3,431,025 3,755,363 4,127,228 4,461,911 4,774,028 5,159,3795/1/07-4/30/08 1,157,022 2,915,935 3,667,675 4,280,146 4,728,136 5,528,785 6,066,747 6,571,2395/1/08-4/30/09 1,252,004 2,707,367 3,594,795 4,120,200 4,593,104 5,116,623 5,567,6465/1/09-4/30/10 1,218,792 2,419,866 2,842,546 3,164,351 3,503,495 3,794,6815/1/10-4/30/11 1,329,218 2,764,808 3,754,746 4,609,950 5,209,2255/1/11-4/30/12 1,925,777 3,426,724 4,258,913 5,335,8145/1/12-4/30/13 1,787,588 4,690,375 5,428,2725/1/13-4/30/14 2,545,665 6,391,2555/1/14-4/30/15 3,243,964
Accident Period 12-24 24-36 36-48 48-60 60-72 72-84 84-96 96-108 108-120 120-132 132-144 144-156 156-168 168-180 180-192 192-204 204-216 216-228 228-240 240-252 252-264 264-276 276-288 288-ULT
5/1/91-4/30/92 1.677 1.373 1.092 1.048 1.017 1.012 1.014 1.011 1.008 1.011 1.006 1.015 1.035 1.009 1.002 1.014 1.008 1.141 1.003 1.011 1.001 1.001 1.0325/1/92-4/30/93 2.100 1.393 1.134 1.131 1.100 1.046 1.042 1.041 1.059 1.027 1.017 1.019 1.034 1.005 1.003 0.983 1.020 1.003 1.003 1.005 1.000 1.0015/1/93-4/30/94 2.138 1.548 1.201 1.111 1.038 1.033 1.023 1.023 1.028 1.009 1.004 1.002 1.003 1.003 1.003 1.006 1.004 1.004 1.005 1.006 1.0085/1/94-4/30/95 2.824 1.136 1.080 1.043 1.051 1.025 1.025 1.017 1.016 1.007 1.006 1.013 1.002 1.001 1.000 1.000 1.000 1.001 1.000 1.0155/1/95-4/30/96 2.105 1.361 1.141 1.051 1.017 1.022 1.017 1.014 1.019 1.001 1.001 1.001 1.001 1.001 1.001 1.001 1.002 1.001 1.0035/1/96-4/30/97 2.381 1.238 1.247 1.267 1.047 1.004 1.013 1.011 1.011 1.011 1.016 1.058 1.008 1.043 1.002 1.003 1.001 0.9475/1/97-4/30/98 2.620 1.359 1.222 1.136 1.019 1.015 1.015 1.014 1.011 1.001 1.002 1.001 1.001 1.001 1.001 1.002 1.0025/1/98-4/30/99 1.751 1.352 1.095 1.042 0.998 1.007 1.003 1.002 1.001 1.003 1.002 1.003 1.004 1.011 1.007 1.0085/1/99-4/30/00 2.969 1.252 1.070 1.043 1.035 1.004 1.003 1.003 1.001 1.001 1.001 1.005 1.001 1.001 1.0055/1/00-4/30/01 2.424 1.536 1.062 1.018 1.010 1.012 1.008 1.005 1.008 1.008 1.005 1.005 1.004 1.0055/1/01-4/30/02 2.844 1.201 1.061 1.018 1.018 1.019 1.008 1.050 1.013 1.018 1.011 1.010 1.0125/1/02-4/30/03 2.382 1.126 1.015 1.007 1.016 1.004 1.007 1.006 1.008 1.015 1.011 1.0525/1/03-4/30/04 2.026 1.429 1.095 1.078 1.057 1.062 1.061 1.049 1.046 1.019 1.0035/1/04-4/30/05 2.463 1.326 1.252 1.154 1.103 1.108 1.118 1.075 1.066 1.0345/1/05-4/30/06 1.947 1.408 1.249 1.149 1.122 1.102 1.105 1.103 1.0705/1/06-4/30/07 2.002 1.247 1.149 1.095 1.099 1.081 1.070 1.0815/1/07-4/30/08 2.520 1.258 1.167 1.105 1.169 1.097 1.0835/1/08-4/30/09 2.162 1.328 1.146 1.115 1.114 1.0885/1/09-4/30/10 1.985 1.175 1.113 1.107 1.0835/1/10-4/30/11 2.080 1.358 1.228 1.1305/1/11-4/30/12 1.779 1.243 1.2535/1/12-4/30/13 2.624 1.1575/1/13-4/30/14 2.511
All Years Average 2.275 1.309 1.146 1.092 1.059 1.041 1.036 1.032 1.024 1.012 1.007 1.015 1.010 1.008 1.003 1.002 1.005 1.016 1.003 1.009 1.003 1.001 1.032All Years Weighted 2.267 1.285 1.150 1.093 1.071 1.055 1.051 1.044 1.033 1.015 1.006 1.016 1.009 1.008 1.003 1.001 1.005 1.009 1.003 1.009 1.003 1.001 1.0325 Years Weighted 2.236 1.242 1.187 1.111 1.120 1.096 1.089 1.069 1.049 1.022 1.006 1.016 1.005 1.012 1.003 1.002 1.002 0.991 1.0032 Years Weighted 2.557 1.193 1.241 1.121 1.101 1.093 1.078 1.093 1.068 1.028 1.006 1.029 1.008 1.003 1.006 1.005 1.001 0.972 1.001 1.011 1.004 1.001Industry 2.056 1.277 1.136 1.072 1.046 1.033 1.023 1.018 1.014 1.011 1.009 1.009 1.008 1.006 1.006 1.005 1.004 1.004 1.003 1.003 1.003 1.003 1.003 1.056Prior (4/30/13) 2.068 1.290 1.147 1.117 1.112 1.078 1.071 1.031 1.016 1.014 1.013 1.011 1.010 1.009 1.008 1.007 1.006 1.006 1.005 1.005 1.004 1.004 1.003 1.027
Selected 12-24 24-36 36-48 48-60 60-72 72-84 84-96 96-108 108-120 120-132 132-144 144-156 156-168 168-180 180-192 192-204 204-216 216-228 228-240 240-252 252-264 264-276 276-288 288-ULT
Age to Age 2.432 1.235 1.188 1.109 1.087 1.078 1.064 1.052 1.041 1.019 1.011 1.010 1.008 1.006 1.005 1.004 1.003 1.003 1.003 1.003 1.003 1.003 1.002 1.050Age to Ultimate 6.165 2.535 2.052 1.727 1.558 1.433 1.330 1.250 1.188 1.141 1.120 1.107 1.096 1.088 1.082 1.076 1.072 1.068 1.065 1.062 1.059 1.056 1.053 1.050
Notes:Not all averages are shown. Selected age to age factors are based on a review of all averages and actuarial judgment.
Oliver Wyman Actuarial Consulting, Inc.
43
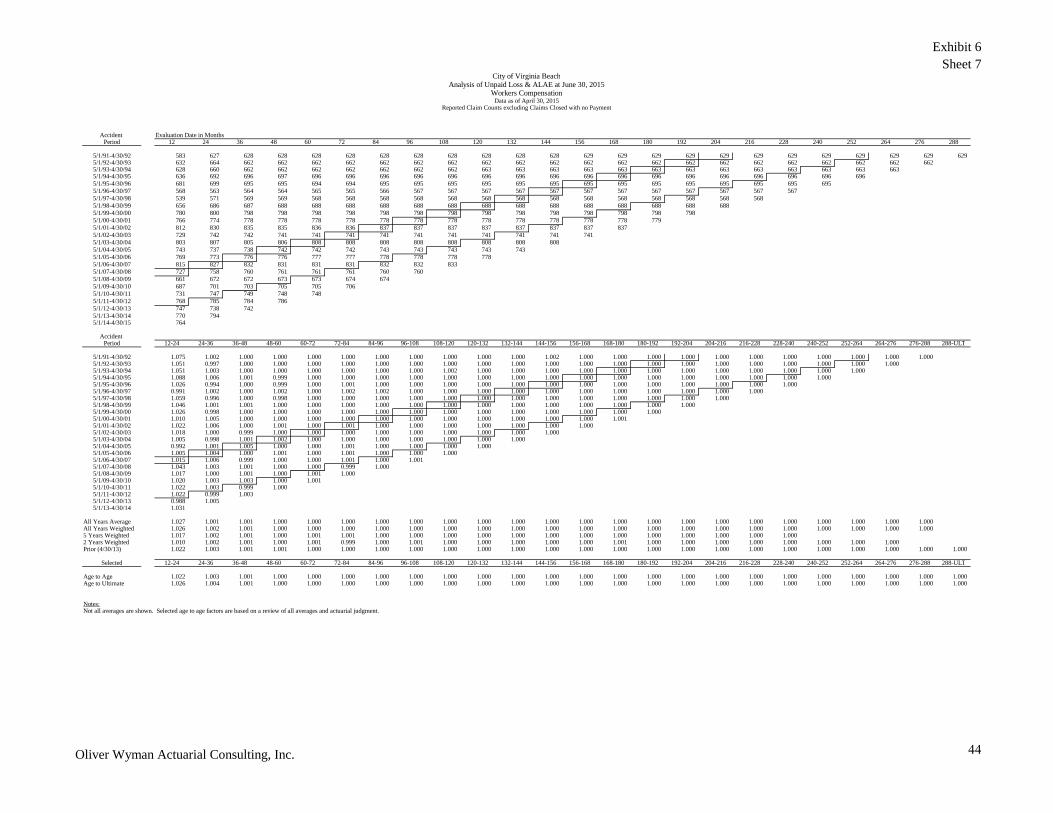
Exhibit 6Sheet 7
City of Virginia BeachAnalysis of Unpaid Loss & ALAE at June 30, 2015
Workers CompensationData as of April 30, 2015
Reported Claim Counts excluding Claims Closed with no Payment
Accident Evaluation Date in MonthsPeriod 12 24 36 48 60 72 84 96 108 120 132 144 156 168 180 192 204 216 228 240 252 264 276 288
5/1/91-4/30/92 583 627 628 628 628 628 628 628 628 628 628 628 629 629 629 629 629 629 629 629 629 629 629 6295/1/92-4/30/93 632 664 662 662 662 662 662 662 662 662 662 662 662 662 662 662 662 662 662 662 662 662 6625/1/93-4/30/94 628 660 662 662 662 662 662 662 662 663 663 663 663 663 663 663 663 663 663 663 663 6635/1/94-4/30/95 636 692 696 697 696 696 696 696 696 696 696 696 696 696 696 696 696 696 696 696 6965/1/95-4/30/96 681 699 695 695 694 694 695 695 695 695 695 695 695 695 695 695 695 695 695 6955/1/96-4/30/97 568 563 564 564 565 565 566 567 567 567 567 567 567 567 567 567 567 567 5675/1/97-4/30/98 539 571 569 569 568 568 568 568 568 568 568 568 568 568 568 568 568 5685/1/98-4/30/99 656 686 687 688 688 688 688 688 688 688 688 688 688 688 688 688 6885/1/99-4/30/00 780 800 798 798 798 798 798 798 798 798 798 798 798 798 798 7985/1/00-4/30/01 766 774 778 778 778 778 778 778 778 778 778 778 778 778 7795/1/01-4/30/02 812 830 835 835 836 836 837 837 837 837 837 837 837 8375/1/02-4/30/03 729 742 742 741 741 741 741 741 741 741 741 741 7415/1/03-4/30/04 803 807 805 806 808 808 808 808 808 808 808 8085/1/04-4/30/05 743 737 738 742 742 742 743 743 743 743 7435/1/05-4/30/06 769 773 776 776 777 777 778 778 778 7785/1/06-4/30/07 815 827 832 831 831 831 832 832 8335/1/07-4/30/08 727 758 760 761 761 761 760 7605/1/08-4/30/09 661 672 672 673 673 674 6745/1/09-4/30/10 687 701 703 705 705 7065/1/10-4/30/11 731 747 749 748 7485/1/11-4/30/12 768 785 784 7865/1/12-4/30/13 747 738 7425/1/13-4/30/14 770 7945/1/14-4/30/15 764
Accident Period 12-24 24-36 36-48 48-60 60-72 72-84 84-96 96-108 108-120 120-132 132-144 144-156 156-168 168-180 180-192 192-204 204-216 216-228 228-240 240-252 252-264 264-276 276-288 288-ULT
5/1/91-4/30/92 1.075 1.002 1.000 1.000 1.000 1.000 1.000 1.000 1.000 1.000 1.000 1.002 1.000 1.000 1.000 1.000 1.000 1.000 1.000 1.000 1.000 1.000 1.0005/1/92-4/30/93 1.051 0.997 1.000 1.000 1.000 1.000 1.000 1.000 1.000 1.000 1.000 1.000 1.000 1.000 1.000 1.000 1.000 1.000 1.000 1.000 1.000 1.0005/1/93-4/30/94 1.051 1.003 1.000 1.000 1.000 1.000 1.000 1.000 1.002 1.000 1.000 1.000 1.000 1.000 1.000 1.000 1.000 1.000 1.000 1.000 1.0005/1/94-4/30/95 1.088 1.006 1.001 0.999 1.000 1.000 1.000 1.000 1.000 1.000 1.000 1.000 1.000 1.000 1.000 1.000 1.000 1.000 1.000 1.0005/1/95-4/30/96 1.026 0.994 1.000 0.999 1.000 1.001 1.000 1.000 1.000 1.000 1.000 1.000 1.000 1.000 1.000 1.000 1.000 1.000 1.0005/1/96-4/30/97 0.991 1.002 1.000 1.002 1.000 1.002 1.002 1.000 1.000 1.000 1.000 1.000 1.000 1.000 1.000 1.000 1.000 1.0005/1/97-4/30/98 1.059 0.996 1.000 0.998 1.000 1.000 1.000 1.000 1.000 1.000 1.000 1.000 1.000 1.000 1.000 1.000 1.0005/1/98-4/30/99 1.046 1.001 1.001 1.000 1.000 1.000 1.000 1.000 1.000 1.000 1.000 1.000 1.000 1.000 1.000 1.0005/1/99-4/30/00 1.026 0.998 1.000 1.000 1.000 1.000 1.000 1.000 1.000 1.000 1.000 1.000 1.000 1.000 1.0005/1/00-4/30/01 1.010 1.005 1.000 1.000 1.000 1.000 1.000 1.000 1.000 1.000 1.000 1.000 1.000 1.0015/1/01-4/30/02 1.022 1.006 1.000 1.001 1.000 1.001 1.000 1.000 1.000 1.000 1.000 1.000 1.0005/1/02-4/30/03 1.018 1.000 0.999 1.000 1.000 1.000 1.000 1.000 1.000 1.000 1.000 1.0005/1/03-4/30/04 1.005 0.998 1.001 1.002 1.000 1.000 1.000 1.000 1.000 1.000 1.0005/1/04-4/30/05 0.992 1.001 1.005 1.000 1.000 1.001 1.000 1.000 1.000 1.0005/1/05-4/30/06 1.005 1.004 1.000 1.001 1.000 1.001 1.000 1.000 1.0005/1/06-4/30/07 1.015 1.006 0.999 1.000 1.000 1.001 1.000 1.0015/1/07-4/30/08 1.043 1.003 1.001 1.000 1.000 0.999 1.0005/1/08-4/30/09 1.017 1.000 1.001 1.000 1.001 1.0005/1/09-4/30/10 1.020 1.003 1.003 1.000 1.0015/1/10-4/30/11 1.022 1.003 0.999 1.0005/1/11-4/30/12 1.022 0.999 1.0035/1/12-4/30/13 0.988 1.0055/1/13-4/30/14 1.031
All Years Average 1.027 1.001 1.001 1.000 1.000 1.000 1.000 1.000 1.000 1.000 1.000 1.000 1.000 1.000 1.000 1.000 1.000 1.000 1.000 1.000 1.000 1.000 1.000All Years Weighted 1.026 1.002 1.001 1.000 1.000 1.000 1.000 1.000 1.000 1.000 1.000 1.000 1.000 1.000 1.000 1.000 1.000 1.000 1.000 1.000 1.000 1.000 1.0005 Years Weighted 1.017 1.002 1.001 1.000 1.001 1.001 1.000 1.000 1.000 1.000 1.000 1.000 1.000 1.000 1.000 1.000 1.000 1.000 1.0002 Years Weighted 1.010 1.002 1.001 1.000 1.001 0.999 1.000 1.001 1.000 1.000 1.000 1.000 1.000 1.001 1.000 1.000 1.000 1.000 1.000 1.000 1.000 1.000Prior (4/30/13) 1.022 1.003 1.001 1.001 1.000 1.000 1.000 1.000 1.000 1.000 1.000 1.000 1.000 1.000 1.000 1.000 1.000 1.000 1.000 1.000 1.000 1.000 1.000 1.000
Selected 12-24 24-36 36-48 48-60 60-72 72-84 84-96 96-108 108-120 120-132 132-144 144-156 156-168 168-180 180-192 192-204 204-216 216-228 228-240 240-252 252-264 264-276 276-288 288-ULT
Age to Age 1.022 1.003 1.001 1.000 1.000 1.000 1.000 1.000 1.000 1.000 1.000 1.000 1.000 1.000 1.000 1.000 1.000 1.000 1.000 1.000 1.000 1.000 1.000 1.000Age to Ultimate 1.026 1.004 1.001 1.000 1.000 1.000 1.000 1.000 1.000 1.000 1.000 1.000 1.000 1.000 1.000 1.000 1.000 1.000 1.000 1.000 1.000 1.000 1.000 1.000
Notes:Not all averages are shown. Selected age to age factors are based on a review of all averages and actuarial judgment.
Oliver Wyman Actuarial Consulting, Inc.
44
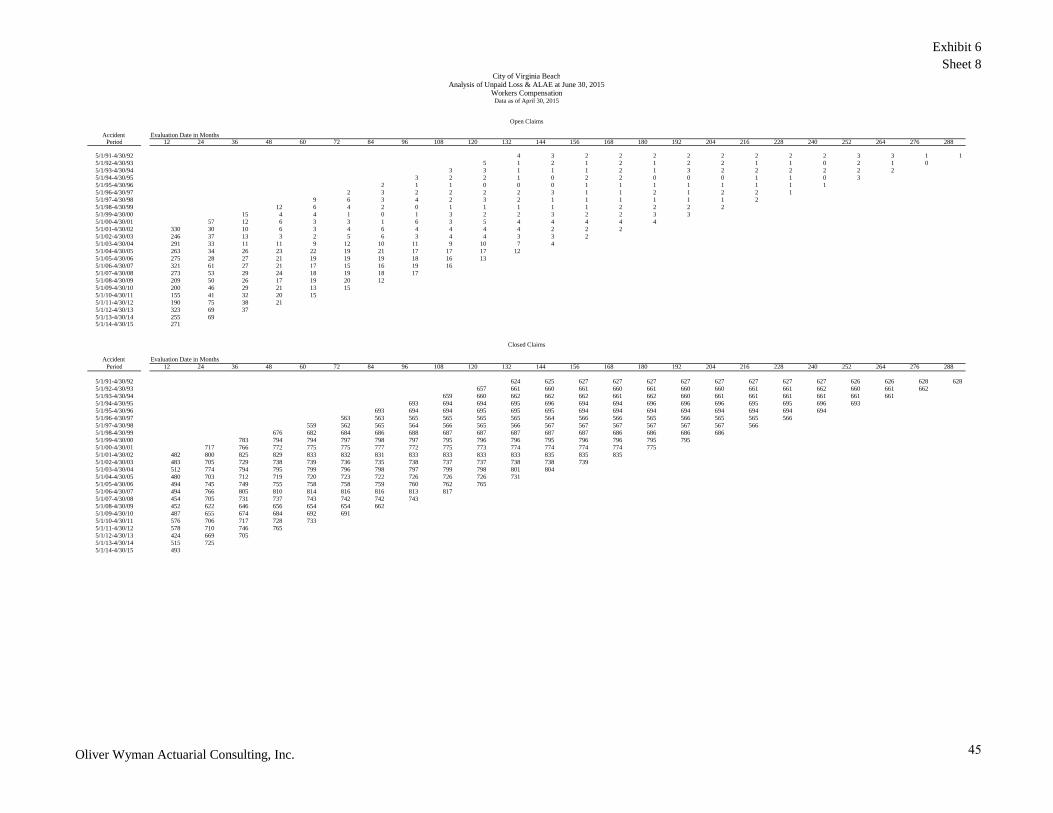
Exhibit 6Sheet 8
City of Virginia BeachAnalysis of Unpaid Loss & ALAE at June 30, 2015
Workers CompensationData as of April 30, 2015
Open Claims
Accident Evaluation Date in MonthsPeriod 12 24 36 48 60 72 84 96 108 120 132 144 156 168 180 192 204 216 228 240 252 264 276 288
5/1/91-4/30/92 4 3 2 2 2 2 2 2 2 2 3 3 1 15/1/92-4/30/93 5 1 2 1 2 1 2 2 1 1 0 2 1 05/1/93-4/30/94 3 3 1 1 1 2 1 3 2 2 2 2 2 25/1/94-4/30/95 3 2 2 1 0 2 2 0 0 0 1 1 0 35/1/95-4/30/96 2 1 1 0 0 0 1 1 1 1 1 1 1 15/1/96-4/30/97 2 3 2 2 2 2 3 1 1 2 1 2 2 15/1/97-4/30/98 9 6 3 4 2 3 2 1 1 1 1 1 1 25/1/98-4/30/99 12 6 4 2 0 1 1 1 1 1 2 2 2 25/1/99-4/30/00 15 4 4 1 0 1 3 2 2 3 2 2 3 35/1/00-4/30/01 57 12 6 3 3 1 6 3 5 4 4 4 4 45/1/01-4/30/02 330 30 10 6 3 4 6 4 4 4 4 2 2 25/1/02-4/30/03 246 37 13 3 2 5 6 3 4 4 3 3 25/1/03-4/30/04 291 33 11 11 9 12 10 11 9 10 7 45/1/04-4/30/05 263 34 26 23 22 19 21 17 17 17 125/1/05-4/30/06 275 28 27 21 19 19 19 18 16 135/1/06-4/30/07 321 61 27 21 17 15 16 19 165/1/07-4/30/08 273 53 29 24 18 19 18 175/1/08-4/30/09 209 50 26 17 19 20 125/1/09-4/30/10 200 46 29 21 13 155/1/10-4/30/11 155 41 32 20 155/1/11-4/30/12 190 75 38 215/1/12-4/30/13 323 69 375/1/13-4/30/14 255 695/1/14-4/30/15 271
Closed Claims
Accident Evaluation Date in MonthsPeriod 12 24 36 48 60 72 84 96 108 120 132 144 156 168 180 192 204 216 228 240 252 264 276 288
5/1/91-4/30/92 624 625 627 627 627 627 627 627 627 627 626 626 628 6285/1/92-4/30/93 657 661 660 661 660 661 660 660 661 661 662 660 661 6625/1/93-4/30/94 659 660 662 662 662 661 662 660 661 661 661 661 661 6615/1/94-4/30/95 693 694 694 695 696 694 694 696 696 696 695 695 696 6935/1/95-4/30/96 693 694 694 695 695 695 694 694 694 694 694 694 694 6945/1/96-4/30/97 563 563 565 565 565 565 564 566 566 565 566 565 565 5665/1/97-4/30/98 559 562 565 564 566 565 566 567 567 567 567 567 567 5665/1/98-4/30/99 676 682 684 686 688 687 687 687 687 687 686 686 686 6865/1/99-4/30/00 783 794 794 797 798 797 795 796 796 795 796 796 795 7955/1/00-4/30/01 717 766 772 775 775 777 772 775 773 774 774 774 774 7755/1/01-4/30/02 482 800 825 829 833 832 831 833 833 833 833 835 835 8355/1/02-4/30/03 483 705 729 738 739 736 735 738 737 737 738 738 7395/1/03-4/30/04 512 774 794 795 799 796 798 797 799 798 801 8045/1/04-4/30/05 480 703 712 719 720 723 722 726 726 726 7315/1/05-4/30/06 494 745 749 755 758 758 759 760 762 7655/1/06-4/30/07 494 766 805 810 814 816 816 813 8175/1/07-4/30/08 454 705 731 737 743 742 742 7435/1/08-4/30/09 452 622 646 656 654 654 6625/1/09-4/30/10 487 655 674 684 692 6915/1/10-4/30/11 576 706 717 728 7335/1/11-4/30/12 578 710 746 7655/1/12-4/30/13 424 669 7055/1/13-4/30/14 515 7255/1/14-4/30/15 493
Oliver Wyman Actuarial Consulting, Inc.
45

Exhibit 7Sheet 1
City of Virginia BeachAnalysis of Unpaid Loss & ALAE at June 30, 2015
Workers CompensationData as of June 30, 2015
Paid Loss & ALAE / Closed Claims - Limited to $750K
Accident Evaluation Date in MonthsPeriod 12 24 36 48 60 72 84 96 108 120 132 144 156 168 180 192 204 216 228 240 252 264 276 288
5/1/91-4/30/92 2,288 2,299 2,326 2,407 2,430 2,434 2,468 2,487 2,837 2,846 2,881 2,883 2,876 2,969 5/1/92-4/30/93 2,977 3,039 3,094 3,149 3,261 3,272 3,286 3,230 3,289 3,298 3,302 3,327 3,322 3,321 5/1/93-4/30/94 3,538 3,632 3,652 3,665 3,672 3,688 3,693 3,716 3,734 3,748 3,762 3,781 3,805 3,837 5/1/94-4/30/95 3,318 3,370 3,422 3,440 3,457 3,510 3,519 3,513 3,514 3,514 3,519 3,523 3,520 3,587 5/1/95-4/30/96 2,864 2,909 2,951 3,002 3,006 3,010 3,019 3,021 3,023 3,025 3,028 3,032 3,035 3,043 5/1/96-4/30/97 3,526 3,542 3,576 3,616 3,656 3,697 3,762 3,965 3,997 4,177 4,177 4,196 4,199 3,968 5/1/97-4/30/98 3,018 3,059 3,088 3,139 3,171 3,210 3,208 3,208 3,211 3,215 3,218 3,222 3,229 3,241 5/1/98-4/30/99 2,204 2,276 2,264 2,274 2,275 2,282 2,286 2,292 2,297 2,303 2,316 2,342 2,360 2,378 5/1/99-4/30/00 2,987 3,151 3,285 3,389 3,397 3,412 3,432 3,433 3,437 3,445 3,457 3,459 3,468 3,484 5/1/00-4/30/01 2,608 3,749 3,951 4,006 4,047 4,085 4,146 4,150 4,195 4,221 4,244 4,264 4,282 4,296 5/1/01-4/30/02 1,781 3,052 3,555 3,753 3,802 3,874 3,951 3,974 4,171 4,226 4,303 4,339 4,382 4,435 5/1/02-4/30/03 2,185 3,566 3,884 3,895 3,917 3,995 4,017 4,029 4,060 4,093 4,149 4,195 4,410 5/1/03-4/30/04 2,299 3,082 4,293 4,696 5,036 5,342 5,657 6,012 6,293 6,594 6,693 6,685 5/1/04-4/30/05 2,096 3,526 4,615 5,722 6,595 7,242 8,034 8,930 9,599 10,233 10,512 5/1/05-4/30/06 2,115 2,730 3,824 4,739 5,424 6,085 6,695 7,386 8,123 8,657 5/1/06-4/30/07 2,420 3,124 3,708 4,236 4,613 5,058 5,468 5,872 6,315 5/1/07-4/30/08 2,549 4,136 5,017 5,808 6,364 7,451 8,176 8,844 5/1/08-4/30/09 2,770 4,353 5,565 6,281 7,023 7,824 8,410 5/1/09-4/30/10 2,503 3,694 4,217 4,626 5,063 5,492 5/1/10-4/30/11 2,308 3,916 5,237 6,332 7,107 5/1/11-4/30/12 3,332 4,826 5,709 6,975 5/1/12-4/30/13 4,216 7,011 7,700 5/1/13-4/30/14 4,943 8,816 5/1/14-4/30/15 6,580
Paid Loss & ALAE / Reported Loss & ALAE - Limited to $750K
Accident Period 12 24 36 48 60 72 84 96 108 120 132 144 156 168 180 192 204 216 228 240 252 264 276 288
5/1/91-4/30/92 0.539 0.697 0.859 0.889 0.861 0.967 0.979 0.973 0.983 0.982 0.967 0.969 0.974 0.964 0.972 0.973 0.960 0.972 0.814 0.772 0.969 0.967 0.999 0.9885/1/92-4/30/93 0.407 0.589 0.694 0.714 0.758 0.812 0.836 0.844 0.876 0.875 0.967 0.927 0.942 0.939 0.958 0.960 1.000 0.990 0.987 1.000 0.987 0.988 1.0005/1/93-4/30/94 0.365 0.528 0.625 0.733 0.857 0.886 0.915 0.857 0.876 0.959 0.970 0.972 0.973 0.975 0.978 0.950 0.926 0.929 0.966 0.971 0.977 0.9855/1/94-4/30/95 0.339 0.674 0.747 0.830 0.894 0.908 0.848 0.866 0.979 0.989 0.994 1.000 0.996 0.985 1.000 1.000 1.000 1.000 0.992 1.000 0.9915/1/95-4/30/96 0.501 0.638 0.790 0.839 0.933 0.953 0.958 0.977 0.989 1.000 1.000 1.000 0.999 0.994 0.981 0.982 0.993 0.995 0.996 0.9975/1/96-4/30/97 0.270 0.651 0.698 0.760 0.896 0.964 0.963 0.968 0.978 0.973 0.983 0.990 0.937 0.918 0.954 0.958 0.957 0.961 0.9625/1/97-4/30/98 0.340 0.592 0.719 0.800 0.939 0.950 0.966 0.971 0.989 0.986 0.991 0.987 0.981 0.982 0.992 0.993 0.995 0.9945/1/98-4/30/99 0.421 0.639 0.805 0.856 0.951 0.955 0.989 1.000 0.991 0.992 0.980 0.989 0.981 0.972 0.967 0.985 0.9885/1/99-4/30/00 0.397 0.725 0.878 0.962 0.957 0.999 1.000 0.996 0.997 0.987 0.983 0.984 0.995 0.998 0.996 0.9915/1/00-4/30/01 0.401 0.592 0.937 0.973 0.969 0.976 0.998 0.997 0.973 0.949 0.951 0.960 0.965 0.967 0.9705/1/01-4/30/02 0.374 0.817 0.887 0.939 0.955 0.939 0.948 0.810 0.813 0.824 0.936 0.945 0.946 0.9615/1/02-4/30/03 0.502 0.836 0.953 0.988 0.972 0.976 0.965 0.985 0.994 0.997 0.993 0.990 0.9935/1/03-4/30/04 0.436 0.544 0.786 0.767 0.847 0.787 0.815 0.855 0.899 0.936 0.951 0.9635/1/04-4/30/05 0.377 0.613 0.618 0.785 0.708 0.624 0.681 0.775 0.821 0.900 0.9375/1/05-4/30/06 0.446 0.486 0.590 0.594 0.598 0.677 0.738 0.779 0.839 0.9025/1/06-4/30/07 0.412 0.708 0.640 0.577 0.641 0.723 0.774 0.833 0.8745/1/07-4/30/08 0.623 0.528 0.537 0.626 0.653 0.723 0.784 0.8395/1/08-4/30/09 0.363 0.513 0.650 0.721 0.770 0.850 0.8895/1/09-4/30/10 0.541 0.721 0.725 0.793 0.864 0.8565/1/10-4/30/11 0.571 0.750 0.721 0.789 0.8155/1/11-4/30/12 0.519 0.728 0.829 0.8815/1/12-4/30/13 0.509 0.812 0.8865/1/13-4/30/14 0.574 0.8375/1/14-4/30/15 0.524
Oliver Wyman Actuarial Consulting, Inc.
46

Exhibit 7Sheet 2
City of Virginia BeachAnalysis of Unpaid Loss & ALAE at June 30, 2015
Workers CompensationData as of June 30, 2015
Case Reserve per $1M Payroll (Based on $750K data)
Accident Evaluation Date in MonthsPeriod 12 24 36 48 60 72 84 96 108 120 132 144 156 168 180 192
5/1/00-4/30/01 5,610 6,288 944 408 484 375 26 44 429 857 826 661 591 557 4995/1/01-4/30/02 6,561 2,497 1,717 924 690 958 818 3,554 3,657 3,450 1,120 972 950 6975/1/02-4/30/03 4,497 2,122 594 151 363 307 454 189 82 41 90 130 935/1/03-4/30/04 6,178 8,121 3,763 4,616 2,951 4,661 4,170 3,298 2,301 1,467 1,123 8495/1/04-4/30/05 6,394 6,011 7,809 4,327 7,529 12,131 10,469 7,242 5,831 3,190 1,9915/1/05-4/30/06 4,719 7,822 7,222 8,878 10,049 7,984 6,560 5,789 4,307 2,6025/1/06-4/30/07 5,892 3,397 5,796 8,683 7,239 5,455 4,504 3,298 2,5705/1/07-4/30/08 2,299 8,567 10,394 8,390 8,260 6,971 5,491 4,1425/1/08-4/30/09 7,038 8,242 6,193 5,117 4,406 2,902 2,2305/1/09-4/30/10 3,317 2,999 3,461 2,651 1,772 2,0435/1/10-4/30/11 3,212 2,970 4,679 3,964 3,8095/1/11-4/30/12 5,694 4,083 2,816 2,3035/1/12-4/30/13 5,479 3,444 2,2285/1/13-4/30/14 5,919 3,8895/1/14-4/30/15 8,953
Oliver Wyman Actuarial Consulting, Inc.
47
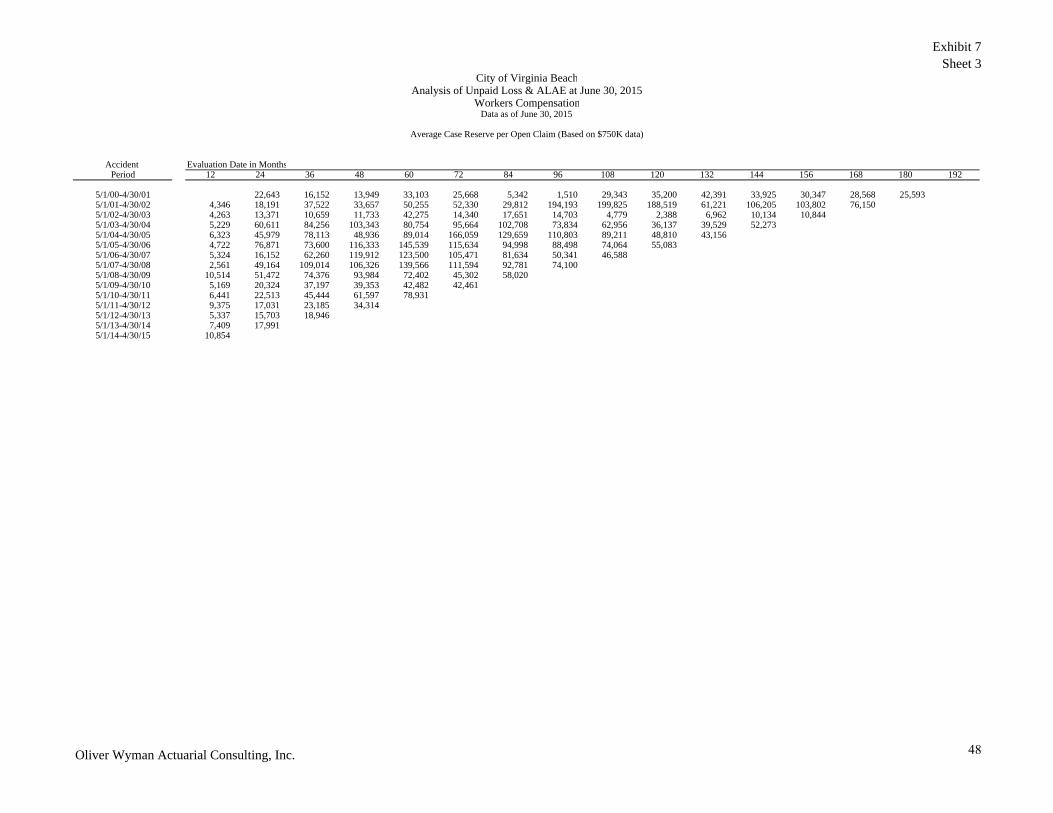
Exhibit 7Sheet 3
Accident Evaluation Date in MonthsPeriod 12 24 36 48 60 72 84 96 108 120 132 144 156 168 180 192
5/1/00-4/30/01 22,643 16,152 13,949 33,103 25,668 5,342 1,510 29,343 35,200 42,391 33,925 30,347 28,568 25,5935/1/01-4/30/02 4,346 18,191 37,522 33,657 50,255 52,330 29,812 194,193 199,825 188,519 61,221 106,205 103,802 76,1505/1/02-4/30/03 4,263 13,371 10,659 11,733 42,275 14,340 17,651 14,703 4,779 2,388 6,962 10,134 10,8445/1/03-4/30/04 5,229 60,611 84,256 103,343 80,754 95,664 102,708 73,834 62,956 36,137 39,529 52,2735/1/04-4/30/05 6,323 45,979 78,113 48,936 89,014 166,059 129,659 110,803 89,211 48,810 43,1565/1/05-4/30/06 4,722 76,871 73,600 116,333 145,539 115,634 94,998 88,498 74,064 55,0835/1/06-4/30/07 5,324 16,152 62,260 119,912 123,500 105,471 81,634 50,341 46,5885/1/07-4/30/08 2,561 49,164 109,014 106,326 139,566 111,594 92,781 74,1005/1/08-4/30/09 10,514 51,472 74,376 93,984 72,402 45,302 58,0205/1/09-4/30/10 5,169 20,324 37,197 39,353 42,482 42,4615/1/10-4/30/11 6,441 22,513 45,444 61,597 78,9315/1/11-4/30/12 9,375 17,031 23,185 34,3145/1/12-4/30/13 5,337 15,703 18,9465/1/13-4/30/14 7,409 17,9915/1/14-4/30/15 10,854
City of Virginia BeachAnalysis of Unpaid Loss & ALAE at June 30, 2015
Workers CompensationData as of June 30, 2015
Average Case Reserve per Open Claim (Based on $750K data)
Oliver Wyman Actuarial Consulting, Inc.
48

Exhibit 8
City of Virginia BeachAnalysis of Unpaid Loss & ALAE at June 30, 2015
Workers CompensationData as of June 30, 2015
Loss & ALAE Limited to Retention
Comparison of Expected Development to Actual Development
SECTION I - REPORTED LOSS & ALAE ActualSelected Change in Expected Actual Selected
Ultimate Loss Expected Percent Reported Change in Minus Ultimate Loss Change inFiscal & ALAE as of Actual Reported Loss & ALAE as of Reported as of 4/13 - 6/15 Reported Expected & ALAE as of UltimateYears 4/30/13 4/30/13 6/30/15 4/30/13 6/30/15 (2b) - (2a) 4/13 - 6/15 (4) - (5) 6/30/15 Loss & ALAE
(1) (2a) (2b) (3a) (3b) (4) (5) (6) (7) (8)
7/1/90-6/30/91 * 1,929,843 1,910,537 1,913,674 99.0% 99.2% 3,137 4,131 (994) 1,934,394 4,5517/1/91-6/30/92 1,842,653 1,794,532 1,815,083 98.9% 99.1% 20,551 10,285 10,266 1,847,884 5,2317/1/92-6/30/93 2,282,259 2,260,327 2,233,888 98.5% 98.8% (26,440) 4,446 (30,886) 2,233,888 (48,371)7/1/93-6/30/94 2,794,336 2,749,287 2,749,848 98.4% 98.7% 561 9,131 (8,570) 2,794,882 5457/1/94-6/30/95 2,508,655 2,495,335 2,648,840 98.2% 98.6% 153,505 2,691 150,815 2,695,902 187,2477/1/95-6/30/96 1,894,361 1,880,611 1,884,601 98.0% 98.4% 3,991 2,767 1,223 1,896,549 2,1887/1/96-6/30/97 2,244,720 2,232,065 2,227,300 97.8% 98.2% (4,765) 2,543 (7,308) 2,242,028 (2,692)7/1/97-6/30/98 1,932,672 1,932,672 1,938,172 97.6% 98.1% 5,500 0 5,500 1,950,673 18,0017/1/98-6/30/99 2,173,819 2,135,814 2,124,530 97.2% 97.8% (11,283) 8,362 (19,645) 2,146,793 (27,025)7/1/99-6/30/00 2,425,919 2,391,871 2,426,067 96.8% 97.6% 34,196 8,349 25,847 2,466,296 40,3777/1/00-6/30/01 3,883,303 3,792,508 3,802,264 96.4% 97.3% 9,757 23,094 (13,338) 3,883,465 1627/1/01-6/30/02 3,843,416 3,738,360 3,749,860 95.8% 96.9% 11,500 26,505 (15,005) 3,852,207 8,7917/1/02-6/30/03 2,992,438 2,911,159 3,113,127 95.3% 96.4% 201,969 20,383 181,585 3,205,156 212,7187/1/03-6/30/04 6,918,545 6,706,692 6,478,490 94.6% 95.9% (228,202) 52,715 (280,916) 6,667,887 (250,658)7/1/04-6/30/05 8,023,301 7,723,364 7,842,451 93.8% 95.4% 119,088 74,012 45,076 8,156,167 132,8667/1/05-6/30/06 7,093,762 6,741,575 6,915,428 92.3% 94.2% 173,853 84,728 89,125 7,267,964 174,2027/1/06-6/30/07 5,578,717 5,219,917 5,498,304 91.1% 93.3% 278,387 88,673 189,714 5,872,087 293,3707/1/07-6/30/08 8,026,643 7,612,262 7,657,426 89.5% 92.2% 45,164 109,181 (64,017) 8,232,887 206,2447/1/08-6/30/09 6,883,893 6,165,630 6,602,084 87.7% 91.1% 436,453 200,105 236,348 7,051,063 167,1707/1/09-6/30/10 5,325,719 4,399,902 4,892,282 85.1% 89.7% 492,380 287,849 204,531 5,450,158 124,4387/1/10-6/30/11 6,872,252 5,443,047 6,853,582 79.4% 88.1% 1,410,535 603,497 807,038 7,868,317 996,0657/1/11-6/30/12 6,653,400 ** 4,100,035 5,516,179 64.7% 85.8% 1,416,143 1,523,816 (107,673) 6,702,846 49,4457/1/12-6/30/13 7,788,348 ** 3,043,952 7,162,088 37.4% 78.7% 4,118,136 3,131,497 986,639 9,510,821 1,722,4737/1/13-6/30/14 7,968,413 ** 0 8,689,311 0.0% 65.5% 8,689,311 5,217,778 3,471,533 11,827,623 3,859,2107/1/14-6/30/15 8,428,028 ** 0 4,349,678 0.0% 45.9% 4,349,678 3,872,048 477,630 10,406,753 1,978,726
Total All Years 118,309,415 89,381,453 111,084,557 21,703,104 15,368,585 6,334,519 128,164,691 9,855,276Exclude FY14 & FY15 101,912,974 89,381,453 98,045,569 8,664,116 6,278,759 2,385,356 105,930,314 4,017,340
SECTION II - PAID LOSS & ALAE ActualSelected Change in Expected Actual Selected
Ultimate Loss Expected Percent Paid Change in Minus Ultimate Loss Change inFiscal & ALAE as of Actual Paid Loss & ALAE as of Paid as of 4/13 - 6/15 Paid Expected & ALAE as of UltimateYears 4/30/13 4/30/13 6/30/15 4/30/13 6/30/15 (2b) - (2a) 4/13 - 6/15 (4) - (5) 6/30/15 Loss & ALAE
(1) (2a) (2b) (3a) (3b) (4) (5) (6) (7) (8)
7/1/90-6/30/91 1,929,843 1,755,731 1,779,984 97.7% 98.3% 24,254 41,173 (16,919) 1,934,394 4,5517/1/91-6/30/92 1,842,653 1,732,025 1,791,752 97.4% 98.0% 59,727 26,125 33,602 1,847,884 5,2317/1/92-6/30/93 2,282,259 2,231,110 2,233,888 96.6% 97.4% 2,777 11,463 (8,685) 2,233,888 (48,371)7/1/93-6/30/94 2,794,336 2,673,921 2,714,289 96.2% 97.0% 40,368 26,940 13,428 2,794,882 5457/1/94-6/30/95 2,508,655 2,476,805 2,527,954 95.7% 96.7% 51,148 7,111 44,037 2,695,902 187,2477/1/95-6/30/96 1,894,361 1,869,600 1,877,862 95.2% 96.3% 8,262 5,511 2,750 1,896,549 2,1887/1/96-6/30/97 2,244,720 2,213,720 2,220,350 94.6% 95.8% 6,630 6,872 (242) 2,242,028 (2,692)7/1/97-6/30/98 1,932,672 1,932,672 1,934,865 94.0% 95.3% 2,193 0 2,193 1,950,673 18,0017/1/98-6/30/99 2,173,819 2,080,944 2,105,581 93.2% 94.7% 24,637 20,399 4,238 2,146,793 (27,025)7/1/99-6/30/00 2,425,919 2,385,713 2,402,831 92.4% 94.1% 17,118 8,786 8,332 2,466,296 40,3777/1/00-6/30/01 3,883,303 3,671,118 3,702,464 91.5% 93.4% 31,346 46,114 (14,769) 3,883,465 1627/1/01-6/30/02 3,843,416 3,525,950 3,615,996 90.5% 92.6% 90,045 68,587 21,458 3,852,207 8,7917/1/02-6/30/03 2,992,438 2,889,413 3,090,891 89.4% 91.7% 201,479 22,115 179,363 3,205,156 212,7187/1/03-6/30/04 6,918,545 5,997,860 6,279,720 88.1% 90.7% 281,860 196,252 85,608 6,667,887 (250,658)7/1/04-6/30/05 8,023,301 6,683,050 7,485,948 86.7% 89.6% 802,898 293,879 509,019 8,156,167 132,8667/1/05-6/30/06 7,093,762 5,187,371 6,226,280 82.8% 87.6% 1,038,909 530,086 508,823 7,267,964 174,2027/1/06-6/30/07 5,578,717 4,176,959 4,911,936 77.0% 86.0% 734,977 551,065 183,912 5,872,087 293,3707/1/07-6/30/08 8,026,643 5,323,523 6,443,881 70.6% 83.0% 1,120,358 1,146,701 (26,343) 8,232,887 206,2447/1/08-6/30/09 6,883,893 4,677,902 5,704,565 63.3% 77.4% 1,026,663 846,117 180,546 7,051,063 167,1707/1/09-6/30/10 5,325,719 3,267,942 4,093,209 56.4% 71.7% 825,267 720,682 104,585 5,450,158 124,4387/1/10-6/30/11 6,872,252 3,903,010 5,590,050 48.4% 64.4% 1,687,040 916,876 770,164 7,868,317 996,0657/1/11-6/30/12 6,653,400 ** 3,071,736 5,008,772 36.6% 57.6% 1,937,036 1,187,206 749,831 6,702,846 49,4457/1/12-6/30/13 7,788,348 ** 1,476,616 6,436,312 13.8% 49.8% 4,959,697 2,638,021 2,321,675 9,510,821 1,722,4737/1/13-6/30/14 7,968,413 ** 0 6,941,003 0.0% 38.8% 6,941,003 3,094,732 3,846,271 11,827,623 3,859,2107/1/14-6/30/15 8,428,028 ** 0 2,397,822 0.0% 19.0% 2,397,822 1,597,711 800,111 10,406,753 1,978,726
Total All Years 118,309,415 75,204,691 99,518,203 24,313,513 14,010,525 10,302,988 128,164,691 9,855,276Exclude FY14 & FY15 101,912,974 75,204,691 90,179,379 14,974,688 9,318,082 5,656,606 105,930,314 4,017,340
Notes:Columns (1), (2a), and (3) are from Oliver Wyman's report using data valued as of April 30, 2013. * Fiscal year 1991 only includes claims with date of loss 8/1/1990 and later.Column (2b) provided by City of Virginia Beach. ** The selected ultimates for fiscal years ending 2012 through 2015 have been revisedColumn (5) equals [Column (1) - Column (2a)] x [Column (3b) - Column (3a)] / [1.00 - Column (3a)]. with updated exposures.Column (7) equals Exhibit 1, Sheet 4, Column (9).Column (8) equals Column (7) - Column (1).
Oliver Wyman Actuarial Consulting, Inc.
49

Exhibit 1Sheet 1
City of Virginia BeachAnalysis of Unpaid Loss & ALAE at June 30, 2015
General LiabilityData as of June 30, 2015
Loss & ALAE Limited to Retention
Summary of Unpaid Loss & ALAE as of June 30, 2016
Selected Total Unpaid % Paid % Paid Expected Total UnpaidUltimate Loss Loss & ALAE Loss & ALAE Loss & ALAE Paid Between Loss & ALAE
Fiscal & ALAE as of as of as of as of 6/30/15 and as ofYears 6/30/15 6/30/15 6/30/15 6/30/16 6/30/16 6/30/16
(1) (2) (3) (4) (5) (6)
7/1/04-6/30/05 333,698 0 99.7% 99.8% 0 07/1/05-6/30/06 517,284 8,018 99.6% 99.7% 2,001 6,0167/1/06-6/30/07 421,983 50,083 99.4% 99.6% 16,656 33,4287/1/07-6/30/08 1,310,079 4,160 99.1% 99.4% 1,382 2,7787/1/08-6/30/09 897,537 0 98.4% 99.1% 0 07/1/09-6/30/10 964,844 14,697 96.5% 98.4% 8,072 6,6267/1/10-6/30/11 474,350 17,258 92.8% 96.5% 8,865 8,3937/1/11-6/30/12 435,132 190,930 88.4% 92.8% 72,450 118,4817/1/12-6/30/13 393,905 122,793 73.6% 88.4% 68,576 54,2177/1/13-6/30/14 640,762 304,576 54.5% 73.6% 127,902 176,6747/1/14-6/30/15 630,610 494,934 27.3% 54.5% 185,582 309,3527/1/15-6/30/16 687,481 0 0.0% 27.3% 187,481 499,999
Total 7,707,663 1,207,450 678,967 1,215,965
Current (Short-term) Liability (excludes FY2016)*: 491,485as a percent of 6/30/15 Liability: 41%
Notes:Column (1) is from Exhibit 1, Sheet 4, Column (9).Column (2) is from Exhibit 1, Sheet 3, Column (6).Columns (3) and (4) are based on Exhibit 6, Sheet 6.Column (5) equals Column (2) x [Column (4) - Column (3)] / [1.0 - Column (3)].Column (6) equals Exhibit 1, Sheet 4, Column (9) - Exhibit 1, Sheet 4, Column (7) - Column (5).* Current (Short-term) liability is calculated as the expected payments during the next 12 months for accidents occurring through the current evaluation date only.
Oliver Wyman Actuarial Consulting, Inc.
50
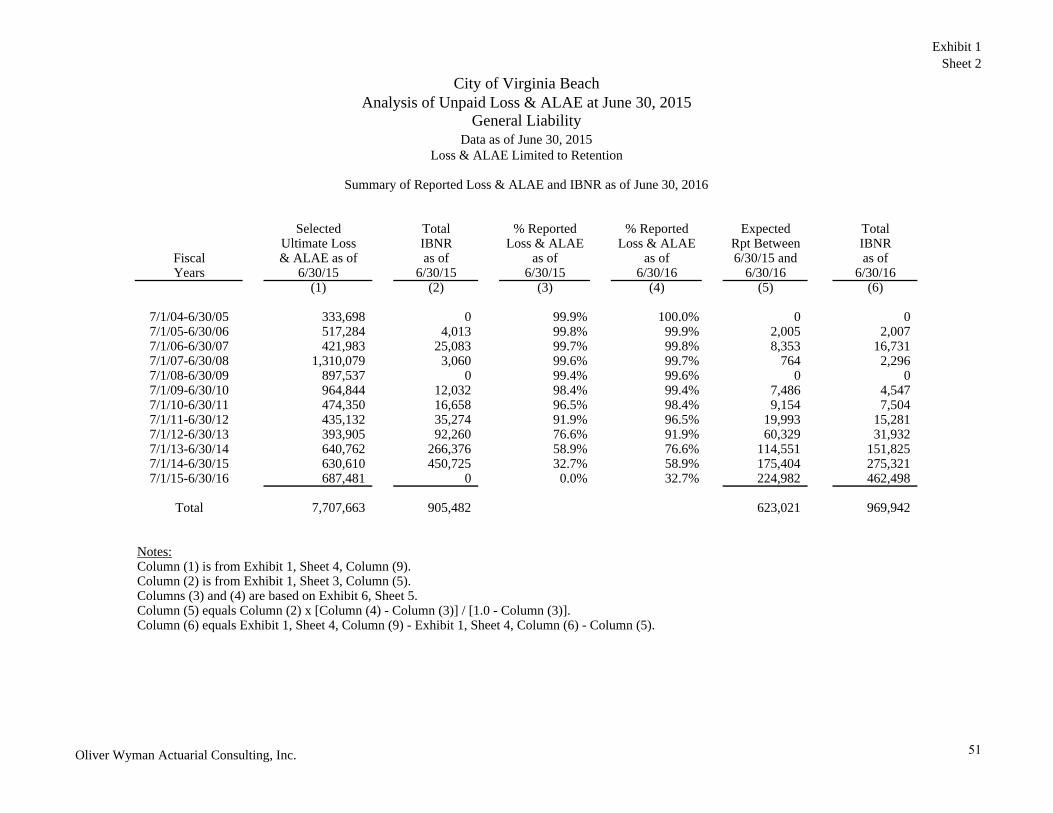
Exhibit 1Sheet 2
City of Virginia BeachAnalysis of Unpaid Loss & ALAE at June 30, 2015
General LiabilityData as of June 30, 2015
Loss & ALAE Limited to Retention
Summary of Reported Loss & ALAE and IBNR as of June 30, 2016
Selected Total % Reported % Reported Expected TotalUltimate Loss IBNR Loss & ALAE Loss & ALAE Rpt Between IBNR
Fiscal & ALAE as of as of as of as of 6/30/15 and as ofYears 6/30/15 6/30/15 6/30/15 6/30/16 6/30/16 6/30/16
(1) (2) (3) (4) (5) (6)
7/1/04-6/30/05 333,698 0 99.9% 100.0% 0 07/1/05-6/30/06 517,284 4,013 99.8% 99.9% 2,005 2,0077/1/06-6/30/07 421,983 25,083 99.7% 99.8% 8,353 16,7317/1/07-6/30/08 1,310,079 3,060 99.6% 99.7% 764 2,2967/1/08-6/30/09 897,537 0 99.4% 99.6% 0 07/1/09-6/30/10 964,844 12,032 98.4% 99.4% 7,486 4,5477/1/10-6/30/11 474,350 16,658 96.5% 98.4% 9,154 7,5047/1/11-6/30/12 435,132 35,274 91.9% 96.5% 19,993 15,2817/1/12-6/30/13 393,905 92,260 76.6% 91.9% 60,329 31,9327/1/13-6/30/14 640,762 266,376 58.9% 76.6% 114,551 151,8257/1/14-6/30/15 630,610 450,725 32.7% 58.9% 175,404 275,3217/1/15-6/30/16 687,481 0 0.0% 32.7% 224,982 462,498
Total 7,707,663 905,482 623,021 969,942
Notes:Column (1) is from Exhibit 1, Sheet 4, Column (9).Column (2) is from Exhibit 1, Sheet 3, Column (5).Columns (3) and (4) are based on Exhibit 6, Sheet 5.Column (5) equals Column (2) x [Column (4) - Column (3)] / [1.0 - Column (3)].Column (6) equals Exhibit 1, Sheet 4, Column (9) - Exhibit 1, Sheet 4, Column (6) - Column (5).
Oliver Wyman Actuarial Consulting, Inc.
51
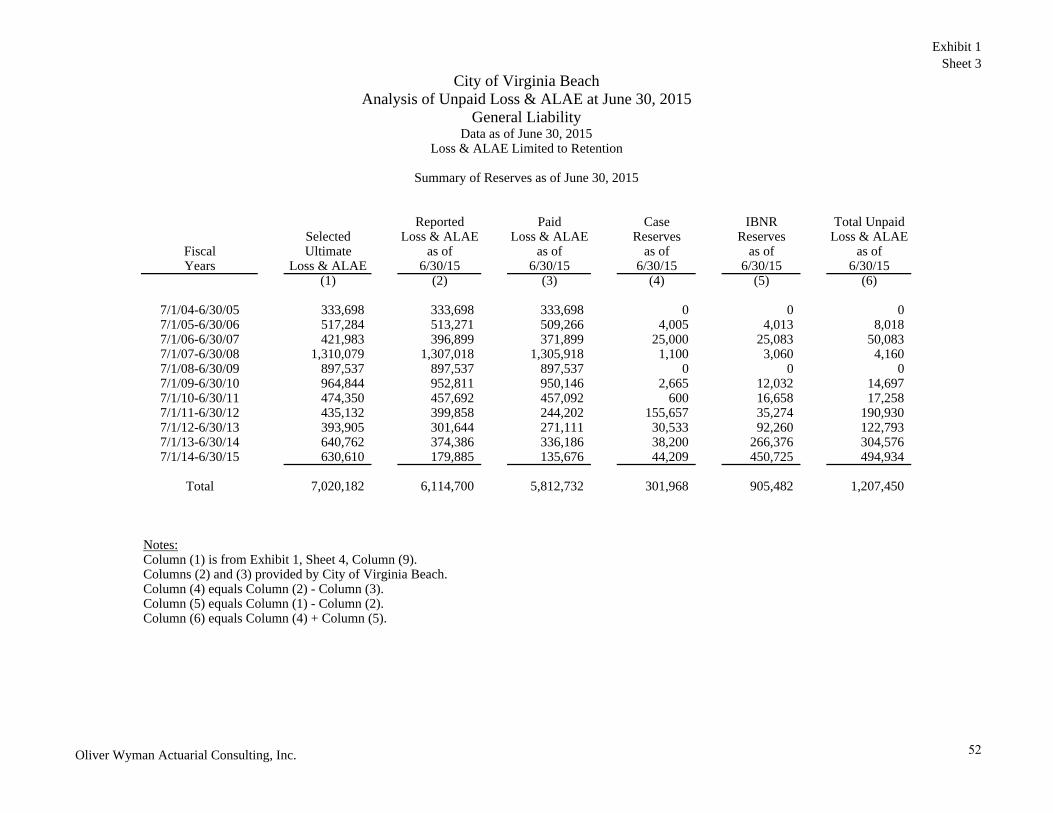
Exhibit 1Sheet 3
City of Virginia BeachAnalysis of Unpaid Loss & ALAE at June 30, 2015
General LiabilityData as of June 30, 2015
Loss & ALAE Limited to Retention
Summary of Reserves as of June 30, 2015
Reported Paid Case IBNR Total UnpaidSelected Loss & ALAE Loss & ALAE Reserves Reserves Loss & ALAE
Fiscal Ultimate as of as of as of as of as ofYears Loss & ALAE 6/30/15 6/30/15 6/30/15 6/30/15 6/30/15
(1) (2) (3) (4) (5) (6)
7/1/04-6/30/05 333,698 333,698 333,698 0 0 07/1/05-6/30/06 517,284 513,271 509,266 4,005 4,013 8,0187/1/06-6/30/07 421,983 396,899 371,899 25,000 25,083 50,0837/1/07-6/30/08 1,310,079 1,307,018 1,305,918 1,100 3,060 4,1607/1/08-6/30/09 897,537 897,537 897,537 0 0 07/1/09-6/30/10 964,844 952,811 950,146 2,665 12,032 14,6977/1/10-6/30/11 474,350 457,692 457,092 600 16,658 17,2587/1/11-6/30/12 435,132 399,858 244,202 155,657 35,274 190,9307/1/12-6/30/13 393,905 301,644 271,111 30,533 92,260 122,7937/1/13-6/30/14 640,762 374,386 336,186 38,200 266,376 304,5767/1/14-6/30/15 630,610 179,885 135,676 44,209 450,725 494,934
Total 7,020,182 6,114,700 5,812,732 301,968 905,482 1,207,450
Notes:Column (1) is from Exhibit 1, Sheet 4, Column (9).Columns (2) and (3) provided by City of Virginia Beach.Column (4) equals Column (2) - Column (3).Column (5) equals Column (1) - Column (2).Column (6) equals Column (4) + Column (5).
Oliver Wyman Actuarial Consulting, Inc.
52

Exhibit 1Sheet 4
City of Virginia BeachAnalysis of Unpaid Loss & ALAE at June 30, 2015
General LiabilityData as of June 30, 2015
Loss & ALAE Limited to Retention
Estimate of Ultimate Loss & ALAE
Reported Paid Reported Paid Reported Paid Implied OpenLoss & ALAE Loss & ALAE Bornhuetter- Bornhuetter- Case Loss & ALAE Loss & ALAE Implied Open and IBNR Selected Implied
Fiscal Development Development Ferguson Ferguson Development as of as of and IBNR Claim Counts Ultimate Loss & ALAEYears Method Method Method Method Method 6/30/15 6/30/15 Claim Counts within Retention Loss & ALAE Cost
(1) (2) (3) (4) (5) (6) (7) (8a) (8b) (9) (10)
7/1/04-6/30/05 334,032 334,701 334,194 335,185 333,698 333,698 333,698 0 0 333,698 0.3517/1/05-6/30/06 514,298 511,306 514,303 511,329 517,284 513,271 509,266 1 1 517,284 0.5257/1/06-6/30/07 398,091 374,136 398,619 375,334 421,983 396,899 371,899 1 1 421,983 0.3887/1/07-6/30/08 1,312,254 1,317,714 1,309,435 1,311,341 1,307,903 1,307,018 1,305,918 2 2 1,310,079 1.1497/1/08-6/30/09 902,934 911,983 901,171 907,167 897,537 897,537 897,537 0 0 897,537 0.7897/1/09-6/30/10 968,127 984,748 962,499 971,663 954,994 952,811 950,146 2 2 964,844 0.8477/1/10-6/30/11 474,350 492,687 479,067 501,068 458,259 457,692 457,092 2 2 474,350 0.4217/1/11-6/30/12 435,132 276,380 449,688 315,768 756,687 399,858 244,202 1 1 435,132 0.3857/1/12-6/30/13 393,905 368,202 451,550 439,877 544,325 301,644 271,111 4 4 393,905 0.3377/1/13-6/30/14 635,564 616,385 640,762 630,854 734,054 374,386 336,186 4 4 640,762 0.5447/1/14-6/30/15 549,675 497,512 630,610 622,947 725,113 179,885 135,676 71 71 630,610 0.521
Total 6,918,362 6,685,753 7,071,899 6,922,533 7,651,836 6,114,700 5,812,732 87 87 7,020,182
7/1/15-6/30/16 687,481 0.557
Notes:Column (1) is from Exhibit 2, Sheet 1, Column (3).Column (2) is from Exhibit 2, Sheet 3, Column (3).Column (3) is from Exhibit 2, Sheet 5, Column (5).Column (4) is from Exhibit 2, Sheet 6, Column (5).Column (5) is from Exhibit 2, Sheet 7, Column (6).Columns (6) and (7) provided by City of Virginia Beach.Column (8a) is from Exhibit 4, Sheet 1, Column (6).Column (8b) based on Column (8a) and individual claim detail.Column (9) based on Columns (1) through (8b) and actuarial judgment. Fiscal year 7/1/15-6/30/16 is from Exhibit 3, Sheet 1, Column (5).Column (10) equals Column (9) / Revenue (000's).
Oliver Wyman Actuarial Consulting, Inc.
53

Exhibit 2Sheet 1
City of Virginia BeachAnalysis of Unpaid Loss & ALAE at June 30, 2015
General LiabilityData as of June 30, 2015
Reported Loss & ALAE Development Method
Reported IndicatedLoss & ALAE Age to Ultimate Loss & ALAE
Fiscal as of Ultimate Loss & ALAE CostYears Retention 6/30/15 Factors (1) x (2) Revenue (000's) (3) / (4)
(1) (2) (3) (4) (5)
7/1/04-6/30/05 2,000,000 333,698 1.001 334,032 951,817 0.3517/1/05-6/30/06 2,000,000 513,271 1.002 514,298 985,307 0.5227/1/06-6/30/07 2,000,000 396,899 1.003 398,091 1,088,153 0.3667/1/07-6/30/08 2,000,000 1,307,018 1.004 1,312,254 1,140,564 1.1517/1/08-6/30/09 2,000,000 897,537 1.006 902,934 1,137,964 0.7937/1/09-6/30/10 2,000,000 952,811 1.016 968,127 1,139,279 0.8507/1/10-6/30/11 2,000,000 457,692 1.036 474,350 1,125,705 0.4217/1/11-6/30/12 2,000,000 399,858 1.088 435,132 1,130,045 0.3857/1/12-6/30/13 2,000,000 301,644 1.306 393,905 1,169,584 0.3377/1/13-6/30/14 2,000,000 374,386 1.698 635,564 1,177,491 0.5407/1/14-6/30/15 2,000,000 179,885 3.056 549,675 1,209,774 0.454
Total 6,114,700 6,918,362 12,255,682
Notes:Columns (1) and (4) provided by City of Virginia Beach.The age to ultimate factors in Column (2) are based on Exhibit 6, Sheet 5.
Loss & ALAE Limited to Retention
Oliver Wyman Actuarial Consulting, Inc.
54

Exhibit 2Sheet 2
City of Virginia BeachAnalysis of Unpaid Loss & ALAE at June 30, 2015
General LiabilityData as of June 30, 2015
Reported Loss & ALAE Development Method
Section I - Reported Loss & ALAE Limited to $250,000
Reported Estimated IndicatedLoss & ALAE Age to Ultimate Loss & ALAE
Fiscal as of Ultimate Loss & ALAE CostYears 6/30/15 Factors (1) x (2) Revenue (000's) (3) / (4)
(1) (2) (3) (4) (5)
7/1/04-6/30/05 333,698 1.000 333,698 951,817 0.3517/1/05-6/30/06 513,271 1.000 513,271 985,307 0.5217/1/06-6/30/07 396,899 1.001 397,296 1,088,153 0.3657/1/07-6/30/08 618,375 1.002 619,613 1,140,564 0.5437/1/08-6/30/09 652,001 1.003 653,959 1,137,964 0.5757/1/09-6/30/10 740,985 1.006 745,440 1,139,279 0.6547/1/10-6/30/11 457,692 1.013 463,667 1,125,705 0.4127/1/11-6/30/12 399,858 1.023 409,129 1,130,045 0.3627/1/12-6/30/13 301,644 1.126 339,501 1,169,584 0.2907/1/13-6/30/14 374,386 1.351 505,648 1,177,491 0.4297/1/14-6/30/15 179,885 2.026 364,429 1,209,774 0.301
Total 4,968,695 5,345,651 12,255,682
Section II - Reported Loss & ALAE Limited to $1,000,000
Reported Estimated IndicatedLoss & ALAE Age to Ultimate Loss & ALAE
Fiscal as of Ultimate Loss & ALAE CostYears 6/30/15 Factors (1) x (2) Revenue (000's) (3) / (4)
(1) (2) (3) (4) (5)
7/1/04-6/30/05 333,698 1.000 333,698 951,817 0.3517/1/05-6/30/06 513,271 1.001 513,784 985,307 0.5217/1/06-6/30/07 396,899 1.002 397,694 1,088,153 0.3657/1/07-6/30/08 1,307,018 1.003 1,310,943 1,140,564 1.1497/1/08-6/30/09 897,537 1.005 902,032 1,137,964 0.7937/1/09-6/30/10 952,811 1.010 962,372 1,139,279 0.8457/1/10-6/30/11 457,692 1.020 466,907 1,125,705 0.4157/1/11-6/30/12 399,858 1.046 418,107 1,130,045 0.3707/1/12-6/30/13 301,644 1.202 362,722 1,169,584 0.3107/1/13-6/30/14 374,386 1.503 562,742 1,177,491 0.4787/1/14-6/30/15 179,885 2.555 459,655 1,209,774 0.380
Total 6,114,700 6,690,656 12,255,682
Section III - Reported Loss & ALAE Limited to $2,000,000
Reported Estimated IndicatedLoss & ALAE Age to Ultimate Loss & ALAE
Fiscal as of Ultimate Loss & ALAE CostYears 6/30/15 Factors (1) x (2) Revenue (000's) (3) / (4)
(1) (2) (3) (4) (5)
7/1/04-6/30/05 333,698 1.001 334,032 951,817 0.3517/1/05-6/30/06 513,271 1.002 514,298 985,307 0.5227/1/06-6/30/07 396,899 1.003 398,091 1,088,153 0.3667/1/07-6/30/08 1,307,018 1.004 1,312,254 1,140,564 1.1517/1/08-6/30/09 897,537 1.006 902,934 1,137,964 0.7937/1/09-6/30/10 952,811 1.016 968,127 1,139,279 0.8507/1/10-6/30/11 457,692 1.036 474,350 1,125,705 0.4217/1/11-6/30/12 399,858 1.088 435,132 1,130,045 0.3857/1/12-6/30/13 301,644 1.306 393,905 1,169,584 0.3377/1/13-6/30/14 374,386 1.698 635,564 1,177,491 0.5407/1/14-6/30/15 179,885 3.056 549,675 1,209,774 0.454
Total 6,114,700 6,918,362 12,255,682
Notes:Columns (1) and (4) provided by City of Virginia Beach.The age to ultimate factors in Column (2) are based on Exhibit 6, Sheets 1, 3, and 5.
Oliver Wyman Actuarial Consulting, Inc.
55
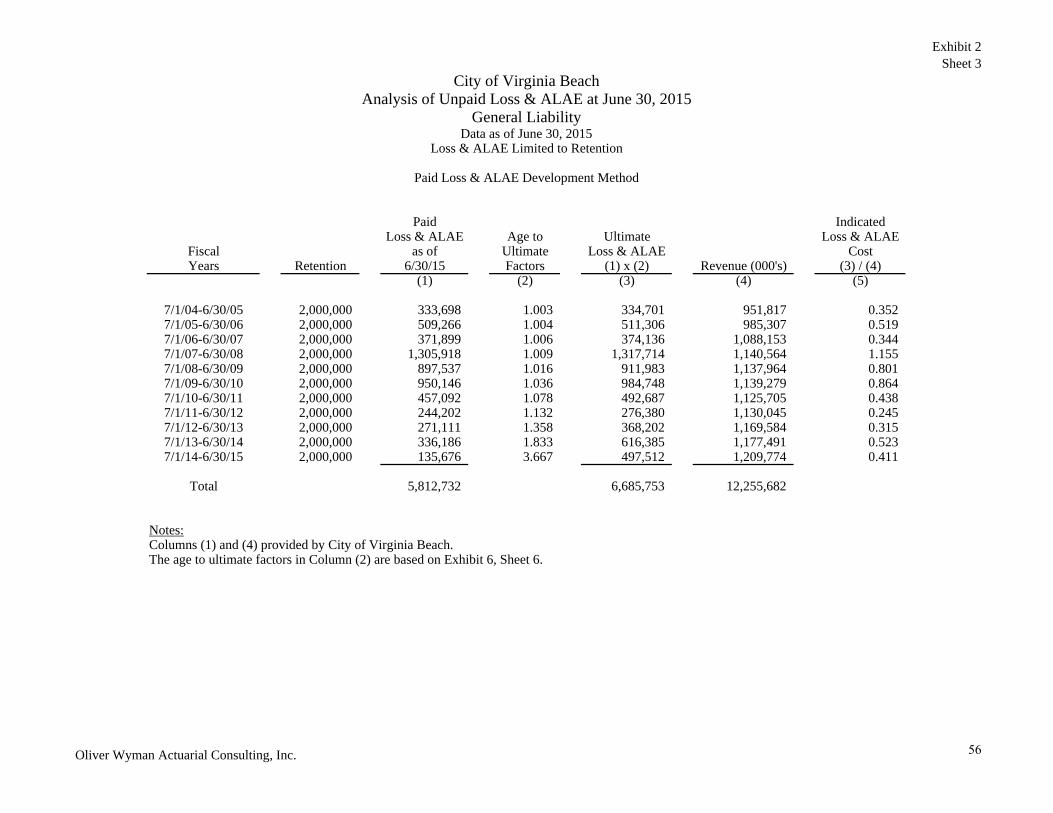
Exhibit 2Sheet 3
City of Virginia BeachAnalysis of Unpaid Loss & ALAE at June 30, 2015
General LiabilityData as of June 30, 2015
Paid Loss & ALAE Development Method
Paid IndicatedLoss & ALAE Age to Ultimate Loss & ALAE
Fiscal as of Ultimate Loss & ALAE CostYears Retention 6/30/15 Factors (1) x (2) Revenue (000's) (3) / (4)
(1) (2) (3) (4) (5)
7/1/04-6/30/05 2,000,000 333,698 1.003 334,701 951,817 0.3527/1/05-6/30/06 2,000,000 509,266 1.004 511,306 985,307 0.5197/1/06-6/30/07 2,000,000 371,899 1.006 374,136 1,088,153 0.3447/1/07-6/30/08 2,000,000 1,305,918 1.009 1,317,714 1,140,564 1.1557/1/08-6/30/09 2,000,000 897,537 1.016 911,983 1,137,964 0.8017/1/09-6/30/10 2,000,000 950,146 1.036 984,748 1,139,279 0.8647/1/10-6/30/11 2,000,000 457,092 1.078 492,687 1,125,705 0.4387/1/11-6/30/12 2,000,000 244,202 1.132 276,380 1,130,045 0.2457/1/12-6/30/13 2,000,000 271,111 1.358 368,202 1,169,584 0.3157/1/13-6/30/14 2,000,000 336,186 1.833 616,385 1,177,491 0.5237/1/14-6/30/15 2,000,000 135,676 3.667 497,512 1,209,774 0.411
Total 5,812,732 6,685,753 12,255,682
Notes:Columns (1) and (4) provided by City of Virginia Beach.The age to ultimate factors in Column (2) are based on Exhibit 6, Sheet 6.
Loss & ALAE Limited to Retention
Oliver Wyman Actuarial Consulting, Inc.
56
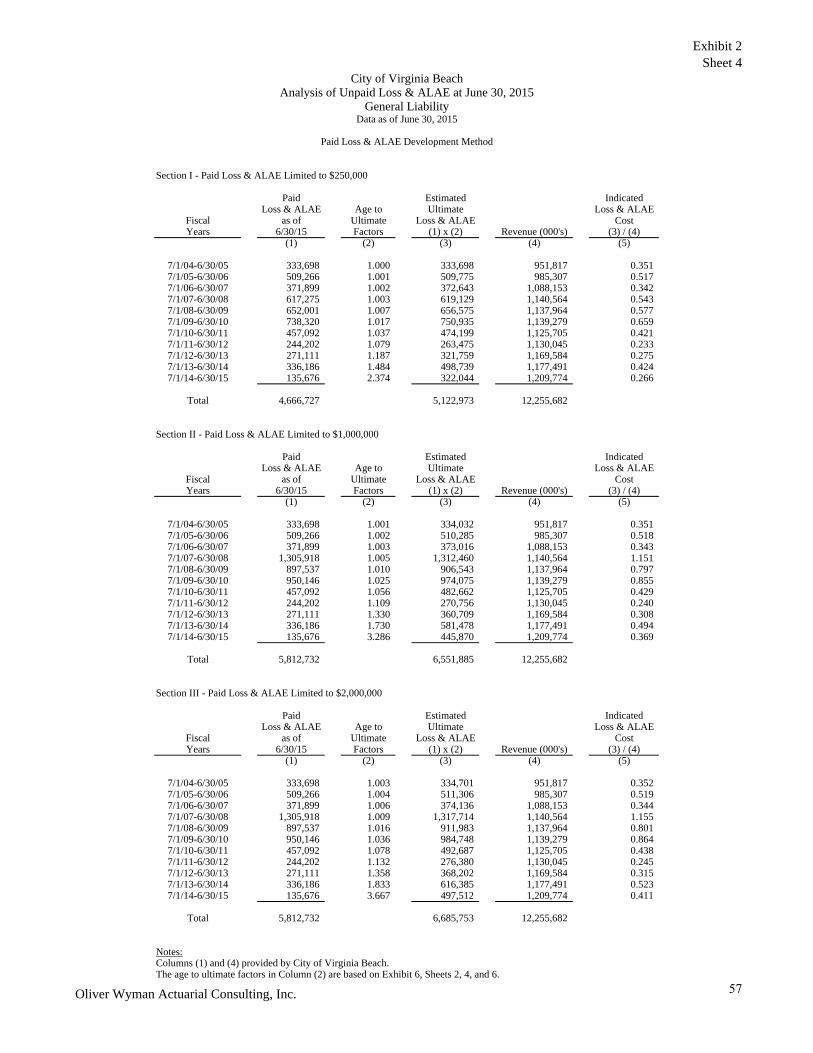
Exhibit 2Sheet 4
City of Virginia BeachAnalysis of Unpaid Loss & ALAE at June 30, 2015
General LiabilityData as of June 30, 2015
Paid Loss & ALAE Development Method
Section I - Paid Loss & ALAE Limited to $250,000
Paid Estimated IndicatedLoss & ALAE Age to Ultimate Loss & ALAE
Fiscal as of Ultimate Loss & ALAE CostYears 6/30/15 Factors (1) x (2) Revenue (000's) (3) / (4)
(1) (2) (3) (4) (5)
7/1/04-6/30/05 333,698 1.000 333,698 951,817 0.3517/1/05-6/30/06 509,266 1.001 509,775 985,307 0.5177/1/06-6/30/07 371,899 1.002 372,643 1,088,153 0.3427/1/07-6/30/08 617,275 1.003 619,129 1,140,564 0.5437/1/08-6/30/09 652,001 1.007 656,575 1,137,964 0.5777/1/09-6/30/10 738,320 1.017 750,935 1,139,279 0.6597/1/10-6/30/11 457,092 1.037 474,199 1,125,705 0.4217/1/11-6/30/12 244,202 1.079 263,475 1,130,045 0.2337/1/12-6/30/13 271,111 1.187 321,759 1,169,584 0.2757/1/13-6/30/14 336,186 1.484 498,739 1,177,491 0.4247/1/14-6/30/15 135,676 2.374 322,044 1,209,774 0.266
Total 4,666,727 5,122,973 12,255,682
Section II - Paid Loss & ALAE Limited to $1,000,000
Paid Estimated IndicatedLoss & ALAE Age to Ultimate Loss & ALAE
Fiscal as of Ultimate Loss & ALAE CostYears 6/30/15 Factors (1) x (2) Revenue (000's) (3) / (4)
(1) (2) (3) (4) (5)
7/1/04-6/30/05 333,698 1.001 334,032 951,817 0.3517/1/05-6/30/06 509,266 1.002 510,285 985,307 0.5187/1/06-6/30/07 371,899 1.003 373,016 1,088,153 0.3437/1/07-6/30/08 1,305,918 1.005 1,312,460 1,140,564 1.1517/1/08-6/30/09 897,537 1.010 906,543 1,137,964 0.7977/1/09-6/30/10 950,146 1.025 974,075 1,139,279 0.8557/1/10-6/30/11 457,092 1.056 482,662 1,125,705 0.4297/1/11-6/30/12 244,202 1.109 270,756 1,130,045 0.2407/1/12-6/30/13 271,111 1.330 360,709 1,169,584 0.3087/1/13-6/30/14 336,186 1.730 581,478 1,177,491 0.4947/1/14-6/30/15 135,676 3.286 445,870 1,209,774 0.369
Total 5,812,732 6,551,885 12,255,682
Section III - Paid Loss & ALAE Limited to $2,000,000
Paid Estimated IndicatedLoss & ALAE Age to Ultimate Loss & ALAE
Fiscal as of Ultimate Loss & ALAE CostYears 6/30/15 Factors (1) x (2) Revenue (000's) (3) / (4)
(1) (2) (3) (4) (5)
7/1/04-6/30/05 333,698 1.003 334,701 951,817 0.3527/1/05-6/30/06 509,266 1.004 511,306 985,307 0.5197/1/06-6/30/07 371,899 1.006 374,136 1,088,153 0.3447/1/07-6/30/08 1,305,918 1.009 1,317,714 1,140,564 1.1557/1/08-6/30/09 897,537 1.016 911,983 1,137,964 0.8017/1/09-6/30/10 950,146 1.036 984,748 1,139,279 0.8647/1/10-6/30/11 457,092 1.078 492,687 1,125,705 0.4387/1/11-6/30/12 244,202 1.132 276,380 1,130,045 0.2457/1/12-6/30/13 271,111 1.358 368,202 1,169,584 0.3157/1/13-6/30/14 336,186 1.833 616,385 1,177,491 0.5237/1/14-6/30/15 135,676 3.667 497,512 1,209,774 0.411
Total 5,812,732 6,685,753 12,255,682
Notes:Columns (1) and (4) provided by City of Virginia Beach.The age to ultimate factors in Column (2) are based on Exhibit 6, Sheets 2, 4, and 6.
Oliver Wyman Actuarial Consulting, Inc.
57

Exhibit 2Sheet 5
City of Virginia BeachAnalysis of Unpaid Loss & ALAE at June 30, 2015
General LiabilityData as of June 30, 2015
Loss & ALAE Limited to Retention
Reported Bornhuetter-Ferguson Method
Expected Reported EstimatedEstimate Age to Loss & ALAE Ultimate Indicated
Fiscal of Ultimate Ultimate Unreported as of Loss & ALAE Loss & ALAEYears Loss & ALAE Factors Loss & ALAE 6/30/15 (3) + (4) Cost
(1) (2) (3) (4) (5) (6)
7/1/04-6/30/05 496,514 1.001 496 333,698 334,194 0.3517/1/05-6/30/06 517,068 1.002 1,033 513,271 514,303 0.5227/1/06-6/30/07 574,466 1.003 1,720 396,899 398,619 0.3667/1/07-6/30/08 605,748 1.004 2,417 1,307,018 1,309,435 1.1487/1/08-6/30/09 607,993 1.006 3,635 897,537 901,171 0.7927/1/09-6/30/10 612,348 1.016 9,687 952,811 962,499 0.8457/1/10-6/30/11 608,682 1.036 21,375 457,692 479,067 0.4267/1/11-6/30/12 614,695 1.088 49,830 399,858 449,688 0.3987/1/12-6/30/13 640,020 1.306 149,906 301,644 451,550 0.3867/1/13-6/30/14 648,213 1.698 266,376 374,386 640,762 0.5447/1/14-6/30/15 669,981 3.056 450,725 179,885 630,610 0.521
Total 6,595,727 957,199 6,114,700 7,071,899
Notes:Column (1) is from Exhibit 3, Sheet 1, Column (5).The age to ultimate factors in Column (2) are based on Exhibit 6, Sheet 5.Column (3) equals Column (1) x [1.0 - 1.0 / Column (2)].Column (4) provided by City of Virginia Beach.Column (6) equals Column (5) / Revenue (000's).
Oliver Wyman Actuarial Consulting, Inc.
58
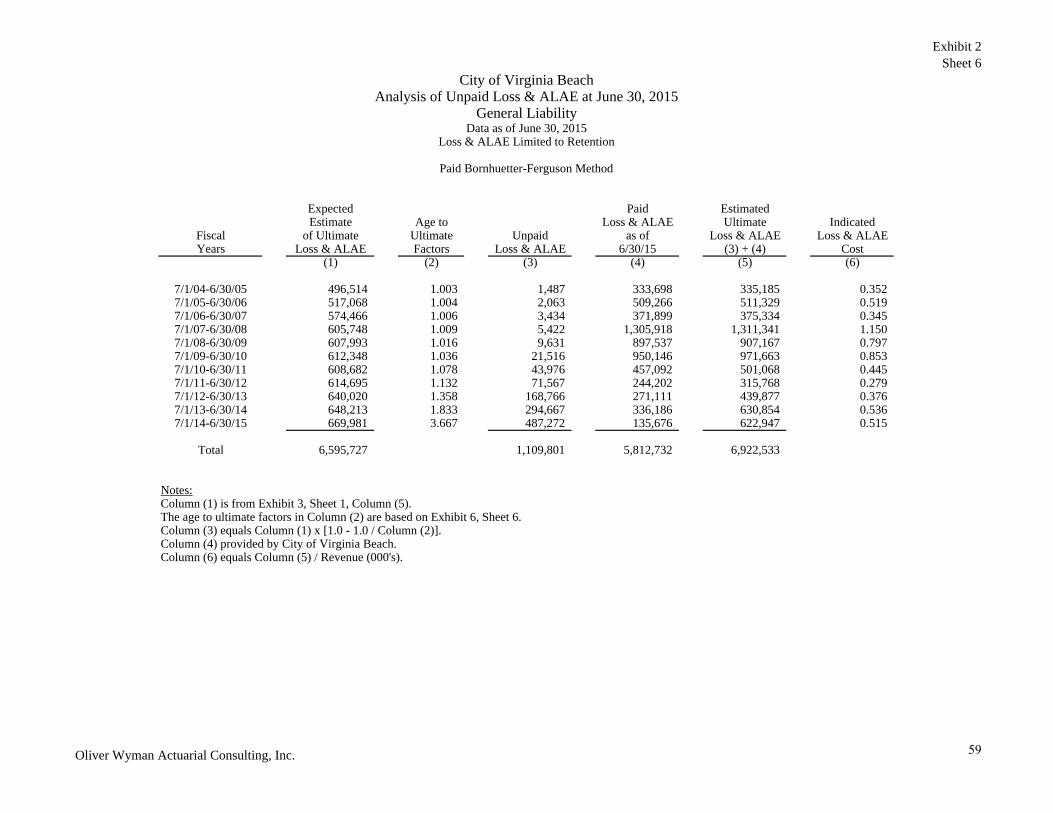
Exhibit 2Sheet 6
City of Virginia BeachAnalysis of Unpaid Loss & ALAE at June 30, 2015
General LiabilityData as of June 30, 2015
Loss & ALAE Limited to Retention
Paid Bornhuetter-Ferguson Method
Expected Paid EstimatedEstimate Age to Loss & ALAE Ultimate Indicated
Fiscal of Ultimate Ultimate Unpaid as of Loss & ALAE Loss & ALAEYears Loss & ALAE Factors Loss & ALAE 6/30/15 (3) + (4) Cost
(1) (2) (3) (4) (5) (6)
7/1/04-6/30/05 496,514 1.003 1,487 333,698 335,185 0.3527/1/05-6/30/06 517,068 1.004 2,063 509,266 511,329 0.5197/1/06-6/30/07 574,466 1.006 3,434 371,899 375,334 0.3457/1/07-6/30/08 605,748 1.009 5,422 1,305,918 1,311,341 1.1507/1/08-6/30/09 607,993 1.016 9,631 897,537 907,167 0.7977/1/09-6/30/10 612,348 1.036 21,516 950,146 971,663 0.8537/1/10-6/30/11 608,682 1.078 43,976 457,092 501,068 0.4457/1/11-6/30/12 614,695 1.132 71,567 244,202 315,768 0.2797/1/12-6/30/13 640,020 1.358 168,766 271,111 439,877 0.3767/1/13-6/30/14 648,213 1.833 294,667 336,186 630,854 0.5367/1/14-6/30/15 669,981 3.667 487,272 135,676 622,947 0.515
Total 6,595,727 1,109,801 5,812,732 6,922,533
Notes:Column (1) is from Exhibit 3, Sheet 1, Column (5).The age to ultimate factors in Column (2) are based on Exhibit 6, Sheet 6.Column (3) equals Column (1) x [1.0 - 1.0 / Column (2)].Column (4) provided by City of Virginia Beach.Column (6) equals Column (5) / Revenue (000's).
Oliver Wyman Actuarial Consulting, Inc.
59

Exhibit 2Sheet 7
City of Virginia BeachAnalysis of Unpaid Loss & ALAE at June 30, 2015
General LiabilityData as of June 30, 2015
Loss & ALAE Limited to Retention
Case Development Method
CasePaid Outstanding Percent Percent Incurred
Loss & ALAE Loss & ALAE of Ultimate of Ultimate But Not Estimated IndicatedFiscal as of as of Loss & ALAE Loss & ALAE Reported Ultimate Loss & ALAEYears 6/30/15 6/30/15 Reported Paid Loss & ALAE Loss & ALAE Cost
(1) (2) (3) (4) (5) (6) (7)
7/1/04-6/30/05 333,698 0 99.9% 99.7% 0 333,698 0.3517/1/05-6/30/06 509,266 4,005 99.8% 99.6% 4,013 517,284 0.5257/1/06-6/30/07 371,899 25,000 99.7% 99.4% 25,083 421,983 0.3887/1/07-6/30/08 1,305,918 1,100 99.6% 99.1% 885 1,307,903 1.1477/1/08-6/30/09 897,537 0 99.4% 98.4% 0 897,537 0.7897/1/09-6/30/10 950,146 2,665 98.4% 96.5% 2,182 954,994 0.8387/1/10-6/30/11 457,092 600 96.5% 92.8% 567 458,259 0.4077/1/11-6/30/12 244,202 155,657 91.9% 88.4% 356,828 756,687 0.6707/1/12-6/30/13 271,111 30,533 76.6% 73.6% 242,681 544,325 0.4657/1/13-6/30/14 336,186 38,200 58.9% 54.5% 359,667 734,054 0.6237/1/14-6/30/15 135,676 44,209 32.7% 27.3% 545,228 725,113 0.599
Total 5,812,732 301,968 1,537,136 7,651,836
Notes:Columns (1) and (2) provided by City of Virginia Beach.The factors in Column (3) equal 1.0 / Exhibit 2, Sheet 1, Column (2).The factors in Column (4) equal 1.0 / Exhibit 2, Sheet 3, Column (2).Column (5) equals Column (2) x [1.0 - Column (3)] / [Column (3) - Column (4)].Column (6) equals Column (1) + Column (2) + Column (5).Column (7) equals Column (6) / Revenue (000's).
Oliver Wyman Actuarial Consulting, Inc.
60
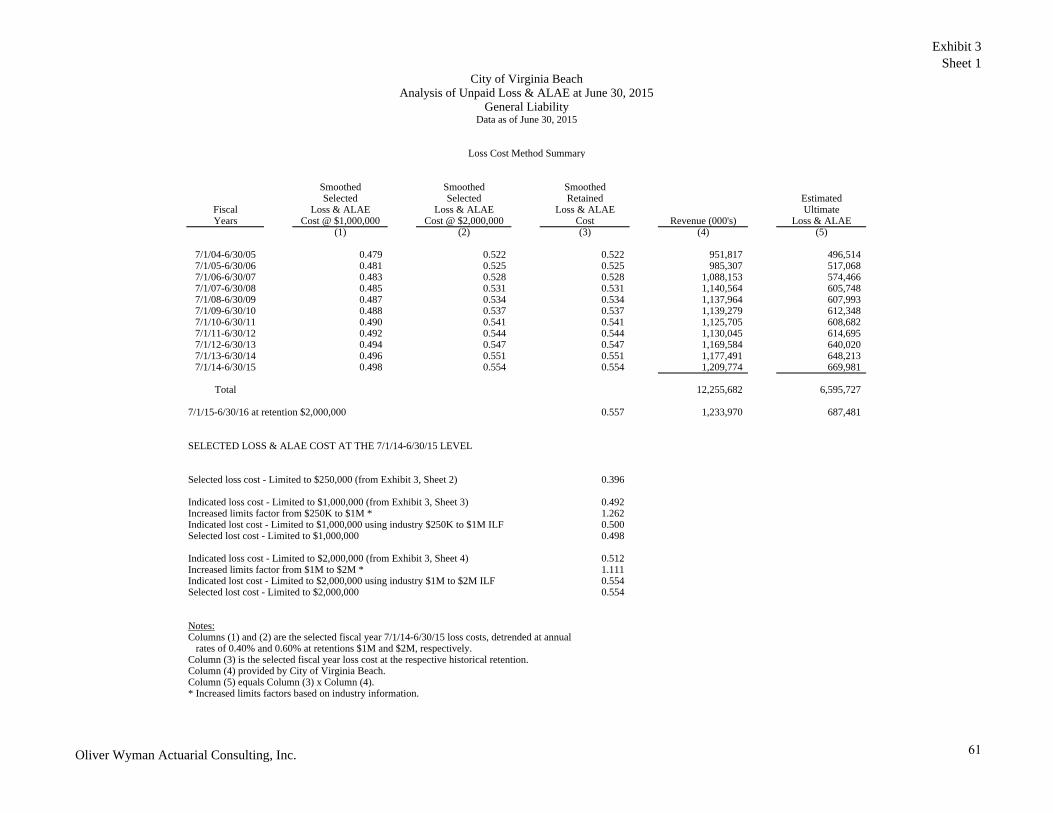
Exhibit 3Sheet 1
City of Virginia BeachAnalysis of Unpaid Loss & ALAE at June 30, 2015
General LiabilityData as of June 30, 2015
Loss Cost Method Summary
Smoothed Smoothed SmoothedSelected Selected Retained Estimated
Fiscal Loss & ALAE Loss & ALAE Loss & ALAE UltimateYears Cost @ $1,000,000 Cost @ $2,000,000 Cost Revenue (000's) Loss & ALAE
(1) (2) (3) (4) (5)
7/1/04-6/30/05 0.479 0.522 0.522 951,817 496,5147/1/05-6/30/06 0.481 0.525 0.525 985,307 517,0687/1/06-6/30/07 0.483 0.528 0.528 1,088,153 574,4667/1/07-6/30/08 0.485 0.531 0.531 1,140,564 605,7487/1/08-6/30/09 0.487 0.534 0.534 1,137,964 607,9937/1/09-6/30/10 0.488 0.537 0.537 1,139,279 612,3487/1/10-6/30/11 0.490 0.541 0.541 1,125,705 608,6827/1/11-6/30/12 0.492 0.544 0.544 1,130,045 614,6957/1/12-6/30/13 0.494 0.547 0.547 1,169,584 640,0207/1/13-6/30/14 0.496 0.551 0.551 1,177,491 648,2137/1/14-6/30/15 0.498 0.554 0.554 1,209,774 669,981
Total 12,255,682 6,595,727
7/1/15-6/30/16 at retention $2,000,000 0.557 1,233,970 687,481
SELECTED LOSS & ALAE COST AT THE 7/1/14-6/30/15 LEVEL
Selected loss cost - Limited to $250,000 (from Exhibit 3, Sheet 2) 0.396
Indicated loss cost - Limited to $1,000,000 (from Exhibit 3, Sheet 3) 0.492Increased limits factor from $250K to $1M * 1.262 Indicated lost cost - Limited to $1,000,000 using industry $250K to $1M ILF 0.500Selected lost cost - Limited to $1,000,000 0.498
Indicated loss cost - Limited to $2,000,000 (from Exhibit 3, Sheet 4) 0.512Increased limits factor from $1M to $2M * 1.111 Indicated lost cost - Limited to $2,000,000 using industry $1M to $2M ILF 0.554Selected lost cost - Limited to $2,000,000 0.554
Notes:Columns (1) and (2) are the selected fiscal year 7/1/14-6/30/15 loss costs, detrended at annual rates of 0.40% and 0.60% at retentions $1M and $2M, respectively.Column (3) is the selected fiscal year loss cost at the respective historical retention.Column (4) provided by City of Virginia Beach.Column (5) equals Column (3) x Column (4).* Increased limits factors based on industry information.
Oliver Wyman Actuarial Consulting, Inc.
61
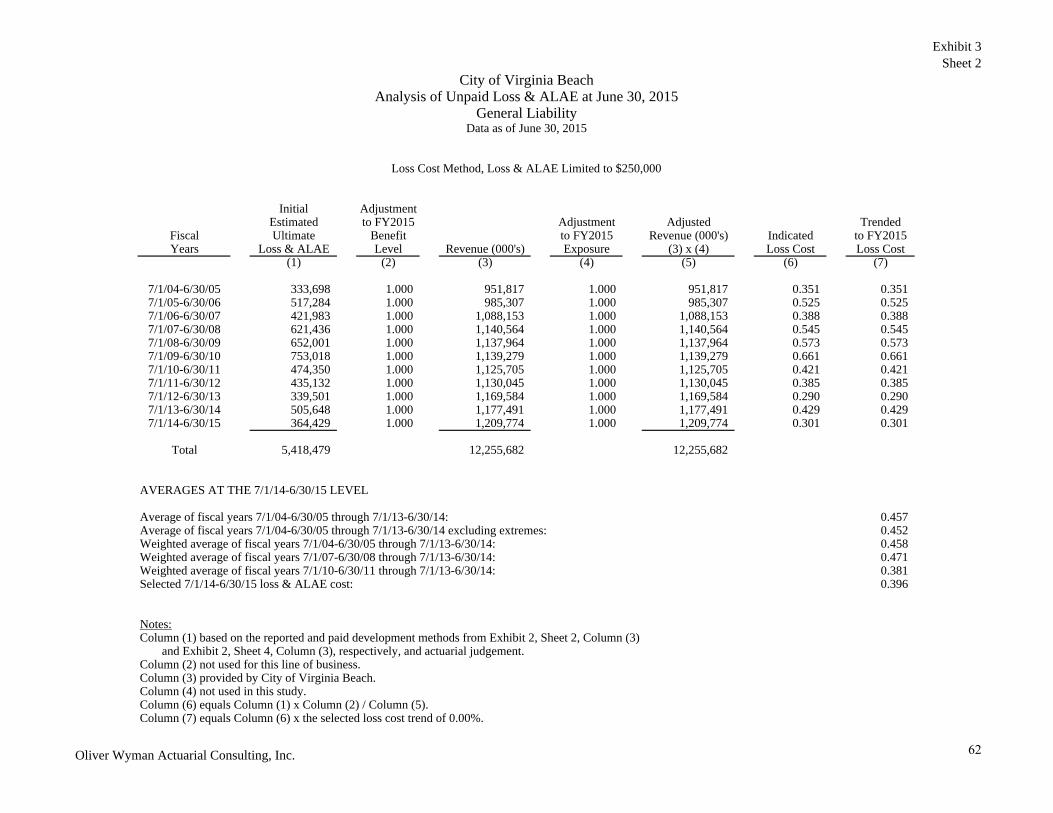
Exhibit 3Sheet 2
City of Virginia BeachAnalysis of Unpaid Loss & ALAE at June 30, 2015
General LiabilityData as of June 30, 2015
Loss Cost Method, Loss & ALAE Limited to $250,000
Initial AdjustmentEstimated to FY2015 Adjustment Adjusted Trended
Fiscal Ultimate Benefit to FY2015 Revenue (000's) Indicated to FY2015Years Loss & ALAE Level Revenue (000's) Exposure (3) x (4) Loss Cost Loss Cost
(1) (2) (3) (4) (5) (6) (7)
7/1/04-6/30/05 333,698 1.000 951,817 1.000 951,817 0.351 0.3517/1/05-6/30/06 517,284 1.000 985,307 1.000 985,307 0.525 0.5257/1/06-6/30/07 421,983 1.000 1,088,153 1.000 1,088,153 0.388 0.3887/1/07-6/30/08 621,436 1.000 1,140,564 1.000 1,140,564 0.545 0.5457/1/08-6/30/09 652,001 1.000 1,137,964 1.000 1,137,964 0.573 0.5737/1/09-6/30/10 753,018 1.000 1,139,279 1.000 1,139,279 0.661 0.6617/1/10-6/30/11 474,350 1.000 1,125,705 1.000 1,125,705 0.421 0.4217/1/11-6/30/12 435,132 1.000 1,130,045 1.000 1,130,045 0.385 0.3857/1/12-6/30/13 339,501 1.000 1,169,584 1.000 1,169,584 0.290 0.2907/1/13-6/30/14 505,648 1.000 1,177,491 1.000 1,177,491 0.429 0.4297/1/14-6/30/15 364,429 1.000 1,209,774 1.000 1,209,774 0.301 0.301
Total 5,418,479 12,255,682 12,255,682
AVERAGES AT THE 7/1/14-6/30/15 LEVEL
Average of fiscal years 7/1/04-6/30/05 through 7/1/13-6/30/14: 0.457Average of fiscal years 7/1/04-6/30/05 through 7/1/13-6/30/14 excluding extremes: 0.452Weighted average of fiscal years 7/1/04-6/30/05 through 7/1/13-6/30/14: 0.458Weighted average of fiscal years 7/1/07-6/30/08 through 7/1/13-6/30/14: 0.471Weighted average of fiscal years 7/1/10-6/30/11 through 7/1/13-6/30/14: 0.381Selected 7/1/14-6/30/15 loss & ALAE cost: 0.396
Notes:Column (1) based on the reported and paid development methods from Exhibit 2, Sheet 2, Column (3)
and Exhibit 2, Sheet 4, Column (3), respectively, and actuarial judgement.Column (2) not used for this line of business.Column (3) provided by City of Virginia Beach.Column (4) not used in this study.Column (6) equals Column (1) x Column (2) / Column (5).Column (7) equals Column (6) x the selected loss cost trend of 0.00%.
Oliver Wyman Actuarial Consulting, Inc.
62

Exhibit 3Sheet 3
Initial AdjustmentEstimated to FY2015 Adjustment Adjusted Trended
Fiscal Ultimate Benefit to FY2015 Revenue (000's) Indicated to FY2015Years Loss & ALAE Level Revenue (000's) Exposure (3) x (4) Loss Cost Loss Cost
(1) (2) (3) (4) (5) (6) (7)
7/1/04-6/30/05 333,698 1.000 951,817 1.000 951,817 0.351 0.3657/1/05-6/30/06 517,284 1.000 985,307 1.000 985,307 0.525 0.5447/1/06-6/30/07 421,983 1.000 1,088,153 1.000 1,088,153 0.388 0.4007/1/07-6/30/08 1,310,079 1.000 1,140,564 1.000 1,140,564 1.149 1.1817/1/08-6/30/09 897,537 1.000 1,137,964 1.000 1,137,964 0.789 0.8087/1/09-6/30/10 964,844 1.000 1,139,279 1.000 1,139,279 0.847 0.8647/1/10-6/30/11 474,350 1.000 1,125,705 1.000 1,125,705 0.421 0.4287/1/11-6/30/12 435,132 1.000 1,130,045 1.000 1,130,045 0.385 0.3907/1/12-6/30/13 362,722 1.000 1,169,584 1.000 1,169,584 0.310 0.3137/1/13-6/30/14 562,742 1.000 1,177,491 1.000 1,177,491 0.478 0.4807/1/14-6/30/15 459,655 1.000 1,209,774 1.000 1,209,774 0.380 0.380
Total 6,740,024 12,255,682 12,255,682
AVERAGES AT THE 7/1/14-6/30/15 LEVEL
Average of fiscal years 7/1/04-6/30/05 through 7/1/13-6/30/14: 0.577Average of fiscal years 7/1/04-6/30/05 through 7/1/13-6/30/14 excluding extremes: 0.535Weighted average of fiscal years 7/1/04-6/30/05 through 7/1/13-6/30/14: 0.581Weighted average of fiscal years 7/1/07-6/30/08 through 7/1/13-6/30/14: 0.636Weighted average of fiscal years 7/1/10-6/30/11 through 7/1/13-6/30/14: 0.403Indicated 7/1/14-6/30/15 loss & ALAE cost: 0.492
Notes:Column (1) based on the reported and paid development methods from Exhibit 2, Sheet 2, Column (3)
and Exhibit 2, Sheet 4, Column (3), respectively, and actuarial judgement.Column (2) not used for this line of business.Column (3) provided by City of Virginia Beach.Column (4) not used in this study.Column (6) equals Column (1) x Column (2) / Column (5).Column (7) equals Column (6) x the selected loss cost trend of 0.40%.
Loss Cost Method, Loss & ALAE Limited to $1,000,000
City of Virginia BeachAnalysis of Unpaid Loss & ALAE at June 30, 2015
General LiabilityData as of June 30, 2015
Oliver Wyman Actuarial Consulting, Inc.
63

Exhibit 3Sheet 4
Initial AdjustmentEstimated to FY2015 Adjustment Adjusted Trended
Fiscal Ultimate Benefit to FY2015 Revenue (000's) Indicated to FY2015Years Loss & ALAE Level Revenue (000's) Exposure (3) x (4) Loss Cost Loss Cost
(1) (2) (3) (4) (5) (6) (7)
7/1/04-6/30/05 333,698 1.000 951,817 1.000 951,817 0.351 0.3727/1/05-6/30/06 517,284 1.000 985,307 1.000 985,307 0.525 0.5547/1/06-6/30/07 421,983 1.000 1,088,153 1.000 1,088,153 0.388 0.4077/1/07-6/30/08 1,310,079 1.000 1,140,564 1.000 1,140,564 1.149 1.1987/1/08-6/30/09 897,537 1.000 1,137,964 1.000 1,137,964 0.789 0.8187/1/09-6/30/10 964,844 1.000 1,139,279 1.000 1,139,279 0.847 0.8737/1/10-6/30/11 474,350 1.000 1,125,705 1.000 1,125,705 0.421 0.4327/1/11-6/30/12 435,132 1.000 1,130,045 1.000 1,130,045 0.385 0.3927/1/12-6/30/13 393,905 1.000 1,169,584 1.000 1,169,584 0.337 0.3417/1/13-6/30/14 635,564 1.000 1,177,491 1.000 1,177,491 0.540 0.5437/1/14-6/30/15 549,675 1.000 1,209,774 1.000 1,209,774 0.454 0.454
Total 6,934,049 12,255,682 12,255,682
AVERAGES AT THE 7/1/14-6/30/15 LEVEL
Average of fiscal years 7/1/04-6/30/05 through 7/1/13-6/30/14: 0.593Average of fiscal years 7/1/04-6/30/05 through 7/1/13-6/30/14 excluding extremes: 0.549Weighted average of fiscal years 7/1/04-6/30/05 through 7/1/13-6/30/14: 0.598Weighted average of fiscal years 7/1/07-6/30/08 through 7/1/13-6/30/14: 0.655Weighted average of fiscal years 7/1/10-6/30/11 through 7/1/13-6/30/14: 0.427Indicated 7/1/14-6/30/15 loss & ALAE cost: 0.512
Notes:Column (1) based on the reported and paid development methods from Exhibit 2, Sheet 2, Column (3)
and Exhibit 2, Sheet 4, Column (3), respectively, and actuarial judgement.Column (2) not used for this line of business.Column (3) provided by City of Virginia Beach.Column (4) not used in this study.Column (6) equals Column (1) x Column (2) / Column (5).Column (7) equals Column (6) x the selected loss cost trend of 0.60%.
Loss Cost Method, Loss & ALAE Limited to $2,000,000
City of Virginia BeachAnalysis of Unpaid Loss & ALAE at June 30, 2015
General LiabilityData as of June 30, 2015
Oliver Wyman Actuarial Consulting, Inc.
64

Exhibit 3Sheet 5
City of Virginia BeachAnalysis of Unpaid Loss & ALAE at June 30, 2015
General LiabilityData as of June 30, 2015
Loss & ALAE Limited to $250,000
Average Severity Method
Initial Adjustment Trended EstimatedEstimated to FY2015 Selected Indicated to FY2015 Ultimate Indicated
Fiscal Ultimate Benefit Ultimate Average Average Fitted Loss & ALAE Loss & ALAEYears Loss & ALAE Level Claim Counts Severity Severity Severity (3) x (6) Cost
(1) (2) (3) (4) (5) (6) (7) (8)
7/1/04-6/30/05 333,698 1.000 210 1,589 1,589 2,887 606,320 0.6377/1/05-6/30/06 517,284 1.000 178 2,906 2,906 2,887 513,928 0.5227/1/06-6/30/07 421,983 1.000 189 2,233 2,233 2,887 545,688 0.5017/1/07-6/30/08 621,436 1.000 147 4,227 4,227 2,887 424,424 0.3727/1/08-6/30/09 652,001 1.000 160 4,075 4,075 2,887 461,958 0.4067/1/09-6/30/10 753,018 1.000 171 4,404 4,404 2,887 493,717 0.4337/1/10-6/30/11 474,350 1.000 188 2,523 2,523 2,887 542,800 0.4827/1/11-6/30/12 435,132 1.000 143 3,043 3,043 2,887 412,875 0.3657/1/12-6/30/13 339,501 1.000 141 2,409 2,409 2,887 406,919 0.3487/1/13-6/30/14 505,648 1.000 160 3,166 3,166 2,887 461,074 0.3927/1/14-6/30/15 364,429 1.000 179 2,040 2,040 2,887 515,747 0.426
Total 5,418,479 1,865 5,385,448
AVERAGES AT THE 7/1/14-6/30/15 LEVEL
Average of fiscal years 7/1/04-6/30/05 through 7/1/13-6/30/14: 3,058Average of fiscal years 7/1/04-6/30/05 through 7/1/13-6/30/14 excluding extremes: 3,073Weighted average of fiscal years 7/1/04-6/30/05 through 7/1/13-6/30/14: 2,997Weighted average of fiscal years 7/1/07-6/30/08 through 7/1/13-6/30/14: 3,408Weighted average of fiscal years 7/1/10-6/30/11 through 7/1/13-6/30/14: 2,778Selected 7/1/14-6/30/15 severity: 2,887
Notes:Column (1) based on the reported and paid development methods from Exhibit 2, Sheet 2, Column (3)
and Exhibit 2, Sheet 4, Column (3), respectively, and actuarial judgment.Column (2) not used for this line of business.Column (3) is from Exhibit 4, Sheet 1, Column (3).Column (4) equals Column (1) x Column (2) / Column (3).Column (5) equals Column (4) x the selected severity trend of 0.00%.Column (6) for all fiscal years is the selected fiscal year 7/1/14-6/30/15 severity,
detrended at an annual rate of 0.00%, and adjusted to the appropriate benefit level (if applicable).Column (8) equals Column (7) / Revenue (000's).
Oliver Wyman Actuarial Consulting, Inc.
65

Exhibit 3Sheet 6
City of Virginia BeachAnalysis of Unpaid Loss & ALAE at June 30, 2015
General LiabilityData as of June 30, 2015
FREQUENCY TREND
SEVERITY TREND
LOSS COST TREND
Notes:The selected frequency trend is 0.00%.The selected severity trend is 0.00%.The selected loss cost trend is 0.00%.The severity and loss cost trends (for both Indicated and Fitted lines) are shown at a $250,000 per occurrence limit.
0.000
0.050
0.100
0.150
0.200
0.250
2005 2006 2007 2008 2009 2010 2011 2012 2013 2014 2015
FREQ
UEN
CY
0
1,000
2,000
3,000
4,000
5,000
2005 2006 2007 2008 2009 2010 2011 2012 2013 2014 2015
SEVER
ITY
0.000
0.100
0.200
0.300
0.400
0.500
0.600
0.700
2005 2006 2007 2008 2009 2010 2011 2012 2013 2014 2015
LOSS COST
FISCAL YEAR ENDINGIndicated Fitted
Oliver Wyman Actuarial Consulting, Inc.
66

Exhibit 4Sheet 1
City of Virginia BeachAnalysis of Unpaid Loss & ALAE at June 30, 2015
General LiabilityData as of June 30, 2015
Estimate of Ultimate Claim Counts
Reported Reported Closed Implied OpenClaim Bornhuetter- Selected Claim Counts and IBNR
Fiscal Development Ferguson Ultimate Implied as of Claim CountsYears Method Method Claim Counts Frequency 6/30/15 (3) - (5)
(1) (2) (3) (4) (5) (6)
7/1/04-6/30/05 210 210 210 0.221 210 07/1/05-6/30/06 178 178 178 0.181 177 17/1/06-6/30/07 189 189 189 0.174 188 17/1/07-6/30/08 147 147 147 0.129 145 27/1/08-6/30/09 160 160 160 0.141 160 07/1/09-6/30/10 171 171 171 0.150 169 27/1/10-6/30/11 188 188 188 0.167 186 27/1/11-6/30/12 143 143 143 0.127 142 17/1/12-6/30/13 141 141 141 0.121 137 47/1/13-6/30/14 160 160 160 0.136 156 47/1/14-6/30/15 177 179 179 0.148 108 71
Total 1,864 1,866 1,865 0.152 1,778 87
Notes:Columns (1) and (2) are from Exhibit 4, Sheet 2, Columns (3) and (8), respectively.Column (3) based on Columns (1) and (2) and actuarial judgment.Column (4) equals Column (3) / Revenue (000's) x 1,000.Column (5) provided by City of Virginia Beach.
Oliver Wyman Actuarial Consulting, Inc.
67
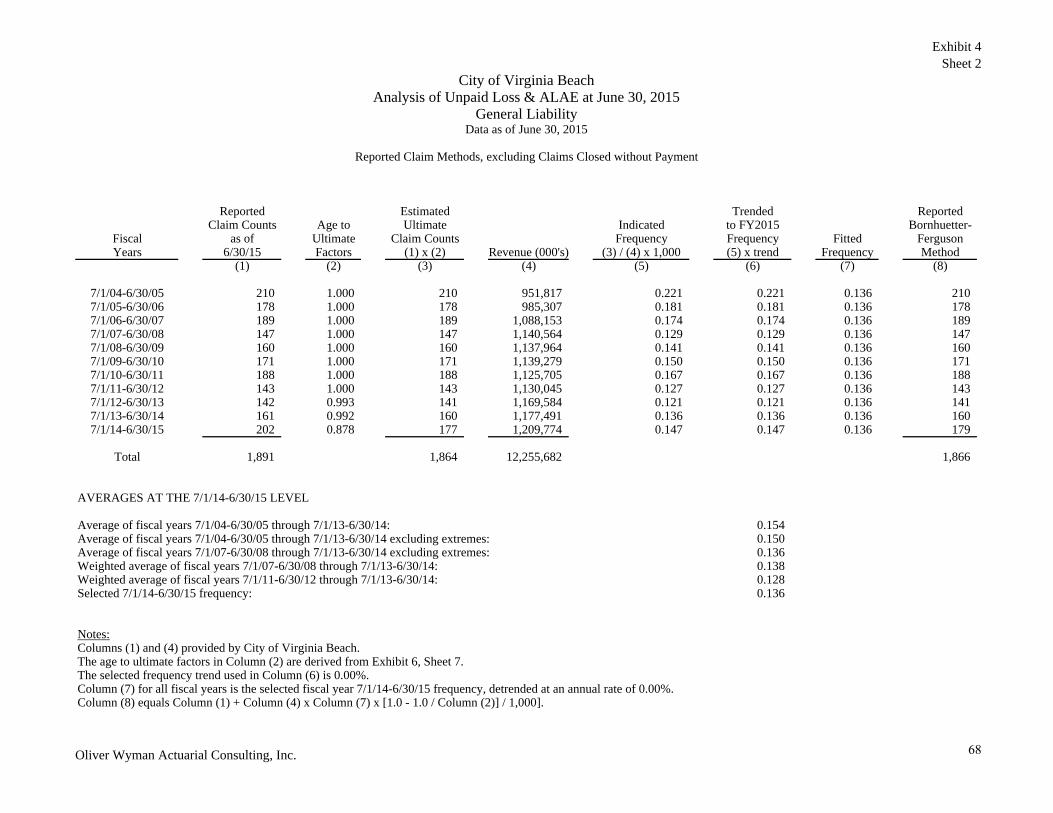
Exhibit 4Sheet 2
City of Virginia BeachAnalysis of Unpaid Loss & ALAE at June 30, 2015
General LiabilityData as of June 30, 2015
Reported Claim Methods, excluding Claims Closed without Payment
Reported Estimated Trended ReportedClaim Counts Age to Ultimate Indicated to FY2015 Bornhuetter-
Fiscal as of Ultimate Claim Counts Frequency Frequency Fitted FergusonYears 6/30/15 Factors (1) x (2) Revenue (000's) (3) / (4) x 1,000 (5) x trend Frequency Method
(1) (2) (3) (4) (5) (6) (7) (8)
7/1/04-6/30/05 210 1.000 210 951,817 0.221 0.221 0.136 2107/1/05-6/30/06 178 1.000 178 985,307 0.181 0.181 0.136 1787/1/06-6/30/07 189 1.000 189 1,088,153 0.174 0.174 0.136 1897/1/07-6/30/08 147 1.000 147 1,140,564 0.129 0.129 0.136 1477/1/08-6/30/09 160 1.000 160 1,137,964 0.141 0.141 0.136 1607/1/09-6/30/10 171 1.000 171 1,139,279 0.150 0.150 0.136 1717/1/10-6/30/11 188 1.000 188 1,125,705 0.167 0.167 0.136 1887/1/11-6/30/12 143 1.000 143 1,130,045 0.127 0.127 0.136 1437/1/12-6/30/13 142 0.993 141 1,169,584 0.121 0.121 0.136 1417/1/13-6/30/14 161 0.992 160 1,177,491 0.136 0.136 0.136 1607/1/14-6/30/15 202 0.878 177 1,209,774 0.147 0.147 0.136 179
Total 1,891 1,864 12,255,682 1,866
AVERAGES AT THE 7/1/14-6/30/15 LEVEL
Average of fiscal years 7/1/04-6/30/05 through 7/1/13-6/30/14: 0.154Average of fiscal years 7/1/04-6/30/05 through 7/1/13-6/30/14 excluding extremes: 0.150Average of fiscal years 7/1/07-6/30/08 through 7/1/13-6/30/14 excluding extremes: 0.136Weighted average of fiscal years 7/1/07-6/30/08 through 7/1/13-6/30/14: 0.138Weighted average of fiscal years 7/1/11-6/30/12 through 7/1/13-6/30/14: 0.128Selected 7/1/14-6/30/15 frequency: 0.136
Notes:Columns (1) and (4) provided by City of Virginia Beach.The age to ultimate factors in Column (2) are derived from Exhibit 6, Sheet 7.The selected frequency trend used in Column (6) is 0.00%.Column (7) for all fiscal years is the selected fiscal year 7/1/14-6/30/15 frequency, detrended at an annual rate of 0.00%.Column (8) equals Column (1) + Column (4) x Column (7) x [1.0 - 1.0 / Column (2)] / 1,000].
Oliver Wyman Actuarial Consulting, Inc.
68

Exhibit 5Sheet 1
City of Virginia BeachAnalysis of Unpaid Loss & ALAE at June 30, 2015
General LiabilityData as of June 30, 2015
Summary of Loss Data Valued as of June 30, 2015
Reported* Open Unlimited Loss & ALAE Loss & ALAE Excess of $250K Loss & ALAE Excess of $1M Loss & ALAE Excess of $2MFiscal Claim Claim CaseYears Retention Counts Counts Paid Reserves Reported Paid Reported Paid Reported Paid Reported
(1) (2) (3) (4) (5) (6) (7) (8) (9) (10) (11)
7/1/04-6/30/05 2,000,000 210 0 333,698 0 333,698 0 0 0 0 0 07/1/05-6/30/06 2,000,000 178 1 509,266 4,005 513,271 0 0 0 0 0 07/1/06-6/30/07 2,000,000 189 1 371,899 25,000 396,899 0 0 0 0 0 07/1/07-6/30/08 2,000,000 147 2 1,305,918 1,100 1,307,018 688,643 688,643 0 0 0 07/1/08-6/30/09 2,000,000 160 0 897,537 0 897,537 245,535 245,535 0 0 0 07/1/09-6/30/10 2,000,000 171 2 950,146 2,665 952,811 211,826 211,826 0 0 0 07/1/10-6/30/11 2,000,000 188 2 457,092 600 457,692 0 0 0 0 0 07/1/11-6/30/12 2,000,000 143 1 244,202 155,657 399,858 0 0 0 0 0 07/1/12-6/30/13 2,000,000 142 5 271,111 30,533 301,644 0 0 0 0 0 07/1/13-6/30/14 2,000,000 161 5 336,186 38,200 374,386 0 0 0 0 0 07/1/14-6/30/15 2,000,000 202 94 135,676 44,209 179,885 0 0 0 0 0 0
Total 1,891 113 5,812,732 301,968 6,114,700 1,146,005 1,146,005 0 0 0 0
Loss & ALAE Limited to $250,000 Loss & ALAE Limited to $1,000,000 Loss & ALAE Limited to $2,000,000 Loss & ALAE Limited to RetentionFiscal Case Case Case CaseYears Paid Reserves Reported Paid Reserves Reported Paid Reserves Reported Paid Reserves Reported
(12) (13) (14) (15) (16) (17) (18) (19) (20) (21) (22) (23)
7/1/04-6/30/05 333,698 0 333,698 333,698 0 333,698 333,698 0 333,698 333,698 0 333,6987/1/05-6/30/06 509,266 4,005 513,271 509,266 4,005 513,271 509,266 4,005 513,271 509,266 4,005 513,2717/1/06-6/30/07 371,899 25,000 396,899 371,899 25,000 396,899 371,899 25,000 396,899 371,899 25,000 396,8997/1/07-6/30/08 617,275 1,100 618,375 1,305,918 1,100 1,307,018 1,305,918 1,100 1,307,018 1,305,918 1,100 1,307,0187/1/08-6/30/09 652,001 0 652,001 897,537 0 897,537 897,537 0 897,537 897,537 0 897,5377/1/09-6/30/10 738,320 2,665 740,985 950,146 2,665 952,811 950,146 2,665 952,811 950,146 2,665 952,8117/1/10-6/30/11 457,092 600 457,692 457,092 600 457,692 457,092 600 457,692 457,092 600 457,6927/1/11-6/30/12 244,202 155,657 399,858 244,202 155,657 399,858 244,202 155,657 399,858 244,202 155,657 399,8587/1/12-6/30/13 271,111 30,533 301,644 271,111 30,533 301,644 271,111 30,533 301,644 271,111 30,533 301,6447/1/13-6/30/14 336,186 38,200 374,386 336,186 38,200 374,386 336,186 38,200 374,386 336,186 38,200 374,3867/1/14-6/30/15 135,676 44,209 179,885 135,676 44,209 179,885 135,676 44,209 179,885 135,676 44,209 179,885
Total 4,666,727 301,968 4,968,695 5,812,732 301,968 6,114,700 5,812,732 301,968 6,114,700 5,812,732 301,968 6,114,700
Notes:Columns (1) through (23) provided by City of Virginia Beach.* Reported claim count excludes claims closed without payment.
Oliver Wyman Actuarial Consulting, Inc.
69

Exhibit 5Sheet 2
Fiscal Date of Claim ClaimYear Loss Number Status Paid Reported Retention Paid Reported
2006 9/14/2005 GL076703 Closed 173,268 173,268 2,000,000 173,268 173,268 2008 12/28/2007 GL077575 Closed 938,643 938,643 2,000,000 938,643 938,643 2009 1/1/2009 GL081830 Closed 495,535 495,535 2,000,000 495,535 495,535 2010 2/6/2010 GL079173 Closed 461,826 461,826 2,000,000 461,826 461,826 2011 7/11/2010 GL079476 Closed 129,246 129,246 2,000,000 129,246 129,246 2012 9/1/2011 GL080693 Open 6,844 162,500 2,000,000 6,844 162,500
Loss & ALAE Limited to Retention
Unlimited Loss & ALAE Loss & ALAE Limited to Retention
Detail of Large Losses with Combined Loss & ALAE Greater than $100,000
City of Virginia BeachAnalysis of Unpaid Loss & ALAE at June 30, 2015
General LiabilityData as of June 30, 2015
Oliver Wyman Actuarial Consulting, Inc.
70

Exhibit 6Sheet 1
City of Virginia BeachAnalysis of Unpaid Loss & ALAE at June 30, 2015
General LiabilityData as of April 30, 2015
Reported Loss & ALAE Limited to $250,000
Accident Evaluation Date in MonthsPeriod 12 24 36 48 60 72 84 96 108 120 132 144 156 168 180
5/1/91-6/30/92 228,802 228,802 228,802 228,802 228,802 228,802 228,802 228,8025/1/92-6/30/93 421,515 421,719 423,703 423,703 423,703 423,703 423,703 423,703 423,7035/1/93-6/30/94 593,582 639,782 636,544 636,544 636,544 636,544 636,544 636,544 636,544 636,5445/1/94-6/30/95 476,559 477,559 476,559 476,559 476,559 476,559 476,559 476,559 476,559 476,559 476,5595/1/95-6/30/96 756,879 791,958 791,458 791,458 791,458 791,458 791,458 791,458 791,458 791,458 791,458 791,4585/1/96-6/30/97 798,171 914,316 835,865 870,865 873,665 821,744 821,444 821,444 821,444 821,444 821,444 821,444 821,4445/1/97-6/30/98 666,430 1,082,788 1,076,631 954,338 954,338 954,338 954,338 954,338 954,338 954,338 954,338 954,338 954,338 954,3385/1/98-6/30/99 318,873 1,128,967 1,462,730 1,443,561 1,235,813 1,264,347 1,253,350 1,191,656 1,196,156 1,196,156 1,196,156 1,196,156 1,196,156 1,196,156 1,196,1565/1/99-6/30/00 245,885 541,495 577,757 589,013 562,570 563,676 562,775 562,775 562,775 562,775 562,775 562,775 562,775 562,775 558,9185/1/00-6/30/01 199,030 372,474 396,916 356,059 351,759 344,659 344,659 344,659 344,659 344,759 344,659 344,659 344,659 344,659 344,6595/1/01-6/30/02 398,646 538,110 613,054 747,179 908,230 908,230 874,409 874,409 874,409 874,409 874,409 874,409 874,409 874,4095/1/02-6/30/03 357,054 393,861 466,938 529,047 505,308 465,166 465,166 465,166 465,166 465,166 465,166 468,728 468,7285/1/03-6/30/04 477,272 788,814 943,917 806,435 816,373 805,032 805,032 805,032 805,032 805,032 805,032 805,0325/1/04-6/30/05 397,670 439,051 425,891 425,785 481,668 484,097 505,256 505,256 505,256 479,256 479,2565/1/05-6/30/06 238,921 249,030 354,748 501,979 425,192 423,352 423,352 423,352 423,352 423,3525/1/06-6/30/07 256,904 398,147 401,684 414,388 414,420 454,420 454,420 454,420 454,4205/1/07-6/30/08 494,759 625,625 636,175 661,014 590,531 590,531 590,531 590,5315/1/08-6/30/09 316,708 592,611 676,589 513,371 462,045 712,045 712,0455/1/09-6/30/10 430,004 423,169 458,269 601,166 570,766 584,4225/1/10-6/30/11 212,993 333,949 426,825 503,562 502,4625/1/11-6/30/12 276,015 301,097 457,230 457,2305/1/12-6/30/13 233,591 284,263 279,3885/1/13-6/30/14 224,089 355,5175/1/14-6/30/15 181,972
Accident Period 12-24 24-36 36-48 48-60 60-72 72-84 84-96 96-108 108-120 120-132 132-144 144-156 156-168 168-180 180-ULT
5/1/91-6/30/92 1.000 1.000 1.000 1.000 1.000 1.000 1.0005/1/92-6/30/93 1.000 1.005 1.000 1.000 1.000 1.000 1.000 1.0005/1/93-6/30/94 1.078 0.995 1.000 1.000 1.000 1.000 1.000 1.000 1.0005/1/94-6/30/95 1.002 0.998 1.000 1.000 1.000 1.000 1.000 1.000 1.000 1.0005/1/95-6/30/96 1.046 0.999 1.000 1.000 1.000 1.000 1.000 1.000 1.000 1.000 1.0005/1/96-6/30/97 1.146 0.914 1.042 1.003 0.941 1.000 1.000 1.000 1.000 1.000 1.000 1.0005/1/97-6/30/98 1.625 0.994 0.886 1.000 1.000 1.000 1.000 1.000 1.000 1.000 1.000 1.000 1.0005/1/98-6/30/99 3.540 1.296 0.987 0.856 1.023 0.991 0.951 1.004 1.000 1.000 1.000 1.000 1.000 1.0005/1/99-6/30/00 2.202 1.067 1.019 0.955 1.002 0.998 1.000 1.000 1.000 1.000 1.000 1.000 1.000 0.9935/1/00-6/30/01 1.871 1.066 0.897 0.988 0.980 1.000 1.000 1.000 1.000 1.000 1.000 1.000 1.000 1.0005/1/01-6/30/02 1.350 1.139 1.219 1.216 1.000 0.963 1.000 1.000 1.000 1.000 1.000 1.000 1.0005/1/02-6/30/03 1.103 1.186 1.133 0.955 0.921 1.000 1.000 1.000 1.000 1.000 1.008 1.0005/1/03-6/30/04 1.653 1.197 0.854 1.012 0.986 1.000 1.000 1.000 1.000 1.000 1.0005/1/04-6/30/05 1.104 0.970 1.000 1.131 1.005 1.044 1.000 1.000 0.949 1.0005/1/05-6/30/06 1.042 1.425 1.415 0.847 0.996 1.000 1.000 1.000 1.0005/1/06-6/30/07 1.550 1.009 1.032 1.000 1.097 1.000 1.000 1.0005/1/07-6/30/08 1.265 1.017 1.039 0.893 1.000 1.000 1.0005/1/08-6/30/09 1.871 1.142 0.759 0.900 1.541 1.0005/1/09-6/30/10 0.984 1.083 1.312 0.949 1.0245/1/10-6/30/11 1.568 1.278 1.180 0.9985/1/11-6/30/12 1.091 1.519 1.0005/1/12-6/30/13 1.217 0.9835/1/13-6/30/14 1.587
All Years Average 1.562 1.187 1.062 0.972 1.039 1.005 0.993 1.001 0.997 1.000 1.001 1.000 1.000 0.999All Years Weighted 1.529 1.196 1.035 0.960 1.030 1.002 0.989 1.001 0.997 1.000 1.000 1.000 1.000 0.9995 Years Weighted 1.233 1.188 1.031 0.943 1.123 1.008 1.000 1.000 0.992 1.000 1.001 1.000 1.000 0.9993 Years Weighted 1.282 1.266 1.164 0.949 1.162 1.000 1.000 1.000 0.985 1.000 1.002 1.000 1.000 0.998All Years excl Hi-Lo 1.462 1.172 1.058 0.963 1.011 1.002 0.996 1.000 1.000 1.000 1.000 1.000 1.000 1.0007 Years excl Hi-Lo 1.345 1.106 1.112 0.948 1.024 1.000 1.000 1.000 1.000 1.000 1.000 1.000 1.000 1.000Industry 1.749 1.345 1.169 1.085 1.043 1.026 1.015 1.013 1.009 1.008 1.007 1.005 1.004 1.004 1.016Prior (4/30/13) 1.509 1.114 1.047 1.008 1.004 1.002 1.001 1.000 1.000 1.000 1.000 1.000 1.000 1.000 1.000
Selected 12-24 24-36 36-48 48-60 60-72 72-84 84-96 96-108 108-120 120-132 132-144 144-156 156-168 168-180 180-ULT
Age to Age 1.500 1.200 1.100 1.010 1.007 1.003 1.001 1.001 1.001 1.000 1.000 1.000 1.000 1.000 1.000Age to Ultimate 2.026 1.351 1.126 1.023 1.013 1.006 1.003 1.002 1.001 1.000 1.000 1.000 1.000 1.000 1.000
Notes:Not all averages are shown. Selected age to age factors are based on a review of all averages and actuarial judgment.
Oliver Wyman Actuarial Consulting, Inc.
71

Exhibit 6Sheet 2
City of Virginia BeachAnalysis of Unpaid Loss & ALAE at June 30, 2015
General LiabilityData as of April 30, 2015
Paid Loss & ALAE Limited to $250,000
Accident Evaluation Date in MonthsPeriod 12 24 36 48 60 72 84 96 108 120 132 144 156 168 180
5/1/91-6/30/92 228,802 228,802 228,802 228,802 228,802 228,802 228,802 228,8025/1/92-6/30/93 421,515 421,719 423,703 423,703 423,703 423,703 423,703 423,703 423,7035/1/93-6/30/94 593,582 636,482 636,544 636,544 636,544 636,544 636,544 636,544 636,544 636,5445/1/94-6/30/95 476,559 476,559 476,559 476,559 476,559 476,559 476,559 476,559 476,559 476,559 476,5595/1/95-6/30/96 755,548 791,458 791,458 791,458 791,458 791,458 791,458 791,458 791,458 791,458 791,458 791,4585/1/96-6/30/97 797,435 818,651 819,886 820,480 821,444 821,444 821,444 821,444 821,444 821,444 821,444 821,444 821,4445/1/97-6/30/98 658,329 946,953 949,390 954,338 954,338 954,338 954,338 954,338 954,338 954,338 954,338 954,338 954,338 954,3385/1/98-6/30/99 308,226 708,064 841,112 1,123,728 1,152,817 1,178,551 1,190,814 1,191,656 1,196,156 1,196,156 1,196,156 1,196,156 1,196,156 1,196,156 1,196,1565/1/99-6/30/00 211,144 268,696 528,255 554,167 558,884 562,775 562,775 562,775 562,775 562,775 562,775 562,775 562,775 562,775 558,9185/1/00-6/30/01 150,870 319,151 339,168 344,446 344,659 344,659 344,659 344,659 344,659 344,659 344,659 344,659 344,659 344,659 344,6595/1/01-6/30/02 289,112 506,674 600,761 631,574 872,405 874,409 874,409 874,409 874,409 874,409 874,409 874,409 874,409 874,4095/1/02-6/30/03 295,343 335,573 381,919 463,905 465,166 465,166 465,166 465,166 465,166 465,166 465,166 468,728 468,7285/1/03-6/30/04 221,485 769,539 781,185 805,335 805,532 805,032 805,032 805,032 805,032 805,032 805,032 805,0325/1/04-6/30/05 314,371 357,772 412,821 417,020 427,718 430,606 479,256 479,256 479,256 479,256 479,2565/1/05-6/30/06 207,344 242,353 332,817 422,407 422,352 422,352 422,352 422,352 422,352 422,3525/1/06-6/30/07 207,764 354,732 383,514 402,673 405,292 417,823 424,058 424,058 424,0585/1/07-6/30/08 267,301 531,637 584,269 585,884 586,430 590,531 590,531 590,5315/1/08-6/30/09 255,508 320,702 397,954 436,971 461,045 508,749 711,0455/1/09-6/30/10 220,418 310,837 311,696 563,101 563,101 581,5575/1/10-6/30/11 183,704 223,281 280,309 496,294 496,2945/1/11-6/30/12 219,415 300,447 300,874 300,9745/1/12-6/30/13 194,509 260,847 260,8475/1/13-6/30/14 194,958 338,0175/1/14-6/30/15 136,747
Accident Period 12-24 24-36 36-48 48-60 60-72 72-84 84-96 96-108 108-120 120-132 132-144 144-156 156-168 168-180 180-ULT
5/1/91-6/30/92 1.000 1.000 1.000 1.000 1.000 1.000 1.0005/1/92-6/30/93 1.000 1.005 1.000 1.000 1.000 1.000 1.000 1.0005/1/93-6/30/94 1.072 1.000 1.000 1.000 1.000 1.000 1.000 1.000 1.0005/1/94-6/30/95 1.000 1.000 1.000 1.000 1.000 1.000 1.000 1.000 1.000 1.0005/1/95-6/30/96 1.048 1.000 1.000 1.000 1.000 1.000 1.000 1.000 1.000 1.000 1.0005/1/96-6/30/97 1.027 1.002 1.001 1.001 1.000 1.000 1.000 1.000 1.000 1.000 1.000 1.0005/1/97-6/30/98 1.438 1.003 1.005 1.000 1.000 1.000 1.000 1.000 1.000 1.000 1.000 1.000 1.0005/1/98-6/30/99 2.297 1.188 1.336 1.026 1.022 1.010 1.001 1.004 1.000 1.000 1.000 1.000 1.000 1.0005/1/99-6/30/00 1.273 1.966 1.049 1.009 1.007 1.000 1.000 1.000 1.000 1.000 1.000 1.000 1.000 0.9935/1/00-6/30/01 2.115 1.063 1.016 1.001 1.000 1.000 1.000 1.000 1.000 1.000 1.000 1.000 1.000 1.0005/1/01-6/30/02 1.753 1.186 1.051 1.381 1.002 1.000 1.000 1.000 1.000 1.000 1.000 1.000 1.0005/1/02-6/30/03 1.136 1.138 1.215 1.003 1.000 1.000 1.000 1.000 1.000 1.000 1.008 1.0005/1/03-6/30/04 3.474 1.015 1.031 1.000 0.999 1.000 1.000 1.000 1.000 1.000 1.0005/1/04-6/30/05 1.138 1.154 1.010 1.026 1.007 1.113 1.000 1.000 1.000 1.0005/1/05-6/30/06 1.169 1.373 1.269 1.000 1.000 1.000 1.000 1.000 1.0005/1/06-6/30/07 1.707 1.081 1.050 1.007 1.031 1.015 1.000 1.0005/1/07-6/30/08 1.989 1.099 1.003 1.001 1.007 1.000 1.0005/1/08-6/30/09 1.255 1.241 1.098 1.055 1.103 1.3985/1/09-6/30/10 1.410 1.003 1.807 1.000 1.0335/1/10-6/30/11 1.215 1.255 1.771 1.0005/1/11-6/30/12 1.369 1.001 1.0005/1/12-6/30/13 1.341 1.0005/1/13-6/30/14 1.734
All Years Average 1.649 1.200 1.171 1.035 1.013 1.038 1.000 1.001 1.000 1.000 1.001 1.000 1.000 0.999All Years Weighted 1.643 1.188 1.133 1.036 1.012 1.031 1.000 1.001 1.000 1.000 1.000 1.000 1.000 0.9995 Years Weighted 1.415 1.096 1.271 1.011 1.034 1.109 1.000 1.000 1.000 1.000 1.001 1.000 1.000 0.9993 Years Weighted 1.477 1.073 1.524 1.016 1.044 1.137 1.000 1.000 1.000 1.000 1.002 1.000 1.000 0.998All Years excl Hi-Lo 1.555 1.160 1.138 1.013 1.008 1.015 1.000 1.000 1.000 1.000 1.000 1.000 1.000 1.0007 Years excl Hi-Lo 1.422 1.085 1.238 1.007 1.015 1.026 1.000 1.000 1.000 1.000 1.000 1.000 1.000 1.000Industry 2.520 1.668 1.348 1.196 1.109 1.065 1.039 1.025 1.018 1.015 1.013 1.012 1.010 1.007 1.039Prior (4/30/13) 1.620 1.183 1.084 1.028 1.010 1.006 1.002 1.001 1.000 1.000 1.000 1.000 1.000 1.000 1.000
Selected 12-24 24-36 36-48 48-60 60-72 72-84 84-96 96-108 108-120 120-132 132-144 144-156 156-168 168-180 180-ULT
Age to Age 1.600 1.250 1.100 1.040 1.020 1.010 1.004 1.001 1.001 1.001 1.000 1.000 1.000 1.000 1.000Age to Ultimate 2.374 1.484 1.187 1.079 1.037 1.017 1.007 1.003 1.002 1.001 1.000 1.000 1.000 1.000 1.000
Notes:Not all averages are shown. Selected age to age factors are based on a review of all averages and actuarial judgment.
Oliver Wyman Actuarial Consulting, Inc.
72

Exhibit 6Sheet 3
City of Virginia BeachAnalysis of Unpaid Loss & ALAE at June 30, 2015
General LiabilityData as of April 30, 2015
Reported Loss & ALAE Limited to $1,000,000
Accident Evaluation Date in MonthsPeriod 12 24 36 48 60 72 84 96 108 120 132 144 156 168 180
5/1/91-6/30/92 228,802 228,802 228,802 228,802 228,802 228,802 228,802 228,8025/1/92-6/30/93 421,515 421,719 423,703 423,703 423,703 423,703 423,703 423,703 423,7035/1/93-6/30/94 698,289 758,836 752,951 752,951 752,951 752,951 752,951 752,951 752,951 752,9515/1/94-6/30/95 1,038,112 1,039,112 1,038,112 1,038,112 1,038,112 1,038,112 1,038,112 1,038,112 1,038,112 1,038,112 1,038,1125/1/95-6/30/96 952,915 987,993 987,493 987,493 987,493 987,493 987,493 987,493 987,493 987,493 987,493 987,4935/1/96-6/30/97 951,862 1,068,007 989,556 1,024,556 1,027,356 975,435 975,135 975,135 975,135 975,135 975,135 975,135 975,1355/1/97-6/30/98 1,416,430 2,582,788 2,576,631 2,454,338 2,454,338 2,454,338 2,454,338 2,454,338 2,454,338 2,454,338 2,454,338 2,454,338 2,454,338 2,454,3385/1/98-6/30/99 318,873 1,190,907 1,518,170 1,499,001 1,291,253 1,319,787 1,308,790 1,247,096 1,251,596 1,251,596 1,251,596 1,251,596 1,251,596 1,251,596 1,251,5965/1/99-6/30/00 245,885 541,495 989,757 992,485 966,042 967,148 966,247 966,247 966,247 966,247 966,247 966,247 966,247 966,247 962,3905/1/00-6/30/01 199,030 372,474 396,916 356,059 351,759 344,659 344,659 344,659 344,659 344,759 344,659 344,659 344,659 344,659 344,6595/1/01-6/30/02 398,646 538,110 613,054 747,179 911,277 911,277 877,456 877,456 877,456 877,456 877,456 877,456 877,456 877,4565/1/02-6/30/03 357,054 393,861 466,938 529,047 505,308 465,166 465,166 465,166 465,166 465,166 465,166 468,728 468,7285/1/03-6/30/04 612,272 1,577,215 1,608,973 1,471,490 1,481,429 1,470,087 1,470,087 1,470,087 1,470,087 1,470,087 1,470,087 1,470,0875/1/04-6/30/05 397,670 439,051 425,891 425,785 481,668 484,097 505,256 505,256 505,256 479,256 479,2565/1/05-6/30/06 238,921 249,030 354,748 1,051,979 425,192 423,352 423,352 423,352 423,352 423,3525/1/06-6/30/07 256,904 398,147 401,684 414,388 414,420 454,420 454,420 454,420 454,4205/1/07-6/30/08 494,759 1,375,625 1,386,175 1,354,657 1,284,174 1,279,174 1,279,174 1,279,1745/1/08-6/30/09 316,708 942,611 1,026,589 513,371 462,045 862,045 1,462,0455/1/09-6/30/10 430,004 423,169 458,269 812,992 782,592 796,2485/1/10-6/30/11 212,993 333,949 426,825 503,562 502,4625/1/11-6/30/12 276,015 301,097 457,230 457,2305/1/12-6/30/13 233,591 284,263 279,3885/1/13-6/30/14 224,089 355,5175/1/14-6/30/15 181,972
Accident Period 12-24 24-36 36-48 48-60 60-72 72-84 84-96 96-108 108-120 120-132 132-144 144-156 156-168 168-180 180-ULT
5/1/91-6/30/92 1.000 1.000 1.000 1.000 1.000 1.000 1.0005/1/92-6/30/93 1.000 1.005 1.000 1.000 1.000 1.000 1.000 1.0005/1/93-6/30/94 1.087 0.992 1.000 1.000 1.000 1.000 1.000 1.000 1.0005/1/94-6/30/95 1.001 0.999 1.000 1.000 1.000 1.000 1.000 1.000 1.000 1.0005/1/95-6/30/96 1.037 0.999 1.000 1.000 1.000 1.000 1.000 1.000 1.000 1.000 1.0005/1/96-6/30/97 1.122 0.927 1.035 1.003 0.949 1.000 1.000 1.000 1.000 1.000 1.000 1.0005/1/97-6/30/98 1.823 0.998 0.953 1.000 1.000 1.000 1.000 1.000 1.000 1.000 1.000 1.000 1.0005/1/98-6/30/99 3.735 1.275 0.987 0.861 1.022 0.992 0.953 1.004 1.000 1.000 1.000 1.000 1.000 1.0005/1/99-6/30/00 2.202 1.828 1.003 0.973 1.001 0.999 1.000 1.000 1.000 1.000 1.000 1.000 1.000 0.9965/1/00-6/30/01 1.871 1.066 0.897 0.988 0.980 1.000 1.000 1.000 1.000 1.000 1.000 1.000 1.000 1.0005/1/01-6/30/02 1.350 1.139 1.219 1.220 1.000 0.963 1.000 1.000 1.000 1.000 1.000 1.000 1.0005/1/02-6/30/03 1.103 1.186 1.133 0.955 0.921 1.000 1.000 1.000 1.000 1.000 1.008 1.0005/1/03-6/30/04 2.576 1.020 0.915 1.007 0.992 1.000 1.000 1.000 1.000 1.000 1.0005/1/04-6/30/05 1.104 0.970 1.000 1.131 1.005 1.044 1.000 1.000 0.949 1.0005/1/05-6/30/06 1.042 1.425 2.965 0.404 0.996 1.000 1.000 1.000 1.0005/1/06-6/30/07 1.550 1.009 1.032 1.000 1.097 1.000 1.000 1.0005/1/07-6/30/08 2.780 1.008 0.977 0.948 0.996 1.000 1.0005/1/08-6/30/09 2.976 1.089 0.500 0.900 1.866 1.6965/1/09-6/30/10 0.984 1.083 1.774 0.963 1.0175/1/10-6/30/11 1.568 1.278 1.180 0.9985/1/11-6/30/12 1.091 1.519 1.0005/1/12-6/30/13 1.217 0.9835/1/13-6/30/14 1.587
All Years Average 1.796 1.231 1.169 0.954 1.058 1.049 0.993 1.001 0.997 1.000 1.001 1.000 1.000 1.000All Years Weighted 1.864 1.243 1.050 0.936 1.031 1.042 0.992 1.000 0.998 1.000 1.000 1.000 1.000 1.0005 Years Weighted 1.233 1.159 0.970 0.957 1.133 1.177 1.000 1.000 0.993 1.000 1.001 1.000 1.000 0.9993 Years Weighted 1.282 1.266 1.321 0.955 1.162 1.231 1.000 1.000 0.989 1.000 1.001 1.000 1.000 0.998All Years excl Hi-Lo 1.716 1.207 1.088 0.974 1.010 1.009 0.996 1.000 1.000 1.000 1.000 1.000 1.000 1.0007 Years excl Hi-Lo 1.649 1.093 1.193 0.962 1.022 1.009 1.000 1.000 1.000 1.000 1.000 1.000 1.000 1.000Industry 1.829 1.381 1.194 1.108 1.059 1.036 1.022 1.017 1.012 1.010 1.009 1.007 1.006 1.005 1.029Prior (4/30/13) 1.880 1.119 1.076 1.010 1.005 1.003 1.002 1.001 1.000 1.000 1.000 1.000 1.000 1.000 1.000
Selected 12-24 24-36 36-48 48-60 60-72 72-84 84-96 96-108 108-120 120-132 132-144 144-156 156-168 168-180 180-ULT
Age to Age 1.700 1.250 1.150 1.025 1.010 1.005 1.002 1.001 1.001 1.001 1.000 1.000 1.000 1.000 1.000Age to Ultimate 2.555 1.503 1.202 1.046 1.020 1.010 1.005 1.003 1.002 1.001 1.000 1.000 1.000 1.000 1.000
Notes:Not all averages are shown. Selected age to age factors are based on a review of all averages and actuarial judgment.
Oliver Wyman Actuarial Consulting, Inc.
73

Exhibit 6Sheet 4
City of Virginia BeachAnalysis of Unpaid Loss & ALAE at June 30, 2015
General LiabilityData as of April 30, 2015
Paid Loss & ALAE Limited to $1,000,000
Accident Evaluation Date in MonthsPeriod 12 24 36 48 60 72 84 96 108 120 132 144 156 168 180
5/1/91-6/30/92 228,802 228,802 228,802 228,802 228,802 228,802 228,802 228,8025/1/92-6/30/93 421,515 421,719 423,703 423,703 423,703 423,703 423,703 423,703 423,7035/1/93-6/30/94 698,289 741,189 752,951 752,951 752,951 752,951 752,951 752,951 752,951 752,9515/1/94-6/30/95 1,038,112 1,038,112 1,038,112 1,038,112 1,038,112 1,038,112 1,038,112 1,038,112 1,038,112 1,038,112 1,038,1125/1/95-6/30/96 951,583 987,493 987,493 987,493 987,493 987,493 987,493 987,493 987,493 987,493 987,493 987,4935/1/96-6/30/97 951,126 972,342 973,577 974,171 975,135 975,135 975,135 975,135 975,135 975,135 975,135 975,135 975,1355/1/97-6/30/98 1,408,329 2,446,953 2,449,390 2,454,338 2,454,338 2,454,338 2,454,338 2,454,338 2,454,338 2,454,338 2,454,338 2,454,338 2,454,338 2,454,3385/1/98-6/30/99 308,226 763,504 896,552 1,179,168 1,208,257 1,233,991 1,246,254 1,247,096 1,251,596 1,251,596 1,251,596 1,251,596 1,251,596 1,251,596 1,251,5965/1/99-6/30/00 211,144 268,696 931,727 957,639 962,356 966,247 966,247 966,247 966,247 966,247 966,247 966,247 966,247 966,247 962,3905/1/00-6/30/01 150,870 319,151 339,168 344,446 344,659 344,659 344,659 344,659 344,659 344,659 344,659 344,659 344,659 344,659 344,6595/1/01-6/30/02 289,112 506,674 600,761 631,574 875,452 877,456 877,456 877,456 877,456 877,456 877,456 877,456 877,456 877,4565/1/02-6/30/03 295,343 335,573 381,919 463,905 465,166 465,166 465,166 465,166 465,166 465,166 465,166 468,728 468,7285/1/03-6/30/04 221,485 1,414,695 1,446,241 1,470,390 1,470,587 1,470,087 1,470,087 1,470,087 1,470,087 1,470,087 1,470,087 1,470,0875/1/04-6/30/05 314,371 357,772 412,821 417,020 427,718 430,606 479,256 479,256 479,256 479,256 479,2565/1/05-6/30/06 207,344 242,353 332,817 422,407 422,352 422,352 422,352 422,352 422,352 422,3525/1/06-6/30/07 207,764 354,732 383,514 402,673 405,292 417,823 424,058 424,058 424,0585/1/07-6/30/08 267,301 1,219,476 1,272,912 1,274,527 1,275,073 1,279,174 1,279,174 1,279,1745/1/08-6/30/09 255,508 320,702 397,954 436,971 461,045 508,749 951,3495/1/09-6/30/10 220,418 310,837 311,696 774,927 774,927 793,3835/1/10-6/30/11 183,704 223,281 280,309 496,294 496,2945/1/11-6/30/12 219,415 300,447 300,874 300,9745/1/12-6/30/13 194,509 260,847 260,8475/1/13-6/30/14 194,958 338,0175/1/14-6/30/15 136,747
Accident Period 12-24 24-36 36-48 48-60 60-72 72-84 84-96 96-108 108-120 120-132 132-144 144-156 156-168 168-180 180-ULT
5/1/91-6/30/92 1.000 1.000 1.000 1.000 1.000 1.000 1.0005/1/92-6/30/93 1.000 1.005 1.000 1.000 1.000 1.000 1.000 1.0005/1/93-6/30/94 1.061 1.016 1.000 1.000 1.000 1.000 1.000 1.000 1.0005/1/94-6/30/95 1.000 1.000 1.000 1.000 1.000 1.000 1.000 1.000 1.000 1.0005/1/95-6/30/96 1.038 1.000 1.000 1.000 1.000 1.000 1.000 1.000 1.000 1.000 1.0005/1/96-6/30/97 1.022 1.001 1.001 1.001 1.000 1.000 1.000 1.000 1.000 1.000 1.000 1.0005/1/97-6/30/98 1.737 1.001 1.002 1.000 1.000 1.000 1.000 1.000 1.000 1.000 1.000 1.000 1.0005/1/98-6/30/99 2.477 1.174 1.315 1.025 1.021 1.010 1.001 1.004 1.000 1.000 1.000 1.000 1.000 1.0005/1/99-6/30/00 1.273 3.468 1.028 1.005 1.004 1.000 1.000 1.000 1.000 1.000 1.000 1.000 1.000 0.9965/1/00-6/30/01 2.115 1.063 1.016 1.001 1.000 1.000 1.000 1.000 1.000 1.000 1.000 1.000 1.000 1.0005/1/01-6/30/02 1.753 1.186 1.051 1.386 1.002 1.000 1.000 1.000 1.000 1.000 1.000 1.000 1.0005/1/02-6/30/03 1.136 1.138 1.215 1.003 1.000 1.000 1.000 1.000 1.000 1.000 1.008 1.0005/1/03-6/30/04 6.387 1.022 1.017 1.000 1.000 1.000 1.000 1.000 1.000 1.000 1.0005/1/04-6/30/05 1.138 1.154 1.010 1.026 1.007 1.113 1.000 1.000 1.000 1.0005/1/05-6/30/06 1.169 1.373 1.269 1.000 1.000 1.000 1.000 1.000 1.0005/1/06-6/30/07 1.707 1.081 1.050 1.007 1.031 1.015 1.000 1.0005/1/07-6/30/08 4.562 1.044 1.001 1.000 1.003 1.000 1.0005/1/08-6/30/09 1.255 1.241 1.098 1.055 1.103 1.8705/1/09-6/30/10 1.410 1.003 2.486 1.000 1.0245/1/10-6/30/11 1.215 1.255 1.771 1.0005/1/11-6/30/12 1.369 1.001 1.0005/1/12-6/30/13 1.341 1.0005/1/13-6/30/14 1.734
All Years Average 2.003 1.309 1.209 1.034 1.012 1.067 1.001 1.001 1.000 1.000 1.001 1.000 1.000 1.000All Years Weighted 2.014 1.278 1.112 1.026 1.008 1.038 1.001 1.000 1.000 1.000 1.000 1.000 1.000 1.0005 Years Weighted 1.415 1.096 1.281 1.008 1.025 1.163 1.000 1.000 1.000 1.000 1.001 1.000 1.000 0.9993 Years Weighted 1.477 1.073 1.761 1.014 1.028 1.203 1.000 1.000 1.000 1.000 1.001 1.000 1.000 0.998All Years excl Hi-Lo 1.751 1.177 1.133 1.012 1.007 1.014 1.000 1.000 1.000 1.000 1.000 1.000 1.000 1.0007 Years excl Hi-Lo 1.422 1.074 1.238 1.007 1.013 1.026 1.000 1.000 1.000 1.000 1.000 1.000 1.000 1.000Industry 2.638 1.711 1.371 1.210 1.120 1.071 1.042 1.028 1.020 1.017 1.014 1.012 1.011 1.009 1.053Prior (4/30/13) 2.040 1.206 1.089 1.031 1.010 1.007 1.002 1.002 1.001 1.000 1.000 1.000 1.000 1.000 1.000
Selected 12-24 24-36 36-48 48-60 60-72 72-84 84-96 96-108 108-120 120-132 132-144 144-156 156-168 168-180 180-ULT
Age to Age 1.900 1.300 1.200 1.050 1.030 1.015 1.005 1.002 1.001 1.001 1.001 1.000 1.000 1.000 1.000Age to Ultimate 3.286 1.730 1.330 1.109 1.056 1.025 1.010 1.005 1.003 1.002 1.001 1.000 1.000 1.000 1.000
Notes:Not all averages are shown. Selected age to age factors are based on a review of all averages and actuarial judgment.
Oliver Wyman Actuarial Consulting, Inc.
74

Exhibit 6Sheet 5
City of Virginia BeachAnalysis of Unpaid Loss & ALAE at June 30, 2015
General LiabilityData as of April 30, 2015
Reported Loss & ALAE Limited to $2,000,000
Accident Evaluation Date in MonthsPeriod 12 24 36 48 60 72 84 96 108 120 132 144 156 168 180
5/1/91-6/30/92 228,802 228,802 228,802 228,802 228,802 228,802 228,802 228,8025/1/92-6/30/93 421,515 421,719 423,703 423,703 423,703 423,703 423,703 423,703 423,7035/1/93-6/30/94 698,289 758,836 752,951 752,951 752,951 752,951 752,951 752,951 752,951 752,9515/1/94-6/30/95 1,038,112 1,039,112 1,038,112 1,038,112 1,038,112 1,038,112 1,038,112 1,038,112 1,038,112 1,038,112 1,038,1125/1/95-6/30/96 952,915 987,993 987,493 987,493 987,493 987,493 987,493 987,493 987,493 987,493 987,493 987,4935/1/96-6/30/97 951,862 1,068,007 989,556 1,024,556 1,027,356 975,435 975,135 975,135 975,135 975,135 975,135 975,135 975,1355/1/97-6/30/98 1,880,958 4,086,663 4,053,840 3,931,717 3,931,717 3,931,717 3,931,717 3,931,717 3,931,717 3,931,717 3,931,717 3,931,717 3,931,717 3,931,7175/1/98-6/30/99 318,873 1,190,907 1,518,170 1,499,001 1,291,253 1,319,787 1,308,790 1,247,096 1,251,596 1,251,596 1,251,596 1,251,596 1,251,596 1,251,596 1,251,5965/1/99-6/30/00 245,885 541,495 989,757 992,485 966,042 967,148 966,247 966,247 966,247 966,247 966,247 966,247 966,247 966,247 962,3905/1/00-6/30/01 199,030 372,474 396,916 356,059 351,759 344,659 344,659 344,659 344,659 344,759 344,659 344,659 344,659 344,659 344,6595/1/01-6/30/02 398,646 538,110 613,054 747,179 911,277 911,277 877,456 877,456 877,456 877,456 877,456 877,456 877,456 877,4565/1/02-6/30/03 357,054 393,861 466,938 529,047 505,308 465,166 465,166 465,166 465,166 465,166 465,166 468,728 468,7285/1/03-6/30/04 612,272 1,689,095 1,608,973 1,471,490 1,481,429 1,470,087 1,470,087 1,470,087 1,470,087 1,470,087 1,470,087 1,470,0875/1/04-6/30/05 397,670 439,051 425,891 425,785 481,668 484,097 505,256 505,256 505,256 479,256 479,2565/1/05-6/30/06 238,921 249,030 354,748 1,051,979 425,192 423,352 423,352 423,352 423,352 423,3525/1/06-6/30/07 256,904 398,147 401,684 414,388 414,420 454,420 454,420 454,420 454,4205/1/07-6/30/08 494,759 1,428,519 1,439,873 1,354,657 1,284,174 1,279,174 1,279,174 1,279,1745/1/08-6/30/09 316,708 942,611 1,026,589 513,371 462,045 862,045 1,662,0455/1/09-6/30/10 430,004 423,169 458,269 812,992 782,592 796,2485/1/10-6/30/11 212,993 333,949 426,825 503,562 502,4625/1/11-6/30/12 276,015 301,097 457,230 457,2305/1/12-6/30/13 233,591 284,263 279,3885/1/13-6/30/14 224,089 355,5175/1/14-6/30/15 181,972
Accident Period 12-24 24-36 36-48 48-60 60-72 72-84 84-96 96-108 108-120 120-132 132-144 144-156 156-168 168-180 180-ULT
5/1/91-6/30/92 1.000 1.000 1.000 1.000 1.000 1.000 1.0005/1/92-6/30/93 1.000 1.005 1.000 1.000 1.000 1.000 1.000 1.0005/1/93-6/30/94 1.087 0.992 1.000 1.000 1.000 1.000 1.000 1.000 1.0005/1/94-6/30/95 1.001 0.999 1.000 1.000 1.000 1.000 1.000 1.000 1.000 1.0005/1/95-6/30/96 1.037 0.999 1.000 1.000 1.000 1.000 1.000 1.000 1.000 1.000 1.0005/1/96-6/30/97 1.122 0.927 1.035 1.003 0.949 1.000 1.000 1.000 1.000 1.000 1.000 1.0005/1/97-6/30/98 2.173 0.992 0.970 1.000 1.000 1.000 1.000 1.000 1.000 1.000 1.000 1.000 1.0005/1/98-6/30/99 3.735 1.275 0.987 0.861 1.022 0.992 0.953 1.004 1.000 1.000 1.000 1.000 1.000 1.0005/1/99-6/30/00 2.202 1.828 1.003 0.973 1.001 0.999 1.000 1.000 1.000 1.000 1.000 1.000 1.000 0.9965/1/00-6/30/01 1.871 1.066 0.897 0.988 0.980 1.000 1.000 1.000 1.000 1.000 1.000 1.000 1.000 1.0005/1/01-6/30/02 1.350 1.139 1.219 1.220 1.000 0.963 1.000 1.000 1.000 1.000 1.000 1.000 1.0005/1/02-6/30/03 1.103 1.186 1.133 0.955 0.921 1.000 1.000 1.000 1.000 1.000 1.008 1.0005/1/03-6/30/04 2.759 0.953 0.915 1.007 0.992 1.000 1.000 1.000 1.000 1.000 1.0005/1/04-6/30/05 1.104 0.970 1.000 1.131 1.005 1.044 1.000 1.000 0.949 1.0005/1/05-6/30/06 1.042 1.425 2.965 0.404 0.996 1.000 1.000 1.000 1.0005/1/06-6/30/07 1.550 1.009 1.032 1.000 1.097 1.000 1.000 1.0005/1/07-6/30/08 2.887 1.008 0.941 0.948 0.996 1.000 1.0005/1/08-6/30/09 2.976 1.089 0.500 0.900 1.866 1.9285/1/09-6/30/10 0.984 1.083 1.774 0.963 1.0175/1/10-6/30/11 1.568 1.278 1.180 0.9985/1/11-6/30/12 1.091 1.519 1.0005/1/12-6/30/13 1.217 0.9835/1/13-6/30/14 1.587
All Years Average 1.814 1.249 1.166 0.955 1.058 1.063 0.993 1.001 0.997 1.000 1.001 1.000 1.000 1.000All Years Weighted 1.895 1.311 1.040 0.942 1.028 1.050 0.993 1.000 0.998 1.000 1.000 1.000 1.000 1.0005 Years Weighted 1.233 1.159 0.956 0.957 1.133 1.234 1.000 1.000 0.993 1.000 1.001 1.000 1.000 0.9993 Years Weighted 1.282 1.266 1.321 0.955 1.162 1.308 1.000 1.000 0.989 1.000 1.001 1.000 1.000 0.998All Years excl Hi-Lo 1.736 1.204 1.085 0.976 1.010 1.009 0.996 1.000 1.000 1.000 1.000 1.000 1.000 1.0007 Years excl Hi-Lo 1.670 1.093 1.185 0.962 1.022 1.009 1.000 1.000 1.000 1.000 1.000 1.000 1.000 1.000Industry 1.838 1.383 1.201 1.110 1.059 1.039 1.025 1.019 1.014 1.012 1.010 1.008 1.007 1.006 1.035Prior (4/30/13) 1.914 1.130 1.076 1.011 1.005 1.004 1.002 1.001 1.000 1.000 1.000 1.000 1.000 1.000 1.000
Selected 12-24 24-36 36-48 48-60 60-72 72-84 84-96 96-108 108-120 120-132 132-144 144-156 156-168 168-180 180-ULT
Age to Age 1.800 1.300 1.200 1.050 1.020 1.010 1.002 1.001 1.001 1.001 1.001 1.000 1.000 1.000 1.000Age to Ultimate 3.056 1.698 1.306 1.088 1.036 1.016 1.006 1.004 1.003 1.002 1.001 1.000 1.000 1.000 1.000
Notes:Not all averages are shown. Selected age to age factors are based on a review of all averages and actuarial judgment.
Oliver Wyman Actuarial Consulting, Inc.
75
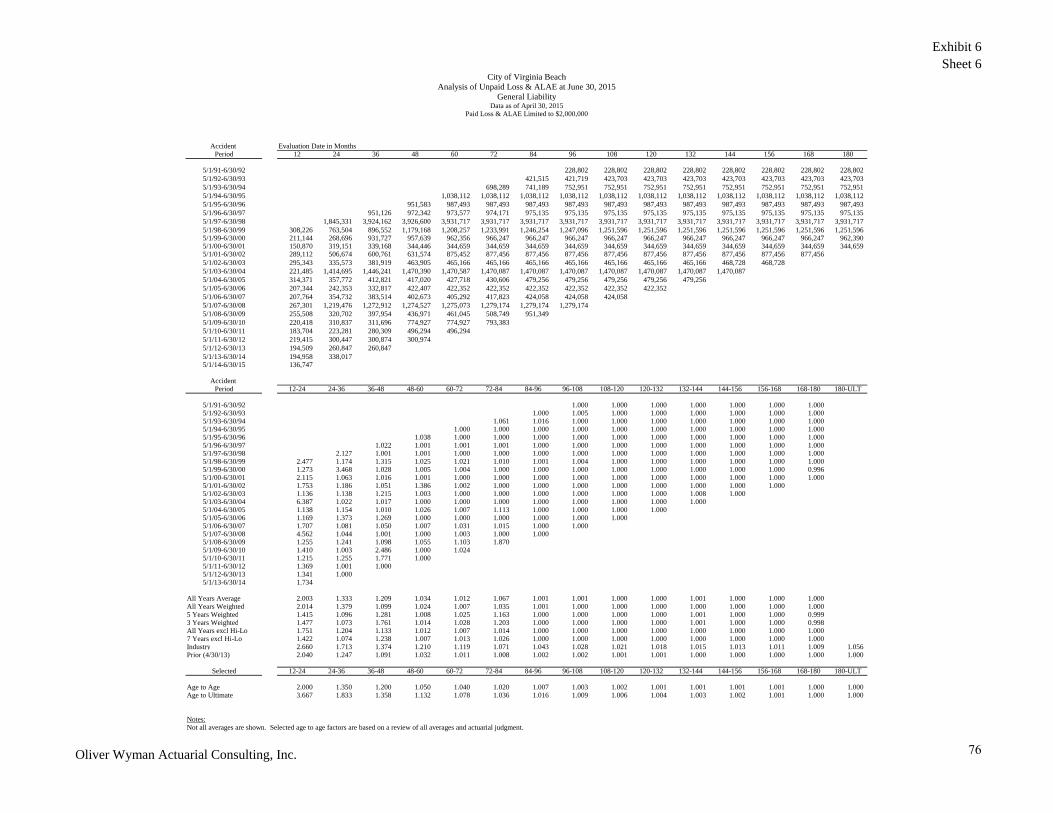
Exhibit 6Sheet 6
City of Virginia BeachAnalysis of Unpaid Loss & ALAE at June 30, 2015
General LiabilityData as of April 30, 2015
Paid Loss & ALAE Limited to $2,000,000
Accident Evaluation Date in MonthsPeriod 12 24 36 48 60 72 84 96 108 120 132 144 156 168 180
5/1/91-6/30/92 228,802 228,802 228,802 228,802 228,802 228,802 228,802 228,8025/1/92-6/30/93 421,515 421,719 423,703 423,703 423,703 423,703 423,703 423,703 423,7035/1/93-6/30/94 698,289 741,189 752,951 752,951 752,951 752,951 752,951 752,951 752,951 752,9515/1/94-6/30/95 1,038,112 1,038,112 1,038,112 1,038,112 1,038,112 1,038,112 1,038,112 1,038,112 1,038,112 1,038,112 1,038,1125/1/95-6/30/96 951,583 987,493 987,493 987,493 987,493 987,493 987,493 987,493 987,493 987,493 987,493 987,4935/1/96-6/30/97 951,126 972,342 973,577 974,171 975,135 975,135 975,135 975,135 975,135 975,135 975,135 975,135 975,1355/1/97-6/30/98 1,845,331 3,924,162 3,926,600 3,931,717 3,931,717 3,931,717 3,931,717 3,931,717 3,931,717 3,931,717 3,931,717 3,931,717 3,931,717 3,931,7175/1/98-6/30/99 308,226 763,504 896,552 1,179,168 1,208,257 1,233,991 1,246,254 1,247,096 1,251,596 1,251,596 1,251,596 1,251,596 1,251,596 1,251,596 1,251,5965/1/99-6/30/00 211,144 268,696 931,727 957,639 962,356 966,247 966,247 966,247 966,247 966,247 966,247 966,247 966,247 966,247 962,3905/1/00-6/30/01 150,870 319,151 339,168 344,446 344,659 344,659 344,659 344,659 344,659 344,659 344,659 344,659 344,659 344,659 344,6595/1/01-6/30/02 289,112 506,674 600,761 631,574 875,452 877,456 877,456 877,456 877,456 877,456 877,456 877,456 877,456 877,4565/1/02-6/30/03 295,343 335,573 381,919 463,905 465,166 465,166 465,166 465,166 465,166 465,166 465,166 468,728 468,7285/1/03-6/30/04 221,485 1,414,695 1,446,241 1,470,390 1,470,587 1,470,087 1,470,087 1,470,087 1,470,087 1,470,087 1,470,087 1,470,0875/1/04-6/30/05 314,371 357,772 412,821 417,020 427,718 430,606 479,256 479,256 479,256 479,256 479,2565/1/05-6/30/06 207,344 242,353 332,817 422,407 422,352 422,352 422,352 422,352 422,352 422,3525/1/06-6/30/07 207,764 354,732 383,514 402,673 405,292 417,823 424,058 424,058 424,0585/1/07-6/30/08 267,301 1,219,476 1,272,912 1,274,527 1,275,073 1,279,174 1,279,174 1,279,1745/1/08-6/30/09 255,508 320,702 397,954 436,971 461,045 508,749 951,3495/1/09-6/30/10 220,418 310,837 311,696 774,927 774,927 793,3835/1/10-6/30/11 183,704 223,281 280,309 496,294 496,2945/1/11-6/30/12 219,415 300,447 300,874 300,9745/1/12-6/30/13 194,509 260,847 260,8475/1/13-6/30/14 194,958 338,0175/1/14-6/30/15 136,747
Accident Period 12-24 24-36 36-48 48-60 60-72 72-84 84-96 96-108 108-120 120-132 132-144 144-156 156-168 168-180 180-ULT
5/1/91-6/30/92 1.000 1.000 1.000 1.000 1.000 1.000 1.0005/1/92-6/30/93 1.000 1.005 1.000 1.000 1.000 1.000 1.000 1.0005/1/93-6/30/94 1.061 1.016 1.000 1.000 1.000 1.000 1.000 1.000 1.0005/1/94-6/30/95 1.000 1.000 1.000 1.000 1.000 1.000 1.000 1.000 1.000 1.0005/1/95-6/30/96 1.038 1.000 1.000 1.000 1.000 1.000 1.000 1.000 1.000 1.000 1.0005/1/96-6/30/97 1.022 1.001 1.001 1.001 1.000 1.000 1.000 1.000 1.000 1.000 1.000 1.0005/1/97-6/30/98 2.127 1.001 1.001 1.000 1.000 1.000 1.000 1.000 1.000 1.000 1.000 1.000 1.0005/1/98-6/30/99 2.477 1.174 1.315 1.025 1.021 1.010 1.001 1.004 1.000 1.000 1.000 1.000 1.000 1.0005/1/99-6/30/00 1.273 3.468 1.028 1.005 1.004 1.000 1.000 1.000 1.000 1.000 1.000 1.000 1.000 0.9965/1/00-6/30/01 2.115 1.063 1.016 1.001 1.000 1.000 1.000 1.000 1.000 1.000 1.000 1.000 1.000 1.0005/1/01-6/30/02 1.753 1.186 1.051 1.386 1.002 1.000 1.000 1.000 1.000 1.000 1.000 1.000 1.0005/1/02-6/30/03 1.136 1.138 1.215 1.003 1.000 1.000 1.000 1.000 1.000 1.000 1.008 1.0005/1/03-6/30/04 6.387 1.022 1.017 1.000 1.000 1.000 1.000 1.000 1.000 1.000 1.0005/1/04-6/30/05 1.138 1.154 1.010 1.026 1.007 1.113 1.000 1.000 1.000 1.0005/1/05-6/30/06 1.169 1.373 1.269 1.000 1.000 1.000 1.000 1.000 1.0005/1/06-6/30/07 1.707 1.081 1.050 1.007 1.031 1.015 1.000 1.0005/1/07-6/30/08 4.562 1.044 1.001 1.000 1.003 1.000 1.0005/1/08-6/30/09 1.255 1.241 1.098 1.055 1.103 1.8705/1/09-6/30/10 1.410 1.003 2.486 1.000 1.0245/1/10-6/30/11 1.215 1.255 1.771 1.0005/1/11-6/30/12 1.369 1.001 1.0005/1/12-6/30/13 1.341 1.0005/1/13-6/30/14 1.734
All Years Average 2.003 1.333 1.209 1.034 1.012 1.067 1.001 1.001 1.000 1.000 1.001 1.000 1.000 1.000All Years Weighted 2.014 1.379 1.099 1.024 1.007 1.035 1.001 1.000 1.000 1.000 1.000 1.000 1.000 1.0005 Years Weighted 1.415 1.096 1.281 1.008 1.025 1.163 1.000 1.000 1.000 1.000 1.001 1.000 1.000 0.9993 Years Weighted 1.477 1.073 1.761 1.014 1.028 1.203 1.000 1.000 1.000 1.000 1.001 1.000 1.000 0.998All Years excl Hi-Lo 1.751 1.204 1.133 1.012 1.007 1.014 1.000 1.000 1.000 1.000 1.000 1.000 1.000 1.0007 Years excl Hi-Lo 1.422 1.074 1.238 1.007 1.013 1.026 1.000 1.000 1.000 1.000 1.000 1.000 1.000 1.000Industry 2.660 1.713 1.374 1.210 1.119 1.071 1.043 1.028 1.021 1.018 1.015 1.013 1.011 1.009 1.056Prior (4/30/13) 2.040 1.247 1.091 1.032 1.011 1.008 1.002 1.002 1.001 1.001 1.000 1.000 1.000 1.000 1.000
Selected 12-24 24-36 36-48 48-60 60-72 72-84 84-96 96-108 108-120 120-132 132-144 144-156 156-168 168-180 180-ULT
Age to Age 2.000 1.350 1.200 1.050 1.040 1.020 1.007 1.003 1.002 1.001 1.001 1.001 1.001 1.000 1.000Age to Ultimate 3.667 1.833 1.358 1.132 1.078 1.036 1.016 1.009 1.006 1.004 1.003 1.002 1.001 1.000 1.000
Notes:Not all averages are shown. Selected age to age factors are based on a review of all averages and actuarial judgment.
Oliver Wyman Actuarial Consulting, Inc.
76

Exhibit 6Sheet 7
City of Virginia BeachAnalysis of Unpaid Loss & ALAE at June 30, 2015
General LiabilityData as of April 30, 2015
Reported Claim Counts excluding Claims Closed with no Payment
Accident Evaluation Date in MonthsPeriod 12 24 36 48 60 72 84 96 108 120 132 144 156 168 180
5/1/91-6/30/92 147 147 147 147 147 147 147 1475/1/92-6/30/93 152 152 152 152 152 152 151 151 1515/1/93-6/30/94 198 200 199 199 199 199 201 200 200 2005/1/94-6/30/95 221 222 221 221 221 221 219 220 220 220 2205/1/95-6/30/96 192 193 192 192 192 192 192 192 192 192 192 1925/1/96-6/30/97 209 211 210 210 211 211 210 210 210 210 210 210 2105/1/97-6/30/98 244 252 248 248 248 248 248 248 248 248 248 248 248 2485/1/98-6/30/99 194 251 252 250 247 246 248 248 248 248 248 248 248 248 2485/1/99-6/30/00 270 234 237 237 237 234 233 233 234 233 233 233 233 233 2325/1/00-6/30/01 287 245 247 247 246 238 238 238 238 239 238 238 238 238 2385/1/01-6/30/02 285 263 261 263 259 259 259 259 259 259 259 259 259 2595/1/02-6/30/03 256 232 233 232 232 232 232 231 231 231 231 231 2315/1/03-6/30/04 260 232 232 232 232 231 230 230 230 230 230 2305/1/04-6/30/05 250 227 226 227 228 227 226 226 226 225 2255/1/05-6/30/06 203 174 176 176 175 175 175 175 175 1755/1/06-6/30/07 236 193 194 191 191 191 191 191 1915/1/07-6/30/08 183 160 162 161 162 162 163 1635/1/08-6/30/09 158 155 156 156 155 156 1565/1/09-6/30/10 200 170 171 170 168 1695/1/10-6/30/11 190 179 178 174 1725/1/11-6/30/12 183 174 174 1735/1/12-6/30/13 172 144 1405/1/13-6/30/14 216 1785/1/14-6/30/15 239
Accident Period 12-24 24-36 36-48 48-60 60-72 72-84 84-96 96-108 108-120 120-132 132-144 144-156 156-168 168-180 180-ULT
5/1/91-6/30/92 1.000 1.000 1.000 1.000 1.000 1.000 1.0005/1/92-6/30/93 1.000 1.000 1.000 1.000 1.000 0.993 1.000 1.0005/1/93-6/30/94 1.010 0.995 1.000 1.000 1.000 1.010 0.995 1.000 1.0005/1/94-6/30/95 1.005 0.995 1.000 1.000 1.000 0.991 1.005 1.000 1.000 1.0005/1/95-6/30/96 1.005 0.995 1.000 1.000 1.000 1.000 1.000 1.000 1.000 1.000 1.0005/1/96-6/30/97 1.010 0.995 1.000 1.005 1.000 0.995 1.000 1.000 1.000 1.000 1.000 1.0005/1/97-6/30/98 1.033 0.984 1.000 1.000 1.000 1.000 1.000 1.000 1.000 1.000 1.000 1.000 1.0005/1/98-6/30/99 1.294 1.004 0.992 0.988 0.996 1.008 1.000 1.000 1.000 1.000 1.000 1.000 1.000 1.0005/1/99-6/30/00 0.867 1.013 1.000 1.000 0.987 0.996 1.000 1.004 0.996 1.000 1.000 1.000 1.000 0.9965/1/00-6/30/01 0.854 1.008 1.000 0.996 0.967 1.000 1.000 1.000 1.004 0.996 1.000 1.000 1.000 1.0005/1/01-6/30/02 0.923 0.992 1.008 0.985 1.000 1.000 1.000 1.000 1.000 1.000 1.000 1.000 1.0005/1/02-6/30/03 0.906 1.004 0.996 1.000 1.000 1.000 0.996 1.000 1.000 1.000 1.000 1.0005/1/03-6/30/04 0.892 1.000 1.000 1.000 0.996 0.996 1.000 1.000 1.000 1.000 1.0005/1/04-6/30/05 0.908 0.996 1.004 1.004 0.996 0.996 1.000 1.000 0.996 1.0005/1/05-6/30/06 0.857 1.011 1.000 0.994 1.000 1.000 1.000 1.000 1.0005/1/06-6/30/07 0.818 1.005 0.985 1.000 1.000 1.000 1.000 1.0005/1/07-6/30/08 0.874 1.013 0.994 1.006 1.000 1.006 1.0005/1/08-6/30/09 0.981 1.006 1.000 0.994 1.006 1.0005/1/09-6/30/10 0.850 1.006 0.994 0.988 1.0065/1/10-6/30/11 0.942 0.994 0.978 0.9895/1/11-6/30/12 0.951 1.000 0.9945/1/12-6/30/13 0.837 0.9725/1/13-6/30/14 0.824
All Years Average 0.911 1.004 0.996 0.997 0.997 1.001 0.999 1.000 1.000 0.999 1.001 0.999 1.000 1.000All Years Weighted 0.906 1.004 0.996 0.996 0.996 1.001 0.999 1.000 1.000 0.999 1.001 0.999 1.000 1.0005 Years Weighted 0.879 0.996 0.992 0.995 1.002 1.000 1.000 1.000 0.999 0.999 1.000 1.000 1.000 0.9993 Years Weighted 0.869 0.990 0.989 0.990 1.004 1.002 1.000 1.000 0.998 1.000 1.000 1.000 1.000 0.999All Years excl Hi-Lo 0.890 1.004 0.996 0.997 0.999 1.000 1.000 1.000 1.000 1.000 1.000 1.000 1.000 1.0007 Years excl Hi-Lo 0.891 1.002 0.993 0.996 1.000 0.999 1.000 1.000 0.999 1.000 1.000 1.000 1.000 1.000Prior (4/30/13) 0.932 1.006 1.000 1.000 1.000 1.000 1.000 1.000 1.000 1.000 1.000 1.000 1.000 1.000 1.000
Selected 12-24 24-36 36-48 48-60 60-72 72-84 84-96 96-108 108-120 120-132 132-144 144-156 156-168 168-180 180-ULT
Age to Age 0.885 0.999 0.993 1.000 1.000 1.000 1.000 1.000 1.000 1.000 1.000 1.000 1.000 1.000 1.000Age to Ultimate 0.878 0.992 0.993 1.000 1.000 1.000 1.000 1.000 1.000 1.000 1.000 1.000 1.000 1.000 1.000
Notes:Not all averages are shown. Selected age to age factors are based on a review of all averages and actuarial judgment.
Oliver Wyman Actuarial Consulting, Inc.
77

Exhibit 7
City of Virginia BeachAnalysis of Unpaid Loss & ALAE at June 30, 2015
General LiabilityData as of June 30, 2015
Loss & ALAE Limited to Retention
Comparison of Expected Development to Actual Development
SECTION I - REPORTED LOSS & ALAE ActualSelected Change in Expected Actual Selected
Ultimate Loss Expected Percent Reported Change in Minus Ultimate Loss Change inFiscal & ALAE as of Actual Reported Loss & ALAE as of Reported as of 4/13 - 6/15 Reported Expected & ALAE as of UltimateYears 4/30/13 4/30/13 6/30/15 4/30/13 6/30/15 (2b) - (2a) 4/13 - 6/15 (4) - (5) 6/30/15 Loss & ALAE
(1) (2a) (2b) (3a) (3b) (4) (5) (6) (7) (8)
7/1/04-6/30/05 361,785 359,698 333,698 100.0% 100.0% (26,000) 2,087 (28,087) 333,698 (28,087)7/1/05-6/30/06 516,228 514,271 513,271 99.9% 100.0% (1,000) 1,957 (2,957) 517,284 1,0567/1/06-6/30/07 423,514 396,871 396,899 99.7% 100.0% 28 26,643 (26,615) 421,983 (1,532)7/1/07-6/30/08 1,312,471 1,306,918 1,307,018 99.2% 99.9% 100 4,826 (4,726) 1,310,079 (2,392)7/1/08-6/30/09 402,001 402,001 897,537 98.7% 99.7% 495,535 0 495,535 897,537 495,5357/1/09-6/30/10 950,362 900,456 952,811 97.1% 99.3% 52,355 37,855 14,500 964,844 14,4827/1/10-6/30/11 454,228 406,922 457,692 89.6% 98.8% 50,770 41,810 8,960 474,350 20,1217/1/11-6/30/12 402,442 * 244,625 399,858 75.6% 97.7% 155,234 143,058 12,176 435,132 32,6907/1/12-6/30/13 635,050 * 196,215 301,644 33.5% 90.9% 105,429 378,451 (273,022) 393,905 (241,145)7/1/13-6/30/14 655,228 * 0 374,386 0.0% 80.4% 374,386 527,034 (152,647) 640,762 (14,466)7/1/14-6/30/15 663,768 * 0 179,885 0.0% 42.0% 179,885 278,973 (99,089) 630,610 (33,158)
Total All Years 6,777,077 4,727,978 6,114,700 1,386,722 1,442,694 (55,971) 7,020,182 243,105excl FY14 & FY15 5,458,081 4,727,978 5,560,429 832,451 636,687 195,765 5,748,810 290,729
SECTION II - PAID LOSS & ALAE ActualSelected Change in Expected Actual Selected
Ultimate Loss Expected Percent Paid Change in Minus Ultimate Loss Change inFiscal & ALAE as of Actual Paid Loss & ALAE as of Paid as of 4/13 - 6/15 Paid Expected & ALAE as of UltimateYears 4/30/13 4/30/13 6/30/15 4/30/13 6/30/15 (2b) - (2a) 4/13 - 6/15 (4) - (5) 6/30/15 Loss & ALAE
(1) (2a) (2b) (3a) (3b) (4) (5) (6) (7) (8)
7/1/04-6/30/05 361,785 333,698 333,698 99.8% 100.0% 0 28,087 (28,087) 333,698 (28,087)7/1/05-6/30/06 516,228 509,266 509,266 99.6% 99.9% 0 5,332 (5,332) 517,284 1,0567/1/06-6/30/07 423,514 370,514 371,899 99.3% 99.8% 1,385 37,559 (36,174) 421,983 (1,532)7/1/07-6/30/08 1,312,471 1,305,918 1,305,918 98.5% 99.6% 0 4,802 (4,802) 1,310,079 (2,392)7/1/08-6/30/09 402,001 402,001 897,537 97.2% 99.4% 495,535 0 495,535 897,537 495,5357/1/09-6/30/10 950,362 812,681 950,146 93.7% 98.6% 137,465 108,230 29,236 964,844 14,4827/1/10-6/30/11 454,228 310,115 457,092 84.6% 97.6% 146,977 121,691 25,285 474,350 20,1217/1/11-6/30/12 402,442 * 243,675 244,202 64.8% 94.5% 527 134,187 (133,660) 435,132 32,6907/1/12-6/30/13 635,050 * 157,432 271,111 25.3% 86.7% 113,679 392,300 (278,621) 393,905 (241,145)7/1/13-6/30/14 655,228 * 0 336,186 0.0% 69.5% 336,186 455,408 (119,222) 640,762 (14,466)7/1/14-6/30/15 663,768 * 0 135,676 0.0% 34.1% 135,676 226,151 (90,476) 630,610 (33,158)
Total All Years 6,777,077 4,445,301 5,812,732 1,367,430 1,513,748 (146,318) 7,020,182 243,105excl FY14 & FY15 5,458,081 4,445,301 5,340,870 895,568 832,189 63,380 5,748,810 290,729
Notes:Columns (1), (2a), and (3) are from Oliver Wyman's report using data valued as of April 30, 2013.Column (2b) provided by City of Virginia Beach.Column (5) equals [Column (1) - Column (2a)] x [Column (3b) - Column (3a)] / [1.00 - Column (3a)].Column (7) equals Exhibit 1, Sheet 4, Column (9).Column (8) equals Column (7) - Column (1).* The selected ultimates for fiscal years ending 2012 through 2015 have been revised with updated exposures.
Oliver Wyman Actuarial Consulting, Inc.
78
Exhibit 1Sheet 1
City of Virginia BeachAnalysis of Unpaid Loss & ALAE at June 30, 2015
Automobile LiabilityData as of June 30, 2015
Loss & ALAE Limited to Retention
Summary of Unpaid Loss & ALAE as of June 30, 2016
Selected Total Unpaid % Paid % Paid Expected Total UnpaidUltimate Loss Loss & ALAE Loss & ALAE Loss & ALAE Paid Between Loss & ALAE
Fiscal & ALAE as of as of as of as of 6/30/15 and as ofYears 6/30/15 6/30/15 6/30/15 6/30/16 6/30/16 6/30/16
(1) (2) (3) (4) (5) (6)
7/1/04-6/30/05 1,169,493 0 100.0% 100.0% 0 07/1/05-6/30/06 725,117 0 100.0% 100.0% 0 07/1/06-6/30/07 504,989 0 100.0% 100.0% 0 07/1/07-6/30/08 345,237 0 100.0% 100.0% 0 07/1/08-6/30/09 368,069 0 99.9% 100.0% 0 07/1/09-6/30/10 726,460 0 99.8% 99.9% 0 07/1/10-6/30/11 221,944 0 99.7% 99.8% 0 07/1/11-6/30/12 993,243 141,446 98.1% 99.7% 118,677 22,7697/1/12-6/30/13 460,993 171,470 89.7% 98.1% 140,409 31,0617/1/13-6/30/14 300,439 69,019 58.8% 89.7% 51,813 17,2067/1/14-6/30/15 701,416 495,054 31.8% 58.8% 196,183 298,8717/1/15-6/30/16 762,419 0 0.0% 31.8% 242,269 520,150
Total 7,279,819 876,988 749,350 890,057
Current (Short-term) Liability (excludes FY2016)*: 507,081as a percent of 6/30/15 Liability: 58%
Notes:Column (1) is from Exhibit 1, Sheet 4, Column (9).Column (2) is from Exhibit 1, Sheet 3, Column (6).Columns (3) and (4) are based on Exhibit 6, Sheet 6.Column (5) equals Column (2) x [Column (4) - Column (3)] / [1.0 - Column (3)].Column (6) equals Exhibit 1, Sheet 4, Column (9) - Exhibit 1, Sheet 4, Column (7) - Column (5).* Current (Short-term) liability is calculated as the expected payments during the next 12 months for accidents occurring through the current evaluation date only.
Oliver Wyman Actuarial Consulting, Inc.
79

Exhibit 1Sheet 2
City of Virginia BeachAnalysis of Unpaid Loss & ALAE at June 30, 2015
Automobile LiabilityData as of June 30, 2015
Loss & ALAE Limited to Retention
Summary of Reported Loss & ALAE and IBNR as of June 30, 2016
Selected Total % Reported % Reported Expected TotalUltimate Loss IBNR Loss & ALAE Loss & ALAE Rpt Between IBNR
Fiscal & ALAE as of as of as of as of 6/30/15 and as ofYears 6/30/15 6/30/15 6/30/15 6/30/16 6/30/16 6/30/16
(1) (2) (3) (4) (5) (6)
7/1/04-6/30/05 1,169,493 0 100.0% 100.0% 0 07/1/05-6/30/06 725,117 0 100.0% 100.0% 0 07/1/06-6/30/07 504,989 0 100.0% 100.0% 0 07/1/07-6/30/08 345,237 0 100.0% 100.0% 0 07/1/08-6/30/09 368,069 0 100.0% 100.0% 0 07/1/09-6/30/10 726,460 0 99.9% 100.0% 0 07/1/10-6/30/11 221,944 0 99.8% 99.9% 0 07/1/11-6/30/12 993,243 35,949 99.5% 99.8% 20,762 15,1877/1/12-6/30/13 460,993 104,555 93.7% 99.5% 96,660 7,8947/1/13-6/30/14 300,439 64,000 78.7% 93.7% 45,191 18,8107/1/14-6/30/15 701,416 442,299 42.6% 78.7% 278,134 164,1657/1/15-6/30/16 762,419 0 0.0% 42.6% 324,841 437,578
Total 7,279,819 646,803 765,589 643,634
Notes:Column (1) is from Exhibit 1, Sheet 4, Column (9).Column (2) is from Exhibit 1, Sheet 3, Column (5).Columns (3) and (4) are based on Exhibit 6, Sheet 5.Column (5) equals Column (2) x [Column (4) - Column (3)] / [1.0 - Column (3)].Column (6) equals Exhibit 1, Sheet 4, Column (9) - Exhibit 1, Sheet 4, Column (6) - Column (5).
Oliver Wyman Actuarial Consulting, Inc.
80

Exhibit 1Sheet 3
City of Virginia BeachAnalysis of Unpaid Loss & ALAE at June 30, 2015
Automobile LiabilityData as of June 30, 2015
Loss & ALAE Limited to Retention
Summary of Reserves as of June 30, 2015
Reported Paid Case IBNR Total UnpaidSelected Loss & ALAE Loss & ALAE Reserves Reserves Loss & ALAE
Fiscal Ultimate as of as of as of as of as ofYears Loss & ALAE 6/30/15 6/30/15 6/30/15 6/30/15 6/30/15
(1) (2) (3) (4) (5) (6)
7/1/04-6/30/05 1,169,493 1,169,493 1,169,493 0 0 07/1/05-6/30/06 725,117 725,117 725,117 0 0 07/1/06-6/30/07 504,989 504,989 504,989 0 0 07/1/07-6/30/08 345,237 345,237 345,237 0 0 07/1/08-6/30/09 368,069 368,069 368,069 0 0 07/1/09-6/30/10 726,460 726,460 726,460 0 0 07/1/10-6/30/11 221,944 221,944 221,944 0 0 07/1/11-6/30/12 993,243 957,294 851,797 105,497 35,949 141,4467/1/12-6/30/13 460,993 356,438 289,523 66,915 104,555 171,4707/1/13-6/30/14 300,439 236,439 231,421 5,018 64,000 69,0197/1/14-6/30/15 701,416 259,117 206,362 52,754 442,299 495,054
Total 6,517,400 5,870,597 5,640,412 230,185 646,803 876,988
Notes:Column (1) is from Exhibit 1, Sheet 4, Column (9).Columns (2) and (3) provided by City of Virginia Beach.Column (4) equals Column (2) - Column (3).Column (5) equals Column (1) - Column (2).Column (6) equals Column (4) + Column (5).
Oliver Wyman Actuarial Consulting, Inc.
81

Exhibit 1Sheet 4
City of Virginia BeachAnalysis of Unpaid Loss & ALAE at June 30, 2015
Automobile LiabilityData as of June 30, 2015
Loss & ALAE Limited to Retention
Estimate of Ultimate Loss & ALAE
Reported Paid Reported Paid Reported Paid Implied OpenLoss & ALAE Loss & ALAE Bornhuetter- Bornhuetter- Case Loss & ALAE Loss & ALAE Implied Open and IBNR Selected Implied
Fiscal Development Development Ferguson Ferguson Development as of as of and IBNR Claim Counts Ultimate Loss & ALAEYears Method Method Method Method Method 6/30/15 6/30/15 Claim Counts within Retention Loss & ALAE Cost
(1) (2) (3) (4) (5) (6) (7) (8a) (8b) (9) (10)
7/1/04-6/30/05 1,169,493 1,169,493 1,169,493 1,169,493 1,169,493 1,169,493 1,169,493 0 0 1,169,493 5287/1/05-6/30/06 725,117 725,117 725,117 725,117 725,117 725,117 725,117 0 0 725,117 3257/1/06-6/30/07 504,989 504,989 504,989 504,989 504,989 504,989 504,989 0 0 504,989 2207/1/07-6/30/08 345,237 345,237 345,237 345,237 345,237 345,237 345,237 0 0 345,237 1507/1/08-6/30/09 368,069 368,438 368,069 368,787 368,069 368,069 368,069 0 0 368,069 1577/1/09-6/30/10 727,187 727,914 727,177 727,892 726,460 726,460 726,460 0 0 726,460 3127/1/10-6/30/11 222,388 222,610 223,384 224,103 221,944 221,944 221,944 0 0 221,944 957/1/11-6/30/12 961,840 867,940 960,659 865,040 993,243 957,294 851,797 1 1 993,243 4347/1/12-6/30/13 380,245 322,652 403,264 366,317 460,993 356,438 289,523 5 5 460,993 1937/1/13-6/30/14 300,439 393,490 396,718 541,319 241,815 236,439 231,421 1 1 300,439 1267/1/14-6/30/15 608,160 649,421 694,085 723,410 538,680 259,117 206,362 30 30 701,416 293
Total 6,313,164 6,297,300 6,518,192 6,561,704 6,296,040 5,870,597 5,640,412 38 38 6,517,400
7/1/15-6/30/16 762,419 319
Notes:Column (1) is from Exhibit 2, Sheet 1, Column (3).Column (2) is from Exhibit 2, Sheet 3, Column (3).Column (3) is from Exhibit 2, Sheet 5, Column (5).Column (4) is from Exhibit 2, Sheet 6, Column (5).Column (5) is from Exhibit 2, Sheet 7, Column (6).Columns (6) and (7) provided by City of Virginia Beach.Column (8a) is from Exhibit 4, Sheet 1, Column (6).Column (8b) based on Column (8a) and individual claim detail.Column (9) based on Columns (1) through (8b) and actuarial judgment, fiscal year 7/1/15-6/30/16 is from Exhibit 3, Sheet 1, Column (5).Column (10) equals Column (9) / Number of Vehicles.
Oliver Wyman Actuarial Consulting, Inc.
82

Exhibit 2Sheet 1
City of Virginia BeachAnalysis of Unpaid Loss & ALAE at June 30, 2015
Automobile LiabilityData as of June 30, 2015
Reported Loss & ALAE Development Method
Reported IndicatedLoss & ALAE Age to Ultimate Loss & ALAE
Fiscal as of Ultimate Loss & ALAE Number of CostYears Retention 6/30/15 Factors (1) x (2) Vehicles (3) / (4)
(1) (2) (3) (4) (5)
7/1/04-6/30/05 2,000,000 1,169,493 1.000 1,169,493 2,213 5287/1/05-6/30/06 2,000,000 725,117 1.000 725,117 2,228 3257/1/06-6/30/07 2,000,000 504,989 1.000 504,989 2,294 2207/1/07-6/30/08 2,000,000 345,237 1.000 345,237 2,294 1507/1/08-6/30/09 2,000,000 368,069 1.000 368,069 2,349 1577/1/09-6/30/10 2,000,000 726,460 1.001 727,187 2,330 3127/1/10-6/30/11 2,000,000 221,944 1.002 222,388 2,330 957/1/11-6/30/12 2,000,000 957,294 1.005 961,840 2,286 4217/1/12-6/30/13 2,000,000 356,438 1.067 380,245 2,387 1597/1/13-6/30/14 2,000,000 236,439 1.271 300,439 2,387 1267/1/14-6/30/15 2,000,000 259,117 2.347 608,160 2,390 254
Total 5,870,597 6,313,164 25,488
Notes:Columns (1) and (4) provided by City of Virginia Beach.The age to ultimate factors in Column (2) are based on Exhibit 6, Sheet 5.
Loss & ALAE Limited to Retention
Oliver Wyman Actuarial Consulting, Inc.
83

Exhibit 2Sheet 2
City of Virginia BeachAnalysis of Unpaid Loss & ALAE at June 30, 2015
Automobile LiabilityData as of June 30, 2015
Reported Loss & ALAE Development Method
Section I - Reported Loss & ALAE Limited to $250,000
Reported Estimated IndicatedLoss & ALAE Age to Ultimate Loss & ALAE
Fiscal as of Ultimate Loss & ALAE Number of CostYears 6/30/15 Factors (1) x (2) Vehicles (3) / (4)
(1) (2) (3) (4) (5)
7/1/04-6/30/05 555,682 1.000 555,682 2,213 2517/1/05-6/30/06 725,117 1.000 725,117 2,228 3257/1/06-6/30/07 504,989 1.000 504,989 2,294 2207/1/07-6/30/08 345,237 1.000 345,237 2,294 1507/1/08-6/30/09 368,069 1.000 368,069 2,349 1577/1/09-6/30/10 471,457 1.000 471,457 2,330 2027/1/10-6/30/11 221,944 1.000 221,944 2,330 957/1/11-6/30/12 765,716 1.002 767,332 2,286 3367/1/12-6/30/13 356,438 1.041 371,100 2,387 1557/1/13-6/30/14 236,439 1.146 270,865 2,387 1137/1/14-6/30/15 259,117 1.943 503,374 2,390 211
Total 4,810,205 5,105,167 25,488
Section II - Reported Loss & ALAE Limited to $1,000,000
Reported Estimated IndicatedLoss & ALAE Age to Ultimate Loss & ALAE
Fiscal as of Ultimate Loss & ALAE Number of CostYears 6/30/15 Factors (1) x (2) Vehicles (3) / (4)
(1) (2) (3) (4) (5)
7/1/04-6/30/05 1,169,493 1.000 1,169,493 2,213 5287/1/05-6/30/06 725,117 1.000 725,117 2,228 3257/1/06-6/30/07 504,989 1.000 504,989 2,294 2207/1/07-6/30/08 345,237 1.000 345,237 2,294 1507/1/08-6/30/09 368,069 1.000 368,069 2,349 1577/1/09-6/30/10 726,460 1.000 726,460 2,330 3127/1/10-6/30/11 221,944 1.001 222,166 2,330 957/1/11-6/30/12 957,294 1.004 961,001 2,286 4207/1/12-6/30/13 356,438 1.064 379,251 2,387 1597/1/13-6/30/14 236,439 1.267 299,654 2,387 1267/1/14-6/30/15 259,117 2.341 606,571 2,390 254
Total 5,870,597 6,308,007 25,488
Section III - Reported Loss & ALAE Limited to $2,000,000
Reported Estimated IndicatedLoss & ALAE Age to Ultimate Loss & ALAE
Fiscal as of Ultimate Loss & ALAE Number of CostYears 6/30/15 Factors (1) x (2) Vehicles (3) / (4)
(1) (2) (3) (4) (5)
7/1/04-6/30/05 1,169,493 1.000 1,169,493 2,213 5287/1/05-6/30/06 725,117 1.000 725,117 2,228 3257/1/06-6/30/07 504,989 1.000 504,989 2,294 2207/1/07-6/30/08 345,237 1.000 345,237 2,294 1507/1/08-6/30/09 368,069 1.000 368,069 2,349 1577/1/09-6/30/10 726,460 1.001 727,187 2,330 3127/1/10-6/30/11 221,944 1.002 222,388 2,330 957/1/11-6/30/12 957,294 1.005 961,840 2,286 4217/1/12-6/30/13 356,438 1.067 380,245 2,387 1597/1/13-6/30/14 236,439 1.271 300,439 2,387 1267/1/14-6/30/15 259,117 2.347 608,160 2,390 254
Total 5,870,597 6,313,164 25,488
Notes:Columns (1) and (4) provided by City of Virginia Beach.The age to ultimate factors in Column (2) are based on Exhibit 6, Sheets 1, 3, and 5.
Oliver Wyman Actuarial Consulting, Inc.
84

Exhibit 2Sheet 3
City of Virginia BeachAnalysis of Unpaid Loss & ALAE at June 30, 2015
Automobile LiabilityData as of June 30, 2015
Paid Loss & ALAE Development Method
Paid IndicatedLoss & ALAE Age to Ultimate Loss & ALAE
Fiscal as of Ultimate Loss & ALAE Number of CostYears Retention 6/30/15 Factors (1) x (2) Vehicles (3) / (4)
(1) (2) (3) (4) (5)
7/1/04-6/30/05 2,000,000 1,169,493 1.000 1,169,493 2,213 5287/1/05-6/30/06 2,000,000 725,117 1.000 725,117 2,228 3257/1/06-6/30/07 2,000,000 504,989 1.000 504,989 2,294 2207/1/07-6/30/08 2,000,000 345,237 1.000 345,237 2,294 1507/1/08-6/30/09 2,000,000 368,069 1.001 368,438 2,349 1577/1/09-6/30/10 2,000,000 726,460 1.002 727,914 2,330 3127/1/10-6/30/11 2,000,000 221,944 1.003 222,610 2,330 967/1/11-6/30/12 2,000,000 851,797 1.019 867,940 2,286 3807/1/12-6/30/13 2,000,000 289,523 1.114 322,652 2,387 1357/1/13-6/30/14 2,000,000 231,421 1.700 393,490 2,387 1657/1/14-6/30/15 2,000,000 206,362 3.147 649,421 2,390 272
Total 5,640,412 6,297,300 25,488
Notes:Columns (1) and (4) provided by City of Virginia Beach.The age to ultimate factors in Column (2) are based on Exhibit 6, Sheet 6.
Loss & ALAE Limited to Retention
Oliver Wyman Actuarial Consulting, Inc.
85

Exhibit 2Sheet 4
City of Virginia BeachAnalysis of Unpaid Loss & ALAE at June 30, 2015
Automobile LiabilityData as of June 30, 2015
Paid Loss & ALAE Development Method
Section I - Paid Loss & ALAE Limited to $250,000
Paid Estimated IndicatedLoss & ALAE Age to Ultimate Loss & ALAE
Fiscal as of Ultimate Loss & ALAE Number of CostYears 6/30/15 Factors (1) x (2) Vehicles (3) / (4)
(1) (2) (3) (4) (5)
7/1/04-6/30/05 555,682 1.000 555,682 2,213 2517/1/05-6/30/06 725,117 1.000 725,117 2,228 3257/1/06-6/30/07 504,989 1.000 504,989 2,294 2207/1/07-6/30/08 345,237 1.000 345,237 2,294 1507/1/08-6/30/09 368,069 1.000 368,069 2,349 1577/1/09-6/30/10 471,457 1.000 471,457 2,330 2027/1/10-6/30/11 221,944 1.001 222,166 2,330 957/1/11-6/30/12 660,219 1.011 667,364 2,286 2927/1/12-6/30/13 289,523 1.071 310,216 2,387 1307/1/13-6/30/14 231,421 1.301 301,101 2,387 1267/1/14-6/30/15 206,362 2.321 478,949 2,390 200
Total 4,580,020 4,950,347 25,488
Section II - Paid Loss & ALAE Limited to $1,000,000
Paid Estimated IndicatedLoss & ALAE Age to Ultimate Loss & ALAE
Fiscal as of Ultimate Loss & ALAE Number of CostYears 6/30/15 Factors (1) x (2) Vehicles (3) / (4)
(1) (2) (3) (4) (5)
7/1/04-6/30/05 1,169,493 1.000 1,169,493 2,213 5287/1/05-6/30/06 725,117 1.000 725,117 2,228 3257/1/06-6/30/07 504,989 1.000 504,989 2,294 2207/1/07-6/30/08 345,237 1.000 345,237 2,294 1507/1/08-6/30/09 368,069 1.000 368,069 2,349 1577/1/09-6/30/10 726,460 1.001 727,187 2,330 3127/1/10-6/30/11 221,944 1.002 222,388 2,330 957/1/11-6/30/12 851,797 1.016 865,120 2,286 3787/1/12-6/30/13 289,523 1.104 319,527 2,387 1347/1/13-6/30/14 231,421 1.638 378,959 2,387 1597/1/14-6/30/15 206,362 3.031 625,440 2,390 262
Total 5,640,412 6,251,526 25,488
Section III - Paid Loss & ALAE Limited to $2,000,000
Paid Estimated IndicatedLoss & ALAE Age to Ultimate Loss & ALAE
Fiscal as of Ultimate Loss & ALAE Number of CostYears 6/30/15 Factors (1) x (2) Vehicles (3) / (4)
(1) (2) (3) (4) (5)
7/1/04-6/30/05 1,169,493 1.000 1,169,493 2,213 5287/1/05-6/30/06 725,117 1.000 725,117 2,228 3257/1/06-6/30/07 504,989 1.000 504,989 2,294 2207/1/07-6/30/08 345,237 1.000 345,237 2,294 1507/1/08-6/30/09 368,069 1.001 368,438 2,349 1577/1/09-6/30/10 726,460 1.002 727,914 2,330 3127/1/10-6/30/11 221,944 1.003 222,610 2,330 967/1/11-6/30/12 851,797 1.019 867,940 2,286 3807/1/12-6/30/13 289,523 1.114 322,652 2,387 1357/1/13-6/30/14 231,421 1.700 393,490 2,387 1657/1/14-6/30/15 206,362 3.147 649,421 2,390 272
Total 5,640,412 6,297,300 25,488
Notes:Columns (1) and (4) provided by City of Virginia Beach.The age to ultimate factors in Column (2) are based on Exhibit 6, Sheets 2, 4, and 6.
Oliver Wyman Actuarial Consulting, Inc.
86

Exhibit 2Sheet 5
City of Virginia BeachAnalysis of Unpaid Loss & ALAE at June 30, 2015
Automobile LiabilityData as of June 30, 2015
Loss & ALAE Limited to Retention
Reported Bornhuetter-Ferguson Method
Expected Reported EstimatedEstimate Age to Loss & ALAE Ultimate Indicated
Fiscal of Ultimate Ultimate Unreported as of Loss & ALAE Loss & ALAEYears Loss & ALAE Factors Loss & ALAE 6/30/15 (3) + (4) Cost
(1) (2) (3) (4) (5) (6)
7/1/04-6/30/05 660,997 1.000 0 1,169,493 1,169,493 5287/1/05-6/30/06 669,470 1.000 0 725,117 725,117 3257/1/06-6/30/07 693,438 1.000 0 504,989 504,989 2207/1/07-6/30/08 697,598 1.000 0 345,237 345,237 1507/1/08-6/30/09 718,609 1.000 0 368,069 368,069 1577/1/09-6/30/10 717,074 1.001 716 726,460 727,177 3127/1/10-6/30/11 721,376 1.002 1,441 221,944 223,384 967/1/11-6/30/12 712,000 1.005 3,366 957,294 960,659 4207/1/12-6/30/13 747,918 1.067 46,825 356,438 403,264 1697/1/13-6/30/14 752,406 1.271 160,279 236,439 396,718 1667/1/14-6/30/15 757,872 2.347 434,968 259,117 694,085 290
Total 7,848,759 647,596 5,870,597 6,518,192
Notes:Column (1) is from Exhibit 3, Sheet 1, Column (5).The age to ultimate factors in Column (2) are based on Exhibit 6, Sheet 5.Column (3) equals Column (1) x [1.0 - 1.0 / Column (2)].Column (4) provided by City of Virginia Beach.Column (6) equals Column (5) / Number of Vehicles.
Oliver Wyman Actuarial Consulting, Inc.
87

Exhibit 2Sheet 6
City of Virginia BeachAnalysis of Unpaid Loss & ALAE at June 30, 2015
Automobile LiabilityData as of June 30, 2015
Loss & ALAE Limited to Retention
Paid Bornhuetter-Ferguson Method
Expected Paid EstimatedEstimate Age to Loss & ALAE Ultimate Indicated
Fiscal of Ultimate Ultimate Unpaid as of Loss & ALAE Loss & ALAEYears Loss & ALAE Factors Loss & ALAE 6/30/15 (3) + (4) Cost
(1) (2) (3) (4) (5) (6)
7/1/04-6/30/05 660,997 1.000 0 1,169,493 1,169,493 5287/1/05-6/30/06 669,470 1.000 0 725,117 725,117 3257/1/06-6/30/07 693,438 1.000 0 504,989 504,989 2207/1/07-6/30/08 697,598 1.000 0 345,237 345,237 1507/1/08-6/30/09 718,609 1.001 718 368,069 368,787 1577/1/09-6/30/10 717,074 1.002 1,432 726,460 727,892 3127/1/10-6/30/11 721,376 1.003 2,160 221,944 224,103 967/1/11-6/30/12 712,000 1.019 13,243 851,797 865,040 3787/1/12-6/30/13 747,918 1.114 76,794 289,523 366,317 1537/1/13-6/30/14 752,406 1.700 309,898 231,421 541,319 2277/1/14-6/30/15 757,872 3.147 517,048 206,362 723,410 303
Total 7,848,759 921,292 5,640,412 6,561,704
Notes:Column (1) is from Exhibit 3, Sheet 1, Column (5).The age to ultimate factors in Column (2) are based on Exhibit 6, Sheet 6.Column (3) equals Column (1) x [1.0 - 1.0 / Column (2)].Column (4) provided by City of Virginia Beach.Column (6) equals Column (5) / Number of Vehicles.
Oliver Wyman Actuarial Consulting, Inc.
88

Exhibit 2Sheet 7
City of Virginia BeachAnalysis of Unpaid Loss & ALAE at June 30, 2015
Automobile LiabilityData as of June 30, 2015
Loss & ALAE Limited to Retention
Case Development Method
CasePaid Outstanding Percent Percent Incurred
Loss & ALAE Loss & ALAE of Ultimate of Ultimate But Not Estimated IndicatedFiscal as of as of Loss & ALAE Loss & ALAE Reported Ultimate Loss & ALAEYears 6/30/15 6/30/15 Reported Paid Loss & ALAE Loss & ALAE Cost
(1) (2) (3) (4) (5) (6) (7)
7/1/04-6/30/05 1,169,493 0 100.0% 100.0% 0 1,169,493 5287/1/05-6/30/06 725,117 0 100.0% 100.0% 0 725,117 3257/1/06-6/30/07 504,989 0 100.0% 100.0% 0 504,989 2207/1/07-6/30/08 345,237 0 100.0% 100.0% 0 345,237 1507/1/08-6/30/09 368,069 0 100.0% 99.9% 0 368,069 1577/1/09-6/30/10 726,460 0 99.9% 99.8% 0 726,460 3127/1/10-6/30/11 221,944 0 99.8% 99.7% 0 221,944 957/1/11-6/30/12 851,797 105,497 99.5% 98.1% 35,949 993,243 4347/1/12-6/30/13 289,523 66,915 93.7% 89.7% 104,555 460,993 1937/1/13-6/30/14 231,421 5,018 78.7% 58.8% 5,376 241,815 1017/1/14-6/30/15 206,362 52,754 42.6% 31.8% 279,564 538,680 225
Total 5,640,412 230,185 425,443 6,296,040
Notes:Columns (1) and (2) provided by City of Virginia Beach.The factors in Column (3) equal 1.0 / Exhibit 2, Sheet 1, Column (2).The factors in Column (4) equal 1.0 / Exhibit 2, Sheet 3, Column (2).Column (5) equals Column (2) x [1.0 - Column (3)] / [Column (3) - Column (4)].Column (6) equals Column (1) + Column (2) + Column (5).Column (7) equals Column (6) / Number of Vehicles.
Oliver Wyman Actuarial Consulting, Inc.
89
Exhibit 3Sheet 1
City of Virginia BeachAnalysis of Unpaid Loss & ALAE at June 30, 2015
Automobile LiabilityData as of June 30, 2015
Loss Cost Method Summary
Smoothed Smoothed SmoothedSelected Selected Retained Estimated
Fiscal Loss & ALAE Loss & ALAE Loss & ALAE Number of UltimateYears Cost @ $1,000,000 Cost @ $2,000,000 Cost Vehicles Loss & ALAE
(1) (2) (3) (4) (5)
7/1/04-6/30/05 266 299 299 2,213 660,9977/1/05-6/30/06 267 300 300 2,228 669,4707/1/06-6/30/07 268 302 302 2,294 693,4387/1/07-6/30/08 270 304 304 2,294 697,5987/1/08-6/30/09 271 306 306 2,349 718,6097/1/09-6/30/10 272 308 308 2,330 717,0747/1/10-6/30/11 273 310 310 2,330 721,3767/1/11-6/30/12 274 311 311 2,286 712,0007/1/12-6/30/13 275 313 313 2,387 747,9187/1/13-6/30/14 276 315 315 2,387 752,4067/1/14-6/30/15 277 317 317 2,390 757,872
Total 25,488 7,848,759
7/1/15-6/30/16 at retention $2,000,000 319 2,390 762,419
SELECTED LOSS & ALAE COST AT THE 7/1/14-6/30/15 LEVEL
Selected loss cost - Limited to $250,000 (from Exhibit 3, Sheet 2) 206
Indicated loss cost - Limited to $1,000,000 (from Exhibit 3, Sheet 3) 258Increased limits factor from $250K to $1M * 1.346 Indicated lost cost - Limited to $1,000,000 using industry $250K to $1M ILF 277Selected lost cost - Limited to $1,000,000 277
Indicated loss cost - Limited to $2,000,000 (from Exhibit 3, Sheet 4) 261Increased limits factor from $1M to $2M * 1.144 Indicated lost cost - Limited to $2,000,000 using industry $1M to $2M ILF 317Selected lost cost - Limited to $2,000,000 317
Notes:Columns (1) and (2) are the selected fiscal year 7/1/14-6/30/15 loss cost, detrended at an annual rate of 0.40% and 0.60% at retention $1M and $2M, respectively.Column (3) is the selected fiscal year loss cost at the respective historical retention.Column (4) provided by City of Virginia Beach.Column (5) equals Column (3) x Column (4).* Increased limits factors based on industry information.
Oliver Wyman Actuarial Consulting, Inc.
90

Exhibit 3Sheet 2
City of Virginia BeachAnalysis of Unpaid Loss & ALAE at June 30, 2015
Automobile LiabilityData as of June 30, 2015
Loss Cost Method, Loss & ALAE Limited to $250,000
Initial AdjustmentEstimated to FY2015 Adjustment Adjusted Trended
Fiscal Ultimate Benefit Number of to FY2015 Vehicles Indicated to FY2015Years Loss & ALAE Level Vehicles Exposure (3) x (4) Loss Cost Loss Cost
(1) (2) (3) (4) (5) (6) (7)
7/1/04-6/30/05 555,682 1.000 2,213 1.000 2,213 251 2517/1/05-6/30/06 725,117 1.000 2,228 1.000 2,228 325 3257/1/06-6/30/07 504,989 1.000 2,294 1.000 2,294 220 2207/1/07-6/30/08 345,237 1.000 2,294 1.000 2,294 150 1507/1/08-6/30/09 368,069 1.000 2,349 1.000 2,349 157 1577/1/09-6/30/10 471,457 1.000 2,330 1.000 2,330 202 2027/1/10-6/30/11 221,944 1.000 2,330 1.000 2,330 95 957/1/11-6/30/12 801,665 1.000 2,286 1.000 2,286 351 3517/1/12-6/30/13 460,993 1.000 2,387 1.000 2,387 193 1937/1/13-6/30/14 300,439 1.000 2,387 1.000 2,387 126 1267/1/14-6/30/15 491,162 1.000 2,390 1.000 2,390 206 206
Total 5,246,754 25,488 25,488
AVERAGES AT THE 7/1/14-6/30/15 LEVEL
Average of fiscal years 7/1/04-6/30/05 through 7/1/13-6/30/14: 207Average of fiscal years 7/1/04-6/30/05 through 7/1/13-6/30/14 excluding extremes: 203Weighted average of fiscal years 7/1/04-6/30/05 through 7/1/13-6/30/14: 206Weighted average of fiscal years 7/1/06-6/30/07 through 7/1/13-6/30/14: 186Weighted average of fiscal years 7/1/07-6/30/08 through 7/1/13-6/30/14: 181Selected 7/1/14-6/30/15 loss & ALAE cost: 206
Notes:Column (1) based on the reported and paid development methods from Exhibit 2, Sheet 2, Column (3)
and Exhibit 2, Sheet 4, Column (3), respectively, and actuarial judgment.Column (2) not used for this line of business.Column (3) provided by City of Virginia Beach.Column (4) not used in this study.Column (6) equals Column (1) x Column (2) / Column (5).Column (7) equals Column (6) x the selected loss & ALAE cost trend of 0.00%.
Oliver Wyman Actuarial Consulting, Inc.
91
Exhibit 3Sheet 3
Initial AdjustmentEstimated to FY2015 Adjustment Adjusted Trended
Fiscal Ultimate Benefit Number of to FY2015 Vehicles Indicated to FY2015Years Loss & ALAE Level Vehicles Exposure (3) x (4) Loss Cost Loss Cost
(1) (2) (3) (4) (5) (6) (7)
7/1/04-6/30/05 1,169,493 1.000 2,213 1.000 2,213 528 5507/1/05-6/30/06 725,117 1.000 2,228 1.000 2,228 325 3377/1/06-6/30/07 504,989 1.000 2,294 1.000 2,294 220 2277/1/07-6/30/08 345,237 1.000 2,294 1.000 2,294 150 1557/1/08-6/30/09 368,069 1.000 2,349 1.000 2,349 157 1607/1/09-6/30/10 726,460 1.000 2,330 1.000 2,330 312 3187/1/10-6/30/11 221,944 1.000 2,330 1.000 2,330 95 977/1/11-6/30/12 993,243 1.000 2,286 1.000 2,286 434 4407/1/12-6/30/13 460,993 1.000 2,387 1.000 2,387 193 1957/1/13-6/30/14 300,439 1.000 2,387 1.000 2,387 126 1267/1/14-6/30/15 616,005 1.000 2,390 1.000 2,390 258 258
Total 6,431,989 25,488 25,488
AVERAGES AT THE 7/1/14-6/30/15 LEVEL
Average of fiscal years 7/1/04-6/30/05 through 7/1/13-6/30/14: 261Average of fiscal years 7/1/04-6/30/05 through 7/1/13-6/30/14 excluding extremes: 245Weighted average of fiscal years 7/1/04-6/30/05 through 7/1/13-6/30/14: 258Weighted average of fiscal years 7/1/06-6/30/07 through 7/1/13-6/30/14: 214Weighted average of fiscal years 7/1/07-6/30/08 through 7/1/13-6/30/14: 212Indicated 7/1/14-6/30/15 loss & ALAE cost: 258
Notes:Column (1) based on the reported and paid development methods from Exhibit 2, Sheet 2, Column (3)
and Exhibit 2, Sheet 4, Column (3), respectively, and actuarial judgment.Column (2) not used for this line of business.Column (3) provided by City of Virginia Beach.Column (4) not used in this study.Column (6) equals Column (1) x Column (2) / Column (5).Column (7) equals Column (6) x the selected loss & ALAE cost trend of 0.40%.
Loss Cost Method, Loss & ALAE Limited to $1,000,000
City of Virginia BeachAnalysis of Unpaid Loss & ALAE at June 30, 2015
Automobile LiabilityData as of June 30, 2015
Oliver Wyman Actuarial Consulting, Inc.
92

Exhibit 3Sheet 4
Initial AdjustmentEstimated to FY2015 Adjustment Adjusted Trended
Fiscal Ultimate Benefit Number of to FY2015 Vehicles Indicated to FY2015Years Loss & ALAE Level Vehicles Exposure (3) x (4) Loss Cost Loss Cost
(1) (2) (3) (4) (5) (6) (7)
7/1/04-6/30/05 1,169,493 1.000 2,213 1.000 2,213 528 5617/1/05-6/30/06 725,117 1.000 2,228 1.000 2,228 325 3437/1/06-6/30/07 504,989 1.000 2,294 1.000 2,294 220 2317/1/07-6/30/08 345,237 1.000 2,294 1.000 2,294 150 1577/1/08-6/30/09 368,069 1.000 2,349 1.000 2,349 157 1627/1/09-6/30/10 726,460 1.000 2,330 1.000 2,330 312 3217/1/10-6/30/11 221,944 1.000 2,330 1.000 2,330 95 987/1/11-6/30/12 993,243 1.000 2,286 1.000 2,286 434 4427/1/12-6/30/13 460,993 1.000 2,387 1.000 2,387 193 1957/1/13-6/30/14 300,439 1.000 2,387 1.000 2,387 126 1277/1/14-6/30/15 628,791 1.000 2,390 1.000 2,390 263 263
Total 6,444,775 25,488 25,488
AVERAGES AT THE 7/1/14-6/30/15 LEVEL
Average of fiscal years 7/1/04-6/30/05 through 7/1/13-6/30/14: 264Average of fiscal years 7/1/04-6/30/05 through 7/1/13-6/30/14 excluding extremes: 247Weighted average of fiscal years 7/1/04-6/30/05 through 7/1/13-6/30/14: 261Weighted average of fiscal years 7/1/06-6/30/07 through 7/1/13-6/30/14: 216Weighted average of fiscal years 7/1/07-6/30/08 through 7/1/13-6/30/14: 214Indicated 7/1/14-6/30/15 loss & ALAE cost: 261
Notes:Column (1) based on the reported and paid development methods from Exhibit 2, Sheet 2, Column (3)
and Exhibit 2, Sheet 4, Column (3), respectively, and actuarial judgment.Column (2) not used for this line of business.Column (3) provided by City of Virginia Beach.Column (4) not used in this study.Column (6) equals Column (1) x Column (2) / Column (5).Column (7) equals Column (6) x the selected loss & ALAE cost trend of 0.60%.
Loss Cost Method, Loss & ALAE Limited to $2,000,000
City of Virginia BeachAnalysis of Unpaid Loss & ALAE at June 30, 2015
Automobile LiabilityData as of June 30, 2015
Oliver Wyman Actuarial Consulting, Inc.
93

Exhibit 3Sheet 5
City of Virginia BeachAnalysis of Unpaid Loss & ALAE at June 30, 2015
Automobile LiabilityData as of June 30, 2015
Loss & ALAE Limited to $250,000
Average Severity Method
Initial Adjustment Trended EstimatedEstimated to FY2015 Selected Indicated to FY2015 Ultimate Indicated
Fiscal Ultimate Benefit Ultimate Average Average Fitted Loss & ALAE Loss & ALAEYears Loss & ALAE Level Claim Counts Severity Severity Severity (3) x (6) Cost
(1) (2) (3) (4) (5) (6) (7) (8)
7/1/04-6/30/05 555,682 1.000 112 4,961 4,961 5,971 668,731 302.27/1/05-6/30/06 725,117 1.000 99 7,324 7,324 5,971 591,111 265.37/1/06-6/30/07 504,989 1.000 106 4,764 4,764 5,971 632,907 275.97/1/07-6/30/08 345,237 1.000 87 3,968 3,968 5,971 519,461 226.47/1/08-6/30/09 368,069 1.000 71 5,184 5,184 5,971 423,928 180.57/1/09-6/30/10 471,457 1.000 59 7,991 7,991 5,971 352,278 151.27/1/10-6/30/11 221,944 1.000 59 3,762 3,762 5,971 352,278 151.27/1/11-6/30/12 801,665 1.000 76 10,548 10,548 5,971 453,782 198.57/1/12-6/30/13 460,993 1.000 61 7,550 7,550 5,971 364,584 152.77/1/13-6/30/14 300,439 1.000 66 4,524 4,524 5,971 396,532 166.17/1/14-6/30/15 491,162 1.000 80 6,127 6,127 5,971 478,674 200.3
Total 5,246,754 877 5,234,266
AVERAGES AT THE 7/1/14-6/30/15 LEVEL
Average of fiscal years 7/1/04-6/30/05 through 7/1/13-6/30/14: 6,058Average of fiscal years 7/1/04-6/30/05 through 7/1/13-6/30/14 excluding extremes: 5,783Weighted average of fiscal years 7/1/04-6/30/05 through 7/1/13-6/30/14: 5,971Weighted average of fiscal years 7/1/06-6/30/07 through 7/1/13-6/30/14: 5,935Weighted average of fiscal years 7/1/08-6/30/09 through 7/1/13-6/30/14: 6,687Selected 7/1/14-6/30/15 severity: 5,971
Notes:Column (1) based on the reported and paid development methods from Exhibit 2, Sheet 2, Column (3)
and Exhibit 2, Sheet 4, Column (3), respectively, and actuarial judgment.Column (2) not used for this line of business.Column (3) is from Exhibit 4, Sheet 1, Column (3).Column (4) equals Column (1) x Column (2) / Column (3).Column (5) equals Column (4) x the selected severity trend of 0.00%.Column (6) for all fiscal years is the selected fiscal year 7/1/14-6/30/15 severity,
detrended at an annual rate of 0.00%, and adjusted to the appropriate benefit level (if applicable).Column (8) equals Column (7) / Number of Vehicles.
Oliver Wyman Actuarial Consulting, Inc.
94

Exhibit 3Sheet 6
City of Virginia BeachAnalysis of Unpaid Loss & ALAE at June 30, 2015
Automobile LiabilityData as of June 30, 2015
FREQUENCY TREND
SEVERITY TREND
LOSS COST TREND
Notes:The selected frequency trend is 0.00%.The selected severity trend is 0.00%.The selected loss cost trend is 0.00%.The severity and loss cost trends (for both Indicated and Fitted lines) are shown at a $250,000 per occurrence limit.
0.0
10.0
20.0
30.0
40.0
50.0
60.0
2005 2006 2007 2008 2009 2010 2011 2012 2013 2014 2015
FREQ
UEN
CY
0
2,000
4,000
6,000
8,000
10,000
12,000
2005 2006 2007 2008 2009 2010 2011 2012 2013 2014 2015
SEVER
ITY
0
50
100
150
200
250
300
350
400
2005 2006 2007 2008 2009 2010 2011 2012 2013 2014 2015
LOSS COST
FISCAL YEAR ENDINGIndicated Fitted
Oliver Wyman Actuarial Consulting, Inc.
95

Exhibit 4Sheet 1
City of Virginia BeachAnalysis of Unpaid Loss & ALAE at June 30, 2015
Automobile LiabilityData as of June 30, 2015
Estimate of Ultimate Claim Counts
Reported Reported Closed Implied OpenClaim Bornhuetter- Selected Claim Counts and IBNR
Fiscal Development Ferguson Ultimate Implied as of Claim CountsYears Method Method Claim Counts Frequency 6/30/15 (3) - (5)
(1) (2) (3) (4) (5) (6)
7/1/04-6/30/05 112 112 112 50.6 112 07/1/05-6/30/06 99 99 99 44.4 99 07/1/06-6/30/07 106 106 106 46.2 106 07/1/07-6/30/08 87 87 87 37.9 87 07/1/08-6/30/09 71 71 71 30.2 71 07/1/09-6/30/10 59 59 59 25.3 59 07/1/10-6/30/11 59 59 59 25.3 59 07/1/11-6/30/12 76 76 76 33.2 75 17/1/12-6/30/13 61 61 61 25.6 56 57/1/13-6/30/14 66 66 66 27.8 65 17/1/14-6/30/15 80 80 80 33.5 50 30
Total 877 877 877 34.4 839 38
Notes:Columns (1) and (2) are from Exhibit 4, Sheet 2, Columns (3) and (8), respectively.Column (3) based on Columns (1) and (2) and actuarial judgment.Column (4) equals Column (3) / Number of Vehicles x 1,000.Column (5) provided by City of Virginia Beach.
Oliver Wyman Actuarial Consulting, Inc.
96

Exhibit 4Sheet 2
City of Virginia BeachAnalysis of Unpaid Loss & ALAE at June 30, 2015
Automobile LiabilityData as of June 30, 2015
Reported Claim Methods, excluding Claims Closed without Payment
Reported Estimated Trended ReportedClaim Counts Age to Ultimate Indicated to FY2015 Bornhuetter-
Fiscal as of Ultimate Claim Counts Number of Frequency Frequency Fitted FergusonYears 6/30/15 Factors (1) x (2) Vehicles (3) / (4) x 1,000 (5) x trend Frequency Method
(1) (2) (3) (4) (5) (6) (7) (8)
7/1/04-6/30/05 112 1.000 112 2,213 50.6 50.6 27.9 1127/1/05-6/30/06 99 1.000 99 2,228 44.4 44.4 27.9 997/1/06-6/30/07 106 1.000 106 2,294 46.2 46.2 27.9 1067/1/07-6/30/08 87 1.000 87 2,294 37.9 37.9 27.9 877/1/08-6/30/09 71 1.000 71 2,349 30.2 30.2 27.9 717/1/09-6/30/10 59 1.000 59 2,330 25.3 25.3 27.9 597/1/10-6/30/11 59 1.000 59 2,330 25.3 25.3 27.9 597/1/11-6/30/12 76 1.000 76 2,286 33.2 33.2 27.9 767/1/12-6/30/13 61 1.001 61 2,387 25.6 25.6 27.9 617/1/13-6/30/14 66 1.006 66 2,387 27.8 27.8 27.9 667/1/14-6/30/15 81 0.988 80 2,390 33.5 33.5 27.9 80
Total 877 877 25,488 877
AVERAGES AT THE 7/1/14-6/30/15 LEVEL
Average of fiscal years 7/1/04-6/30/05 through 7/1/13-6/30/14: 34.7Average of fiscal years 7/1/04-6/30/05 through 7/1/13-6/30/14 excluding extremes: 33.8Weighted average of fiscal years 7/1/04-6/30/05 through 7/1/13-6/30/14: 34.5Weighted average of fiscal years 7/1/08-6/30/09 through 7/1/13-6/30/14: 27.9Selected 7/1/14-6/30/15 frequency: 27.9
Notes:Columns (1) and (4) provided by City of Virginia Beach.The age to ultimate factors in Column (2) are derived from Exhibit 6, Sheet 7.The selected frequency trend used in Column (6) is 0.00%.Column (7) for all fiscal years is the selected fiscal year 7/1/14-6/30/15 frequency, detrended at an annual rate of 0.00%.Column (8) equals Column (1) + Column (4) x Column (7) x [1.0 - 1.0 / Column (2)] / 1,000].
Oliver Wyman Actuarial Consulting, Inc.
97
Exhibit 5Sheet 1
City of Virginia BeachAnalysis of Unpaid Loss & ALAE at June 30, 2015
Automobile LiabilityData as of June 30, 2015
Summary of Loss Data Valued as of June 30, 2015
Reported Open Unlimited Loss & ALAE Loss & ALAE Excess of $250K Loss & ALAE Excess of $1M Loss & ALAE Excess of $2MFiscal Claim Claim CaseYears Retention Counts Counts Paid Reserves Reported Paid Reported Paid Reported Paid Reported
(1) (2) (3) (4) (5) (6) (7) (8) (9) (10) (11)
7/1/04-6/30/05 2,000,000 112 0 1,169,493 0 1,169,493 613,811 613,811 0 0 0 07/1/05-6/30/06 2,000,000 99 0 725,117 0 725,117 0 0 0 0 0 07/1/06-6/30/07 2,000,000 106 0 504,989 0 504,989 0 0 0 0 0 07/1/07-6/30/08 2,000,000 87 0 345,237 0 345,237 0 0 0 0 0 07/1/08-6/30/09 2,000,000 71 0 368,069 0 368,069 0 0 0 0 0 07/1/09-6/30/10 2,000,000 59 0 726,460 0 726,460 255,003 255,003 0 0 0 07/1/10-6/30/11 2,000,000 59 0 221,944 0 221,944 0 0 0 0 0 07/1/11-6/30/12 2,000,000 76 1 851,797 105,497 957,294 191,578 191,578 0 0 0 07/1/12-6/30/13 2,000,000 61 5 289,523 66,915 356,438 0 0 0 0 0 07/1/13-6/30/14 2,000,000 66 1 231,421 5,018 236,439 0 0 0 0 0 07/1/14-6/30/15 2,000,000 81 31 206,362 52,754 259,117 0 0 0 0 0 0
Total 877 38 5,640,412 230,185 5,870,597 1,060,392 1,060,392 0 0 0 0
Loss & ALAE Limited to $250,000 Loss & ALAE Limited to $1,000,000 Loss & ALAE Limited to $2,000,000 Loss & ALAE Limited to RetentionFiscal Case Case Case CaseYears Paid Reserves Reported Paid Reserves Reported Paid Reserves Reported Paid Reserves Reported
(12) (13) (14) (15) (16) (17) (18) (19) (20) (21) (22) (23)
7/1/04-6/30/05 555,682 0 555,682 1,169,493 0 1,169,493 1,169,493 0 1,169,493 1,169,493 0 1,169,4937/1/05-6/30/06 725,117 0 725,117 725,117 0 725,117 725,117 0 725,117 725,117 0 725,1177/1/06-6/30/07 504,989 0 504,989 504,989 0 504,989 504,989 0 504,989 504,989 0 504,9897/1/07-6/30/08 345,237 0 345,237 345,237 0 345,237 345,237 0 345,237 345,237 0 345,2377/1/08-6/30/09 368,069 0 368,069 368,069 0 368,069 368,069 0 368,069 368,069 0 368,0697/1/09-6/30/10 471,457 0 471,457 726,460 0 726,460 726,460 0 726,460 726,460 0 726,4607/1/10-6/30/11 221,944 0 221,944 221,944 0 221,944 221,944 0 221,944 221,944 0 221,9447/1/11-6/30/12 660,219 105,497 765,716 851,797 105,497 957,294 851,797 105,497 957,294 851,797 105,497 957,2947/1/12-6/30/13 289,523 66,915 356,438 289,523 66,915 356,438 289,523 66,915 356,438 289,523 66,915 356,4387/1/13-6/30/14 231,421 5,018 236,439 231,421 5,018 236,439 231,421 5,018 236,439 231,421 5,018 236,4397/1/14-6/30/15 206,362 52,754 259,117 206,362 52,754 259,117 206,362 52,754 259,117 206,362 52,754 259,117
Total 4,580,020 230,185 4,810,205 5,640,412 230,185 5,870,597 5,640,412 230,185 5,870,597 5,640,412 230,185 5,870,597
Notes:Columns (1) through (23) provided by City of Virginia Beach.* Reported claim count excludes claims closed without payment.
Oliver Wyman Actuarial Consulting, Inc.
98

Exhibit 5Sheet 2
Fiscal Date of Claim ClaimYear Loss Number Status Paid Reported Retention Paid Reported
2005 4/11/2005 VA074720 Closed 863,811 863,811 2,000,000 863,811 863,811 2006 12/29/2005 VA075741 Closed 208,009 208,009 2,000,000 208,009 208,009 2006 1/19/2006 VA075766 Closed 224,650 224,650 2,000,000 224,650 224,650 2010 6/28/2010 VA079404 Closed 505,003 505,003 2,000,000 505,003 505,003 2012 10/28/2011 VA080397 Closed 441,578 441,578 2,000,000 441,578 441,578 2012 4/24/2012 VA080678 Open 11,152 116,649 2,000,000 11,152 116,649
Loss & ALAE Limited to Retention
Unlimited Loss & ALAE Loss & ALAE Limited to Retention
Detail of Large Losses with Combined Loss & ALAE Greater than $100,000
City of Virginia BeachAnalysis of Unpaid Loss & ALAE at June 30, 2015
Automobile LiabilityData as of June 30, 2015
Oliver Wyman Actuarial Consulting, Inc.
99

Exhibit 6Sheet 1
City of Virginia BeachAnalysis of Unpaid Loss & ALAE at June 30, 2015
Automobile LiabilityData as of April 30, 2015
Reported Loss & ALAE Limited to $250,000
Accident Evaluation Date in MonthsPeriod 12 24 36 48 60 72 84 96 108 120 132 144 156 168 180
5/1/91-4/30/92 458,266 458,266 458,266 458,266 458,266 458,266 458,266 458,2665/1/92-4/30/93 453,385 453,385 453,385 453,385 453,385 453,385 453,385 453,385 453,3855/1/93-4/30/94 542,668 543,753 543,453 543,453 543,453 543,453 543,453 543,453 543,453 543,4535/1/94-4/30/95 177,098 177,248 177,098 177,098 177,098 177,098 177,098 177,098 177,098 177,098 177,0985/1/95-4/30/96 212,638 391,057 358,762 358,762 355,817 355,817 355,817 355,817 355,817 355,817 355,817 355,8175/1/96-4/30/97 318,805 581,945 522,807 522,657 522,657 522,657 522,657 522,657 522,657 522,657 522,657 522,657 522,6575/1/97-4/30/98 332,859 389,746 336,654 336,654 337,526 336,090 336,090 336,090 336,090 336,090 336,090 336,090 336,090 336,0905/1/98-4/30/99 207,629 366,181 352,165 377,665 376,463 376,463 376,463 376,426 376,426 376,426 376,426 376,426 376,426 376,426 376,4265/1/99-4/30/00 249,675 518,825 508,577 508,837 508,837 507,455 506,955 506,955 506,955 506,955 506,955 506,955 506,955 506,955 506,9555/1/00-4/30/01 327,372 479,279 479,497 447,582 446,718 421,218 421,218 421,218 421,218 421,218 421,218 421,218 421,218 421,218 421,2185/1/01-4/30/02 400,789 405,580 495,456 476,619 474,107 474,107 474,107 474,107 474,107 474,107 474,107 474,107 474,107 474,1075/1/02-4/30/03 454,181 494,587 564,415 786,159 761,491 761,491 583,881 583,881 583,881 583,881 583,881 583,881 583,8815/1/03-4/30/04 310,700 373,043 667,707 754,556 755,556 754,556 754,556 754,556 754,556 754,556 754,556 754,5565/1/04-4/30/05 284,752 612,694 672,792 636,992 588,055 588,055 588,055 588,055 588,055 562,555 562,5555/1/05-4/30/06 360,608 736,297 818,920 800,632 800,632 800,632 800,632 800,632 800,632 800,6325/1/06-4/30/07 255,864 396,457 381,866 356,622 356,622 356,622 356,622 356,622 356,6225/1/07-4/30/08 448,690 489,864 497,033 502,070 502,070 502,070 502,070 502,0705/1/08-4/30/09 297,369 306,153 320,234 320,334 320,234 320,234 320,2345/1/09-4/30/10 182,965 245,038 245,538 245,538 245,538 245,5385/1/10-4/30/11 290,002 547,684 547,374 534,874 512,7175/1/11-4/30/12 342,261 828,776 879,026 789,0265/1/12-4/30/13 255,935 308,733 368,4535/1/13-4/30/14 227,842 272,5545/1/14-4/30/15 237,647
Accident Period 12-24 24-36 36-48 48-60 60-72 72-84 84-96 96-108 108-120 120-132 132-144 144-156 156-168 168-180 180-ULT
5/1/91-4/30/92 1.000 1.000 1.000 1.000 1.000 1.000 1.0005/1/92-4/30/93 1.000 1.000 1.000 1.000 1.000 1.000 1.000 1.0005/1/93-4/30/94 1.002 0.999 1.000 1.000 1.000 1.000 1.000 1.000 1.0005/1/94-4/30/95 1.001 0.999 1.000 1.000 1.000 1.000 1.000 1.000 1.000 1.0005/1/95-4/30/96 1.839 0.917 1.000 0.992 1.000 1.000 1.000 1.000 1.000 1.000 1.0005/1/96-4/30/97 1.825 0.898 1.000 1.000 1.000 1.000 1.000 1.000 1.000 1.000 1.000 1.0005/1/97-4/30/98 1.171 0.864 1.000 1.003 0.996 1.000 1.000 1.000 1.000 1.000 1.000 1.000 1.0005/1/98-4/30/99 1.764 0.962 1.072 0.997 1.000 1.000 1.000 1.000 1.000 1.000 1.000 1.000 1.000 1.0005/1/99-4/30/00 2.078 0.980 1.001 1.000 0.997 0.999 1.000 1.000 1.000 1.000 1.000 1.000 1.000 1.0005/1/00-4/30/01 1.464 1.000 0.933 0.998 0.943 1.000 1.000 1.000 1.000 1.000 1.000 1.000 1.000 1.0005/1/01-4/30/02 1.012 1.222 0.962 0.995 1.000 1.000 1.000 1.000 1.000 1.000 1.000 1.000 1.0005/1/02-4/30/03 1.089 1.141 1.393 0.969 1.000 0.767 1.000 1.000 1.000 1.000 1.000 1.0005/1/03-4/30/04 1.201 1.790 1.130 1.001 0.999 1.000 1.000 1.000 1.000 1.000 1.0005/1/04-4/30/05 2.152 1.098 0.947 0.923 1.000 1.000 1.000 1.000 0.957 1.0005/1/05-4/30/06 2.042 1.112 0.978 1.000 1.000 1.000 1.000 1.000 1.0005/1/06-4/30/07 1.549 0.963 0.934 1.000 1.000 1.000 1.000 1.0005/1/07-4/30/08 1.092 1.015 1.010 1.000 1.000 1.000 1.0005/1/08-4/30/09 1.030 1.046 1.000 1.000 1.000 1.0005/1/09-4/30/10 1.339 1.002 1.000 1.000 1.0005/1/10-4/30/11 1.889 0.999 0.977 0.9595/1/11-4/30/12 2.421 1.061 0.8985/1/12-4/30/13 1.206 1.1935/1/13-4/30/14 1.196
All Years Average 1.533 1.110 1.058 1.036 0.991 0.985 0.999 1.000 0.997 1.000 1.000 1.000 1.000 1.000All Years Weighted 1.508 1.100 1.039 1.003 0.992 0.977 1.000 1.000 0.997 1.000 1.000 1.000 1.000 1.0005 Years Weighted 1.696 1.056 0.961 0.989 1.000 1.000 1.000 1.000 0.992 1.000 1.000 1.000 1.000 1.0003 Years Weighted 1.707 1.065 0.939 0.980 1.000 1.000 1.000 1.000 0.988 1.000 1.000 1.000 1.000 1.000Industry 1.366 1.139 1.066 1.028 1.008 1.001 1.000 1.000 1.000 1.000 1.000 1.000 1.000 1.000 1.000Prior (4/30/13) 1.769 1.101 1.042 1.003 1.001 1.001 1.001 1.000 1.000 1.000 1.000 1.000 1.000 1.000 1.000
Selected 12-24 24-36 36-48 48-60 60-72 72-84 84-96 96-108 108-120 120-132 132-144 144-156 156-168 168-180 180-ULT
Age to Age 1.696 1.100 1.039 1.002 1.000 1.000 1.000 1.000 1.000 1.000 1.000 1.000 1.000 1.000 1.000Age to Ultimate 1.943 1.146 1.041 1.002 1.000 1.000 1.000 1.000 1.000 1.000 1.000 1.000 1.000 1.000 1.000
Notes:Not all averages are shown. Selected age to age factors are based on a review of all averages and actuarial judgment.
Oliver Wyman Actuarial Consulting, Inc.
100

Exhibit 6Sheet 2
City of Virginia BeachAnalysis of Unpaid Loss & ALAE at June 30, 2015
Automobile LiabilityData as of April 30, 2015
Paid Loss & ALAE Limited to $250,000
Accident Evaluation Date in MonthsPeriod 12 24 36 48 60 72 84 96 108 120 132 144 156 168 180
5/1/91-4/30/92 458,266 458,266 458,266 458,266 458,266 458,266 458,266 458,2665/1/92-4/30/93 453,385 453,385 453,385 453,385 453,385 453,385 453,385 453,385 453,3855/1/93-4/30/94 542,668 543,453 543,453 543,453 543,453 543,453 543,453 543,453 543,453 543,4535/1/94-4/30/95 177,098 177,098 177,098 177,098 177,098 177,098 177,098 177,098 177,098 177,098 177,0985/1/95-4/30/96 211,333 355,817 355,817 355,817 355,817 355,817 355,817 355,817 355,817 355,817 355,817 355,8175/1/96-4/30/97 313,795 461,592 522,657 522,657 522,657 522,657 522,657 522,657 522,657 522,657 522,657 522,657 522,6575/1/97-4/30/98 332,846 336,026 336,090 336,090 336,090 336,090 336,090 336,090 336,090 336,090 336,090 336,090 336,090 336,0905/1/98-4/30/99 195,475 271,699 303,310 372,192 376,426 376,426 376,426 376,426 376,426 376,426 376,426 376,426 376,426 376,426 376,4265/1/99-4/30/00 187,663 497,066 506,566 506,955 506,955 506,955 506,955 506,955 506,955 506,955 506,955 506,955 506,955 506,955 506,9555/1/00-4/30/01 203,388 373,938 421,194 421,218 421,218 421,218 421,218 421,218 421,218 421,218 421,218 421,218 421,218 421,218 421,2185/1/01-4/30/02 220,885 398,112 412,627 420,439 474,107 474,107 474,107 474,107 474,107 474,107 474,107 474,107 474,107 474,1075/1/02-4/30/03 241,410 371,370 428,720 527,470 578,451 582,531 583,881 583,881 583,881 583,881 583,881 583,881 583,8815/1/03-4/30/04 209,760 360,806 624,394 754,556 754,556 754,556 754,556 754,556 754,556 754,556 754,556 754,5565/1/04-4/30/05 192,790 287,853 535,444 535,492 537,055 537,055 537,055 537,055 537,055 537,055 537,0555/1/05-4/30/06 253,316 433,972 480,091 775,567 775,567 775,567 775,567 775,567 775,567 775,5675/1/06-4/30/07 191,843 325,944 356,366 356,622 356,622 356,622 356,622 356,622 356,6225/1/07-4/30/08 317,412 446,592 492,033 492,070 492,070 492,070 492,070 492,0705/1/08-4/30/09 208,568 256,299 320,134 320,234 320,234 320,234 320,2345/1/09-4/30/10 120,488 245,038 245,538 245,538 245,538 245,5385/1/10-4/30/11 158,045 278,845 512,299 512,717 512,7175/1/11-4/30/12 162,421 562,474 600,121 603,5595/1/12-4/30/13 157,675 220,793 302,5385/1/13-4/30/14 156,222 270,8585/1/14-4/30/15 187,928
Accident Period 12-24 24-36 36-48 48-60 60-72 72-84 84-96 96-108 108-120 120-132 132-144 144-156 156-168 168-180 180-ULT
5/1/91-4/30/92 1.000 1.000 1.000 1.000 1.000 1.000 1.0005/1/92-4/30/93 1.000 1.000 1.000 1.000 1.000 1.000 1.000 1.0005/1/93-4/30/94 1.001 1.000 1.000 1.000 1.000 1.000 1.000 1.000 1.0005/1/94-4/30/95 1.000 1.000 1.000 1.000 1.000 1.000 1.000 1.000 1.000 1.0005/1/95-4/30/96 1.684 1.000 1.000 1.000 1.000 1.000 1.000 1.000 1.000 1.000 1.0005/1/96-4/30/97 1.471 1.132 1.000 1.000 1.000 1.000 1.000 1.000 1.000 1.000 1.000 1.0005/1/97-4/30/98 1.010 1.000 1.000 1.000 1.000 1.000 1.000 1.000 1.000 1.000 1.000 1.000 1.0005/1/98-4/30/99 1.390 1.116 1.227 1.011 1.000 1.000 1.000 1.000 1.000 1.000 1.000 1.000 1.000 1.0005/1/99-4/30/00 2.649 1.019 1.001 1.000 1.000 1.000 1.000 1.000 1.000 1.000 1.000 1.000 1.000 1.0005/1/00-4/30/01 1.839 1.126 1.000 1.000 1.000 1.000 1.000 1.000 1.000 1.000 1.000 1.000 1.000 1.0005/1/01-4/30/02 1.802 1.036 1.019 1.128 1.000 1.000 1.000 1.000 1.000 1.000 1.000 1.000 1.0005/1/02-4/30/03 1.538 1.154 1.230 1.097 1.007 1.002 1.000 1.000 1.000 1.000 1.000 1.0005/1/03-4/30/04 1.720 1.731 1.208 1.000 1.000 1.000 1.000 1.000 1.000 1.000 1.0005/1/04-4/30/05 1.493 1.860 1.000 1.003 1.000 1.000 1.000 1.000 1.000 1.0005/1/05-4/30/06 1.713 1.106 1.615 1.000 1.000 1.000 1.000 1.000 1.0005/1/06-4/30/07 1.699 1.093 1.001 1.000 1.000 1.000 1.000 1.0005/1/07-4/30/08 1.407 1.102 1.000 1.000 1.000 1.000 1.0005/1/08-4/30/09 1.229 1.249 1.000 1.000 1.000 1.0005/1/09-4/30/10 2.034 1.002 1.000 1.000 1.0005/1/10-4/30/11 1.764 1.837 1.001 1.0005/1/11-4/30/12 3.463 1.067 1.0065/1/12-4/30/13 1.400 1.3705/1/13-4/30/14 1.734
All Years Average 1.805 1.242 1.111 1.066 1.000 1.000 1.000 1.000 1.000 1.000 1.000 1.000 1.000 1.000All Years Weighted 1.763 1.214 1.109 1.044 1.001 1.000 1.000 1.000 1.000 1.000 1.000 1.000 1.000 1.0005 Years Weighted 2.090 1.267 1.002 1.000 1.000 1.000 1.000 1.000 1.000 1.000 1.000 1.000 1.000 1.0003 Years Weighted 2.213 1.332 1.003 1.000 1.000 1.000 1.000 1.000 1.000 1.000 1.000 1.000 1.000 1.000Industry 1.972 1.383 1.212 1.105 1.044 1.019 1.009 1.004 1.003 1.001 1.001 1.001 1.001 1.001 1.003Prior (4/30/13) 2.157 1.224 1.116 1.012 1.002 1.001 1.001 1.001 1.000 1.000 1.000 1.000 1.000 1.000 1.000
Selected 12-24 24-36 36-48 48-60 60-72 72-84 84-96 96-108 108-120 120-132 132-144 144-156 156-168 168-180 180-ULT
Age to Age 1.784 1.214 1.060 1.010 1.001 1.000 1.000 1.000 1.000 1.000 1.000 1.000 1.000 1.000 1.000Age to Ultimate 2.321 1.301 1.071 1.011 1.001 1.000 1.000 1.000 1.000 1.000 1.000 1.000 1.000 1.000 1.000
Notes:Not all averages are shown. Selected age to age factors are based on a review of all averages and actuarial judgment.
Oliver Wyman Actuarial Consulting, Inc.
101

Exhibit 6Sheet 3
City of Virginia BeachAnalysis of Unpaid Loss & ALAE at June 30, 2015
Automobile LiabilityData as of April 30, 2015
Reported Loss & ALAE Limited to $1,000,000
Accident Evaluation Date in MonthsPeriod 12 24 36 48 60 72 84 96 108 120 132 144 156 168 180
5/1/91-4/30/92 568,413 568,413 568,413 568,413 568,413 568,413 568,413 568,4135/1/92-4/30/93 701,606 701,606 701,606 701,606 701,606 701,606 701,606 701,606 701,6065/1/93-4/30/94 1,292,668 1,293,753 1,293,453 1,293,453 1,293,453 1,293,453 1,293,453 1,293,453 1,293,453 1,293,4535/1/94-4/30/95 177,098 177,248 177,098 177,098 177,098 177,098 177,098 177,098 177,098 177,098 177,0985/1/95-4/30/96 212,638 391,057 358,762 358,762 355,817 355,817 355,817 355,817 355,817 355,817 355,817 355,8175/1/96-4/30/97 318,805 581,945 522,807 522,657 522,657 522,657 522,657 522,657 522,657 522,657 522,657 522,657 522,6575/1/97-4/30/98 332,859 389,746 336,654 336,654 337,526 336,090 336,090 336,090 336,090 336,090 336,090 336,090 336,090 336,0905/1/98-4/30/99 207,629 366,181 352,165 377,665 376,463 376,463 376,463 376,426 376,426 376,426 376,426 376,426 376,426 376,426 376,4265/1/99-4/30/00 249,675 518,825 508,577 508,837 508,837 507,455 506,955 506,955 506,955 506,955 506,955 506,955 506,955 506,955 506,9555/1/00-4/30/01 327,372 479,279 479,497 447,582 446,718 421,218 421,218 421,218 421,218 421,218 421,218 421,218 421,218 421,218 421,2185/1/01-4/30/02 400,789 405,580 495,456 476,619 474,107 474,107 474,107 474,107 474,107 474,107 474,107 474,107 474,107 474,1075/1/02-4/30/03 454,181 494,587 564,415 1,209,491 1,184,822 1,184,822 583,881 583,881 583,881 583,881 583,881 583,881 583,8815/1/03-4/30/04 310,700 373,043 1,417,707 1,504,556 1,505,556 1,504,556 1,504,556 1,504,556 1,504,556 1,504,556 1,504,556 1,504,5565/1/04-4/30/05 284,752 1,362,694 1,422,792 1,250,803 1,201,866 1,201,866 1,201,866 1,201,866 1,201,866 1,176,366 1,176,3665/1/05-4/30/06 360,608 907,297 818,920 800,632 800,632 800,632 800,632 800,632 800,632 800,6325/1/06-4/30/07 255,864 396,457 381,866 356,622 356,622 356,622 356,622 356,622 356,6225/1/07-4/30/08 448,690 489,864 497,033 502,070 502,070 502,070 502,070 502,0705/1/08-4/30/09 297,369 306,153 320,234 320,334 320,234 320,234 320,2345/1/09-4/30/10 182,965 245,038 245,538 245,538 245,538 245,5385/1/10-4/30/11 290,002 552,684 802,377 789,877 767,7205/1/11-4/30/12 342,261 1,020,353 1,070,604 980,6045/1/12-4/30/13 255,935 308,733 368,4535/1/13-4/30/14 227,842 272,5545/1/14-4/30/15 237,647
Accident Period 12-24 24-36 36-48 48-60 60-72 72-84 84-96 96-108 108-120 120-132 132-144 144-156 156-168 168-180 180-ULT
5/1/91-4/30/92 1.000 1.000 1.000 1.000 1.000 1.000 1.0005/1/92-4/30/93 1.000 1.000 1.000 1.000 1.000 1.000 1.000 1.0005/1/93-4/30/94 1.001 1.000 1.000 1.000 1.000 1.000 1.000 1.000 1.0005/1/94-4/30/95 1.001 0.999 1.000 1.000 1.000 1.000 1.000 1.000 1.000 1.0005/1/95-4/30/96 1.839 0.917 1.000 0.992 1.000 1.000 1.000 1.000 1.000 1.000 1.0005/1/96-4/30/97 1.825 0.898 1.000 1.000 1.000 1.000 1.000 1.000 1.000 1.000 1.000 1.0005/1/97-4/30/98 1.171 0.864 1.000 1.003 0.996 1.000 1.000 1.000 1.000 1.000 1.000 1.000 1.0005/1/98-4/30/99 1.764 0.962 1.072 0.997 1.000 1.000 1.000 1.000 1.000 1.000 1.000 1.000 1.000 1.0005/1/99-4/30/00 2.078 0.980 1.001 1.000 0.997 0.999 1.000 1.000 1.000 1.000 1.000 1.000 1.000 1.0005/1/00-4/30/01 1.464 1.000 0.933 0.998 0.943 1.000 1.000 1.000 1.000 1.000 1.000 1.000 1.000 1.0005/1/01-4/30/02 1.012 1.222 0.962 0.995 1.000 1.000 1.000 1.000 1.000 1.000 1.000 1.000 1.0005/1/02-4/30/03 1.089 1.141 2.143 0.980 1.000 0.493 1.000 1.000 1.000 1.000 1.000 1.0005/1/03-4/30/04 1.201 3.800 1.061 1.001 0.999 1.000 1.000 1.000 1.000 1.000 1.0005/1/04-4/30/05 4.786 1.044 0.879 0.961 1.000 1.000 1.000 1.000 0.979 1.0005/1/05-4/30/06 2.516 0.903 0.978 1.000 1.000 1.000 1.000 1.000 1.0005/1/06-4/30/07 1.549 0.963 0.934 1.000 1.000 1.000 1.000 1.0005/1/07-4/30/08 1.092 1.015 1.010 1.000 1.000 1.000 1.0005/1/08-4/30/09 1.030 1.046 1.000 1.000 1.000 1.0005/1/09-4/30/10 1.339 1.002 1.000 1.000 1.0005/1/10-4/30/11 1.906 1.452 0.984 0.9725/1/11-4/30/12 2.981 1.049 0.9165/1/12-4/30/13 1.206 1.1935/1/13-4/30/14 1.196
All Years Average 1.763 1.246 1.098 1.040 0.991 0.968 0.999 1.000 0.999 1.000 1.000 1.000 1.000 1.000All Years Weighted 1.736 1.184 1.060 1.002 0.994 0.942 1.000 1.000 0.997 1.000 1.000 1.000 1.000 1.0005 Years Weighted 1.847 1.154 0.967 0.990 1.000 1.000 1.000 1.000 0.994 1.000 1.000 1.000 1.000 1.0003 Years Weighted 1.939 1.191 0.952 0.984 1.000 1.000 1.000 1.000 0.993 1.000 1.000 1.000 1.000 1.000Industry 1.403 1.159 1.078 1.036 1.012 1.004 1.002 1.001 1.000 1.001 1.001 1.000 1.000 1.000 1.002Prior (4/30/13) 1.952 1.203 1.060 1.004 1.002 1.001 1.001 1.001 1.000 1.000 1.000 1.000 1.000 1.000 1.000
Selected 12-24 24-36 36-48 48-60 60-72 72-84 84-96 96-108 108-120 120-132 132-144 144-156 156-168 168-180 180-ULT
Age to Age 1.847 1.191 1.060 1.003 1.001 1.000 1.000 1.000 1.000 1.000 1.000 1.000 1.000 1.000 1.000Age to Ultimate 2.341 1.267 1.064 1.004 1.001 1.000 1.000 1.000 1.000 1.000 1.000 1.000 1.000 1.000 1.000
Notes:Not all averages are shown. Selected age to age factors are based on a review of all averages and actuarial judgment.
Oliver Wyman Actuarial Consulting, Inc.
102

Exhibit 6Sheet 4
City of Virginia BeachAnalysis of Unpaid Loss & ALAE at June 30, 2015
Automobile LiabilityData as of April 30, 2015
Paid Loss & ALAE Limited to $1,000,000
Accident Evaluation Date in MonthsPeriod 12 24 36 48 60 72 84 96 108 120 132 144 156 168 180
5/1/91-4/30/92 568,413 568,413 568,413 568,413 568,413 568,413 568,413 568,4135/1/92-4/30/93 701,606 701,606 701,606 701,606 701,606 701,606 701,606 701,606 701,6065/1/93-4/30/94 1,292,668 1,293,453 1,293,453 1,293,453 1,293,453 1,293,453 1,293,453 1,293,453 1,293,453 1,293,4535/1/94-4/30/95 177,098 177,098 177,098 177,098 177,098 177,098 177,098 177,098 177,098 177,098 177,0985/1/95-4/30/96 211,333 355,817 355,817 355,817 355,817 355,817 355,817 355,817 355,817 355,817 355,817 355,8175/1/96-4/30/97 313,795 461,592 522,657 522,657 522,657 522,657 522,657 522,657 522,657 522,657 522,657 522,657 522,6575/1/97-4/30/98 332,846 336,026 336,090 336,090 336,090 336,090 336,090 336,090 336,090 336,090 336,090 336,090 336,090 336,0905/1/98-4/30/99 195,475 271,699 303,310 372,192 376,426 376,426 376,426 376,426 376,426 376,426 376,426 376,426 376,426 376,426 376,4265/1/99-4/30/00 187,663 497,066 506,566 506,955 506,955 506,955 506,955 506,955 506,955 506,955 506,955 506,955 506,955 506,955 506,9555/1/00-4/30/01 203,388 373,938 421,194 421,218 421,218 421,218 421,218 421,218 421,218 421,218 421,218 421,218 421,218 421,218 421,2185/1/01-4/30/02 220,885 398,112 412,627 420,439 474,107 474,107 474,107 474,107 474,107 474,107 474,107 474,107 474,107 474,1075/1/02-4/30/03 241,410 371,370 428,720 527,470 578,451 582,531 583,881 583,881 583,881 583,881 583,881 583,881 583,8815/1/03-4/30/04 209,760 360,806 1,374,394 1,504,556 1,504,556 1,504,556 1,504,556 1,504,556 1,504,556 1,504,556 1,504,556 1,504,5565/1/04-4/30/05 192,790 287,853 1,149,256 1,149,303 1,150,866 1,150,866 1,150,866 1,150,866 1,150,866 1,150,866 1,150,8665/1/05-4/30/06 253,316 433,972 480,091 775,567 775,567 775,567 775,567 775,567 775,567 775,5675/1/06-4/30/07 191,843 325,944 356,366 356,622 356,622 356,622 356,622 356,622 356,6225/1/07-4/30/08 317,412 446,592 492,033 492,070 492,070 492,070 492,070 492,0705/1/08-4/30/09 208,568 256,299 320,134 320,234 320,234 320,234 320,2345/1/09-4/30/10 120,488 245,038 245,538 245,538 245,538 245,5385/1/10-4/30/11 158,045 278,845 767,302 767,720 767,7205/1/11-4/30/12 162,421 754,052 791,699 795,1375/1/12-4/30/13 157,675 220,793 302,5385/1/13-4/30/14 156,222 270,8585/1/14-4/30/15 187,928
Accident Period 12-24 24-36 36-48 48-60 60-72 72-84 84-96 96-108 108-120 120-132 132-144 144-156 156-168 168-180 180-ULT
5/1/91-4/30/92 1.000 1.000 1.000 1.000 1.000 1.000 1.0005/1/92-4/30/93 1.000 1.000 1.000 1.000 1.000 1.000 1.000 1.0005/1/93-4/30/94 1.001 1.000 1.000 1.000 1.000 1.000 1.000 1.000 1.0005/1/94-4/30/95 1.000 1.000 1.000 1.000 1.000 1.000 1.000 1.000 1.000 1.0005/1/95-4/30/96 1.684 1.000 1.000 1.000 1.000 1.000 1.000 1.000 1.000 1.000 1.0005/1/96-4/30/97 1.471 1.132 1.000 1.000 1.000 1.000 1.000 1.000 1.000 1.000 1.000 1.0005/1/97-4/30/98 1.010 1.000 1.000 1.000 1.000 1.000 1.000 1.000 1.000 1.000 1.000 1.000 1.0005/1/98-4/30/99 1.390 1.116 1.227 1.011 1.000 1.000 1.000 1.000 1.000 1.000 1.000 1.000 1.000 1.0005/1/99-4/30/00 2.649 1.019 1.001 1.000 1.000 1.000 1.000 1.000 1.000 1.000 1.000 1.000 1.000 1.0005/1/00-4/30/01 1.839 1.126 1.000 1.000 1.000 1.000 1.000 1.000 1.000 1.000 1.000 1.000 1.000 1.0005/1/01-4/30/02 1.802 1.036 1.019 1.128 1.000 1.000 1.000 1.000 1.000 1.000 1.000 1.000 1.0005/1/02-4/30/03 1.538 1.154 1.230 1.097 1.007 1.002 1.000 1.000 1.000 1.000 1.000 1.0005/1/03-4/30/04 1.720 3.809 1.095 1.000 1.000 1.000 1.000 1.000 1.000 1.000 1.0005/1/04-4/30/05 1.493 3.993 1.000 1.001 1.000 1.000 1.000 1.000 1.000 1.0005/1/05-4/30/06 1.713 1.106 1.615 1.000 1.000 1.000 1.000 1.000 1.0005/1/06-4/30/07 1.699 1.093 1.001 1.000 1.000 1.000 1.000 1.0005/1/07-4/30/08 1.407 1.102 1.000 1.000 1.000 1.000 1.0005/1/08-4/30/09 1.229 1.249 1.000 1.000 1.000 1.0005/1/09-4/30/10 2.034 1.002 1.000 1.000 1.0005/1/10-4/30/11 1.764 2.752 1.001 1.0005/1/11-4/30/12 4.643 1.050 1.0045/1/12-4/30/13 1.400 1.3705/1/13-4/30/14 1.734
All Years Average 1.878 1.562 1.104 1.066 1.000 1.000 1.000 1.000 1.000 1.000 1.000 1.000 1.000 1.000All Years Weighted 1.823 1.484 1.087 1.036 1.000 1.000 1.000 1.000 1.000 1.000 1.000 1.000 1.000 1.0005 Years Weighted 2.344 1.383 1.002 1.000 1.000 1.000 1.000 1.000 1.000 1.000 1.000 1.000 1.000 1.0003 Years Weighted 2.615 1.485 1.002 1.000 1.000 1.000 1.000 1.000 1.000 1.000 1.000 1.000 1.000 1.000Industry 2.150 1.449 1.239 1.117 1.049 1.021 1.010 1.005 1.003 1.001 1.001 1.001 1.001 1.001 1.004Prior (4/30/13) 2.473 1.556 1.126 1.016 1.003 1.002 1.001 1.001 1.001 1.000 1.000 1.000 1.000 1.000 1.000
Selected 12-24 24-36 36-48 48-60 60-72 72-84 84-96 96-108 108-120 120-132 132-144 144-156 156-168 168-180 180-ULT
Age to Age 1.851 1.484 1.087 1.014 1.001 1.001 1.000 1.000 1.000 1.000 1.000 1.000 1.000 1.000 1.000Age to Ultimate 3.031 1.638 1.104 1.016 1.002 1.001 1.000 1.000 1.000 1.000 1.000 1.000 1.000 1.000 1.000
Notes:Not all averages are shown. Selected age to age factors are based on a review of all averages and actuarial judgment.
Oliver Wyman Actuarial Consulting, Inc.
103

Exhibit 6Sheet 5
City of Virginia BeachAnalysis of Unpaid Loss & ALAE at June 30, 2015
Automobile LiabilityData as of April 30, 2015
Reported Loss & ALAE Limited to $2,000,000
Accident Evaluation Date in MonthsPeriod 12 24 36 48 60 72 84 96 108 120 132 144 156 168 180
5/1/91-4/30/92 568,413 568,413 568,413 568,413 568,413 568,413 568,413 568,4135/1/92-4/30/93 701,606 701,606 701,606 701,606 701,606 701,606 701,606 701,606 701,6065/1/93-4/30/94 1,784,025 1,785,110 1,784,810 1,784,810 1,784,810 1,784,810 1,784,810 1,784,810 1,784,810 1,784,8105/1/94-4/30/95 177,098 177,248 177,098 177,098 177,098 177,098 177,098 177,098 177,098 177,098 177,0985/1/95-4/30/96 212,638 391,057 358,762 358,762 355,817 355,817 355,817 355,817 355,817 355,817 355,817 355,8175/1/96-4/30/97 318,805 581,945 522,807 522,657 522,657 522,657 522,657 522,657 522,657 522,657 522,657 522,657 522,6575/1/97-4/30/98 332,859 389,746 336,654 336,654 337,526 336,090 336,090 336,090 336,090 336,090 336,090 336,090 336,090 336,0905/1/98-4/30/99 207,629 366,181 352,165 377,665 376,463 376,463 376,463 376,426 376,426 376,426 376,426 376,426 376,426 376,426 376,4265/1/99-4/30/00 249,675 518,825 508,577 508,837 508,837 507,455 506,955 506,955 506,955 506,955 506,955 506,955 506,955 506,955 506,9555/1/00-4/30/01 327,372 479,279 479,497 447,582 446,718 421,218 421,218 421,218 421,218 421,218 421,218 421,218 421,218 421,218 421,2185/1/01-4/30/02 400,789 405,580 495,456 476,619 474,107 474,107 474,107 474,107 474,107 474,107 474,107 474,107 474,107 474,1075/1/02-4/30/03 454,181 494,587 564,415 1,209,491 1,184,822 1,184,822 583,881 583,881 583,881 583,881 583,881 583,881 583,8815/1/03-4/30/04 310,700 373,043 1,663,455 1,750,303 1,751,303 1,750,303 1,750,303 1,750,303 1,750,303 1,750,303 1,750,303 1,750,3035/1/04-4/30/05 284,752 1,372,794 1,461,703 1,250,803 1,201,866 1,201,866 1,201,866 1,201,866 1,201,866 1,176,366 1,176,3665/1/05-4/30/06 360,608 907,297 818,920 800,632 800,632 800,632 800,632 800,632 800,632 800,6325/1/06-4/30/07 255,864 396,457 381,866 356,622 356,622 356,622 356,622 356,622 356,6225/1/07-4/30/08 448,690 489,864 497,033 502,070 502,070 502,070 502,070 502,0705/1/08-4/30/09 297,369 306,153 320,234 320,334 320,234 320,234 320,2345/1/09-4/30/10 182,965 245,038 245,538 245,538 245,538 245,5385/1/10-4/30/11 290,002 552,684 802,377 789,877 767,7205/1/11-4/30/12 342,261 1,020,353 1,070,604 980,6045/1/12-4/30/13 255,935 308,733 368,4535/1/13-4/30/14 227,842 272,5545/1/14-4/30/15 237,647
Accident Period 12-24 24-36 36-48 48-60 60-72 72-84 84-96 96-108 108-120 120-132 132-144 144-156 156-168 168-180 180-ULT
5/1/91-4/30/92 1.000 1.000 1.000 1.000 1.000 1.000 1.0005/1/92-4/30/93 1.000 1.000 1.000 1.000 1.000 1.000 1.000 1.0005/1/93-4/30/94 1.001 1.000 1.000 1.000 1.000 1.000 1.000 1.000 1.0005/1/94-4/30/95 1.001 0.999 1.000 1.000 1.000 1.000 1.000 1.000 1.000 1.0005/1/95-4/30/96 1.839 0.917 1.000 0.992 1.000 1.000 1.000 1.000 1.000 1.000 1.0005/1/96-4/30/97 1.825 0.898 1.000 1.000 1.000 1.000 1.000 1.000 1.000 1.000 1.000 1.0005/1/97-4/30/98 1.171 0.864 1.000 1.003 0.996 1.000 1.000 1.000 1.000 1.000 1.000 1.000 1.0005/1/98-4/30/99 1.764 0.962 1.072 0.997 1.000 1.000 1.000 1.000 1.000 1.000 1.000 1.000 1.000 1.0005/1/99-4/30/00 2.078 0.980 1.001 1.000 0.997 0.999 1.000 1.000 1.000 1.000 1.000 1.000 1.000 1.0005/1/00-4/30/01 1.464 1.000 0.933 0.998 0.943 1.000 1.000 1.000 1.000 1.000 1.000 1.000 1.000 1.0005/1/01-4/30/02 1.012 1.222 0.962 0.995 1.000 1.000 1.000 1.000 1.000 1.000 1.000 1.000 1.0005/1/02-4/30/03 1.089 1.141 2.143 0.980 1.000 0.493 1.000 1.000 1.000 1.000 1.000 1.0005/1/03-4/30/04 1.201 4.459 1.052 1.001 0.999 1.000 1.000 1.000 1.000 1.000 1.0005/1/04-4/30/05 4.821 1.065 0.856 0.961 1.000 1.000 1.000 1.000 0.979 1.0005/1/05-4/30/06 2.516 0.903 0.978 1.000 1.000 1.000 1.000 1.000 1.0005/1/06-4/30/07 1.549 0.963 0.934 1.000 1.000 1.000 1.000 1.0005/1/07-4/30/08 1.092 1.015 1.010 1.000 1.000 1.000 1.0005/1/08-4/30/09 1.030 1.046 1.000 1.000 1.000 1.0005/1/09-4/30/10 1.339 1.002 1.000 1.000 1.0005/1/10-4/30/11 1.906 1.452 0.984 0.9725/1/11-4/30/12 2.981 1.049 0.9165/1/12-4/30/13 1.206 1.1935/1/13-4/30/14 1.196
All Years Average 1.765 1.289 1.096 1.040 0.991 0.968 0.999 1.000 0.999 1.000 1.000 1.000 1.000 1.000All Years Weighted 1.738 1.216 1.054 1.002 0.994 0.946 1.000 1.000 0.998 1.000 1.000 1.000 1.000 1.0005 Years Weighted 1.847 1.154 0.967 0.990 1.000 1.000 1.000 1.000 0.995 1.000 1.000 1.000 1.000 1.0003 Years Weighted 1.939 1.191 0.952 0.984 1.000 1.000 1.000 1.000 0.993 1.000 1.000 1.000 1.000 1.000Industry 1.406 1.162 1.079 1.036 1.012 1.005 1.002 1.001 1.000 1.001 1.001 1.001 1.000 1.000 1.002Prior (4/30/13) 1.952 1.240 1.062 1.004 1.002 1.001 1.001 1.001 1.000 1.000 1.000 1.000 1.000 1.000 1.000
Selected 12-24 24-36 36-48 48-60 60-72 72-84 84-96 96-108 108-120 120-132 132-144 144-156 156-168 168-180 180-ULT
Age to Age 1.847 1.191 1.062 1.003 1.001 1.001 1.000 1.000 1.000 1.000 1.000 1.000 1.000 1.000 1.000Age to Ultimate 2.347 1.271 1.067 1.005 1.002 1.001 1.000 1.000 1.000 1.000 1.000 1.000 1.000 1.000 1.000
Notes:Not all averages are shown. Selected age to age factors are based on a review of all averages and actuarial judgment.
Oliver Wyman Actuarial Consulting, Inc.
104

Exhibit 6Sheet 6
City of Virginia BeachAnalysis of Unpaid Loss & ALAE at June 30, 2015
Automobile LiabilityData as of April 30, 2015
Paid Loss & ALAE Limited to $2,000,000
Accident Evaluation Date in MonthsPeriod 12 24 36 48 60 72 84 96 108 120 132 144 156 168 180
5/1/91-4/30/92 568,413 568,413 568,413 568,413 568,413 568,413 568,413 568,4135/1/92-4/30/93 701,606 701,606 701,606 701,606 701,606 701,606 701,606 701,606 701,6065/1/93-4/30/94 1,784,025 1,784,810 1,784,810 1,784,810 1,784,810 1,784,810 1,784,810 1,784,810 1,784,810 1,784,8105/1/94-4/30/95 177,098 177,098 177,098 177,098 177,098 177,098 177,098 177,098 177,098 177,098 177,0985/1/95-4/30/96 211,333 355,817 355,817 355,817 355,817 355,817 355,817 355,817 355,817 355,817 355,817 355,8175/1/96-4/30/97 313,795 461,592 522,657 522,657 522,657 522,657 522,657 522,657 522,657 522,657 522,657 522,657 522,6575/1/97-4/30/98 332,846 336,026 336,090 336,090 336,090 336,090 336,090 336,090 336,090 336,090 336,090 336,090 336,090 336,0905/1/98-4/30/99 195,475 271,699 303,310 372,192 376,426 376,426 376,426 376,426 376,426 376,426 376,426 376,426 376,426 376,426 376,4265/1/99-4/30/00 187,663 497,066 506,566 506,955 506,955 506,955 506,955 506,955 506,955 506,955 506,955 506,955 506,955 506,955 506,9555/1/00-4/30/01 203,388 373,938 421,194 421,218 421,218 421,218 421,218 421,218 421,218 421,218 421,218 421,218 421,218 421,218 421,2185/1/01-4/30/02 220,885 398,112 412,627 420,439 474,107 474,107 474,107 474,107 474,107 474,107 474,107 474,107 474,107 474,1075/1/02-4/30/03 241,410 371,370 428,720 527,470 578,451 582,531 583,881 583,881 583,881 583,881 583,881 583,881 583,8815/1/03-4/30/04 209,760 360,806 1,620,142 1,750,303 1,750,303 1,750,303 1,750,303 1,750,303 1,750,303 1,750,303 1,750,303 1,750,3035/1/04-4/30/05 192,790 287,853 1,149,256 1,149,303 1,150,866 1,150,866 1,150,866 1,150,866 1,150,866 1,150,866 1,150,8665/1/05-4/30/06 253,316 433,972 480,091 775,567 775,567 775,567 775,567 775,567 775,567 775,5675/1/06-4/30/07 191,843 325,944 356,366 356,622 356,622 356,622 356,622 356,622 356,6225/1/07-4/30/08 317,412 446,592 492,033 492,070 492,070 492,070 492,070 492,0705/1/08-4/30/09 208,568 256,299 320,134 320,234 320,234 320,234 320,2345/1/09-4/30/10 120,488 245,038 245,538 245,538 245,538 245,5385/1/10-4/30/11 158,045 278,845 767,302 767,720 767,7205/1/11-4/30/12 162,421 754,052 791,699 795,1375/1/12-4/30/13 157,675 220,793 302,5385/1/13-4/30/14 156,222 270,8585/1/14-4/30/15 187,928
Accident Period 12-24 24-36 36-48 48-60 60-72 72-84 84-96 96-108 108-120 120-132 132-144 144-156 156-168 168-180 180-ULT
5/1/91-4/30/92 1.000 1.000 1.000 1.000 1.000 1.000 1.0005/1/92-4/30/93 1.000 1.000 1.000 1.000 1.000 1.000 1.000 1.0005/1/93-4/30/94 1.000 1.000 1.000 1.000 1.000 1.000 1.000 1.000 1.0005/1/94-4/30/95 1.000 1.000 1.000 1.000 1.000 1.000 1.000 1.000 1.000 1.0005/1/95-4/30/96 1.684 1.000 1.000 1.000 1.000 1.000 1.000 1.000 1.000 1.000 1.0005/1/96-4/30/97 1.471 1.132 1.000 1.000 1.000 1.000 1.000 1.000 1.000 1.000 1.000 1.0005/1/97-4/30/98 1.010 1.000 1.000 1.000 1.000 1.000 1.000 1.000 1.000 1.000 1.000 1.000 1.0005/1/98-4/30/99 1.390 1.116 1.227 1.011 1.000 1.000 1.000 1.000 1.000 1.000 1.000 1.000 1.000 1.0005/1/99-4/30/00 2.649 1.019 1.001 1.000 1.000 1.000 1.000 1.000 1.000 1.000 1.000 1.000 1.000 1.0005/1/00-4/30/01 1.839 1.126 1.000 1.000 1.000 1.000 1.000 1.000 1.000 1.000 1.000 1.000 1.000 1.0005/1/01-4/30/02 1.802 1.036 1.019 1.128 1.000 1.000 1.000 1.000 1.000 1.000 1.000 1.000 1.0005/1/02-4/30/03 1.538 1.154 1.230 1.097 1.007 1.002 1.000 1.000 1.000 1.000 1.000 1.0005/1/03-4/30/04 1.720 4.490 1.080 1.000 1.000 1.000 1.000 1.000 1.000 1.000 1.0005/1/04-4/30/05 1.493 3.993 1.000 1.001 1.000 1.000 1.000 1.000 1.000 1.0005/1/05-4/30/06 1.713 1.106 1.615 1.000 1.000 1.000 1.000 1.000 1.0005/1/06-4/30/07 1.699 1.093 1.001 1.000 1.000 1.000 1.000 1.0005/1/07-4/30/08 1.407 1.102 1.000 1.000 1.000 1.000 1.0005/1/08-4/30/09 1.229 1.249 1.000 1.000 1.000 1.0005/1/09-4/30/10 2.034 1.002 1.000 1.000 1.0005/1/10-4/30/11 1.764 2.752 1.001 1.0005/1/11-4/30/12 4.643 1.050 1.0045/1/12-4/30/13 1.400 1.3705/1/13-4/30/14 1.734
All Years Average 1.878 1.604 1.103 1.066 1.000 1.000 1.000 1.000 1.000 1.000 1.000 1.000 1.000 1.000All Years Weighted 1.823 1.526 1.084 1.035 1.000 1.000 1.000 1.000 1.000 1.000 1.000 1.000 1.000 1.0005 Years Weighted 2.344 1.383 1.002 1.000 1.000 1.000 1.000 1.000 1.000 1.000 1.000 1.000 1.000 1.0003 Years Weighted 2.615 1.485 1.002 1.000 1.000 1.000 1.000 1.000 1.000 1.000 1.000 1.000 1.000 1.000Industry 2.156 1.451 1.239 1.117 1.048 1.021 1.010 1.005 1.003 1.001 1.001 1.001 1.001 1.001 1.004Prior (4/30/13) 2.473 1.606 1.127 1.018 1.003 1.002 1.001 1.001 1.001 1.001 1.000 1.000 1.000 1.000 1.000
Selected 12-24 24-36 36-48 48-60 60-72 72-84 84-96 96-108 108-120 120-132 132-144 144-156 156-168 168-180 180-ULT
Age to Age 1.851 1.526 1.094 1.016 1.001 1.001 1.001 1.000 1.000 1.000 1.000 1.000 1.000 1.000 1.000Age to Ultimate 3.147 1.700 1.114 1.019 1.003 1.002 1.001 1.000 1.000 1.000 1.000 1.000 1.000 1.000 1.000
Notes:Not all averages are shown. Selected age to age factors are based on a review of all averages and actuarial judgment.
Oliver Wyman Actuarial Consulting, Inc.
105

Exhibit 6Sheet 7
City of Virginia BeachAnalysis of Unpaid Loss & ALAE at June 30, 2015
Automobile LiabilityData as of April 30, 2015
Reported Claim Counts excluding Claims Closed with no Payment
Accident Evaluation Date in MonthsPeriod 12 24 36 48 60 72 84 96 108 120 132 144 156 168 180
5/1/91-4/30/92 76 76 76 76 76 76 76 765/1/92-4/30/93 84 84 84 84 84 84 84 84 845/1/93-4/30/94 104 106 104 104 104 105 104 104 104 1045/1/94-4/30/95 80 81 80 80 80 80 80 80 80 80 805/1/95-4/30/96 109 112 110 110 110 110 110 110 110 110 110 1105/1/96-4/30/97 113 114 114 113 113 113 113 113 113 113 113 113 1135/1/97-4/30/98 104 107 104 104 104 105 105 105 105 105 105 105 105 1055/1/98-4/30/99 99 114 107 107 106 107 109 109 109 109 109 109 109 109 1095/1/99-4/30/00 128 106 107 108 108 106 106 106 106 106 106 106 106 106 1065/1/00-4/30/01 121 115 113 113 113 112 112 112 112 113 113 113 113 113 1135/1/01-4/30/02 143 133 135 134 133 133 133 133 133 133 133 133 133 1335/1/02-4/30/03 121 102 107 107 107 107 107 107 107 107 107 107 1075/1/03-4/30/04 112 117 116 116 117 116 116 116 116 116 116 1165/1/04-4/30/05 108 106 112 111 111 112 112 112 112 111 1115/1/05-4/30/06 114 108 110 110 110 110 110 110 110 1105/1/06-4/30/07 105 97 97 96 96 96 96 96 965/1/07-4/30/08 105 95 96 96 96 96 96 965/1/08-4/30/09 96 71 72 73 73 73 735/1/09-4/30/10 58 57 57 57 57 575/1/10-4/30/11 68 67 66 66 665/1/11-4/30/12 76 75 73 735/1/12-4/30/13 63 62 625/1/13-4/30/14 71 695/1/14-4/30/15 69
Accident Period 12-24 24-36 36-48 48-60 60-72 72-84 84-96 96-108 108-120 120-132 132-144 144-156 156-168 168-180 180-ULT
5/1/91-4/30/92 1.000 1.000 1.000 1.000 1.000 1.000 1.0005/1/92-4/30/93 1.000 1.000 1.000 1.000 1.000 1.000 1.000 1.0005/1/93-4/30/94 1.019 0.981 1.000 1.000 1.010 0.990 1.000 1.000 1.0005/1/94-4/30/95 1.013 0.988 1.000 1.000 1.000 1.000 1.000 1.000 1.000 1.0005/1/95-4/30/96 1.028 0.982 1.000 1.000 1.000 1.000 1.000 1.000 1.000 1.000 1.0005/1/96-4/30/97 1.009 1.000 0.991 1.000 1.000 1.000 1.000 1.000 1.000 1.000 1.000 1.0005/1/97-4/30/98 1.029 0.972 1.000 1.000 1.010 1.000 1.000 1.000 1.000 1.000 1.000 1.000 1.0005/1/98-4/30/99 1.152 0.939 1.000 0.991 1.009 1.019 1.000 1.000 1.000 1.000 1.000 1.000 1.000 1.0005/1/99-4/30/00 0.828 1.009 1.009 1.000 0.981 1.000 1.000 1.000 1.000 1.000 1.000 1.000 1.000 1.0005/1/00-4/30/01 0.950 0.983 1.000 1.000 0.991 1.000 1.000 1.000 1.009 1.000 1.000 1.000 1.000 1.0005/1/01-4/30/02 0.930 1.015 0.993 0.993 1.000 1.000 1.000 1.000 1.000 1.000 1.000 1.000 1.0005/1/02-4/30/03 0.843 1.049 1.000 1.000 1.000 1.000 1.000 1.000 1.000 1.000 1.000 1.0005/1/03-4/30/04 1.045 0.991 1.000 1.009 0.991 1.000 1.000 1.000 1.000 1.000 1.0005/1/04-4/30/05 0.981 1.057 0.991 1.000 1.009 1.000 1.000 1.000 0.991 1.0005/1/05-4/30/06 0.947 1.019 1.000 1.000 1.000 1.000 1.000 1.000 1.0005/1/06-4/30/07 0.924 1.000 0.990 1.000 1.000 1.000 1.000 1.0005/1/07-4/30/08 0.905 1.011 1.000 1.000 1.000 1.000 1.0005/1/08-4/30/09 0.740 1.014 1.014 1.000 1.000 1.0005/1/09-4/30/10 0.983 1.000 1.000 1.000 1.0005/1/10-4/30/11 0.985 0.985 1.000 1.0005/1/11-4/30/12 0.987 0.973 1.0005/1/12-4/30/13 0.984 1.0005/1/13-4/30/14 0.972
All Years Average 0.947 1.005 0.999 1.001 0.998 1.002 0.999 1.000 1.000 1.001 0.999 1.000 1.000 1.000All Years Weighted 0.941 1.005 0.998 1.001 0.998 1.002 0.999 1.000 1.000 1.001 0.999 1.000 1.000 1.0005 Years Weighted 0.982 0.994 1.003 1.000 1.000 1.000 1.000 1.000 0.998 1.000 1.000 1.000 1.000 1.0003 Years Weighted 0.981 0.985 1.000 1.000 1.000 1.000 1.000 1.000 0.997 1.000 1.000 1.000 1.000 1.000Prior (4/30/13) 0.985 1.007 1.002 1.001 1.000 1.000 1.000 1.000 1.000 1.000 1.000 1.000 1.000 1.000 1.000
Selected 12-24 24-36 36-48 48-60 60-72 72-84 84-96 96-108 108-120 120-132 132-144 144-156 156-168 168-180 180-ULT
Age to Age 0.982 1.005 1.001 1.000 1.000 1.000 1.000 1.000 1.000 1.000 1.000 1.000 1.000 1.000 1.000Age to Ultimate 0.988 1.006 1.001 1.000 1.000 1.000 1.000 1.000 1.000 1.000 1.000 1.000 1.000 1.000 1.000
Notes:Not all averages are shown. Selected age to age factors are based on a review of all averages and actuarial judgment.
Oliver Wyman Actuarial Consulting, Inc.
106

Exhibit 7
City of Virginia BeachAnalysis of Unpaid Loss & ALAE at June 30, 2015
Automobile LiabilityData as of June 30, 2015
Loss & ALAE Limited to Retention
Comparison of Expected Development to Actual Development
SECTION I - REPORTED LOSS & ALAE ActualSelected Change in Expected Actual Selected
Ultimate Loss Expected Percent Reported Change in Minus Ultimate Loss Change inFiscal & ALAE as of Actual Reported Loss & ALAE as of Reported as of 4/13 - 6/15 Reported Expected & ALAE as of UltimateYears 4/30/13 4/30/13 6/30/15 4/30/13 6/30/15 (2b) - (2a) 4/13 - 6/15 (4) - (5) 6/30/15 Loss & ALAE
(1) (2a) (2b) (3a) (3b) (4) (5) (6) (7) (8)
7/1/04-6/30/05 1,207,148 1,194,993 1,169,493 100.0% 100.0% (25,500) 12,155 (37,655) 1,169,493 (37,655)7/1/05-6/30/06 757,562 750,182 725,117 99.9% 100.0% (25,065) 7,379 (32,444) 725,117 (32,444)7/1/06-6/30/07 504,989 504,989 504,989 99.8% 100.0% 0 0 0 504,989 07/1/07-6/30/08 363,478 355,237 345,237 99.7% 99.9% (10,000) 5,716 (15,716) 345,237 (18,242)7/1/08-6/30/09 368,069 368,069 368,069 99.5% 99.8% 0 0 0 368,069 07/1/09-6/30/10 726,460 726,460 726,460 98.8% 99.7% 0 0 0 726,460 07/1/10-6/30/11 290,604 256,601 221,944 91.7% 99.5% (34,657) 31,969 (66,626) 221,944 (68,661)7/1/11-6/30/12 1,312,510 1,075,223 957,294 70.7% 99.1% (117,929) 230,258 (348,187) 993,243 (319,267)7/1/12-6/30/13 807,439 194,995 356,438 30.7% 93.4% 161,443 553,771 (392,328) 460,993 (346,446)7/1/13-6/30/14 869,757 0 236,439 0.0% 75.3% 236,439 654,693 (418,254) 300,439 (569,318)7/1/14-6/30/15 883,913 * 0 259,117 0.0% 38.6% 259,117 340,815 (81,698) 701,416 (182,497)
Total All Years 8,091,931 5,426,749 5,870,597 443,847 1,836,756 (1,392,908) 6,517,400 (1,574,531)Exclude FY14 & FY15 6,338,260 5,426,749 5,375,041 (51,708) 841,248 (892,956) 5,515,545 (822,716)
SECTION II - PAID LOSS & ALAE ActualSelected Change in Expected Actual Selected
Ultimate Loss Expected Percent Paid Change in Minus Ultimate Loss Change inFiscal & ALAE as of Actual Paid Loss & ALAE as of Paid as of 4/13 - 6/15 Paid Expected & ALAE as of UltimateYears 4/30/13 4/30/13 6/30/15 4/30/13 6/30/15 (2b) - (2a) 4/13 - 6/15 (4) - (5) 6/30/15 Loss & ALAE
(1) (2a) (2b) (3a) (3b) (4) (5) (6) (7) (8)
7/1/04-6/30/05 1,207,148 1,169,493 1,169,493 99.8% 100.0% 0 37,655 (37,655) 1,169,493 (37,655)7/1/05-6/30/06 757,562 725,117 725,117 99.7% 99.9% 0 22,125 (22,125) 725,117 (32,444)7/1/06-6/30/07 504,989 504,989 504,989 99.6% 99.8% 0 0 0 504,989 07/1/07-6/30/08 363,478 345,237 345,237 99.4% 99.7% 0 9,619 (9,619) 345,237 (18,242)7/1/08-6/30/09 368,069 368,069 368,069 99.0% 99.6% 0 0 0 368,069 07/1/09-6/30/10 726,460 726,460 726,460 96.6% 99.4% 0 0 0 726,460 07/1/10-6/30/11 290,604 221,526 221,944 83.1% 99.2% 418 65,627 (65,209) 221,944 (68,661)7/1/11-6/30/12 1,312,510 797,646 851,797 49.5% 97.4% 54,151 488,455 (434,304) 993,243 (319,267)7/1/12-6/30/13 807,439 108,010 289,523 16.2% 86.4% 181,513 586,356 (404,842) 460,993 (346,446)7/1/13-6/30/14 869,757 0 231,421 0.0% 53.8% 231,421 468,076 (236,655) 300,439 (569,318)7/1/14-6/30/15 883,913 * 0 206,362 0.0% 21.8% 206,362 192,329 14,033 701,416 (182,497)
Total All Years 8,091,931 4,966,547 5,640,412 673,865 1,870,241 (1,196,376) 6,517,400 (1,574,531)Exclude FY14 & FY15 6,338,260 4,966,547 5,202,629 236,082 1,209,836 (973,754) 5,515,545 (822,716)
Notes:Columns (1), (2a), and (3) are from Oliver Wyman's report using data valued as of April 30, 2013.Column (2b) provided by City of Virginia Beach.Column (5) equals [Column (1) - Column (2a)] x [Column (3b) - Column (3a)] / [1.0 - Column (3a)].Column (7) equals Exhibit 1, Sheet 4, Column (9).Column (8) equals Column (7) - Column (1).* The selected ultimate for fiscal year ending 2015 has been revised with updated exposures.
Oliver Wyman Actuarial Consulting, Inc.
107

Oliver Wyman 100 North Tryon Street, Suite 3600 Charlotte, NC 28202 1 704 374 8413