activity set 3.2 prep pptx visual algebra for teachers
TRANSCRIPT

Activity Set 3.2PREP PPTX
Visual Algebra for Teachers
Chapter 3
REAL NUMBERS AND QUADRATIC FUNCTIONS
Visual Algebra for Teachers
Visual Algebra for Teachers
Activity Set 3.2
Introduction to Quadratic Functions

PURPOSETo learn: How to analyze quadratic extended tile sequences
and use ±x-squares while modeling these sequences.
How to distinguish quadratic extended tile sequences from linear extended tile sequences.
How to graph quadratic functions and note key features on the graphs such as turning points, x-intercepts and y-intercepts and to connect these ideas to the ranges of quadratic functions.
To use a graphing calculator to support t-table and graphing work.

Black and red tiles, white and opposite white n-strips and black and red x-squares
Graphing calculator with table functions (recommended)
MATERIALS
ooo
ooo

INTRODUCTION
Black x-SquareA Black x-Square represents a square number,
x2 = 12, 22, 32…
Both sides of the square are the same length as the long edge of the white and opposite white x-strips.
Because the square is black, the dimensions of the square can be x x or -x -x as shown on the next slide.

Black x-Square
Red x-SquareA Red x-Square represents a negative square number,
-x2 = -12, -22, -32…
Both sides of the square are the same length as the long edge of the white and opposite white x-strips.
Because the square is red, the dimensions of the square can be x -x or -x x as shown on the next slide.

Red x-Square
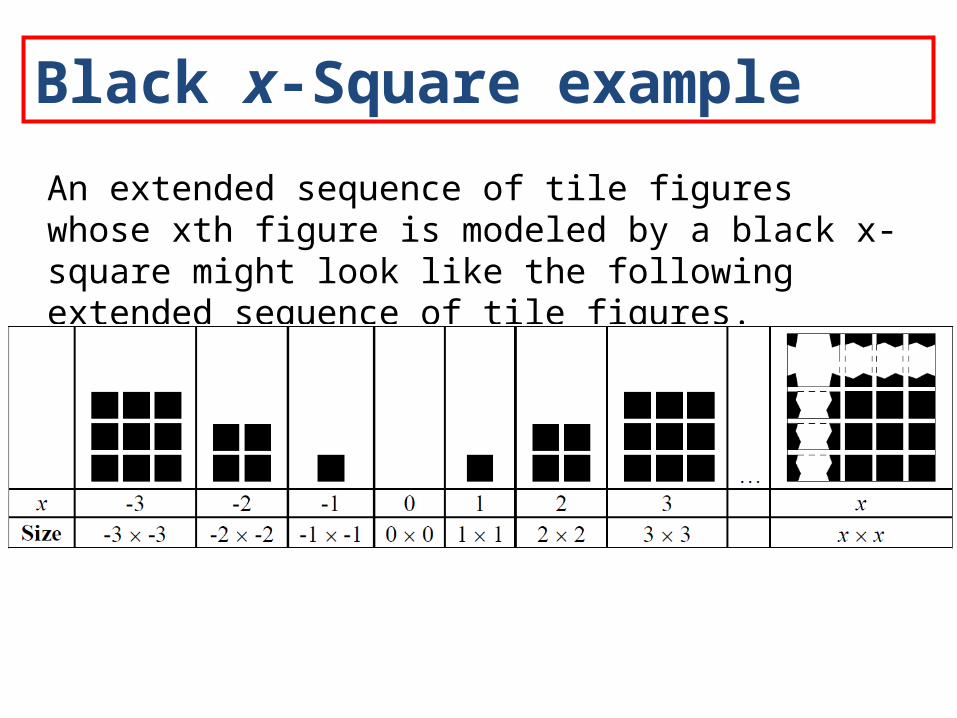
Black x-Square example
An extended sequence of tile figures whose xth figure is modeled by a black x-square might look like the following extended sequence of tile figures.
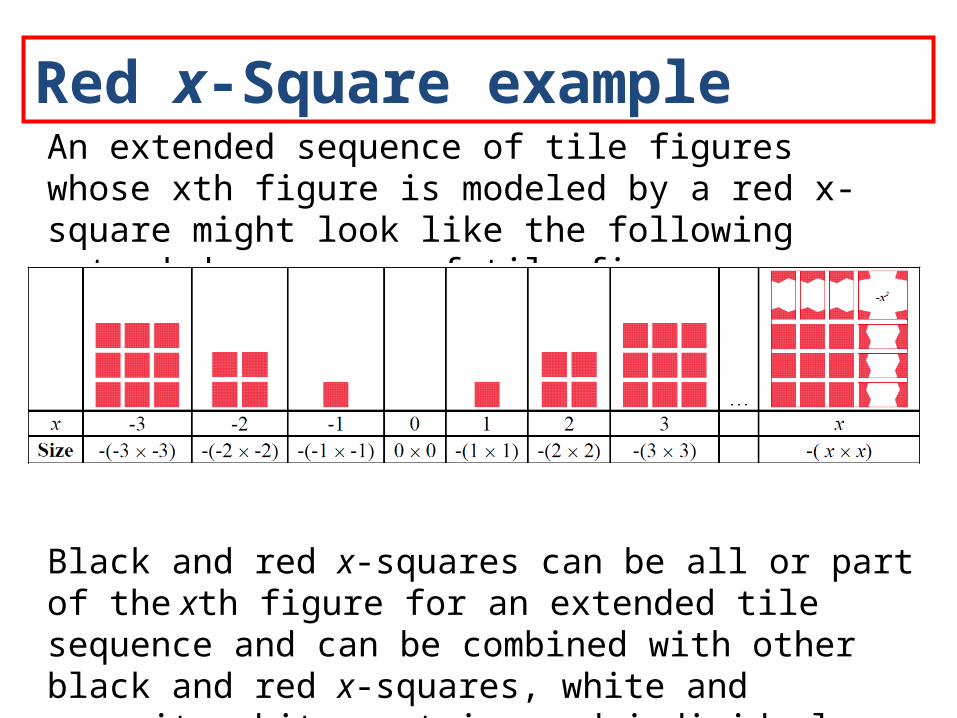
Red x-Square exampleAn extended sequence of tile figures whose xth figure is modeled by a red x-square might look like the following extended sequence of tile figures.
Black and red x-squares can be all or part of the xth figure for an extended tile sequence and can be combined with other black and red x-squares, white and opposite white x-strips and individual black and red tiles.

x-Strips, y output and edgesWe will call our white strips “white and opposite white x-strips” instead of “white and opposite white n-strips” and we will label the strips with x and –x instead of n and –n.
. x
-xoo
o ooo
x
-xo oo o oo

Sketching x-SquaresTo sketch a black or red x-square, you may wish to simply sketch and label an outline of the square. Remember the length of the edge of the square should match the length of the long edge of an x-strip.

Using a Graphing Calculator to Display T-Tables(use your calculator as you read along)
Step One Enter the formula for your function in the graphing menu (usually the y = button).
Use y = x + 1 as an example.
Using a Graphing Calculator
y = menu
y = x + 1
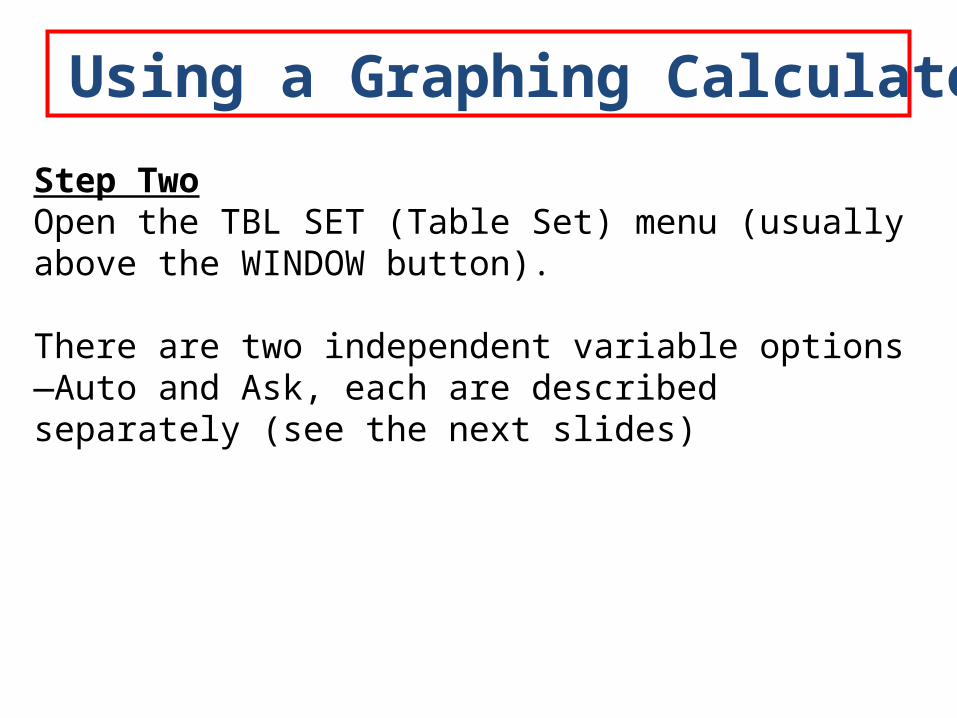
Step Two Open the TBL SET (Table Set) menu (usually above the WINDOW button).
There are two independent variable options—Auto and Ask, each are described separately (see the next slides)
Using a Graphing Calculator
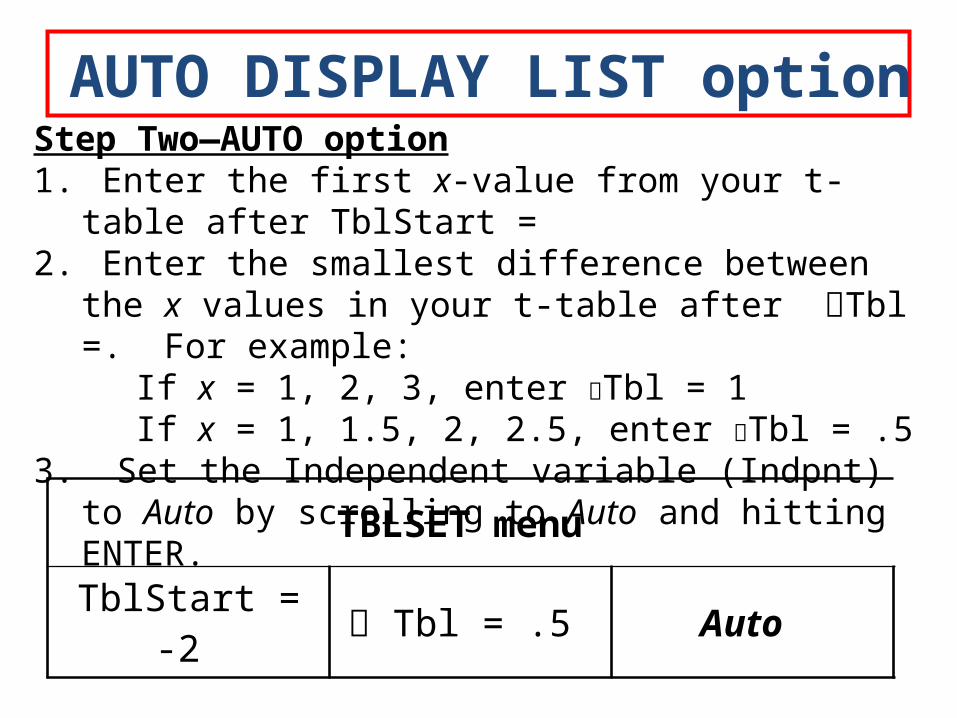
Step Two—AUTO option1. Enter the first x-value from your t-table after TblStart =2. Enter the smallest difference between the x values in
your t-table after Tbl =. For example:If x = 1, 2, 3, enter Tbl = 1If x = 1, 1.5, 2, 2.5, enter Tbl = .5
3. Set the Independent variable (Indpnt) to Auto by scrolling to Auto and hitting ENTER.
AUTO DISPLAY LIST option
TBLSET menu
TblStart = -2 Tbl = .5 Auto
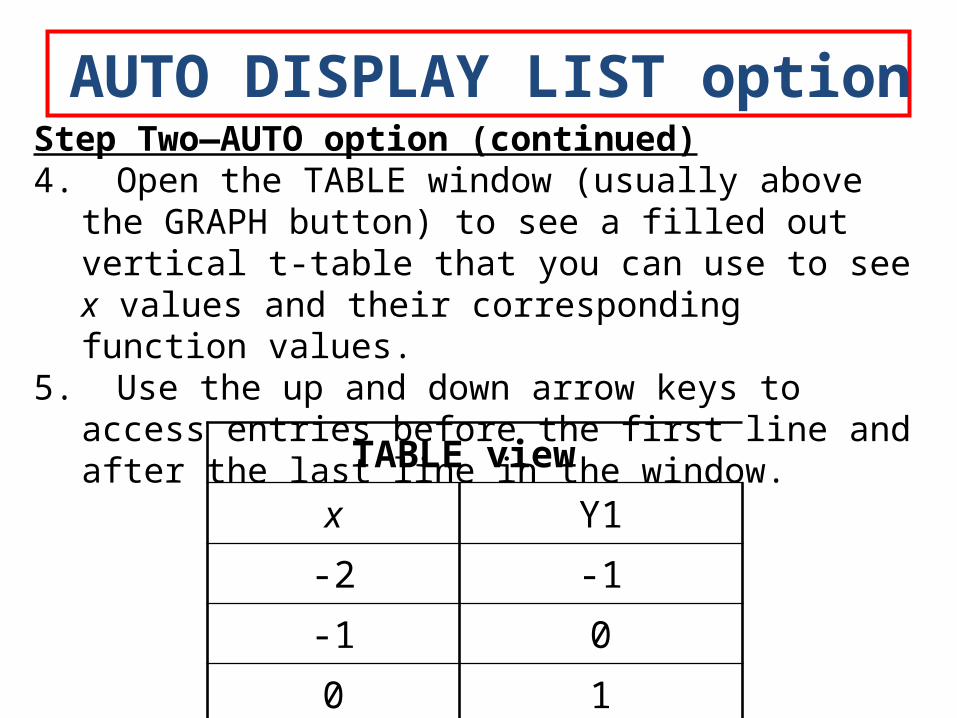
Step Two—AUTO option (continued) 4. Open the TABLE window (usually above the GRAPH
button) to see a filled out vertical t-table that you can use to see x values and their corresponding function values.
5. Use the up and down arrow keys to access entries before the first line and after the last line in the window.
AUTO DISPLAY LIST option
TABLE view
x Y1
-2 -1
-1 0
0 1
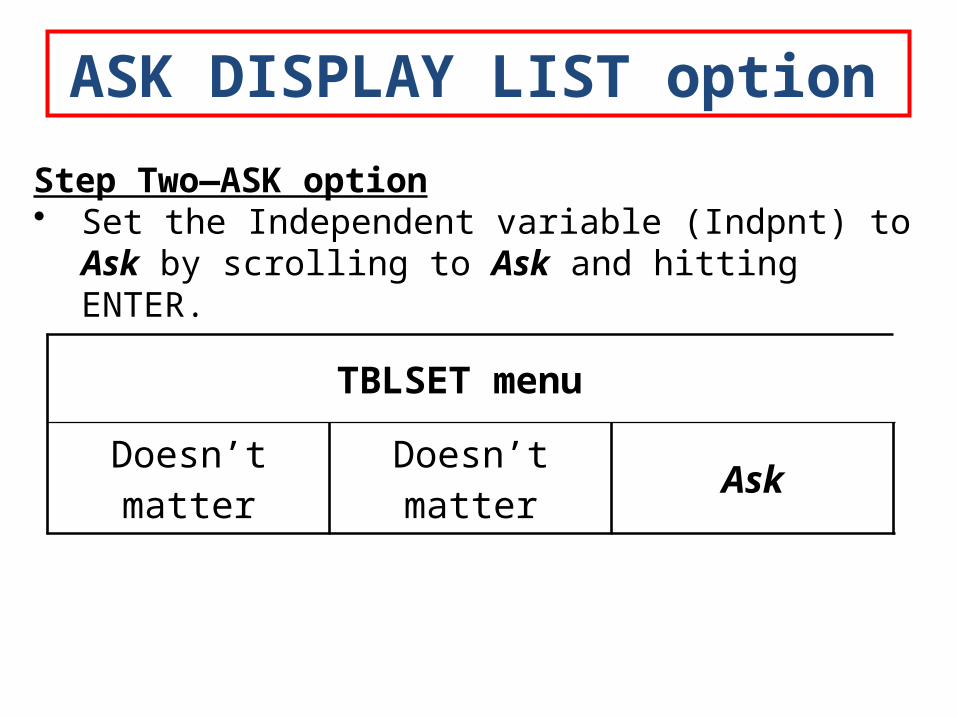
Step Two—ASK option• Set the Independent variable (Indpnt) to Ask by
scrolling to Ask and hitting ENTER.
ASK DISPLAY LIST option
TBLSET menu
Doesn’t matter Doesn’t matter Ask
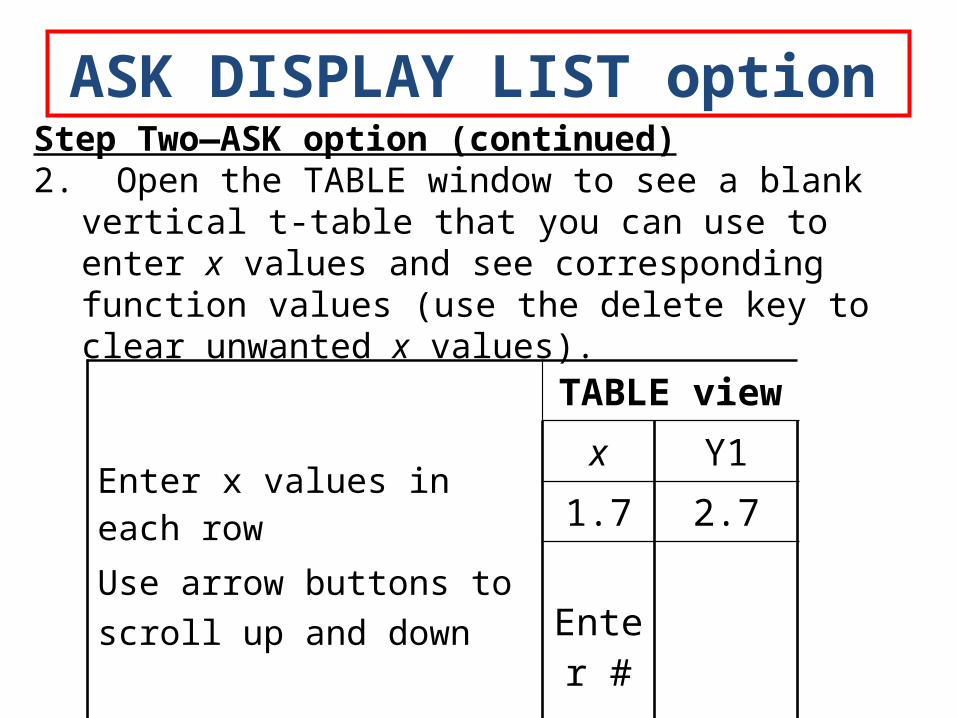
Step Two—ASK option (continued) 2. Open the TABLE window to see a blank vertical t-table
that you can use to enter x values and see corresponding function values (use the delete key to clear unwanted x values).
ASK DISPLAY LIST option
Enter x values in each rowUse arrow buttons to scroll up and down
TABLE view
x Y1
1.7 2.7
Enter #
CHANGE Function: Clear existing function and reenter a new function in the graphing menu (y = button)
ENTER Multiple Functions: Enter each function on separate line in the graphing menu (usually y1 =, y2 =, etc) under the y= button.
VIEWING Multiple T-Tables: To view t-tables for multiple functions already entered in the graphing menu, notice the function names (Y1, Y2, etc) will be displayed as the column headers in the TABLE window. To access columns off of the screen, use the right and left arrow keys on your calculator
Display Multiple T-Tables

1. Enter the formula for your function in the graphing menu (the y = button)
2. Use the WINDOW button and enter in (axes) values for
Xmin = Ymin =Xmax = Ymax=
3. Press the GRAPH button to see a display of your function graph
4. Change the window settings and explore the ZOOM features to look at different views of your graph.
To View Function Graphs

ZOOM Standard is often a good place to initially view the functions in this activity set
ZOOM Standard sets the WINDOW to:Xmin = -10 Xmax = +10Ymin = -10 Ymax= +10
ZOOM Fit (#0 which follows #9on Zoom menu) is a great way to get a good view of the main part of your graph on the view screen. 1. Set the x range (Xmin and Xmax)2. Select ZOOM Fit and the calculator will adjust the y
range to correspond to those x-values.
Zoom settings
Write in your coursepack, Activity Set 3.2 #2
Do 3.2 #2 questions a, b, c and d.
PREP Questions #2abcd

You are now ready for:
PREP QUIZ 3.2
See Moodle
Visual Algebra for Teachers