activity recognition using rajectory …pulkitag/btp-finalppt.pdf · activity recognition using...
TRANSCRIPT

ACTIVITY RECOGNITION USING TRAJECTORY
CLUSTERING IN
SURVEILLANCE VIDEOS
PULKIT AGRAWAL
PRINCE ARORA
SUPERVISORS:
DR. AMITABHA MUKERJEE
DR. K.S. VENKATESH
MOTIVATION
Large amount of surveillance videos, difficult to keep
manual check.
Terrorist activities !!!!
Need of automatic surveillance system.
First step, understanding usual and unusual activities.
What are they ??
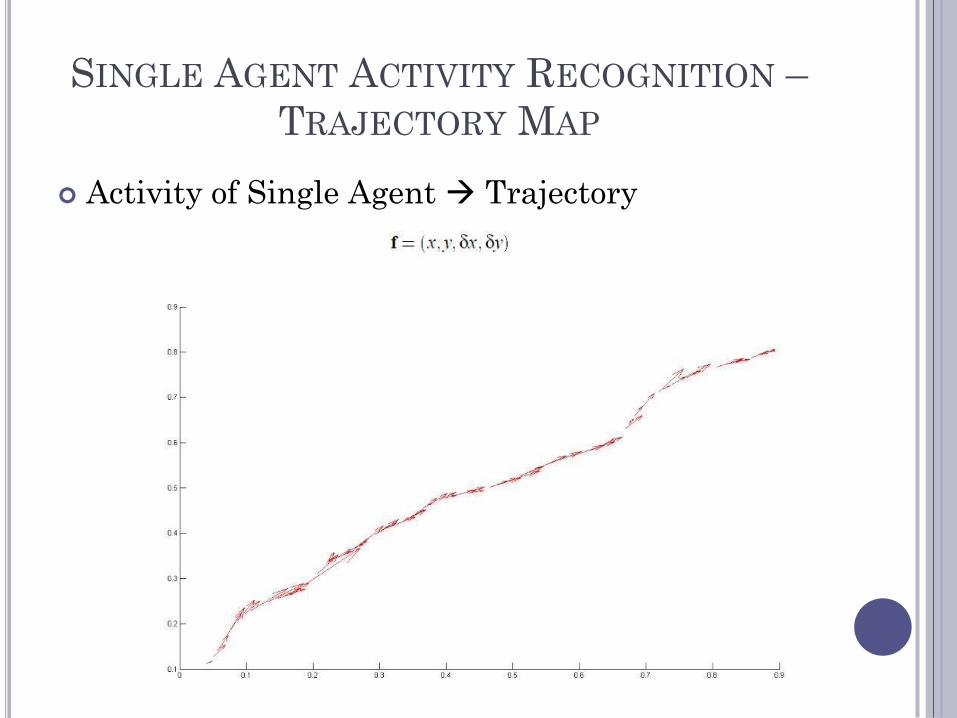
SINGLE AGENT ACTIVITY RECOGNITION –
TRAJECTORY MAP
Activity of Single Agent Trajectory

VIDEOS USED
Highway Video
Parking Lot Video

THE SYSTEM

PRE-PROCESSING OF AGENT TRACKS
Take only individual Agents
Remove Agents which move more than 10% of
frame in consecutive frames.
Remove Agents which appear for less than 3
frames.

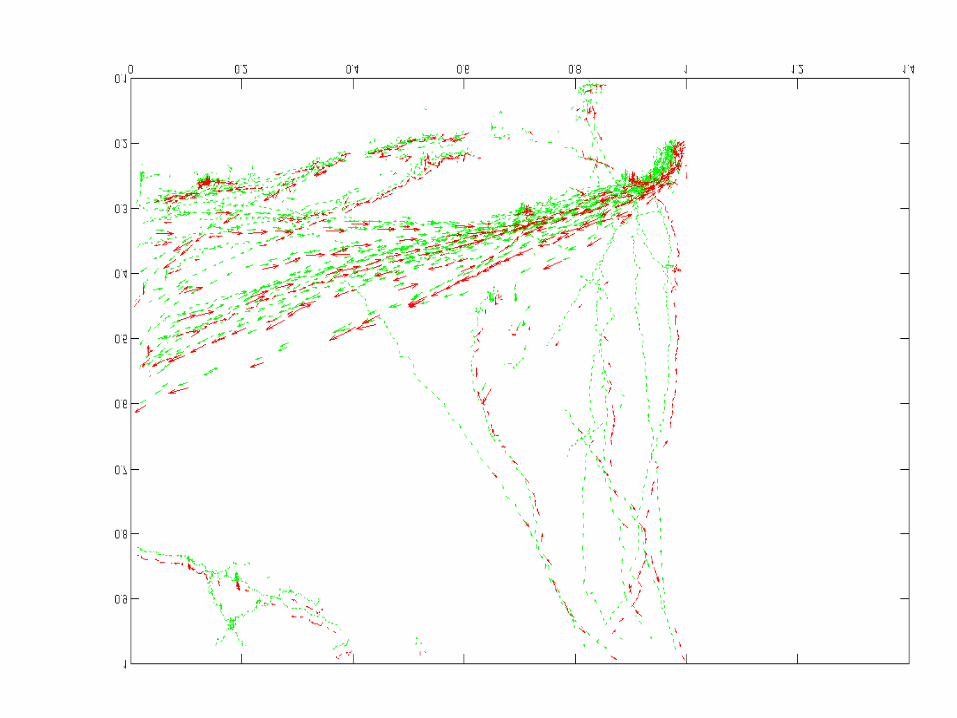
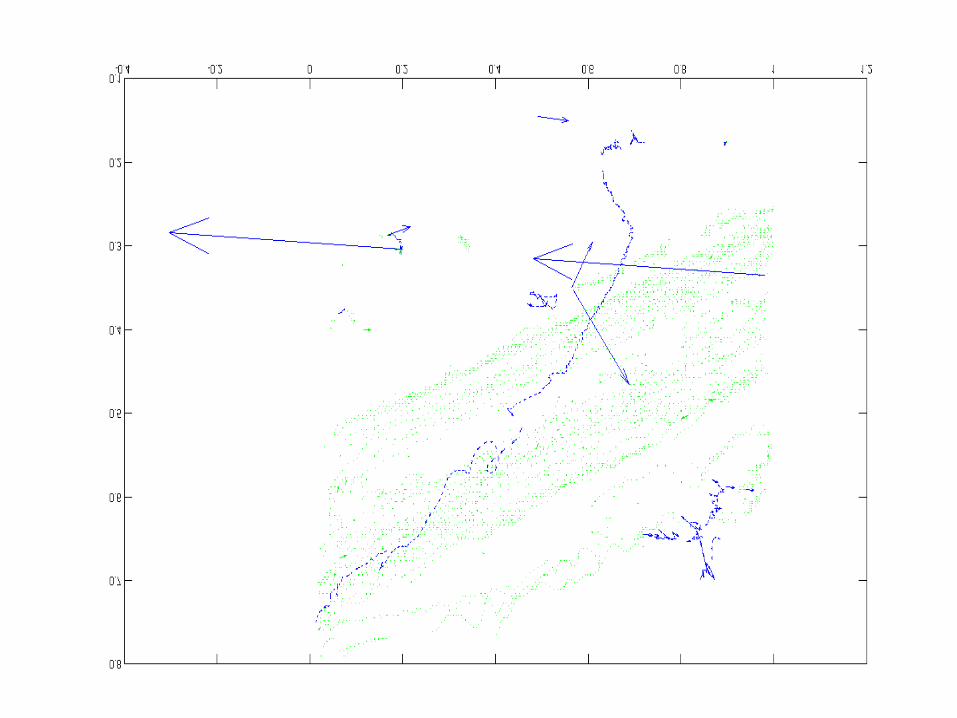
ACTUAL TRAJECTORIES
HighWay Video

ACTUAL TRAJECTORIES
Parking Lot Video

PROJECT LAYOUT
Usual and Unusual Trajectories – Subjective !
Perceptual distance between Trajectories ?
A Novel Approach
An Experiment designed for the same
Synthetic Data Generation
Provides - Proof of Concept
Real Time Data
Trajectory Clustering – Unsupervised !!!!
Identification of unusual and usual trajectories
OUR WORK
Code Detect Isolated Tracks
Tracks Code Words
Combined Space (x,y,dx,dy) v/s Separated Space (x,y),(dx,dy)
Hierarchical Code Word Generation
Design of Cognitive Experiment Collection of Data
Design of GUI for Collecting Synthetic Data
Proposing Algorithms for Trajectory Clustering/Identification of unusual trajectories.

FUNDAMENTAL ISSUES
Mapping of Perceptual distance in Feature
Space !
Representation of Trajectories
Vector Quantization
COGNITIVE ANALYSIS – A NOVEL APPROACH
Objective Measure – Perceptual Distance
between Trajectories.

A SCREEN SHOT

THE RESULTS
A Sequence of 5 Experiments
Orientation
Most Prominent
Perceptual distance increases with rotation of trajectory (until 90◦ and decreases thereof)
Interesting: Even if the agent traverses in totally opposite direction, people don’t perceive it as very different.
Speed
Speed Perceptual Distance
Less Prominent than Orientation
Almost Translation Invariant
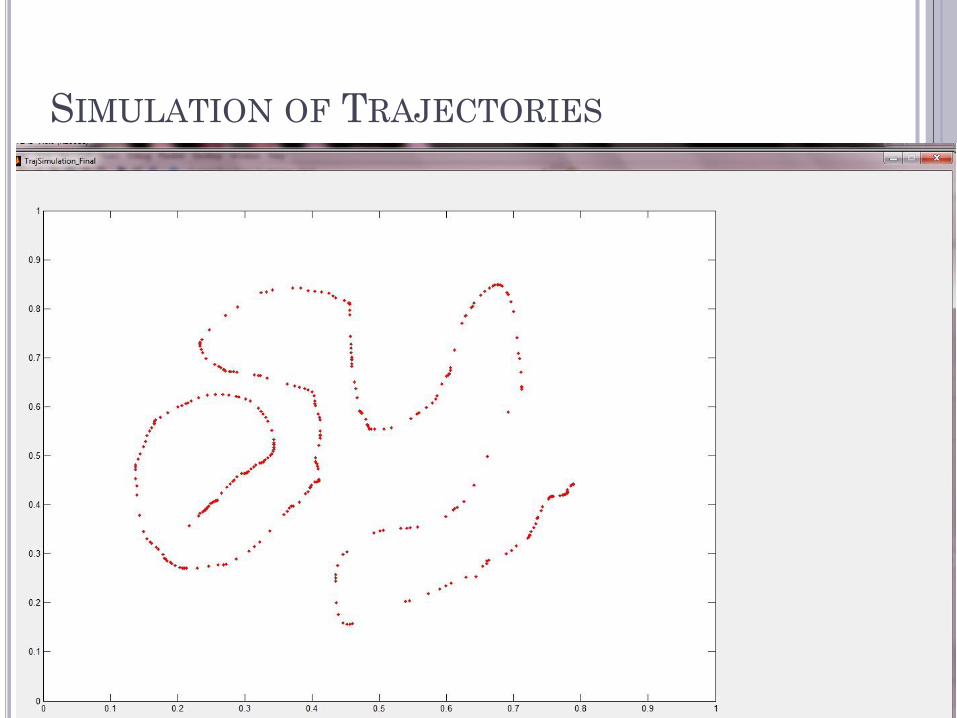
SIMULATION OF TRAJECTORIES
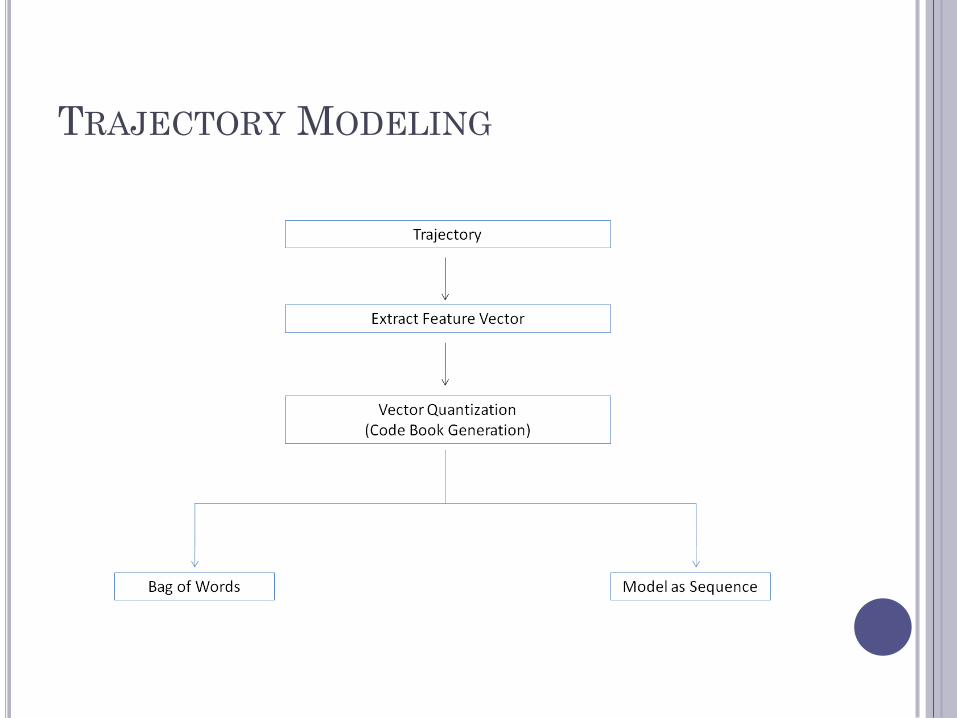
TRAJECTORY MODELING

TRAJECTORY MODELLING
Sequence of Words
v/s
Bag Of Words

THE GENERAL METHODS
Model as Sequence (Not Used)
N gram language model
Markov Chains with k-memory
Issue: Bias towards smaller trajectories
Bag Of Words (Used)
Trajectory – Histogram – Frequency Count of Code
Words
Distance Computation b/w Histograms
Dimensionality Reduction – PCA, Kernel PCA
K-means clustering etc

BAG OF WORDS – FEATURE VECTOR
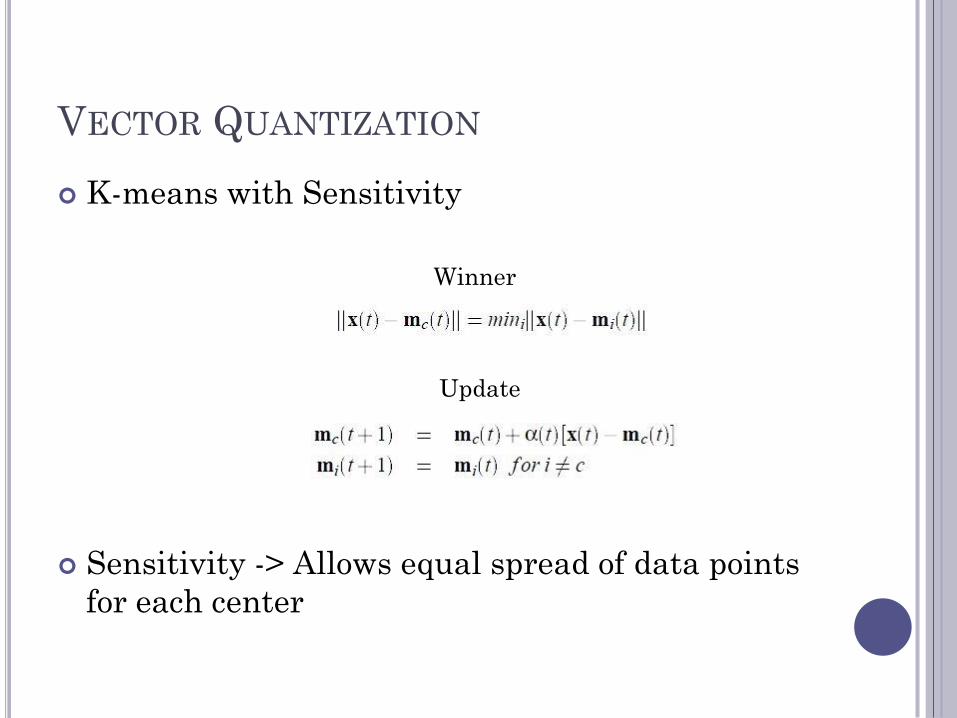
VECTOR QUANTIZATION
K-means with Sensitivity
Sensitivity -> Allows equal spread of data points
for each center
Winner
Update


HIERARCHICAL CLUSTERING

TRAJECTORY CLUSTERING – METHOD 1
K-Means Clustering based on Bhattacharya
Distance
The less prominent trajectories group together
Results as depicted

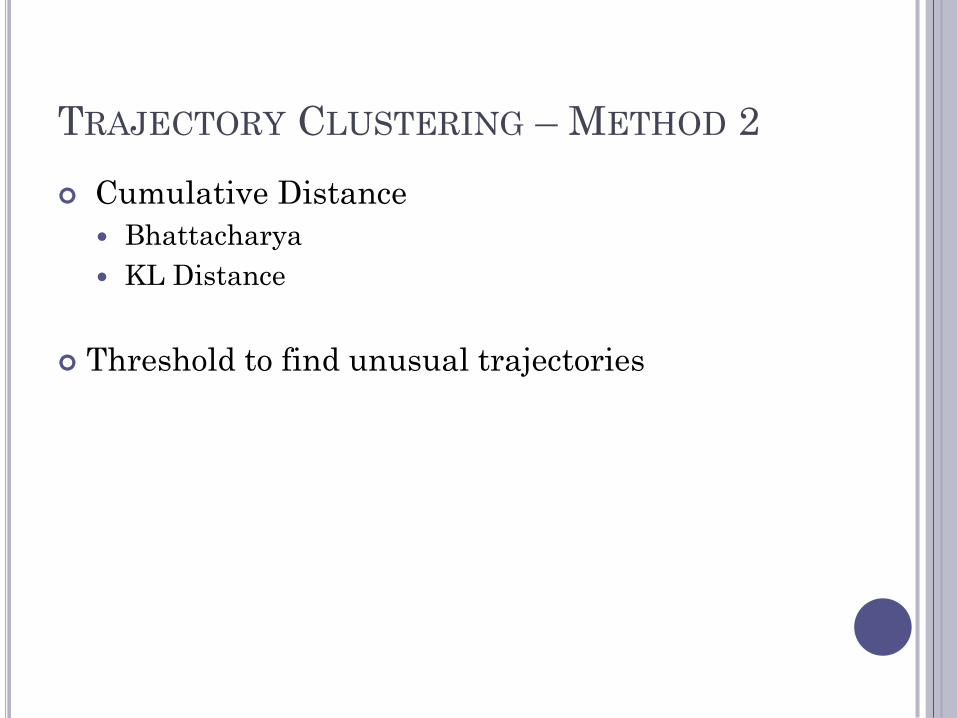
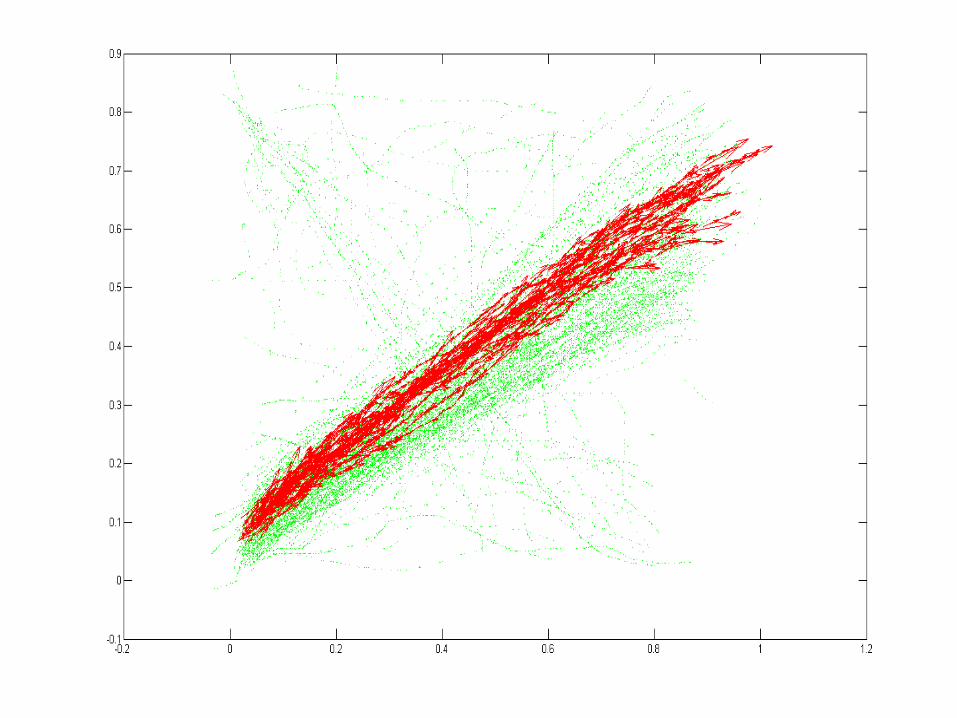
TRAJECTORY CLUSTERING – METHOD 2
Cumulative Distance
Bhattacharya
KL Distance
Threshold to find unusual trajectories


TRAJECTORY CLUSTERING – METHOD 3
PCA
Top 10 Components
Cumulative Distance
Bhattacharya
KL Distance
Threshold to find unusual trajectories

SEPARATED SPACE CLUSTERING – A
NOVEL APPROACH
Quantize (x,y) space – Heirch. Clustering
8 Orientations – Compute Orientations for all
member points of Center.
Form a count histogram.
Similarly form a 5 bin histogram of speeds
depending on Mean, Variance of speeds.
D(p,q) = αD(C1,C2) + βD(O1,O2) +γD(V1,V2)
γ = 1; β = 3; α = 2 (Based on perceptual data)

PARADIGM 2
Compute Distance of Each Point on Trajectory Center Distance
D1 = 0 if {d <Thresh/2}
= 1 - e-(||c-x||) {Otherwise}
Orientation Unusualness D2 = Summation of values in other bins
Speed Unusualness D3 = 0.25 if in Mean Bin +/- 1
D3 = 0.75 if in Mean Bin +/- 2
D = αD1 + βD2 + γD3 (Threshold D)
If more than 50% points are unusual, then label trajectory as unusual.
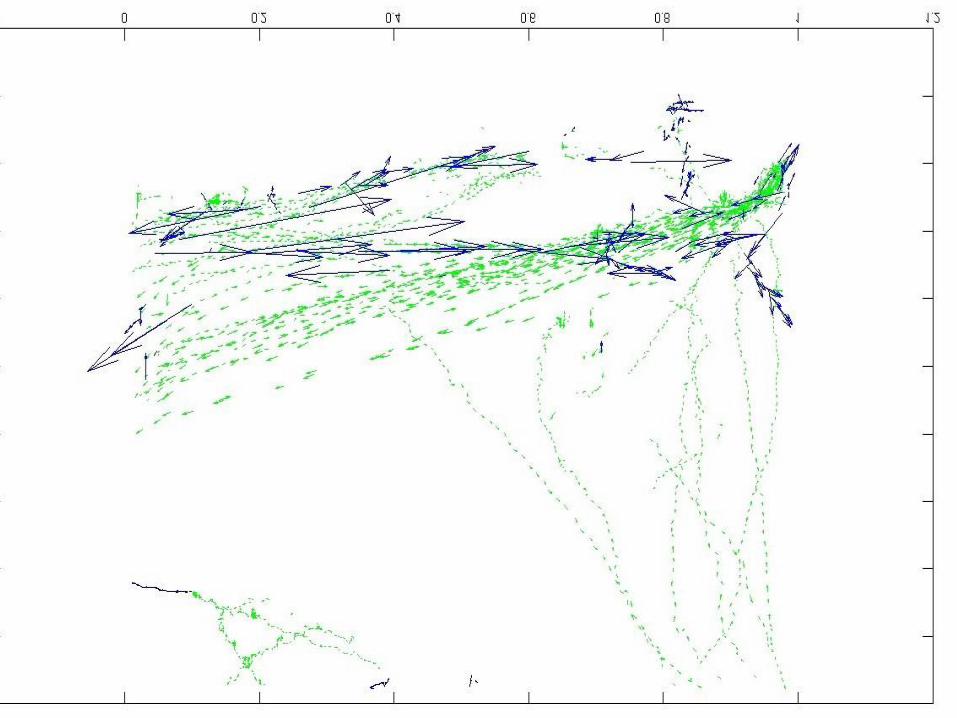
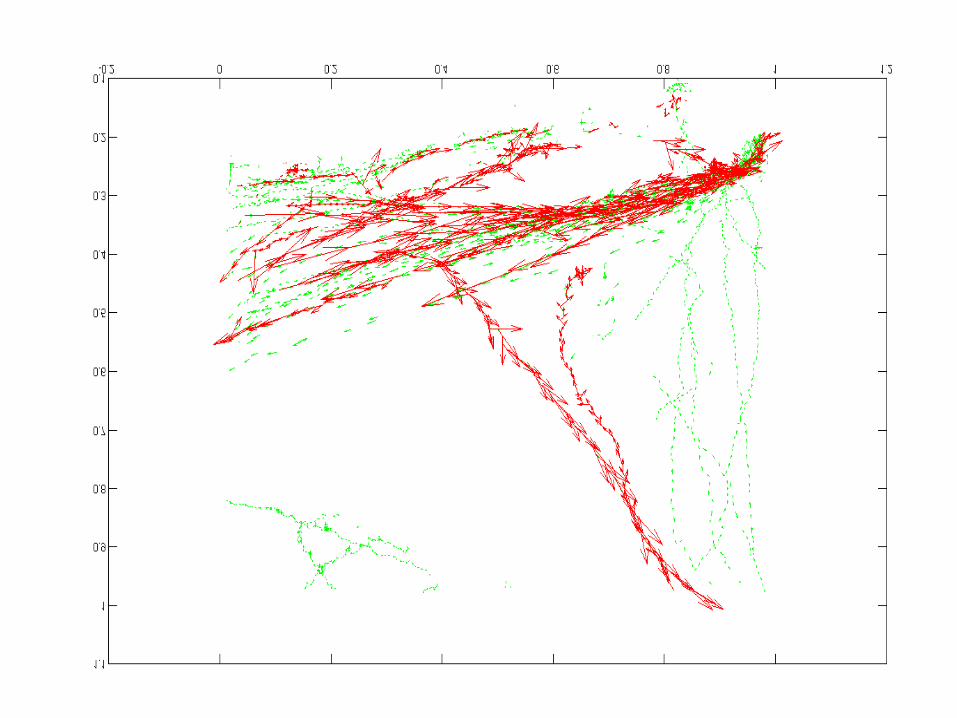
Can differentiate decently well between Unusual and Usual Trajectories

RESULTS
Unusual
Usual

FUTURE WORK
Improving Tracking
Use of object identification for better trajectories
Use of usual notion of trajectories to improve
tracking

REFERENCES

THANK YOU
Questions ??