activity patterns and ca2+ dynamics of sensory ... file1 activity patterns and ca2+ dynamics of...
TRANSCRIPT
1
Activity Patterns and Ca2+
Dynamics of Sensory Interneurons
and Motoneurons of the Cricket Auditory Pathway
Thomas Baden
Girton College
This dissertation is submitted for the degree of Doctor of Philosophy in
the University of Cambridge
March 2008
2
PREFACE
Behavioural experiments relating front leg movements to phonotactic steering were
performed by Leanne Scott. All other aspects of this dissertation are the result of my
own work and include nothing that is the outcome of work done in collaboration.
Chapter 3 has been published in the Journal of Developmental Neurobiology (Former:
Journal of Neurobiology) (Baden and Hedwig 2007). Chapter 2 has been submitted to
the Journal of Experimental Biology, and Chapter 4 has been submitted to the Journal
of Neurophysiology. No part of this dissertation has been submitted for any such
degree, diploma or other qualification.
3
ACKNOWLEDGEMENTS
I wish to thank Berthold Hedwig, my supervisor and friend, for the continued
guidance, uncounted hours of fruitful discussions and innumerable insightful
recommendations. I am very grateful to Leanne Scott for the very skilled conduct of
behavioural experiments. I thank Glen Harris and Steve Ellis for their excellent
technical assistance, and the many people who devoted their time and attention to
reading the various parts of this thesis. I furthermore thank all members of the
neurobiology group, especially Olivier Françoise Faivre, Maja Zorović and Greg
Sutton, for the helpful discussions and the jolly good time we had together. I wish to
thank my girlfriend Berenika - her brilliant typesetting skills were invaluable, and her
unusual ideas were a source of constant inspiration. Finally, and most importantly, I
thank my parents for never-ending support throughout the years.
The BBSRC, the Cambridge European Trust, the Cambridge Newton Trust, the
Zoology Balfour Fund, Cambridge funded my PhD. The BBSRC in addition allowed
me to attend the Microelectrode Techniques Course at Plymouth, the Invertebrates
Sound and Vibrations conference at Toronto, Canada and the Gordon Conference
Dendrite: Structures, Molecules and Function in Ventura, CA. I also received funding
from the German Society for Neuroscience and Girton College, Cambridge, to attend
other conferences and meetings.
4
CONTENTS
PREFACE ..................................................................................................................................... 2
ACKNOWLEDGEMENTS ..................................................................................................................... 3
SUMMARY ..................................................................................................................................... 5
CHAPTER 1 INTRODUCTION
Background .................................................................................................................. 6
The Electrophysiological Approach ............................................................................. 6
The Optical Imaging Approach: Ca2+
in Neurons ........................................................ 7
Combining Electrophysiology and Optical Imaging .................................................... 8
Phonotaxis in Crickets ................................................................................................. 8
The Omega Neuron-1 ................................................................................................. 10
The Front Extensor and Flexor Tibiae Motoneurons ................................................ 11
Thesis Layout ............................................................................................................. 12
CHAPTER 2 FRONT LEG MOVEMENTS AND TIBIAL MOTONEURONS UNDERLYING AUDITORY
STEERING IN THE CRICKET
Summary .................................................................................................................... 13
Introduction ............................................................................................................... 14
Methods ...................................................................................................................... 15
Results ........................................................................................................................ 19
Discussion .................................................................................................................. 25
CHAPTER 3 NEURITE SPECIFIC CA2+ DYNAMICS UNDERLYING SOUND PROCESSING IN AN
AUDITORY INTERNEURON
Summary .................................................................................................................... 39
Introduction ............................................................................................................... 40
Methods ...................................................................................................................... 41
Results ........................................................................................................................ 44
Discussion .................................................................................................................. 49
CHAPTER 4 DYNAMICS OF FREE INTRACELLULAR CA2+ DURING SYNAPTIC AND SPIKE
ACTIVITY OF CRICKET TIBIAL MOTONEURONS
Summary .................................................................................................................... 63
Introduction ............................................................................................................... 63
Methods ...................................................................................................................... 64
Results ........................................................................................................................ 67
Discussion .................................................................................................................. 73
CHAPTER 5 GENERAL DISCUSSION
Background ................................................................................................................ 87
Front Tibial Movements and Motoneurons Underlie Phonotactic Steering .............. 88
Activity Patterns of the Omega Neurons-1 and Tibial Motoneurons ......................... 89
Ca2+
and Electrical Activity in Inter- and Motoneurons ............................................ 89
Dendrites .................................................................................................................... 89
Axon and Soma .......................................................................................................... 95
Axonal Terminals ....................................................................................................... 96
Summary of Functional Specialisations ..................................................................... 97
Future Projects .......................................................................................................... 98
BIBLIOGRAPHY ................................................................................................................................ 101
5
SUMMARY
The complexity of information processing within the central nervous system of all
animals relies on the connections between neurons as well as on the particular
processing properties of each individual neuron. For a deeper understanding of this
processing I analysed the sensory-motor pathway underlying phonotactic steering in
the cricket. Using optoelectronic measurements of front leg movements and
electromyogram recordings of the tibial muscles during phonotaxis I demonstrated an
input from ipsilateral sounds to the slow extensor tibiae motoneuron, and an input
from contralateral sounds to the fast flexor tibiae motoneuron. This highlighted the
importance of the front tibial motoneurons in phonotactic steering. I consequently
compared the processing properties of these motoneurons and those of a first order
auditory interneuron, the Omega Neuron-1. I recorded the synaptic and spike activity
of both neuron types and simultaneously imaged the distribution of free intracellular
Ca2+
over space and time during rest and activity. Ca2+
is a key cation, controlling
many intracellular signalling cascades involved in neuronal information processing.
Furthermore Ca2+
is a good indicator of local activity within different branches of
neurons. In the Omega Neurons-1 optical imaging revealed a tonotopic synaptic input
arrangement of auditory afferents at the dendrites. Furthermore Ca2+
influx was
strongly dependent on high voltage activated channels, and Ca2+
dynamics were
particularly slow and prolonged at the spike generating zone. In this neuron Ca2+
controls an outward current leading to an automatic gain control of neuronal activity.
In contrast, Ca2+
influx to the main dendrites of tibial motoneurons was spatially
uniform, and occurred predominately through low voltage activated channels. Here
Ca2+
did not feed back on synaptic inputs nor directly on membrane potential. The
consequences of the very different control over and role of Ca2+
in both neuron types
is discussed in the light of each neuron’s functional context.

Chapter 1
6
CHAPTER 1
INTRODUCTION
Background
The processing properties of the nervous system of any animal fundamentally rely on
the properties of its cellular elements, the individual neurons. Neurons receive
synaptic inputs along their complex tree of neurites. Temporally and spatially distinct
synaptic inputs are integrated according to the 3D morphology of the neuronal arbours
and their membrane properties (Eilers and Konnerth 1997, Augustine et al. 2003,
London and Häusser 2005). Scientists are driven to understand the cellular and
molecular principles that shape the specific signal integration and information
processing properties of neurons. How do a neuron’s morphology, the arrangement of
its synaptic inputs, its ionic currents or its recent activity contribute to its function
within the nervous system? To approach this question, I studied the processing within
individually identified neurons of the cricket by combining electrophysiology and
optical imaging of free intracellular Ca2+
.
The Electrophysiological Approach
Intracellular recording of neurons allows studying neuronal processing with high
sensitivity and temporal resolution. The voltage change across the neuron’s
membrane revealing synaptic inputs and spike activity can be accurately measured at
any one point of the neuron. The connections between neurons can be identified, or
the result of individual or multiple synaptic inputs reaching a neuron can be
investigated (e.g. Burrows 1996b). However one key limitation is associated with this
technique. Single microelectrodes only allow measuring the electrical activity at one
point at a time, making it difficult to draw conclusions about spatial integration of
activity across different branches of a neuron (Gwilliam and Burrows 1980, Williams
and Atkinson 2007).

Chapter 1
7
The Optical Imaging Approach: Ca2+
in Neurons
Optical imaging combined with microinjected fluorescent Ca2+
indicators allows for
monitoring free intracellular Ca2+
in live neurons (Mammano et al. 1999, Göbel and
Helmchen 2007). Intracellular signalling through Ca2+
may underlie processes as
diverse as the regulation of ion channels, secondary messenger cascades or the
triggering of synaptic vesicle release (Berridge 1998, Augustine et al. 2003). Through
voltage gated Ca2+
channels the concentration of free intracellular Ca2+
is dependent
on membrane potential (DiPolo and Beaugé 1987, Umemiya and Berger 1994, Bean
2007). Furthermore Ca2+
enters neurons as a direct consequence of synaptic activation
via ligand gated Ca2+
channels or via release from intracellular stores (Berridge 1998,
Bootman et al. 2001). Therefore the presence of free intracellular Ca2+
can both be
indicative of electrical and synaptic activity at any one point within a neuron, and
subserve specified functions depending on the local intracellular signalling machinery
(London and Häusser 2005).
Using optical imaging of free intracellular Ca2+
the spatial limits of classical
electrophysiology can be met: it is possible to indirectly monitor neuronal activity at
several different branches of the same neuron at the same time (e.g.: Ogawa et al.
1996, Single and Borst 1998). However, the chemical properties of fluorescent
indicator molecules, as well as the optical properties of the imaging systems impose
limits on the amplitude resolution as well as the speed of image acquisition. The faster
the video capture rate, the less light is available per frame, and therefore the worse
image quality and contrast. Increasing illumination intensity to increase fluorescence
yield, and therefore image quality, is met by the fail safe properties of the cellular
machinery: apoptosis. The build up of free radicals as a by-product of the excitation
of fluorescent probes, as well as a too high concentration of free intracellular Ca2+
due
to its disturbed regulation introduced by the indicator probes results in the destruction
of the neuron (Bootman et al 2001. Göbel and Helmchen 2007). Through the use of
imaging techniques alone the temporal resolution and sensitivity of
electrophysiological techniques can therefore not be achieved.
Chapter 1
8
Combining Electrophysiology and Optical Imaging
Both the spatial limitations of electrophysiology as well as the temporal and contrast
limitations of optical imaging can be met in a joint approach of both techniques.
Combining intracellular recordings with Ca2+
imaging allows the electrical activity of
a neuron measured at one point to be correlated with the spatio-temporal distribution
of free intracellular Ca2+
. In this way Single and Borst (1998) demonstrated a
retinotopic input arrangement along the dendrites of a fly visual interneuron, and
Ogawa et al. (1996) revealed a dendritic tuning of the cricket giant cercal interneuron
to wind direction. The combined approach of electrophysiology and optical imaging is
one of the key advances in neuroscience of the past 20 years, and significantly
contributes to our understanding of the cellular and subcellular processes underlying
information processing in neurons.
I intracellularly recorded from interneurons and motoneurons of the neuronal
network underlying phonotactic steering in the cricket while optically imaging free
intracellular Ca2+
. This allowed me to study how these neurons integrate and process
information on a sub-cellular level, and to relate these principles to their role in
auditory-to-motor integration.
Phonotaxis in Crickets
The behaviour of phonotaxis in crickets (Gryllus bimaculatus) and its underlying
neuronal control is one of the best studied invertebrate sensory-to-motor model
systems (Wohlers and Huber 1978, Pollack and Hoy 1980, Schildberger et al. 1989,
Horseman and Huber 1994, Pollack 2001, Hedwig and Poulet 2005). Crickets use
acoustic communication for mate attraction, courtship and signalling territorial
rivalry. To attract a female, male G. bimaculatus generate a loud, repetitive calling
song, sometimes lasting several hours. The female uses this song to approach the
singing male. The behaviour can be studied in the lab with the use of a trackball or
treadmill system. This allows recording the walking patterns of crickets in response to
acoustic stimulation. Hedwig and Poulet (2005) demonstrated rapid steering
movements of crickets in response to individual syllables of calling song. Animals
responded to sounds presented alternately from the left and right with a delay of 55-

Chapter 1
9
60ms – too fast to allow for a complete recognition of the song’s temporal pattern.
Once phonotactically responsive, crickets responded to unattractive sounds as well
(Poulet and Hedwig 2005). Accordingly, a pattern recognition network may operate in
parallel to the neuronal network conveying the auditory information to the motor
system. Activation of such a system prior to phonotaxis may lead to a modulation of
the gain of a direct auditory-to-motor loop.
Cricket phonotaxis requires three key processing stages: i) recognition of the
sound pattern ii) localisation of the sound source, and iii) the production of the
appropriate motor responses in order to walk, or fly towards the singing male. The
pattern recognition system is probably located in the brain (Pollack and Hoy 1980,
Schildberger 1984). Some candidate neurons that may be involved in this process
have been described. Sound localisation is achieved though comparing the intensity of
the same acoustic signal received at the two ears, which are located in the front legs.
Depending on the wavelength of the sound and acoustic shadowing effects between
the ears the physical difference in sound energy received by the two ears can be very
small. Therefore, next to mechanical adaptations (Larsen et al. 1989), crickets have
evolved a neuronal mechanism to enhance bilateral differences of sound evoked
activity in the central nervous system. Signals received by the two auditory organs are
forwarded to a small number of bilaterally paired auditory interneurons of the
prothoracic ganglion via a population of 50-60 auditory afferents per ear (Imaizumi
and Pollack 2005). Here a bilateral pair of reciprocally coupled inhibitory neurons, the
Omega Neurons-1 (ON1), enhances intensity differences in the left and right auditory
pathways (Wohlers and Huber 1982, Selverston et al. 1985, Horseman and Huber
1994). Ascending Neurons-1 and 2 (AN1, AN2) then forward the auditory
information to the brain (Selverston et al. 1985, Horseman and Huber 1994, Faulkes
and Pollack 2000).
To allow for phonotactic steering the activity of the left and right auditory
pathways information must be forwarded to the walking and flight motor systems.
Little is known about which movements and muscles underlie auditory steering.
During phonotactic flight of Teleogryllus oceanicus dorsal longtitudinal muscles are
activated by sounds (Pollack and Hoy 1980). Which movements and muscles underlie
auditory steering during walking? I monitored the front leg movements (Dürr and
Ebeling 2005, Rosano and Webb 2007) and used electromyogram recordings of the
tibial muscles while crickets phonotactically oriented on a trackball system. This
Chapter 1
10
allowed me to identify the front leg tibial extensor and flexor motoneurons as an
output pathway of phonotactic steering. I intracellularly stained and identified these
motoneurons and investigated their synaptic inputs. This allowed me to draw
conclusions by which pathway auditory information may reach these motoneurons.
The identification of a neuronal output pathway for phonotactic steering
offered the possibility to compare the processing principles of two types of neurons at
different stages of this auditory-to-motor network. I studied the first order auditory
interneuron ON1 as an example of a neuron involved in early auditory processing, and
the tibial extensor and flexor motoneurons of the front leg as examples of neurons
located at the output of the network. Using a combined approach of Ca2+
imaging and
electrophysiology I investigated how the processing within these neurons is adapted
towards their very different roles in supporting auditory steering.
The Omega Neuron-1
The Omega Neuron-1 (ON1) of the cricket is a bilaterally paired auditory interneuron
located entirely within the prothoracic ganglion. It is highly conserved between
species of crickets and has been the focus of several studies aiming to analyse its
precise connectivity (Selverston et al. 1985, Horseman and Huber 1994), processing
(Wohlers and Huber 1978, Wiese and Eilts 1985, Sobel and Tank 1994, Nabatyian et
al. 2003) and resultant role (Selverston et al. 1985) in the auditory pathway. The
neuron is almost entirely planar, and extends its cellular processes 200μm beneath the
ventral ganglion surface. It receives direct excitatory inputs from the ear ipsilateral to
its soma, and in turn forms inhibitory connections onto its mirror image partner as
well as the contralateral AN1 and AN2. The network of reciprocal inhibition between
the pair of ON1s enhances the difference in activation between the two neurons, and
through their connections to ascending neurons the activity difference in the entire left
versus right auditory pathway (Horseman and Huber 1994). Sobel and Tank (1994)
studied the dynamics of free intracellular Ca2+
in the ON1 of Acheta domesticus. They
demonstrated a large Ca2+
influx in response to increased spike activity. Through
photo-release of caged Ca2+
they further demonstrated the existence of a Ca2+
controlled hyperpolarising current, which acts as a noise filter (Pollack 1988).
However Sobel and Tank were limited by the temporal resolution of optical imaging
techniques available. Furthermore Ca2+
signals recorded in axonal and dendritic
branches, the spike generating zone and the soma were not differentiated. I analysed
Chapter 1
11
the spatio-temporal Ca2+
dynamics associated with sound processing in the ON1 of G.
bimaculatus. Building on the work by Sobel and Tank (1994) I demonstrated neurite
specific Ca2+
dynamics that underlie the function of this neuron during sound
processing.
The Front Extensor and Flexor Tibiae Motoneurons
Motoneurons are the output channels by which the activity patterns of motor networks
are conveyed to their effectors (Burrows 1996a). These neurons are the convergence
point of central premotor activity, direct sensory drive and sensory feedback.
Accordingly motoneurons integrate information from many different sources and
form a single coherent output to drive muscles. While the specific control over
motoneurons reflects the processing of entire neuronal networks rendering it difficult
to analyse, their output is comparatively simple. Following the identification of front
tibial motoneurons as an output pathway of phonotactic steering in crickets, I
investigated their spatio-temporal Ca2+
dynamics during synaptic and spike activity
and analysed the cellular machinery underling the distribution and role of free
intracellular Ca2+
. I consequently analysed the common principles and differences
between the control over and the role of Ca2+
in these motoneurons and in the ON1.
This highlighted the importance of the specialisation of the cellular machinery
involved in information processing in neurons of different functional roles within the
same neuronal network.

Chapter 1
12
Thesis Layout:
First I identified the tibial extensor and flexor motoneurons as a neuronal output
pathway of phonotactic steering in the cricket. Using optical imaging and
electrophysiology I then investigated the adaptations and processing principles of
neurons located at opposite ends of this auditory-to-motor network. For this I
recorded from the 1st order interneuron ON1 as an example of a neuron located early
in the auditory pathway, and from the newly identified front tibial motoneurons as
output channels of auditory steering. Chapters 2, 3 and 4 are presented as individual
papers with their own abstract, introduction, methods, results and discussion sections:
Chapter 1: Introduction
Chapter 2: Front leg movements and tibial motoneurons underlying auditory
steering in the cricket.
Chapter 3: Neurite-specific Ca2+
dynamics underlying sound processing in an
auditory interneuron.
Chapter 4: Dynamics of free intracellular Ca2+
during synaptic and spike activity
of cricket tibial motoneurons.
Chapter 5: General discussion

Chapter 2
13
CHAPTER 2
Front Leg Movements and Tibial Motoneurons Underlying Auditory
Steering in the Cricket
SUMMARY
Front leg movements in the cricket (Gryllus bimaculatus) were measured during
phonotactic steering on a trackball together with electromyogram recordings of the
tibial extensor and flexor muscles. An optoelectronic system revealed the movement
patterns of a front leg from in front of the animal. Up-down leg movements clearly
indicated the step cycle and were independent of auditory stimulation. In contrast left-
right movements of the front leg were dependent on sound direction, with crickets
performing rapid steering leg movements towards the active speaker. Steering
movements were dependent on the phase of sound relative to the step cycle, and were
greatest for sounds occurring during the swing phase. During phonotaxis the slow
extensor tibiae motoneuron responded to ipsilateral sounds with a latency of 35-40ms,
while the fast flexor tibiae motoneurons were excited by contralateral sound. I
intracellularly recorded two tibial extensor and at least 8 flexor motoneurons. While
the fast extensor tibiae, the slow extensor tibiae and one fast flexor tibiae
motoneurons were individually identifiable, a group of at least 4 fast flexor tibiae as
well as at least 3 slow flexor tibiae motoneurons of highly similar morphology could
not be distinguished. Motoneurons received descending inputs from cephalic ganglia
and from local prothoracic networks. There was no overlap between the dendritic
fields of the tibial motoneurons and the auditory neuropil. They did not respond to
auditory stimulation at rest. Neither extracellular stimulation of descending pathways
nor pharmacological activation of prothoracic motor networks changed the auditory
responsiveness. Therefore any auditory input to tibial motoneurons is likely to be
indirect, possibly via the brain.
Chapter 2
14
INTRODUCTION
Female crickets (Gryllus bimaculatus) walk towards singing males. This requires the
female to recognise the species specific calling song and consequently steer towards
the singer. This behaviour has been studied in great detail at both behavioural and
neurobiological levels (e.g. Weber and Thorson 1989, Ball et al. 1989, Schildberger et
al. 1989, Pollack 2001). The auditory afferents transmit the auditory information from
the ears located in the front legs to a small number of auditory interneurons in the
prothoracic auditory neuropils. The auditory information is then passed on by few
ascending neurons to local and descending brain neurons which may form a pattern
recognition network (Schildberger 1984).
Little is known about the motor performance during phonotaxis, especially
upon changes in sound direction. Trackball recordings show that phonotactically
walking females turn towards attractive sounds with a delay of 55-60ms (Hedwig and
Poulet 2004, 2005). Pollack and Hoy (1980) reported a clear response of a flight
muscle to acoustic stimulation during phonotaxis in flying crickets (Teleogryllus
oceanicus). These responses may be achieved by a pattern recognition system
regulating the gain of a more direct auditory-to-motor loop to the steering motor
network (Poulet and Hedwig 2005). In phonotactically active animals it should
therefore be possible to observe specific motor outputs as a direct result of auditory
stimulation.
An effective method for steering during walking (Dürr and Ebeling 2005, Rosano and
Webb 2007) and jumping (Santer et al. 2005) in insects is to change the positioning of
the front legs. I therefore analysed the movement of a front leg tibia during
phonotaxis, and related this to the direction of the sound patterns presented. Using
electromyogram recordings I then analysed the activity of the tibial extensor and
flexor motoneurons during phonotaxis. Finally I intracellularly stained and identified
these motoneurons and investigated if any direct or indirect auditory input exists and
if it can be gated by descending interneurons or local pharmacological activation of
thoracic motor networks using pilocarpine.

Chapter 2
15
METHODS
Animals
Female crickets (Gryllus bimaculatus) with intact front legs were selected from the
colony kept at the Department of Zoology, University of Cambridge, maintained on a
12L:12D light cycle. Prior to dissection animals were cold anaesthetised at 4°C for
15mins. All experiments were performed during the day and at room temperature (21-
23ºC).
Trackball system
For walking experiments the crickets were supported on top of a trackball system by a
small metal pin waxed onto their back (Hedwig and Poulet, 2005). A 3g 56.5mm
diameter trackball made from Rohacell 31 (Roehm KG, Darmstadt, Germany) was
supported in a transparent acrylic half-sphere with 24 holes passing a constant air
supply. The movement of the trackball was detected by an optical 2D mouse sensor
(Agilent, Farnell Electronics, Oberhaching, Germany) aligned opposite its south pole.
The output of the sensor chip was processed with a quadratur to pulse converter.
Positive coding pulses indicated forward or left increments, and negative pulses
indicated movements to the back or right.
Optical measurements of leg movements
A custom build optoelectronic system was used to measure front leg movements
(Hedwig and Becher 1998, Hedwig 2000). A modified single-lens reflex (SLR)
camera with a 2D photodiode (United Detector Technology, PIN DLS-20) in the
plane of the film was was used to record the movements of a small piece of reflective
material (Scotchlite 7610, 3M Laboratories, Germany) fastened around the distal part
of the tibia using a small drop of beeswax. I recorded the frontal projection of left
tibial movements during walking; i.e. its left-right and up-down movements. This
required animals to walk towards the light source of the optical recording system,
which reduced the phonotactic performance, even when long wavelength (LED at
630nm) illumination was used (n=28).
For relating electromyogram (EMG) recordings to the step cycle the
forward/backward motion of the femur was recorded from above the animal and used

Chapter 2
16
as an indication of the swing and stance phase. Here a one-dimensional version of the
optoelectronic system (Laser Components, Olching, Germany; Type 1L30) was used
with infra-red illumination (LED at 850nm) (n=4).
Acoustic stimulation
Artificial calling song at a carrier frequency of 4.8kHz, syllable duration of 21ms,
syllable period of 42ms, chirp duration of 250ms and chirp period of 500ms was used
(Thorson et al. 1982). Crickets were presented with alternating 6 chirp sequences
from the left and the right at 75dB Sound Pressure Level (SPL) relative to 2x10⁻⁵
Pa.
Sound stimuli were digitally generated at 22.05kHz sampling rate (CoolEdit 2000;
Syntrillium, Phoenix, USA) and were presented by PC audio boards via two active
speakers (SRS A57; Sony, Tokyo, Japan) positioned 60cm frontal to the cricket each
at an angle of 45° to the animal’s longitudinal body axis. Sound intensities were
calibrated with an accuracy of 1dB at the position of the cricket using a Bruel and
Kjaer (Naerum, Denmark) free field microphone (Type 4191) and measuring
amplifier (Type 2610).
Electromyogram recordings
Electromyograms (EMG) of tibial extensor and flexor muscles were obtained using
two varnish coated steel wires (30μm diameter) inserted distally into the extensor tibia
muscle or proximally into the flexor tibiae muscles (Fig.2.4A). Large amplitude
extensor muscle potentials were recorded while at the same time activity in the flexor
muscles was reliably picked up at lower amplitude. This vice versa occurred in flexor
recordings (Fig.2.4B). In all further recordings I consequently used this cross talk to
identify flexor activity in extensor recordings, avoiding the need for separate flexor
recordings. Signals were picked up using an amplifier (A-M Systems, Differential AC
Amplifier Model 1700).
Intracellular recordings
Animals were pinned in a bed of plasticineTM
. After a dorsal incision of the thorax the
gut was removed and the prothoracic ganglion was exposed. The thoracic cavity was
filled with insect saline (140mM NaCl, 10mM KCl, 4mM CaCl2, 4mM NaHCO3,
6mM NaH2PO4). A small metal platform with an optic fibre embedded in it was
Chapter 2
17
placed underneath the ganglion. The optic fibre was used for bright field illumination
of the ganglion. The connectives towards the mesothoracic ganglion were cut.
Thick walled borosilicate micropipettes with resistances of 60-120 M filled
with 5% Lucifer Yellow (Molecular Probes, Eugene, Oregon) in water (tip) and 1M
LiCl (shaft) were used to record from the main neurites of motoneurons. Recordings
lasted for up to 1 hr. For intracellular staining with Lucifer Yellow a 1-9nA
hyperpolarising current was injected for 5-20mins. Signals were recorded using an
SEC-10L amplifier (NPI, Tamm, Germany) and digitised at 10kHz. Motoneurons
were characterised and identified according to morphology, the impact of spiking on
tibial movement and the size of evoked EMG potentials. A total of ~250 crickets were
used, of which 93 yielded the presented data.
Sensory stimulation during intracellular recordings
Auditory: Sound stimuli were presented using a small speaker (ø=2cm) attached to
the wide end of a 15cm conical copper-tube, the narrow end of which was placed 2cm
from the opening of the ipsilateral auditory spiracle. Intensities of stimuli were
calibrated to an accuracy of 0.5dB SPL at the position of the spiracle. The carrier
frequency of sound stimuli was 4.8kHz, and the amplitude used throughout was 90dB
SPL. Background noise in the room was <45dB SPL.
Air currents: Stimuli were generated using a Picopump (PV 820 Pneumatic
PicoPump) connected to a rubber tube (inner diameter: 0.5mm), the other end of
which was positioned 5cm in front of the animal.
Tactile: Stimuli were applied manually using a small paintbrush. In all recordings the
tibia and tarsus were gently touched at several positions, and the largest response
recorded.
Visual: Stimuli were generated using a white LED (Nichia 1100mcd, 50° divergent
angle) positioned at a distance of 3cm from the head of the animal pointing at the eye
ipsilateral to the front leg investigated.
Activation of descending pathways
A small bipolar hook electrode was placed underneath the connective ipsilateral to the
recorded motoneuron between the prothoracic and subesophageal ganglia and
insulated with a mixture of 90% VaselineTM
and 10% paraffin. Stimuli were generated

Chapter 2
18
using a stimulus isolation unit (WPI A360 SIU), triggered by a custom built pulse
generator. Current pulses were of 2ms duration and between 1-50μA amplitude,
applied at 1-100Hz (n=19).
Pharmacological stimulation
To disinhibit or activate thoracic motor networks the ganglion was bathed in the
GABA blocker picrotoxin (10-4
M in saline) or the muscarinic receptor agonist
pilocarpine (10-3
M in saline), respectively (Ryckebusch and Laurent 1993). This
elicited increased motor activity after 20-30s which persisted until the entire thoracic
cavity was washed with saline. To ensure all activity recorded was generated within
the prothoracic ganglion the connectives towards the subesophageal ganglion were cut
in n=3/23 experiments.
Processing of neurons stained with Lucifer Yellow
After intracellular staining of a motoneuron it was left for 5-20mins to allow the dye
to diffuse throughout the cell. The ganglion was then dissected and placed in 4%
formaldehyde for 1h. Specimen were dehydrated and cleared in methyl-Salicate. The
ganglion was photographed using a digital SLR camera (Canon EOS 350D) attached
to a Zeiss (Axiophot) fluorescent microscope with a UV-light source (Zeiss VHW
50f-2b). For graphical projections of neural arborisations photo-stacks were traced
manually using Adobe Photoshop (CS 8.00).
Data sampling and analysis
An A/D board (MIO 16E4, National Instruments, Austin, Texas) linked to custom
built software running under LabView 5.01 (National Instuments) was used in all
experiments. Behavioural and electrophysiological data was analysed in Neurolab
(Hedwig and Knepper 1992). Further data analysis was performed using MatLab 6.5
(Mathworks, Natick, MA).

Chapter 2
19
RESULTS
Front leg movements during phonotaxis
Animals walking on the trackball responded to sequences of 6 chirps alternating from
the left and the right with steering towards the active speaker (Fig.2.1A,top). The
optoelectronic system picked up the up-down and left-right movements of the left
front leg. Up-down movements revealed the stepping cycle, with rapid movements
indicating swing phase, and slower movements indicating stance. Small amplitude
oscillations in the trackball recording also reflected the step pattern. Up-down leg
movements were unaffected by the sound direction. In contrast, the pattern of the left-
right movements changed with the direction of acoustic stimulation
(Fig.2.1A,bottom). When steering towards the ipsilateral (left) speaker left-right
movements were small and corresponded to left-right movements during straight
ahead walking. When animals steered towards the contralateral (right) speaker left-
right leg movements were clearly larger, extending to the right towards the direction
of acoustic stimulation. These movement patterns were remarkably constant during
steering to either side, but upon a change in direction of acoustic stimulation leg
movement patterns were switched within a single step cycle (Fig.2.1A,B). To better
illustrate the rapid effect of change in sound direction on left-right leg movements the
predicted movement pattern (red) is superimposed on the leg movement trace during a
turn as indicated (Fig.2.1B). After less than 60ms after ipsilateral sound presentation
the recorded movement trace deviates from the expected movement. From the up-
down and left-right leg movement components I obtained 2D projections of the
average movement pattern of the front leg at the position of the reflective disk
(Fig.2.1C). This revealed that during steering to the contralateral, but not during
steering to the ipsilateral side the leg reached in front of the head during swing phase
in order to pull the animal towards the stimulated side during the following stance.
A third of animals showed large left-right leg movements also towards
ipsilateral (left) sounds. Here the tibia moved away from the body during swing phase
and towards the body during stance (Fig.2.2). Furthermore in less than 10% of cases
turning disturbed the step rhythm (Fig.2.2A, asterisk).
It may be advantageous for phonotactic steering to synchronise the stepping
cycle with the rhythm of incoming chirps (Hedwig and Poulet 2004). Step cycle

Chapter 2
20
durations ranged between 250ms and 600ms (21-23ºC). Fig.2.3A shows the
distribution of step cycle durations for one representative animal. I tested animals
with chirp rates between 1 and 5Hz. There was no coupling between the step rhythm
and the chirp rhythm at any repetition rate tested when the sound direction was
constant (Fig.2.3B). I furthermore tested if there is a phase dependent effect of
incoming sounds on the leg movements using a double pulse paradigm, where the first
and last two syllables of each chirp were presented from contralateral, and the middle
two syllables from ipsilateral (Fig.2.3C, inset). The ipsilateral double pulses were
sorted into 20 bins depending on their phase relative to the step cycle. The leg
movement traces were then averaged within each bin, centred at the peak of swing
phase (t=0ms). Leg movement traces from 4 representative phase relations between
ipsilateral sounds presentation and the step cycle are shown (Fig.2.3C). Ipsilateral
acoustic stimulation during swing phase, but not during stance, reduced the amplitude
of the left-right leg movement during the following step (red, asterisk).
At least movements in three joints can contribute to the measured movements of the
front leg. However, due to the nature of our recording method I cannot directly
identify the separate contributions of coxal rotations, tibial extension and flexion
movements or overall bending movements of the body to the observed front leg
movement patterns (see Discussion). Nonetheless our measurements indicated the
importance in particular of tibial extension and flexion movements in steering. The
strong dependency of the front leg left-right movement pattern on sound direction are
likely the result of rotations around the femoral tibial joint. I therefore proceeded to
record from front tibial muscles during auditory steering.
Tibial Musculature
To investigate the control of tibial movements I identified the tibial musculature and
its innervation. Nomenclature was based on the description of the hind leg
musculature in locust (Snodgrass 1929). A single tibial extensor muscle (dorsal: 135)
and 4 tibial flexor muscle bundles (1 antero-ventral, 2 ventral, 1 postero-ventral:
136a-d) were identified (Fig.2.4A). The proximal ends of flexors 136a and 136d
attached to multiple points along the anterior and posterior cuticle respectively. A
single retractor unguis (139) was positioned antero-dorsal to the acoustic trachea.

Chapter 2
21
EMG recordings during phonotaxis
Extracellular recordings from tibial muscles were used to monitor tibial motoneuron
activity. A pair of EMG wire electrodes was placed dorso-distally into the extensor,
while a second pair was placed ventro-proximally into the flexor, as indicated in
Fig.2.4A. Despite maximal spatial separation, electrical crosstalk between the pairs of
extensor and flexor electrodes occurred. Large muscle potentials recorded in one set
of electrodes were always mirrored by small muscle potentials recorded by the other
pair (Fig.2.4B). This allowed us to record both extensor and flexor activity using only
one pair of electrodes.
We recorded the extensor muscle activity during walking and simultaneously
measured forward-backward movements of the femur to monitor the step cycle.
Amplitude-sorting of EMG potentials allowed us to separate at least 4 different motor
units contributing to tibial movements during walking. These were characterised by
their typical activity during walking. The description of EMG activity presented in
this paragraph relates to motor units. An intracellular identification of the associated
motoneurons is presented below. Fig.2.4C shows the average spike occurrence of
each motor unit during the step cycle. Fast Extensor Tibiae (FETi) activity was
present in less than 1 out of 20 steps and occurred just prior or during early swing
phase. This motor unit only showed increased activity (1-2 spikes per step) during
escape running elicited by wind stimulation of the cerci. Slow Extensor Tibiae (SETi)
activity also occurred just prior and during early swing phase. Fast Flexor Tibiae
(FFTi) potentials occurred during late swing and early stance phase. Finally Slow
Flexor Tibiae (SFTi) activity was high throughout the step cycle, but reduced just
prior and during early swing phase.
We then analysed the effect of acoustic stimulation on the spike activity of the
tibial extensor and flexor motor units during phonotactic steering (Fig.2.5). In single
trial recordings motor unit activity in the step rhythm was dominant and masked any
effects of acoustic stimulation (Fig.2.5A). I therefore averaged the discharge rate of
motor units relative to the sound, thereby discarding the effect of the step rhythm
(Fig.2.5B). This revealed clear modulations of SETi and FFTi motor activity in
response to acoustic stimulation: each chirp presented from ipsilateral (blue) gave rise
to a distinct increase in SETi activity, while each contralateral chirp (red) increased
FFTi activity. SETi and FFTi only responded to acoustic stimulation during
phonotaxis and not in standing or non-acoustically orienting animals, indicating a

Chapter 2
22
clear phonotaxis dependent steering response. SFTi and FETi were unaffected by the
sounds. To investigate the delay between sound presentation and evoked spike
activity in SETi I presented animals with the double pulse paradigm (Fig.2.6). The
trackball recording revealed clear lateral steering movements towards the active
speaker with a delay of 55-60ms, consistent with previous findings (Hedwig and
Poulet 2004). Increases in SETi activity always preceded changes in the trackball
movements, and reliably increased with a delay of 35-40ms after ipsilateral sound
presentation.
Recordings of front leg movement patterns and analysis of tibial EMG activity
during auditory steering therefore clearly highlight the importance of tibial motor
control in mediating phonotactic behaviour.
Identification of tibial motoneurons
To identify the motoneurons underlying activity in tibial muscles during phonotactic
walking, I intracellularly recorded and identified the front leg tibial motoneurons and
revealed their morphology and synaptic inputs. Identification criteria included the
effect of depolarisation on tibial movement, the amplitude of the elicited EMG signal
and their morphology.
Two extensor tibiae motoneurons, the FETi and the SETi (Fig.2.7A), were
individually identified. Each spike of the FETi elicited a >10mV EMG potential and
gave rise to a rapid tibial extension. In contrast, SETi spikes gave rise to 3-5mV EMG
potentials and resulted in slower, graded extension movements, dependent on spike
rate. One fast flexor motoneuron (FFTi) was also individually identified (Fig.2.7B
left). In addition a group of at least 4 FFTi motoneurons was morphologically distinct
from the latter FFTi (Fig.2.7B right) and a group of at least 3 SFTi motoneurons
(Fig.2.7C) were distinguished. The minimal number given for these groups of FFTi
and SFTi are derived from sequential stainings of the respective neuron type in the
same specimen. The individually identifiable FFTi was labelled FFTi1 while the
morphologically distinct group of 4 FFTi was labelled FFTi2-5 (Fig.2.7B). Spike
activity in either type of FFTi gave rise to 2-3mV EMG potentials and resulted in
graded flexion movements of the tibia. SFTi spikes elicited the smallest (1mV) EMG
potentials, and alone were insufficient to move the tibia.
Both FETi and SETi EMG potentials recorded during phonotaxis could be
clearly attributed to their corresponding individually identified motoneurons. FFTi

Chapter 2
23
EMG potentials may be the result of either FFTi1 or FFTi2-5 motoneuron activity.
SFTi EMG activity was attributed to the group of SFTi1-3 motoneurons. The label of
a “fast” motoneuron was attributed to motoneurons where a single spike resulted in
movement, while in a “slow” motoneuron only burst activity resulted in movement.
Morphology of tibial motoneurons
Somata of all motoneurons were located antero-ventrally with the somata of SETi,
FETi and the group of FFTi2-5 typically adjoining the antero-most border of the
ganglion, while somata of the group of SFTi1-3 and that of FFTi1 were located
further posterior. The most prominent neurite of all motoneurons ran 150-200μm
beneath the dorsal surface of the ganglion between the midline and the point where
the axon left the ganglion through the respective side nerve. A second large neurite
ran posteriorly in all motoneurons except for FFTi1, where it ran antero-medially. All
motoneurons exit the ganglion via nerve 5, with exception of the FETi which exits via
nerve 3 (Fig.2.7A left).
The dendrites of both FETi and SETi extended throughout the entire ipsilateral
dorsal surface of the ganglion, with extensive medial branching (Fig.2.7A). The main
processes and the posterior dendrite of SETi were thicker than those of FETi. The
main processes of FFTi1 were very large (Ø=20-30μm), and almost reached the
midline with a prominent diameter. The main branches gave off very short secondary
neurites (Fig.2.7B left). In contrast the main neurites of FFTi2-5 (Fig.2.7B right) were
much thinner (Ø=5μm) than of any other tibial motoneuron, with secondary and
tertiary branching patterns similar to the extensor motoneurons, yet were very sparse.
The morphology of the main neurites of SFTi1-3 varied substantially and only one
example is given (Fig.2.7C). The extent of the branching patterns of their secondary
and tertiary neurites was similar to SETi. None of the motoneurons exhibited any
overlap with the ventrally located auditory neuropil (Schildberger et al. 1989,
Imaizumi and Pollack 2005).
Sensory and central inputs to tibial motoneurons
Sensory inputs to tibial motoneurons were investigated during rest and activity. SETi,
FETi and FFTi2-5 did not spike at rest. In contrast SFTi1-3 and FFTi1 were active
with a spike rate between 0.5-2Hz and generated frequent EPSPs and IPSPs in resting
animals (Fig.2.8A). I did not detect any auditory or visual inputs in this state.
Chapter 2
24
However all neurons received both wind and tactile inputs (Fig.2.8B). Only tactile
inputs to SFTi1-3 could elicit spikes.
Thoracic motoneurons frequently receive inputs from descending interneurons
of the brain (Burrows 1996c). Previous studies suggested that the brain may be
involved in auditory pattern recognition (Schildberger 1984): successful recognition
of species specific song may lead to phonotactic steering by a descending pathway
acting on the thoracic motor system (Pollack and Hoy 1980, Poulet and Hedwig
2005). To reveal any descending control over tibial motoneuron activity I
extracellularly stimulated the ipsilateral connective between the prothoracic and the
subesophageal ganglia. This allowed to elicit compound EPSPs and spikes in all tibial
motoneurons (Fig.2.8C). Compound EPSPs occurred with a delay of <3ms and were
dependent on the amplitude of the stimulation current, indicative of a direct, parallel
polyneural input from descending pathways.
During walking leg motoneurons are under control of local central pattern generating
networks (Burrows 1996b, Büschges et al. 2008). I therefore tested for local
prothoracic inputs to tibial motoneurons. Prothoracic motor networks were
pharmacologically activated by the muscarinic receptor agonist pilocarpine (10-3
M) or
the GABA-antagonist picrotoxin (10-4
M) (Ryckebusch and Laurent 1993, Büschges et
al. 1995). In all motoneurons both picrotoxin and pilocarpine elicited powerful motor
bursts that exceeded spike threshold. However bursts were irregular and occurred at
lower frequency (0.1-1Hz) than during walking (2-3Hz) (Fig.2.8D) and therefore did
not directly relate to “fictive walking” (Ryckebusch and Laurent 1993, Büschges et al.
1995). Nonetheless this experiment demonstrated inputs to all tibial motoneurons
from prothoracic motor networks.
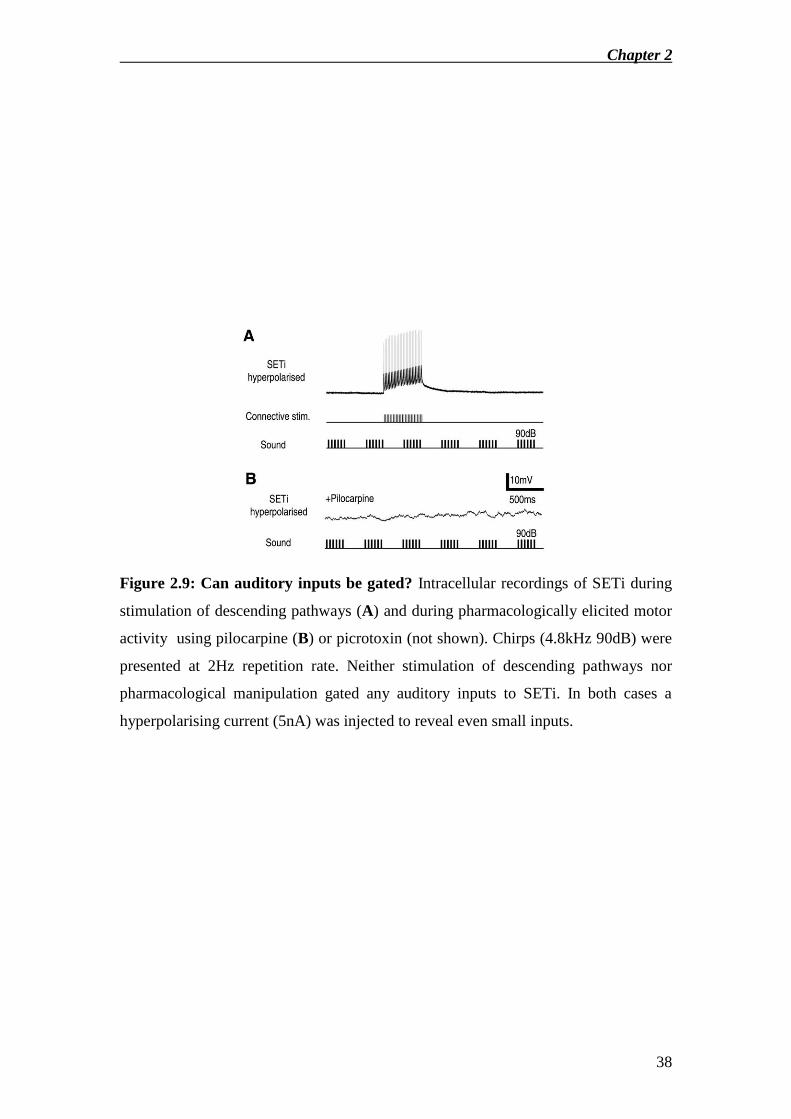
Can auditory inputs be gated?
Our data from EMG recordings during phonotaxis demonstrate an auditory input to
SETi and to at least one of the two groups of FFTi motoneurons. However I did not
detect any auditory inputs to these motoneurons at rest. Poulet and Hedwig (2005)
suggested a descending modulatory pathway, that may gate auditory inputs towards
the motor system in phonotactically active animals. It may therefore be possible to
unmask auditory inputs to SETi or either class of FFTi by stimulating descending
pathways. A strong hyperpolarising current (5nA) was injected into SETi to both
prevent spiking and to reveal potentially weak auditory inputs during and after

Chapter 2
25
stimulation of the connectives. However, neither single trial nor continuous activation
of descending pathways up-regulated any putative auditory inputs to any of the tibial
motoneurons (Fig.2.9A). Furthermore no auditory responses were apparent during
pharmacologically elicited motor activity (Fig.2.9B). The trace presented is a section
between ongoing motor activity and was chosen as it lacks motor burst activity that
could obscure any auditory inputs.
DISCUSSION
It was the aim of this study to investigate the role of front leg movements during
phonotactic steering in crickets. I furthermore aimed to identify the underlying
neuronal control over tibial movements at the level of the tibial muscles, the tibial
motoneurons and the sensory and central control over these motoneurons. I also set
out to identify or unmask any auditory inputs towards the motor system, as required
for phonotactic steering.
Front leg movements during phonotaxis
We studied front leg movements during phonotaxis in order to identify the motor
pathway involved in phonotactic steering. During forward walking left-right front leg
movements were remarkably small, but during steering leg movements showed a clear
dependency on sound direction (Figs.2.1, 2.2). Throughout stimulation from either
left or right steering movements were unchanged (Figs.2.1A, 2.2A), however in
response to a change in sound direction animals switched the steering pattern within a
single step cycle, and frequently after less than ~60ms (Figs.2.1B, 2.2A). This
remarkably fast response is in agreement with rapid steering movements of 55-60ms
measured with a trackball system (Hedwig and Poulet 2004, 2005) and indicates the
importance of the front legs in steering.
There are three possible, non-exclusive modes of steering using the front legs:
(1) changing the femoral/tibial angle (Dürr and Ebeling 2005), (2) changing the
positioning of the femur (Laurent and Richard 1986a,b, Dürr and Ebeling 2005), and
(3) overall bending movements of the prothoracic segment passively moving the front
legs into a steering position: unlike in many species of grasshoppers or phasmids, the
prothoracic segment of cricket is not rigidly connected to the mesothorax and could

Chapter 2
26
be used in steering. While effects due to positioning of the femur and bending of the
prothoracic segment are superimposed on the tibial movements due to the nature of
our recording technique, I judge these effects as less significant: during visual
inspection of front leg steering movements tibial extension and flexion movements
could clearly be identified. Detailed analysis of leg positioning using high speed video
analysis did clearly demonstrate the contribution of tibial extension and flexion
movements in steering (Witney and Hedwig, personal communication).
Movement in the femoral-tibial joint provides a powerful way to affect the
movement direction of the animal: increased tibial extensions shift the anterior end
point (AEP) towards a more extreme position along the axis of the femur and
therefore allow consequent tibial flexion to pull the animal towards that point. For
tibial movements to allow for steering, the overall step cycle must be taken into
account: while an extension during swing phase will shift the AEP forwards, an
activation of extensor motoneurons during stance will push the animal away from the
AEP, resulting in a sideways or even backwards movement of the cricket. Similarly
flexion during swing phase would decrease the step size and therefore limit the
steering, while flexion during stance would pull the animal forwards, towards the
AEP. Again, high speed video recordings will be necessary to clarify the details of
sound induced leg steering movements (Witney and Hedwig, personal
communication).
During acoustic stimulation animals did not couple their overall step-rhythm
to the chirp rhythm (Fig.2.3B). This is in contrast to locust flight pattern generators
which are under pivotal control of rhythmic wind inputs to synchronise wing beats
between animals (e.g. Camhi et el. 1995). The absence of coupling between sounds
and the step cycle in crickets indicated that here steering commands are probably
integrated with the walking central pattern generator (CPG). They do not modify the
overall stepping pattern, but instead modulate the amplitude of steering responses.
The phase dependency of motor effects caused by sounds during swing phase
supports this.
Anatomy and morphology
The muscles of the front leg tibia and their innervation patterns showed several
parallels to that of the locust front leg (Hoyle 1955a,b), stick insect middle leg
(Bässler 1993) and the cricket middle leg (Nishino 2003). The single large extensor

Chapter 2
27
muscle was driven by two excitatory extensor motoneurons, a FETi and a SETi.
These corresponded to tibial extensor motoneurons in locust front and hind legs,
cricket hind legs and stick insect middle legs. The flexor system was more complex,
but acted as a single functional unit due to a common distal attachment point. At least
8 excitatory flexor motoneurons exit. The cricket hind leg tibia is innervated by at
least 19, the locust hind leg by 9 and the stick insect by 14 excitatory flexor
motoneurons. All motoneurons identified, except for the FETi which projected its
axon through nerve III, projected their axons through nerve V. This corresponds to the
arrangement of the front tibial motoneurons in locusts (Burrows 1996a).
EMG recordings
We investigated the role of the tibial extensor motoneurons and flexor motor units in
walking and phonotactic steering. During walking tibial extensions were carried
almost entirely by SETi. In contrast SFTi was tonically active throughout stance
phase but reduced activity during swing (Fig.2.4C). Flexion was also strongly driven
by FFTi activity, which peaked at the beginning of stance phase. I did not attempt to
identify any common inhibitor motoneurons or dorsal unpaired median cells
innervating tibial muscles. In particular the low activity of the tibial extensors is in
clear contrast to similar studies performed on locust legs (Burns and Usherwood
1979) and cockroach hind legs (Krauthamer and Fourtner 1978) where at high
stepping rates SETi is tonically active and bursts of FETi activity support the step
rhythm. Due to its very low spike rate during phonotactic walking FETi is unlikely to
contribute to steering under normal circumstances. It remains open whether FETi
supports steering at very high stepping rates. However the low SETi activity during
walking in G. bimaculatus leaves room for its recruitment during steering: SETi
responded to ipsilateral acoustic stimulation during phonotaxis. EMG recordings also
demonstrate an auditory input to at least one type of FFTi motoneurons (Fig.2.5). It is
unclear which, if not both types of FFTi motoneurons underlie these auditory
responses during phonotaxis. Previously Pollack and Hoy (1980) demonstrated
activity in dorsal longtitudinal muscles in response to individual sound pulses in
flying crickets (Teleogryllus oceanicus). These inputs result in bending of the
abdomen towards the direction of the sound during flight. It is unclear whether these
inputs are gated by a pattern recognition system, and to what extent abdominal
movements contribute to auditory steering during walking. While these findings

Chapter 2
28
emphasise the likely involvement of multiple motor systems of the body other than
tibial extension and flexion movements in supporting cricket phonotaxis behaviour,
our behavioural experiments highlight both the SETi and either FFTi1 or FFTi2-5 as
key output neurons for phonotactic steering during walking.
Auditory control over tibial motoneurons
As demonstrated in EMG recordings tibial motoneurons integrate auditory inputs with
activity from walking pattern generating networks during phonotactic steering.
However intracellular recordings revealed no auditory inputs to any motoneuron
identified at rest or during pharmacologically elicited motor activity. Furthermore
motoneurons were located dorsally and did not extend any neurites towards the
ventrally located auditory neuropils (Schildberger et al. 1989). The auditory input to
motoneurons therefore has to be indirect, leaving two options: (1) it may be entirely
local, via interneurons in the prothoracic ganglion or (2) it may reach motoneurons via
the brain. In this respect the timing is crucial: increased spike rate in SETi in response
to acoustic stimulation during EMG recordings occurred after 35-40ms. Subtracting
4ms to allow for spikes to be generated and propagated towards the muscles (Fig.2.7)
this leaves 31-36ms for the synaptic input to be evoked in the motoneurons following
acoustic stimulation. First order prothoracic auditory interneurons such as the Omega
Neuron-1 (ON1) or Ascending Neuron-1 (AN1) respond to acoustic stimulation with
a latency of 15-17ms (Wohlers and Huber 1978). This leaves 14-21ms for the
information to reach motoneurons from 1st order auditory interneurons via either a
thoracic or a cephalic pathway. This delay is rather long for an entirely prothoracic
pathway, but it also leaves only little time for a loop via the brain: AN1 activity in the
brain occurs with a latency of 20-22ms after sound presentation (Schildberger 1984,
Zorović, personal communication), implying a propagation time of auditory signals
between the prothoracic ganglion and the brain of ~5ms. Two way propagation to and
from the brain therefore costs a total ~10ms leaving 4-11ms for local processing in the
brain. In support of a cephalic pathway, extracellular stimulation of descending
pathways clearly indicated a direct, parallel polyneural descending input to tibial
motoneurons. The physiological relevance of the extracellularly evoked synchronous
spike activity in several descending axons remains unclear. In addition several
multimodal descending brain neurons respond to auditory stimuli and are known to
terminate dorsally in all thoracic ganglia (Staudacher 2001). These respond with

Chapter 2
29
latencies between 25-47ms at the level of the connectives between the subesophageal
and prothoracic ganglia, and may therefore be candidate neurons for a descending
auditory control of front tibial motoneurons. An entirely prothoracic auditory loop
towards the motoneurons would require descending gating control (Pollack and Hoy
1980, Poulet and Hedwig 2005) to enable the pathway only during steering. However
stimulation of descending interneurons did not unmask any auditory inputs to the
motoneurons. Furthermore, despite decades of research, no prothoracic auditory
interneurons have been identified that project from the ventral auditory neuropils
towards the dorsal motoneurons. Instead the gating mechanism may exist in the brain,
with a descending pathway mediating the steering responses. Most of AN1s
presynaptic terminals project antero-ventrally in the brain, laterally of the α-lobes
(Schildberger 1984), however most descending brain neurons extend their dendritic
fields in the ventral posterior deutocerebrum (Staudacher 1998). I therefore anticipate
a cephalic auditory loop to require at least 2 synapses within the brain, involving local
brain neurons forwarding the auditory information from AN1 towards descending
pathways.
Future experiments will aim at a more comprehensive understanding of auditory
processing in the brain. The identification of the descending pathways to the SETi and
FFTi motoneurons as well as the postsynaptic targets of AN1 will be critical.
Furthermore the identification of the mechanism underlying the putative gating of the
auditory-to-motor pathway during phonotaxis is a central question.
Chapter 2
30
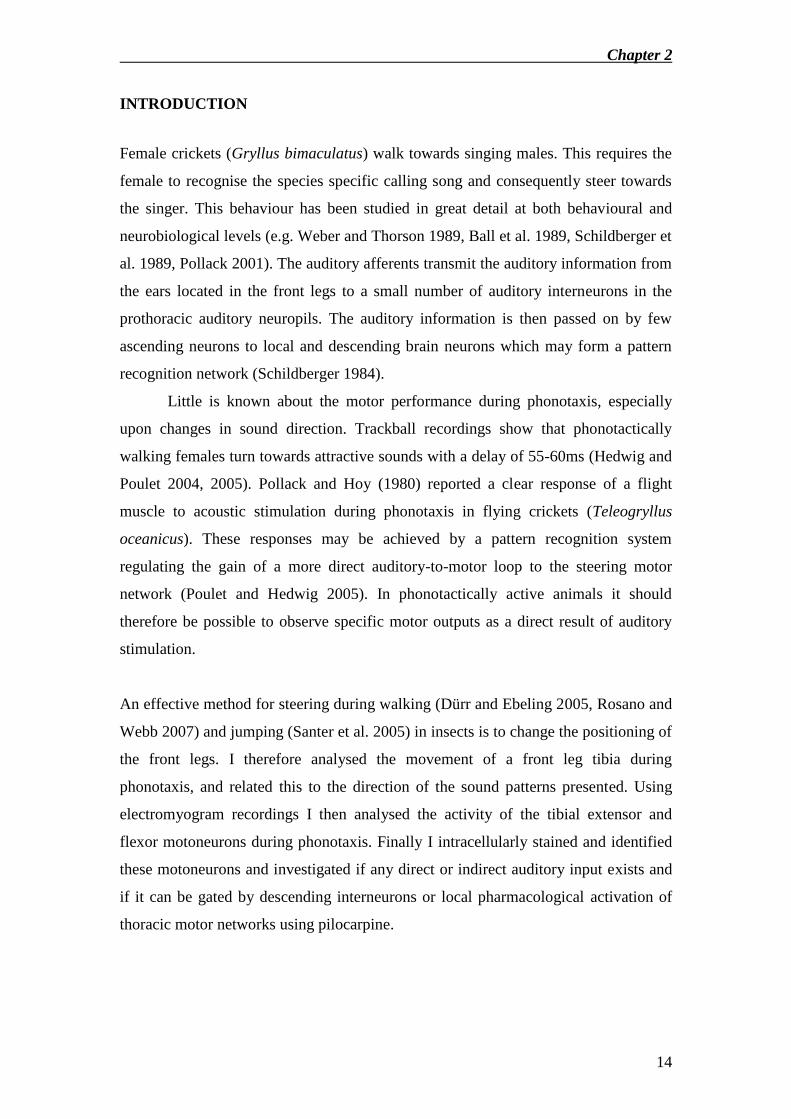
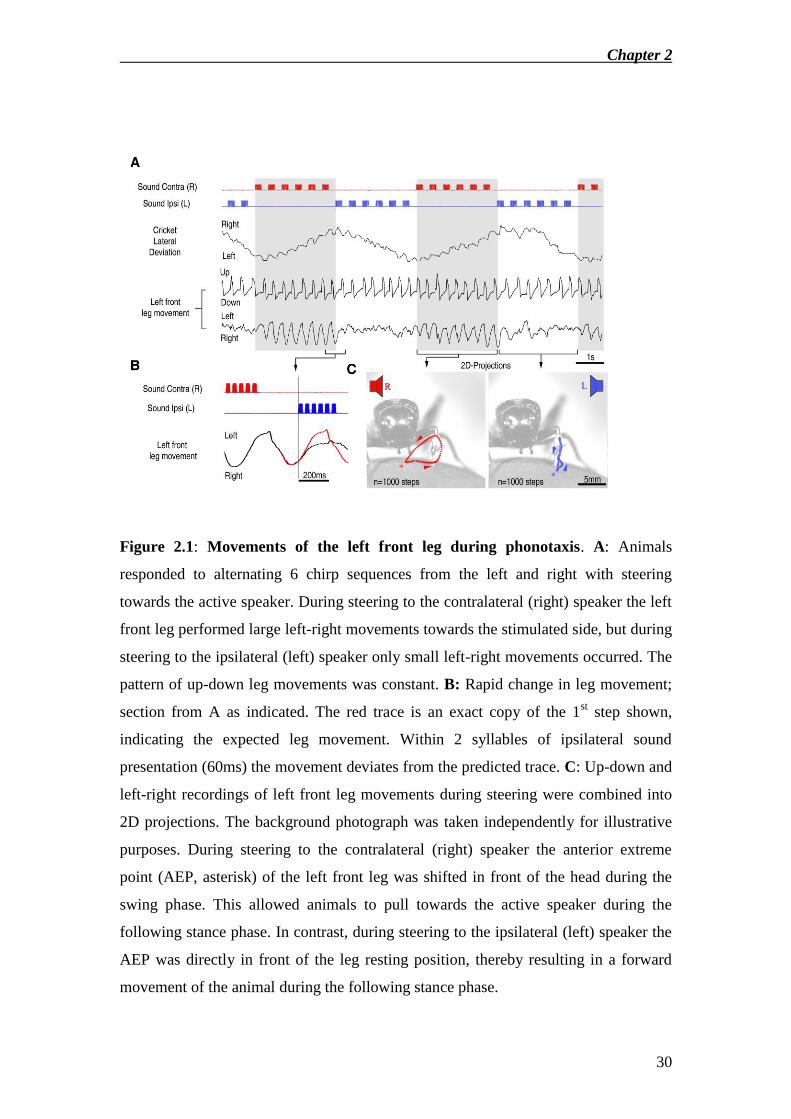
Figure 2.1: Movements of the left front leg during phonotaxis. A: Animals
responded to alternating 6 chirp sequences from the left and right with steering
towards the active speaker. During steering to the contralateral (right) speaker the left
front leg performed large left-right movements towards the stimulated side, but during
steering to the ipsilateral (left) speaker only small left-right movements occurred. The
pattern of up-down leg movements was constant. B: Rapid change in leg movement;
section from A as indicated. The red trace is an exact copy of the 1st step shown,
indicating the expected leg movement. Within 2 syllables of ipsilateral sound
presentation (60ms) the movement deviates from the predicted trace. C: Up-down and
left-right recordings of left front leg movements during steering were combined into
2D projections. The background photograph was taken independently for illustrative
purposes. During steering to the contralateral (right) speaker the anterior extreme
point (AEP, asterisk) of the left front leg was shifted in front of the head during the
swing phase. This allowed animals to pull towards the active speaker during the
following stance phase. In contrast, during steering to the ipsilateral (left) speaker the
AEP was directly in front of the leg resting position, thereby resulting in a forward
movement of the animal during the following stance phase.
Chapter 2
31
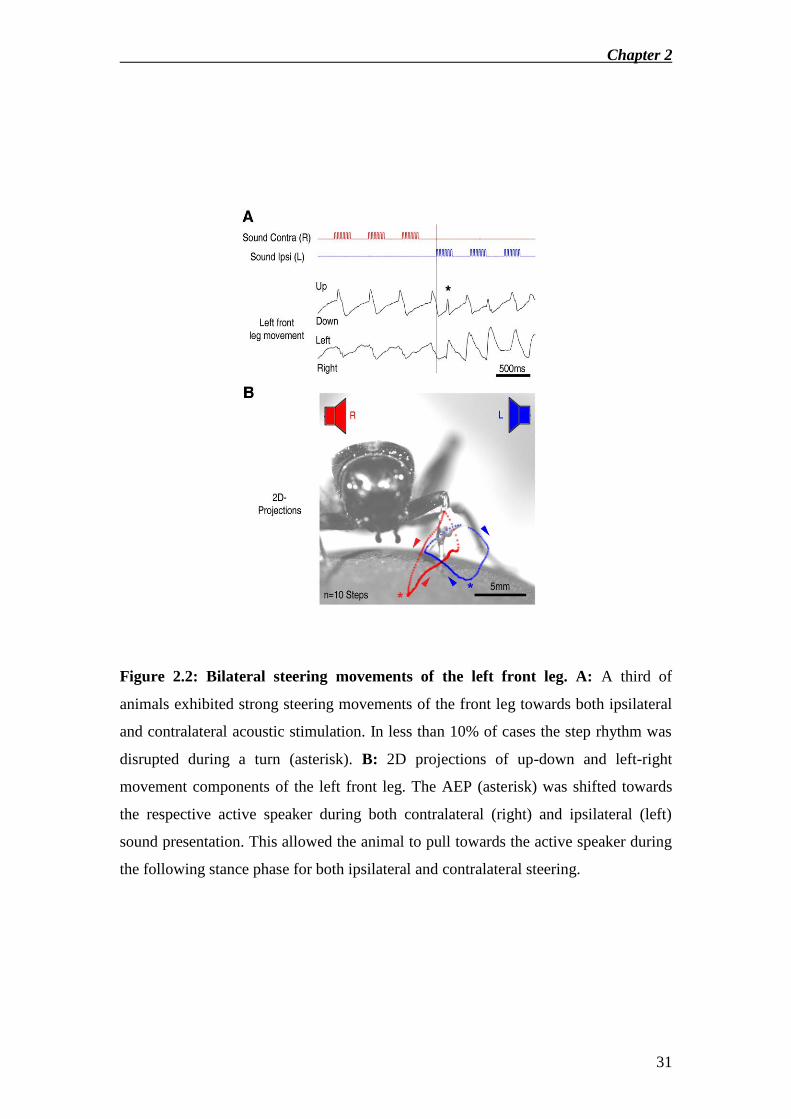
Figure 2.2: Bilateral steering movements of the left front leg. A: A third of
animals exhibited strong steering movements of the front leg towards both ipsilateral
and contralateral acoustic stimulation. In less than 10% of cases the step rhythm was
disrupted during a turn (asterisk). B: 2D projections of up-down and left-right
movement components of the left front leg. The AEP (asterisk) was shifted towards
the respective active speaker during both contralateral (right) and ipsilateral (left)
sound presentation. This allowed the animal to pull towards the active speaker during
the following stance phase for both ipsilateral and contralateral steering.
Chapter 2
32
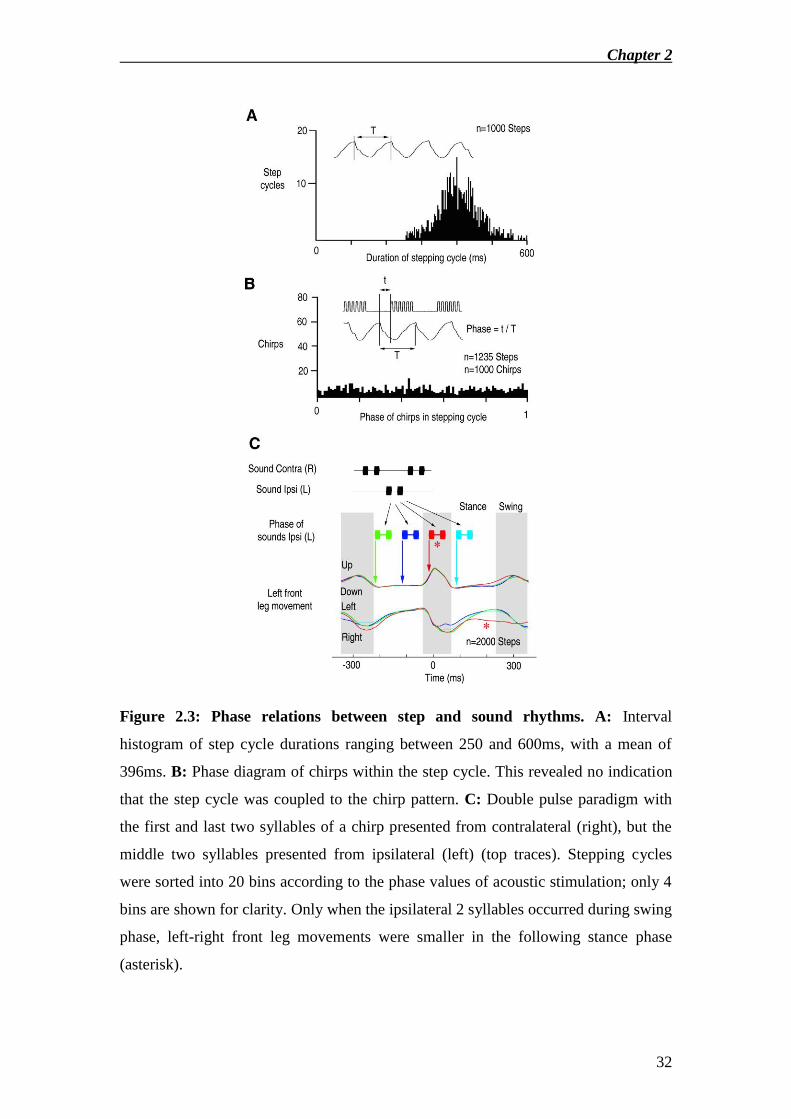
Figure 2.3: Phase relations between step and sound rhythms. A: Interval
histogram of step cycle durations ranging between 250 and 600ms, with a mean of
396ms. B: Phase diagram of chirps within the step cycle. This revealed no indication
that the step cycle was coupled to the chirp pattern. C: Double pulse paradigm with
the first and last two syllables of a chirp presented from contralateral (right), but the
middle two syllables presented from ipsilateral (left) (top traces). Stepping cycles
were sorted into 20 bins according to the phase values of acoustic stimulation; only 4
bins are shown for clarity. Only when the ipsilateral 2 syllables occurred during swing
phase, left-right front leg movements were smaller in the following stance phase
(asterisk).

Chapter 2
33
Figure 2.4: Tibial muscles and
EMG recordings during walking.
A: A single tibia extensor muscle
(red, 135) extended dorsally
throughout the entire length of the
femur. 4 tibia flexor muscle bundles
(green, 136a-d) were located
ventrally. A retractor unguis (pink,
139) ran anteriorly along the acoustic
trachea. B: Simultaneous tibial
extensor and tibial flexor EMG
recordings were taken at positions as
indicated in (A). Large amplitude
muscle potentials recorded in the
extensor were directly related to
small amplitude muscle potentials
measured in the flexor, and vice
versa. C: EMG recordings were
obtained during walking, with
simultaneous recordings of forward-
backward movements of the femur as
an indication of the step cycle. Peaks
of the EMGs were sorted according
to amplitudes:
FETi>SETi>FFTi>SFTi. The
occurrence of motor unit activity
within each step was normalised to
the mean duration of steps (390ms).
Chapter 2
34
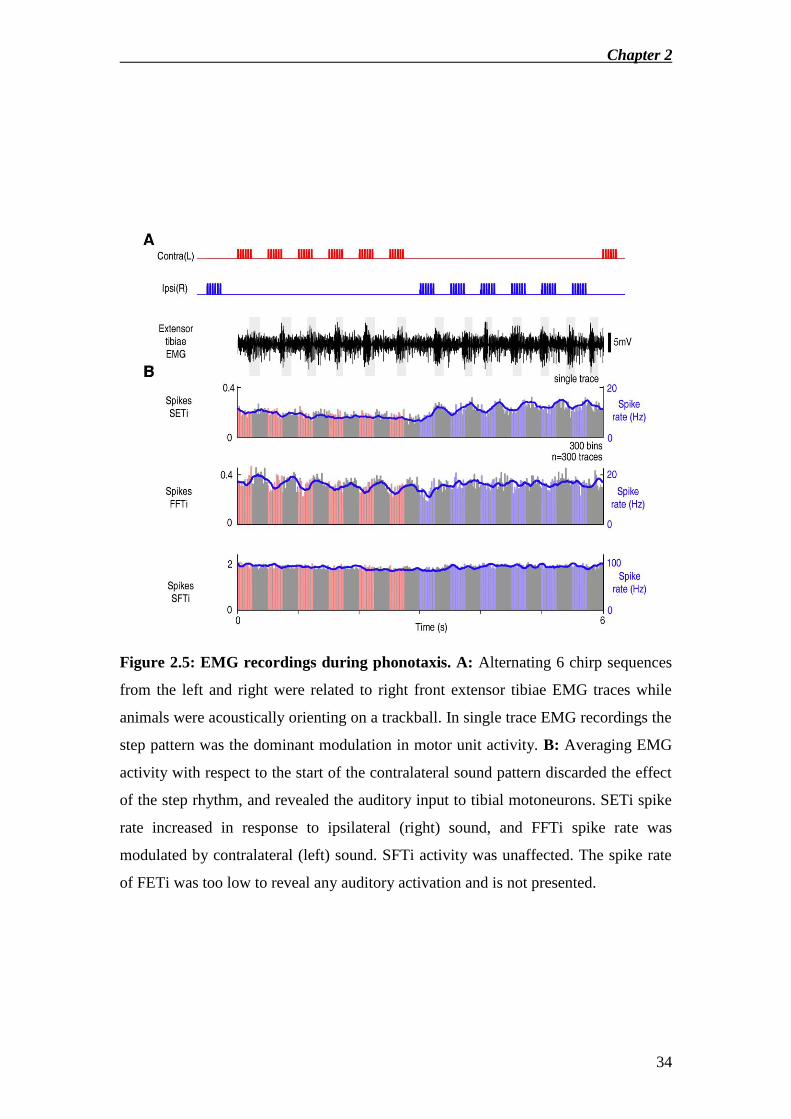
Figure 2.5: EMG recordings during phonotaxis. A: Alternating 6 chirp sequences
from the left and right were related to right front extensor tibiae EMG traces while
animals were acoustically orienting on a trackball. In single trace EMG recordings the
step pattern was the dominant modulation in motor unit activity. B: Averaging EMG
activity with respect to the start of the contralateral sound pattern discarded the effect
of the step rhythm, and revealed the auditory input to tibial motoneurons. SETi spike
rate increased in response to ipsilateral (right) sound, and FFTi spike rate was
modulated by contralateral (left) sound. SFTi activity was unaffected. The spike rate
of FETi was too low to reveal any auditory activation and is not presented.

Chapter 2
35
Figure 2.6: Timing of auditory inputs to SETi. A,B: Animals acoustically orienting
on the trackball were presented with the double pulse paradigm. The trackball
recording revealed steering towards the stimulated side with a delay of 55-60ms.
Simultaneously recorded EMG traces reveal a reliable increase in SETi activity with a
delay of 35-40ms after ipsilateral (right) sound presentation.
Chapter 2
36
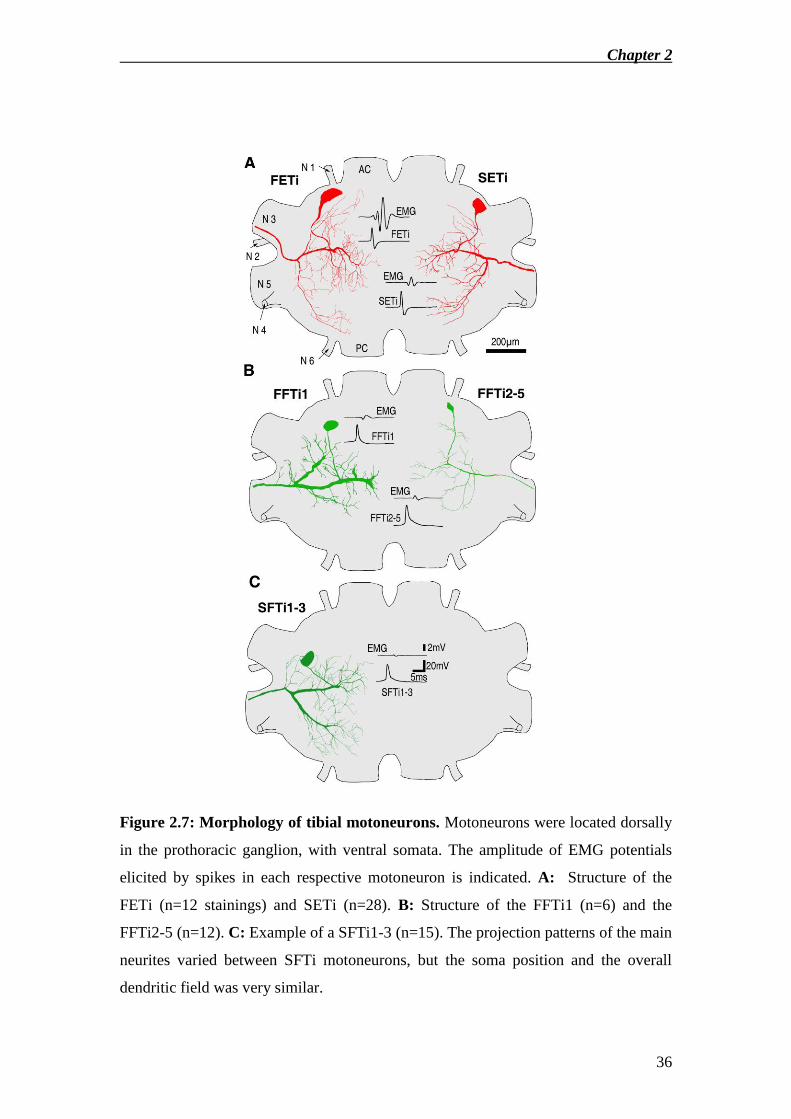
Figure 2.7: Morphology of tibial motoneurons. Motoneurons were located dorsally
in the prothoracic ganglion, with ventral somata. The amplitude of EMG potentials
elicited by spikes in each respective motoneuron is indicated. A: Structure of the
FETi (n=12 stainings) and SETi (n=28). B: Structure of the FFTi1 (n=6) and the
FFTi2-5 (n=12). C: Example of a SFTi1-3 (n=15). The projection patterns of the main
neurites varied between SFTi motoneurons, but the soma position and the overall
dendritic field was very similar.

Chapter 2
37
Figure 2.8: Sensory and central inputs to tibial motoneurons. A: Intracellular
recordings of SETi (left) and SFTi1-3 (right) at rest. No synaptic activity was
recorded in SETi, while SFTi1-3 received frequent synaptic inputs. B: Sensory
stimulation during hyperpolarising current injection to unmask any weak inputs.
Motoneurons did not respond to auditory or visual inputs, but did respond to wind and
tactile inputs. C: Extracellular electrical stimulation of descending pathways evoked
EPSPs and spikes in all motoneurons. D: Bath application of pilocarpine or picrotoxin
elicited motor bursts in all motoneurons.
Chapter 2
38
Figure 2.9: Can auditory inputs be gated? Intracellular recordings of SETi during
stimulation of descending pathways (A) and during pharmacologically elicited motor
activity using pilocarpine (B) or picrotoxin (not shown). Chirps (4.8kHz 90dB) were
presented at 2Hz repetition rate. Neither stimulation of descending pathways nor
pharmacological manipulation gated any auditory inputs to SETi. In both cases a
hyperpolarising current (5nA) was injected to reveal even small inputs.
Chapter 3
39
CHAPTER 3
Neurite Specific Ca2+
Dynamics Underlying Sound Processing in an
Auditory Interneuron
SUMMARY
Concepts on neuronal signal processing and integration at a cellular and subcellular
level are driven by recording techniques and model systems available. The cricket
CNS with the Omega Neuron-1 (ON1) provides a model system for auditory pattern
recognition and directional processing. Exploiting ON1’s planar structure I
simultaneously imaged free intracellular Ca2+
at both input and output neurites and
recorded the membrane potential in vivo during acoustic stimulation. In response to a
single sound pulse the rate of Ca2+
rise followed the onset spike rate of ON1, while the
final Ca2+
level depended on the mean spike rate. Ca2+
rapidly increased in both
dendritic and axonal arborisations and only gradually in the axon and the cell body.
Ca2+
levels were particularly high at the spike-generating zone. Through the activation
of a Ca2+
sensitive K+ current this may exhibit a specific control over the cell’s
electrical response properties. In all cellular compartments presentation of species-
specific calling song caused distinct oscillations of the Ca2+
level in the chirp rhythm,
but not the faster syllable rhythm. The Ca2+
mediated hyperpolarisation of ON1
suppressed background spike activity between chirps, acting as a noise filter. During
directional auditory processing the functional interaction of Ca2+
mediated inhibition
and contralateral synaptic inhibition was demonstrated. Upon stimulation with
different sound frequencies the dendrites, but not the axonal arborisations,
demonstrated a tonotopic response profile. This mirrored the dominance of the
species-specific carrier frequency and resulted in spatial filtering of high frequency
auditory inputs.
Chapter 3
40
INTRODUCTION
Computational power and complexity achieved by nervous systems rely on the
synaptic connections between neurons and also upon functional properties within each
neuron. The response to synaptic inputs, their effect on the activation of secondary
ionic currents, and the generation of a spike code as a function of synaptic current and
recent neuronal history are central to intra-neuronal processing and integration (Borst
and Egelhaaf 1992, Single and Borst 1998, Ogawa et al. 2001,2002, Destexhe and
Marder 2004, London and Häusser 2005). Comparatively little however is known
about how such responses within and between individual neurites are integrated
towards shaping the electrical properties of a neuron in vivo. By combining
electrophysiology and fast optical imaging I analysed the spatio-temporal Ca2+
activation patterns following acoustic stimulation in the cricket auditory interneuron
Omega Neuron-1 (ON1) where Ca2+
is involved in "chemical computation" of sound
responses (Sobel and Tank 1994).
ON1 is a bilaterally paired auditory interneuron located in the prothoracic
auditory neuropil with well documented morphology (Wohlers and Huber 1982),
response characteristics (Wohlers and Huber 1978, Wiese and Eilts 1985),
connectivity (Selverston et al. 1985, Horseman and Huber 1994, Poulet and Hedwig
2006) and functionality (Wiese and Eilts 1985, Pollack 1988, Sobel and Tank 1994,
Nabatiyan et al. 2003). ON1 receives inputs from ipsilateral auditory afferents
originating from the ears in the front legs (Imaizumi and Pollack 2005) and in turn
forms inhibitory connections to its contralateral counterpart (Selverston et al. 1985)
and the contralateral ascending auditory interneurons AN1 (Horseman and Huber
1994, Faulkes and Pollack 2000) and AN2 (Selverston et. al 1985) which transmit
auditory information to the brain (Wohlers and Huber 1982). The recurrent inhibitory
network formed by the two ON1 has been implicated in enhancing bilateral auditory
contrast supporting auditory orientation and temporal pattern processing (Wiese and
Eilts 1985, Nabatiyan et al. 2003). At high sound intensities the neuron integrates a
broad range of sound frequencies (Schildberger 1988). ON1 extends its processes in a
narrow plane (<150μm, Watson and Hardt 1996) nearly parallel to the ventral
ganglion surface. Therefore optical imaging of free intracellular Ca2+
is possible
simultaneously at input and output regions of the cell.
Chapter 3
41
The monitoring of free intracellular Ca2+
is interesting as it is not only a marker of
localised activity within a neuron but also carries great functional importance in
regulating cellular processes ranging from ionic currents (Sah and Faber 2002, Faber
and Sah 2003) to gene transcription (West et al. 2001). Following the approach by
Sobel and Tank (1994) I have used the advantages of the cricket ON1 neuron to
investigate how the level of free intracellular Ca2+
changes during acoustic
stimulation within individual neurites of ON1 reflect the cell’s spatial and temporal
integration of synaptic inputs and spike activity underlying sound processing.
METHODS
Animals
Female crickets (Gryllus bimaculatus) with intact ears were selected from the colony
kept at the Department of Zoology, University of Cambridge, which is maintained on
a 12L:12D light cycle. Prior to dissection animals were cold anaesthetised at 4°C for
10-20mins.
Dissection
Animals were placed ventral side up in PlasticineTM
. Mid- and hind-legs were pinned
down while the front legs were fixed with bee’s wax to a holder at the tarsus to keep
them in walking position. Additionally the coxa was waxed to the prothoracic
segment. A ring of wax was build-up around the sternite and neck of the animal to
hold saline (140mM NaCl, 10mM KCl, 4mM CaCl2, 4mM NaHCO3, 6mM
NaH2PO4) at all times. The gut was removed via an incision in the abdomen that was
sealed with wax afterwards. The prothoracic ganglion was exposed and a small metal
platform with an optic fibre embedded in it was placed underneath. The optic fibre
was used for bright field illumination of the ganglion. The cervical connectives were
cut. All peripheral nerves were left intact. The prothoracic ganglion was held in
position by a small fork placed on the trunks of the cut connectives. To disconnect the
auditory input of an ear (Fig.3.5B-D) the front leg was cut off at the femur. All
experiments were performed at room temperature (21-23ºC). A total of ~200 crickets
were used of which 31 yielded the presented data.

Chapter 3
42
Dye injection
Tips of thick walled microcapillaries were back-filled with either 400μM Oregon
Green BAPTA-1 (Molecular Probes, Eugene, Oregon) dissolved in 400μM KAc or
with 2mM Calcium Green5N (Molecular Probes) dissolved in distilled water. Shafts
of electrodes were filled with 1M KAc. Resistances of microelectrodes varied
between 100 and 200 M. Cells were filled with the Ca2+
indicator by applying a 1-
4nA hyperpolarising current for 5-15mins. I could not control the exact concentration
of the dye in the cell. Care was taken to use the lowest possible intracellular dye
concentration that would yield detectable fluorescence and minimise chelating
artefacts. The electrode was removed and the preparation was left for at least 60mins
in order to allow the dye to diffuse throughout the neuron. Due to the relatively high
Kd of Calcium Green5N (14μM) this dye was preferred for experiments where the
temporal dynamics of Ca2+
were analysed (Fig.3.1). Oregon Green BAPTA-1 (Kd:
170nM) was superior in terms of diffusion throughout the cell and brightness, and was
used to reveal the spatial distribution of Ca2+
as well as for simultaneous recordings of
Ca2+
and membrane potential (Figs. 3.2-3.6). Time courses given indicate the most
typical examples of responses, measured with Calcium Green5N.
Electrophysiological recordings
After the staining procedure thick walled micropipettes with resistances of 60-120
M filled with 1M KAc were used to intracellularly record either from the main
axonal branch or close to the point of convergence of the two dendritic branches
(Fig.3.1), where the neurites have the largest diameter. Recordings lasted for up to 2
hrs. As this second electrode was non-fluorescing it did not interfere with optical
recordings. Physiological signals were recorded using an SEC-10L amplifier (NPI,
Tamm, Germany) and digitised at 10kHz using an AD board (MIO 16E4 National
Instruments, Austin, Texas) linked to custom built software running under LabView
5.01 (National Instruments). The manipulation of ionic currents in vivo is very
difficult and can be very expensive in the model system at hand, and was so far not
attempted.
Chapter 3
43
Optical recordings
Injected dyes were excited with monochromatic light at 494nm (10nm bandwidth)
(Optoscan Monochromator CAIRN Research, Faversham, UK). Indicator
fluorescence emission in the range of 515-560μm was detected by a cooled CCD
camera (Andor iXon DV887, back illuminated, 90% quantum efficiency with single
photon sensitivity at -65ºC, 12bit amplitude resolution) operating at 90Hz at 128x128
pixel resolution (10.5ms integration time, with 0.5ms inter-frame intervals). This was
attached to a Leica DMLFS microscope. For simultaneous electrophysiological and
optical recordings a 10X dry objective (Leica: N.A. 0.25, 19.5mm working distance)
was used to allow space for the electrode. In all other experiments a 10X (N.A. 0.3),
20X (N.A. 0.5) or 40X (N.A. 0.8) water immersion objective was used. Data was
sampled using AQM Advance 6 software (Kinetic Imaging – Andor, Belfast, N.
Ireland).
In each ON1 analysed the following compartments could clearly be
distinguished and were defined as separate regions of interest for image analysis: the
axon, 2 major dendritic branches (D1 and D2), two prominent branches with axonal
terminals (T1 and T2), and the spike generating zone (SGZ) (Fig.3.1A). This was
located next to the convergence point of the two main dendrites where the neurite was
particularly thick. Electrophysiological recordings at this region showed small spikes
riding on large EPSPs, while recordings further along the axon demonstrated large
spikes and no/small EPSPs (Selverston 1985, personal observations). In addition in
some preparations it was possible to image the primary neurite and soma as well when
located in the same plane as the rest of the neuron.
Single acoustic stimuli (>60dB SPL) led to fluorescence changes of up to 20%
and were clearly detectable in single trials of acoustic stimulation (Fig.3.3, 3.4, 3.5).
Averaging over several trials was only used when the exact time course of the Ca2+
response was to be analysed, or particularly small changes in Ca2+
were to be detected
(Figs.3.1, 3.2, 3.6). Due to light scattering I could not specifically resolve the Ca2+
signal in individual small diameter secondary and tertiary neurites of ON1. Therefore
all analysis considers primary neurites and the summed activity of adjacent smaller
branches (Figs.3.1B,C).

Chapter 3
44
Acoustic stimulation
Sound stimuli were generated in CoolEdit 2000 (Syntrillium, Phoenix, US) and
presented by a pair of headphone speakers attached to the wide ends of 15cm conical
copper-tubes acting as sound guides. The speakers were aligned at 90 deg left and
right to the animal's length axis. The narrow end of the tubes was placed 2cm from the
opening of the respective auditory spiracle. Intensities of stimuli were calibrated
(Amplifier Type 2610 with 4133 microphone Bruel and Kjaer, Nærum, Denmark) to
an accuracy of +/- 1dB Sound Pressure Level (SPL relative to 2x10⁻⁵ Pa) at the
position of the spiracle. Unless stated otherwise carrier frequency of sound stimuli
was 4.8kHz. Background noise in the room was <45dB SPL.
Data analysis
Imaging data was first converted in AQM Advanced 6 to be read by ImageJ 1.33u
(US National Institutes of Health). Grey levels over time could be calculated for
arbitrary regions of interest. Values given are changes in fluorescence relative to
background intensity at that region (ΔF/F). Imaging data was precisely aligned with
electrophysiological data in Neurolab (Hedwig and Knepper 1992) using camera
generated TTL pulses indicating the timing of every frame taken. Further data
analysis was performed using MatLab 6.5 (Mathworks, Natick, MA).
RESULTS
Ca2+
dynamics in different neurites
We used a 1s sound pulse (90dB SPL, 4.8kHz) to characterise the spatio-temporal
Ca2+
response profile of the Omega Neuron-1 (ON1). Acoustic stimulation led to Ca2+
increases in all regions, with the axonal terminals (T1, T2), the medial dendrite (D1)
and the putative spike generating zone (SGZ) exhibiting greatest amplitude changes,
followed by the lateral dendrite (D2) and the axon (Fig.3.1). Within the dendrite and
axonal terminals the rise times of Ca2+
transients in response to acoustic stimulation
were faster than decay times (τrise=177ms, τdecay=237ms, Calcium Green-5N).
Generally T1,T2 exhibited slightly faster changes than D1,D2. In experiments where
Oregon Green BAPTA-1 was used Ca2+
dynamics were generally slower, due to the
greater chelating effect of the dye.

Chapter 3
45
At the SGZ pronounced Ca2+
elevations were present despite the lack of any fine
neurites in that region. Here the Ca2+
rise and decay times are slower, (τrise=298ms,
τdecay=1265ms) (Fig.3.1D). Consequently the Ca2+
level was elevated for hundreds of
milliseconds longer than at D1,D2 or T1,T2. This relates to a prominent spatial
change in the Ca2+
distribution. During the first 500ms of the acoustic stimulus the
peak Ca2+
transient at D1 started shifting towards the SGZ at a velocity of ~100μm/s
(Fig.3.1E, F). No Ca2+
shift occurred at the axonal side of the neuron despite that a
similar spatial arrangement exists prior to the main axonal branching site.
After about 5-10s of repeated stimulation even the axon and soma showed
distinct Ca2+
signals. Time courses of Ca2+
elevations here varied as a function of
distance from T1, T2 and D1, D2 (data not shown), indicating that Ca2+
enters the
axon and soma by diffusion from T1, T2 and D1, D2 (See also Fig.3.4C).
Correlations between membrane potential and Ca2+
dynamics
Upon excitatory synaptic activation Ca2+
may enter the cytosol through voltage or
ligand gated channels as well as through release from intracellular stores (Gallin and
Greenberg 1995, Berridge 1998). Once inside the cytosol however, Ca2+
may in turn
act as a regulator of the cell’s excitatory activity through activation of an outward
current (Sobel and Tank 1994, Berridge 1998, Sah and Faber 2002). I therefore
analysed the relationship between Ca2+
and the cell’s electrical activity. Since the Ca2+
dynamics at D1 and D2 and T1 and T2 respectively were very similar for further
analysis only T1 versus D1 were considered.
We averaged the Ca2+
signal triggered by spikes occurring at low discharge rates
(<5Hz) in quiescent preparations. This revealed distinct elevations in Ca2+
with a
maximum amplitude of ~0.2% change in fluorescence at the spike generating zone
(not shown), the axonal terminals and the dendrites (Fig.3.2A). Following the
occurrence of spikes the Ca2+
change exhibited a rapid rise time (<10ms) followed by
a slower decay time (>200ms).
Since single spikes caused small Ca2+
transients variation of acoustic stimulus
parameters should evoke different response patterns in both spike rate and Ca2+
transients. Given the putative presence of voltage-gated Ca2+
channels at both T1 and
D1, effects on Ca2+
transients here may be secondary to effects in spike rate.
Increasing ipsilateral sound amplitude from 50 to 90dB SPL revealed a linear
relationship between stimulus intensity up to 80dB SPL (note that dB scales

Chapter 3
46
logarithmically) and the following four parameters: mean spike rate, peak spike rate,
D1 peak Ca2+
level and the reciprocal of the time constant of Ca2+
rise (τCa2+ -1
)
(Fig.3.2B). In order to separate the effects of peak spike rate and mean spike rate on
the Ca2+
changes the onset rate of the sound stimuli was systematically altered.
Increasing sound onset rate had a large effect on peak spike rate but only caused a
very small decrease of the mean spike rate (Fig.3.2C-E). Now the steady state Ca2+
level followed the trend of mean spike rate, while the Ca2+
influx rate (proportional to
τCa2+ -1
) varied with peak spike rate (Fig.3.2E).
Once in the cytosol, Ca2+
can affect the membrane potential and evoke a
hyperpolarization via Ca2+
activated K+ currents (Sobel and Tank 1994, Sah and Faber
2002). A pronounced (at least 5mV) after-hyperpolarisation, recorded at T1, followed
at the end of acoustic stimulation in ON1 (Fig.3.3A). The decay of this
hyperpolarisation strongly correlated with the decay in Ca2+
at the SGZ (r=-0.9640),
at T1 (r=-0.9577) and D1 (r=-0.9574) (Fig.3.3B). However within the initial phase
when the hyperpolarisation is strongest (~0-1s after stimulus offset) Ca2+
at the SGZ,
and to a smaller degree also at T1, is not linearly related to membrane potential, but
instead is higher than indicated by the linear regression. This indicates that Ca2+
at the
SGZ may have a particularly large effect on hyperpolarisation.
Since Ca2+
entry to ON1 at different compartments occurs over hundreds of
milliseconds (τrise=177ms at D1 and τrise=298ms at the SGZ) it probably does not
contribute to the rapid decrease of ON1’s spike rate after an initial phasic response
which occurs within the first ~50ms after stimulus onset (Fig.3.3A, 3.2C), but instead
may contribute to a slower component of adaptation.
Temporal pattern processing in ON1 and Ca2+
dynamics
How are the changes in Ca2+
related to the processing of behaviourally relevant
auditory patterns? The calling song of crickets may last for many hours. In G.
bimaculatus it consists of chirps composed of 4-6 syllables (21 ms duration) at a
syllable period approximating 42ms and a chirp repetition rate around 2 Hz (Doherty
1985) (Fig.3.4A,B). Three time scales are hence to be considered: (1) responses to
syllables, (2) responses to chirps and (3) long term effects of song processing. During
the first 1-2 chirps of calling song presentation a general Ca2+
elevation was
established. Ca2+
levels oscillated to the chirp pattern of 2Hz around this elevation
(Fig.3.4B). After the first 2-3 chirps, oscillations at T1 and D1 were more pronounced

Chapter 3
47
(25% of the elevation amplitude) than at the SGZ (15% of the elevation amplitude).
At the SGZ this resulted in a greater overall Ca2+
elevation to species-specific song
than at T1 or D1. Up to natural syllable periods of 42ms Ca2+
levels did not decay
between syllables. With longer syllable periods a distinct decay in Ca2+
between
individual syllables occurred (Fig.3.4A). The Ca2+
dynamics therefore exhibited
properties of a low pass filter for the syllable pattern.
Prolonged stimulation for at least 5 minutes did not change the oscillation
amplitudes and general elevation levels (Fig.3.4C). Ca2+
signals in axon and soma
occurred only after 5-10s stimulation and then remained high for the duration of
extended stimulation.
Integration of excitatory and inhibitory inputs
During phonotaxis crickets use interaural sound level differences to localise a calling
conspecific (Larsen et al. 1989). The paired ON1 enhance bilateral auditory contrast
through recurrent inhibition (Selverston et al. 1985, Wiese and Eilts 1985, Römer and
Krusch 2000). In each ON1 ipsilateral excitation by afferents is processed
simultaneously with inhibition from the contralateral ON1. The neuron is therefore a
model system for the analysis of the interplay of inhibition with excitation. Low
sound amplitudes (60dB SPL) were used to activate the ears independently. During
the ipsilateral presentation of a 2000ms sound a second contralateral stimulus of
500ms duration was given. This led to a sudden cessation in spiking, which then
recovered towards a spike rate of 50Hz while the contralateral stimulus was still on.
Simultaneously a distinct decrease in Ca2+
occurred particularly at T1 (28%) and D1
(24%), and to a lesser degree (10%) at the SGZ (Fig.3.5A).
In order to dissociate the effects of inhibition and excitation the ipsilateral ear
providing most excitatory auditory inputs (Watson and Hardt 1996) was removed.
Recordings of the membrane potential near T1 now revealed clear IPSPs in response
to contralateral acoustic stimulation (Fig.3.5B). During contralateral acoustic
stimulation Ca2+
decreased by 1% in the dendrite (5 out of 7 animals, 2 showed no
effect), due to the inhibition suppressing the ongoing spike activity. Ca2+
at the axonal
branches (T1, T2), however, increased by about 1.5% (about 10 times less than during
ipsilateral stimulation) during the inhibition (6 out of 7 animals) (Fig.3.5C,D). This
result cannot be explained by the reduced spike activity but rather may indicate a
direct synaptic input to the axonal terminals activated by contralateral acoustic
Chapter 3
48
stimulation as previously suggested for crickets (Selverston et al. 1985, Watson and
Hardt 1996) as well as bushcrickets (Molina and Stumpner 2005).
Sound frequency integration
The lowest threshold of ON1 is at 4-5kHz, but it responds to frequencies in a range
from 3 to 20 kHz at 75dB SPL (Schildberger 1988). Its dendrites extend along the
axonal projections of the auditory afferents in the auditory neuropil (Esch et al. 1980,
Wohlers and Huber 1982, Imaizumi and Pollack 2005). I therefore tested for a
tonotopic arrangement of auditory inputs along the dendritic branches (D1,D2). At the
axonal terminals (T1,T2), however, the spatial distribution of Ca2+
activity is not
expected to directly depend on input frequency, but instead depend on the resultant
spiking response.
ON1 was stimulated with 1s sounds (75dB SPL, 0.25 Hz repetition rate) at
frequencies between 3-20kHz (steps of 1kHz for 3-6kHz, steps of 2kHz for 8-20kHz)
and Ca2+
was imaged. Adjacent regions of interest were defined along T2, T1, D1 and
D2, each covering 35μm along the length of these neurites (Fig.3.6). The Ca2+
response at each region of interest was normalised to the maximum response across
the frequencies tested. As expected, along the axonal neurites T1,T2, which are
activated by the spike pattern of the neuron, no spatial pattern of frequency
representation occurred. Here the response to sound frequencies peaked at 4-5kHz
corresponding to the tuning of the neuron (Schildberger 1988). Along the dendrites
D1,D2, which respond to synaptic potentials and invading spikes, a tonotopic
arrangement of sound frequency inputs was observed. The arborisations of D1
responded more strongly to low frequency sound (4-5kHz), and D2 showed a greater
responsiveness to high frequencies (~12kHz). The frequency tuning at the axonal
terminals (T1,T2) reflects responses at D1 better than at D2. This is most likely due to
the greater spatial proximity of D1 relative to the spike generating zone. Interestingly,
in addition the low frequency band at T1,T2 is narrower than at D1,D2, with
responses to frequencies below 4kHz at T1,T2 being weaker than compared to D1,D2.
Chapter 3
49
DISCUSSION
The planar structure of the Omega Neuron-1 offers the possibility to record Ca2+
dynamics in both input and output neurites at the same time, and to relate Ca2+
changes to simultaneously recorded electrical activity and the functional properties of
the cell.
Methodological considerations
Due to the nature of our staining and recording techniques it was impossible to
determine the absolute concentration of Ca2+
dye in the individual compartments of
our cells. Inherent to the method chelating artefacts introduced by the dyes could
affect time courses and diffusion velocities measured. For a review of problems
associated with Ca2+
imaging using fluorescent indicators see Berridge (1998) or
Augustine et al. (2003). Several steps were taken to minimise chelating artefacts: (1)
minimal concentrations of dye which would yield a detectable fluorescent change
upon acoustic stimulation were used. (2) A gap of at least 60mins between the
staining and the recording process was left to allow diffusion of the dye throughout
the cell. (3) Staining of the cell was performed at two different locations in different
experiments (near the SGZ and in the axon near the terminals), and the effects of a
dye concentration gradient after 60mins diffusion was judged minimal. (4) A low
affinity dye (Calcium Green-5N) was employed to determine more exact time courses
(Fig.3.1) to reduce the extent of chelating artefacts introduced by the higher affinity
dye Oregon Green BAPTA-1. Consequently velocities of Ca2+
changes presented in
this study are if anything an underestimation, with Fig.3.1 presenting the most
accurate indication.
The manipulation of specific ionic channels was not attempted. Accordingly
conclusions drawn about possible ionic currents underlying the observed changes in
cell physiology in response to acoustic stimulation are based on characterised Ca2+
effects in similar studies (Wicher & Penzlin 1997, Single & Borst 1998, Nakamura et
al. 1999, Augustine et al. 2003).
Chapter 3
50
Ca2+
dynamics in different neurites
Ca2+
may enter the cytosolic phase in three different ways: (1) entry through voltage
gated Ca2+
channels (2) entry through ligand gated channels and (3) release from
intracellular stores (Berridge 1998). Ca2+
entry at presynaptic terminals occurs via
voltage gated channels (Berridge 1998). Ca2+
elevations at both the axonal terminals
(T1,T2) and the dendrites (D1,D2) to single spikes (Fig.3.2A) suggest the presence of
voltage gated Ca2+
channels at both types of neurites, and may underlie the rapid Ca2+
dynamics at these branches in response to acoustic stimulation (Fig.3.1D). I could not
distinguish between contributions from high and low voltage gated channels (Wicher
and Penzlin 1997). The much slower Ca2+
dynamics at soma and axon varied as a
function of distance from these primary entry areas and therefore indicates passive
diffusion of Ca2+
(Fig.3.1A,D).
Assuming passive electrical signal propagation properties in the dendrites, a
leakage of Ca2+
through ligand gated channels or alternatively its release from
intracellular stores at the dendrites (D1,D2) is suggested by the tonotopic arrangement
of excitation. Additionally the observed small but significant Ca2+
elevation in axonal
branches upon contralateral acoustic stimulation despite the absence of spike activity
indicates an entry of Ca2+
through a mechanism other than through voltage gated
channels at the terminals (T1,T2) (Fig. 6B-D). It can at this point not be concluded
whether or not this elevation in Ca2+
contributes to the release of synaptic vesicles.
A key question for the function of ON1 is where Ca2+
at the SGZ is derived from. The
particularly slow Ca2+
dynamics at the SGZ are unlikely to be the result of a non-
uniform dye distribution as staining ON1 at different sites and with minimum
concentrations of Calcium Green5N reliably yielded very similar spatio-temporal
Ca2+
distributions. Instead they could be a result of the large size of the SGZ. The
increased cytoplasmic volume dictates that free intracellular Ca2+
concentration rises
more slowly than at thinner neurites if the same Ca2+
influx occurs. Alternatively the
peak Ca2+
transient travelling from D1 to the SGZ (Fig.3.1E,F) may result from
movement of Ca2+
ions through the cytosol. In comparison with the similar cytosolic
volume compartment at the junction of the axonal terminals (T1) and the axon, the
speed and amplitude of Ca2+
changes are much greater at the SGZ. A pure passive
diffusion model is therefore unsatisfactory, and active transport or propagation
processes from the dendrites to the SGZ may have to be assumed. Ca2+
waves in
Chapter 3
51
neurons of similar spatio-temporal properties have been described previously, e.g. in
hippocampal CA1 neurons (Nakamura et al. 1999, 2000).
Interdependence of Ca2+
and membrane potential
Ca2+
enters the cytosolic phase of ON1 as a result of depolarising synaptic input
and/or intracellular release and spike activity. Once inside, Ca2+
contributes to the
control of the membrane potential for example through a Ca2+
activated
hyperpolarising current (Sah and Faber 2002) as in blowfly large monopolar cells
(Hardie and Weckström 1990) as well as in ON1 (cricket: Acheta domestica, Sobel
and Tank 1994). This negative feedback loop of cell excitability is a key element of
ON1 response properties in temporal pattern processing and noise suppression.
We observed that the after-stimulus hyperpolarisation correlates with the free
cytosolic Ca2+
concentration at the SGZ, the dendrites and the axonal terminals
(Fig.3.3). Notably any dendritic contribution to hyperpolarisation will have been
attenuated at the recording site near T1. Since the amount of this attenuation is not
known it was not included into calculations. Nonetheless, immediately after the end of
acoustic stimulation hyperpolarisation and Ca2+
at the SGZ was particularly high
(Fig.3.1D,F, Fig.3.3B). This suggests that hyperpolarisation of ON1 as a function of
its own spike activity may be driven in particular by the SGZ. Functionally this
appears to be a very efficient mechanism of ON1 to control spiking activity. The
impact of EPSPs in generating spikes could be reduced at the very site where it is
translated into a series of spikes.
Increasing sound intensity resulted in linear increases of the final Ca2+
elevation, rate of Ca2+
rise, mean spike rate and peak spike rate relative to the
logarithmic dB scale, all saturating at 80dB (Fig.3.2B). Within the range of 50-80dB
ON1 hence encodes stimulus intensity in dB linearly not only in spike rate parameters
but also in Ca2+
rate of rise and concentration. Increasing stimulus onset rate strongly
increased peak spike rate without changing the final mean spike rate (Fig.3.2C,D,E).
Final Ca2+
elevation however correlated with mean spike rate. This indicates that the
peak spike rate does affect the rate of Ca2+
rise while the final Ca2+
level and the mean
spike rate are interdependent. The functional consequence of these particular Ca2+
dynamics is that transient peaks in spike rate, thought critical in temporal pattern
processing (Nabatiyan et al. 2003), are maintained relative to a generally suppressed
background activity. In this way peaks in spike rate can not only operate to transmit

Chapter 3
52
the temporal structure of species-specific song to postsynaptic targets, but at the same
time maintain intracellular Ca2+
at a high level.
Temporal pattern processing
Upon species-specific song presentation Ca2+
levels oscillated in the chirp rhythm
around a general sustained elevation, the level of which coincides with a
simultaneously maintained hyperpolarisation between chirps (Fig.3.4B). This
hyperpolarisation has previously been shown to keep background activity below the
threshold for spike generation (Pollack 1988, Sobel and Tank 1994).
Ca2+
did not decay during species-specific inter-syllable intervals (Fig.3.4A).
However Ca2+
levels oscillated in the slower chirp rhythm. Ca2+
dynamics in ON1
therefore provide a low pass filter of temporal pattern, as previously shown for peak
spike rate (Nabatiyan et al. 2003).
Over prolonged acoustic stimulation amplitudes of Ca2+
oscillations were
constant in all cellular compartments (Fig.3.4C). Elevations in free intracellular Ca2+
occurred only gradually in the axon and the soma, which in most insect neurons has
only a passive role in electrical signalling. The Ca2+
elevation in the cell body may
allow an activation of long-term processes such as the mobilisation of dormant
proteins or even enhanced translation or transcription to meet the requirements of the
neuron (West et al. 2001) exposed to continuous song.
Integration of excitatory and inhibitory inputs
The bilaterally paired ON1 form a network of recurrent inhibition (Selverston et al.
1985) which allows for the enhancement of bilateral auditory contrast (Wiese and
Eilts 1985) and supports directional processing. During sound processing ON1
integrates ipsilateral excitatory inputs from auditory afferents (Imaizumi and Pollack
2005) and inhibitory inputs from its contralateral counterpart. Presentation of a
contralateral stimulus during ongoing ipsilateral stimulation demonstrated this
integration not only in membrane potential but also in the Ca2+
signals (Fig.3.5A).
The initial cessation of spiking in response to the contralateral sound is accompanied
by a Ca2+
decay rate similar to the Ca2+
rate at ipsilateral sound offset. Changes in
Ca2+
may therefore be the consequence of the decreased spike rate. Again, at the SGZ
the decay in Ca2+
due to the inhibition was less pronounced than at the axonal
terminals or dendritic areas. Therefore, the two different mechanisms acting to reduce

Chapter 3
53
spiking activity in ON1, that is contralateral synaptic inhibition and internal Ca2+
controlled K+ conductance at the SGZ, interfere only to a small degree. The functional
consequence of this is that - in our stimulation paradigm - the two types of inhibition
are effectively additive. A decrease in Ca2+
due to an inhibitory synaptic input was
demonstrated in blowfly tangential neurons (Single and Borst 1998), however
interactions between excitation and inhibition were not studied in detail.
After removing ipsilateral excitatory inputs, intracellular recordings demonstrated
distinct IPSPs to contralateral acoustic stimulation (Fig.3.5B). Now Ca2+
at the
dendrites (D1,D2) decreased due to the reduced resting spike activity (Fig.3.5C,D).
Critically however, Ca2+
at the axonal branches T1,T2 still showed a clear increase to
the contralateral acoustic stimulus. This indicates a contralateral synaptic input to the
axonal terminals of ON1 which was unmasked by removing the ipsilateral ear. It is
unclear by what mechanism Ca2+
enters ON1 here, however it is unlikely to be
dependent on voltage gated channels. Pre-synaptic inputs onto ON1 axonal terminals
are indicated on the basis of ultrastructural studies (Watson and Hardt 1996), and may
be the basis for the observed changes.
Sound frequency integration
The population of Gryllus bimaculatus auditory afferents encodes a frequency range
of 3-20kHz (Oldfield et al. 1986). In other, closely related species, their axonal
terminals project in a tonotopic fashion in the prothoracic auditory neuropil (Römer
1983, Oldfield et al. 1986, Römer et al. 1988). In crickets high frequency coding
afferents terminate both medially and laterally, while lower frequency afferents
project medially (Imaizumi and Pollack 2005). The G. bimaculatus ON1 encodes a
wider frequency range than individual afferents (Schildberger 1988, personal
observations), and extends its dendrite along the same projection area as the
tonotopicity map of afferent terminals.
Accordingly, Ca2+
responses along the dendrites revealed a tonotopic input
arrangement: medially low (4-5kHz) frequency inputs predominated (D1), the medial
end of the lateral branches (D2) received both low and high (10-14kHz) frequency
inputs, and towards the lateral tip of the lateral dendrites (D2) low frequency inputs
ceased and 20kHz inputs occurred (Fig.3.6). At the axonal terminals (T1,T2) no such
tonotopicity was observed. Here high frequency components, although prominent at

Chapter 3
54
the lateral dendrite (D2), were weaker than low frequency components. Notably
intracellular diffusion of Ca2+
may have contaminated the measurements which were
taken over 1s, tonotopicity may therefore be more pronounced than presented here.
Assuming passive electrical signal propagation properties in the dendrites
(London and Häusser 2005), the large distance of D2 towards the SGZ, as compared
to D1 towards the SGZ, may functionally result in spatial filtering of EPSPs between
D2 and the SGZ, giving them a weaker effect on spike generation. This demonstrates
how tonotopicity can be exploited for sound frequency filtering within a single
neuron. However most synaptic connections between ON1 and auditory afferents are
located towards the distal ends of the smaller neurites along D1 and D2 (Watson and
Hardt 1996), therefore a large proportion of input attenuation may occur before
reaching the main dendritic arms. Additionally Ca2+
transients measured at the lateral
dendrite (D2) are generally weaker than at the medial dendrite (D1) (Fig.3.1B).
Pollack (1994) found that presentation of 30kHz stimuli to ON1 in Teleogryllus
oceanicus elcicited larger EPSP amplitudes at the SGZ than 5kHz inputs. However,
given the increased flight activity and expanded hearing range towards the ultrasound
of T. oceanicus relative to G. bimaculatus this finding may reflect an increased
importance in high frequency sound processing in this species. This may be revealed
using Ca2+
imaging in the Omega Neuron-1 of T. oceanicus.
Given this underrepresentation of high frequency inputs an interesting
question is why ON1 of G. bimaculatus receives these inputs at all? One possibility
may lie in the extraction of timing information: high frequency auditory afferents also
weakly respond to low frequency inputs (Oldfield et al. 1986). In response to each
low frequency pulse almost the entire population of auditory afferents produces at
least one spike at sound onset. ON1 may make use of this synchronised spike activity
across the population of auditory afferents to extract the best estimate of sound onset
timing. The high peak spike rates of ON1 in response to sound pulses with a sharp
sound onset (Nabatiyan et al. 2003), but not to a slower ramped onset, are indicative
of such a principle.
Interestingly, the broad frequency band centred around 4-5kHz at the medial
dendrite and the medial end of the lateral dendrite is narrower at the axonal terminals,
with components below 4kHz reduced in amplitude. While it is unclear how such
frequency filtering is achieved, it cannot result from the distance between inputs and
the SGZ.

Chapter 3
55
Future Experiments
The manipulation of ion channels and internal Ca2+
release mechanisms through
specific blockers could lead to a more complete understanding of the relationship
between synaptic inputs, Ca2+
entry and the activation of hyperpolarising outwards
currents in ON1. Furthermore site-specific flash photolysis of caged Ca2+
, Ca2+
buffers or Inositol-1-4-5-triphosphate should clarify the role of the SGZ in supporting
the observed gain control properties of ON1.

Chapter 3
56
Figure 3.1: The
spatio-temporal Ca2+
profile of the Omega
Neuron-1. (A)
Structure of ON1.
Regions highlighted
are: 2 main branches
of axonal terminals
(T1,T2), 2 branches of
the dendrite (D1,D2),
the spike generating
zone (SGZ), axon and
soma. (B) Oregon
Green BAPTA-1
staining of ON1 in
vivo. All major
branches of the
neuron can be imaged
simultaneously. The
soma is out of focus in
the top right corner.
(C) Distribution of
Ca2+
changes (ΔF/F)
after 1s of acoustic
stimulation (90dB
SPL, 4.8kHz). (D)
Spatio-temporal Ca2+
dynamics (ΔF/F)
during acoustic stimulation as in (C), using Calcium Green-5N (10 trials averaged).
T1,T2 and D1,D2 exhibited the most pronounced and fastest changes in Ca2+
(τrise=177ms, τdecay=237ms). Slower, yet similar amplitude changes occurred at the
SGZ (τrise=298ms, τdecay=1265ms). The axon was slowest to respond, and amplitude
and time course varied as a function of distance from D1,D2 and A1,A2 (τrise>500ms,
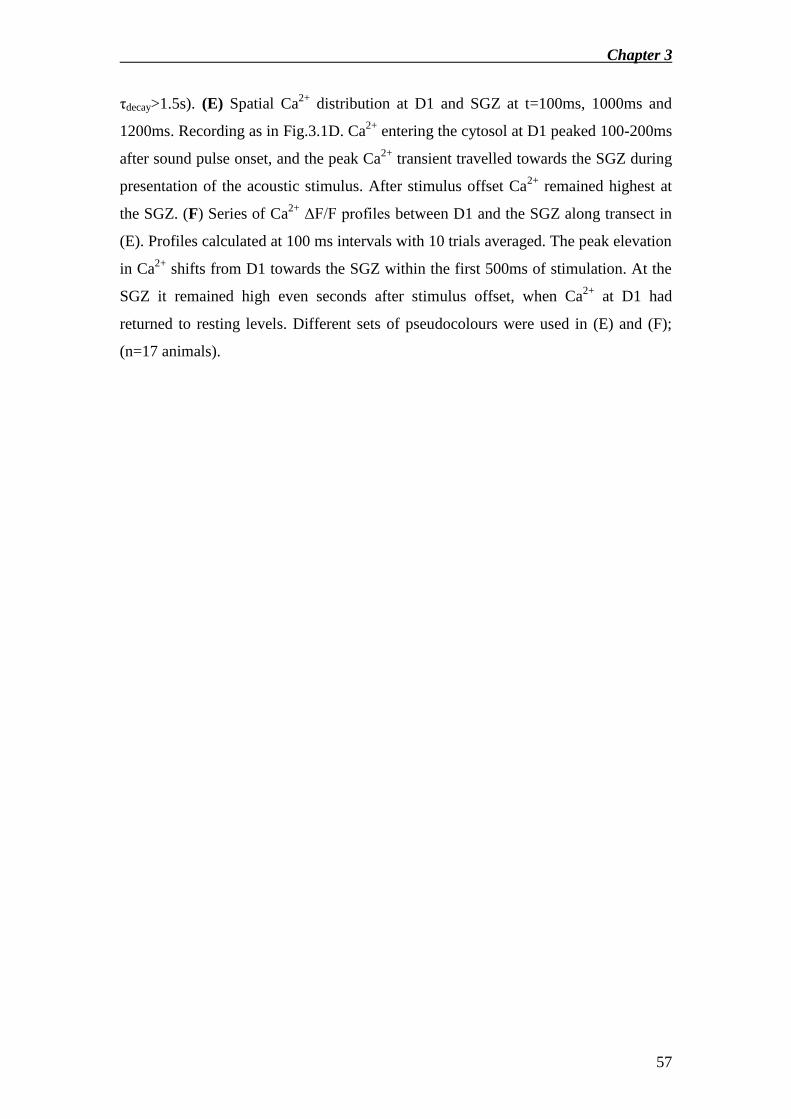
Chapter 3
57
τdecay>1.5s). (E) Spatial Ca2+
distribution at D1 and SGZ at t=100ms, 1000ms and
1200ms. Recording as in Fig.3.1D. Ca2+
entering the cytosol at D1 peaked 100-200ms
after sound pulse onset, and the peak Ca2+
transient travelled towards the SGZ during
presentation of the acoustic stimulus. After stimulus offset Ca2+
remained highest at
the SGZ. (F) Series of Ca2+
ΔF/F profiles between D1 and the SGZ along transect in
(E). Profiles calculated at 100 ms intervals with 10 trials averaged. The peak elevation
in Ca2+
shifts from D1 towards the SGZ within the first 500ms of stimulation. At the
SGZ it remained high even seconds after stimulus offset, when Ca2+
at D1 had
returned to resting levels. Different sets of pseudocolours were used in (E) and (F);
(n=17 animals).

Chapter 3
58
Figure 3.2: Spike
frequency determines
Ca2+
influx. (A)
Average Ca2+
responses
at T1 and D1 to single
spikes generated at low
discharge rate (1000
spikes averaged). (B)
Increasing acoustic
stimulus intensity (all 1s
4.8kHz) from 50-90dB
SPL revealed that peak
spike rate (PSR), mean
spike rate (MSR), final
Ca2+
level ΔF/F at D1,
and the reciprocal of the
time constant of Ca2+
rise at D1 (τCa2+ -1
) scale
linearly with stimulus
intensity up to 80dB
SPL. At 90dB SPL the
system is saturated.
Values were normalised to their maximum (100%). (C) Fast sound onset rates
resulted in high peak spike rates, independent of mean spike rate. The velocity of Ca2+
rise increased for higher peak spike rates. (D) Altering sound onset rate only had a
small decreasing effect on mean spike rate and D1 final Ca2+
level (ΔF/F). (E) The
sound onset rate had a strong effect on both peak spike rate and the reciprocal of the
time constant of Ca2+
rise (τCa2+ -1
). Faster onset rates resulted in higher peak spike
rates and shorter time constants of Ca2+
rise; (n=3 animals).

Chapter 3
59
Figure 3.3: Ca2+
determines membrane potential. (A) Single trial of
simultaneously recorded responses of membrane potential and Ca2+
transients to a 1s,
90dB sound pulse. At sound offset a marked hyperpolarisation occurs. Ca2+
levels at
the SGZ are highest for the entire decay phase. (B) The recovery from
hyperpolarisation strongly correlated with the decay in Ca2+
level at the SGZ, D1 and
T1; (n=3 animals).
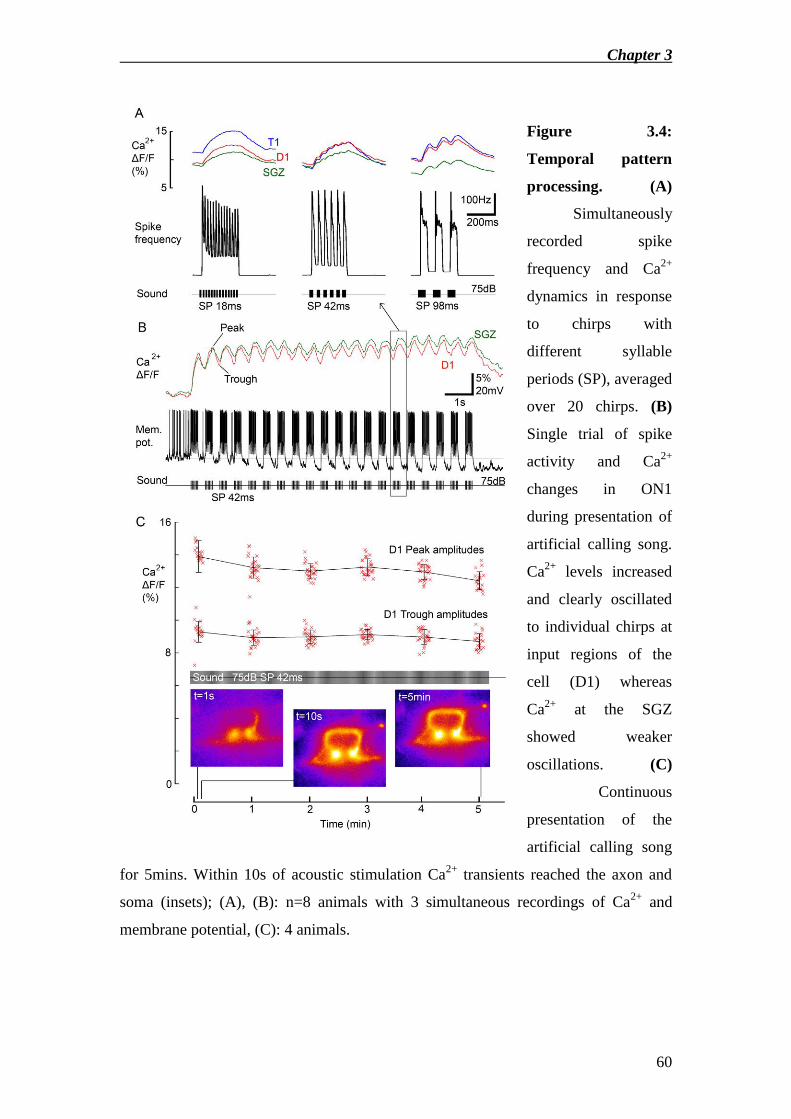
Chapter 3
60
Figure 3.4:
Temporal pattern
processing. (A)
Simultaneously
recorded spike
frequency and Ca2+
dynamics in response
to chirps with
different syllable
periods (SP), averaged
over 20 chirps. (B)
Single trial of spike
activity and Ca2+
changes in ON1
during presentation of
artificial calling song.
Ca2+
levels increased
and clearly oscillated
to individual chirps at
input regions of the
cell (D1) whereas
Ca2+
at the SGZ
showed weaker
oscillations. (C)
Continuous
presentation of the
artificial calling song
for 5mins. Within 10s of acoustic stimulation Ca2+
transients reached the axon and
soma (insets); (A), (B): n=8 animals with 3 simultaneous recordings of Ca2+
and
membrane potential, (C): 4 animals.

Chapter 3
61
Figure 3.5:
Integration of
excitation and
inhibition. (A) Single
trial simultaneous
recording of
membrane potential
and Ca2+
dynamics
demonstrating
contralateral
inhibition.
Presentation of a short
contralateral acoustic
stimulus (500ms,
60dB SPL) during
presentation of a
2000ms ipsilateral
acoustic stimulus
(60dB SPL) resulted
in a decreased spike
rate. This was
accompanied by
strong reductions in
Ca2+
level at D1 and
T1, and a weaker reduction at the SGZ. (B) After removal of the ipsilateral ear
distinct IPSPs were elicited upon contralateral acoustic stimulation. (C) Now
contralateral acoustic stimulation resulted in a decrease of Ca2+
at D1, whereas at T1
an increase occurred. (D) Spatial distribution of changes as in seen in C (ΔF/F),
demonstrates the opposite responses in dendrite (D1) and terminals (T1); ((A): n=10
animals, (B-D): 7 animals).
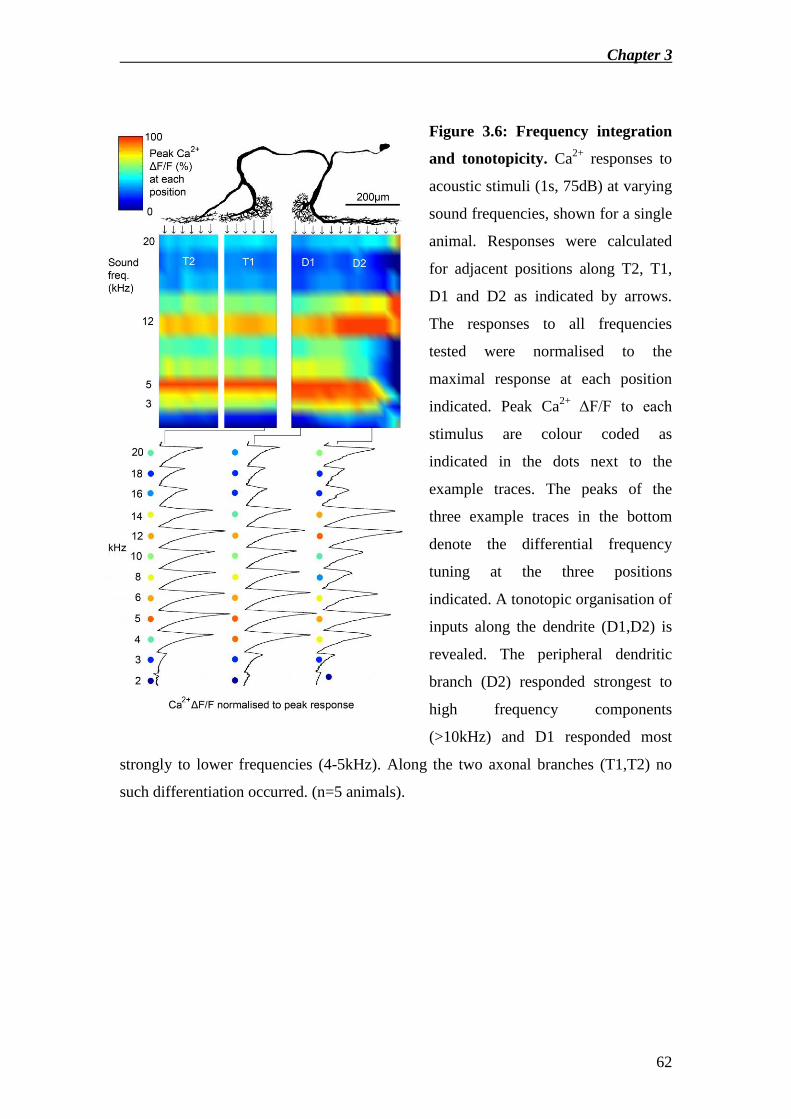
Chapter 3
62
Figure 3.6: Frequency integration
and tonotopicity. Ca2+
responses to
acoustic stimuli (1s, 75dB) at varying
sound frequencies, shown for a single
animal. Responses were calculated
for adjacent positions along T2, T1,
D1 and D2 as indicated by arrows.
The responses to all frequencies
tested were normalised to the
maximal response at each position
indicated. Peak Ca2+
ΔF/F to each
stimulus are colour coded as
indicated in the dots next to the
example traces. The peaks of the
three example traces in the bottom
denote the differential frequency
tuning at the three positions
indicated. A tonotopic organisation of
inputs along the dendrite (D1,D2) is
revealed. The peripheral dendritic
branch (D2) responded strongest to
high frequency components
(>10kHz) and D1 responded most
strongly to lower frequencies (4-5kHz). Along the two axonal branches (T1,T2) no
such differentiation occurred. (n=5 animals).

Chapter 4
63
CHAPTER 4
Dynamics of Free Intracellular Ca2+
during Synaptic and Spike
Activity of Cricket Tibial Motoneurons
SUMMARY
The spatio-temporal dynamics, mode of entry and role of free intracellular Ca2+
in
cricket (Gryllus bimaculatus) front leg tibial extensor and flexor motoneurons were
investigated. Synaptic activation or intracellular depolarising current injection
uniformly increased Ca2+
with the same dynamics throughout the primary and
secondary branches of the dendritic tree of all motoneurons. Ca2+
rise times (τrise: 180-
215ms) were faster than decay times (τdecay: 1400-1700ms) and resulted in an elevated
Ca2+
plateau during repetitive activation, such as during walking. The neurons
therefore operate in a different Ca2+
environment during walking than during episodic
leg movements. Ca2+
enters the dendritic processes of motoneurons predominately via
low voltage activated Ca2+
channels. In addition smaller contributions via high
voltage activated Ca2+
channels and via ligand gated Ca2+
channels may exist. Ca2+
does not activate any prominent secondary currents, or contribute to membrane
potential in any obvious way. EPSPs evoked by descending inputs are unaffected by
the level of free intracellular Ca2+
. Unlike in most neurons, the activity of tibial
motoneurons therefore appears to be independent of the level of free intracellular Ca2+
in dendrites. This may represent an essential prerequisite for the generation of spike
patterns given the wide range of different motor sequences supported.
INTRODUCTION
Ca2+
in neurons may act in a plethora of ways to support and regulate neuronal
processing (Borst and Egelhaaf 1992, Sobel and Tank 1994, London and Häusser
2005), signalling and cellular processes (Berridge 1998, Bootman et al. 2001).
Through binding to secondary proteins it may contribute to membrane potential,
regulate synaptic transmission both pre- and postsynaptically or affect gene
transcription and translation. Due to a precise regulation of the spatio-temporal Ca2+

Chapter 4
64
concentration within neurons (Albritton et al. 1992, Berridge 1998, Bootman et al.
2001, London and Häusser 2005), Ca2+
can play different roles in different regions of
the same neuron at the same time (Augustine et al. 2003). To therefore understand
neuronal processing it is critical to identify the source, spatio-temporal distribution
and function of Ca2+
within neurons.
While several studies investigated the role of free intracellular Ca2+
in insect
sensory neurons (Borst and Egelhaaf 1992, Sobel and Tank 1994, Single and Borst
1998, Galizia et al. 2000, Ogawa et al. 2002, Baden and Hedwig 2007), and the role
of Ca2+
in vertebrate (Sah and McLachlan 1992, Housgaard and Kiehn 1993, Bonnot
et al. 2002) and non-insect invertebrate (Kloppenburg et al. 2000) motoneurons, there
is no data on free intracellular Ca2+
in insect motoneurons. I therefore aimed to
demonstrate the mode of entry, the spatio-temporal distribution and the role of free
intracellular Ca2+
in the cricket (Gryllus bimaculatus) front leg tibal motoneurons
during rhythmic activity, synaptic activation and during intracellular current injection.
The functional properties of these motoneurons are of behavioural relevance as they
are an output pathway for phonotactic steering movements.
METHODS
Animals
Female crickets (Gryllus bimaculatus) with intact front legs were selected from the
colony kept at the Department of Zoology, University of Cambridge, which is
maintained on a 12L:12D light cycle. Prior to dissection animals were cold
anaesthetised at 4°C for 10-20mins.
Dissections
Animals were placed dorsal side up in PlasticineTM
with only the left front leg free to
move. Left is referred to as ipsilateral. The leg was fixed with bees wax to a holder at
the proximal femur to allow free movement of the tibia and tarsus. Following a dorsal
incision, the gut was removed and the prothoracic ganglion exposed. The thoracic
cavity was filled with insect saline (140mM NaCl, 10mM KCl, 4mM CaCl2, 4mM
NaHCO3, 6mM NaH2PO4). A small metal platform with an optic fibre embedded in
it was placed underneath the ganglion. The optic fibre was used for bright field

Chapter 4
65
illumination. The connectives between the pro- and mesothoracic ganglia were cut but
the connectives towards the subesophageal ganglion as well as all side nerves were
left intact. Experiments were performed at room temperature (21-23ºC). A total of
about 200 crickets were used, of which 51 yielded the presented data.
EMG recordings
Two varnish coated steel wires (ø: 30μm) were placed into the extensor tibia muscle
through two small holes in the dorsal distal femur. The electrodes recorded extensor
muscle potentials at 2-15mV amplitude and flexor muscle potentials at 0.2-3mV.
EMG signals were recorded using an extracellular amplifier (A-M Systems,
Differential AC Amplifier Model 1700, Sequim, WA).
Electrophysiological recordings and dye injection
Thick walled micropipettes (øouter: 1mm, øinner: 0.5mm) were used to intracellularly
record from the main neurites of motoneurons. Tips of electrodes were back-filled
with 400μM Oregon Green BAPTA-1 (Molecular Probes, Eugene, Oregon) dissolved
in 400μM potassium acetate and shafts were filled with 1M potassium acetate.
Resistances were 60-120 M and recordings lasted for up to 1h. Cells were filled
with the Ca2+
indicator by applying a 1-9nA hyperpolarising current for 10-30mins
and left for at least 30mins to allow for diffusion of the dye. This sometimes required
re-penetration after the diffusion period. To confirm the identity of stained
motoneurons following re-penetration I observed Ca2+
changes following intracellular
depolarising current injection, and also compared the amplitude and waveform of
elicited muscle potentials. To minimise chelating artifacts care was taken to achieve
the lowest possible intracellular dye concentration that yielded detectable
fluorescence. I could not determine the exact concentration of the dye in the cell
which introduced variability in time courses of Ca2+
dynamics. Therefore values given
indicate the most typical examples of responses. Intracellular signals were measured
using an SEC-10L amplifier (NPI, Tamm, Germany).
Optical recordings
Monochromatic light at 488nm with 10nm bandwidth was used (Optoscan
Monochromator, CAIRN Research, Faversham, UK). Indicator fluorescence emission
Chapter 4
66
in the range of 515-560nm was detected by a cooled CCD camera (Andor iXon
DV887, Belfast, Northern Ireland; back illuminated, 90% quantum efficiency with
single photon sensitivity at -65ºC) operating at 50Hz with 256x256 pixel resolution.
In another recording mode the camera operated at 140Hz at 64x64 pixel resolution.
Due to the slow Ca2+
kinetics observed I judged 50Hz video data acquisition to be
sufficient to accurately reflect Ca2+
changes. This also allowed a better spatial
resolution than the fast recording mode. The camera was attached to a Leica DMLFS
(Wetzlar, Germany) microscope. A 10X dry objective (Leica: N.A. 0.25, 19.5mm
working distance) was used to allow space for the microelectrode. Imaging data was
sampled using AQM Advance 6 software (Kinetic Imaging – Andor, Belfast, N.
Ireland) and synchronised with electrophysological recordings using camera
generated trigger pulses. All imaging analysis considers primary and secondary
neurites and the summed activity of adjacent smaller branches. Due to light scattering
I could not specifically resolve the Ca2+
signal in individual small diameter secondary
and tertiary neurites.
Electrical stimulation of descending connectives
A small bipolar hook electrode was placed under the ipsilateral connective between
the pro- and subesophageal ganglion, and insulated with a mixture of 90% VaselineTM
and 10% paraffin. Stimuli were generated using a Stimulus Isolation Unit (WPI A360
SIU, Stevenage, UK), triggered by a custom built pulse generator.
Pharmacological stimulation
The ganglion was bathed in the muscarinic agonist pilocarpine (10-3
M in saline) for
the entire duration of pharmacological stimulation. Increased motor activity was
commonly observed after 20-30s and persisted until the entire thoracic cavity was
washed in saline.
Data sampling and analysis
Electrophysiological data was digitised at 10kHz using an AD board (MIO 16E4
National Instruments, Austin, Texas) linked to custom built software running under
LabView 5.01 (National Instuments) and analysed in Neurolab (Hedwig and Knepper
1992). Imaging data was first converted in AQM Advance 6 to be read by ImageJ
1.33u (US National Institutes of Health). Grey levels over time could be calculated for

Chapter 4
67
arbitrary regions of interest. Values given are changes in fluorescence relative to
background intensity at that region (ΔF/F). Imaging data was precisely aligned with
electrophysiological data using camera generated TTL pulses for every frame taken.
Further data analysis was performed using MatLab 6.5 (Mathworks, Natick, MA).
RESULTS
We aimed to study the spatio-temporal Ca2+
dynamics in cricket front leg tibial
motoneurons, and link them to their simultaneously measured membrane potential
and muscle activity. I further aimed to analyse the mode of entry and role of free
intracellular Ca2+
, and relate them to both episodic and rhythmical activity patterns of
these motoneurons.
Quality of stainings
We recorded from all five types of front tibial motoneurons: the Fast Extensor Tibia
(FETi, n=6), the Slow Extensor Tibia (SETi, n=22), the Fast Flexor Tibia 1 (FFTi1,
n=8), the group of Fast Flexor Tibia 2-5 (FFTi2-5, n=6), and the group of Slow Flexor
Tibia 1-3 (SFTi1-3, n=9). After staining with Oregon Green BAPTA-1 all primary
and several secondary branches were discernable during in vivo conditions. All
neurons could clearly be identified, but due to light scattering by the superficial tissue
in the light path tertiary neurites could not be individually resolved. The ventral
location of somata meant that these were outside the plane of focus. The optical signal
quality allowed measuring of free intracellular Ca2+
in all main branches without the
need for averaging and also to simultaneously record and manipulate the membrane
potential of the motoneurons.
Ca2+
dynamics during pharmacologically elicited spike activity
All front tibial motoneurons receive excitatory inputs from prothoracic networks. To
characterise and compare the spatio-temporal Ca2+
dynamics within different
motoneurons I therefore elicited motor activity by bathing the ganglion in 10-3
M
pilcocarpine (Ryckebusch and Laurent 1993, Büschges et al. 1995). The intracellular
electrode was withdrawn after staining and the EMG activity was used as a monitor of
the motoneuron spike activity. The structure of SETi is given in Fig.4.1A and a bright
Chapter 4
68
field image of the stained motoneuron in vivo is given in Fig.4.1B. Changes in relative
fluorescence throughout the main neurites of SETi during a burst of spike activity are
shown in Fig.4.1C. Based on each neuron’s morphology I defined three key regions of
interest: the primary neurite (green), the main medial neurite including its tertiary
branches (red) and the other main neurite including tertiary branches (blue)
(Fig.4.1B). Pilocarpine elicited highly irregular bursts of activation in both extensor
and flexor motoneurons which was monitored using an EMG recording of the
extensor tibia muscle (Fig.4.1D). An enlarged burst illustrates how different motor
units could be discriminated in the EMG recording (Fig.4.1E). Motor bursts were
accompanied by Ca2+
elevations that were salient without averaging (Fig.4.1D). The
amplitude of Ca2+
elevations was always highest in the primary neurite and reached
up to 25% fluorescence change, followed by the main posterior neurite exhibiting
slightly higher amplitudes than the main medial neurite. Ca2+
elevations measured in
the axon of all neurons were less than 5% fluorescence change and were not
considered. Ca2+
kinetics were similar in all main neurites, with distinctly faster rise
than decay times (τrise: 185ms; τdecay: 1470ms). This resulted in temporal summation
of Ca2+
levels between bursts occurring in close succession.
Application of pilcoarpine also activated FETi (Fig.4.2A-D) and FFTi1
(Fig.4.2E-H). As in SETi, Ca2+
dynamics in the three regions of interest of each
motoneuron were very similar, and exhibited faster rise than decay times. No
consistent differences in Ca2+
dynamics were observed between different
motoneurons. All time constants of Ca2+
rise ranged between 180 and 215ms, and
time constants of Ca2+
decay ranged between 1400 and 1700ms. Amplitudes of Ca2+
elevations were up to 25% fluorescence change and very similar between the
corresponding branches of all motoneurons. Due to the high variability in motoneuron
activation using pilocarpine I did not perform a statistical analysis of Ca2+
dynamics.
Since the spatio-temporal parameters of changes in free intracellular Ca2+
were very
similar in all motoneurons I present data only from SETi which was easiest to identify
and record from. Only fluorescence changes of the primary neurite are shown for
clarity in most following experiments.
Pharmacologically elicited spike activity gave rise to different ranges of spike
rates in different motoneurons. FETi exhibited lowest spike rates (up to 50Hz,
Fig.4.2D), followed by FFTi1 (up to 100Hz, Fig.4.2H) and SETi (up to 150Hz,
Fig.4.1D). Nonetheless amplitudes of Ca2+
elevations in response to the largest burst

Chapter 4
69
observed in each motoneuron were very similar. This indicated that Ca2+
influx
mechanisms are not matched to spike activity in the same way in every motoneuron.
Ca2+
dynamics during depolarising current injection
Ca2+
in neurons may control secondary currents, such as Ca2+
gated hyperpolarising
K+ currents or Ca
2+ dependent depolarising Ca
2+ or Na
+ currents (McLarnon 1995,
Harris-Warrick 2002, Berridge 1998). Furthermore Ca2+
is a cation and therefore
directly contributes to membrane potential. Spike frequency adaptation or after-
stimulus hyperpolarisation effects can be an indication of the action of Ca2+
on K+
channels, while after-stimulus depolarisations can be an indication of a Ca2+
activated
depolarising current or a significant contribution of free intracellular Ca2+
to
membrane potential (e.g. Viana et al. 1993). I therefore studied possible links between
free intracellular Ca2+
and spike frequency adaptation, after-stimulus
hyperpolarisation or depolarisations (Fig.4.3). Injection of depolarising current pulses
into labelled motoneurons allowed analysing the temporal Ca2+
changes in greater
detail than with pharmacologically elicited motor bursts. A 1s 2nA depolarising
current reliably evoked spikes in SETi (Fig.4.3). In the example presented the time
constant for Ca2+
rise (τrise) in the primary neurite was 205ms while the time constant
for decay (τdecay) was 1630ms. Injection of a 2nA 2.5s hyperpolarising current had no
effect on the Ca2+
level (n=11). Depolarising current injection gave rise to a peak
discharge rate (up to 400Hz) at the beginning of stimulation, followed by a lower near
tonic discharge rate (~150Hz). The initial peak in spike frequency occurred during a
time when Ca2+
was near resting levels. The gradual increase of free intracellular Ca2+
throughout stimulation was not accompanied by a gradual decay in spike rate
indicating that Ca2+
had no significant impact on the frequency of spike generation.
However the rise in Ca2+
levels was accompanied by a gradual spike height reduction.
It is unclear whether Ca2+
contributes to this effect. Although Ca2+
was maximal at
stimulus offset, no effect on membrane potential was obvious. This indicated that any
contribution of Ca2+
, directly or indirectly via Ca2+
dependent secondary currents, to
membrane potential is minimal.
Rhythmical depolarising current injection
Cricket leg motoneurons are rhythmically activated during walking (Laurent and
Richard 1986). Natural stepping rhythms range between 2-5Hz. To investigate the
Chapter 4
70
Ca2+
levels that are likely to occur in front tibial motoneurons during walking I used
rhythmical depolarisation patterns (100ms 2nA pulses at 1,2,3,5Hz) (Fig.4.4A-D,
n=6). This elicited up to 6 spikes per pulse. Even at stimulus repetition rates below
natural stepping patterns (1Hz) Ca2+
did not decay towards baseline levels between
stimuli. Instead, clear Ca2+
summation occurred (Fig.4.4A). This degree of summation
increased for higher pulse repetition rates (Fig.4.4B-D). Above 3Hz stimulation a
Ca2+
plateau level established within 2-4s, with Ca2+
responses to individual current
pulses oscillating around the plateau (Fig.4.4C,D). At these highest depolarisation
rates spike generation frequently failed during the later pulses, without affecting the
Ca2+
responses towards these individual current pulses (Fig.4.4D). However at lower
pulse repetition rates almost no spike frequency adaptation occurred despite strongly
elevated Ca2+
levels (Fig.4.4A-C). At highest Ca2+
elevations (up to 28% fluorescence
change) Ca2+
remained above baseline level for up to 5s after stimulus offset. Even at
these high Ca2+
elevations, no change in membrane potential was obvious after
stimulation.
Stimulation of descending inputs
Extracellular electrical stimulation of descending pathways reliably evokes EPSPs in
all front tibial motoneurons of G. bimaculatus. To investigate Ca2+
responses to
synaptic activation I therefore electrically activated these pathways, while
intracellularly recording membrane potential and optically measuring free
intracellular Ca2+
in SETi (Fig.4.5A, n=4). Extracellular stimuli were sequences of 31
pulses with 2ms duration at 50Hz (total time: 602ms), with an amplitude between 1
and 40 μA. At low amplitude stimulation each pulse gave rise to a single EPSP in
SETi, which summated towards a subthreshold depolarisation (2-4mV) during the
stimulation period (inset 4). Already at this depolarisation level small Ca2+
signals (1-
2% fluorescence change) were elicited (asterisks). Increasing the stimulation
amplitude raised the membrane potential above spike threshold (inset 5). At higher
amplitudes more pulses gave rise to a single action potential (insets 7,9).
The gradual change from subthreshold to suprathreshold responses offered the
chance to determine the role of spike activity in supporting Ca2+
influx. Spike activity
may facilitate the opening of high voltage activated (HVA) Ca2+
channels, giving rise
to an additional Ca2+
elevation. I therefore compared the number of spikes with the
peak elicited Ca2+
level at each stimulation trial (Fig.4.5B). Peak Ca2+
levels followed

Chapter 4
71
the increasing stimulus amplitudes and did not show any supralinear increase with the
first occurrence of spikes. This indicated that the contribution of HVA Ca2+
channels
to the overall Ca2+
signal is small. The kinetics and spatial distribution of free
intracellular Ca2+
changes in response to activation of descending pathways were very
similar to those observed during pharmacological activation.
The mode of Ca2+
entry into motoneurons
Ca2+
may enter the cytosolic phase of neurons through voltage activated channels,
through ligand gated channels and via release from internal stores (Berridge 1998).
Elevated Ca2+
levels in response to depolarising current injection (Figs.4.3, 4.4)
indicated the presence of voltage activated Ca2+
channels. Activation of descending
pathways (Fig.4.5) indicated that any contribution of high voltage activated (HVA)
Ca2+
channels (Hofmann et al. 1994) is probably minimal. However it did not
distinguish between Ca2+
influx through low voltage activated (LVA) Ca2+
channels
(Huguenard 1996) and influx through ligand gated channels opened upon synaptic
activation. I therefore tested the effect of subthreshold depolarisation on Ca2+
elevation. Injection of a 500ms 0.5nA depolarising current gave rise to a distinct Ca2+
elevation despite the absence of spikes (Fig.4.6A, n=6). This strongly pointed towards
the presence of LVA Ca2+
channels.
To test for a mechanism of Ca2+
entry as a direct result of synaptic activation I
stimulated descending pathways during injection of a strong hyperpolarising current
(5nA). Clear Ca2+
elevations in response to activation of these synaptic inputs were
recorded (Fig.4.6B, n=5). Hyperpolarsing current injection was likely to have reduced
activation of voltage-dependent Ca2+
entry mechanisms. This therefore points towards
the existence of a voltage-independent mechanism of Ca2+
entry, such as through
ligand gated channels or via release from intracellular stores.
Ca2+
and post synaptic potentials
Ca2+
in neurons is involved in presynaptic transmission, and frequently also regulates
a multitude of postsynaptic processes ranging from changes in synaptic efficacy to the
activation of local gene translation (Berridge 1998, Bootman et al. 2001, Augustine et
al. 2003). I therefore tested the effect of dendritic Ca2+
on EPSP shapes and sizes. I
continuously stimulated descending pathways with 2ms, 30μA pulses at 10Hz. This
gave rise to large (5-6mV) subthreshold EPSPs in response to each pulse in SETi

Chapter 4
72
while avoiding temporal EPSP summation (Fig.4.7, n=4). This rate of stimulation did
not affect EPSP amplitudes or waveforms, when compared to EPSPs elicited in
isolation (Parker 1995a,b). I then intracellularly applied a 1200ms, 3nA depolarising
current pulse. The elevation of Ca2+
in response to this depolarisation was estimated
based on time constants determined previously (Fig.4.7A, top trace). Accordingly
Ca2+
would have been maximal immediately after the end of depolarising current
injection. I then compared the amplitude and shape of the evoked subthreshold EPSPs
before and immediately after depolarisation. Superimposing EPSPs before and
immediately after current injection revealed no changes in EPSP shapes, amplitudes
or membrane potential between EPSPs (Fig.4.7B). This indicated that postsynaptic
Ca2+
has no effect on synaptic efficacy in this pathway.
Non-spiking interneurons
To compare our measurements of the spatio-temporal Ca2+
dynamics in motoneurons
with other neurons of the motor system, I also recorded from several unidentified
prothoracic non-spiking interneurons (n=6). Such neurons may form part of a
premotor network like in stick insects and locusts (Büschges and Wolf 1995, Wolf
and Büschges 1995) or in cockroaches (Pearson and Fourtner 1975). Classification of
non-spiking interneurons was based on their very large PSPs (up to 12mV), their
absence of any obvious axonal processes and their absence of spikes even during
strong depolarising current injection. Fig.4.8A shows a bright field image of a stained
non-spiking interneuron in the prothoracic ganglion. Fig.4.8B and C show the relative
changes of free intracellular Ca2+
in response to depolarising and hyperpolarising
injection, respectively. As in tibial motoneurons, injection of a depolarising current
(2s, 4nA) gave rise to a spatially uniform elevation in free intracellular Ca2+
of up to
20% fluorescence change in all major processes of the neuron (Fig.4.8B,D). However
injection of a 2s 4nA hyperpolarising current gave rise to a Ca2+
decrease of 15%
fluorescence change below resting levels (Fig.4. 8C,D). A decrease in free
intracellular Ca2+
in response to hyperpolarising current injection was never observed
in any tibial motoneuron (Fig.4.3). At rest the non-spiking interneuron exhibited
frequent large (7-12mV) PSPs (Fig.4.8E). The amplitude of PSPs was reduced during
depolarising current injections (1-5mV) (Fig.4.8F), but increased during
hyperpolarising current injections (up to 50mV) (Fig.4.8G). Bursts of EPSPs could
furthermore be accompanied by clear Ca2+
elevations (Fig.4.8H). These findings are

Chapter 4
73
clearly different from our observations in motoneurons, and highlight the likely
different cellular and molecular processes underlying the distribution and role of Ca2+
in these non-spiking interneurons.
DISCUSSION
We aimed to analyse the spatio-temporal Ca2+
dynamics, mode of entry and the
possible links between the Ca2+
dynamics and electrical activity patterns of Ca2+
in
cricket front tibial motoneurons.
Ca2+
dynamics in motoneurons and non-spiking interneurons
In all five types of tibial motoneurons Ca2+
changes during activation were
remarkably large, reaching up to 28% fluorescence change. Ca2+
dynamics were slow
(τrise: 180-215ms, τdecay: 1400-1700ms) and temporally uniform over all main neurites
(Figs.4.1, 4.2). In contrast, peak Ca2+
elevations in a cricket auditory interneuron,
using the low affinity Ca2+
indicator Calcium Green-5N, reached only up to 20%
fluorescence change, and the dynamics of Ca2+
decay were faster with a time constant
for Ca2+
decay of 237-1265ms, depending on the neurite (Baden and Hedwig 2007).
The use of the high affinity Ca2+
indicator Oregon Green BAPTA-1 may have
introduced additional chelating artifacts, therefore in particular the natural decay time
constants may be smaller than observed. I judge this effect as small, as care was taken
not to overload motoneurons with the dye (see also Ch3. “Methodological
considerations”). Within the sensitivity limits of our optical recording system, there
was no difference in the Ca2+
dynamics occurring within motoneurons in response to
either depolarising current injection or synaptic activation via prothoracic or
descending pathways. Furthermore between the five different groups of motoneurons
no clear differences in their Ca2+
dynamics were observed. However, I cannot exclude
the possibility that potentially different Ca2+
changes in tertiary neurites may occur,
that could not be resolved by our system (Kloppenenburg et al. 2000).
In both tibial motoneurons and in non-spiking interneurons depolarising
current injection gave rise to a prolonged uniform elevation of free intracellular Ca2+
.
However only in non-spiking interneurons hyperpolarising current injection resulted
in a Ca2+
decrease below resting levels (Fig.4.8A). A decrease in Ca2+
below resting

Chapter 4
74
levels has been reported upon inhibitory synaptic activation in fly visual interneurons
(Single and Borst 1998) and in the cricket Omega Neuron-1 (Baden and Hedwig
2007). The Ca2+
decrease in these latter neurons was small compared to their Ca2+
elevation levels during activation. However in non-spiking neurons recorded in this
study, the decrease in Ca2+
upon 2nA hyperpolarising current injection was almost as
pronounced as the increase in Ca2+
towards 2nA depolarising current injection. This
implies that Ca2+
levels are maintained at high resting level in these neurons. In leech
heart interneurons large uniform Ca2+
elevations drive graded synaptic transmission
(Ivanov and Calabrese 2000,2003,2006). It is possible that Ca2+
in cricket non-spiking
interneurons may underlie similar processes.
The mode of Ca2+
entry
Ca2+
may enter neurons by three main, non exclusive mechanisms (Berridge 1998):
(1) entry though voltage activated Ca2+
channels, (2) entry through ligand gated Ca2+
channels, and (3) via release from intracellular stores. Furthermore a 4th
mechanism,
via voltage dependent G-protein mediated release from intracellular stores, has
recently been suggested (Ryglewski et al. 2007). Both suprathreshold (Fig.4.3, 4.4)
and subthreshold (Fig.4.6A) depolarising current injections resulted in clear Ca2+
elevations in all main neurites. This demonstrates the existence of either LVA Ca2+
channels (membrane potential at which 50% of channels are open (V½) =-60 to -
20mV, Huguenard 1996), or a voltage dependent G-protein mediated mechanism
(V½=-44mV Ryglewski et al. 2007). Through the use of either LVA or HVA Ca2+
channels the neuron’s electrical activity directly drives the level of free intracellular
Ca2+
, giving rise to the observed spatially uniform dendritic Ca2+
dynamics (Ivanov
and Calabrese 2000). It remains to be established whether HVA Ca2+
channels
(Hofmann et al. 1994) coexist with either of the latter mechanisms as in the somata of
cockroach Dorsal Unpaired Median (DUM) cells (Grolleau and Lapied 1996), in
leech heart interneurons (Angstadt and Calabrese 1991, Ivanov and Calabrese 2000)
and in rat spinal motoneurons (Viana et al. 1997). Without the use of selective
channel blockers and patch clamp techniques the presence of HVA channels is
difficult to test for directly in tibial motoneurons. However two of our findings argue
against a major contribution from HVA Ca2+
channels towards the overall Ca2+
level.
Firstly, even when no spikes were elicited during rhythmical depolarising current
injections the amplitude of Ca2+
increases to individual pulses was unaffected
Chapter 4
75
(Fig.4.4D). However, I cannot exclude the possibility that injection of the
depolarising current alone may have opened HVA Ca2+
channels. Secondly and more
importantly, HVA channels are gated by spike activity, and therefore give rise to a
Ca2+
influx whenever the neuron generates spikes. However, gradual increasing EPSP
amplitudes upon stimulation of the descending pathways did not give rise to any
supralinear increase of Ca2+
signals when the first spikes were elicited (Fig.4.5B).
Interestingly, Ca2+
elevations in leech heart interneurons are, as in tibial motoneurons,
remarkably uniform throughout all main neurites, and are primarily driven by LVA
Ca2+
currents (Ivanov and Calabrese 2000,2003,2006).
FETi discharge rates rarely exceed 50Hz but SETi discharges at up to 150Hz.
With a high contribution of HVA channels to the overall Ca2+
influx this difference in
spike rates would cause higher elevations in free intracellular Ca2+
in SETi because it
generates more spikes than FETi. I observed Ca2+
elevations of similar amplitude in
response to the largest motor bursts of each motoneuron, independent of the
respective spike rate (Figs.4.1, 4.2). Through a strong contribution of LVA, rather
than HVA channels towards dendritic Ca2+
levels these motoneurons may therefore
match their dynamic range of Ca2+
elevations to their levels of graded depolarisation
rather than spike frequency.
The activation of both subthreshold and supratheshold synaptic inputs also gave rise
to Ca2+
elevations throughout the entire dendritic tree of the neurons (Figs.4.5, 4.6B).
A small proportion of this influx in Ca2+
remained when a strong hyperpolarising
current (5nA) was injected (Fig.4.6B). The hyperpolarisation was likely to minimise
Ca2+
influx via depolarisation activated mechanisms. Any remaining Ca2+
influx was
therefore most likely the direct result of synaptic activation. Both voltage dependent
as well as voltage independent mechanisms of Ca2+
entry may therefore exist
throughout the dendrites of motoneurons. Single and Borst (2002) report a neurite
specific separation of Ca2+
channel types between the area of tertiary neurites and the
larger secondary and primary neurites in fly vertial motion-sensitive neurons: while
all neurites contained voltage activated Ca2+
channels only the smallest neurites
showed evidence for an additional voltage independent mechanisms of Ca2+
entry.
The voltage independent mechanism of Ca2+
entry points towards either a
direct influx of Ca2+
through ligand gated Ca2+
channels, or an indirect effect via
synaptically activated release of Ca2+
from intracellular stores. I did not distinguish

Chapter 4
76
between these two options, for example by using blockers of inositol-3-phosphate
receptors (IP3R) or ryanodine receptors (RYR) (Berridge 1998, Bootman et al. 2001).
This was due to the inherent difficulty to selectively apply pharmacological blockers
only to the recorded cell during in vivo conditions. This also prevented us from
attempting selective pharmacological inactivation of HVA or LVA Ca2+
channels in
order to determine the contribution of either mechanism to the overall Ca2+
level of
tibial motoneurons in more detail. Furthermore bath application of selective channel
blockers would have required large quantities of expensive pharmacological agents.
The role of Ca2+
in motoneurons
Ca2+
in neurons may have many different effectors involved in signal processing, cell
gene transcription and translation, homeostasis regulation or apoptosis (Berridge
1998, Bootman et al. 2001, Augustine et al. 2003, London and Häusser 2005).
Common roles for Ca2+
in neuronal signal processing include activation of secondary
currents (Sah and McLachlan 1992, Sobel and Tank 1994, McLarnon 1995, Sah and
Faber 2002), direct contribution to membrane potential (Viana et al. 1993,
Hounsgaard and Kiehn 1993, London and Häusser 2005) or the regulation of synaptic
inputs and outputs (Ogawa et al. 2001, Augustine et al. 2003). Following depolarising
current injection or stimulation of descending synaptic inputs, the membrane potential
of cricket tibial motoneurons returned to its resting level within less than 10ms, while
Ca2+
could remain elevated for several seconds (Figs. 4.3, 4.4, 4.7). In contrast to Ca2+
in several vertebrate motoneurons (Sah and McLachlan 1992, Hounsgaard and Kiehn
1993) this strongly argues against the existence of Ca2+
activated secondary currents
that may have any effect on membrane potential in cricket tibial motoneurons. This is
further supported by the very weak spike frequency adaptation in response to
continuous or low frequency repetitive stimulation (Figs. 4.3, 4.4). During fast (5Hz)
repetitive depolarisation (Fig.4.4D) spike generation frequently failed in response to
individual pulses. While I cannot explain this spike failure, it is unlikely to be directly
related to the elevated Ca2+
level: spike generation does not reliably fail as a function
of Ca2+
elevations. During 5Hz stimulation some pulses do give rise to spikes
(Fig.4.5D), and during 3Hz stimulation (Fig.4.5C) Ca2+
levels are only slightly lower
(3Hz: ~25%; 5Hz ~28% fluorescence change) but spike failure never occurred.
As Ca2+
is a divalent cation it also directly contributes to membrane
potential. This effect is particularly important in neurons where Ca2+
spikes occur

Chapter 4
77
(e.g. Hounsgaard and Kiehn 1993). These are usually broader than Na+ spikes, and
therefore easily identified in intracellular recordings. No Ca2+
spikes occurred in tibial
motoneurons, and no gradual depolarisation correlated with Ca+ elevations, indicating
that the direct contribution of Ca2+
to membrane potential is low.
Another common effect of free intracellular Ca2+
in neurons is to regulate the
efficacy of synapses (Berridge 1998, Augustine et al. 2003) through both pre- and
postsynaptic mechanisms. Ogawa et al. (2001) for example demonstrated neurite
specific Ca2+
controlled synaptic depression in the giant cercal interneuron of the
cricket. Similarly, in locust the EPSP amplitude in hind tibial flexor motoneurons in
response to antagonist motoneuron activation was dependent on the level of
postsynaptic Ca2+
(Parker 1995a,b). Dendrites of cricket tibial motoneurons receive
sensory, descending as well as local prothoracic synaptic inputs. I therefore tested
whether the elevated Ca2+
immediately after strong depolarising current injection
affected the amplitude of subthreshold EPSPs evoked by descending excitatory
synaptic inputs. There was no effect, arguing against Ca2+
affecting synapses of this
particular pathway at the postsynaptic site.
Ca2+
in motoneurons during behaviour
Tibial motoneurons are activated in two fundamentally different contexts: during
episodic leg movements or continuously during walking. As a result of the low
preceding electrical activity episodic leg movements will most often occur during a
time when Ca2+
levels within the tibial motoneurons are at resting levels. However,
due to the slow kinetics of Ca2+
decay repetitive motoneuron activation as during
walking will maintain the Ca2+
level elevated (Fig.4.4). This implies that these
motoneurons operate in two fundamentally different functional states as defined by
the overall level of free intracellular Ca2+
. Similarly lamprey spinal motoneurons
(Bacskai et al. 1995) and an auditory interneuron of the cricket, the Omega Neuron-1
(Sobel and Tank 1994, Baden and Hedwig 2007) maintain elevated Ca2+
levels during
continuous stimulation. In the cricket Omega Neuron-1 Ca2+
elevations in response to
acoustic stimulation functions as a noise filter through a Ca2+
activated
hyperpolarising current (Pollack 1988, Sobel and Tank 1994, Baden and Hedwig
2007). This is quite different from our findings in cricket tibial motoneurons where
Ca2+
had no obvious effect on activity patterns, synaptic inputs or membrane
potential. Activation patterns of motoneurons controlling limb movements are some

Chapter 4
78
of the most diverse in neurons. Short, unique bursts of activity, as required for
example for scratching or grasping/reaching must be supported as well as highly
repetitive, stereotype movements during locomotion. It may therefore be highly
desirable for motoneurons controlling limb movements to always remain unadapted.
The independence of motoneuron spike activity from dendritic Ca2+
levels may
support permanent functional readiness.
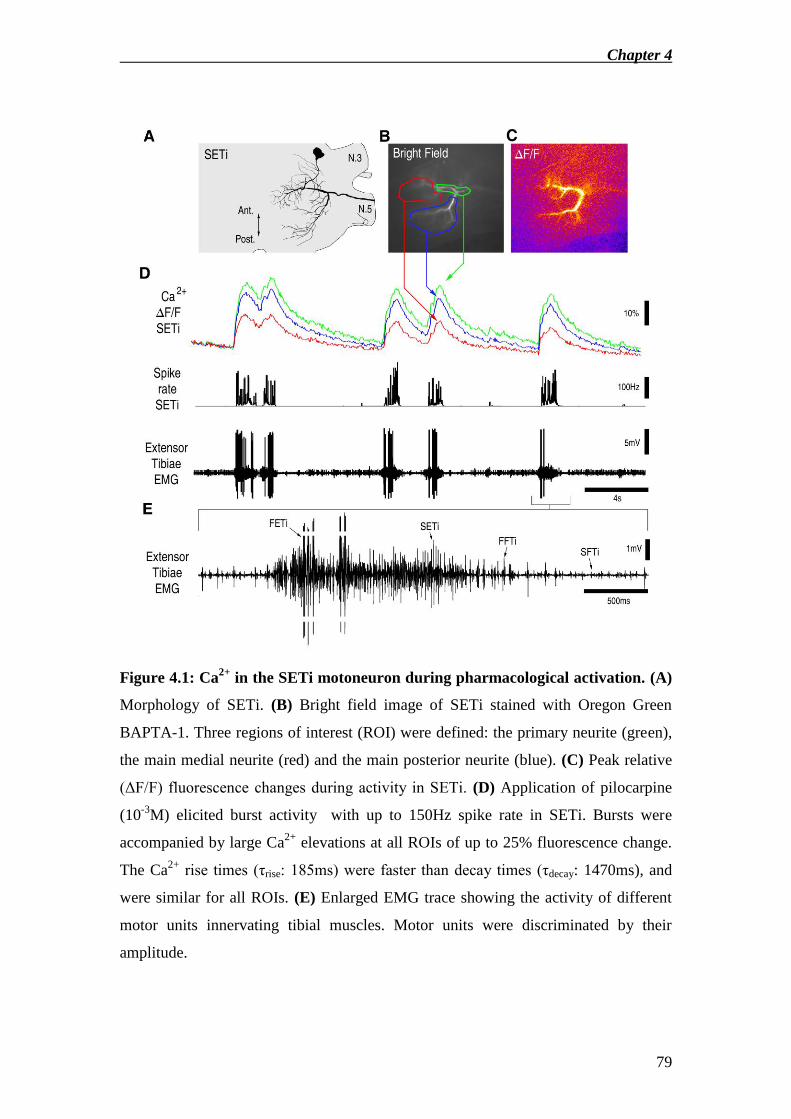
Chapter 4
79
Figure 4.1: Ca2+
in the SETi motoneuron during pharmacological activation. (A)
Morphology of SETi. (B) Bright field image of SETi stained with Oregon Green
BAPTA-1. Three regions of interest (ROI) were defined: the primary neurite (green),
the main medial neurite (red) and the main posterior neurite (blue). (C) Peak relative
(ΔF/F) fluorescence changes during activity in SETi. (D) Application of pilocarpine
(10-3
M) elicited burst activity with up to 150Hz spike rate in SETi. Bursts were
accompanied by large Ca2+
elevations at all ROIs of up to 25% fluorescence change.
The Ca2+
rise times (τrise: 185ms) were faster than decay times (τdecay: 1470ms), and
were similar for all ROIs. (E) Enlarged EMG trace showing the activity of different
motor units innervating tibial muscles. Motor units were discriminated by their
amplitude.

Chapter 4
80
Figure 4.2: Ca2+
in the FETi and FFTi1 motoneurons during pharmacological
activation. (A) Morphology, (B) bright field image and (C) relative fluorescence
changes during activity of the FETi motoneuron. Three ROIs were defined
corresponding to those used for SETi. (D) Burst activity with up to 50Hz in FETi was
accompanied by up to 25% fluorescence change Ca2+
elevations, which were
temporally uniform across all ROI. (E) Morphology, (F) bright field image and (G)
relative fluorescence changes during activity of the FFTi1 motoneuron. ROI were
defined as indicated in F. Ca2+
amplitudes and kinetics during pharmacologically
elicited motor activity were similar to both SETi and FETi. FFTi Burst spike rates
reached up to 100Hz.

Chapter 4
81
Figure 4.3: Ca2+
during current injection. Injection of a 1s 2nA depolarising
current evoked spike activity in SETi. Ca2+
at the primary neurite gradually increased
towards 30% fluorescence change (τrise: 185ms), and decreased towards resting levels
after stimulation (τdecay: 1630ms). Injection of a 2.5s 2nA hyperpolarising current had
no effect on the Ca2+
level.
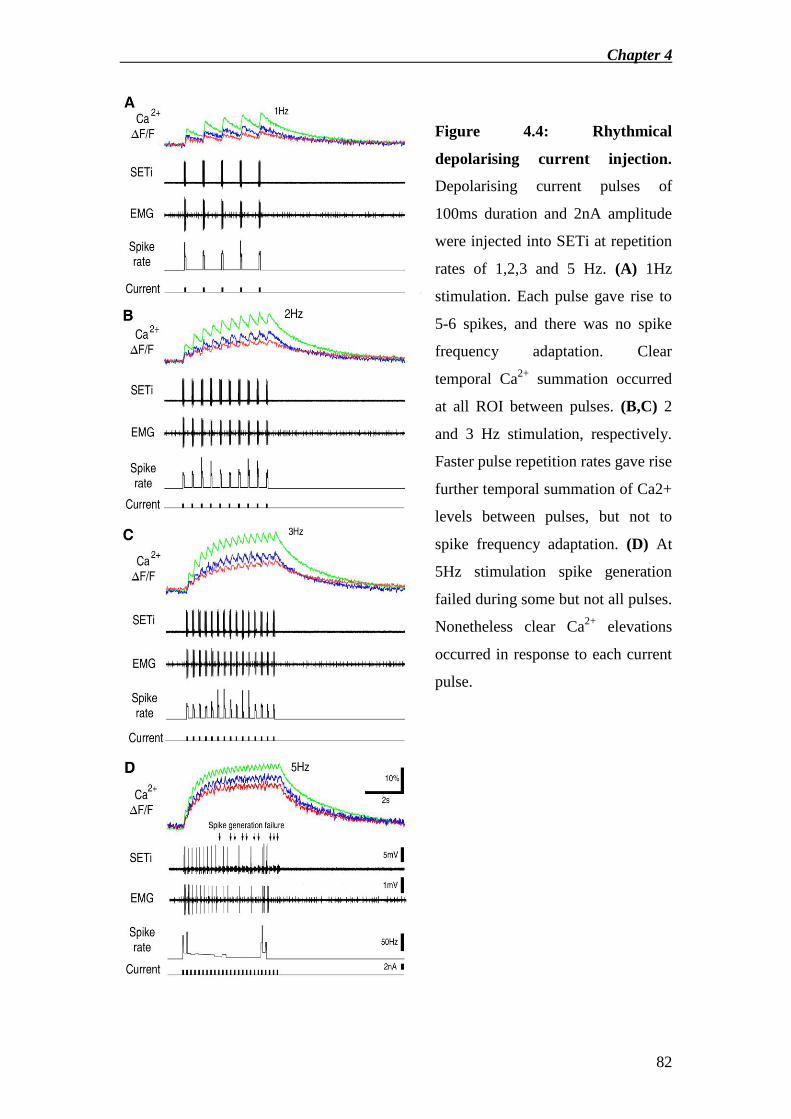
Chapter 4
82
Figure 4.4: Rhythmical
depolarising current injection.
Depolarising current pulses of
100ms duration and 2nA amplitude
were injected into SETi at repetition
rates of 1,2,3 and 5 Hz. (A) 1Hz
stimulation. Each pulse gave rise to
5-6 spikes, and there was no spike
frequency adaptation. Clear
temporal Ca2+
summation occurred
at all ROI between pulses. (B,C) 2
and 3 Hz stimulation, respectively.
Faster pulse repetition rates gave rise
further temporal summation of Ca2+
levels between pulses, but not to
spike frequency adaptation. (D) At
5Hz stimulation spike generation
failed during some but not all pulses.
Nonetheless clear Ca2+
elevations
occurred in response to each current
pulse.

Chapter 4
83
Figure 4.5: Ca2+
and descending synaptic inputs. Descending pathways were
electrically stimulated using a hook electrode. Series of 2ms 1-40μA pulses were
applied at 50Hz repetition rate over 602ms (31 pulses). (A) Increasing stimulation
amplitude elicited first only EPSPs and then also spikes in SETi (insets 4,5,7,9), and
gave rise to Ca2+
elevations of increasing amplitude. Clear Ca2+
elevations occurred
even in the absence of spike activity (asterisks; inset 4). Stimulation artifacts were cut
off for clarity in the insets. (B) Peak Ca2+
elevations and spike number in response to
each stimulation series. Ca2+
levels linearly increased with stimulation amplitude.
There was no supralinear Ca2+
elevation with the occurrence of spikes.

Chapter 4
84
Figure 4.6: The mode of Ca2+
entry. (A) Injection of a 0.5nA subthreshold
depolarising current into SETi gave rise to a clear Ca2+
elevation (3% fluorescence
change) at all ROI, indicating the presence of LVA Ca2+
channels. (B) Stimulation of
descending pathways during 5nA hyperpolarising current injection gave rise to a
small (1.5% fluorescence change) elevation of Ca2+
in SETi. This points towards the
presence of a voltage independent mechanism of Ca2+
entry. Artifacts due to
descending pathway stimulation are shaded grey for clarity.
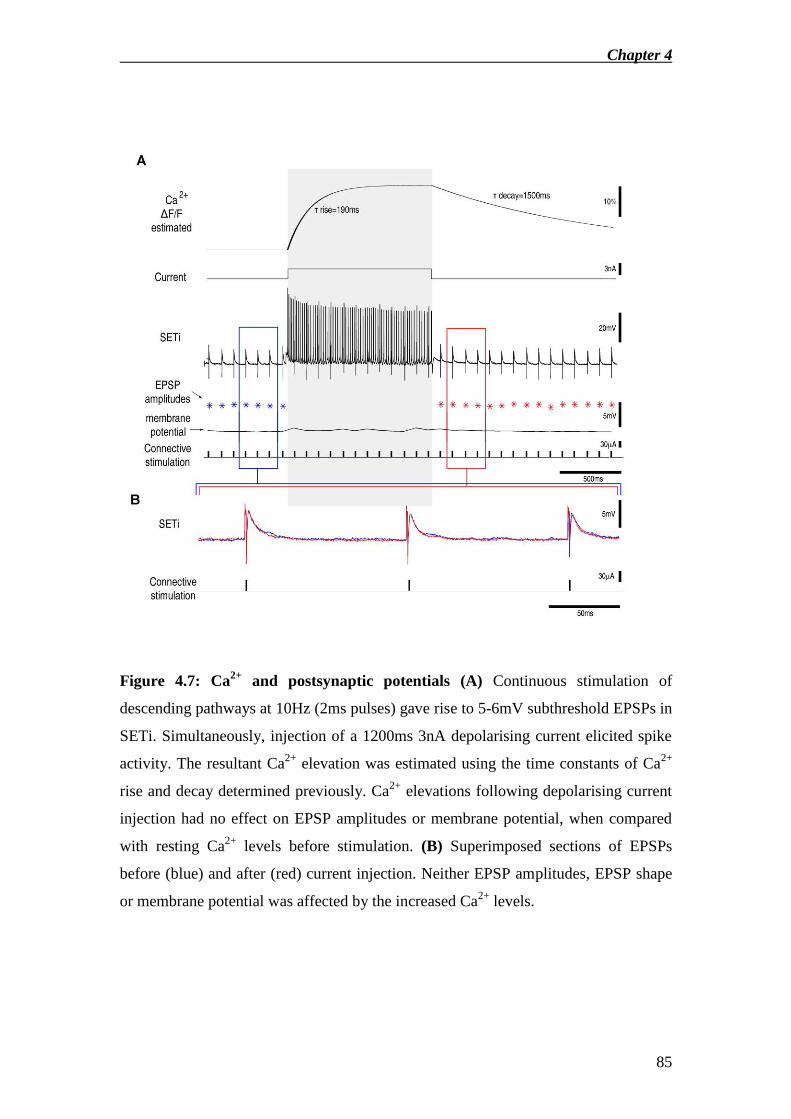
Chapter 4
85
Figure 4.7: Ca2+
and postsynaptic potentials (A) Continuous stimulation of
descending pathways at 10Hz (2ms pulses) gave rise to 5-6mV subthreshold EPSPs in
SETi. Simultaneously, injection of a 1200ms 3nA depolarising current elicited spike
activity. The resultant Ca2+
elevation was estimated using the time constants of Ca2+
rise and decay determined previously. Ca2+
elevations following depolarising current
injection had no effect on EPSP amplitudes or membrane potential, when compared
with resting Ca2+
levels before stimulation. (B) Superimposed sections of EPSPs
before (blue) and after (red) current injection. Neither EPSP amplitudes, EPSP shape
or membrane potential was affected by the increased Ca2+
levels.

Chapter 4
86
Figure 4.8: Ca2+
in a non-spiking interneuron. (A) Bright field image of the stained
interneuron. The dye-filled microelectrode obscures the top right quadrant. (B)
Relative Ca2+
changes during depolarising and (C) hyperpolarising current injection.
(D) Ca2+
changes and membrane potential. The neuron exhibited frequent post
synaptic potentials (PSP) at rest. During 2s 4nA depolarising current injection Ca2+
levels increased by 20% fluorescence change throughout all main neurites, and PSP
amplitudes were reduced. In contrast 2s 4nA hyperpolarising current injection
resulted in a large decrease in Ca2+
levels below resting levels of 15% fluorescence
change, and increased PSP amplitudes. (E) Enlarged sections of intracellular
recordings during resting, (F) depolarised and (G) hyperpolarised membrane
potentials. (H) An isolated burst of EPSPs is correlated with a transient Ca2+
elevation.

Chapter 5
87
CHAPTER 5: GENERAL DISCUSSION
Background
Information processing in any nervous system is dependent upon the internal
processing of each individual neuron. Moreover, neurons are adapted to their role
within the nervous system. Some principles of neuronal function, such as the use of
Na+ and K
+ as primary charge carriers in signal propagation, are universal. Other
principles, such as the employment of Ca2+
controlled hyperpolarising currents, are
common, but not universal (Sah and McLachlan 1992, Sobel and Tank 1994, Sah and
Faber 2002). In evolving its specific processing principles any one neuron is open for
task specific adaptations through a vast array of morphological, biochemical or
electrical building blocks (Berridge 1998, Bootman et al. 2001, Augustine et al. 2003,
London and Häusser 2005). To understand the function of any neuronal network we
therefore need to study the principles of information processing of each of their
individual neuronal elements.
I studied the signal processing of individual neurons within the neuronal
network underlying cricket phonotactic behaviour (Wohlers and Huber 1978, Pollack
and Hoy 1980, Schildberger et al. 1989, Horseman and Huber 1994, Pollack 2001,
Hedwig and Poulet 2005). I analysed how individually identifiable neurons of this
network are adapted to their role in generating the behaviour, and how the specific
processing requirements of each neuron are met by its intracellular signalling
machinery. I optically imaged free intracellular Ca2+
while simultaneously
intracellularly recording and manipulating membrane potential.
I compared two fundamentally different neuron types of the neuronal network
underlying auditory steering: the Omega Neurons-1 (ON1) are first order auditory
interneurons, and are therefore located at an early stage of the auditory-to-motor
pathway (Wohlers and Huber 1978, Wiese and Eilts 1985). In contrast, the tibial
extensor and flexor motoneurons are the final neuronal elements of the network,
conveying the steering motor output.

Chapter 5
88
Front tibial movements and motoneurons underlie phonotactic steering
Phonotactically orienting crickets perform rapid steering movements with a latency of
55-60ms after sound presentation (Hedwig and Poulet 2004, 2005). These steering
movements only occur during phonotaxis, elicited by presentation of species specific
song. Once in a phonotactically responsive state, crickets also steer towards
unattractive sounds interspersed into the calling song (Poulet and Hedwig 2005). A
direct auditory-to-motor loop may therefore exist, gated or controlled by a pattern
recognition system for song. Such a system may be located in the brain (Pollack and
Hoy 1980, Schildberger 1984). However the location of the gating and the auditory
pathway towards these motoneurons remain unclear.
Steering during walking in insects can be achieved through asymmetrical
positioning and movements of the front legs (Dürr and Ebeling 2005, Rosano and
Webb 2007). To identify motoneurons underlying auditory steering I therefore
investigated front leg movement patterns during phonotaxis. This pointed towards the
importance of tibial extension and flexion movements in the control of auditory
steering. Using EMG recordings I demonstrated auditory responses in the front tibial
muscles. This was only present during phonotaxis giving support to the idea of a
phonotaxis dependent auditory-to-motor pathway. The latency of 35-40ms at this
level points towards a cephalic pathway for sound inputs to the motor system. Several
descending brain neurons that respond to sound and terminate dorsally in all thoracic
ganglia are known (Staudacher 2001). These may connect to tibial motoneurons:
extracellular stimulation of the connectives between the pro- and subesophageal
ganglia during intracellular recordings of tibial motoneuons indicated a direct
polyneural descending input. A possible auditory-to-motor loop via the brain is
summarised in Fig.5.1. The model represents a sequential signal propagation pathway
from the auditory afferents via 3 interneuron classes onto tibial motoneurons. This
system would allow for the sound reflex-like tibial movements observed at the
behavioural level (Pollack and Hoy 1980, Hedwig and Poulet 2004, 2005). A pattern
recognition system may operate in parallel to this pathway, modulating its gain
depending on the pattern of the incoming sounds.

Chapter 5
89
Activity patterns of the Omega Neurons-1 and tibial motoneurons
Following the identification of a neuronal output pathway for phonotactic steering I
compared the roles and functional adaptations of front tibial motoneurons with those
of ON1. Both types of neurons are activated rhythmically during phonotactic steering,
however due to different reasons. Activity patterns of ON1 during phonotaxis convey
the temporal pattern of the calling song. The frequency tuning of ON1 is matched to
the carrier frequency of the calling song. Furthermore auditory activity evoked by
environmental noise is suppressed, while activity associated with song is enhanced
(Pollack 1988). In contrast rhythmical activity of tibial motoneurons during walking is
driven by central motor networks. During phonotactic steering, auditory information
from the calling song is integrated with the step rhythm. Tibial motoneurons should
therefore retain responsiveness to auditory synaptic inputs during walking. I obtained
intracellular recordings of ON1 and tibial motoneurons while simultaneously imaging
their level and distribution of free intracellular Ca2+
. By relating the spatio-temporal
distribution of cytosolic Ca2+
upon neuronal activation to changes in membrane
potential I studied their individual response properties at a cellular and sub-cellular
level.
Ca2+
and electrical activity in inter- and motoneurons
Neurons have several sub-cellular compartments. The soma harbours the nucleus of
the cell. In insects it typically plays only a passive role in electrical signal processing.
The dendrites are predominantly postsynaptic elements, while the axonal terminals
mainly form presynaptic sites. Spiking neurons contain at least one spike generating
zone, as well as an axon to actively propagate spikes towards the axonal terminals.
This subdivision of function is common to both ON1 as well as tibial motoneurons. I
will therefore compare the specific processing and adaptations at each of these sub-
neuronal sites in these neurons.
Dendrites
In both vertebrate and invertebrate neurons dendritic Ca2+
levels are driven by a
plethora of different Ca2+
influx mechanisms (Trimmer and Rhodes 2004). Global
Ca2+
elevations, neuronal Ca2+
waves (Nakamura et al. 1999, 2000) or highly

Chapter 5
90
localised hot spots of Ca2+
concentration (Kloppenburg et al. 2000) may occur
throughout dendrites. Similarly, the scope of Ca2+
effectors leading to dendritic
integration and signal refinement towards spike generation is vast. Postsynaptic
regulation of synaptic efficacy, activation of neurite specific secondary currents or a
support of backpropagating action potentials are but a few examples of Ca2+
mediated
dendritic processing principles (London and Häusser 2005). I will first consider
dendritic Ca2+
dynamics driven by synaptic activation. I will then discuss mechanisms
of voltage activated Ca2+
influx and their functional consequences in both types of
neurons. Finally I will consider the impact of dendritic Ca2+
levels on spike
generation.
Dendritic Ca2+
and synaptic activation
Synaptic inputs to the main dendrite of ON1 are tonotopically organised. Low
frequency inputs predominately activated the medial dendrites of ON1, while high
frequency predominately activated lateral branches. Assuming a passive electrical
signal propagation properties of the dendrites this may bear important consequences
for weighting of synaptic inputs towards spike generation. As the spike generating
zone of ON1 is located medially low frequency inputs may have a stronger impact on
spike generation than high frequency inputs. Consequently the output tuning of ON1,
as represented in the spike pattern as well as the Ca2+
response at the axonal terminals,
is a weighted average of synaptic inputs from all auditory afferents, biased towards
low frequency components. The high frequency inputs are underrepresented in the
neuron’s output, but may support the extraction of timing information.
Like ON1, tibial motoneurons receive excitatory synaptic inputs from different
sources: local inputs from central pattern generating networks are integrated with
descending inputs as well as inputs from sensory neurons of the innervated leg.
However selective activation of no one individual input pathway gave rise to
detectable spatial differences in activation patterns along the dendrites of individual
motoneurons. This may be due to two non-exclusive reasons. Tibial motoneurons are
the output channels of complex computations performed by the nervous system –
sources of synaptic inputs may therefore more distributed in space, lacking the simple
tonotopic organisation of auditory afferent terminals (Römer 1983, Imaizumi and
Pollack 2005). Furthermore the prominent low voltage gated Ca2+
currents of these
motoneurons will spatially distort any localised Ca2+
elevations.

Chapter 5
91
In addition to excitatory inputs from auditory afferents, each ON1 receives inhibitory
inputs from its mirror image partner (Selverston et al. 1985). This offered the
opportunity to study the interplay of inhibitory and excitatory synaptic inputs in this
neuron. Presentation of a contralateral sound during ipsilateral auditory stimulation
gave rise to a drop in Ca2+
levels in both axonal and dendritic compartments. This
indicates that inhibitory terminals of the contralateral neuron synapse onto the
dendritic compartment, as suggested by the morphology of the neurons (Wohlers and
Huber 1982). It is not clear whether the reduced Ca2+
levels in the axonal terminals
are a result of the drop in spike rate or due to direct inhibition at this site. Following
removal of all ipsilateral inputs through cutting the ipsilateral front leg Ca2+
levels
increased in axonal terminals in response to contralateral acoustic stimulation, but
decreased in the dendritic compartment. The Ca2+
elevations in axonal terminals could
either be indicative of a local excitatory inputs from contralateral sensory auditory or
vibration sensitive systems (Wiese and Eilts 1981), or be the result of a presynaptic
inhibition, mediated by output synapses of the dendritic compartments of the
contralateral ON1 (Watson and Hardt 1996).
As postsynaptic Ca2+
frequently regulates synaptic efficacy Ca2+
influx driven by
synaptic activation is a powerful tool to locally affect synaptic transmission. Such
effects range from the millisecond range, for example mediated via Ca2+
controlled
phosphorilation or dephosphorilation of synaptic receptor proteins (Zucker and
Regehr 2002), to hours or even days such as during long term potentiation (LTP) or
depression (LTD) (Takagi 2000, Hartmann and Konnerth 2005, Kullmann and Lamsa
2007). In the giant cercal interneuron of the cricket a dendrite specific synaptic
depression occurs due to local Ca2+
influx (Ogawa et al. 2001).
Both ON1 and tibial motoneurons exhibit Ca2+
elevations as a result of synaptic
activation. However I did not find any evidence of postsynaptic Ca2+
affecting
synaptic efficacy in either type of neuron. Subthreshold stimulation of descending
pathways reliably evoked EPSPs in tibial motoneurons. Depolarising current injection
was used to elevate dendritic Ca2+
levels. However, this had no effect on EPSP
amplitude nor shape.
In both neuron types the contribution towards the overall Ca2+
level directly
through synaptic activation route is small compared to the contribution via voltage

Chapter 5
92
activated mechanisms of Ca2+
influx. In particular for ON1 this may be important
during prolonged presentation of species specific song: a synapse specific synaptic
depression as a result of continuous synaptic activation would shift the frequency
tuning of ON1 towards high frequency inputs when exposed to low frequency
stimulation of species specific song, as this would selectively attenuate synaptic
inputs from low frequency coding auditory afferents.
Dendritic Ca2+
and membrane potential
Dendritic Ca2+
levels are often driven by voltage activated Ca2+
currents (Harris-
Warrick 2002). Ca2+
influx through voltage activated Ca2+
channels gave rise to large
Ca2+
elevations during neuronal activity in the dendrites of both ON1 and tibial
motoneurons. The speed of the passive spread of electrical current throughout the
neurites of neurons far exceeds the speed of diffusion of free intracellular Ca2+
(Koch
1984, Huguenard 1996, Harris-Warrick 2002). Through a uniform expression of
voltage activated Ca2+
channels throughout the dendritic tree of a neuron a spatio-
temporally uniform control over global dendritic Ca2+
levels can be achieved
(Trimmer and Rhodes 2004). The highly uniform Ca2+
elevations observed through
dendrites of tibial motoneurons are indicative of such a principle. Global Ca2+
elevations may synchronise Ca2+
mediated events across different neurites.
Voltage activated currents may be divided into high voltage activated (HVA)
and low voltage activated (LVA) currents (Hofmann et al. 1994, Huguenard 1996,
Trimmer and Rhodes 2004). While HVA currents generate Ca2+
elevations driven by
spike activity, LVA currents allow Ca2+
entry already at subthreshold depolarisation,
and are largely independent of spike generation. The dendrites of many neurons
support both HVA and LVA Ca2+
currents (Huguenard 1994, Hofmann et al. 1994).
For example Ca2+
dynamics in leech heart interneurons are heavily dependent on
LVA Ca2+
channels, but also exhibit a smaller contribution to dendritic Ca2+
levels
through HVA channels (Ivanov and Calabrese 2000). Here LVA Ca2+
channels allow
Ca2+
levels to follow membrane potential in a graded fashion, giving rise to graded
activation of synaptic output, while the additional Ca2+
influx through HVA channels
supports synaptic activation during spike activity (Ivanov and Calabrese 2003, 2006).
Dendritic Ca2+
elevations in response to backpropagating spikes in many vertebrate
neurons are driven by LVA Ca2+
currents (Eilers and Konnerth 2007). A co-
expression of HVA and LVA channels can also be important in shaping the waveform

Chapter 5
93
of action potentials (Bean 2007). In rat hypoglossal motoneurons for example Ca2+
influx through HVA Ca2+
channels gives rise to spike after-hyperpolarisaion through
activation of a K+ current, while LVA Ca
2+ currents are responsible for spike
afterdepolarisation (Umemiya and Berger 1994).
A choice over the expression of HVA or LVA Ca2+
channels provides a
powerful processing tool as also illustrated on the examples of the ON1 versus tibial
motoneurons. While ON1 dendritic Ca2+
levels are likely to be predominately driven
by HVA Ca2+
currents, Ca2+
levels in the dendritic compartments of tibial
motoneurons are probably driven by LVA Ca2+
currents. Accordingly Ca2+
levels in
ON1 dendrites are spike-rate dependent, but Ca2+
levels in tibial motoneuron
dendrites are largely spike-rate independent. As a result the peaks in ON1 spike rates
at each sound onset (Nabatiyan et al. 2003) may be a highly effective means to drive
and maintain high Ca2+
levels when listening to the species specific song. In contrast a
stronger contribution to Ca2+
levels by LVA Ca2+
currents in tibial motoneurons may
allow matching the dynamic range of Ca2+
elevations to the degree of depolarising
inputs to each motoneuron, rather than its spike rate. This is important as the different
types of motoneurons exhibit similar graded depolarisations but highly different spike
rates during behaviour.
Spike generation
Spiking neurons translate the amplitude of graded depolarisations into a temporal
code of spikes. Spike generation occurs at areas of particularly low spike threshold
within the neuron, and is commonly based on a local high concentration of voltage
gated Na+ channels (Wollner and Catterall 1986, Safronov 1998). Such areas are
associated with the axon hillock in vertebrates, but can occur throughout all areas of
neurons (e.g.: Zecević 1996). In insect neurons the spike generating zones are
commonly located at junctions between dendritic and axonal compartments. The level
of free intracellular Ca2+
can affect spike generation directly, or via the activation of
Ca2+
dependent secondary currents (Berridge 1998, Augustine et al. 2003, London
and Häusser 2005).
The Ca2+
dynamics in the dendrites of tibial motoneurons are uniform
throughout all primary and secondary branches. In contrast Ca2+
dynamics at the spike
generating zone in ON1 are much slower than in any of the neighbouring dendrites.
Chapter 5
94
Interestingly the time constant of Ca2+
decay following elevations in the dendrites of
tibial motoneuron is much slower than in the dendrites of ON1, but is similar to that
of the spike generating zone of ON1. While it is unclear where exactly the spike
generating zone is in tibial motoneurons, its location is likely to coincide with at least
part of the larger dendrites (Gwilliam and Burrows 1980). Therefore, despite the
different Ca2+
dynamics in the dendrites of both types of neurons, the Ca2+
dynamics
at the spike generating zones in both neurons are probably very similar. In general the
level of Ca2+
at the spike generating zone is particularly important as any changes in
membrane excitability due to local Ca2+
activated secondary currents will directly
affect spike generation. The slow time constants of Ca2+
decay at the spike generating
zone in both neurons result in prolonged Ca2+
elevations due to presentation of
species specific song or due to walking. Consequently the spike generating zones of
both ON1 and tibial motoneurons operate in a different Ca2+
environment during
continuous stimulation than at rest. A Ca2+
summation during rhythmical motor
activity has been shown in the dendrites of lamprey (Bacskai et al. 1995) and rat
(Viana et al. 1993) spinal motoneurons. Furthermore fly visual interneurons summate
Ca2+
elevations during periodic visual pattern presentation (Single and Borst 1998).
The functional role of Ca2+
in neurons is critical. In ON1 Ca2+
controls an
outward current, resulting in hyperpolarisation of the neuron following activity (Sobel
and Tank 1994). In contrast, Ca2+
in tibial motoneuron has no obvious impact on
membrane potential or spike generation. The elevated dendritic Ca2+
levels in ON1
during continuous stimulation drive membrane potential to a more negative state,
further from spike threshold. This gives rise to a shift in the neuron’s input-output
function resulting in a noise filter effect (Pollack 1988): only strong inputs, such as
from loud chirps, will be represented in ON1’s spike pattern while weaker synaptic
inputs such as from environmental sounds are suppressed. Contralateral inhibition
mediated by its mirror image partner gives rise to a decrease in ON1 spike rate.
Consequently Ca2+
levels drop in the dendrites, effectively disinhibiting the neuron
from internally driven inhibition through a Ca2+
activated outwards current. In order
to maximise the combined effect of internally generated inhibition through Ca2+
and
externally generated inhibition through synaptic inputs, the impact of synaptic
inhibition on Ca2+
levels in particular at the spike generating zone should be
minimised: indeed contralateral inhibition resulted in a smaller drop in Ca2+
levels at
the spike generating zone than in neighbouring dendritic compartments.
Chapter 5
95
In contrast, Ca2+
in tibial motoneurons does not activate any prominent secondary
currents, and the role of the large prolonged Ca2+
elevations observed in tibial
motoneurons during repetitive stimulation remains unclear. The absence of Ca2+
controlled secondary currents in tibial motoneurons allows these neurons retain equal
responsiveness to synaptic inputs during walking and rest. This may represent a
necessary prerequisite for flexible motor control which allows supporting the range of
very different behavioural tasks of these motoneurons such as walking, scratching or
kicking.
Dendrites of neurons may also express mechanisms for Ca2+
mediated Ca2+
release (Berridge 1998). This can be important in supporting synaptic vesicle release
from dendritic presynaptic terminals (Rusakov 2006), or in the generation and
propagation of neuronal Ca2+
waves (Nakamura et al. 1999, 2000). In ON1 Ca2+
appears to travel from dendritic compartments towards the spike generating zone
during prolonged activation. It is however unclear to what extent this apparent wave is
driven by Ca2+
mediated Ca2+
release, or a direct consequence of the different neurite
volumes between the dendritic and spike generating compartments of this neuron.
Axon and Soma
The axon actively propagates action potentials between the spike generating zone and
the axonal terminals. Action potentials in both vertebrate and invertebrate neurons can
be supported by Ca2+
currents, and axons can locally express Ca2+
channels (DiPolo
and Beauge 1987, Bean 2007, Zheng and Poo 2007). However axonal Ca2+
entry
mechanisms are generally less abundant than in the dendrites or at the axonal
terminals (Trimmer and Rhodes 2004). The axon of both ON1 as well as all tibial
motoneurons exhibited Ca2+
elevations of much lower amplitude and slower time
course than dendritic compartments. In ON1 increases in axonal Ca2+
levels depended
on the distance from the dendrites and from the axonal terminals. The main mode of
Ca2+
entry in the axon may therefore be by passive diffusion from the neighbouring
dendrites or axonal terminals. This slow accumulation of Ca2+
in the axon may play
an important functional role in ON1. The soma of ON1 attaches to the axon via a thin
neurite. Like the axon, the soma showed no signs of active Ca2+
entry mechanisms
during episodic activity. However, during prolonged stimulation Ca2+
entered the
soma via the axon. I could not directly study this effect in tibial motoneurons due to

Chapter 5
96
the ventral location of somata. However the neurite leading towards the soma only
showed small Ca2+
elevations during episodic stimulation indicating that similar
principles may apply. Similar to ON1, the somata of fly visual interneurons or the
cricket giant cercal interneuron only exhibit weak Ca2+
changes upon neuron
activation (Ogawa et al. 1996, Single and Borst 1998). A mechanism of Ca2+
entry to
the soma via diffusion from neighbouring neurites may be an effective way of
generating a threshold to local Ca2+
triggered intracellular events, and give rise to a
simple and effective control over transcription and translation required only during
prolonged neuronal activity (Berridge 1998, Augustine et al. 2003). This is in clear
contrast to vertebrate neurons. Here the soma exists as a key site of electrical
processing, acting both as a site of signal integration as well as hosting the axon
hillock, an area of low spike threshold. Ca2+
dynamics in vertebrate somata are often
driven by powerful Ca2+
entry mechanisms giving rise to large Ca2+
elevations during
electrical and synaptic activity. Some insect neurons do however also exhibit local
mechanisms of Ca2+
influx. For example locust Dorsal Unpaired Median cells exhibit
several voltage dependent Ca2+
currents (Wicher and Penzlin 1997) including a
voltage dependent pathway through a G-protein couple cascade acting on intracellular
Ca2+
release mechanisms (Ryglewski et al. 2007).
Axonal Terminals
In ON1 it was possible to measure Ca2+
dynamics in the axonal terminals. These were
voltage dependent, and followed a time course of rise and decay similar to the
dendrites of the neuron. Ca2+
at presynaptic terminals controls synaptic vesicle release
(Rusakov 2006, Evans and Zamponi 2006). Due to the nature of our optical recording
technique I could not resolve individual synapses. However at the level of entire
branchlets of axonal terminals Ca2+
did not decay towards baseline between spike
responses to syllables or even between chirps. This implies that in the absence of
spiking activity Ca2+
remains inside the axonal terminals. Accordingly the presynaptic
Ca2+
buffering capacity, defined by the concentration of unbound Ca2+
buffers will
decrease. Any free Ca2+
transients following spike evoked Ca2+
entry may therefore
be enhanced compared to that under the low resting Ca2+
. This could give rise to a
tighter coupling between further Ca2+
influx and synaptic vesicle release (Rusakov
2006).

Chapter 5
97
Ca2+
in presynaptic terminals may also control secondary currents as in
Aplysia sensory neurons (Byrne and Kandel 1996). Here Ca2+
mediated deactivation
of a local K+ current gives rise to spike broadening, thus increasing synaptic output.
Changes in the spike waveform may also affect the dynamics of synaptic efficacy: a
reduction in presynaptic spike width at the synapse between two identified
motoneurons of the locust gave rise to a smaller decrease of EPSP amplitudes over
repeated stimulation (Niven and Burrows 2003). However no effect on spike
amplitude or shape following spike activity was obvious when recording near axonal
terminals of ON1 arguing against the existence of Ca2+
controlled secondary currents
at this site.
Summary of functional specialisations of ON1 and tibial motoneurons
Spatial arrangements of input synapses
- The spatial proximity of low frequency inputs to the spike generating zone
biases the output tuning of ON1 towards low frequencies
- The additional high frequency auditory inputs to ON1 may enhance the acuity
of the song’s temporal representation.
- In tibial motoneurons there is no indication for a spatial separation of synaptic
inputs from different presynaptic sources.
Dendritic Ca2+
and postsynaptic regulation of synaptic efficacy
- Neither type of neuron exhibited any obvious changes in dendritic synaptic
efficacy during elevated Ca2+
levels.
Voltage activated Ca2+
currents
- The dendritic Ca2+
levels in ON1 are driven by likely to be driven by HVA
Ca2+
currents. Therefore high spike rates in ON1 maintain elevated dendritic
Ca2+
levels during phonotaxis.
- The dendritic Ca2+
levels of tibial motoneurons are likely to be predominately
driven by LVA currents. Ca2+
elevations within each motoneuron are therefore
largely independent of spike activity, but are instead driven by graded
depolarisations due to synaptic activity.
Spike generation and secondary currents:
Chapter 5
98
- At the spike generating zone in both ON1 and tibial motoneurons the slow
Ca2+
dynamics give rise to prolonged Ca2+
elevations during rhythmical
activation.
- In ON1 Ca2+
activates an outward current which acts as a noise filter.
- Inhibition of ON1 from its contralateral partner neuron results in a drop in
spike rate and a subsequent decrease in Ca2+
levels. This decrease is less
pronounced at the spike generating zone than in the dendrites.
- In tibial motoneurons no Ca2+
activated secondary currents were obvious.
Axon and soma:
- In both ON1 and tibial motoneurons the axon and soma did not show any
pronounced Ca2+
elevations during episodic activation.
- During prolonged activation Ca2+
appeared to diffuse into the axon and soma
of ON1 from the dendrites and axonal terminals. Similar mechanisms may
apply in tibial motoneurons.
Axonal terminals:
- Ca2+
remaining inside axonal terminals of ON1 between spike responses to
individual syllables and chirps. This may reduce the local buffering capacity
of axonal terminals, and may cause an increased coupling between the Ca2+
influx due to spike arrival and synaptic vesicle release.
Future projects
I have studied how two types of neurons of the neuronal network underlying
phonotactic steering in crickets are adapted to their different functional roles. By
studying their synaptic inputs, morphology and neuronal processing supported by
Ca2+
I analysed how both classes of neurons integrate and process auditory or motor
inputs. However not all elements of this auditory-to-motor network have been
identified (Schildberger et al. 1989). In attempting to achieve a more comprehensive
understanding of the specific processing requirements and adaptations of each neuron
within this network, the missing neuronal elements need to be identified. Especially
auditory processing within the brain remains unclear (Schildberger 1984, Staudacher
2001). Studying both newly identified as well as known neuronal elements during
phonotaxis will lead to a better understanding of the roles played by each of the
neuronal elements controlling the behaviour.

Chapter 5
99
Another important focus is the causality between elevations in free
intracellular Ca2+
and its intracellular effectors. In particular the use of photoreleased
caged Ca2+
compounds will be a key approach, as it allows to control Ca2+
levels
independent of synaptic inputs and a neuron’s depolarisation state (Petersen 2002,
Kurtz et al. 2008). Furthermore the application of activators or blockers of parts of
intracellular Ca2+
cascades, such as caged IP3 or selected Ca2+
channel blockers will
lead to a deeper understanding of the cellular mechanisms that govern the control over
and control by Ca2+
in ON1 and tibial motoneurons (Huguenard 1996, Viana et al.
1997). In addition the use of different, more sophisticated imaging techniques such as
high speed confocal imaging or two-photon microscopy would allow studying Ca2+
dynamics within these neurons with much improved spatial and temporal resolution,
allowing to reveal the effects of Ca2+
at the level of tertiary neurite or even individual
synapses (e.g. Kloppenburg et al. 2000). Finally the specific conclusions drawn from
the data presented here need to be tested in the context of different neuronal networks,
as well as the neurons of homologous neuronal networks of different species, such as
Teleogryllus oceanius (Pollack 2003, Tunstall and Pollack 2005, Marsat and Pollack
2005). Are findings presented from Gryllus bimaculatus universal to the control of
phonotactic behaviour in crickets, or specifically adapted only for this species? How
do findings relate to neurons found in completely different contexts still? The toolkit
for task specific adaptations of neurons is vast and we are only beginning to scratch
the surface of what nature holds possible.

Chapter 5
100
Figure 5.1: A thoraco-cephalic pathway for auditory steering? Acoustic
stimulation during phonotaxis results in steering leg movements with a latency of 55-
60ms. Tibial muscles are activated with a latency of 35-40ms, and prothoracic tibial
motoneurons generate spikes 31-36ms following acoustic stimulation. Auditory
activation of tibial motoneurons may be achieved via a direct polyneural pathway
from Descending Brain Neurons (DBN). These may receive auditory information
from cephalic projections of Ascending Neuron-1 (AN1) via Local Brain Neurons
(LBN). AN1 receives direct synaptic inputs from auditory afferents in the prothoracic
ganglion (TH1), and responds with a latency of 20-22ms in the brain. Auditory inputs
to the motor system only occur during phonotaxis. A gating mechanism of auditory-
to-motor control, driven by cephalic pattern recognition networks may exist. (asterisks
indicate calculated, as opposed to measured latencies).
101
BIBLIOGRAPHY
Albritton NL, Meyer T, Stryer L. (1992). Range of Messenger Action of Calcium
Ion and Inositol 1,4,5-Triphosphate. Science 258:1812-1815.
Angstadt JD, Calabrese RL. (1991). Calcium currents and graded synaptic
transmission between heart interneurons of the leech. J. Neurosci. 11:746-759.
Augustine GJ, Santamaria F, Tanaka K. (2003). Local Calcium Signalling in
Neurons. Neuron 40:331-346.
Bacskai BJ, Wallèn P, Lev-Ram V, Grillner S, Tsien RY. (1995). Activity-Related
Calcium Dynamics in Lamprey Motoneurons as Revealed by Video-Rate Confocal
Microscopy. Neuron 14:19-28.
Baden T, Hedwig B. (2007). Neurite Specific Ca2+
Dynamics Underlying Sound
Processing in an Auditory Interneuron. Dev. Neurobiol. 67(1):68-80.
Ball EE, Oldfield BP, Rudolph KM. (1989). Auditory Organ Structure,
Development, and Function. In: Cricket Behaviour and Neurobiology, Ch.13:391-423
(ed. F. Huber, T.E. Moore, W. Loher). Ithaca and London, Cornell University Press.
Bässler U. (1993). The femur-tibia control system of stick insects – a model system
for the study of the neural basis of joint control. Brain Res. Rev. 18:207-226.
Bean B. (2007). The action potential in mammalian central neurons. Nature Rev.
Neurosci. 8:451-465.
Berridge MJ. (1998). Neuronal Ca2+
Signalling. Neuron 21:13-26.
Bonnot A, Whelan PJ, Mentis GZ, O’Donovan MJ. (2002). Spatiotemporal pattern
of motoneuron activation in the rostral lumbar and the sacral segments during
locomotor-like activity in the neonatal mouse spinal cord. J. Neurosci. 22(3):1-8.

102
Bootman MD, Collins TJ, Peppiatt CM, Prothero LS, MacKenzie L, De Smet P,
Travers M, Tovey SC, Seo JT, Berridge MJ, Ciccolini F, Lipp P. (2001). Calcium
signalling – an overview. Cell & Dev. Biol. 12:3-10.
Borst A, Egelhaaf M. (1992). In vivo imaging of Ca2+
accumulation in fly
interneurons as elicited by visual motion stimulation. Proc. Natl. Acad. Sci. 89:4139-
4143.
Büschges A, Wolf H. (1995). Nonspiking Local Interneurons in Insect Leg Motor
Control I: Common Layout and Species-Specific Response Properties of Femur-
Tibial Joint Control Pathways in Stick Insect and Locust. J. Neurophysiol.
73(5):1843-1850.
Büschges A, Schmitz J, Bässler U. (1995). Rhythmic patterns in the thoracic nerve
cord of the stick insect induced by pilocarpine. J. Exp. Biol. 198:435-456.
Büschges A, Akay T, Gabriel JP, Schmidt J. (2008). Organizing network action for
locomotion: Insights from studying insects walking. Brain Res. Rev. 57(1):162-71.
Burns MD, Usherwood PNR. (1979). The control of walking in orthoptera: II. Motor
neuron activity in normal free-walking animals. J. Exp. Biol. 79:69-98.
Burrows, M. (1996a). Components of the nervous system. In: The Neurobiology of
an Insect brain Ch3.3:48-67. Oxford University Press.
Burrows M. (1996b). Controlling local movements of the legs. Walking. Jumping.
In: The Neurobiology of an Insect brain Chs.7,8,9:254-447. Oxford University Press.
Burrows M. (1996c). Flying. In: The Neurobiology of an Insect brain Ch.11:475-
560. Oxford University Press.
Byrne JH, Kandel ER. (1996). Presynaptic Facilitation Revisited: State and Time
Dependence. J. Neurosci. 16(2):425-435
103
Camhi J, Sumbre G, Wendler G. (1995). Wing-beat coupling between flying locust
pairs: preferred phase and lift enhancement. J. Exp. Biol. 198(4):1051-63.
Destexhe A, Marder E. (2004). Plasticity in single neuron and circuit computations.
Nature 431:789-795.
DiPolo R, Beaugé L. (1987). Plasma membrane mechanisms for intracellular calcium
regulation in squid axons. Acta Physiol. Pharmacol. Latinoam. 37(4):437-44
Doherty JA. (1985). Trade-off phenomena in calling song recognition and phonotaxis
in the cricket Gryllus bimaculatus (Orthoptera, Gryllidae). J. Comp. Physiol. A
156:787-801.
Dürr V, Ebeling W. (2005). The behavioural transition from straight to curve
walking: kinetics of leg movement parameters and the initiation of turning. J. Exp.
Biol. 208:2237-2252.
Eilers J, Konnerth A. (1997). Dendritic signal integration. Curr. Op. Neurobiol.
7:385-390.
Esch H, Huber F. (1980). Primary auditory neurons in crickets: physiology and
central projections. J. Comp. Physiol. A 137:27-38.
Evans RM, Zamponi GW. (2006). Presynaptic Ca2+
channels – integration centers
for neuronal signaling pathways. Trends in Neurosci. 29(11):617-624.
Faber LSE, Sah P. (2003). Ca2+
-Activated Potassium Channels: Multiple
Contributions to Neuronal Function. Neuroscientist 9(3):181-194.
Faulkes Z, Pollack GS. (2000). Effects of Inhibitory Timing on Contrast
Enhancement in Auditory Circuits in Crickets (Teleogryllus oceanicus). J.
Neurophysiol. 84:1247-1255.
104
Galizia CG, Sachse S, Mustaparta H. (2000). Calcium responses to pheromones
and plant odours in the antennal lobe of the male and female moth Helithis virescens.
J. Comp. Physiol. A 186:1049-1063.
Gallin WJ, Greenberg ME. (1995). Ca2+
regulation of gene expression in neurons:
the mode of entry matters. Curr. Op. Neurobiol. 268(5208):367-374.
Göbel W, Helmchen F. (2007). In vivo imaging of neural network function. Physiol.
(Bethesda) 22:358-65.
Grolleau F, Lapied B. (1996). Two Distinct Low-Voltage-Activated Ca2+
Currents
Contribute to the Pacemaker Mechanism in Cockroach Doral Unpaired Median
Neurons. J. Neurophysiol. 76(2):963-976.
Gwilliam GF, Burrows M. (1980). Electrical characteristics of the membrane of an
identified insect motor neuron. J. Exp. Biol. 86:49-61.
Hardie R, Weckström M. (1990). Three classes of potassium channels in large
monopolar cells of the blowfly Calliphora vicina. J. Comp. Physiol. A 167:723-736.
Harris-Warrick RM. (2002). Voltage-sensitive ion channels in rhythmic motor
systems. Curr. Op. Neurobiol. 12:646-651.
Hartmann J, Konnerth A. (2005). Determinants of postsynaptic Ca2+
signaling in
Purkinje neurons. Cell. Calcium. 37:459-466.
Hedwig B, Knepper M. (1992). NEUROLAB, a comprehensive program for the
analysis of neurophysiological and behavioural data. J. Neurosci. Methods 45:135-
148.
Hedwig B, Becher G. (1998). Forewing Movements and intracellular motoneurons
stimulation in tethered flying locusts. J. Exp. Biol. 201:731-744.

105
Hedwig B. (2000). A highly sensitive opto-electronic system for the measurement of
movements. J. Neurosci. Methods 100:165-171.
Hedwig B, Poulet JFA. (2004). Complex auditory behaviour emerges from simple
reactive steering. Nature 430:781-785.
Hedwig B, Poulet JFA. (2005). Mechanisms underlying phonotactic steering in the
cricket Gryllus bimaculatus revealed with a fast trackball system. J. Exp. Biol.
208:915-927.
Hofmann F, Biel M, Flockerzi V. (1994). Molecular Basis for Ca2+
Channel
Diversity. Annu. Rev. Neurosci. 17:399-418.
Horseman G, Huber F. (1994). Sound localisation in crickets I. Contralateral
inhibition of an ascending interneuron (AN1) in the cricket Gryllus bimaculatus. J.
Comp. Physiol. A 175:389-398.
Hounsgaard J, Kiehn O. (1993). Calcium Spikes and Calcium Plateaux evokes by
Differential Polarization in Dendrites of Turtle Motoneurons in Vitro. J. Physiol.
468:245-259.
Hoyle G. (1955a). The anatomy and innervation of skeletal muscle. Proc. R. Soc.
Lond. 143:281-343.
Hoyle G. (1955b). Neuromuscular mechanism of a locust skeletal muscle. Proc. R.
Soc. Lond. 143:343-367.
Huguenard JR. (1996). Low-Threshold Calcium Currents in Central Nervous
System Neurons. Annu. Rev. Physiol. 58:329-348.
Imaizumi K, Pollack GS. (2005). Central projections of auditory receptor of crickets.
J. Comp. Neurol. 493:439-447.
106
Ivanov AI, Calabrese RL. (2000). Intracellular Ca2+
Dynamics During Spontaneous
and Evoked Activity of Leech Heart Interneurons: Low-Threshold Ca2+
Currents and
Graded Synaptic Transmission. J. Neurosci. 20(13):4930-4943.
Ivanov AI, Calabrese RL. (2003). Modulation of Spike-Mediated Synaptic
Transmission by Presynaptic Backgroud Ca2+
in Leech Heart Interneurons. J.
Neurosci. 23(4):1206-1218.
Ivanov AI, Calabrese RL. (2006). Graded Inhibitory Synaptic Transmission
Between Leech Interneurons: Assessing the Roles of two Kinetically Distinct Low-
Threshold Ca2+
Currents. J. Neurophysiol. 96:218-234.
Kloppenburg P, Zipfel WR, Webb WW, Harris-Warrick RM. (2000). Highly
Localized Ca2+
Accumulation Revealed by Multiphoton Microscopy in an Identified
Motoneuron and its Modulation by Dopamine. J. Neurosci. 20(7):2523-2533.
Koch C. (1984). Cable theory in neurons with active, linearized membranes. Biol.
Cybern. 50(1):15-33.
Krauthamer V, Fourtner CR. (1978). Locomotory activity in the extensor and
flexor tibiae of the cockroach, Periplaneta americana. J. Insect Physiol. 24:813-819.
Kullmann DM, Lamsa KP. (2007). Long-term synaptic plasticity in hippocampal
interneurons. Nature Rev. Neurosci. 8:687-699.
Kurtz R, Kalb J, Spalthoff C. (2008). Examination of fly motion by functional
flourescence techniques. Front. Biosci. 13:3000-3021.
Larsen ON, Kleindienst HU, Michelsen A. (1989). Biophysical aspects of sound
reception. In: Cricket behaviour and neurobiology. Ch.12:364-390. (ed. F. Huber, T.
E. Moore and W. Loher). Ithaca and London, Cornell University press.

107
Laurent G, Richard D. (1986a). The organization and role during locomotion of the
proximal musculature of the cricket foreleg: I. Anatomy and Innervation. J. Exp. Biol.
123:255-283.
Laurent G, Richard D. (1986b). The organization and role during locomotion of the
proximal musculature of the cricket foreleg: II. Electromyographic activity during
stepping patterns. J. Exp. Biol. 123:285-306.
London M, Häusser M. (2005). Dendritic Computation. Ann. Rev. Neurosci. 8:503-
532.
Mammano F, Canepari M, Capello G, Ijaduola RB, Cunei A, Ying L, Fratnik F,
Colavita A. (1999). An optical recording system based on a fast CCD sensor for
biological imaging. Cell Calcium 25(2):115-123.
Marsat G, Pollack GS. (2005). Effect of the Temporal Patterns of Contralateral
Inhibition on Sound Localization Cues. J. Neurosci. 25(26):6137-6144.
McLarnon JG. (1995). Potassium Currents in Motoneurons. Prog. Neurobiol.
47:513-531.
Molina J, Stumpner A. (2005). Effects of pharmacological treatment and
photoinactivation on the directional responses of an insect neuron. J. Exp. Zoolog. A
Comp. Exp. Biol. 303(12):1085-103.
Nabatiyan A, Poulet JFA, de Polavieja GG, Hedwig B. (2003). Temporal pattern
recognition based on instantaneous spike rate coding in a simple auditory system. J.
Neurophysiol. 90:2484-2493.
Nakamura T, Barbara J-G, Nakamura K, Ross WN. (1999). Synergistic Release
of Ca2+
from IP3-Sensitive Stores Evoked by Synaptic Activation of mGluRs Paired
with Backpropagating Action Potentials. Neuron 24:727-737.

108
Nakamura T, Nakamura K, Lasser-Ross N, Barbara J-G, Sandler VM, Ross
WN. (2000). Inositol 1,4,5-Triphosphate (IP3)-Mediated Ca2+
Release Evoked by
Metabotropic Agonists and Backpropagating Action Potentials in Hippocampal CA1
Pyramidal Neurons. J. Neurosci. 20(22):8365-8376.
Nishino H. (2003). Local Innervation Patterns of the Metathoracic Flexor and
Extensor Tibiae Motor Neurons in the Cricket Gryllus bimaculatus. Zool. Sci. 20:697-
707.
Niven JE, Burrows M. (2003). Spike Width Reduction Modifies the Dynamics of
Short-Term Depression at a Central Synapse in the Locust. J. Neurosci. 23(20):7461-
7469.
Oertner TG, Brotz TM, Borst A. (2001). Mechanisms of Dendritic Ca2+
Signaling
in Fly Neurons. J. Neurophysiol. 85:439-447.
Ogawa H, Baba Y, Oka K. (1996). Dendritic Ca2+
response in cercal sensory
interneurons of the cricket Gryllus bimaculatus. Neurosci. Lett. 219:21-24.
Ogawa H, Baba Y, Oka K. (2001). Dendritic Calcium Accumulation Regulates
Wind Sensitivity via Short-Term Depression at Cercal Sensory-to-Giant Interneuron
Synapses in the Cricket. J. Neurobiol. 46:301-313.
Ogawa H, Baba Y, Oka K. (2002). Spike-Triggered Dendritic Calcium Transients
Depend on Synaptic Activity in the Cricket Giant Interneurons. J. Neurobiol. 50:234-
244.
Oldfield BP, Kleindienst HU, Huber F. (1986). Physiology and tonotopic
organization of auditory receptors in the cricket Gryllus bimaculatus. J. Comp.
Physiol. A 159:457-464.
Parker D. (1995a). Long-lasting potentiation of a direct central connection between
identified motor neurons in the locust. Eur. J. Neurosci. 7(5):1097-1106.

109
Parker D. (1995b). Depression of Synaptic Connections Between Identified Motor
Neurons in the Locust. J. Neurophysiol. 74(2):529-538.
Pearson KG, Fourtner CR. (1975). Nonspiking interneurons in walking system of
the cockroach. J. Neurophysiol. 38:33-52.
Petersen OH. (2002). Calcium signal compartmentalization. Biol. Res. 35(2):177-
182.
Pollack GS, Hoy R. (1980). Phonotaxis in flying crickets: Neural correlates. J. Insect
Physiol. 27:41-45.
Pollack GS. (1988). Selective attention in an insect auditory neuron. J. Neurosci.
8(7):2635-2639.
Pollack GS. (1994). Synaptic inputs to the omega neuron of the cricket Teleogryllus
oceanicus: differences in EPSP waveforms evoked by low and high sound
frequencies. J. Comp. Physiol. A 174:83-89.
Pollack GS. (2001). Analysis of temporal patterns of communication signals. Curr.
Op. Neurobiol. 11:734-738.
Poulet JFA, Hedwig B. (2005). Auditory orientation in crickets: Pattern recognition
controls reactive steering. Proc. Natl. Acad. Sci. 102:15665-15669.
Poulet JFA, Hedwig B. (2006). The cellular basis of a corollary discharge. Science
311:518-522.
Römer H. (1983). Tonotopic organization of the auditory neuropil in the bushcricket
Tettigonia viridissima. Nature 306(5938):60-62.
Römer H, Marquart V, Hardt M. (1988). Organization of a Sensory Neuropil in the
Auditory Pathway of Two Groups of Orthoptera. J. Comp. Neurol. 275:201-215.
110
Römer H, Krusch M. (2000). A gain-control mechanism for processing of chorus
sounds in the afferent auditory pathway of the bushcricket Tettigonia viridissima
(Orthoptera; Tettigoniidae). J. Exp. Biol. 186:181-191.
Rosano H, Webb B. (2007). A dynamic model of thoracic differentiation for the
control of turning in the stick insect. Biol. Cybern. 96:229-246.
Rusakov DA. (2006). Ca2+
-Dependent Mechanisms of Presynaptic Control at Central
Synapses. Neuroscientist. 12(4):317-326.
Ryckebusch S, Laurent G. (1993). Rhythmic Patterns Evoked in Locust Leg Motor
Neurons by Muscarinic Agonist Pilocarpine. J. Neurophys. 69(5):1583-1595.
Ryglewski S, Pflüger HJ, Duch C. (2007). Expanding the Neuron’s Calcium
Signalling Repertoire: Intracellular Calcium Release via Voltage-Induced PLC and
IP3R Activation. PLoS Biol. 5(4):818-827.
Safronov BV. (1999). Spatial Distribution of Na+ and K
+ Channels in Spinal Dorsal
Horn Neurons: Role of the Soma, Axon and Dendrites in Spike Generation. Prog.
Neurobiol. 59:217-241.
Sah P, McLachlan EM. (1992). Potassium Currents Contribution to Action Potential
Repolarization and Afterhyperpolarisation in Rat Vagal Motoneurons. J.
Neurophysiol. 68:1834-1841.
Sah P, Faber ESL. (2002). Channels underlying neuronal calcium-activated
potassium currents. Prog. Neurobiol. 66:345-353.
Santer RD, Yamawaki Y, Rind FC, Simmons PJ. (2005). Motor activity and
trajectory control during escape jumping in the locust Locusta migratoria. J. Comp.
Physiol. A 191:965-975.
Schildberger K. (1984). Temporal selectivity of identified auditory neurons in the
cricket brain. J. Comp. Physiol. A 155:171-185.

111
Schildberger K. (1988). Behavioural and neuronal mechanisms of cricket
phonotaxis. Experimentia 44:408-415.
Schildberger K, Huber F, Wohlers DW. (1989). Central Auditory Pathway:
Neuronal Correlates of Phonotactic Behaviour. In: Cricket behaviour and
neurobiology. Ch.14:391-423. (ed. F. Huber, T. E. Moore and W. Loher). Ithaca and
London, Cornell University press.
Selverston AI, Kleindienst HU, Huber F. (1985). Synaptic connectivity between
cricket auditory interneurons as studied by selective photoinactivation. J. Neurosci.
5(5):1283-1292.
Single S, Borst A. (1998). Dendritic Integration and Its Role in Computing Image
Velocity. Science 281:1848-1850.
Single S, Borst A. (2002). Different Mechanisms of Ca2+
Entry within different
Dendritic Compartments. J. Neurophysiol. 87:1616-1624.
Snodgrass RC. (1929). The thoracic mechanism of a grasshopper and its antecedents.
Smithson. Misc. Collect. 82:1-111.
Sobel EC, Tank DW. (1994). In vivo Ca2+
dynamics in a cricket auditory neuron: an
example of chemical computation. Science 263:823-826.
Staudacher E. (1998). Distribution and morphology of descending brain neurons in
the crickets Gryllus bimaculatus. Cell. Tissue Res. 294:187-202.
Staudacher UM. (2001). Sensory responses of descending brain neurons in the
walking cricket Gryllus bimaculatus. J. Comp. Physiol. A 187:1-17.
Takagi H. (2000). Roles of ion channels in EPSP integration at neuronal dendrites.
Neurosci. Res. 37:167-171.

112
Thorson J, Weber T, Huber F. (1982). Auditory behaviour of the cricket. II.
Simplicity of calling-song recognition in Gryllus, and anomalous phonotaxis at
abnormal carrier frequencies. J. Comp. Physiol. A 146:361-378.
Trimmer JS, Rhodes KJ. (2004). Localization of Voltage-Gated Ion Channels in
Mammalian Brain. Annu. Rev. Physiol. 66:477-519.
Tunstall DN, Pollack GS. (2005). Temporal and directional processing by an
identified interneuron, ON1, compared in cricket species that sing with different
tempos. J. Comp. Physiol. A Neuroethol. Sens. Neural Behavi. Physiol. 191(4):363-
72.
Umemiya M, Berger AJ. (1994). Properties and Function of Low- and High-
Voltage-Activated Ca2+
Channels in Hypoglossal Motoneurons. J. Neurosci.
14(9):5652-5660.
Viana F, Bayliss DA, Berger AJ. (1993). Calcium Conductances and their Role in
the Firing Behaviour of Neonatal Rat Hypoglossal Motoneurons. J. Neurophysiol.
69(6):2137-2149.
Viana F, Van den Bosch L, Missiaen L, Vandenberghe W, Droogmans G, Nilius
B, Robberecht W. (1997). Mibefradil (Ro 40-5967) blocks multiple types of voltage-
gated calcium channels in cultured rat spinal motoneurons. Cell Calcium 22(4):299-
311.
Watson AHD, Hardt M. (1996). Distribution of synapses on two local auditory
interneurons, ON1 and ON2, in the prothoracic ganglion of the cricket: relationships
with GABA-immunoreactive neuron. Cell and Tissue Res. 283:231-246.
Weber T, Thorson J. (1989). Phonotactic Behaviour of Walking Crickets. In:
Cricket behaviour and neurobiology. Ch.10:310-430. (ed. F. Huber, T. E. Moore and
W. Loher). Ithaca and London, Cornell University press.

113
West AE, Chen WG, Dalva MB, Dolmetsch RE, Kornhauser JM, Shaywitz AJ,
Takasu MA, Tao X, Greenberg ME. (2001). Ca2+
regulation of neuronal gene
expression. Proc. Natl. Acad. Sci. 98(20):11024-11031.
Wicher D, Penzlin H. (1997). Ca2+
Currents in Central Insect Neurons:
Electrophysiological and Pharmacological Properties. J. Neurophysiol. 77:186-199.
Wiese K, Eilts K. (1985). Evidence for Matched Frequency Dependence of Bilateral
Inhibition in the Auditory Pathway of Gryllus bimaculatus. Zool. Jb. Physiol.
89:181-201.
Williams SR, Atkinson SE. (2007). Pathway-specific use-dependent dynamics of
excitatory synaptic transmission in rat intracortical circuits. J. Physiol. 15:759-77.
Wohlers DW, Huber F. (1978). Intracellular recording and staining of cricket
auditory interneurons (Gryllus campestris L., Gryllus bimaculatus DeGeer). J. Comp.
Physiol. A 127:11-28.
Wohlers DW, Huber F. (1982). Processing of sound signals by six types of neurons
in the prothoracic ganglion of the cricket, Gryllus campestris L. J. Comp. Physiol. A
146:161-173.
Wolf H, Büschges A. (1995). Nonspiking Local Interneurons in Insect Leg Motor
Control. II. Role of Nonspiking Local Interneurons in the Control of Leg Swing
During Walking. J. Neurophysiol. 73(5):1861-1875.
Wollner DA, Catterall WA. (1986). Localization of sodium channels in axon hillock
and initial segments of retinal ganglion cells. Proc. Natl. Acad. Sci. 83:8424-8428.
Zecević D. (1996). Multiple spike-initiation zones in single neurons revealed by
voltage-sensitive dyes. Nature 381:322-5.
Zheng JQ, Poo M. (2007). Calcium Signalling in Neuronal Motility. Annu. Rev. Cell
Dev. Biol. 23:275-404.
114
Zucker RS, Regehr WG. (2002). Short-Term Synaptic Plasticity. Annu. Rev.
Physiol. 64:355-405.
LIST OF ABBREVIATIONS USED
EMG: Electromyogram
FETi: Fast extensor tibiae
SETi: Slow extensor tibiae
FFTi: Fast flexor tibiae
SFTi: Slow flexor tibiae
ON1: Omega Neuron-1
AN1: Ascending Neuron-1
LBN: Local Brain Neuron
DBN: Descending Brain Neuron
CPG: Central pattern generator
EPSP: Excitatory postsynaptic potential
IPSP: Inhibitory postsynaptic potential
PSP: Postsynaptic potential
HVA: High voltage activated
LVA: Low voltage activated
GABA: Gamma-aminobutyric acid
IP3: Inositol-3-phosphate
IP3R: Inositol-3-phosphate receptor
RYR: Ryanodine receptor

115
AEP: Anterior end point
PEP: Posterior end point
SLR: Single-lens reflex
LED: Light emitting diode
UV: Ultra-violet
IR: Infra-red
SPL: Sound pressure level
CCD: Charge coupled device
TTL: Transistor-transistor logic
ROI: Region of interest

116
INTERESTING STATISTICS
During the making of this thesis a total of….
…3554 cups of tea were consumed
…713 crickets were sent to cricket heaven
…29 drafts of the chapters were produced
This thesis contains the word “Ca2+
” 647 times – this represents
0.21% of all words and is about 3 times less than the use of the word
“the” (0.67%).