activity h9: modeling the expanding universe - astronomical
TRANSCRIPT
The Universe at Your Fingertips • Astronomical Society of the Pacific
Galaxies and the Universe • H9
Page 1
What’s This Activity About?This is another sequence of activities (like H8) to help students understand the expansion of the universe. It in-volves activities to help them picture the expansion and others to help them understand how Hubble discovered the pattern of galaxy Doppler shifts that provide evi-dence for the expansion.
What Will Students Do?First they use an elastic band with spots to study expan-sion. Then they watch as two transparencies with gal-axies show how expansion proceeds. Next they learn how to use spectra of galaxies to measure the Doppler Shift (or red shift) and graph the velocity of four galaxies against distance to discover Hubble’s Law.
Tips and Suggestions• Both activities H8 and this one are designed to take
students step by step over the reasoning that leads us to the notion of the expanding universe and the Big Bang. You may want to look at both of them and de-cide which sequence is best for your students.
• You may want to consult or give out the background articles on galaxies and the universe from The Universe at Your Fingertips disk.
Modeling the Expanding UniverseActivity H9
Grade Level: 8–12
Source: This activity is produced by the Universe Forum at NASA’s Office of Space Science, along with their Structure and Evolution of the Universe (SEU) Education partners. It is a professional development experience for teachers of grades 8 to 12. See: http://www.cfa.harvard.edu/seuforum/mtu/
Concepts• Expanding universe• Doppler shift/red shift• Galaxy spectra
Inquiry Skills• Exploring• Modeling• Measuring• Describing• Graphing• Reasoning• Visualizing• Inferring
Big Ideas• Patterns of change• Models and simulations• Evolution
What Will Students Learn?
The Universe at Your Fingertips • Astronomical Society of the Pacific
Galaxies and the Universe H9 • Modeling the Expanding Universe
Page 2Modeling the Expanding Universe 39
MODELING THE EXPANDING UNIVERSEExhibit Connections: Cosmic Calendar, The Big Bang
Goal• to visualize a universe expanding in all directions
MaterialsThis activity has several parts. Materials for each part are listed separately.
BackgroundBefore 1917, many scientists thought the universe always existed. But Einstein’s revolutionarytheory of gravity changed all the rules. It opened up the mind-boggling possibility that space itself—the permanence of which had never been questioned—might actually be expanding. If space isexpanding, the universe we inhabit today could once have been infinitely smaller.
In 1929, astronomer Edwin Hubble made the amazing discovery that distant galaxies are speeding away from us. This means that the galaxies we see today were once much closer together—originating from a tiny region of space.
The origin of the universe remains one of the greatest questions in science. Current scientificevidence supports the Big Bang model, which states that 12 to 15 billion years ago, the entireuniverse began expanding from a very hot, very dense state. This sudden expansion is knownas the Big Bang.
What does it mean to say the universe is expanding? The Big Bang was an expansion of spaceitself. Every part of space participated in it. Space is not simply emptiness; it’s a real, stretch-able, flexible thing. Galaxies are moving away from us because space is expanding. Galaxies aremoving with space, not through space!* The models in this activity demonstrate how themotions of the galaxies reveal the continuing expansion of the universe.
In the 1920s, Edwin Hubble measured the motion of galaxies. By measuring a galaxy’s distancefrom us and how fast that galaxy is receding (its recession velocity), he found a simple relation-ship: double the distance, double the velocity; triple the distance, triple the velocity. This isHubble’s Law. In equation form, it is written:
v = H x dRecession velocity = Hubble’s constant x distance from us
The slope of the graph of distance vs. velocity represents the Hubble Constant for the universe.
The Hubble Constant describes how fast the universe is expanding. By measuring the rate ofexpansion, the size and age of the universe can be calculated. Interpreting recent observation-al results from space-borne and ground-based telescopes, scientists have determined differentvalues of Hubble’s constant. Determining the precise value of the Hubble constant is key tounderstanding the origin of the universe, and there are several factors that affect this determi-nation. For example, the universe may not have been expanding at the same rate throughouttime; that is, the expansion itself may be accelerating. Questions like these make the age ofthe universe a hot topic—one of the most controversial in the study of cosmology. The age ofthe universe is currently estimated to be between 12 and 15 billion years.
* There is also a local motion through space as galaxies interactwith their neighbors, but on larger scales, the expansion ofspace dominates.
The Universe at Your Fingertips • Astronomical Society of the Pacific
Galaxies and the Universe H9 • Modeling the Expanding Universe
Page 3
Suggestions for Introducing the ActivityGather students’ ideas and questions about the Big Bang. What caused the Big Bang? Wasthere anything before the Big Bang? What evidence do we have of the Big Bang? When we saythe universe is expanding, what exactly is expanding? Students should also discuss models andthe inherent flaws of any model.
In this activity, students will be using rulers to measure distances between hypothetical galaxies and using these distances to calculate the velocities of these galaxies. Astronomers do not have rulers in space, but the relationship between distance and velocity means thatthey can calculate distances by measuring velocities. Astronomers measure the recession velocities by looking at the spectra of the galaxies. This idea is explored further in Evidencefor the Expanding Universe.
Part 1. Elastic band model–a one-dimensional modelMaterials
• Six-foot length of one inch (or greater) wide elastic ribbon, or exercise band or bungee cord
• approximately 1/2-inch round stickers• stapler• tape measure• white board or chalk board
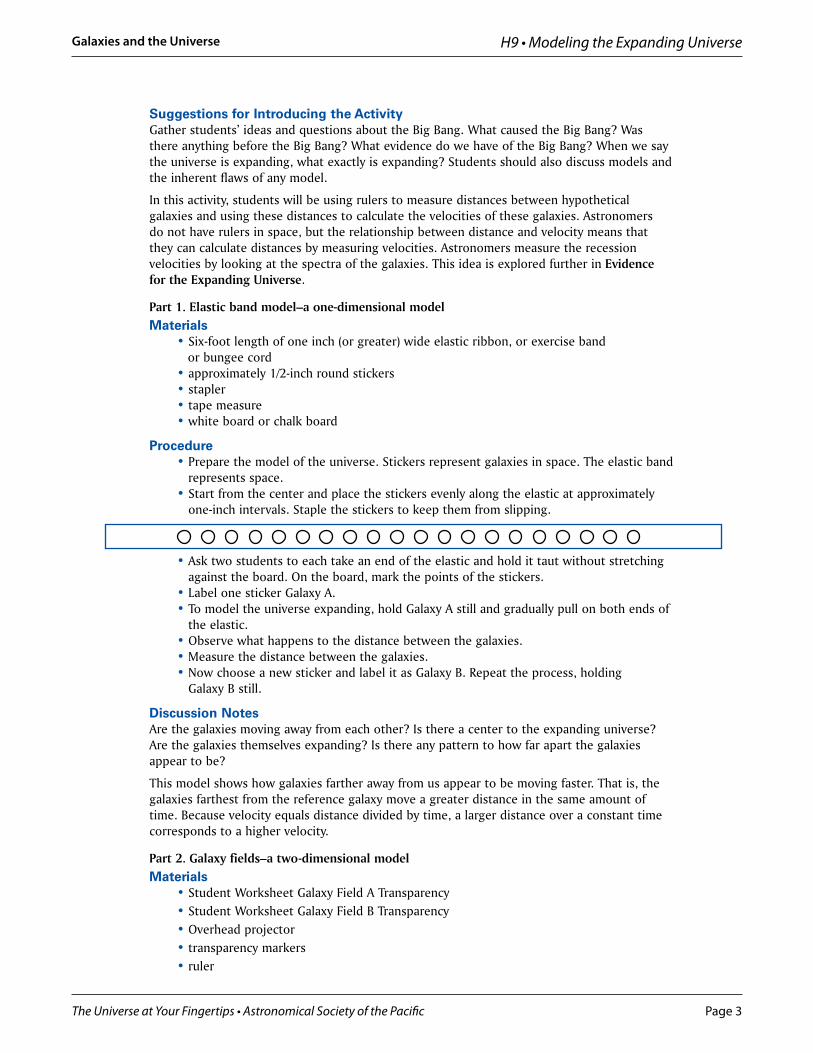
Procedure• Prepare the model of the universe. Stickers represent galaxies in space. The elastic band
represents space.• Start from the center and place the stickers evenly along the elastic at approximately
one-inch intervals. Staple the stickers to keep them from slipping.
• Ask two students to each take an end of the elastic and hold it taut without stretchingagainst the board. On the board, mark the points of the stickers.
• Label one sticker Galaxy A.• To model the universe expanding, hold Galaxy A still and gradually pull on both ends of
the elastic.• Observe what happens to the distance between the galaxies.• Measure the distance between the galaxies.• Now choose a new sticker and label it as Galaxy B. Repeat the process, holding
Galaxy B still.
Discussion NotesAre the galaxies moving away from each other? Is there a center to the expanding universe?Are the galaxies themselves expanding? Is there any pattern to how far apart the galaxiesappear to be?
This model shows how galaxies farther away from us appear to be moving faster. That is, thegalaxies farthest from the reference galaxy move a greater distance in the same amount oftime. Because velocity equals distance divided by time, a larger distance over a constant time corresponds to a higher velocity.
Part 2. Galaxy fields–a two-dimensional modelMaterials
• Student Worksheet Galaxy Field A Transparency• Student Worksheet Galaxy Field B Transparency• Overhead projector • transparency markers• ruler
Cosmic Questions Educator’s Guide 40
The Universe at Your Fingertips • Astronomical Society of the Pacific
Galaxies and the Universe H9 • Modeling the Expanding Universe
Page 4
Modeling the Expanding Universe 41
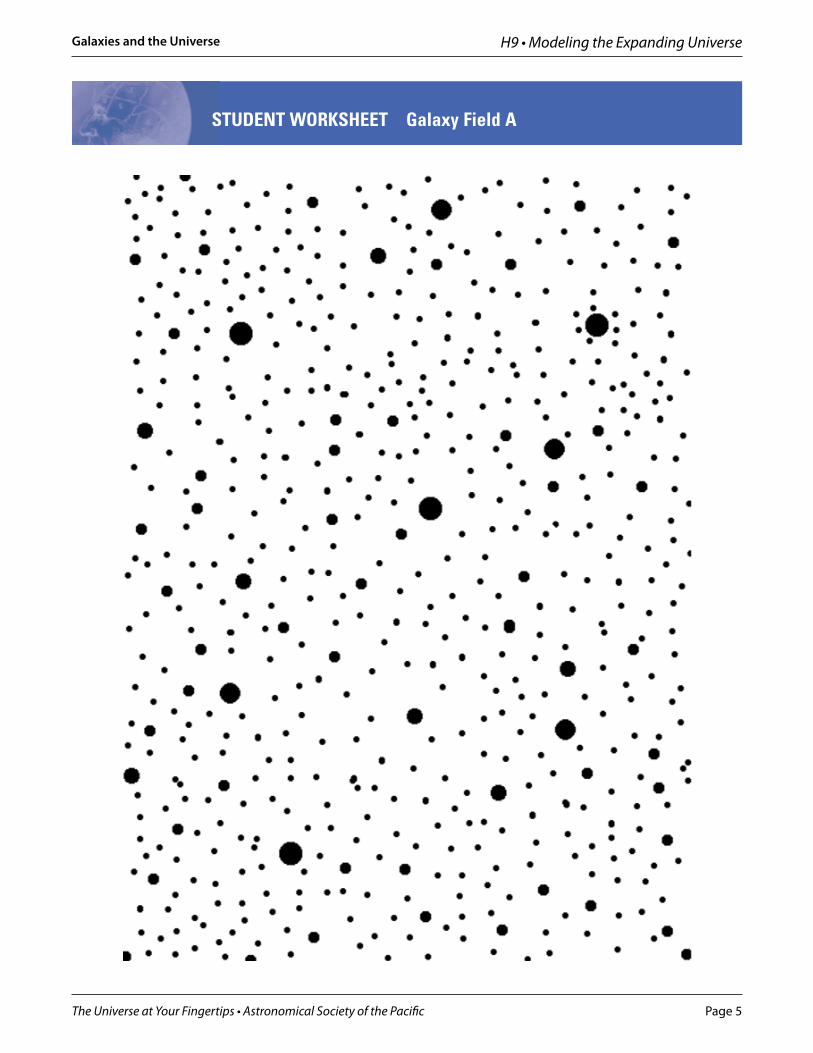
Procedure• Project Student Worksheet Galaxy Field A Transparency for everyone to observe. This is
a picture of an imaginary field of galaxies taken at one moment in time.• Lay Student Worksheet Galaxy Field B Transparency over A. Imagine this represents the
same galaxy field one second later. Choose one galaxy (it is easier to choose a large dot)and match up Worksheets A and B. It is important to keep the Worksheets square andnot rotate either one, as you do this.
• What can you observe about how the other galaxies appear to have moved? (It shouldlook as if all the galaxies are moving away from this point).
• Now choose a different point on Worksheet B to align with Worksheet A. Observe thepattern again. (It should look again as if everything is moving away from this point.)
Discussion NotesAre we at the center of the universe? Is there a center? Is there an edge? In the universe everygalaxy is moving away from every other galaxy. There is no center. From the point of view ofany galaxy, that galaxy appears to be the center of the expansion. This observation is similar to observations made by a person in a moving car. Objects outside the car may appear to be moving away, but the person inside the car does not experience the sensation of movement.
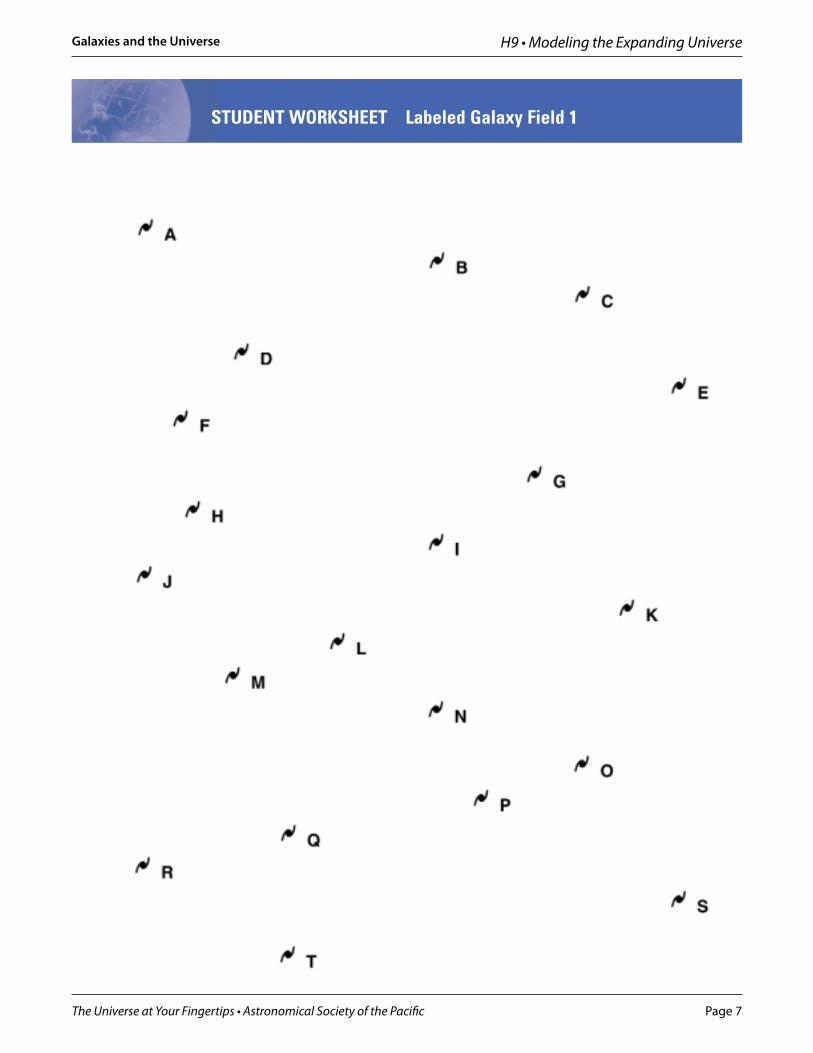
Part 3. Measuring the relative motion of galaxiesIn this model the imaginary galaxy fields on Student Worksheets Labeled Galaxy Fields 1 and 2show only a few galaxies. Students will measure the distance the galaxies appear to havemoved in one second.
MaterialsEach student, or small group of students, should have:
• Student Worksheet Labeled Galaxy Field 1• Student Worksheet Labeled Galaxy Field 2, copied onto transparency• Expanding Universe Student Worksheet• transparency marker• ruler
Procedure• Each student chooses a different galaxy and locates it in the galaxy field on Student
Worksheet Labeled Galaxy Field 1. Remember, this is just an idealized map. Real galaxiesare neither sized this regularly nor spread this regularly throughout the universe.
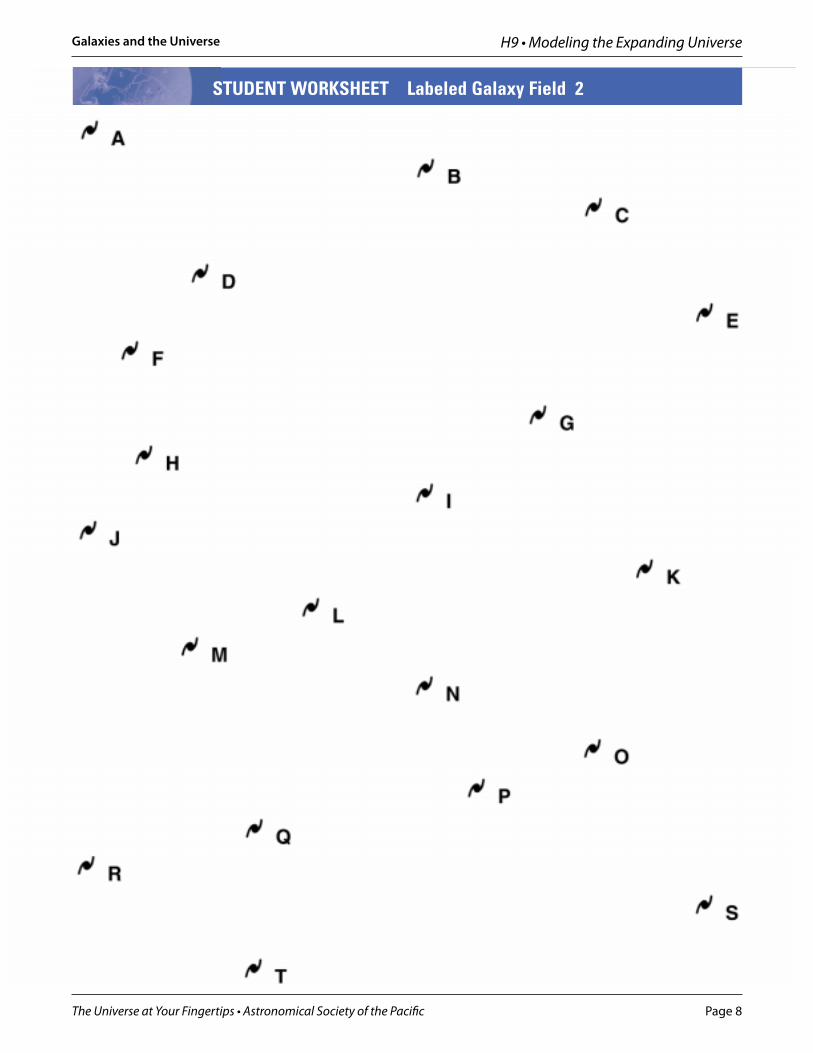
• Lay Worksheet 2 over Worksheet 1 and align the two using the letter of your galaxy.This simulates one second of universal galaxy motion. Your galaxy should not appear tohave moved from the top sheet to the bottom sheet.
• What can you observe about how the other galaxies appear to have moved? • Use a transparency marker to draw an arrow from each galaxy’s position at time
00:00:00 to where it has moved one second later. Record your observations and graphyour data on the Expanding Universe Student Worksheet.
• Collect all the copies of the Worksheet 2 transparencies. Pile the transparencies on topof each other. You should notice that students have drawn arrows in different directionsfor the same galaxy. Is it possible for something to move at different speeds and direc-tion at the same time? Is one set of data right and another wrong?
Discussion NotesEach student’s galaxy seems to be the center of the expansion. The only way this could possi-bly happen is if space itself is expanding because otherwise an object (such as the Sun or theEarth) would have to be moving in two directions at once. The expansion of space is the onlyway to reconcile the observation that from Earth everything appears to move away from us.Astronomers assume that we are not in a special place in the universe; that our place in theuniverse is not different from other places. This assumption is called the CosmologicalPrinciple. It suggests that every other place should observe the expansion just as we do—a situation that would be true if space itself were expanding between the galaxies.
The Universe at Your Fingertips • Astronomical Society of the Pacific
Galaxies and the Universe H9 • Modeling the Expanding Universe
Page 5Cosmic Questions Educator’s Guide 42
STUDENT WORKSHEET Galaxy Field A
Cosmic Questions Educator’s Guide 42
STUDENT WORKSHEET Galaxy Field A

The Universe at Your Fingertips • Astronomical Society of the Pacific
Galaxies and the Universe H9 • Modeling the Expanding Universe
Page 6Modeling the Expanding Universe 43
STUDENT WORKSHEET Galaxy Field B
Modeling the Expanding Universe 43
STUDENT WORKSHEET Galaxy Field B
The Universe at Your Fingertips • Astronomical Society of the Pacific
Galaxies and the Universe H9 • Modeling the Expanding Universe
Page 7
Cosmic Questions Educator’s Guide 44
STUDENT WORKSHEET Labeled Galaxy Field 1
The Universe at Your Fingertips • Astronomical Society of the Pacific
Galaxies and the Universe H9 • Modeling the Expanding Universe
Page 8Modeling the Expanding Universe 45
STUDENT WORKSHEET Labeled Galaxy Field 2
Modeling the Expanding Universe 45
STUDENT WORKSHEET Labeled Galaxy Field 2
The Universe at Your Fingertips • Astronomical Society of the Pacific
Galaxies and the Universe H9 • Modeling the Expanding Universe
Page 9
Cosmic Questions Educator’s Guide 46
Choose a galaxy on Labeled Galaxy Field 1. Remember, this is just an idealized map. Real galaxies are neither this regularly sizednor spread regularly throughout the universe.
Lay Labeled Galaxy Field 2 Transparency over Labeled Galaxy Field 1 and align the letters of your galaxy. This simulates one secondof universal galaxy motion. Align your galaxy so it does not appear to move from the top sheet to the bottom sheet. (Be carefulnot to rotate the papers.)
What can you observe about how the other galaxies appear to have moved?
What direction are the galaxies moving?
Have all the galaxies moved the same distance?
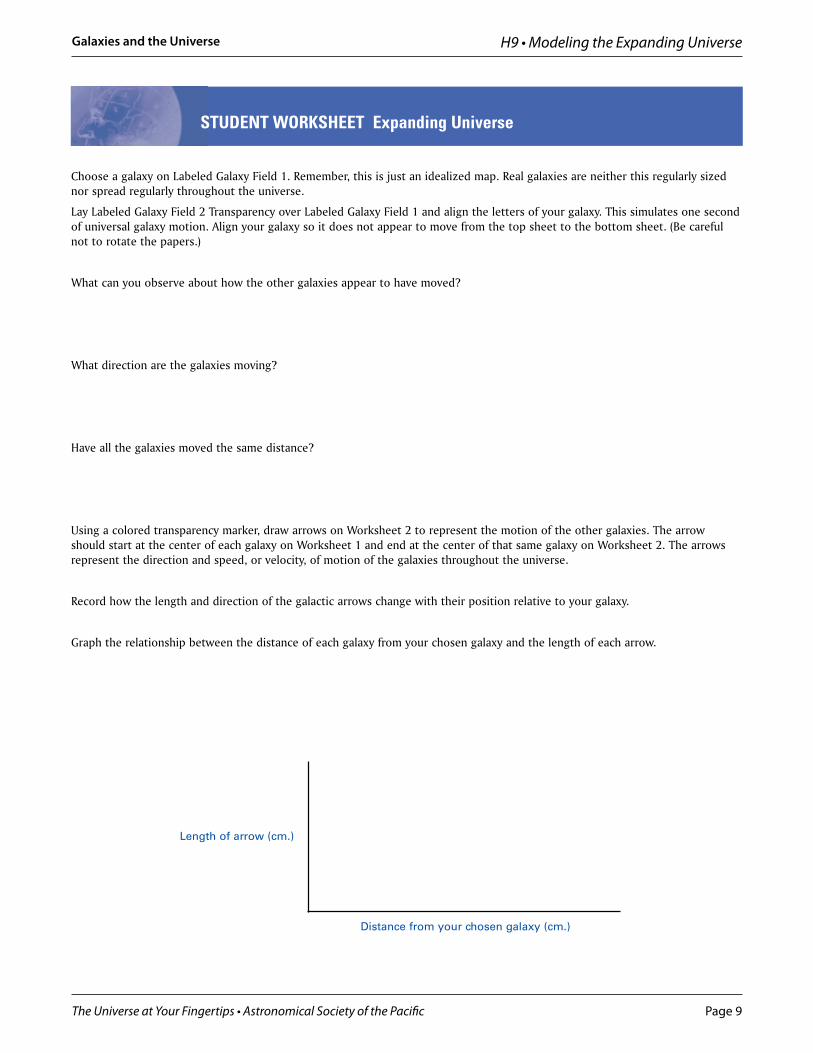
Using a colored transparency marker, draw arrows on Worksheet 2 to represent the motion of the other galaxies. The arrowshould start at the center of each galaxy on Worksheet 1 and end at the center of that same galaxy on Worksheet 2. The arrowsrepresent the direction and speed, or velocity, of motion of the galaxies throughout the universe.
Record how the length and direction of the galactic arrows change with their position relative to your galaxy.
Graph the relationship between the distance of each galaxy from your chosen galaxy and the length of each arrow.
STUDENT WORKSHEET Expanding Universe
Distance from your chosen galaxy (cm.)
Length of arrow (cm.)
The Universe at Your Fingertips • Astronomical Society of the Pacific
Galaxies and the Universe H9 • Modeling the Expanding Universe
Page 10
Evidence for the Expanding Universe 47
EVIDENCE FOR THE EXPANDING UNIVERSE*Exhibit Connections: Cosmic Calendar, The Big Bang, Spectra Interactive
Goals• to become familiar with emission spectra as sources of information• to use galactic spectra to determine galactic speed
MaterialsEach student or small group of students needs a set of student worksheets:
• Looking at Spectra• Calculating and Graphing Galactic Speed• Images of Four Galaxies• Spectra of Galaxies A, B, C, and D
Students should have access to color images of all spectra, including those on the StudentWorksheet Looking at Spectra.
BackgroundThe previous activity helps students to visualize a universe expanding in all directions. In thisactivity, students use astronomical evidence to explore this notion further. How do we knowthe universe is expanding?
The Big Bang model of the origin of the universe states that the universe originated in a veryhot, very dense state 12 to15 billion years ago and has been expanding and cooling ever since.There are three lines of evidence that support this model.
1. We observe that galaxies are moving away from us.
2. We can detect the afterglow from this hot dense state of the early universe. The hotglowing fog that once filled all of space has now cooled to an “invisible” sea of low-energy microwaves (in the radio region of the electromagnetic spectrum). Telescopes sen-sitive to microwave light detect this afterglow across the entire sky and show that we arebathed in this radiation that dates from when the universe was barely 300,000 years old.
3. Spectroscopic observation of the universe shows its chemical composition to be roughly75% hydrogen, 25% helium by mass (12 to 1 ratio of hydrogen to helium atoms). Thecreation of so much helium from hydrogen in nuclear reactions could only have hap-pened if the universe was at some point in time very hot and very dense.
In this activity students examine the first line of evidence, galactic motion. Galaxies are solarge, and so far away, that you could never see them move just by looking – even if youlooked for a whole lifetime through the most powerful telescope! However, there is a way to detect the motion of a galaxy. By examining the spectrum of light from a galaxy, you candetermine whether the galaxy is moving toward or away from us, and how fast. Students willlook at optical images of four galaxies. They will then compare the emission spectra fromthese same four galaxies and measure the wavelength of the red hydrogen line for each galaxy.Because of the Doppler effect, the wavelength will shift as the source travels through space.
Suggestions for Introducing the ActivityStudents should already be familiar with the electromagnetic spectrum and understand thatatoms emit and absorb light of fixed standard wavelengths. In Part 2, students observe the red-shift of the hydrogen lines in the spectra of galaxies. You may wish to introduce the concept ofDoppler shift before completing this activity, or use the activity to motivate a discussion aboutthe relationship between motion and wavelength. For an online tutorial about the Doppler effect,visit cfa-www.harvard.edu/seuforum/galSpeed or www.pbs.org/wgbh/nova/universe/moving.html.
* This is adapted from an online activity: How Fast Do Galaxies Move? AnInteractive Lab. Produced for NASA’s Office of Space Science by the SmithsonianAstrophysical Observatory © 2001 Smithsonian Institution. It can be found at: http://cfa-www.harvard.edu/seuforum/galSpeed
The Universe at Your Fingertips • Astronomical Society of the Pacific
Galaxies and the Universe H9 • Modeling the Expanding Universe
Page 11
Part 1. Looking at SpectraAtoms emit and absorb light of fixed, standard wavelengths. An emission or absorption spec-trum shows a specific pattern of lines that is a kind of “fingerprint,” unique to the particulartypes of molecules. The emission spectrum of glowing hydrogen gas has one bright red line, a fainter blue line, and several other faint lines. The red line for hydrogen has a wavelength of 656 nanometers.
A spectrum of a galaxy is the pattern produced when the light from the galaxy is passedthrough a prism or similar device. The element hydrogen is the most common element in the universe, and it is plentiful in galaxies. Hydrogen is present in huge clouds of gas that fill some of the space between the stars in a galaxy. The bright red hydrogen line is an easilyrecognizable feature in many astronomical spectra.
Procedure• Observe the spectrum of the Sun on the Student Worksheet.
• Observe the spectrum of the fluorescent lamp on the Student Worksheet. Have students record the colors they see and the wavelengths.
• Observe the spectrum of hydrogen gas. Have students record the colors they see andthe wavelengths.
• Look again at the spectrum of the Sun and look for dark lines at these recorded wave-lengths. Although these absorption lines are not as dramatic as the emission lines inthe pure hydrogen spectrum, their presence tells us that the Sun contains hydrogen,and that this hydrogen is absorbing light.
• Observe the spectrum of the sample galaxy on the Student Worksheet. Determine thewavelength of the red hydrogen line in this spectrum. Note that the position of thispeak is different from the laboratory sample of hydrogen.
• Discuss why the red hydrogen line would be in a different place.
Part 2. Analyzing Galactic Spectra, Calculating and Graphing Galactic SpeedAs students observe the emission spectra from four different galaxies, they will observe that ineach spectrum the bright red hydrogen line has shifted from its characteristic wavelength of656 nanometers, as seen in the laboratory spectrum of hydrogen gas. This shift toward thelonger wavelength part of the spectrum, which is the redder end of the spectrum, is called“redshift.”
The observed redshift can be used to calculate the galaxy’s velocity. The amount of theobserved redshift is proportional to the speed of the source (for speeds that are not close tothe speed of light). For example, light from a galaxy moving away from us at 10% of the speedof light will be redshifted by 10%. The hydrogen line that was at 656 nanometers will be red-shifted by about 65 nanometers to 721 nanometers. (As speeds approach the speed of light,the principles of relativity must be used to explain the relationship between an object’s red-shift and its speed. However, the speeds of the galaxies in this activity are much less than thespeed of light, so the simple proportion described above can be used.)
Using the galactic spectra, students will calculate how fast Galaxies A, B, C, and D are recedingfrom us, and graph that in relation to the galaxy’s estimated distance from us.
Cosmic Questions Educator’s Guide 48
The Universe at Your Fingertips • Astronomical Society of the Pacific
Galaxies and the Universe H9 • Modeling the Expanding Universe
Page 12
Evidence for the Expanding Universe 49
Procedure• Give each student or small group of students optical images of the four galaxies, A, B,
C, and D.
• Tell students to assume that these four galaxies are all approximately the same actual size.
• Ask students to arrange the four galaxies in order of distance from the earth. Discusswhat evidence they used for their choices.
• Label the graph on the student worksheet by writing the letters of the galaxies in orderof their estimated distance along the x- axis.
• Give each student or small group of students the spectra of the four galaxies, A, B, C,and D.
• Determine the wavelength of the red hydrogen line in the spectra from galaxies, A, B, Cand D. Record these on the worksheet.
• Compare the wavelength of the red hydrogen line in each galactic spectrum to the labo-ratory sample of hydrogen gas. By how much has the line been shifted? What fraction ofthe original wavelength is it? At what fraction of the speed of light is the galaxy moving?
• Calculate the recession velocity of the four galaxies using the Student Worksheet.
• Plot the velocity data on the y-axis of the graph on the Student Worksheet.
Discussion NotesIn the 1920s, Edwin Hubble measured redshifts to determine the velocities of galaxies. Hefound that there was a linear relationship between a galaxy’s distance from us and how fastthat galaxy is receding (its recession velocity). This simple relationship can be described inequation form, where the slope of the graph of distance vs. velocity represents the HubbleConstant for the universe.
v = H x d
Recession velocity = Hubble’s constant x distance from us
This equation, known as Hubble’s Law, states that a galaxy at double the distance will havedouble the velocity; at triple the distance, it will have triple the velocity. Hubble’s Law isimportant in understanding the age and size of the universe, and is described further in thebackground information for the previous activity, Modeling the Expanding Universe.
Suggested Answers
These notes provide answers to some of the questions on the Student Worksheets and can beused to help guide a class discussion.
In Part 1, when looking at the pure hydrogen spectrum, students should measure peaks at 656 nanometers, 486 nanometers, and 434 nanometers. Although this third line is not visiblein the color image, it can be measured on the graph. All three of these lines appear in thespectrum of the Sun and may be easier to find in the graph than in the color image.
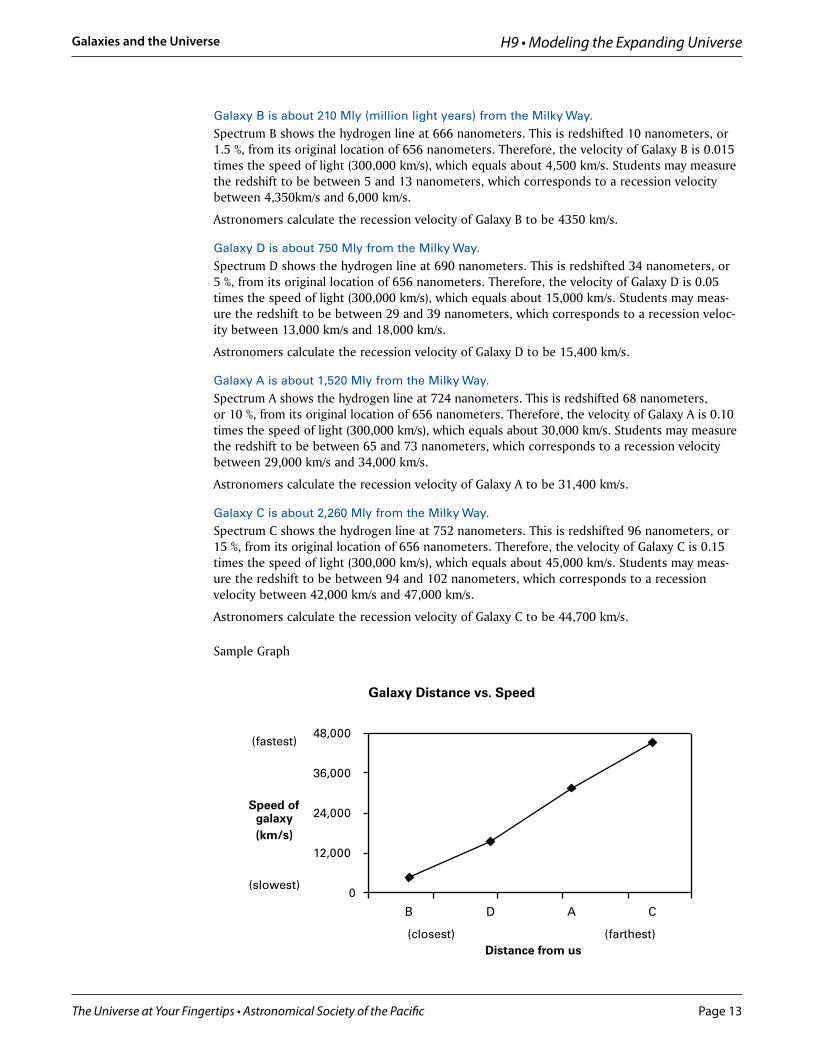
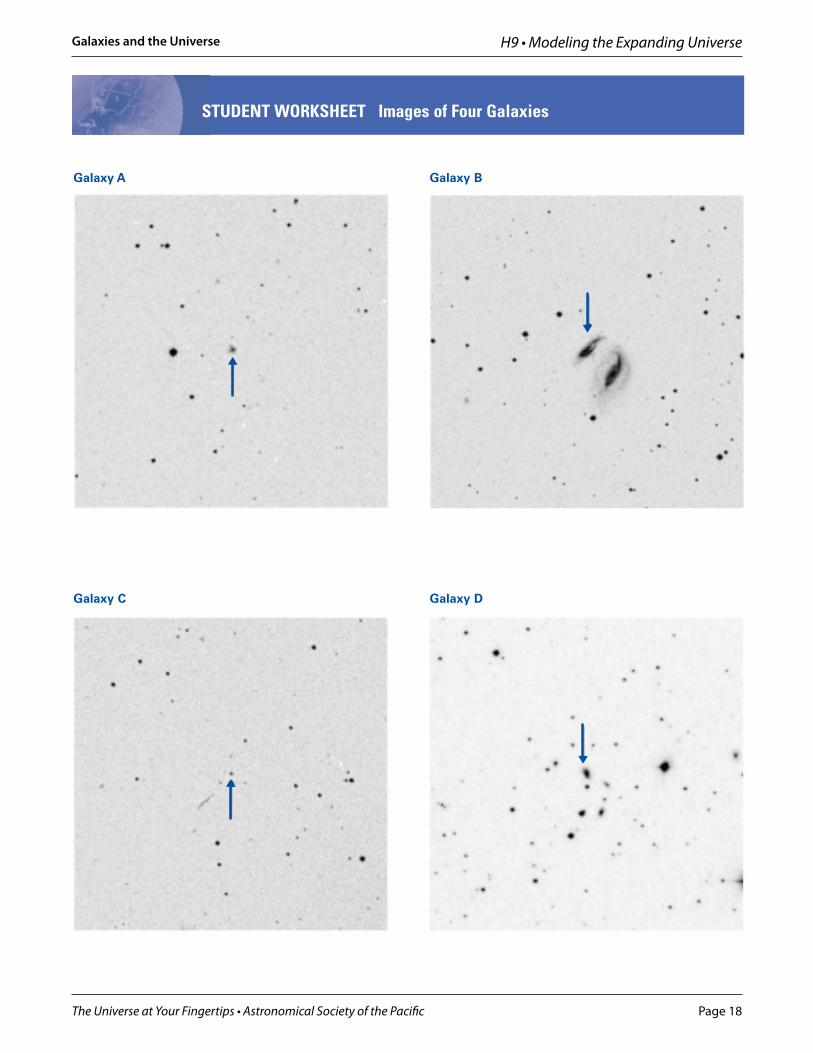
In Part 2, we have assumed all the galaxies are all the same actual size. Therefore, Galaxy B,which appears largest in the optical image, is presumed to be closest to us. Accordingly, thesmallest image (C) is farthest away. In order from closest to farthest, the galaxies are B, D, A,and then C.
The Universe at Your Fingertips • Astronomical Society of the Pacific
Galaxies and the Universe H9 • Modeling the Expanding Universe
Page 13
Cosmic Questions Educator’s Guide 50
Galaxy Distance vs. Speed
0
12,000
24,000
36,000
48,000
B D A C
(fastest)
Speed ofgalaxy
(slowest)
(closest) (farthest)Distance from us
(km/s)
Galaxy B is about 210 Mly (million light years) from the Milky Way.
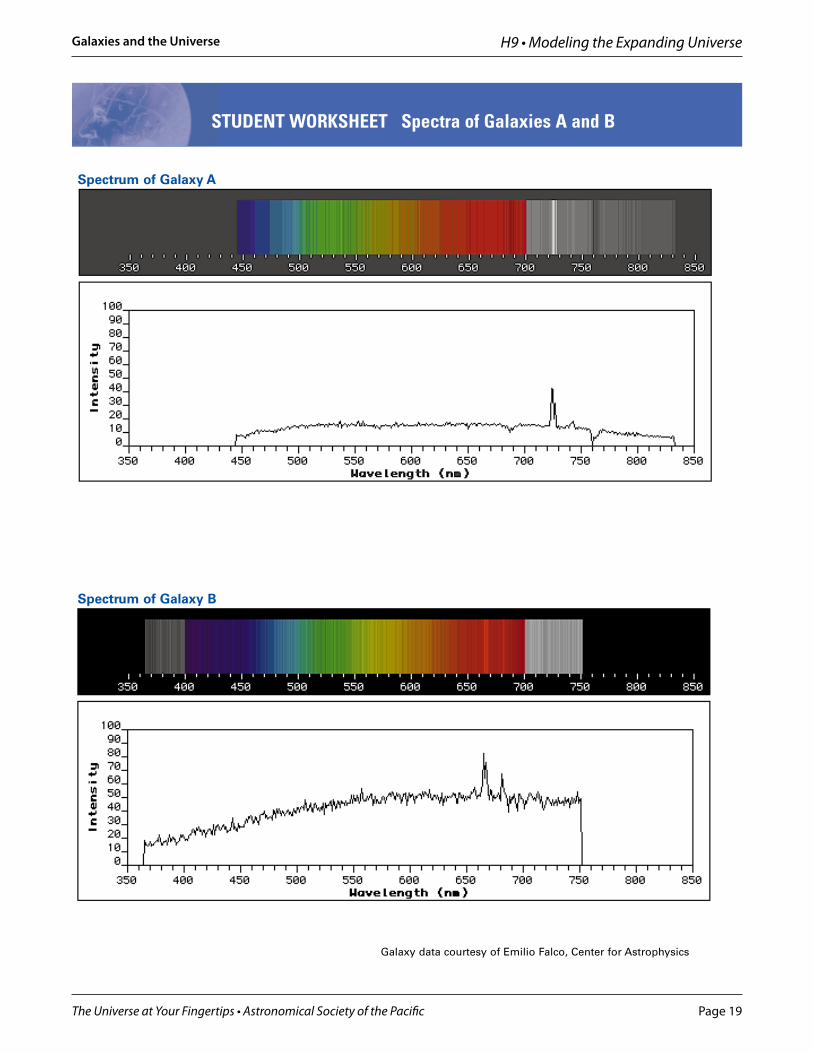
Spectrum B shows the hydrogen line at 666 nanometers. This is redshifted 10 nanometers, or1.5 %, from its original location of 656 nanometers. Therefore, the velocity of Galaxy B is 0.015times the speed of light (300,000 km/s), which equals about 4,500 km/s. Students may measurethe redshift to be between 5 and 13 nanometers, which corresponds to a recession velocitybetween 4,350km/s and 6,000 km/s.
Astronomers calculate the recession velocity of Galaxy B to be 4350 km/s.
Galaxy D is about 750 Mly from the Milky Way.
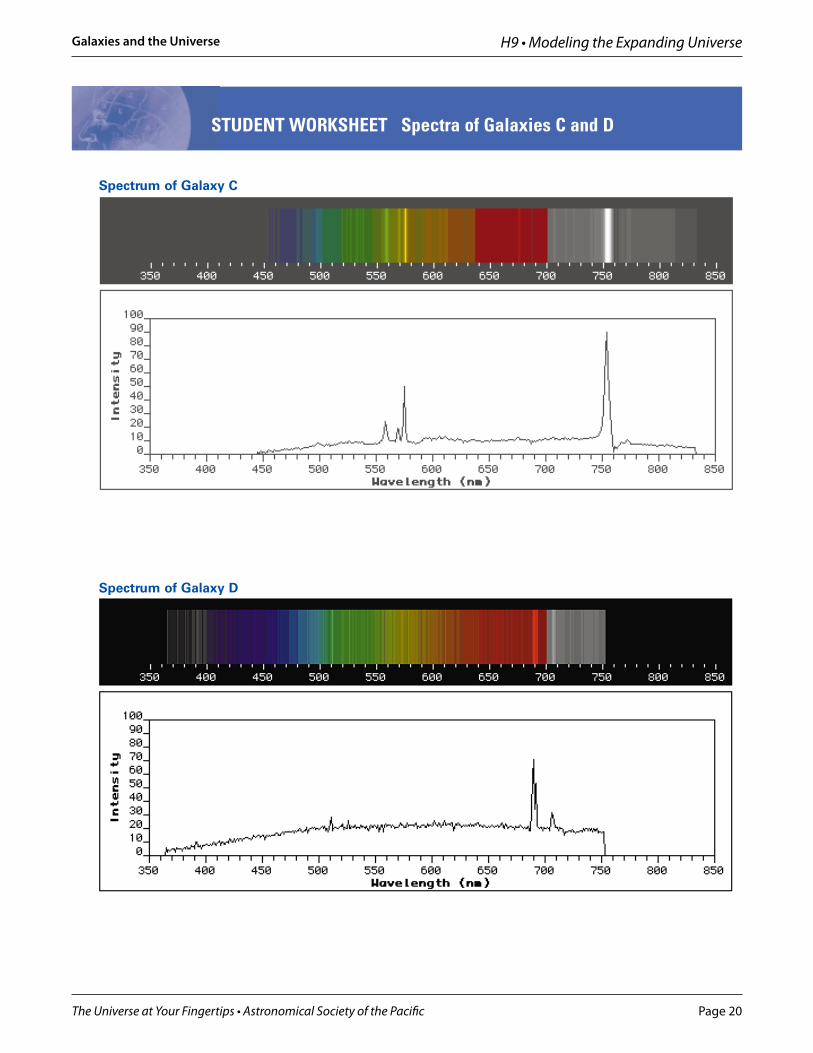
Spectrum D shows the hydrogen line at 690 nanometers. This is redshifted 34 nanometers, or5 %, from its original location of 656 nanometers. Therefore, the velocity of Galaxy D is 0.05times the speed of light (300,000 km/s), which equals about 15,000 km/s. Students may meas-ure the redshift to be between 29 and 39 nanometers, which corresponds to a recession veloc-ity between 13,000 km/s and 18,000 km/s.
Astronomers calculate the recession velocity of Galaxy D to be 15,400 km/s.
Galaxy A is about 1,520 Mly from the Milky Way.
Spectrum A shows the hydrogen line at 724 nanometers. This is redshifted 68 nanometers, or 10 %, from its original location of 656 nanometers. Therefore, the velocity of Galaxy A is 0.10times the speed of light (300,000 km/s), which equals about 30,000 km/s. Students may measurethe redshift to be between 65 and 73 nanometers, which corresponds to a recession velocitybetween 29,000 km/s and 34,000 km/s.
Astronomers calculate the recession velocity of Galaxy A to be 31,400 km/s.
Galaxy C is about 2,260 Mly from the Milky Way.
Spectrum C shows the hydrogen line at 752 nanometers. This is redshifted 96 nanometers, or15 %, from its original location of 656 nanometers. Therefore, the velocity of Galaxy C is 0.15times the speed of light (300,000 km/s), which equals about 45,000 km/s. Students may meas-ure the redshift to be between 94 and 102 nanometers, which corresponds to a recessionvelocity between 42,000 km/s and 47,000 km/s.
Astronomers calculate the recession velocity of Galaxy C to be 44,700 km/s.
Sample Graph
The Universe at Your Fingertips • Astronomical Society of the Pacific
Galaxies and the Universe H9 • Modeling the Expanding Universe
Page 14
Evidence for the Expanding Universe 51
The Sun
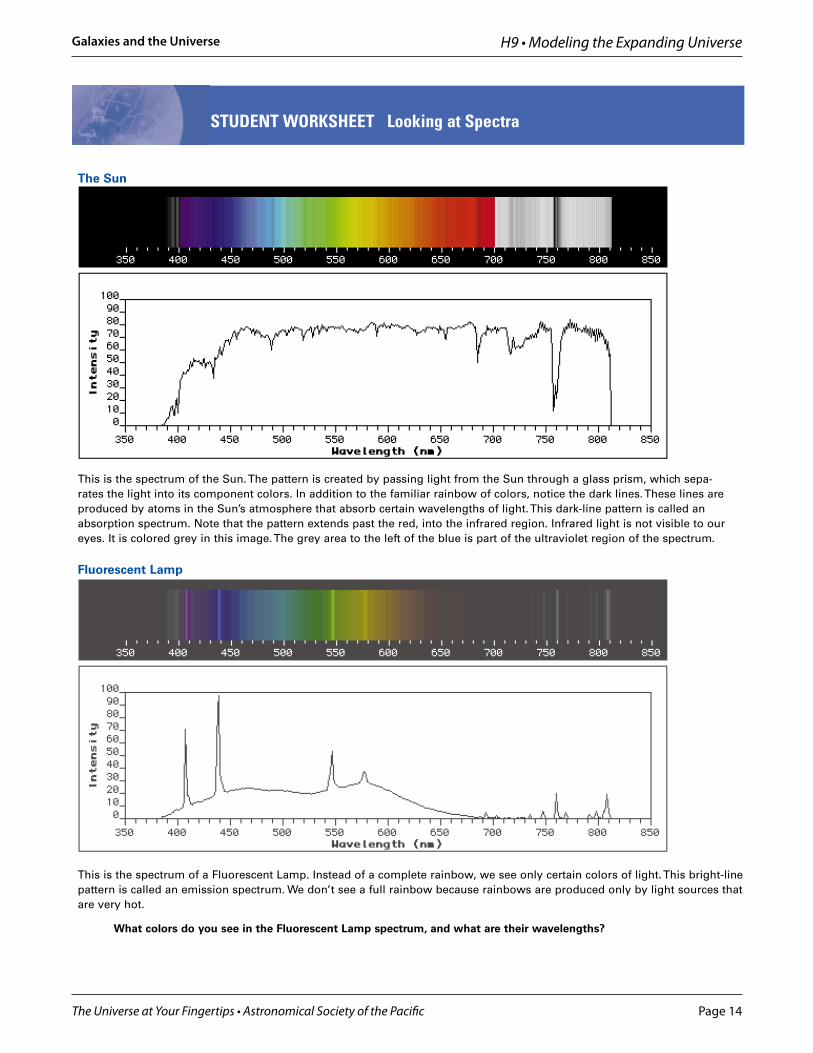
STUDENT WORKSHEET Looking at Spectra
This is the spectrum of the Sun. The pattern is created by passing light from the Sun through a glass prism, which sepa-rates the light into its component colors. In addition to the familiar rainbow of colors, notice the dark lines. These lines areproduced by atoms in the Sun’s atmosphere that absorb certain wavelengths of light. This dark-line pattern is called anabsorption spectrum. Note that the pattern extends past the red, into the infrared region. Infrared light is not visible to oureyes. It is colored grey in this image. The grey area to the left of the blue is part of the ultraviolet region of the spectrum.
Fluorescent Lamp
This is the spectrum of a Fluorescent Lamp. Instead of a complete rainbow, we see only certain colors of light. This bright-linepattern is called an emission spectrum. We don’t see a full rainbow because rainbows are produced only by light sources thatare very hot.
What colors do you see in the Fluorescent Lamp spectrum, and what are their wavelengths?
The Universe at Your Fingertips • Astronomical Society of the Pacific
Galaxies and the Universe H9 • Modeling the Expanding Universe
Page 15Cosmic Questions Educator’s Guide 52
STUDENT WORKSHEET Looking at Spectra (continued)
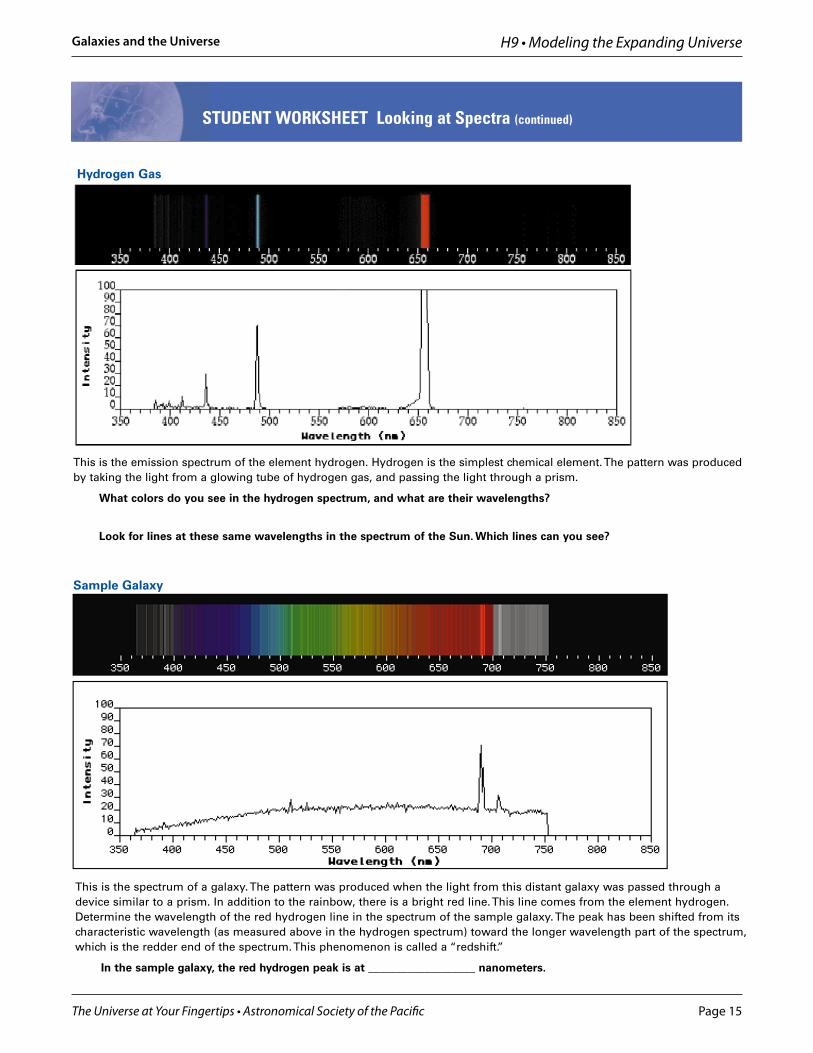
This is the spectrum of a galaxy. The pattern was produced when the light from this distant galaxy was passed through adevice similar to a prism. In addition to the rainbow, there is a bright red line. This line comes from the element hydrogen.Determine the wavelength of the red hydrogen line in the spectrum of the sample galaxy. The peak has been shifted from itscharacteristic wavelength (as measured above in the hydrogen spectrum) toward the longer wavelength part of the spectrum,which is the redder end of the spectrum. This phenomenon is called a “redshift.”
In the sample galaxy, the red hydrogen peak is at ___________________ nanometers.
This is the emission spectrum of the element hydrogen. Hydrogen is the simplest chemical element. The pattern was producedby taking the light from a glowing tube of hydrogen gas, and passing the light through a prism.
What colors do you see in the hydrogen spectrum, and what are their wavelengths?
Look for lines at these same wavelengths in the spectrum of the Sun. Which lines can you see?
Sample Galaxy
Hydrogen Gas
The Universe at Your Fingertips • Astronomical Society of the Pacific
Galaxies and the Universe H9 • Modeling the Expanding Universe
Page 16
Evidence for the Expanding Universe 53
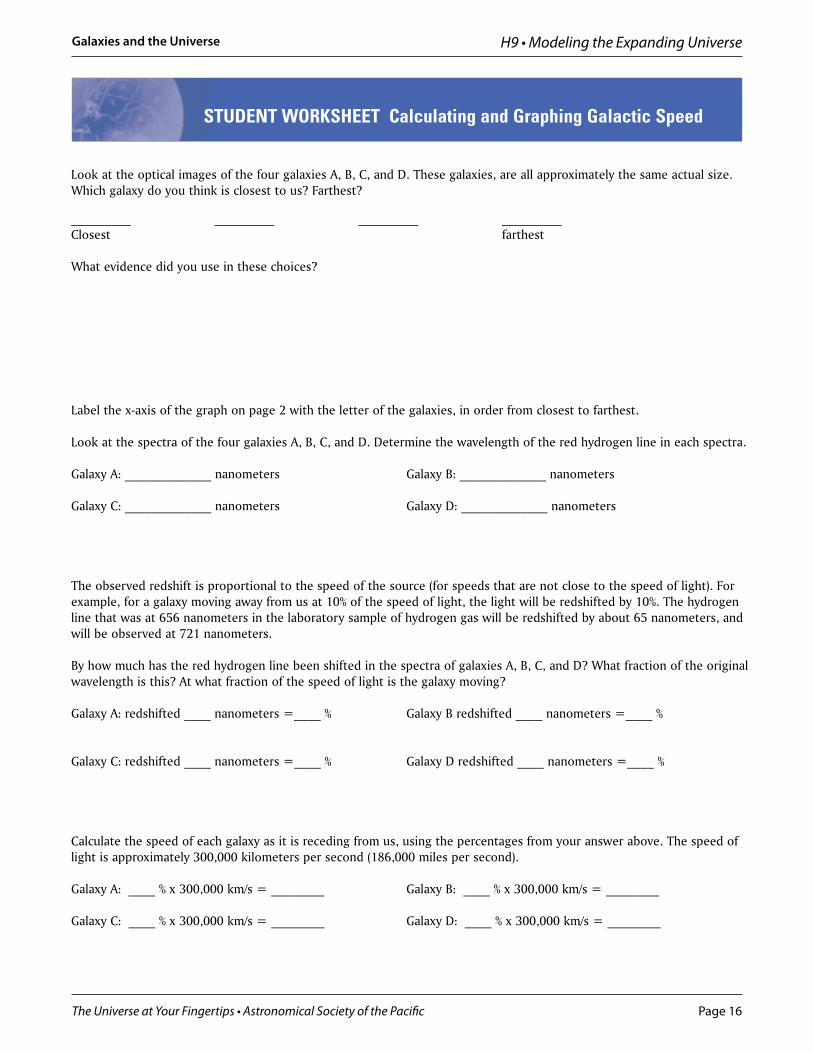
Look at the optical images of the four galaxies A, B, C, and D. These galaxies, are all approximately the same actual size.Which galaxy do you think is closest to us? Farthest?
_________ _________ _________ _________Closest farthest
What evidence did you use in these choices?
Label the x-axis of the graph on page 2 with the letter of the galaxies, in order from closest to farthest.
Look at the spectra of the four galaxies A, B, C, and D. Determine the wavelength of the red hydrogen line in each spectra.
Galaxy A: _____________ nanometers Galaxy B: _____________ nanometers
Galaxy C: _____________ nanometers Galaxy D: _____________ nanometers
The observed redshift is proportional to the speed of the source (for speeds that are not close to the speed of light). Forexample, for a galaxy moving away from us at 10% of the speed of light, the light will be redshifted by 10%. The hydrogenline that was at 656 nanometers in the laboratory sample of hydrogen gas will be redshifted by about 65 nanometers, andwill be observed at 721 nanometers.
By how much has the red hydrogen line been shifted in the spectra of galaxies A, B, C, and D? What fraction of the originalwavelength is this? At what fraction of the speed of light is the galaxy moving?
Galaxy A: redshifted ____ nanometers =____ % Galaxy B redshifted ____ nanometers =____ %
Galaxy C: redshifted ____ nanometers =____ % Galaxy D redshifted ____ nanometers =____ %
Calculate the speed of each galaxy as it is receding from us, using the percentages from your answer above. The speed oflight is approximately 300,000 kilometers per second (186,000 miles per second).
Galaxy A: ____ % x 300,000 km/s = ________ Galaxy B: ____ % x 300,000 km/s = ________
Galaxy C: ____ % x 300,000 km/s = ________ Galaxy D: ____ % x 300,000 km/s = ________
STUDENT WORKSHEET Calculating and Graphing Galactic Speed
The Universe at Your Fingertips • Astronomical Society of the Pacific
Galaxies and the Universe H9 • Modeling the Expanding Universe
Page 17
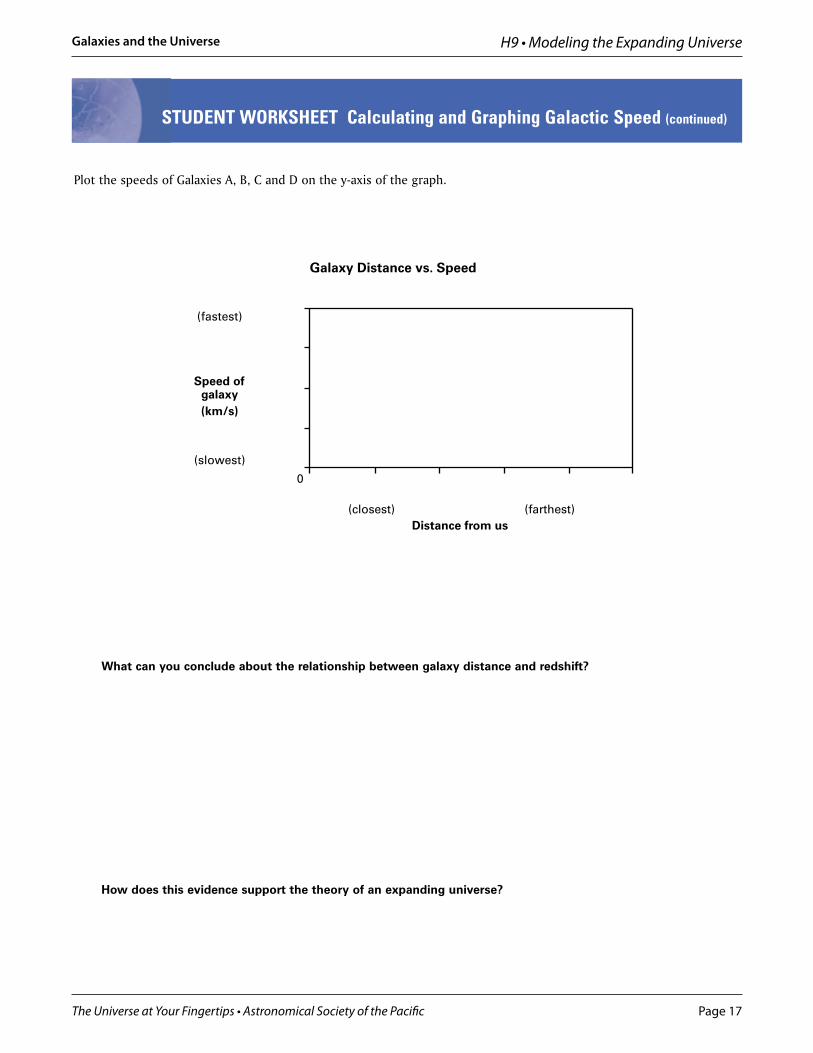
Plot the speeds of Galaxies A, B, C and D on the y-axis of the graph.
What can you conclude about the relationship between galaxy distance and redshift?
How does this evidence support the theory of an expanding universe?
Cosmic Questions Educator’s Guide 54
STUDENT WORKSHEET Calculating and Graphing Galactic Speed (continued)
Speed ofgalaxy(km/s)
Galaxy Distance vs. Speed
0
(fastest)
(slowest)
(closest) (farthest)Distance from us
The Universe at Your Fingertips • Astronomical Society of the Pacific
Galaxies and the Universe H9 • Modeling the Expanding Universe
Page 18
Evidence for the Expanding Universe 55
Galaxy A Galaxy B
Galaxy C Galaxy D
STUDENT WORKSHEET Images of Four Galaxies
The Universe at Your Fingertips • Astronomical Society of the Pacific
Galaxies and the Universe H9 • Modeling the Expanding Universe
Page 19
Evidence for the Expanding Universe 57
Spectrum of Galaxy A
Spectrum of Galaxy B
STUDENT WORKSHEET Spectra of Galaxies A and B
Galaxy data courtesy of Emilio Falco, Center for Astrophysics
Evidence for the Expanding Universe 57
Spectrum of Galaxy A
Spectrum of Galaxy B
STUDENT WORKSHEET Spectra of Galaxies A and B
Galaxy data courtesy of Emilio Falco, Center for Astrophysics
The Universe at Your Fingertips • Astronomical Society of the Pacific
Galaxies and the Universe H9 • Modeling the Expanding Universe
Page 20
Cosmic Questions Educator’s Guide 58
STUDENT WORKSHEET Spectra of Galaxies C and D
Spectrum of Galaxy C
Spectrum of Galaxy D