activity guidebook for ncsc 2014 & 2015: version 2.0 part –i
TRANSCRIPT

Activity Guidebook for NCSC 2014 & 2015: Version 2.0
1
PPaarrtt ––II
AAbboouutt NNCCSSCC

Activity Guidebook for NCSC 2014 & 2015: Version 2.0
2
Graphics/Illustration

Activity Guidebook for NCSC 2014 & 2015: Version 2.0
3
About Children’s Science Congress (CSC)
1. CSC- The Beginning
The seeds of the programme of children’s science congress (CSC), in the way of an
exercise to carry out small research activities at micro-level were planned in Madhya
Pradesh by an NGO called Gwalior Science Center. It was later adopted by National
Council for Science and Technology Communication (NCSTC), Department of Science
& Technology (DST), Government of India for carrying out national level activities
through NCSTC-Network (a network of Non-Government and Government
organizations working in the field of science popularization) as national organizer. It
was a time when many of the country’s crusaders of science communication were
experienced with massive science communication exercise of Bharat Jana
BigyanJatha and Bharat Jana GyanBigyanJatha. It was felt that the large scale
activities for developing science awareness among the masses are to be continued as
regular activity, so, this programme was launched nationwide in 1993, under
nomenclature National Children’s Science Congress (NCSC), with an expectation that
it would generate scientific temperament among the teachers and students, and
spread among the various stakeholders of the society. The programme of NCSC has
been fruitfully conducted for the last 21 years.
2. CSC: An overview
Children’s Science Congress is targeted to spread the concept of the method of
science among the children their project activities adopting the principle of learning
through doing’. The mandate of participation is that, the children will carry out a
project on a particular topic in relation to theme and sub-theme decided for the year.
The study is to be carried out in the neighbourhood of the children where they live.
For this, the students form a group with their like-minded friends/classmates and the
study is carried out under the supervision of a guide. It is noteworthy that, CSC
programme is not only for the school going children but is also open fort the
children outside the formal boundary of schools, in the age group of 10 to 17 years
(where 10 to 14 years is considered as junior group and 14 + to 17 years as senior
group). Further, it is not mandatory that a guide must be a school teacher; any
persons with fair knowledge of dealing with children and method of science are
considered eligible to guide the children, but should not be direct relative of any of
the children.
The exercise of project activities, as thumb rule, encourages the children to explore,
think, serve and wonder. It is capable to imbibe the following
temperament/quality/skill of the children:
• Observation
• Making measurement,
• Making comparison and contrasts,
• Classification,
• Estimation,

Activity Guidebook for NCSC 2014 & 2015: Version 2.0
4
• Prediction,
• Interpretation,
• Critical thinking,
• Creative thinking,
• Drawing conclusion and
• Cooperative skill
Activity Guidebook for NCSC 2014 & 2015: Version 2.0
5
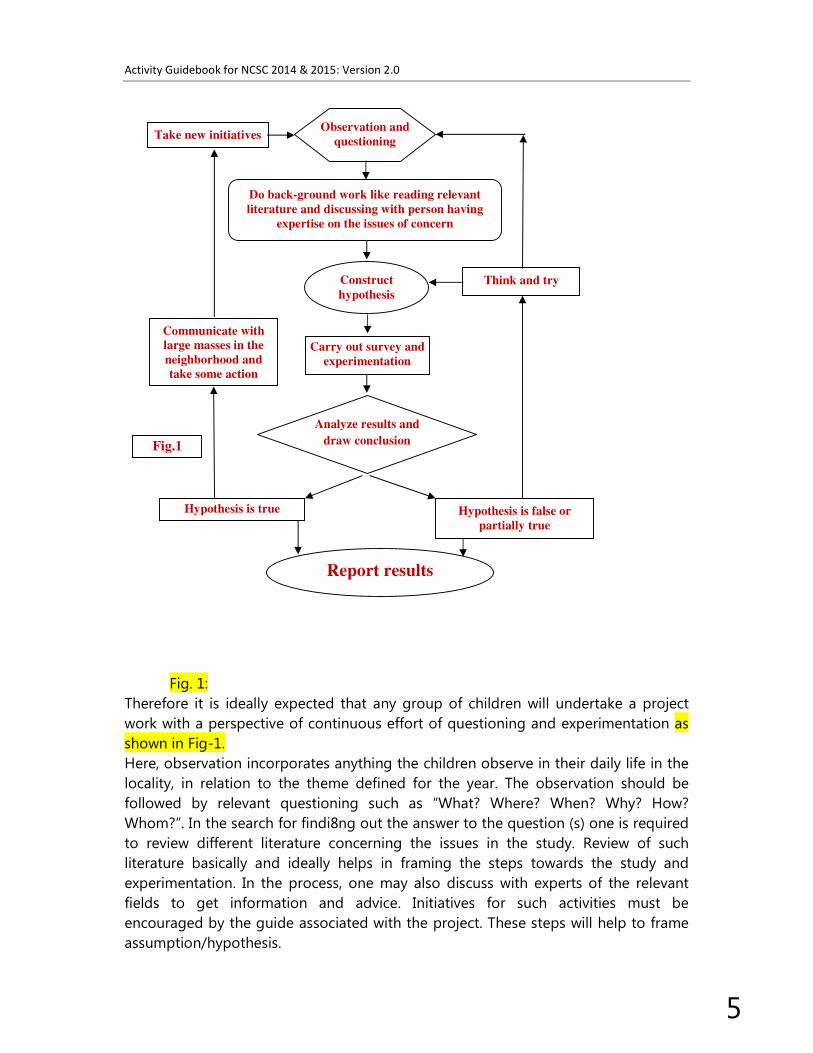
Fig. 1:
Therefore it is ideally expected that any group of children will undertake a project
work with a perspective of continuous effort of questioning and experimentation as
shown in Fig-1.
Here, observation incorporates anything the children observe in their daily life in the
locality, in relation to the theme defined for the year. The observation should be
followed by relevant questioning such as “What? Where? When? Why? How?
Whom?”. In the search for findi8ng out the answer to the question (s) one is required
to review different literature concerning the issues in the study. Review of such
literature basically and ideally helps in framing the steps towards the study and
experimentation. In the process, one may also discuss with experts of the relevant
fields to get information and advice. Initiatives for such activities must be
encouraged by the guide associated with the project. These steps will help to frame
assumption/hypothesis.
Think and try
again
Observation and
questioning
Do back-ground work like reading relevant
literature and discussing with person having
expertise on the issues of concern
Construct
hypothesis
Carry out survey and
experimentation
Analyze results and
draw conclusion
Hypothesis is true Hypothesis is false or
partially true
Report results
Communicate with
large masses in the
neighborhood and
take some action
Take new initiatives
Fig.1
Activity Guidebook for NCSC 2014 & 2015: Version 2.0
6
Hypothesis is an assumption of some cause and its impact on the basic of
observation, information collected from different literature and emerged from
discussion with experts. After these phases, actual study through survey or
experimentation or survey followed by experimentation would start. In the case of
survey-based work, identification of respondent, their unit of observation, sample
coverage, design of survey in relation to designing of interview schedule or
questionnaire is supposed to be the most critical steps. Such decisions may vary with
the issues of study. On the other hand, in case of experimentation, setting the
objective of experimentation, defining different parameters, identification of ideal
instruments, framing of procedures/ steps and control along with repetitive
observation of the experiments are critical decisions, which will determine the path
towards the result. Again in relation to issues of study, such experiment may be
either laboratory experiments or field experiments.
It is expected that in course of time, the children’s project will bring in lots of new
information about problems and prospects of their locality along with innovative
ideas to address these issues. Moreover, in the course of project work, the children
may develop different new approaches of study along with the development of
different instruments for their experiments. Such tools/instruments may be
developed with the material in their access/available to them nearby. Another
expectation was that the outcome of different studies will be communicated among
the local populace, which in turn, helps in generating scientific temperament among
the general mass.
In a nutshell, the CSC projects are simple, innovative, concerned with local issues
related with day to day life and are carried out with very nominal cost, where the
focus is more on logical interpretation and analysis of issues, and finding out
pragmatic solutions of generic nature to the possible extent, and not merely
confined to the study topic and corresponding model making.
3. Objectives of CSC
The primary objective of the Children’s Science Congress is to make a forum available
to children of the age-group of 10-17 years, both from formal school system as well
as from out of school, to exhibit their creativity and innovativeness and more
particularly their ability to solve a societal problem experienced locally using the
method of science.
By implication, the CSC prompts children to think of some significant societal
problems, ponder over its causes and subsequently try and solve the same using the
scientific process. This involves close and keen observation, raising pertinent
questions, building models, predicting solutions on the basis of a model, trying out
various possible alternatives and arriving at an optimum solution using
Activity Guidebook for NCSC 2014 & 2015: Version 2.0
7
“A social movement along the
lines of the Children’s Science
Congress should be visualized
in order to promote discovery
learning across the nation,
and eventually throughout
South Asia” – National
Curriculum Framework 2005,
Executive Summary, Page (ix)
experimentation, field work, research and innovative ideas. The Children’s Science
Congress encourages a sense of discovery. It emboldens the participants to question
many aspects of our progress and development and express their findings in their
vernacular.
4. Relevance of CSC in the light of
contemporary educational initiatives
The basic approach of CSC is the principle of learning
through doing on the issues of children’s immediate
environment significantly caries the spirit and mandate
of education for sustainable development (ESD) of
UNESCO, National Curriculum Framework (NCF, 2005)
and Right to Education (RTE, 2009).
The modalities and approaches of CSC cater to the five pillars of learning of
education for Sustainable Development vividly, viz. Learning to know, learning to do,
learning to live together and learning to be, learning to transform one self and
society (Declaration of ESD in the 57th meeting of the United Nations General
Assembly in December 2002, which proclaimed the UN Decade Education for
sustainable Development, 2005-2014, refer – www.desd.org and www.unesco.org)
The mandate of CSC which encourages children to observe, explore, experiment and
wonder through a project activity and its associated ways of participation and
evaluation rightly takes care of the guiding principles of the NCF, 2005. Therefore,
example of children’s Science Congress has been rightly cited in the NCF documents
under executive summary section, page ix (http://www.teindia.nic.in/Files/NCF-
2005.pdf).
Similarly CSC activities also helps in materializing the approach of learning as framed
in the Right of Children of Free and Compulsory Education (RTE)Act, 2005
[particularly in relation to article 6.1, section C (ii, iii, iv and v)].
More over the CSC activities, since 1993, has catered to many of the approaches and
priorities of Science education visualized in the National Programme of
SarbaShikshaAbhijan (SSA) (Ref:SSA framework,
http//ssakarnataka.gov.in/pdfs/aboutus/ssa_framework%20.pdf) and
RashtriyaMadhyamikShikshaAbhijan (RMSA) (Ref:http://www.educationfor-
allinindia.com/rastriya-madhyamic-shiksha-mission-RMSM.pdf).
5. Eligibility Criteria for Participants
Activity Guidebook for NCSC 2014 & 2015: Version 2.0
8
• It is open for children in the age of 10 years to 14 years (lower age group) and
from 14+ years to 17 years (upper age group) as on December 31 of the
calendar year.
• A group of children not exceeding five can do the project study under a guide
teacher.
• A child scientist, who had already presented as a Group Leader at the
National Level in one age-group can act as a co-worker in the subsequent
year, in the same age group (lower / upper).
• Parents, whose child would participate in the Children’s Science Congress in
the ensuing year, should not hold any portfolio in the organizing committee
of the CSC conducted at any level.
Activity Guidebook for NCSC 2014 & 2015: Version 2.0
9
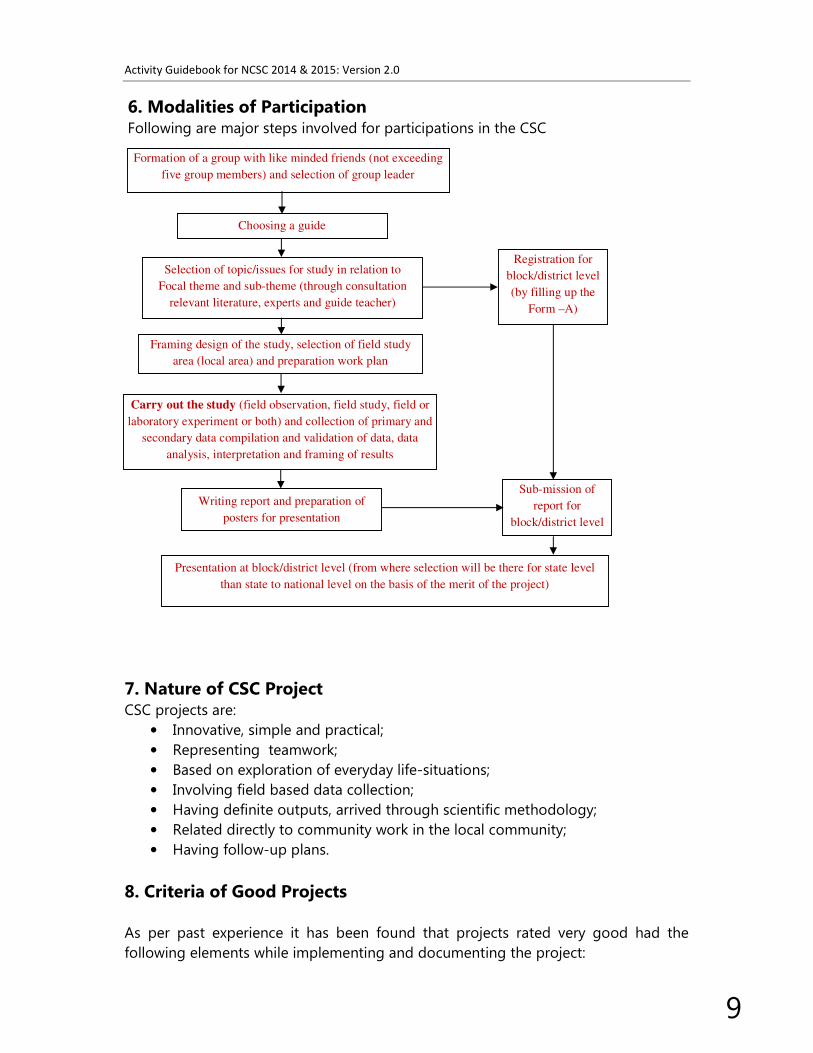
6. Modalities of Participation Following are major steps involved for participations in the CSC
7. Nature of CSC Project CSC projects are:
• Innovative, simple and practical;
• Representing teamwork;
• Based on exploration of everyday life-situations;
• Involving field based data collection;
• Having definite outputs, arrived through scientific methodology;
• Related directly to community work in the local community;
• Having follow-up plans.
8. Criteria of Good Projects
As per past experience it has been found that projects rated very good had the
following elements while implementing and documenting the project:
Formation of a group with like minded friends (not exceeding
five group members) and selection of group leader
Choosing a guide
Selection of topic/issues for study in relation to
Focal theme and sub-theme (through consultation
relevant literature, experts and guide teacher)
Framing design of the study, selection of field study
area (local area) and preparation work plan
Carry out the study (field observation, field study, field or
laboratory experiment or both) and collection of primary and
secondary data compilation and validation of data, data
analysis, interpretation and framing of results
Registration for
block/district level
(by filling up the
Form –A)
Writing report and preparation of
posters for presentation
Sub-mission of
report for
block/district level
Presentation at block/district level (from where selection will be there for state level
than state to national level on the basis of the merit of the project)
Activity Guidebook for NCSC 2014 & 2015: Version 2.0
10
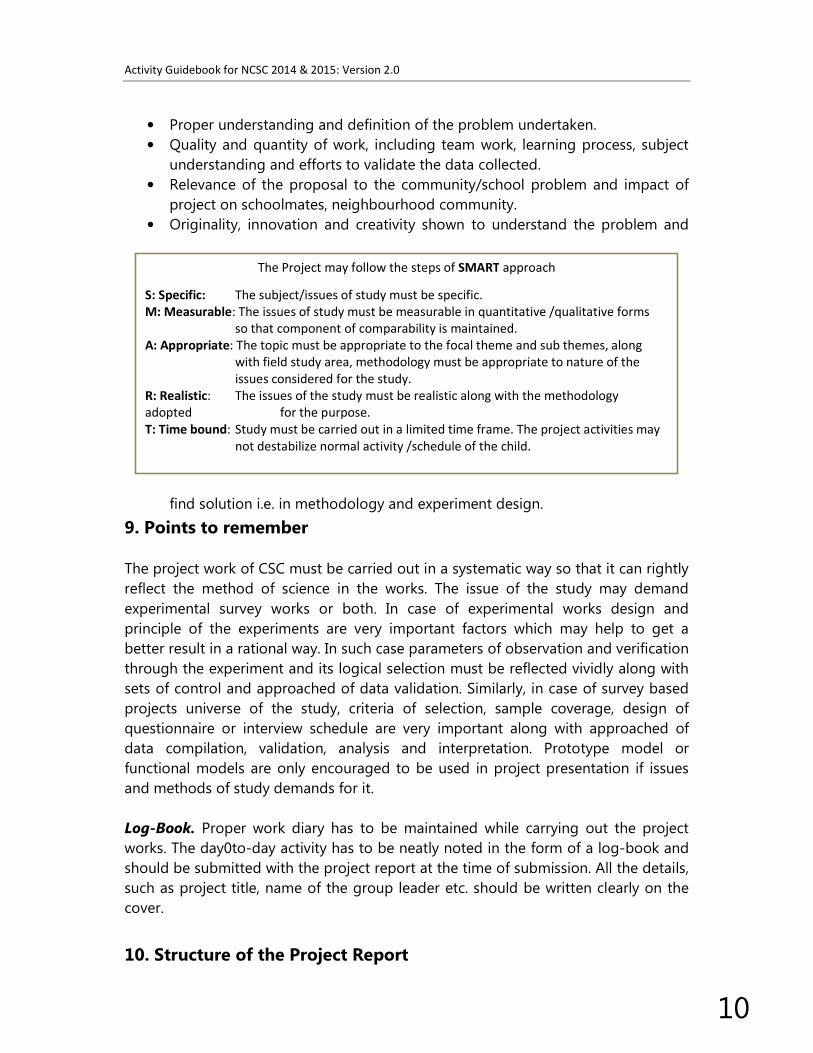
The Project may follow the steps of SMART approach
S: Specific: The subject/issues of study must be specific.
M: Measurable: The issues of study must be measurable in quantitative /qualitative forms
so that component of comparability is maintained.
A: Appropriate: The topic must be appropriate to the focal theme and sub themes, along
with field study area, methodology must be appropriate to nature of the
issues considered for the study.
R: Realistic: The issues of the study must be realistic along with the methodology
adopted for the purpose.
T: Time bound: Study must be carried out in a limited time frame. The project activities may
not destabilize normal activity /schedule of the child.
• Proper understanding and definition of the problem undertaken.
• Quality and quantity of work, including team work, learning process, subject
understanding and efforts to validate the data collected.
• Relevance of the proposal to the community/school problem and impact of
project on schoolmates, neighbourhood community.
• Originality, innovation and creativity shown to understand the problem and
find solution i.e. in methodology and experiment design.
9. Points to remember
The project work of CSC must be carried out in a systematic way so that it can rightly
reflect the method of science in the works. The issue of the study may demand
experimental survey works or both. In case of experimental works design and
principle of the experiments are very important factors which may help to get a
better result in a rational way. In such case parameters of observation and verification
through the experiment and its logical selection must be reflected vividly along with
sets of control and approached of data validation. Similarly, in case of survey based
projects universe of the study, criteria of selection, sample coverage, design of
questionnaire or interview schedule are very important along with approached of
data compilation, validation, analysis and interpretation. Prototype model or
functional models are only encouraged to be used in project presentation if issues
and methods of study demands for it.
Log-Book. Proper work diary has to be maintained while carrying out the project
works. The day0to-day activity has to be neatly noted in the form of a log-book and
should be submitted with the project report at the time of submission. All the details,
such as project title, name of the group leader etc. should be written clearly on the
cover.
10. Structure of the Project Report

Activity Guidebook for NCSC 2014 & 2015: Version 2.0
11
The structure of the project report of CSC shall be as follows:
The structure project report of CSC is as follows:
i. Cover page – must incorporate
• Title of the project
• Name and address of Group leader and co-workers
• Name and address of guide
ii. Form – A ( Registration Form)
iii. Abstract – in 250 words for lower age group and 300 words upper age
group (one copy in English) Please see Annexure VI for the Format for
writing the Abstract.
iv. Contents- list of chapter with detail heading and sub-heading, list of
table, chart, maps, etc. along with references against page numbers
v. Introduction- description on background of the study
vi. Aims and objectives of the study
vii. Hypothesis
viii. Need statement & Relevance.
ix. Methodology:
i. Experimentation,
ii. Survey (if related to the project, neatly describe Survey
methodologyfollowed, sampling procedure, Sample size etc.)
Remember that projects having only a Survey component do not
qualify to be an NCSC project and would be rejected. Survey can be
an additional component of the methodology, to strengthen the
project outcomes, to understand the Knowledge, Aptitude and
Practices of the population).
x. Observations: By this we mean what we observe during the experiment,
what outcomes are seen etc. Observation can be both qualitative as well
as quantitative, but in NCSC, we mean quantitative mode where we end
up having specific data from the experiments. Please note that
observing some phenomenon is different in scientific parlance where
every observation leads us to better understanding of the phenomenon,
where we generate specific information as to when something
happened, why, under what conditions and what /how much the change
occurred.
xi. Data analysis and interpretation: From the data that we generate
/obtained from the experiments/observations, the data is processed for
better understanding of the phenomenon in a more structured manner.
We can use many tools and methods to analyse the data where we try
to understand the patterns that emerge from it to form results and
later conclusions. We need to remember that the raw data that is
generated is not the Results, rather we use the raw data and interpret
the data using tools /methods (eg. Statistical methods)..
Activity Guidebook for NCSC 2014 & 2015: Version 2.0
12
xii. Results : Results are the output of our compilation of the data into
meaningful outcomes / interpretations and sometimes, we may need to
redo the experiments to get consistent results. If in case, we are not able
to “repeat the experiments”, we need to have adequate replicates so
that adequate data is available for interpretation, and arriving at results.
xiii. Conclusions: This is the logical end of the project where the
experimenter tries to arrive at specific conclusions from the observed
phenomena. In a way, the whole objective of the project was to arrive at
some conclusion, either positive or negative which would lead to a
better understanding of the problem.
xiv. Solution to the problem: Once the problem is understood using the
above steps, then we can attend searching for solutions to the
problems. Most often, the correct understanding of the problem would
lead us to one or many solutions .
xv. Future plan (Including any follow up plans): We can chalk out a future
plan of action for taking the problem further, studying it deeper with
more intensity and with more observations (replications, repeatations
etc.)
xvi. Acknowledgement
xvii. References
The word limit for the written report for the lower age group is 2500 and that for the
upper age group is 3500. The written report can be substantiated by including
limited number of photographs, sketches, illustrations and / or drawings, etc.
11. Oral Presentation:
Oral presentation at the technical sessions of the congress is a very important
component of the entire process. Effective communication during the briefing of the
issues of study, its objectives, methodology adopted for the study, important
observation and findings, vital aspects on the way and approach to solve the
problem or addressing the problem is a very critical part of the exercise, since only 8
minutes’ time is allotted for the purpose. Therefore, one has to plan pragmatically for
this purpose. Children can use 4 different posters (which is mandatory) to make their
presentation easier, clearer and richer. Posters must be prepared on 55 cm x 70 cm
(21.6" x 27.5") drawing sheets (i.e. chart papers). If needed power point presentation
may be used.
Your posters should contain bulleted points/information on (1) The project title, (2)
Names of the group members, (3) Objectives, (4) Map of the area, if any, (5)
Methodology, (6) Results, (7) Conclusion, (8) Solution to the problem. Depending
upon the nature of the project the poster may or may not have a map and/or results.
12. Different levels of Congress

Activity Guidebook for NCSC 2014 & 2015: Version 2.0
13
Children’s Science Congress is organized in three levels where the child scientists and
their project works are screened under common evaluation criteria. The evaluation of
the project is done for its innovativeness, simplicity and practicality. On the basis
of the merit of the project is selected for the next level. The three levels are as
follows:
• Block /district level
• State level
• National level.
The District/Block level Congress is the first level in which projects compete with
one another and are screened for presentation at the State level Congress, which is
the second level. Projects as per State-wise quota (indicated at Annexure- I) are
selected from the State level for the Grand Finale – the National Children’s Science
Congress. Seven to eight lakh child scientists participate at various levels from the
States and the Union Territories.
13. Screening (i) The selection ratio at District/State Level and at State/National Level should
be as follows:
State: District = 1: 15
(Out of 15 projects presented at District 1 will be screened for State Level.)
(ii) State to National As per State-wise quota indicated at Annexure-I. Projects
qualified to take part in the National level are further divided in the ratio of
1:5, where the best projects at the State level are qualified for Oral
Presentation at the National level, whereas the rest of the projects that
come to the National level are qualified for Poster Presentations. (See
Annexure I for details).
(iii) The selection ratio of Lower age group (10 to 14 years of age) to Upper age
group (14+ to 17 years) should be 40:60. For National level, the State
Academic Committee can decide which is the best project that would
qualify for Oral Presentation irrespective of age group or Rural/Urban.
14. Tentative Activity Schedule
1) Selection of subjects and activity for registration of teams : June-July
2) Working on the project: Minimum two months
3) District level Congress: By September-October
4) State level Congress: By November
5) National level Congress: 27-31 December
6) Indian Science Congress – 3 to 7th January.
7) ‘Kishore VaigyanikSammelan’ (at Indian Science Congress) from 3rd to 6th January.
Activity Guidebook for NCSC 2014 & 2015: Version 2.0
14
15. Approaches of Project Evaluation The innovative ideas and scientific methodology are the basis of a good project but
one has to prove his communication skills also to make others listen and understand
his findings. For doing this, a total cooperation in the group is a must. Accept
positive criticism within the group or even from outside and improve the work plan.
This will bring award and recognition.
15.1. Evaluation Criteria
i. Originality of idea and concept: A unique or novel project idea which
attempts to answer a specific question - (a hypothesis driven by curiosity to
understand any concept related to focal theme). The idea should not be an
exact replication of model project as printed in the Activity Guide. A proper
explanation of origin of the idea may be demanded by the evaluator.
ii. Relevance of the project to the theme: This section focuses on how the
project is relevant to the focal theme/sub-theme.
iii. Scientific understanding of the issue: Refers to the extent of knowledge the
child scientist has in relation to the project idea.
iv. Data collection: Systematic collection of information using relevant
tools/interviews/questionnaire. Sample size should be sufficient to support the
issues under study.
v. Analysis: This includes tabulation, categorization/classification, and simple
statistics as applicable to the study.
vi. Experimentation/Scientific study/validation: Conducting of
experiments/field study and validation applying simple methods of science.
Experiment need not be every sophisticated or lab based, they could be
simple, self developed and inexpensive too.
vii. Interpretation and Problem solving attempt: To what extent the team has
addressed the proposed hypothesis and the issue of the locality through the
project.
viii. Team work: It refers to work division, cooperation and sharing among and
beyond the team members (the child scientists).
ix. Background correction (Only for District level):In this case the background
of the children is verified like geographical location of their school, village,
town etc. in relation to infrastructure, information and other input related
facilities available with them. The logic is that children from difficult

Activity Guidebook for NCSC 2014 & 2015: Version 2.0
15
geographical situation must get some weightage in comparison to the
children from advantageous geographical location. Non-school going children
should also get some weightage in this criterion.
x. Report and Presentation: Written Report and Oral Presentation are evaluated
separately. Reports are evaluated for its systematic presentation, tabulation of
data in support of the project idea and the clarity with which the study is
documented and explained. A Log Book(actually a Daily Diary) is
mandatory and should be authenticated over the signature of the guide
teacher daily. The cover page of the Log Book should carry the names of the
child scientists, the district and the Sate, in English. Marks awarded for the
presentation covers question and answer with evaluators, presentation of
charts/posters, illustrations and other visuals.
xi. Follow up Action Plan (Only for State level): The child scientists should try
to find out scientific solution to the bothering problem. Has the team
conveyed the message to the community? How it was communicated? Will
effort continue to involve more people till the problem is solved? Was any
action plan suggested? Credit shall be given for similar efforts.
xii. Improvement from the previous level (Only for State level):This is to
encourage the child scientists towards their continuous involvement with the
project for its improvement. Improvements on the work from District to state
level and then from State level to the national level will be given marks
separately. The evaluators shall specify the areas of improvement on a
separate sheet of paper.
xiii. Additional page(s): These must be there in the Project Report with detail
description of works of improvement done after the previous level (particularly
on the basis of the evaluators’ suggestion in the previous level).
15.2. Evaluators
i. Evaluators may please note that the participating children are budding
scientists from the age group of 10 to 17 years with limited access to
knowledge centers and therefore require encouragement. Having understood
their capabilities and capacities, the evaluators provide them with constructive
inputs and positive feed-back.
ii. Evaluators appreciate and value the efforts, innovativeness and confidence of
the participating child scientists and ensure that their honest assessment work
as a guiding light for future endeavors of the child scientists and each one
goes back motivated, intellectually rich and more confident.

Activity Guidebook for NCSC 2014 & 2015: Version 2.0
16
iii. Evaluators should evaluate the projects on the basis of subject matter and
scientific content and are not influenced by the gadgetry or models used or
oratory skills of the participants. They avoid unwarranted comments and also
avoid comparing the works of the child scientists with those carried out by
senior members or scientists.
iv. Evaluators should avoid being any source of distraction to the child scientists
while presentation is going on and do not take the interactions with the
participants as a test what the participating child does not know, rather, they
make efforts to know what the child scientist know about the subject area.
15.3. Model consolidated Evaluation Sheet (For District level)
Sl.
No.
Criteria Max.
marks
Written
Report
Oral
Presentation
Total
1. Originality of idea and concept 10
2. Relevance of the project to the
theme
10
3. Understanding of the issue 15
4. Data collection & analysis 15
5. Experimentation/validation 10
6. Interpretation and Problem
solving attempt
10
7. Team work 10
8. Background correction 10
9. Oral presentation/ written
report (as applicable)
10
Total: 100
Model consolidated Evaluation Sheet (ForState level)
Sl.
No.
Criteria Max.
marks
Written
Report
Oral
Presentation
Total
1. Originality of idea and concept 5
2. Relevance of the project to the
theme
5
3. Understanding of the issue 15
4. Data collection & analysis 15
5. Experimentation/validation 10
6. Interpretation and Problem
solving attempt
15
7. Team work 5
8. Follow up action plan 10
9. Oral presentation/ written 10

Activity Guidebook for NCSC 2014 & 2015: Version 2.0
17
report (as applicable)
10. Improvement over the previous
level suggested
10
Total: 100
Model consolidated Evaluation Sheet (National level) with effect from 2014 onwards
1. The same team of evaluators will evaluate each project for Oral, Written and
Poster presentations at one stretch.
2. More time would be allotted for the project evaluation – roughly 20 to 25
minutes – including 8 minutes for Oral Presentation, evaluation of the written
report and the posters followed by interaction with the Team leader. With
increased time available, the entire screening process would be in a relaxed
manner and also in a child-friendly environ.
3. The parameters and attributes under each parameter for the national level
evaluation are given below.
Sl.
No.
Criteria Max.
Points
A Oral Presentation
1. Originality of idea and concept 05
2. Relevance of the project to the theme 05
3. Understanding of the issue 05
4. Data collection & analysis 10
5. Experimentation/validation 10
6. Interpretation and Problem solving attempt 05
7. Oral Presentation 10
Sub Total – A 50
B Written report
1 Data Collection /Analysis, Graphical Representation etc. 15
2 Methodology/Experimental design. 15
3 Discussion /Conclusion 10
Sub Total – B 40
C Poster Presentation
1 Lay out 05
2 Logical Framework 05
Sub Total – C 10
Grand Total (A+B+C) 100
Thus each project would have total points of 100, out of which 50% would be for
Oral presentation, 40% for Written Report and 10% for Poster presentation.
Modified Evaluation Criteria for national level CSC
Activity Guidebook for NCSC 2014 & 2015: Version 2.0
18
a. Every State Academic Committee need to be more proactive in the evaluation
process at state level CSC and for this all SACs need to take appropriate action
to strengthen their State Academic Committees with subject related persons
and also having experience of the programme much more in advance. The
SACs will be responsible for proper orientation of the experts, state level
evaluators and mentors.
b. Every project selected by the State Academic Committee for national will go
through a quality mentoring process following which the State Academic
Committee will evaluate the projects and grades to be awarded to each of the
mentored projects. The grade sheet authenticated by State Academic
Coordinator and State Coordinator is to be sent/ submitted to the National
Academic Committee in a sealed confidential envelope. .(sample of grade
sheet and methods of grading is shown above)
c. Out of the projects which will be selected/ recommended from the state to
take part in the National event, each state should recommend the best
projects in the ratio of 1:5 of their respective state quota, which will be
evaluated at the national level for Oral Presentation. The rest of the projects
would be qualified for Poster Presentations as is normally followed in
professional scientific conferences /seminar
d. The selected projects from the states should be endorsed by the State
Academic Coordinator and the State Coordinator so that the responsibility of
projects being selected to the national level does not rest with the national
academic core group.
(National Academic Core group would not be responsible in any way for
any selection that is done by the respective State Academic Committee
(SAC) or District Academic Committee (DAC) or Coordinators at the
district or state level. Any query in this regard, would be attended by
respective SAC or DAC).
e. Projects selected for oral presentation will be given certificate for Oral
Presentation and the projects selected for poster presentation will be given
certificate for Poster Presentation. Children who will qualify as outstanding
after oral presentation will be given a ‘Certificate of Merit’. However, all
children irrespective of categories will be handed over medals/ mementos as
has been done in the past.
f. The objective of this modified evaluation process is to identify the most
‘outstanding’ projects. Hence, it is to be noted that this system will be
followed at National Level only. At district and state levels the existing
methods of evaluation has to be followed.
It is MANDATORY for the projects selected for Oral Presentations at
National Level to have the following;
i. The cover page of the project should be either in Hindi or
English.
ii. Each project to have one page Abstract in English.
Activity Guidebook for NCSC 2014 & 2015: Version 2.0
19
iii. Four numbers of Posters as per the instructions provided in
the activity guidebook.
iv. Properly maintained Log book along with written report and
posters.
These instructions are to be followed strictly else the project would not be
evaluated at national level.
16. Organizers NCSC is organized by National Council for Science and Technology Communication
(NCSTC), Department of Science & Technology, Government of India, with active
support from NCSTC-Network, as a National Coordinating Agency. NCSTC-Network
is registered Society, comprising a network of 79 organizations, Governmental and
Non-governmental, spread over all the States and Union Territories of India, who are
working for science popularization. To organize CSC at the State Level, each
State/Union Territory has a coordinating body viz. State Coordinating Agency, which
is a member of the NCSTC-Network.
16.1. Role of District Coordinating Agency, District Coordinators
and District Academic Coordinators i. To agree in writing, on being selected, to act as a District Coordinating Agency
and abide by rules and regulations prescribed in this Activity Guide Book and
also by the State Coordinating Agency;
ii. To constitute a District Organizing Committee and a District Academic
Committee consisting of not less than 7 (seven) teachers, activists, ex-child
scientists, government officials, officials of the local bodies etc. and send the
lists to the State Coordinator by the date specified. The District Coordinators
shall act as the Member-Secretary of both the Committees;
iii. To register groups of children (not more than 5 in one group) in Form A
(Annexure V) and provide them with necessary reference materials, kits and
guidance. No. of groups registered to be intimated to the State Coordinator
by the date specified;
iv. While registering the District Coordinator should be assured that the age of
the child scientist falls within the age as on 31st December of the calendar
year. If need be a copy of the age-certificate may be retained by the District
Coordinator, to avoid any confusion at the later stages. Even while
participating at the National Congress, the State Coordinator may also keep a
copy of the certificate.
v. To select schools from rural and urban area in an equal ratio;
vi. To organize District level Teachers’ Orientation Workshops with the help of
the State Coordinators;
vii. To interact with local scientist and arrange for their periodic interaction with
the registered group of children, if required;
Activity Guidebook for NCSC 2014 & 2015: Version 2.0
20
viii. Try to involve at least 50 schools and 250 numbers of project in the district
including those from informal education system;
ix. Organize District level Congress, Orientation of Evaluators in consultation with
the State Coordinators;
x. To submit Feed-back Reports on all activities, containing names of schools
and number of projects at district level and follow up action taken on projects
likely to become part of community action, photocopies of all
Registration/Attendance Sheets for all Workshops/Meetings, Evaluation
Sheets in original, samples of certificates issued, mementos presented to child
scientists, photo-documentation etc. related to CSC at the District level to the
State Coordinator in the manner and by the date specified;
xi. To maintain a Bank Account and maintain Accounts at the District level and
submit an audited Receipts & Payment Account to the State Coordinators by
the date and in the manner specified;
xii. To maintain infrastructural facilities, including electronic communication
facility, such as internet connectivity, fax etc.
xiii. To arrange review and mentoring of the projects selected for presentation at
the State level NCSC.
16.2. Role of State Coordinating Agency, State Coordinators and
State Academic Coordinators The State Coordinating Agency shall have the overall responsibility for the
implementation of NCSC at the State level. The specific responsibilities shall be –
i. Constitute a State Organizing Committee (SOC) and a State Academic
Committee (SAC) where minimum 7 (seven) members to be selected from
teachers, activists, ex-child scientists, government officials, officials of the local
bodies, Network members in the State and other non-Network organizations
specifically active in a region in the State, where the State Coordinating
Agency does not have a reach. Submit the list of SOC, SAC, DOC and DAC
along with Project Proposal for districts and state. The State Coordinators shall
act as the Member-Secretary of both the Committees;
ii. To constitute Regional Coordinators, if found necessary in case of big States
and to involve SCERT, DIET, IRIS and organizations working with handicapped
children/elder citizens and media representatives. Distribution of geographical
area for organizational purposes etc. will be the prerogative of the State
Coordinators;
iii. To locate individuals, schools specially interested in other curricular activities;
iv. To select District Coordinating Agencies and obtain consent letter from the
respective organization, where they have to agree to abide by the guideline
of CSC and willing to follow the guidelines of NCSTC-DST, NCSTC-Network
and State Coordinating Agency of the State;
v. Organize Orientation Workshops of District Coordinators and teachers with
the help of subject experts;
vi. To coordinate translation of the Activity Guide Book to be used by the
children, in local language and make them available to the District
Activity Guidebook for NCSC 2014 & 2015: Version 2.0
21
Coordinators. To separately print/photocopy Activity Guide Book for
participating child scientists and give them on cost to cost basis;
vii. To maintain a Bank Account and maintain Accounts at the State level and
submit an audited Receipts & Payment Account to the funding agencies
within three months of the date of event with a Project Completion Report
and a Utilization Certificate in the manner prescribed;
viii. To submit Feed-back Reports on all activities, samples of certificates issued,
mementos presented to child scientists, photo-documentation etc. related to
CSC at the State level to the funding agency in the manner and by the date
specified;
ix. To remit funds to District Coordinating Agencies by account payee cheques;
x. To form linkages with Testing and Monitoring facilities available in the State
(with NGOs as well as Government), Municipal Corporations and other local
bodies etc. to help children in better implementation (information
collection/sample testing) of their activities(Identity Cards may be issued to
children registered for activities) through District Coordinators/State
Coordinators;
xi. To arrange review and monitoring of the projects selected for presentation at
the NCSC.
xii. To ensure that Evaluation sheets, both written and oral are forwarded to the
next higher level, i.e. from district to State and from State to National level,
else the district / State contingent might not be registered during
State/National level CSC.
xiii. State Academic Coordinators should work in close association with the
district/State Coordinators for arranging evaluation process and shall make an
effort to send one member from State Academic Committee as an Observer to
the district level CSC. His/her signature on the selection list is mandatory. The
entire process of evaluation is to be supervised by the Observer. Decision of
the State Academic Committee shall be final word on the selection.
16.3. Note for State Coordinators and District Coordinators i. The age limits for participation must not be less than 10 years and more than
17 years on December 31 of the year.
ii. Relatives of District Coordinators, District Academic Coordinators, State
Coordinators and State Academic Coordinators will not be selected for
National CSC. They may leave the post for the year if participation of the ward
is desired.
iii. A child will not participate more than twice in national CSC as Group Leader –
once from each age group.
iv. Two selected projects (one from lower age group and the other one from
upper age group) from each State are to be selected to participate in
‘Kishore VaigyanikSammelan’ of the Indian Science Congress session held
every year during ……..
v. CSC projects meeting the following criteria may apply Technology
Entrepreneurship Promotion Program selected for support–

Activity Guidebook for NCSC 2014 & 2015: Version 2.0
22
• The idea should be new/novel,
• The idea should have potentiality for translating it into working model
/prototype/process,
• The idea should be based on known scientific principle,
• The idea should have commercial feasibility/ technical viability.
vi. Proposals from individual innovators to convert an original idea / invention /
know-how into working prototype / processes. These proposals can be made
by individuals or jointly with any sponsoring organizations.
vii. Selected projects will be provided by financial support to undertake the above
developments, patent support and guidance, scientific / technical consultancy,
fabrication assistance, market information and networking with related
research lab/ institutes as required. For detailed information you may contact:
Techno-entrepreneur Promotion Programme,
Ministry of Science & Technology, Post Bag No. 66,
HauzKhas, New Delhi 110016.
For further details one may contact:
Dr.B.P.Singh, Scientist G & Head,
National Council for Science & Technology Communication (NCSTC),
DST, Govt. of India.
Dr.D.K.Pandey, Scientist F & National Programme Coordinator of NCSC,
National Council for Science & Technology Communication,
Department of Science & Technology, Technology Bhavan, New Mehrauli Road
New Delhi-110016.
Email: [email protected] ; Telephone: 011-26535564 / 26590251.
Er.AnujSinha
Dr. Raghu Menon, Chairperson, NCSTC Network
Mobile: 9717048666
Email: [email protected]
Mr.KhwajaRaji,General Secretary,
NCSTC Network
E-56, 1st. Floor, SamaspurRoad,Pandav Nagar, New Delhi 110091
Mobile: 0-9873717806
Email: [email protected] , [email protected];
Or State Coordinator of the Respective State (See Annexure-II).
Some important points for Participation in the Indian Science Congress’s
‘Kishore VaigyanikSammelan’
Any one of the co-workers (preferably the second in the team) of the selected two
Activity Guidebook for NCSC 2014 & 2015: Version 2.0
23
best projects of the State level Congress (one from lower age group and the other
one from upper age group) will participate in this programme.
This session is a poster presentation session, so following aspects have to be taken
care of for participation:
i. Use four posters which were used earlier in the State Congress (as suggested
by the evaluators in the State Congress and the mentors. Those may be
improved).
ii. The posters must use English along with children’s own language.
iii. Keep a copy of the Project Report.
iv. You shall also have to keep copies of abstract in English separately (for
distribution if required) with details of the all team members, teacher guide
and the State represented mentioned clearly).
v. Posters should be designed in such a way that the contents are readable from
a considerable distance and to also to ensure that excess use of colours do
not create hurdles in reading and viewing.
vi. Each Child Scientist is to be escorted by an Escort Teacher.?????
Activity Guidebook for NCSC 2014 & 2015: Version 2.0
24
PPaarrtt IIII
UUnnddeerrssttaannddiinngg WWeeaatthheerr && CClliimmaattee
FFooccaall TThheemmee ====================================
====

Activity Guidebook for NCSC 2014 & 2015: Version 2.0
25
SSuubb TThheemmeess.

Activity Guidebook for NCSC 2014 & 2015: Version 2.0
26
Reflections of some thought on Weather & Climate
Activity Guidebook for NCSC 2014 & 2015: Version 2.0
27
Focal Theme
Understanding Weather & Climate
Weather is the instantaneous state of the atmosphere, or sequence of states of the
atmosphere with time, which can be defined as the condition of the atmosphere at
any given time and place. Climate, on other hand, is the average as well as variability
of weather conditions prevailing in an area over a long period of time; it can, in short,
be viewed as the Statistics of Weather.
Precipitation, temperature, humidity, atmospheric pressure, and wind are the
important elements of weather and climate. It is the result of the interaction of four
basic physical elements- the Sun, the Earth's atmosphere, the Earth itself, and natural
landforms on the Earth's surface.
Why is Earth getting warmer?
Global air temperatures near Earth's surface rose almost one and one-half degrees
Fahrenheit in the last century. Eleven of the last 12 years have been the warmest on
record. Earth has warmed twice as fast in the last 50 years
as in the 50 years before that.Even a small rise in Earth's
global temperature means melting ice at the North and
South Poles. It means rising seas. It means flooding in
some places and drought in others. It means that some
plants and animals thrive while others starve. It can mean
big changes for humans too. One and one-half degrees
may not seem like much. But when we are talking about the average over the whole
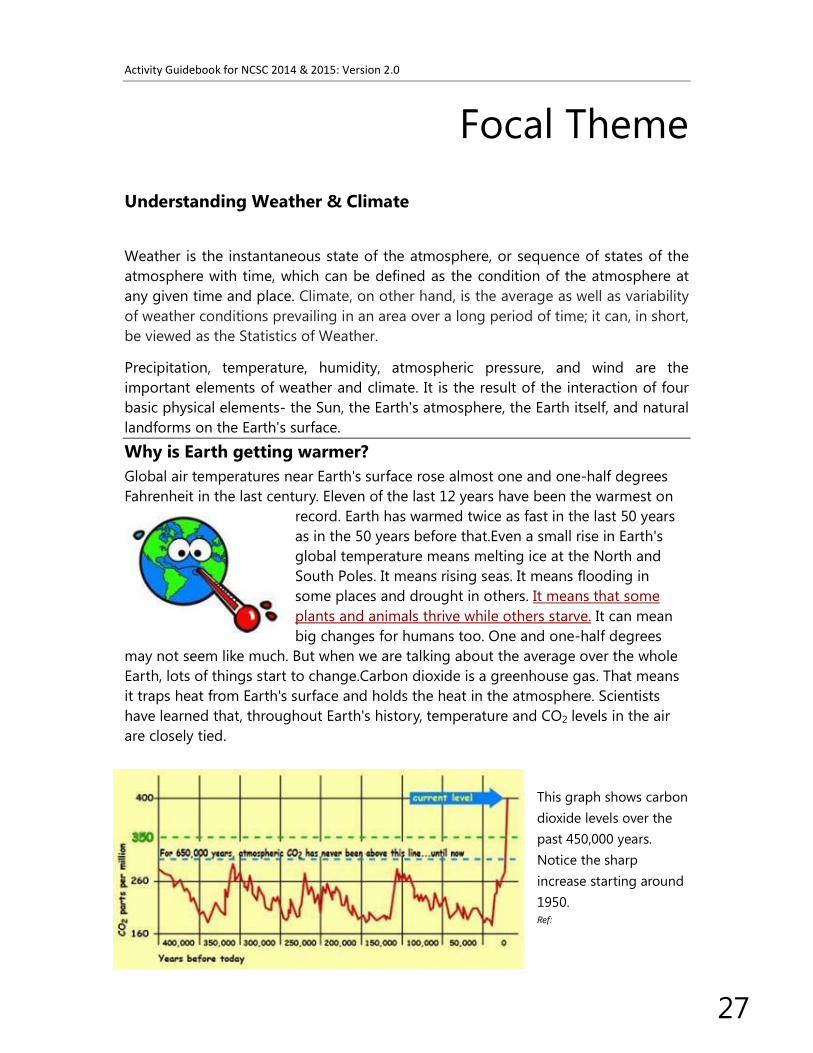
Earth, lots of things start to change.Carbon dioxide is a greenhouse gas. That means
it traps heat from Earth's surface and holds the heat in the atmosphere. Scientists
have learned that, throughout Earth's history, temperature and CO2 levels in the air
are closely tied.
This graph shows carbon
dioxide levels over the
past 450,000 years.
Notice the sharp
increase starting around
1950. Ref:

Activity Guidebook for NCSC 2014 & 2015: Version 2.0
28
http://www.ncdc.noaa.gov/paleo/globalwarming/temperature-change.html.)
As you can see, for 450,000 years, CO2 went up and down. But CO2 levels never rose over 280
parts per million until 1950. But then something different happens and CO2 increases very
fast. At the end of 2012, it is 394 parts per million mainly because of burning of fossil fuel.
Now, let's look at that graph again, but adding the temperatures for that same period of
Earth's history.
This graph shows how carbon dioxide and temperature have risen and fallen together in
Antarctica over the past 400,000 years. Ref: http://www.epa.gov/climatechange/science/pastcc_fig1.html.
* Reference NOAA's Earth system Research Laboratory, Global Monitoring Division,
http://www.esrl.noaa.gov/gmd/ccgg/trends, http://climatekids.nasa.gov/greenhouseeffect
How can so little warming cause so much melting?
Water can soak up a lot of heat. When the oceans get warmer, sea ice begins to melt in the
Arctic and around Greenland. NASA's Earth satellites show us that every summer some Arctic
ice melts and shrinks, getting smallest by September. Then, when winter comes, the ice
grows again.
But, since 1979, the September ice has been getting smaller and smaller and thinner and
thinner. Check out the Climate Time Machine and watch the ice shrink.
Earth's Arctic area: On left, the ice cap covers a large part of the Arctic Ocean. This
image is an average of the ice extent during Septembers of 1979-1981. On right,
however, a much smaller area is covered by ice in September 2007. Ref: http://www.nasa.gov/topics/earth/sea_ice_nsidc.html.
As more sea ice and glaciers melt, the global sea level rises. But melting ice is not the only
cause of rising sea level. As the ocean gets warmer, the water actually expands! Sea level has
risen 6.7 inches in the last 100 years. In the last 10 years, it has risen twice as fast as in the

Activity Guidebook for NCSC 2014 & 2015: Version 2.0
29
previous 90 years. If Greenland's ice sheet were to melt completely, sea level all over the
world would rise by 16-23 feet (5 to 7 meters).

Activity Guidebook for NCSC 2014 & 2015: Version 2.0
30
What is a greenhouse?
A greenhouse is a house made of glass. It
has glass walls and a glass roof. People
grow tomatoes and flowers and other
plants in them. A greenhouse stays warm
inside, even during winter. Sunlight shines in
and warms the plants and air inside. But the
heat is trapped by the glass and can't
escape. So during the daylight hours, it gets
warmer and warmer inside a greenhouse,
and stays pretty warm at night too.
How is Earth a greenhouse?
Earth's atmosphere does the same thing
as the greenhouse. Gases in the
atmosphere such as carbon dioxide do
what the roof of a greenhouse does.
During the day, the Sun shines through
the atmosphere. Earth's surface warms
up in the sunlight. At night, Earth's
surface cools, releasing the heat back
into the air. But some of the heat is
trapped by the greenhouse gases in the
atmosphere. That's what keeps our Earth
a warm and cozy 59 degrees Fahrenheit,
on average.
Greenhouse effect of Earth's
atmosphere keeps some of the Sun's
energy from escaping back into space at
night.
If the atmosphere causes too much greenhouse
effect, Earth just gets warmer and warmer. This is
what is happening now. Too much carbon dioxide
and other greenhouse gases in the air are making
the greenhouse effect stronger.

Activity Guidebook for NCSC 2014 & 2015: Ver
What is the big deal with carbon?
Why are they called fossil fuels?
Because the fuel in your gas tank comes
from the chemical remains of prehistoric
plants and animals! All living things on
Earth contain carbon. Even you contain
carbon. Lots of it. If you weigh 100
pounds, 18 pounds of you is pure carbon! And plants are almost half carbon!
You are 18 percent carbon. Plants are 45 percent carbon.
How does carbon get into
Plants and animals depend on each other. It works out well. For h
plants and animals have lived and died. Their remains have gotten buried deep beneath
Earth's surface. So for hundreds of millions of years, this material has been getting squished
and cooked by lots of pressure and heat.
Activity Guidebook for NCSC 2014 & 2015: Version 2.0
What is the big deal with carbon?
Why are they called fossil fuels?
Because the fuel in your gas tank comes
from the chemical remains of prehistoric
living things on
Earth contain carbon. Even you contain
carbon. Lots of it. If you weigh 100
pounds, 18 pounds of you is pure carbon! And plants are almost half carbon!
You are 18 percent carbon. Plants are 45 percent carbon.
How does carbon get into living things?
Carbon dioxide in, water and oxygen out.
Plants take in CO2. They keep the carbon and give away the
oxygen. Animals breathe in the oxygen and breathe out
carbon dioxide.
Plants and animals depend on each other. It works out well. For hundreds of millions of years,
plants and animals have lived and died. Their remains have gotten buried deep beneath
Earth's surface. So for hundreds of millions of years, this material has been getting squished
and cooked by lots of pressure and heat.
31
. They keep the carbon and give away the
oxygen. Animals breathe in the oxygen and breathe out
undreds of millions of years,
plants and animals have lived and died. Their remains have gotten buried deep beneath
Earth's surface. So for hundreds of millions of years, this material has been getting squished

Activity Guidebook for NCSC 2014 & 2015: Version 2.0
32
For hundreds of millions
of years, dead plants and
animals were buried
under water and dirt.
Heat and pressure
turned the dead plants
and animals into oil, coal,
and natural gas.
How does the carbon get out of living things?
When fossil fuels burn, we mostly get three things: heat,
water, and CO2. We also get some solid forms of carbon,
like soot and grease.
So that's where all the old carbon goes. All that carbon
stored in all those plants and animals over hundreds of millions of years is getting pumped
back into the atmosphere over just one or two hundred years. Did you know that burning 6.3
pounds of gasoline produces 20 pounds of carbon dioxide?
Is carbon in the air good, bad, or just ugly??
A greenhouse traps the Sun's energy inside and keeps the plants warm.
Here's the big, important thing about CO2: It's a greenhouse gas. That means CO2 in the
atmosphere works to trap heat close to Earth. It helps Earth to hold on to some of the energy
it gets from the Sun so the energy doesn't all leak back out into space.
If it weren't for this greenhouse effect, Earth's oceans would be frozen solid. Earth would not
be the beautiful blue and green planet of life that it is.If not for the greenhouse effect, Earth
would be an ice ball. So, CO2 and other greenhouse gases are good—up to a point. But CO2
is so good at holding in heat from the Sun, that even a small increase in CO2 in the
atmosphere can cause Earth to get even warmer.
The geographical situation of any locality/area/region in relation to its latitudinal and
longitudinal position, altitude, distribution of land and water, relative location from
water bodies, surface cover (viz. vegetation/snow/rocks etc.) are some of the natural
factors that influence the weather and climatic condition of that particular location.
Likewise, weather and climate are among the factors that determine the nature,
condition, and pattern of natural resources (e.g. water, soil, flora, and fauna). State of
temperature, humidity, and precipitation in temporal context in a year determine
season and climatic condition in long temporal context. These are responsible for

Activity Guidebook for NCSC 2014 & 2015: Ver
determining the forms of water, soil
for floral growth; which again determine the faunal composition. These natural
resource bases along with weather and climate determine our way of life (viz.
occupation, housing, food habits, dress style, transportation, etc.) to some extent. In
totality, weather and climate influence the base of the economy and culture of that
area. In this perspective, any significant as well as rapid change in weather and
climatic condition creates serious impact not only on natural resources but also on
the biosphere as a whole, including human life.
Scientists have studied global climate change patterns, apparent from mid to late
20th century onward, attributed largely to increased levels
dioxide produced by uses of fossil fuels and other greenhouse gases. Averaged over
all land and ocean surfaces, temperature has increased by
from 1880 to 2012, according to the Intergovernmental Panel on Climate Change
(the IPCC's Climate Change 2013: The Physical Science Basis,
Policymakers, Page 5. The In
leading international body for the assessment of climate change. It was established by the
United Nations Environment Programme (UNEP)
(WMO) in 1988 to provide the world with a clear scientific view on the current state of
knowledge in climate change and its potential environmental and socio
and was endorsed by the UN General Assembly. It produces detailed reports on Climate
Change once every five years, based on hundreds of peer reviewed studies. Its Fifth
Assessment Report is getting finalized now.)
Above graph shows the average temperature on land and ocean together as it has changed
from 1880–2013. Zero degree here is the average mean temperature between 1951
black line is the annual mean and the red line is the 5
Activity Guidebook for NCSC 2014 & 2015: Version 2.0
termining the forms of water, soil-forming processes and creating support systems
for floral growth; which again determine the faunal composition. These natural
resource bases along with weather and climate determine our way of life (viz.
ng, food habits, dress style, transportation, etc.) to some extent. In
totality, weather and climate influence the base of the economy and culture of that
area. In this perspective, any significant as well as rapid change in weather and
creates serious impact not only on natural resources but also on
the biosphere as a whole, including human life.
Scientists have studied global climate change patterns, apparent from mid to late
century onward, attributed largely to increased levels of atmospheric carbon
dioxide produced by uses of fossil fuels and other greenhouse gases. Averaged over
all land and ocean surfaces, temperature has increased by roughly 1.53°F (0.85
according to the Intergovernmental Panel on Climate Change
Climate Change 2013: The Physical Science Basis, Summary for
The Intergovernmental Panel on Climate Change (IPCC) is the
leading international body for the assessment of climate change. It was established by the
Programme (UNEP) and the World Meteorological Organization
in 1988 to provide the world with a clear scientific view on the current state of
e and its potential environmental and socio-economic impacts
and was endorsed by the UN General Assembly. It produces detailed reports on Climate
Change once every five years, based on hundreds of peer reviewed studies. Its Fifth
ting finalized now.)
Above graph shows the average temperature on land and ocean together as it has changed
2013. Zero degree here is the average mean temperature between 1951
black line is the annual mean and the red line is the 5-year running mean. This five year
33
forming processes and creating support systems
for floral growth; which again determine the faunal composition. These natural
resource bases along with weather and climate determine our way of life (viz.
ng, food habits, dress style, transportation, etc.) to some extent. In
totality, weather and climate influence the base of the economy and culture of that
area. In this perspective, any significant as well as rapid change in weather and
creates serious impact not only on natural resources but also on
Scientists have studied global climate change patterns, apparent from mid to late
of atmospheric carbon
dioxide produced by uses of fossil fuels and other greenhouse gases. Averaged over
roughly 1.53°F (0.850C)
according to the Intergovernmental Panel on Climate Change
Summary for
tergovernmental Panel on Climate Change (IPCC) is the
leading international body for the assessment of climate change. It was established by the
World Meteorological Organization
in 1988 to provide the world with a clear scientific view on the current state of
economic impacts
and was endorsed by the UN General Assembly. It produces detailed reports on Climate
Change once every five years, based on hundreds of peer reviewed studies. Its Fifth
Above graph shows the average temperature on land and ocean together as it has changed
2013. Zero degree here is the average mean temperature between 1951-80. The
. This five year
Activity Guidebook for NCSC 2014 & 2015: Ver
moving average line makes it easier to see the temperature trend over the years after the
industrial revolution. Source: NASA GISS
This climate change is considered as one of the most important global environmental
challenges being faced by humanity today, with its implication on natural ecosystem, food
production systems, fresh water supply, heal
India’s weather and climatic conditions are naturally controlled by her geographical location
(i.e. its latitudinal and longitudinal extents) and the conditions along her boundaries.
(Himalayan ranges from northwestern
The latitudinal and longitudinal extension wi
on variation of solar days or sunshine hours from east to west, which is one of the
fundamental factors regulating weather and climatic variations in the country.
Further, within the country, there are variations in
altitudinal differences, vegetation type and coverage. All these together have given
rise to six different climatic zones and twelve agro
However, these climatic and agro
various kinds due to the impact of climatic/ weather changes. For more than a
decade, weather and climatic anomalies are taking place in all the agro
regions of the country. Moreover, winds during monsoon mainly control Indian
climate; highly influenced by the summer monsoon. But in the last few decades,
Activity Guidebook for NCSC 2014 & 2015: Version 2.0
moving average line makes it easier to see the temperature trend over the years after the
NASA GISS
This climate change is considered as one of the most important global environmental
challenges being faced by humanity today, with its implication on natural ecosystem, food
production systems, fresh water supply, health and weather related calamities.
India’s weather and climatic conditions are naturally controlled by her geographical location
(i.e. its latitudinal and longitudinal extents) and the conditions along her boundaries.
(Himalayan ranges from northwestern to northeastern corner in the northern side, existence
of Indian Ocean and Arabian Sea
as well as Bay of Bengal in
southwest to southeast).
The country also encompasses
the Western Ghats, which is
one of the 34 Biodiversity hot
spots of the world;
along the West coast of India
from the VindyaSatpura
ranges in the North to the
Southern tip of the peninsula
to a stretch of 1,600
km,receiving an average of
nearly 6000 mm of rainfall
every year.
The latitudinal and longitudinal extension within the country has greater implication
on variation of solar days or sunshine hours from east to west, which is one of the
fundamental factors regulating weather and climatic variations in the country.
Further, within the country, there are variations in distribution of land and water,
altitudinal differences, vegetation type and coverage. All these together have given
rise to six different climatic zones and twelve agro-climatic zones.
However, these climatic and agro-climatic zones are facing serious problems of
various kinds due to the impact of climatic/ weather changes. For more than a
decade, weather and climatic anomalies are taking place in all the agro
regions of the country. Moreover, winds during monsoon mainly control Indian
highly influenced by the summer monsoon. But in the last few decades,
34
moving average line makes it easier to see the temperature trend over the years after the
This climate change is considered as one of the most important global environmental
challenges being faced by humanity today, with its implication on natural ecosystem, food
India’s weather and climatic conditions are naturally controlled by her geographical location
(i.e. its latitudinal and longitudinal extents) and the conditions along her boundaries.
to northeastern corner in the northern side, existence
of Indian Ocean and Arabian Sea
as well as Bay of Bengal in
southwest to southeast).
The country also encompasses
Western Ghats, which is
one of the 34 Biodiversity hot-
spots of the world; extending
along the West coast of India
from the VindyaSatpura
ranges in the North to the
Southern tip of the peninsula
to a stretch of 1,600
km,receiving an average of
nearly 6000 mm of rainfall
thin the country has greater implication
on variation of solar days or sunshine hours from east to west, which is one of the
fundamental factors regulating weather and climatic variations in the country.
distribution of land and water,
altitudinal differences, vegetation type and coverage. All these together have given
problems of
various kinds due to the impact of climatic/ weather changes. For more than a
decade, weather and climatic anomalies are taking place in all the agro-climatic
regions of the country. Moreover, winds during monsoon mainly control Indian
highly influenced by the summer monsoon. But in the last few decades,

Activity Guidebook for NCSC 2014 & 2015: Version 2.0
35
onset of monsoon over India is changing resulting in variations in the amount and
distribution of rainfall.
While weather and climate impact living conditions of humans, humans too impact
climate through their actions. This is partly because of the rapid growth of their
population in the last century. But it is largely due to the manner in which humans –
mainly in developed countries – have started exploiting natural resources including
coal and oil in an increasing manner to produce all kinds of goods and services to
lead a life they consider to be comfortable. In 2009, a group of eminent scientists
identified planetary boundaries – safe operating limits, which, if crossed risk
irreversible and abrupt environmental change - for nine earth system processes like
fresh water use, land use, biodiversity loss, ocean acidification and such other. They
found that these boundaries had already been crossed in biodiversity loss, climate
change and Nitrogen cycle. (“Planetary Boundaries: Exploring the Safe Operating Space
for Humanity”, Rockström, J and 28 others, Ecology and Society14(2): 32. [online] URL:
http://www.ecologyandsociety.org/vol14/iss2/art32/ ). There is substantial risk of climate
change, being caused by human action in increasing manner each year, getting out
of hand. This focuses attention on what steps humans need to take now to save
their future generations, along with other species on earth.
In this context, there is a need to have proper understanding of weather and climate
and its changes, mainly oriented towards different aspects, factors, and attributes of
weather and climate along with their implications on the natural ecosystem, on
society and culture and on human health. Right through, there needs to be focus on
climate change aspects, including mitigation and adaptation.
With this aim, the main focal theme of Understanding Weather and Climate will have
the following sub themes under which children can carry out projects.
Sub Theme 1 : Understanding Weather around you.
Sub Theme 2 : Human Impacts on Weather and climate.
Sub Theme 3: Weather, Climate and Ecosystems.
Sub Theme 4: Weather, Climate, Society & Culture.
Sub Theme 5: Weather, Climate and Agriculture.
Sub Theme 6: Weather, Climate and Health.
Each of the Sub themes would be elaborated in the next sections.

Activity Guidebook for NCSC 2014 & 2015: Version 2.0
36
Sub Theme 1
========================
Understanding Weather around You:

Activity Guidebook for NCSC 2014 & 2015: Version 2.0
37
Working Group of the Sub Theme
Activity Guidebook for NCSC 2014 & 2015: Version 2.0
38
UNDERSTANDING WEATHER AROUND YOU:
OBSERVING, MEASURING, UNDERSTANDING AND PREDICTING IT
Background.
Weather is ubiquitous. You cannot ignore it. We live “inside”. We may feel it. We complain
against it. But we often take it for granted and not care about it. This could be dangerous.
We need to understand the weather, measure its parameters and see if we can predict for us
to even survive. It is a historical fact that we created calendars to predict weather. How can
we understand the details about our local weather? How do we make observations on the
weather? Do we follow the same steps our distant forefathers did? Can we find new ways?
Can we learn from modern scientific methods for our local use?
Why is weather important?
Weather affects all things around us. Whether it is crop production, insects biting us,
diseases crippling us, fruits we eat, flowers we smell all respond to weather.
So, we think you will all agree we need to learn more about the weather that is everywhere
around us.
Weather is what we feel today. Now if you can imagine yourself living for a hundred years
and you remember all the days of your life and how the weather was on each of those days,
then you would tell your great-grandchild that “in my days in July it was like this”—You have
talked about the “climate”. Climate is an “averaged” view of weather over a long time –
typically from few years to millennia.
Weather is made up of several interlinked parameters – such as, temperature, humidity, wind
speed/direction at different atmospheric levels. Of course, these are all influenced by
geography(latitude, longitude), distance from the sun, solar activity, sunrise, sunset,(day
length) sun’s position etc.
So what can all of us do to learn more?
Framework
Our objective is to be able to
(i) decide what aspect/parameter of weather or its manifestation(s) we want to
observe/measure/understand/predict;
(ii) decide what methods we should adopt for this purpose
(iii) decide on instruments we could use/build for the above purpose
(iv) report/record our observations/measurements
(v) analyse the data we gather
(vi) predict what might happen in the future
Importance
As already stated in the background above, it is important that we are able to predict
weather as ignorance of it may be costly. Knowledge is power. Those who know survive and
prosper. Simple extrapolation would be dangerously unsuccessful. To predict we need to
Activity Guidebook for NCSC 2014 & 2015: Version 2.0
39
know what it is now and what it was earlier so we can develop methodology. As all of us
have felt at one time or another weather can really make our life difficult – whether it is
cyclones, tides or tornadoes. Only knowledge will let us know what the probability we may
be wrong is!
How to Proceed?
We propose a series of simple-to-do experiments exemplifying each/some of the parameters
that you children can do and learn from. The experiments should be of such a nature that
you can think it through and come up with innovative ways of doing it. The experiments
would be so designed that they bring out information on the quantity, magnitude of the
factor/parameter, changes in its values over time, and how it links to other parameters.
Ultimately, this would allow the child to understand and describe the parameter and its role
in defining the weather and its implicaitons for us.
Components
The experiments would involve, inter alia, observations, measurements of different
parameters of interest. The observations would push the child to integrate and synthesis the
data into a set of linked proposals(hypotheses). The child would, ideally, at the end of the
experiment, come up with a conclusion based on evidence which will be of some
consequence. The components/ parameters/ aspects that could be studied are:
• Temperature [ maximum, minimum, average]
• Atmospheric pressure
• Wind Speed and wind directions
• Relative Humidity
• Clouds
• Quantum, Intensity and Frequency of Rain
• Lightning, thunder, rainbow
• Tides [in coastal regions]
• Water level [in wells, ponds]
• Evaporation from surface water
• Fog, mists and smog and dew
• Response of Plants and insects to weather
• Predicting weather from plants and animal behavior
• Emergence of diseases
Weather and climate influence many socio-economic and development patterns of a
region and thus has become one of the most important environmental parameters.
Weather and climate decide almost everything about our way of life including our
occupational and recreational practices and this critical role is often not taken into
account by planners while siting industries and power stations and making decisions
on transport and other infra-structure for a region.
Activity Guidebook for NCSC 2014 & 2015: Version 2.0
40
There is hardly any human activity that is not in one form or another influenced by
weather and climate. In a country like India where rainfall is highly seasonal and
agriculture is largely dependent on the rainfall of the summer monsoon months, viz.,
June to September, the national economy has become crucially dependent on the
behaviour of monsoon. Vagaries in the monsoon rainfall resulting in large scale
floods and droughts seriously affect the annual food production of the country
besides causing loss of lives and damage to property. Heavy rainfall and strong
winds associated with cyclonic disturbance cause disruption and dislocation of
transport and communications and loss of life and property.
The siting of industries, thermal power stations, oil refineries etc., which emit gaseous
and other particulate pollutants into the atmosphere has to take due consideration
of the prevailing wind and atmospheric stability conditions during the course of the
year to minimize the harmful effects of the atmospheric pollution and contamination.
With large scale establishment and expansion of industries throughout the country
especially in the coastal belt, the protection of the environment (land, sea and air)
from the harmful chemicals into the environment by man-made factors has become
a matter of concern. There is apprehension that unless preventive measures are
taken, this may lead to irreversible ecological imbalances and climatic changes.
The local weather and climate of a station are of interest to the residents in general
since it concerns their day-to-day lives. Besides, it also influences their clothing,
food habits, working styles and recreational practices. Dislocation of transport,
communication, power and water distribution is a common occurrence in most
states during during heavy spells of monsoon. Little can be done about gusty
strong winds during pre-monsoon which uproot trees and fell electric poles year
after year.
Planners require weather information for design, execution, management and
control of major industrial, commercial, and other activities in and around their
chosen sites. Information about local weather parameters and their seasonal
variations is needed for siting of runways, railways and road network.
Structure and composition of the Atmosphere:
� Meteorology is the study of the atmosphere and all processes and
phenomena that results in our particular weather.
� Different branches of Meteorology are
• Climatology
• Synoptic Meteorology

Activity Guidebook for NCSC 2014 & 2015: Version 2.0
41
Principal Gases of Dry Air
Constituent Percent by
Volume
Parts per million
(PPM)
Nitrogen (N2) 78.08400000 7,80,840
Oxygen (O2) 20.94600000 2,09,460
Argon (Ar) 0.93400000 9,340
Carbon Dioxide (CO2) 0.03800000 380
Neon (Ne) 0.00182000 18.20
Helium (He) 0.00052400 5.24
Methane (CH4) 0.00015000 1.50
Krypton (Kr) 0.00011400 1.14
Hydrogen (H2) 0.00005000 0.50
• Dynamic Meteorology
Composition of the Atmosphere:
The major gases in the atmosphere are nitrogen which constitutes about 78%
and then oxygen which constitutes about 21% of the atmosphere. Further
there is presence of Argon which is present by about 0.93% and then trace
gases such as Hydrogen, Krypton, Methane, Helium, Neon, carbon dioxide and
water vapour etc. Figure and the table given below explains the atmospheric
composition.
Figure 1. Composition of the atmosphere.
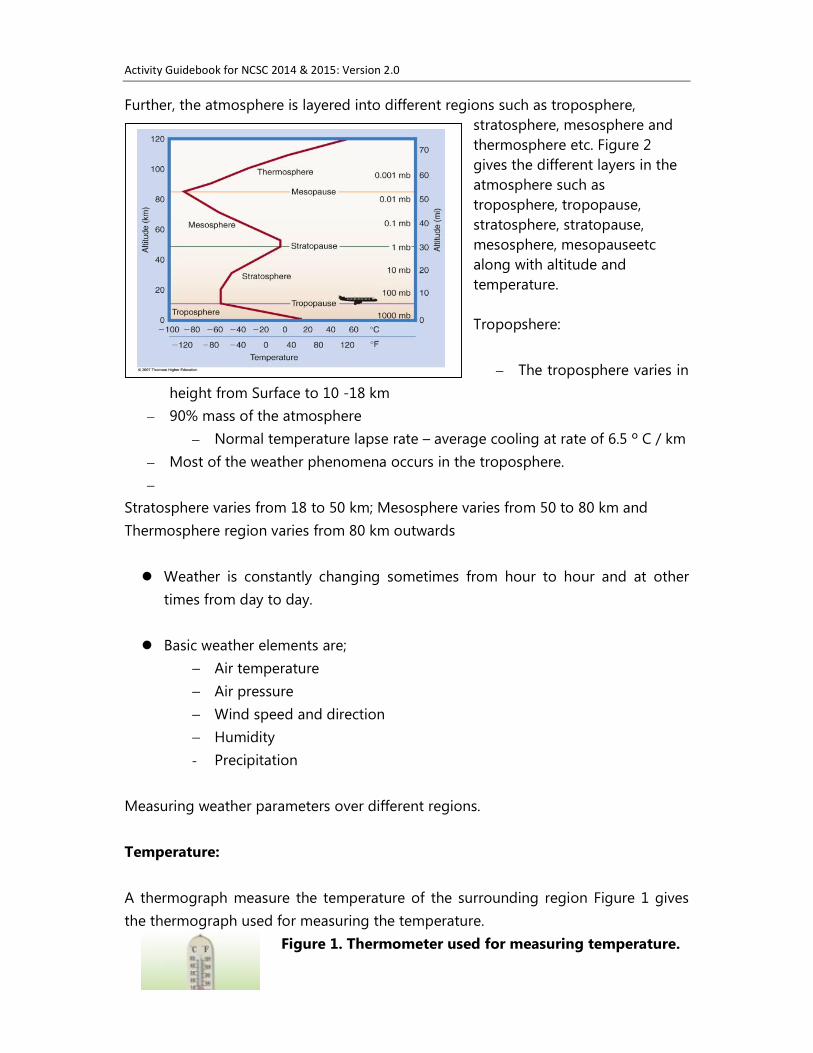
Activity Guidebook for NCSC 2014 & 2015: Version 2.0
42
Further, the atmosphere is layered into different regions such as troposphere,
stratosphere, mesosphere and
thermosphere etc. Figure 2
gives the different layers in the
atmosphere such as
troposphere, tropopause,
stratosphere, stratopause,
mesosphere, mesopauseetc
along with altitude and
temperature.
Tropopshere:
– The troposphere varies in
height from Surface to 10 -18 km
– 90% mass of the atmosphere
– Normal temperature lapse rate – average cooling at rate of 6.5 º C / km
– Most of the weather phenomena occurs in the troposphere.
–
Stratosphere varies from 18 to 50 km; Mesosphere varies from 50 to 80 km and
Thermosphere region varies from 80 km outwards
� Weather is constantly changing sometimes from hour to hour and at other
times from day to day.
� Basic weather elements are;
− Air temperature
− Air pressure
− Wind speed and direction
− Humidity
- Precipitation
Measuring weather parameters over different regions.
Temperature:
A thermograph measure the temperature of the surrounding region Figure 1 gives
the thermograph used for measuring the temperature.
Figure 1. Thermometer used for measuring temperature.
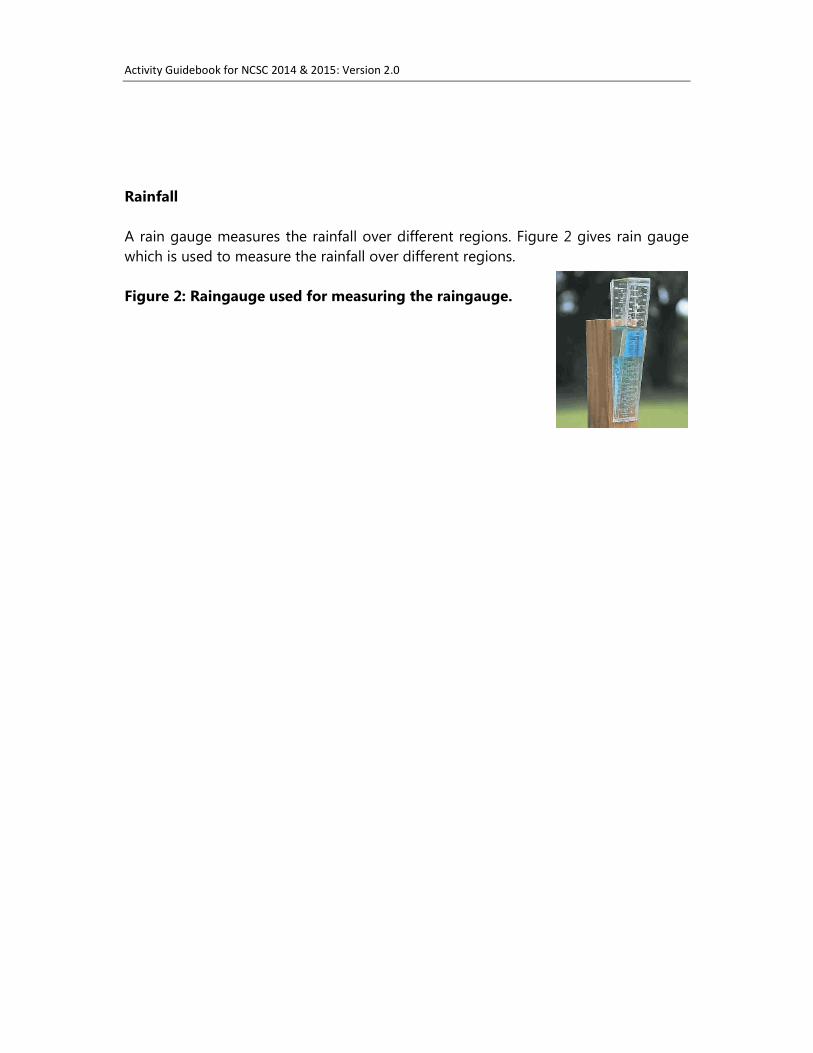
Activity Guidebook for NCSC 2014 & 2015: Version 2.0
43
Rainfall
A rain gauge measures the rainfall over different regions. Figure 2 gives rain gauge
which is used to measure the rainfall over different regions.
Figure 2: Raingauge used for measuring the raingauge.

Activity Guidebook for NCSC 2014 & 2015: Version 2.0
44
Wind speed and wind direction :
Winds play an important role in weather and climate as they
decide the fate where how the pollutnats are dispersed in the
atmosphere. Further the land and sea breeze phenomena an
important role in the land and sea circulation in coastal areas.
Further they also decide how the mixing takes in the low
troposphere.
An Anemometer measures the wind speed and a wind vane gives the direction from
which the wind comes from. Figure 3 gives the anemometer and wind vane used for
measuring the wind direction.
Clouds:
• Typically, temperature decreases with altitude, so the lighter stuff (warmer air)
is below the heavier stuff (colder air). This typically supports some overturning,
especially in the boundary layer. This in turn
generates clouds.
• Clouds are very common, with 50% of
the earth covered in cloud at any given
time. Only 1 to 2 % of the clouds are
raining. Clouds are classified by height and
nature.
(Figure): Cumulus – cauliflower type
appearance
Stratus - flat, grey and dull
Cirrus -
If a cloud produces rain, then prefix ‘nimbo’ is added or a suffix numus is added. e.g:
nimbostratus, cumulonimbus … etc Medium level clouds have a prefix ‘alto’ added.
e.g: altocumulus, altostratus … etc
There are two important weather events in India. They are the monsoons (southwest
monsoon and northeast monsoon) and cyclones.

Activity Guidebook for NCSC 2014 & 2015: Version 2.0
45
The monsoon rainfall contributes about 75-80% of the mean annual rainfall of the
Indian subcontinent. The significant features are large variability of monsoon rainfall
over the Indian subcontinent from Rajasthan to Meghalaya where the rainfall varies
from 10 cm during a season over Rajasthan to about 1000 cm over places such as
Cherrapunji etc.
Figure . Seasonal monsoon rainfall over different regions of the Indian
subcontinent (India Meteorological Department).
There are three unique aspects which differentiate one Monsoon from another
they are
1) Monsoon Onset over Kerala
2) Active and break in monsoon conditions over the Indian subcontinent
3) Quantum of monsoon rainfall over different meteorological subdivisions.
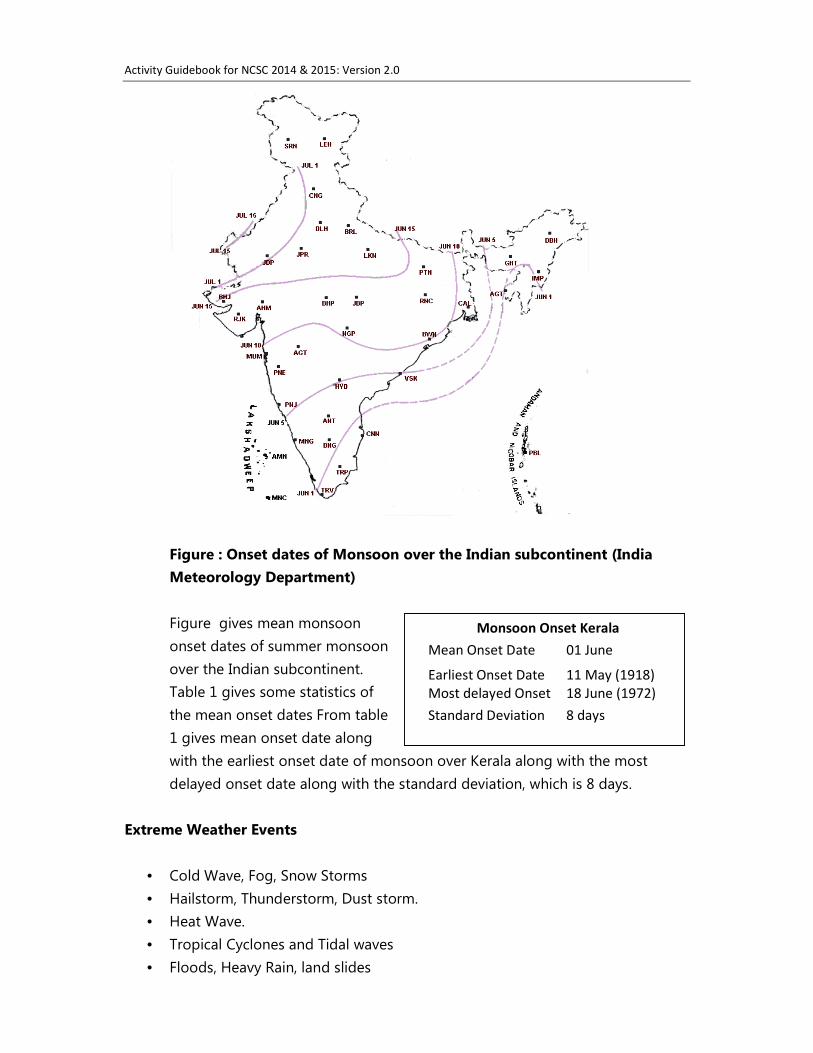
Activity Guidebook for NCSC 2014 & 2015: Version 2.0
46
Monsoon Onset Kerala
Mean Onset Date 01 June
Earliest Onset Date 11 May (1918)
Most delayed Onset 18 June (1972)
Standard Deviation 8 days
Figure : Onset dates of Monsoon over the Indian subcontinent (India
Meteorology Department)
Figure gives mean monsoon
onset dates of summer monsoon
over the Indian subcontinent.
Table 1 gives some statistics of
the mean onset dates From table
1 gives mean onset date along
with the earliest onset date of monsoon over Kerala along with the most
delayed onset date along with the standard deviation, which is 8 days.
Extreme Weather Events
• Cold Wave, Fog, Snow Storms
• Hailstorm, Thunderstorm, Dust storm.
• Heat Wave.
• Tropical Cyclones and Tidal waves
• Floods, Heavy Rain, land slides

Activity Guidebook for NCSC 2014 & 2015: Version 2.0
47
• Droughts
Cold Wave :
• Occurrences of extreme low temperature in association with incursion of
dry cold winds from north into the sub continent are known as cold waves.
The northern parts of India specially the hilly regions and the adjoining plains
are influenced by transient disturbances which often have weak frontal
characteristics, known as western disturbances. They occur maximum over
Jammu & Kashmir, Rajasthan and Uttar Pradesh.
Fog :
• Immediately after the passage of a Western Disturbance a lot of moisture is
available in the atmosphere and the regional and synoptic scale conditions
provide the trigger for the formation of fog. This has an effect on all forms of
transport and in particular to aviation. This has indirect effect on the economy
of aircraft operations and air passenger inconvenience. Airports in north India
show a significant increasing trend in visibility during the winter season
amounting to 90%.
Heat Wave
• Extreme positive departures from the normal maximum temperature result in
heat wave during the summer season. They occur maximum over Uttar
Pradesh. Bihar, Rajasthan, West Bengal etc.
In recent years the heat wave has increased in both in intensity as well as
duration.
Tropical Cyclones over Indian Ocean:
There are two seasons for cyclone formation in the north Indian Ocean :
• Pre Monsoon - (March to May)
• Post Monsoon - (October to December)
Further, more number of cyclones form over the Bay of Bengal than the
Arabian Sea.
A severe Super Cyclonic Storm with winds of upto 250 km/h, crossed the coast
in Orissa on October 29, 1999. This may prove to have been the worst cyclone
of the century in the Orissa region and is responsible for as many as 10,000
deaths, for rendering millions homeless and for extensive damage . Over the
past decades the frequency of tropical cyclones in the north Indian ocean has
registered significant increasing trends (20% per hundred years) during
November and May which account for maximum number of intense cyclones .

Activity Guidebook for NCSC 2014 & 2015: Version 2.0
48
Figure: Orissa super cyclone on 29th October, 1999.
Floods and Droughts
� Floods and droughts are two important aspects of the weather associated with
the abundance or deficit of monsoon rainfall. During the last 125 years
phenomenal droughts on all India scale were only four, namely, 1877, 1899,
1918 and 1972. In these years, the seasonal rainfall deficiencies were more
than -26% below the seasonal mean rainfall. The droughts were associated
with considerable losses of life and property. Better distribution system and
buffer food stock have gone a long way in reducing the adverse effects of
drought.
Project Examples
Making simple measuring devices and using and validating them
• Calendar - onset of major events such as monsoons
• Making a Rain Gauge ; Human hair hygrometer
Making a Rain gauge
http://www.wikihow.com/Build-a-Rain-Gauge
If you'd like to keep track of how much rainfall you're getting, you can buy a rain
gauge, or you can make one out of inexpensive items from your local hardware store.
These instructions discuss how to put one together and calculate exactly how much
rain has fallen. It's not only easier on the wallet, but it's also a great science project

Activity Guidebook for NCSC 2014 & 2015: Version 2.0
49
and learning experience for kids.
Method 1 of 2: Turning a funnel and container into a rain gauge
1. Assemble the gauge. Put the funnel securely into a container that's large enough to collect the amount of rain you would normally get in your area without overflowing.
2. Work out the surface area of the funnel that you will be using.
• Measure the widest inside diameter of the funnel in cm, divide that by 2 (to get the radius).
• Square that number (multiply it by itself) then multiply by 3.142 to get the area of the top of the funnel.
• Multiply (cm) by 10 (to get mm). This gives you the number to divide by when you are working out how much rain has fallen in
millimetres. (Ex: If the area of the funnel (step 2) is 78.55cm2 (10 cm diameter) and your container filled with 50 ml of rain, then you divide 50 by 78.55 and multiply by 10 to get 6.365mm of rain. (50ml/78.55cm2X10=6.365mm)
Using a measuring jug or any other container calibrated in milliliters (ml) measure the amount of rainwater you have collected. Then divide that number by the number you came up in step 2. This gives

Activity Guidebook for NCSC 2014 & 2015: Version 2.0
50
you the amount of rain in millimeters that has fallen.
Human Hair Hygrometer
Property used : Length of a human hair is dependent on the relative humidity and it is close
tolinear
Process: Obtain a reasonably long human hair [or horse hair]. Fix one end to a split cork or
some such fixating device. Wind the other end over a wheel that can spin freely. Weigh the
wheel with asmall weight on the other side so that the wheel is in equilibrium between the
tension in the hair and the string. Affix a light pointer to the wheel and place a dial.
Calibration : Put the apparatus in a “dry” environment –dry environment obtained by
passing air over dessicators. Mark “0” for the pointer’s position. Put near a boiling kettle so
that saturated environment is available. Mark “100” for the pointer’s position. You have the
human hair hygrometer
(Also see http://www.scientificamerican.com/article/bring-science-home-hair-hygrometer/)
Measuring wind speed and direction
• How to measure speed?
• Why is direction important?
• Wind rose
Procedure:
Construct a fan from paper fan-wheel which can rotate freely. Hold the fan against the wind
and measure its speed of rotation. [This can be done either by a commercial speedometer or
by constructing a strobe light arrangement]. Orient the fan so that the speed is maximum.
Note the direction.
Measuring temperatures
• Maximum, minimum and average temperature
• Shade or open?
• What is the “hottest month”?
Use a thermometer to measure the temperature every hour in a shaded place. Note it. From
the data decide what the maximum and minimum temperature are in a day. Do this for
every day for a year to get monthly maximum, minimum and average temperature.
Impact of any one parameter measured on something of importance to us
• e.g. Correlate (i.e. draw a graph) on temperature and electricity bills
• Rain and flower prices; seasons & illnesses; rain & mosquitoes
• Ants & prediction of rain
Glossary

Activity Guidebook for NCSC 2014 & 2015: Version 2.0
51
Air pressure The cumulative force exerted on any surface by the molecules
composing air.
Altocumulus A middle cloud, usually white or gray. Often occurs in layers or patches
with wavy, rounded masses or rolls.
Altostratus A middle cloud composed of gray or bluish sheets or layers of uniform
appearance. In the thinner regions, the sun or moon usually appears dimly visible.
Anemometer An instrument designed to measure wind speed.
Aneroid barometer An instrument designed to measure atmospheric pressure. It
contains no liquid.
Barograph A recording instrument that provides a continuous trace of air pressure
variation with time.
Barometer An instrument that measures atmospheric pressure. The two most
common barometers are the mercury barometer and the aneroid barometer.
Blizzard A severe weather condition characterized by low temperatures and strong
winds (greater than 32 mi/hr) bearing a great amount of snow. When these
conditions continue after the falling snow has ended, it is termed a ground blizzard.
Ceilometer An instrument that automatically records cloud height.
Climate The accumulation of daily and seasonal weather events over a long period
of time. A description of aggregate weather conditions; the sum of all statistical
weather information that helps describe a place or region.
Cloud base The lowest portion of a cloud.
Cloud cover The amount of the sky obscured by clouds when observed at a
particular location.
Cumulonimbus An exceptionally dense and vertically developed cloud, often with a
top in the shape of an anvil. The cloud is frequently accompanied by heavy showers,
lightning, thunder, and sometimes hail. It is also known as a thunderstorm cloud.
Cumulus A cloud in the form of individual, detached domes or towers that are
usually dense and well defined. It has a flat base with a bulging upper part that often
resembles cauliflower. Cumulus clouds of fair weather are called cumulus humilis.
Those that exhibit much vertical growth are called cumulus congestur or towering
cumulus.
Daily range of temperature The difference between the maximum and minimum
temperatures for any given day.
Desert One of two types of dry climate-the driest of the dry climates.
Dew Water that has condensed onto objects near the ground when their
temperatures have fallen below the dew point of the surface air.
Drizzle Small drops between 0.2 and 0.5 mm in diameter that fall slowly and reduce
visibility more than light rain

Activity Guidebook for NCSC 2014 & 2015: Version 2.0
52
Evaporation The process by which a liquid changes into a gas.
Fog A cloud with its base at the earth's surface. It reduces visibility to below 1 km.
Hail Solid precipitation in the form of chunks or balls of ice with diameters greater
than 5 mm. The stones fall from cumulonimbus clouds.
Hailstones Transparent or partially opaque particles of ice that range in size from
that of a pea to that of golf balls.
Hurricane A severe tropical cyclone having winds in excess of 64 knots (74 mi/hr).
Hygrometer An instrument designed to measure the air's water vapor content. The
sensing part of the instrument can be hair (hair hygrometer), a plate coated with
carbon (electrical hygrometer), or an infrared sensor (infrared hygrometer).
Inversion An increase in air temperature with height.
Isobar A line connecting points of equal pressure
Isotach A line connecting points of equal wind speed.
Isotherm A line connecting points of equal wind temperature.
Lightning A visible electrical discharge produced by thunderstorms.
Meteorology The study of the atmosphere and atmospheric phenomena as well as
the atmosphere's interaction with the earth's surface, oceans, and life in general.
Mist Very thin fog in which visibility is greater than 1.0 km (0.62 mi).
Nimbostratus A dark, gray cloud characterized by more or less continuously falling
precipitation. It is not accompanied by lightning, thunder, or hail.
Precipitation Any form of water particles-liquid or solid-that falls from the
atmosphere and reaches the ground.
Psychrometer An instrument used to measure the water vapor content of the air. It
consists of two thermometers (dry bulb and wet bulb). After whirling the instrument,
the dew point and relative humidity can be obtained with the aid of tables.
Rain Precipitation in the form of liquid water drops that have diameters greater than
that of drizzle.
Rain gage A device-usually a cylindrical container-for measuring rain-fall.
Sea breeze A coastal local wind that blows from the ocean onto the land. The
leading edge of the breeze is termed a sea breeze front.
Sea level pressure The atmospheric pressure at mean sea level.
Shower Intermittent precipitation from a cumuliform cloud, usually of short duration
but often heavy.
Sleet A type of precipitation consisting of transparent pellets of ice 5 mm or less in
diameter. Same as ice pellets.
Smog Originally smog meant a mixture of smoke and fog. Today, smog means air
that has restricted visibility due to pollution, or pollution formed in the presence of
sunlight-photochemical smog.
Snow Solid precipitation in the form of minute ice flakes that occur below 0ºC.
Snowflake An aggregate of ice crystals that falls from a cloud
Stratocumulus A low cloud, predominantly stratiform with low, lumpy, rounded
masses, often with blue sky between them.
Activity Guidebook for NCSC 2014 & 2015: Version 2.0
53
Stratus A low, gray cloud layer with a rather uniform base whose precipitation is
most commonly drizzle.
Temperature The degree of hotness or coldness of a substance as measured by a
thermometer. It is also a measure of the average speed or kinetic energy of the
atoms and molecules in a substance.
ThermographA recording instrument that gives a continuous trace of temperature with
time.
Thermometer An instrument used to measure temperature.
Thunder The sound due to rapidly expanding gases along the channel of a lightning
discharge.
Tipping bucket rain gage A device that accumulates rainfall in increments of 0.01 in.
by containers that alternately fill and empty (tip).
Tornado An intense, rotating column of air that protrudes from a cumulonimbus
cloud in the shape of a funnel or a rope and touches the ground. (See Funnel cloud.)
Trade winds The winds that occupy most of the tropics and blow from the
subtropical highs to the equatorial low.
Weather The state of the atmosphere in terms of such variables as temperature,
cloudiness, precipitation, and radiation.
Wind Vane An instrument used to determine wind direction.
References:
C. Donald Ahrens, 1985. Meteorology Today. West Publishing Company, 497-509.
Frederick K. Lutgens, and Edward J. Tarbuck, 1995. The Atmosphere. Prentice-Hall
Inc., 443-456.
Joe R. Eagleman, 1980. Meteorology The Atmosphere in Action. Litton Educational
Publishing Inc., 353-364.
Joseph M. Moran, and Michael D. Morgan, 1986. Meteorology. Burgess Publishing,
486-496.
Some websites where you can get Ocean and Atmosphere related phenomena :
National Institute of Oceanography:www.nio.org
India Meteorological Departmentwww.imd.gov.in
Indian Institute of Tropical Meteorologywww.tropmet.res.in
Some Books on Monsoons
a. Southwest Monsoon – Y.P. Rao
b. The Monsoons – P.K.Das
c. Monsoon Dynamics – T.N.Krishnamurti
d. Monsoon Meteorology – C.S. Ramage
e. Monographs of India Meteorological
Department, New Delhi available from their website as e copies..
Activity Guidebook for NCSC 2014 & 2015: Version 2.0
54
Sub Theme 2
========================
Impact Of Human Activities On Weather & Climate :
Activity Guidebook for NCSC 2014 & 2015: Version 2.0
55
Sub Theme-II
IMPACT OF HUMAN ACTIVITIES ON WEATHER
AND CLIMATE Background
It took about 60000 years for the human population to grow to one billion. It took a
little more than two centuries only to grow from one billion to eight billion. Growing
population requires environmental resources (life support systems like air, water and
soil) for its survival and sustenance. In addition to this, humans, particularly in the
developed countries used technology and natural resources to produce and consume
goods in large quantities. Hence, pressure on environmental resources has grown
manifold during the last two centuries. This pressure has also impacted the climate as
well as weather conditions. Whenever we undertake any activity, we always utilise
energy in some form or other. As a result the carbon stored in the energy source is
released to the atmosphere in the form of carbon dioxide. That indicates our carbon
footprint. The more severe is the footprint, the more impact will be there on weather
and climate, since carbon dioxide is a greenhouse gas and its accumulation in the
atmosphere causes global warming. Direct and indirect impacts of such activities
listed below have resulted in change of weather and climate locally and globally.
1. Agriculture: The practices were at the expense of forest lands and other ecosystems.
Chemical fertilizers, pesticides, irrigation, soil salinity, ground water contamination,
methane generation NOxgenerationetc. impacted weather and climate in one or the
other way.
2. Animal husbandry: Demand for meat, dairy products, manure, draught animals and
easy transport led to animal rearing in large scale resulting in soil compaction, over
grazing energy wastage, methane generation, deforestation and water depletion.
3. Fisheries: Fertilizing the natural water bodies, eutrophication and ground water
contamination results in generation of greenhouse gases.
4. Human settlement and Urbanization: deforestation, conversion of agricultural lands
to urban areas, more utilisation of energy, infrared radiation, depletion of natural
resources etccreated heat islands adding to the already aggravating global warming
problems.
5. Industrialisation: the fast changing scenario in natural resource utilisation and
industrialisation in the 19th century resulted in rampant deforestation, further
conversion of agricultural lands, increased mining, quarrying, energy utilisation, heat
islands, industrial effluents, solid waste generation, air and water pollution.
6. Transportation: The development of transportation facilities vehicle explosion cause
increased fossil fuel utilisation, land use changes, heat generation and air pollution
7. Communication (paper and electronic):the communication revolution in the 20th
century increased the demand for paer and other resources in a tremendous
proportion. This led to changes in land use pattern, energy utilisation, depletion of
water and deforestation.
8. Energy production: The progress of modernisation resulted in more energy input in
all the realms of development. Energy from hydel, thermal and nuclear sources led to
greater ecological imbalance on land, water and atmosphere directly or indirectly

Activity Guidebook for NCSC 2014 & 2015: Version 2.0
56
Carbon footprint:
(http://en.wikipedia.org/wiki/Carbon_footprint)
A carbon footprint is historically defined as "the total sets of greenhouse gas emissions caused by an
organization, event, product or person."[1]
The total carbon footprint cannot be calculated because of the large amount of data required and the fact
that carbon dioxide can be produced by natural occurrences. It is for this reason that Wright, Kemp, and
Williams, writing in the journal Carbon Management, have suggested a more practicable definition:
A measure of the total amount of carbon dioxide (CO2) and methane (CH4) emissions of a defined
population, system or activity, considering all relevant sources, sinks and storage within the spatial
and temporal boundary of the population, system or activity of interest. Calculated ascarbon dioxide
equivalent (CO2e) using the relevant 100-year global warming potential(GWP100).
Greenhouse gases (GHGs) can be emitted through transport, land clearance, and the production
and consumption of food, fuels, manufactured goods, materials, wood, roads, buildings, and
services.[3]
For simplicity of reporting, it is often expressed in terms of the amount of carbon dioxide,
or its equivalent of other GHGs, ed..
Most of the carbon footprint emissions for the average U.S. household come from "indirect" sources,
i.e. fuel burned to produce goods far away from the final consumer. These are distinguished from
emissions which come from burning fuel directly in one's car or stove, commonly referred to as
"direct" sources of the consumer's carbon footprint.[4]
The concept name of the carbon footprint originates from ecological footprint, discussion,[5]
which
was developed by Rees and Wackernagel in the 1990s which estimates the number of "earths" that
would theoretically be required if everyone on the planet consumed resources at the same level as
the person calculating their ecological footprint. However, given that ecological footprints are a
measure of failure, AninditaMitra (CREA, Seattle) chose the more easily calculated "carbon footprint"
to easily measure use of carbon, as an indicator of unsustainable energy use. In 2007, carbon
footprints was used as a measure of carbon emissions to develop the energy plan for City of
Lynnwood, Washington. Carbon footprints are much more specific than ecological footprints since
they measure direct emissions of gases that cause climate change into the atmosphere.
impacting on weather and climate. Increase in GHG, deforestation, mining generating
heat, increased water consumption, dumping of fly ash etc had direct impact. Even
certain sectors of renewable sources of energy like wind and solar ha d its impact on
ecosystems.
9. Waste generation:the life style changes and throw away culture led to generating
huge quantity of muncipal, biomedical,industrial and agricultural waste which is
cumbersome for nature to take care in its course. The GHG, open burning , dumping
yards and burning of rubber, plastic etc added more problems.
10. Tourism and entertainment: globalisation, increased transport and communication
facilities enhanced a sudden disproportional growth in the tourism industry during
the last few decades. This resulted in demand for huge quantity of energy and
infrastructure facility which resulted in to large scale land and water encroachment,
waste generation etc especially in the developing countries which contributed to the
aggravating changes in the ecosystem.
11. Forestry: Due to increased demand for preferred type of timber and wood, for the
last few centuries trees have been felled from natural forests. The land is utilised for non
forestry purpose and at at times the land is also utilised for reforestation. However the
species diversity gets altered on account of preference of certain selected species like
sal, eucalyptus, teak etc. As a result the ecological benefits of natural forests is lost. The
relative humidity, temperature water percolation and soil profile etc are changed. Also
the carbon sequestration pattern and the rate of biogeochemical cycles changed.
Activity Guidebook for NCSC 2014 & 2015: Version 2.0
57
Following can be used to introduce climate
change to older children. Courtesy
Environmental Protection Agency, USA.From A
Student’s Guide to Climate Change. See
http://www.epa.gov/climatechange/kids/index.
html
What is to be understood:
The children should be able to understand the direct as well as indirect impacts of human
activities on weather and climate. The impacts may be in the form of temperature
change, change in humidity, changes in water availability, changes in energy level
received from sun etc.
Why it is important:
The children should know that human activities are impacting weather and climate
in different ways. Some of the impacts may threaten the survival of human race
itself. Even if it does not happen so, food shortage, water shortage, temperature
variation, flooding, drought,
sea level rise, cyclones etc
may cause serious
implications in terms of
economy and well being.
1. Is climate change the same
thing as global warming?
No. “Global warming” refers
to an increase in the average temperature near the Earth's surface. “Climate change”
refers to the broader set of changes that go along with global warming, including
changes in weather patterns, the oceans, ice and snow, and ecosystems. Most experts
now use the term “climate change” because it gives a more complete picture of the
changes that are happening around the world.
2. Why is climate change happening?
The main reason the climate is changing is because people are adding greenhouse
gases to the atmosphere. The most important greenhouse gas is carbon dioxide,
which is released whenever people burn fossil fuels to do everyday activities like
driving cars, heating buildings, and making electricity. As greenhouse gases build up
in the atmosphere, they cause the Earth to trap extra heat, making the planet warmer.
3. Does the “ozone hole” have anything to do with climate change?
Not really. The “ozone hole” refers to a decrease in the layer of ozone gas found high
in the Earth's atmosphere, which helps to shield the planet from the sun's harmful
ultraviolet rays. The ozone layer has become thinner because of chemicals that were
once commonly used in products ranging from spray cans to foam furniture
cushions. While a thinner ozone layer allows more ultraviolet rays to reach the Earth,
increasing the risk of sunburns and skin cancer, it doesn't cause climate change.
4. Hasn't the Earth's climate changed before? What's different about climate
change today?
Yes. The Earth's climate changed many times in the distant past as a result of natural
causes, but today's climate change is different because people's activities are the
main cause. This is also the first time modern society has had to deal with such large,
widespread changes in climate. Rising sea level, stronger storms, droughts, and other
effects of climate change will pose major challenges for people around the world.

Activity Guidebook for NCSC 2014 & 2015: Version 2.0
58
The Earth's Climate in the
Past
The Earth was formed about 4.5 billion
years ago—that's a very long time ago!
It's hard to say exactly what the Earth's
daily weather was like in any particular
place on any particular day thousands
or millions of years ago. But we know
a lot about what the Earth's climate
was like way back then because of
clues that remain in rocks, ice, trees,
corals, and fossils.
These clues tell us that the Earth's
climate has changed many times
before. There have been times when
most of the planet was covered in ice,
and there have also been much warmer
periods. Over at least the last 650,000
years, temperatures and carbon dioxide
levels in the atmosphere have
increased and decreased in a cyclical
pattern. People didn't cause the climate
change that occurred thousands or
millions of years ago, so it must have
happened for other natural reasons.
5. Why is it a problem if the Earth's average temperature gets a little warmer?
Temperature plays an important role in how nature works, and even a small change
in average temperature can have a noticeable impact on plants, animals, and other
natural processes. For example, just a one- to two-degree increase in global
temperature can lead to a much greater risk of wildfires. Some parts of the world are
warming a lot more than average, which means the effects are much more dramatic.
6. How can the Earth be getting warmer if it's colder than usual where I live?
The average temperature around the world is rising, and 2000–2009 was the warmest
decade on record. But that doesn't mean we won't still have occasional cold spells. To
see why, it's helpful to understand the difference between weather and climate.
“Weather” refers to day–to–day conditions, such as a rainstorm or today's
temperature. In contrast, “climate” refers to the average weather conditions you
would expect to find in a certain place, based on patterns over many years. Day–to–
day weather will always have its ups and downs, and there will always be a chance of
extreme cold events. But as the Earth's climate gets warmer over time, most places
will experience more days with record high temperatures and fewer days with record
low temperatures.
7. What are the most visible signs of
climate change?
You can't see the signs of climate change
from one day to the next, but if you
compare from year to year, the clues are
everywhere! For example, as the Earth has
become warmer, the average sea level
around the world has risen by nearly 7
inches in the last 100 years, glaciers all over
the world are shrinking, and many bird
species are shifting northward. Some of the
most obvious changes are happening in the
Arctic, where the amount of ice in the ocean
has decreased dramatically.
8. Can climate change harm plants and
animals?
Yes. Any change in the climate of an area
can affect the plants and animals that live
there. Some animals might adapt or move
elsewhere, but others could have trouble
surviving. For example, if the ice in the
Arctic Ocean disappears, the animals that
depend on this ice won't have anywhere
else to go. Climate change also alters plants'
and animals' life cycles. For example, some
flowers are blooming earlier in the spring,
while some animals are migrating at
different times.
9. What can we do to stop climate change?
There are lots of things you, your friends,
and your family can do each day to reduce
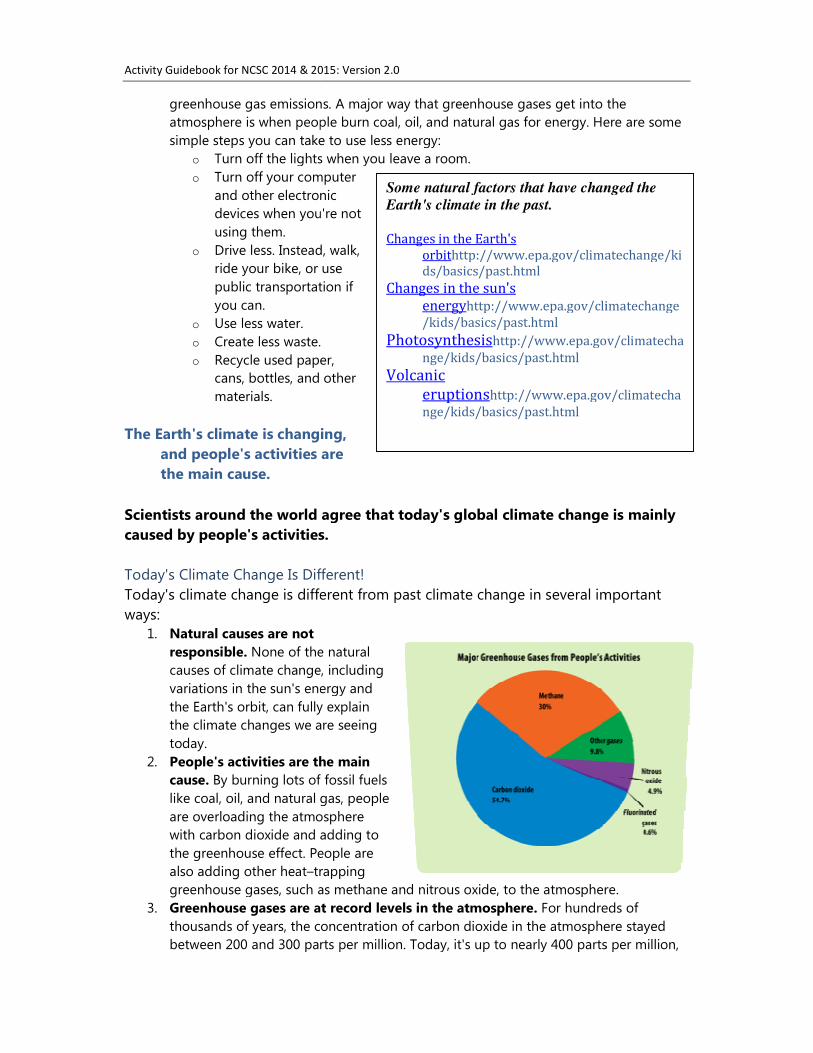
Activity Guidebook for NCSC 2014 & 2015: Ver
greenhouse gas emissions. A major way that greenhouse gases get into the
atmosphere is when people burn coal, oil, and natural gas for energy. Here
simple steps you can take to use less energy:
o Turn off the lights when you leave a room.
o Turn off your computer
and other electronic
devices when you're not
using them.
o Drive less. Instead, walk,
ride your bike, or use
public transportation if
you can.
o Use less water.
o Create less waste.
o Recycle used paper,
cans, bottles, and other
materials.
The Earth's climate is changing,
and people's activities are
the main cause.
Scientists around the world agree that today's global climate change is mainly
caused by people's activities.
Today's Climate Change Is Different!
Today's climate change is differen
ways:
1. Natural causes are not
responsible. None of the natural
causes of climate change, including
variations in the sun's energy and
the Earth's orbit, can fully explain
the climate changes we are seeing
today.
2. People's activities are the main
cause. By burning lots of fossil fuels
like coal, oil, and natural gas, people
are overloading the atmosphere
with carbon dioxide and adding to
the greenhouse effect. People are
also adding other heat–trapping
greenhouse gases, such as methane and nitrous oxide, to the atmosphere.
3. Greenhouse gases are at record levels in the atmosphere.
thousands of years, the concentration of carbon dioxide in the atmosphere stayed
between 200 and 300 parts per million.
Activity Guidebook for NCSC 2014 & 2015: Version 2.0
Some natural factors that have changed the
Earth's climate in the past.
Changes in the Earth's
orbithttp://www.epa.gov/climatechange/ki
ds/basics/past.html
Changes in the sun's
energyhttp://www.epa.gov/climatechange
/kids/basics/past.html
Photosynthesishttp://www.epa.gov/climatecha
nge/kids/basics/past.html Volcanic
eruptionshttp://www.epa.gov/climatecha
nge/kids/basics/past.html
greenhouse gas emissions. A major way that greenhouse gases get into the
atmosphere is when people burn coal, oil, and natural gas for energy. Here
simple steps you can take to use less energy:
Turn off the lights when you leave a room.
your computer
and other electronic
devices when you're not
Drive less. Instead, walk,
ride your bike, or use
public transportation if
Create less waste.
Recycle used paper,
cans, bottles, and other
Earth's climate is changing,
and people's activities are
Scientists around the world agree that today's global climate change is mainly
caused by people's activities.
Today's Climate Change Is Different!
Today's climate change is different from past climate change in several important
None of the natural
causes of climate change, including
variations in the sun's energy and
the Earth's orbit, can fully explain
the climate changes we are seeing
People's activities are the main
By burning lots of fossil fuels
like coal, oil, and natural gas, people
are overloading the atmosphere
with carbon dioxide and adding to
the greenhouse effect. People are
trapping
se gases, such as methane and nitrous oxide, to the atmosphere.
Greenhouse gases are at record levels in the atmosphere. For hundreds of
thousands of years, the concentration of carbon dioxide in the atmosphere stayed
between 200 and 300 parts per million. Today, it's up to nearly 400 parts per million,
59
Some natural factors that have changed the
http://www.epa.gov/climatechange/ki
http://www.epa.gov/climatechange
http://www.epa.gov/climatecha
http://www.epa.gov/climatecha
greenhouse gas emissions. A major way that greenhouse gases get into the
atmosphere is when people burn coal, oil, and natural gas for energy. Here are some
Scientists around the world agree that today's global climate change is mainly
t from past climate change in several important
se gases, such as methane and nitrous oxide, to the atmosphere.
For hundreds of
thousands of years, the concentration of carbon dioxide in the atmosphere stayed
Today, it's up to nearly 400 parts per million,

Activity Guidebook for NCSC 2014 & 2015: Ver
and the amount is still rising. Along with other greenhouse gases, this extra carbon
dioxide is trapping heat and causing the climate to change.
Source: EPA's Climate Change Indicators (2010)
The size of each piece of the pie represents the amount of warming that each gas is
currently causing in the atmosphere as a result of em
Source: Intergovernmental Panel on Climate Change, Fourth Assessment Report
(2007).
Source: EPA's Inventory of U.S. Greenhouse Gas Emissions and Sinks (2013)
Source: EPA's Climate Change Indicators (2012)
All About Carbon Dioxide
Carbon is an element that's found all over the world and in every living thing. Oxygen
is another element that's in the air we breathe. When carbon and oxygen bond
together, they form a colorless, odorless gas called carbon dioxide, which is a heat
trapping greenhouse gas. Whenever we burn fossil fuels such as coal, oil, and natural
gas—whether it's to drive our cars, use electricity, or make products
producing carbon dioxide.
The atmosphere isn't the only part of the Earth that has carbon. The oceans store
large amounts of carbon, and so do plants, soil, and
deposits of coal, oil, and natural gas deep
underground. Carbon naturally moves from one
part of the Earth to another thr
cycle. But right now, by burning fossil fuels, people
are adding carbon to the atmosphere (in the form
Activity Guidebook for NCSC 2014 & 2015: Version 2.0
People are adding carbon
dioxide to the atmosphere
faster than it can be removed.
Scorching summers... Melting
glaciers... Stronger storms...
The signs of global climate
and the amount is still rising. Along with other greenhouse gases, this extra carbon
dioxide is trapping heat and causing the climate to change.
EPA's Climate Change Indicators (2010).
The size of each piece of the pie represents the amount of warming that each gas is
currently causing in the atmosphere as a result of emissions from people's activities.
Intergovernmental Panel on Climate Change, Fourth Assessment Report
EPA's Inventory of U.S. Greenhouse Gas Emissions and Sinks (2013)
EPA's Climate Change Indicators (2012).
Carbon is an element that's found all over the world and in every living thing. Oxygen
is another element that's in the air we breathe. When carbon and oxygen bond
together, they form a colorless, odorless gas called carbon dioxide, which is a heat
g greenhouse gas. Whenever we burn fossil fuels such as coal, oil, and natural
whether it's to drive our cars, use electricity, or make products—we are
The atmosphere isn't the only part of the Earth that has carbon. The oceans store
large amounts of carbon, and so do plants, soil, and
deposits of coal, oil, and natural gas deep
underground. Carbon naturally moves from one
part of the Earth to another through the carbon
cycle. But right now, by burning fossil fuels, people
are adding carbon to the atmosphere (in the form
60
People are adding carbon
dioxide to the atmosphere
e removed.
Scorching summers... Melting
glaciers... Stronger storms...
The signs of global climate
and the amount is still rising. Along with other greenhouse gases, this extra carbon
The size of each piece of the pie represents the amount of warming that each gas is
issions from people's activities.
Intergovernmental Panel on Climate Change, Fourth Assessment Report
EPA's Inventory of U.S. Greenhouse Gas Emissions and Sinks (2013).
Carbon is an element that's found all over the world and in every living thing. Oxygen
is another element that's in the air we breathe. When carbon and oxygen bond
together, they form a colorless, odorless gas called carbon dioxide, which is a heat-
g greenhouse gas. Whenever we burn fossil fuels such as coal, oil, and natural
we are
The atmosphere isn't the only part of the Earth that has carbon. The oceans store

Activity Guidebook for NCSC 2014 & 2015: Version 2.0
61
of carbon dioxide) faster than natural processes can remove it. That's why the
amount of carbon dioxide in the atmosphere is increasing, which is causing global
climate change.
The Earth's climate is getting warmer, and the signs are everywhere. Rain patterns are
changing, sea level is rising, and snow and ice are melting sooner in the spring. As global
temperatures continue to rise, we'll see more changes in our climate and our environment.
These changes will affect people, animals, and ecosystems in many ways.
Less rain can mean less water for some places, while too much rain can cause terrible
flooding. More hot days can dry up crops and make people and animals sick. In some places,
people will struggle to cope with a changing environment. In other places, people may be
able to successfully prepare for these changes. The negative impacts of global climate
change will be less severe overall if people reduce the amount of greenhouse gases we're
putting into the atmosphere and worse if we continue producing these gases at current or
faster rates.
Worldwide, 2000–2009 was the warmest decade ever recorded.
What will happen in the future?
The choices we make now and in the next few decades will determine how much the
planet's temperature will rise. While we are not exactly sure how fast or how much
the Earth's average temperature will rise, we know that:
• If people keep adding greenhouse gases into the atmosphere at the current rate, the
average temperature around the world could increase by about 4 to 12°F by the year
2100.
• If we make big changes, like using more renewable resources instead of fossil fuels,
the increase will be less—about 2 to 5°F.
Why does it matter?
Higher temperatures mean that heat waves are likely to happen more often and last
longer, too. Heat waves can be dangerous, causing illnesses such as heat cramps and
heat stroke, or even death.
Warmer temperatures can also lead to a chain reaction of other changes around the
world. That's because increasing air temperature also affects the oceans, weather
patterns, snow and ice, and plants and animals. The warmer it gets, the more severe
the impacts on people and the environment will be.
Technologies To successfully combat climate change, people will have to switch from getting most
of their energy from burning fossil fuels to getting most of their energy from a wide
variety of clean energy sources.
Many of these technologies are already available today, while others are still being
developed and tested. Clean energy technologies like wind and solar power produce
Activity Guidebook for NCSC 2014 & 2015: Version 2.0
62
energy without burning fossil fuels. Other technologies reduce greenhouse gas
emissions through energy efficiency or by capturing these gases before they can
enter the atmosphere.
What You Can Do Can one person help stop global climate change? Yes! Especially when the simple
steps you, your friends, and your family take are multiplied by millions of people all
over the world.
Switch to Clean Energy When we get electricity from renewable energy sources like wind and solar power,
we avoid the carbon dioxide emissions that would have come from burning fossil
fuels like coal, oil, or natural gas.
• Choose green power. Talk with your family and school about switching to renewable
energy.
• Generate your own power. Can your school or home generate its own renewable
energy? Talk with your family and school about the possibility of installing solar
panels, a solar water heater, or even a wind turbine.
Use Less Energy Most of the energy you use at home and at school comes from burning fossil fuels.
Using less energy means burning fewer fossil fuels and putting less carbon dioxide
into the atmosphere.
Watch Your Water Use Saving water saves energy, which in turn reduces greenhouse gas emissions. It takes
a lot of energy to treat the water you use every day to make it safe to drink and to
deliver it to your house. It takes even more energy to turn it into hot water. Did you
know that letting your faucet run warm water for five minutes uses about as much
energy as leaving a 60–watt light bulb on for 14 hours?
Reduce Waste Most people don't realize that reducing, reusing, and recycling can help slow climate
change. How? To begin with, every product has a life cycle, and every step—from
manufacturing to disposal—leads to greenhouse gas emissions. Reducing, reusing,
and recycling means you buy (and throw away) less stuff, and that helps reduce the
amount of greenhouse gases we're adding to the atmosphere.
You can reduce greenhouse gas emissions if you:
• Reduce. Reduce the amount of new stuff you buy. To reduce waste, buy things that
have less packaging.
• Reuse. Try to borrow or rent things you'll only need for a short amount of time, and
reuse the things you already have. When you have things you no longer need, give
them to others who can use them. Use reusable bags when you go shopping.
• Recycle. Remember to recycle whatever materials you can, like bottles, cans, and
paper, so they can be collected and remade into new products.
• Buy recycled. Choose products made from recycled materials whenever you can.
• Teach your school the three R's. Schools can save energy, preserve natural
resources, and prevent greenhouse gas emissions by reducing, reusing, and recycling.

Activity Guidebook for NCSC 2014 & 2015: Version 2.0
63
More Ways to Make a Difference You can take many other actions to help reduce greenhouse gas emissions and
global climate change. For example:
• Plant a tree. Trees help to slow climate change because they absorb carbon dioxide
during photosynthesis. Trees also provide shade, which helps keep streets and
houses cooler in the summertime and reduces the need for air conditioning.
• Consider buying locally grown food. The further your food travels, the more
greenhouse gas emissions are produced in transporting the food from the farm to
your plate. You can find locally grown food at a farmers market and even at some
grocery stores.
• Reduce your carbon footprint.Find out how big your own carbon footprint is, and
explore ways you can reduce it.
• Spread the word. Give a presentation to your family, school, or community group
that explains how their actions can cause or reduce climate change. You can develop
your own. Get creative, and think of more ways to help others make a difference!
How to go for it:
The children through their observations studies, projects, etc, will be able to
understand the concept of weather and climate and their relationship with
human activities. In future if they get opportunities they may be intellectually
prepared to improve human activities in such away that weather and climate are
impacted least.
Box 3: An example of human impact on local climate
Anamalais is the Hill
Range in the
southern Western
Ghats, immediately
south to Palakkad
Gap. The highest
peak in the Western
Ghats, Anamudi
which stands at
2695 m above the
sea level is in the
Munnar region in
the Anamalais. Further south to the Anamalais is the High Ranges which is a
plateauwith heavy rainfall and with undulating terrain. The area forms the catchment
of Periyar, a major river originating from the Southern Western Ghats.The area was
once covered with dense evergreen forests, stunted shola forests and high altitude
grasslands. The British during the colonial time discovered that this region would be
ideal for some kind of plantations. Large stretches of forests in the Munnar region
were cleared for raising tea palntations in the 1880s. The forests of High Ranges were
opened up to cultivate cardamomum in 1890s. The human population grew up in
this region gradually and the human activities and the so called developmental

Activity Guidebook for NCSC 2014 & 2015: Version 2.0
64
activities resulted in dwindling of the forest cover in the region.Many small and large
urban centers were emerged with the increase of population and increased
transportation
facilities
causing
further loss of
forests.
The analysis
of weather
data being
recorded for
the last more
than 100
years has clearly shown a change in climate in Munnar and High Ranges during this
period. The temperature data from Pampadumpara in the High Ranges showed a
shift in the maximum and minimum temperature during the last 30 years. As per the
data available from Munnar, there is a decreasing trend in the total rainfall and
number of rainy days during the last more than 70 years. These changes are
supposed to be because of the impacts of human activites in the region during last
more than 100 years.
(Source of the pictures:Measures to mitigate agrarian distress in Idukki district
of Kerala:M. S. Swaminathan Research ndation, 2008.)
Box 4: Climate Change and Increasing Disasters in India
These short term climate fluctuations and extreme weather events have been the
most frequently occurring hazards and in combination with social vulnerability have
been responsible for the vast majority of disaster losses worldwide. Centre for
Research on Epidemiology of Diseases (CRED)categorizes these disasters resulting
from climatic variability and other climatic and meteorological causes as hydro-
meteorological disasters(floods, landslides, mudflows, avalanches, tidal waves,
windstorms, including typhoons, cyclones, hurricanes, storms, winter storms, tropical
storms and tornadoes, droughts, extreme temperatures, and complex disasters
associated with drought) as distinct from geological disasters (earthquakes, volcanic
eruptions and tsunamis). The hydro-meteorological disasters resulting from climate
variability and other climatic and meteorological causes are also commonly referred
as ‘climate disasters’ in disaster studies. Climate disasters have always been a
recurring theme in human history, and are on rising trend. A number of experts link
the current trends in extreme weather events with the increase in the global mean
temperature. The CRED report states that there ‘there is increasingly conclusive
evidence which confirms that global climate change will have an impact on the
Activity Guidebook for NCSC 2014 & 2015: Version 2.0
65
occurrence and magnitude of extreme events. These impacts are envisaged to
increase human vulnerability to natural disasters, thus emphasizing the need for
improved measures of preparedness in every part of the world’ .The report also
surmises that the current trends are consistent with the predictions in the case of
Asia, and West Africa that are already suffering from more severe and frequent
floods. Many future projections by Intergovernmental Panel for Climate and Climate
change (IPCC) indicate that there is ‘increased confidence that some weather events
and extremes will become more frequent, more widespread and/or more intense
during the 21st century and impacts due to altered frequencies and intensities of
extreme weather, climate and sea level events are very likely to change’.
Also, there is evidence now that climate change, with present developmental trends,
will not express itself in through slow shifts in average conditions, but will manifest at
an unprecedented rate with increased variability, frequency of extreme events, long
term implications and possibility of abrupt change, fuelled largely through
anthropogenic causes. Under such trajectory these two processes do have the
potential to coalesce generating destructive forces which could cause mega disasters
unless urgent, radical and resolute mitigation actions are not implemented. The
projected climate change will affect India particularly severely. Its consequences
include a rise in sea level, threatening areas such as the densely populated Ganges
delta, changes in the monsoon rains, the melting of the glaciers in the Hindukush-
Karakorum-Himalaya region(crucial for the water supply in the dry seasons), and the
foreseeable increase in heavy rain events and intensity of tropical cyclones. The
unprecedented heavy rain on 26th July 2005 in Mumbay is an example. In a span of
24 hours Mumbay recorded more than 90 cm railfall, a rare event in the western
coast. Nodody will forget the aftermath of the cloudburst on 16 the June 2013 in the
Utharakhand Himalayas and the massive landslides in Kedar and Kumaon regions
which killed thousands of people.
The thousands of glaciers located across the 2,400 km of the Himalayan range are at
the epicenter of an emerging crisis. The effect of possible changes in the intensity of
the monsoons will be particularly sensitive, because large parts of India receive the
majority of their annual precipitation during the summer monsoon rains, which
already vary noticeably in different regions. The summer monsoon is crucial to the
annual precipitation total of the Indian subcontinent. Over 40 million hectares (12 %
of land), is prone to floods, close to 5700 kms of its 7516 km coast line (about 8%), is
cyclone prone and exposed to tsunamis and storm surges, 2% of land is landslide
prone, and 68% of India’s arable land is affected by droughts. Of the 35 States and
Union Territories, as many as 27 are disaster prone. Most disasters in India are water
related the east coast of India, which lies in the path of tropical hurricanes from the
Gulf of Bengal, is particularly at risk of being damaged by storms and floods.The
projections by the National Institute of Oceanography (NIO), under the Council of
Scientific and Industrial Research (CSIR), Government of India on the impacts of
climate change on sea level, to assess the degree to which mean sea level and the

Activity Guidebook for NCSC 2014 & 2015: Version 2.0
66
occurrence of extreme events may change, showed an increased occurrence of
cyclones in the Bay of Bengal, particularly in the post-monsoon period, along with
increased maximum wind speeds associated with cyclones and a greater number of
high surges under climate change. In addition, the strength of tropical cyclones,
which represent a threat to the eastern coast of India and to Bangladesh, could
increase. The risk to these areas will be aggravated by the rising sea level.
Vast stretches of land in India suffers acute water shortage. Of the net area sown in
the country, 68 percent is prone to drought, and of this 33 percent is chronically
drought-prone, receiving rainfall of less than 750 mm per annum, while 35 percent
receives rainfall between 750-1,125 mm per annum. The steady shrinking of the
Himalayan Glacier ranges will drastically cut down water availability in downstream
plains of Uttar Pradesh and Bihar. India’s initial National Communication to the
United Nations Framework Convention (UNFCCC) on Climate Change projects that
Luni, the west flowing rivers of Kutchh and Saurashtra occupying about one fourth of
the area of Gujarat and 60 % of Rajasthan are likely to experience acute physical
water scarcity. The river basins of Mahi, Pennar, Sabarmati and Tapi are also likely to
experience constant water scarcities and shortages .
Landslides The areas that suffer from landslide hazards are located in the hilly tracts
of the Himalayas, Northeast India, Nilgiris, Eastern Ghats and Western Ghats. With
the melting of the glaciers in the Hindukush-Karakorum- Himalaya region, and the
foreseeable increase in heavy rain events and intensity of tropical cyclones, the
incidences of landslides are likely to increase.
Coastal zone India has an 8000 km-long coastline with two cyclone seasons, during
the southwest and northeast monsoons. Cyclones have been observed to be more
frequent in the Bay of Bengal than the Arabian Sea. Future climate change in the
coastal zones is likely to be manifested through worsening of some of the existing
coastal zonal problems. Some of the main climate related concerns in the context of
the Indian coastal zones are erosions, flooding, submergence and deterioration of
coastal ecosystems, such as mangroves and salinization. In many case these are
caused by, or, exacerbated by, sea level rise and tropical cyclones.
---------------------------------------------------------------------------------------------
---------------------------
We are suggesting some project ideas. The children can enrich their concept
and knowledge which will help them in framing projects.
Ideas for projects
1. long term changes in weather condition of the locality : rainfall(total and
pattern), temperature , relative humidity, number of rainy days, wind speed
Activity Guidebook for NCSC 2014 & 2015: Version 2.0
67
and direction data are to be obtained on long term basis (for mare than 30
years) from sources already available and plot the data to indicate any
obvious changes in the parameters. If possible discuss and correlate the
changes with certain observable parameters in the environment of the area.
The changes may be correlated with the impact on agricultural production,
drought, flood etc.
2. Urbanisation: Changes in land use in the area due to human habitation and
urbanisation: Children will interact with senior persons in their locality to
obtain information about changes in land use in the form of conversion of
agricultural land, orchards, grassland, wilderness areas in to human habitation.
Thetoposheets of different periods and google earth images may be
used(students should get a chance to know toposheets and other sources of
knowledge on earth surface, past and present) They will quantify diversions
for various purposes. Compare temperature regime and humidity level in the
surrounding area and in the habitation.
3. Analysis of waste generation, collection, and disposal in a locality and its
impact on weather and climate: children will sample waste generated in few
premises and classify them under biodegradable and non-biodegradable.
They will observe the approximate percentage of waste collected by the local
authority and their disposal methods. They will make rough estimations of
carbon dioxide and methane emissions from the waste. These two gases
directly impact the climate and weather, as these are GHGs.
4. Evaporation from man-made reservoirs and its impact on local weather:
Children can plan experiments with containers of different diameters. They
can put same quantity of water in all the container and leave them. Every
second day they can measure the loss of water by measuring the quantity left
in each container. They should correlate evaporation rate with diameter of the
container which is indicative of exposed surface area. They can correlate the
findings with field observations. Ponds, ditches, lakes etc. which are shallow
dry up fast as compared to the deeper ones. Water vapour is a greenhouse
component and also loss of water will reflect on availability of water in the
locality
Resources for use: Many links explaining weather, climate, climate change and its impacts by The Energy
and Resources Institute, New Delhi: http://know.climateofconcern.org/index.php
A Guidebook on Climate Science by the U.S. Global Change Research Program:
http://downloads.globalchange.gov/Literacy/climate_literacy_highres_english.pdf
A Climate Change Communication Toolkit including Carbon Footprint Calculator,
Presentations, Posters, Childrens’ Activity Booklet and others by the The Mumbai
Metropolitan Region – Environment Improvement Society (MMR-EIS):
http://www.mmr-ccrt.org.in/index.php?lang=en

Activity Guidebook for NCSC 2014 & 2015: Version 2.0
68
Childrens’ Activity Booklet on Climate Change by the The Mumbai Metropolitan
Region – Environment Improvement Society (MMR-EIS): http://www.mmr-
ccrt.org.in/images/CCRT_ChildrensActivityBooklet_draft5a.pdf
An Indian Guidebook to Low Carbon Lifestyle, giving Carbon Footprint Savings
as well as money savings: http://www.coolcalculator.org/toolkit.pdf
Carbon Footprint Calculator for each region in India hosted by the ICICI Bank:
http://www.icicibank.com/go-green/carbon-world-
day/indexef62.html?utm_source=gogreenhomepage&utm_medium=display&utm_ev
ent=go-green-carbon-footprint-calculator
Provides emission factors for Indian electricity, petrol, diesel and cooking gas:
http://greencleanguide.com/2011/09/14/calculate-your-carbon-footprint/
Carbon Footprint Calculator provided by Tata Power:
http://www.tatapower.com/sustainability/carbon-footprint.aspx
Carbon Footprint Calculator for major cities in India, including food:
http://www.no2co2.in/CarbonCalculator.php
Detailed Emissions Factor Ready Reckoner including food and other usage
articles, apart from energy items:
http://www.no2co2.in/admin/utils/internalresource/intresourceupload/EF_ready_reck
oner_india_Mar2012_CC.pdf
Draft article that has researched the Carbon Footprint of different classes of
households in India:
http://www.wiod.org/conferences/groningen/Paper_Grunewald_et_al.pdf
Wikipedia on Carbon Footprint: http://en.wikipedia.org/wiki/Carbon_footprint
Carbon Footprint Calculator oriented to western countries, by The Nature
magazine: http://www.nature.org/greenliving/carboncalculator/
Provides links on teaching climate concepts and student activities related to
that: http://cleanet.org/clean/literacy/climate_lit.html
Provides video links to explain climate change to children:
https://www.oercommons.org/courses/climate-change
Teachers Resource Guide on Climate Change by UNICEF provides many activities
for children: http://teachunicef.org/sites/default/files/documents/climate-change-
children-and-youth.pdf
Activity Guidebook for NCSC 2014 & 2015: Version 2.0
69
The Human impact of Climate changes in India. Freya Seath, CLRA, Published by
VinodBhanu, Executive Director, CLRA, 9 Firoze Shah Road, New Delhi,
Links to presentations and materials for kids and teachers on Global Warming:
http://www.freeclubweb.com/powerpoints/science/globalwarming.html
Links to science presentations and games to children on weather and climate:
http://science.pppst.com/index.html
Glossary Animal husbandry: is the management and care of farm animals by humans for
profit, in which genetic qualities and behaviour, considered to be advantageous to
humans, are further developed.
Biodegradable:generally organic material such as plant and animal matter and other
substances originating from living organisms, or artificial materials that are similar
enough to plant and animal matter to be put to use by microorganisms.
Eutrophication: The process by which a body of water becomes enriched in
dissolved nutrients (as phosphates) that stimulate the growth of aquatic plant life
usually resulting in the depletion of dissolved oxygen
Urbaisation:is the increasing number of people that migrate from rural to urban
areas. It predominantly results in the physical growth of urban areas, be it horizontal
or vertical. The United Nations projected that half of the world's population would
live in urban areas at the end of 2008. By 2050 it is predicted that 64.1% and 85.9% of
the developing and developed world respectively will be urbanized
Urban heat islands:An urban heat island (UHI) is a metropolitan area that is
significantly warmer than its surrounding rural areas due to human activities. The
phenomenon was first investigated and described by Luke Howard in the 1810s,
although he was not the one to name the phenomenon. The temperature difference
usually is larger at night than during the day, and is most apparent when winds are
weak.
Carbon sequestration:is the process of capture and long-term storage of carbon
dioxide or other forms of carbon to either mitigate or defer global warming and
avoid dangerous climate change. It has been proposed as a way to slow the
atmospheric and marine accumulation of greenhouse gases, which are released by
burning fossil fuels. Carbon dioxide is naturally captured from the atmosphere
through biological, chemical or physical processes.Planting more trees is one of the
methods.
Biogeochemical cycles: Biogeochemical cycle or substance turnover or cycling of
substances is a pathway by which a chemical substance moves through both biotic
(biosphere) and abiotic (lithosphere, atmosphere, and hydrosphere) compartments of
Earth. A cycle is a series of change which comes back to the starting point and which
can be repeated. Water cycle, carbon cycle, nitrogen cycle etc.
Activity Guidebook for NCSC 2014 & 2015: Version 2.0
70
Sub Theme 3
========================
Weather, Climate& Eco Systems

Activity Guidebook for NCSC 2014 & 2015: Version 2.0
71
Activity Guidebook for NCSC 2014 & 2015: Version 2.0
72
Sub Theme 3
Weather, Climate and Ecosystems
Introduction
Weather and climate are important physical environmental factors which influences
the ecosystems. The term Ecosystem deals with the biotic (living) and abiotic
(nonliving) components within the environment along with the factors interacting
each other. An ecosystem can be as large as an ocean or as small as a local pond.
Ecosystems provide people with food, goods, medicines, and many other products.
They also play a vital role in nutrient cycling, water purification, and climate
moderation.All weather and climatic paramerters affect the ecosystem elements in
various ways. In turn, biotic elements influence the development of microclimate in
an ecosystem. Human activities also affect weather and climate which now has come
to reality leading us to the perceived global climate change.
Weather and Climate have profound effects on ecosystems and the habitats that
support life on earth. The variation of temperature, humidity and precipitation the
quality of water, soil forming process directly will influence the floral growth and
faunal composition. Even though smaller changes are taking place in weather
conditions a fairly high impact may be observed on natural resources. Changes are
expected to alter the makeup and functioning of ecosystems, as well as some of the
critical benefits that ecosystems provide to people. Fast changes in the climate can
threaten ecosystems that have already been weakened by other human activities
such as pollution, development, and overharvest etc.
Biodiversity is the living component of any ecosystem. Although species have
adapted to environmental change for millions of years, a quickly changing climate
could require adaptation on larger and faster scales than in the past. Those species
that cannot adapt are at risk of extinction. Even the loss of a single species can have
cascading effects because organisms are connected through food webs and other
interactions.
The timing of many natural events, such as flower blooms and animal migrations, is
linked to climate factors such as temperature, moisture availability, and amount of
daylight. Changes in weather patterns and extreme events associated with climate
change can disrupt these natural patterns. These isruptions, in turn, can affect
seasonal behavior and interactions among species. For example, if birds migrate and
lay eggs too early, hatchlings might not have an adequate food supply. While some
animals and plants will successfully adjust life-cycle patterns to changing weather
pattern cues, others might not be so successful. Climate change can alter where
species live and how they interact, which could fundamentally transform current

Activity Guidebook for NCSC 2014 & 2015: Version 2.0
73
ecosystems. Impacts on one species can ripple through the food web and affect
many organisms in an ecosystem.
India’s weather and climatic conditions are naturally controlled by its geographical
locations and hence the parameters of weather vary from place to place. Due to such
variations the vegetation type, soil quality and water quality also vary from place to
place.
Weather and Climate variability have various significant parameters such as Rain,
Temperature, Wind and Humidity that inflict impact on the abiotic and biotic nature
on earth. These parameters have effect on the occurrence, abundance, seasonality
and behavior of living organisms as well as quality of air, water and soil. It has direct
or indirect effect on the various ecosystems. When some of these ecosystems are
available every where in India some will be restricted to very specialized locations.
Types of ecosystems
Terrestrial ecosystems
Forest ecosystem – Various types of forests across the country
Agricultural ecosystem _ various crop systems across the country
Grassland – Secondary, rarely the primary grass lands in many parts of the country
Desert ecosystem – Ex: Thar desert in Rajastan
Hill and mountain ecosystems : Ex: Himalayas, Western & Eastern Ghats, North
Eastern Hills, Aravali, Vindya-Satpuraetc
Iceland ecosystems : Himalyas
Aquatic ecosystems
Pond, Lake, River ecosystem Temporary Wetlands : most parts of the country
Mangroves, Marine, , Estuaries and Lagoons : Costal area
Logical framework
Weather and climate variability affect the phenology of plants, occurrence of various
floral and faunal elements populations of different species and in the manifestation
of many behavior of animals. The consequences of climate variability at a macro
level could be manifested as disasters also such as floods, droughts, unprecedented
rains, inconsistencies in seasonal temperature etc on various ecosystems.

Activity Guidebook for NCSC 2014 & 2015: Ver
We need to understand and observe the changes in weather parameters
the changes in biotic and abiotic parameters around us. This will enable us to study
the effect of the weather/climate on ecosystems. For example in pond ecosystem
the intensity of rain will change the level of water, change the pH level, turbi
so on which in turn influence the biological activities such as growth of grass,
flowering, population of insects, fishes and birds. They also behave in different ways.
Systematic observations, measurement and analysis make us understand the
functioning of ecosystem in better way. To understand the effect of weather and
climate on the life on the surrounding or vice versa the children’s projects should
begin with asking significant questions to that effect.
Different component and aspects to be c
1. The various components contributing to the weather and climate conditions
such as temperature, pressure, wind, precipitation and humidity are important
for the study depending on the question under study.
2. Biotic components suc
3. Abiotic component such as air, water and soil.
Project Examples
1. Influence of vegetation cover on microclimate
Activity Guidebook for NCSC 2014 & 2015: Version 2.0
Flow chart
We need to understand and observe the changes in weather parameters
the changes in biotic and abiotic parameters around us. This will enable us to study
the effect of the weather/climate on ecosystems. For example in pond ecosystem
the intensity of rain will change the level of water, change the pH level, turbi
so on which in turn influence the biological activities such as growth of grass,
flowering, population of insects, fishes and birds. They also behave in different ways.
Systematic observations, measurement and analysis make us understand the
ioning of ecosystem in better way. To understand the effect of weather and
climate on the life on the surrounding or vice versa the children’s projects should
begin with asking significant questions to that effect.
Different component and aspects to be covered under this subtheme
The various components contributing to the weather and climate conditions
such as temperature, pressure, wind, precipitation and humidity are important
for the study depending on the question under study.
Biotic components such as flora, fauna and microbs in a given ecosystem
Abiotic component such as air, water and soil.
Influence of vegetation cover on microclimate
74
We need to understand and observe the changes in weather parameters as well as
the changes in biotic and abiotic parameters around us. This will enable us to study
the effect of the weather/climate on ecosystems. For example in pond ecosystem
the intensity of rain will change the level of water, change the pH level, turbidity and
so on which in turn influence the biological activities such as growth of grass,
flowering, population of insects, fishes and birds. They also behave in different ways.
Systematic observations, measurement and analysis make us understand the
ioning of ecosystem in better way. To understand the effect of weather and
climate on the life on the surrounding or vice versa the children’s projects should
overed under this subtheme
The various components contributing to the weather and climate conditions
such as temperature, pressure, wind, precipitation and humidity are important
h as flora, fauna and microbs in a given ecosystem
Activity Guidebook for NCSC 2014 & 2015: Version 2.0
75
The microclimate in simple term refers to the modified climate of a small area which
can be different in temporal and spatial scale from the climate of the region. The
microclimate is modified by vegetation cover, industrialization, development of
human settlement and any other intervention in the land use pattern. Tree plantation
restricts incoming radiation and has a cooling impact on the microclimate. Trees also
act as shelterbelts and reduce desiccating effect of wind. Vegetation cover greatly
modifies the soil environment in long run which is a vital component of the
microclimate. Modification of microclimate is the perceptible and immediate effect of
anthropogenic intervention in land use system. A basic understanding of
microclimate will help the students to conceive the possible impact of land use
change.
Objective
To understand the microclimate of an area
To study the influence of vegetation cover on microclimate
To have a comparative study of microclimate under different land use system
The experiment may be divided in two components
(A) Field study - monitoring microclimate of different land use system
(B) Development of workable model to understand the concept of microclimate
Part A: Field study - monitoring microclimate of different land use systems
Methodology
Select different land use systems in the surrounding locality
a) Crop land
b) Barren land
c) Forest land/Orchard
d) Settlement areas and any other typical land use system.
Two simply measurable parameters: temperature and evaporation are selected. This
can be improvised by incorporating additional indicators.
• Keep circular leak proof open pan of ½ m diameter and 50 cm depth at the
representative place of each land use system. Fill with water up to 30 cm
depth. Cover it with wire net.
• Keep the thermometers in suitable places to measure soil temperature,
water temperature (of the pan) and air temperature in these sites. Care
should be taken to avoid direct radiation on the bulb of the thermometer.
• Record the temperature observations three times daily at early morning (say,
7 am), mid day (say at 12 to 2 pm) and during evening (say, 6 pm) over a
period of 4 months at weekly interval.
• Record the depth of water from these pans at weekly interval and add water
as per requirement during the period of study
• Collect the soil samples from each site at 10 cm depth 3 days after each rain
event. Take the fresh weight (immediately after collection) and again by
Activity Guidebook for NCSC 2014 & 2015: Version 2.0
76
drying the same sample at 105 0C for 24 hours in an oven. Calculate the
moisture content as below -
Soil moisture content = (Fresh soil weight – Dry soil weight)/Dry soil weight
The impact on soil evaporation can only be perceptible if soil types are same
because the soil type (textural class) is a major driving factor for water
release from soil for evaporation
Important note: It is a group activity. Time synchrony has to be maintained for
observations at different field sites. Each student may be assigned one site for diurnal
observation.
Relevance:
Note the difference in temperature and evaporation rate from each
observation site. These parameters are easily perceptible but important indicators to
define a microclimate of a place. Mark, how human intervention changes the
microclimate. This will give help the students to understand the microclimate and in
broad sense demonstrate how anthropogenic intervention is responsible for
modification of the climate on the earth surface.
Part B: Understanding the concept of microclimatic
Materials required
• Earthen pot (6 Nos)
• Seedlings (Fast growing plant depending local suitability)
• Card board & Ply board
• Thermometer (2 Nos)
• Open pan of 20 cm diameter and 5 cm depth
Methodology:
• Take 6 earthen pots. Make a whole at the bottom of each pot.
• Fill the pots with one thin layer of small stones at the bottom and the rest with
soil
• Plant one seedling in each pot and water regularly.
• Make two model houses using card board / ply board
• Place one model house in the middle of 6 pots and one house in open area
• Measure the temperature of the roof top of each house (using thermometer)
at 15 days interval starting from the date of planting.
• Place the open pan near each model house and keep 2 cm depth of water in
each pan. Add water to each pan after drying.
• Note the temperature difference between the two situations
• Note the time required to dry up the water from each pan
Relevance:
This project will give a direct experience to the students about how plantation
helps in ameliorating the microclimate. Maintaining the plants from sowing to

Activity Guidebook for NCSC 2014 & 2015: Version 2.0
77
subsequent growth will induce the association of students with the plants and will
help in understanding the concept of microclimatic modification at the same time.
Hands-on learning process will be an interesting and effective method.
Note:These two exercises (part-A & part-B) may be considered complimentary to
each other
2. Effect of weather on soil fauna
Introduction:
Soil is one of the most diverse habitats on earth and contains one of the numerous
assemblages of living organisms. Soil biota includes bacteria, fungi, protozoa,
nematodes, mites, collembolans (springtails), annelids (earthworms), macro
arthropods (insects, woodlice) etc. The primary role of soil biota is to recycle organic
matter that is derived from the above ground plant based food web. Weather has a
profound effect on
Objectives:
1. To observe and document some visible life forms present in the land.
2. To record the seasonal variation and the type of biodiversity present in the
soils of varying productivity levels.
3. To study effect of rainfall and soil temperature on soil fauna
Methodology:
Sampling of soil and soil fauna:
Sample should be taken from the root zone of plants. Collect soil samples with
specific quadrat . Take sample from different locations within the area and mix
together. Collect the soil and place it in a ziploc bag. It should not be touched with
hands. Separate soil samples will be collected for some physico-chemical analysis viz.
texture (feel method), colour, pH etc.
To study the organisms in the soil:
1. Larger animals can be easily separated( Earthworms, beetles, etc)
2. To catch small arthropods, take a Tullgren funnel. Set a piece of ¼ inch rigid
wire screen in the bottom of the funnel to support the soil. Half fill the funnel
with soil, and suspend it over a cup with a bit of anti freeze or ethyl alcohol in
the bottom as a preservative. Suspend a light bulb (25 W) for about 4-5 days
over the soil to drive the organisms out of the soil. Animals will move away
from the light and heat and fall down in the cup placed below.
[ we can give a figure of the funnel and separation of insects here]
Observation:
Date
Time:
Weather: Sunny/ Rainy /Cloudy etc.
Activity Guidebook for NCSC 2014 & 2015: Version 2.0
78
Sampling area:
Characteristics of the soil:
Sample size:
Performing this study a student can realize the possibility of using the soils in
industry and how quality of raw materials influence end product quality. The
magnitude of large scale destruction of good quality of soil through other purposes
can also be assessed.
Analysis:
1. Appropriate data sheet may be created for soil fauna.
2. Abundance of different species or relative density could be analyzed from the
data collected using following formula.
Total no. of individuals of the species in all the sampling units
3. Abundance = --------------------------------------------------------------------------
---
No. of sampling units in which the species occurred
Total no. of individual species
4. Relative density = --------------------------------------------- x 100
Total no. of individual in all species.
5. Seasonal variation of the animals could be noted under different soil conditions.
Conclusion:
1. Significance of habitat choice by the organism can be studied.
2. Dominant species and rare species can be shown.
3. Compare the result between or among the soils.
Relevance of the project:
A comparison of soil macro fauna in different types of soil like, forest, agricultural
land, and urban, eroded, etc can be shown. The analysis of results may suggest
remedies for eco-restoration of the degraded land.
3. Effect of rainfall on phenology of plants
Objectives:
Sample no. Type of organism No. of individual Remarks
Activity Guidebook for NCSC 2014 & 2015: Version 2.0
79
1. To study the phenology of plants in relation to the rainfall in an area.
2. To analyse the relation between temperature/rainfall and various pheno-
phases of plants
Methodology
• Select a set of common plants species available in your locality.
• Then collect information about these species from elderly people and
observation about their period of flowering, fruiting and other charateristics
• Start observations on each of these plants and record the phenology
(budding, leaf flushing, flowering, fruiting, seed dispersal etc) of the plant
systematically
• The data gathered thus should be tabulated analysed and compared to
understanding the change in phenology of the different species.
Observation sheet:
Date: Time:
Weather: Sunny/ Rainy /Cloudy etc. Location:
4. To study the impact of climate on sacred grove biodiversity
Sacred grooves are the ecosystems conserved through traditional belief systems
in particular localities. They have played significant role in conservation and
preservation of biological resources. Students can document the changes in
sacred groves through questionnaire survey and collect the climatic information
from secondary sources and study the relationships.
Objectives
1. To understand the component of the sacred groves and the changes in sacred
grove in last 2 decades
2. Study the changes in sacred grows with respect to the weather and climate
Methodology
• At the very outset we need to collect information from the village
headman/priest and elderly people regarding existence of sacred groves in
the vicinity of the study area.
• The sacred grove needs to be visited for the pilot survey along with teacher.
Species Number of
Individuals
Phenological
stage
Remarks

Activity Guidebook for NCSC 2014 & 2015: Version 2.0
80
• During the pilot visit the main features of the grove such as the deity, belief
system, use of resources and biodiversity have to be recorded.
• Then the main questions regarding sacred groves to be prepared for
documentation of biodiversity and degradation.
• The historical data can be compared with the current data to make us
understand the changes taking place in the sacred groves.
• Meantime the information regarding weather and climate can be collected
from secondary sources and can be correlated with change in sacred grove.
Box1. Carbon sequestration
Carbon sequestration - Forests trap carbon in the soil
Plants use the sunlight to combine carbon dioxide and water into starch. The new
research shows that vast amounts of it are pumped down to fungi deep in the
ground, keeping the carbon out of the atmosphere and keeping the climate cool.
Some of the energy-rich starch molecules are kept in the plants, and then is often
eaten by herbivorous animals or reaches again the soil through fallen leaves to be
gobbled up by microscopic organisms. But some of the sugar is pumped down to
the roots and traded with mycorrhizal fungi in exchange for nutrients.
The mycorrhizal fungi take the starchfrom the plants, and in return they feed
nutrients to the plants. Fungi
send stretching tentacles,
called mycelia, through the
ground to forage for nitrogen,
phosphorous and other
nutrients that are valued by the
plants. They use those
nutrients as currency with
which they buy starch.
Illustrated by Perry Shirley (taken from web)
The sugar that’s passed from the plant to the fungi contains lots of carbon, which the
plant originally sucked out of the air as carbon dioxide. Scientists have discovered
that most of the carbon that’s stored in some forest floors is sequestered in the
bodies of the dirt-dwelling fungi — not, as had been presumed, in the decomposing
leaf litter. The researchers discovered that 50 to 70 percent of stored carbon in the
forests was locked up in the root layer, where the mycorrhizal fungi thrive.
Box2.Foliar Water Uptake - Climate matters in the ecosystem
Foliar Water Uptake
All of us know that the water enters the roots from moisture in the soil and is sucked
up the trunk through straw-like xylem to the leaves, where some evaporates. The
combined effects of water tension and water cohesion inside the xylem and

Activity Guidebook for NCSC 2014 & 2015: Version 2.0
81
evaporation from the leaves keeps the water flowing against the force of gravity. A
study of trees growing on Costa Rican mountains revealed that some high-altitude
species can do the opposite way. When the soil is parched and their canopies are
saturated by clouds, these trees use their leaves to suck water out of the air and then
send the moisture back toward their trunks. “Water is still moving along a gradient
from areas with more water to areas with less water. The clouds that nurture these
cloud forests are evaporating as the planet warms, meaning the cloud-drinking
strategy could doom those trees that rely upon it. That would be bad news for the
birds and other wildlife that live in cloud forests, which are some of the world’s most
striking and biodiverse ecosystems. “This phenomenon of water from clouds entering
leaves — foliar water uptake — indicates a much tighter relationship between clouds
and cloud forest plants than previously known.
Activity Guidebook for NCSC 2014 & 2015: Version 2.0
82
Focal Theme 4
Weather, Climate- Society & Culture.

Activity Guidebook for NCSC 2014 & 2015: Version 2.0
83
Sub theme-IV
Weather, Climate – Society and Culture
Draft prepared by: Jayanta Kr Sarma, SSEAEP, M.G. Road
Nagaon-782001, Assam
Website-www.sseaep.org
Background:
Weather is the condition of the atmosphere at particular place and time1; with respect to the
variables like temperature, air pressure, wind, precipitation, etc.2
On the other hand climate is the regular pattern of weather conditions of a particular place1;a region
of Earth having particular meteorological condition3.
It can also be defined as the conditions of the
atmosphere near the Earth’s surface at certain location on Earth. But there are distinct differences
with weather. Weather changes from day to day or season to season and also change in a regular
cycle during the year. Climate is broadly a long term condition of weather pattern taken over a
period of at least thirty years of a region.4
Abstract Weather and climate are key environmental factors which determine the state of natural
environment, which influences the human being in to a large extent. In brief, weather and climatic
condition determines the state of natural environment in relation to land, soil, water, flora and
fauna, etc. Natural state of environment creates foundation for human livelihood practices. The
natural environment and associated livelihood practices leads to formation of different social
groups and traits of belief, values, norms and knowledge system. These together structure the
society and form the cultural system at large and mould human way of life in terms of life style.
When this life style is less energy and material intensive its impact on natural state of environment
is minimum;so pressure of human activities on weather and climate are less. On the other hand,
when it is more energy and material intensive its negative impact on natural state of environment
is more and have more pressure on weather and climate through its activities. In many cases the
social and cultural practices develop specific knowledge system through which people of this
societal group try to assess the weather and predicting its nature traditionally to plan their day to
day activities. In this sub-theme, it is planned to review, assess, and validate such social and
cultural practices to know about the inter-woven relationship among weather-climate-society and
culture, and impact of socio-culturally defined lifestyle on weather & climate. However instead of
mere survey and documentation based work, it is desired that theactivities would validate the
practices through appropriate analysis and experimentation.
Activity Guidebook for NCSC 2014 & 2015: Version 2.0
84
Society is a group of people with common territory, interaction, and culture. Society evolved
through formation of groups from family to occupation based to interest based groups, etc. It may
vary from region to region on the basis of natural environmental situation over different time scales.
time. Because with the variation of space and time human interface with natural environment
changes and human beings acquire different information and knowledge. Based on such practical
experience and knowledge human beings designed their way of life, which is linked to formation of
different social groups and with its elements of similarities, differences, cooperation,
interdependence, social relationship, organization, etc.
Culture is everything made, learnt, or shared by the members of a society, including values, beliefs,
behaviours, and material objects.Culture is learnt, and it varies tremendously from society to
society.5“A culture is the totally acquired way of life or life style for a group of people. It consists of
the patterned, repetitive ways of thinking, feeling and acting that are characteristics of members of
a particular society or segment of a society”.6
Weather and climatic condition of an area exerts impact on available natural resources and these
natural resources provides opportunities and hurdles for human beins for designing their livelihood
practices leading to formation of social groups and sub-groups and their cultural practices.
Issues to understand?
The interface of weather and climate with human life is not so simple, rather it is a complex
interaction linking many aspects of physical and social environment through evolution of cultural
landscape on a natural landscape ( as in model-I)7.
This relationship of nature and culture in the context of influence of weather and climate on human
society and culture streamline through human life style, evolved around their occupation, food
system, housing or shelter, technology and material uses etc ( as in fig.1). Here, when the life style
becomes less material and energy dependent it may have less impact on weather and climatic
factors on the other hand when it is more material and energy intensive its impact on weather and
climate will be more. Such interrelationship varies with human knowledge and information, and
more specifically with uses of technology. “Technological inventions or use of technology alter the
means of subsistence and influence the structure and ideological sectors of culture”.8 So, cultural
value changes have relationship with life style changes which has distinct impact on weather and
climatic association. In today’s world, increase of human population and proliferation of material
intensive socio-cultural practices lead to problems like climate change.Therefore, IPCC’s analysis
explains that “global Green House Gases (GHG) emission grew up due to human activities since pre-
industrial times, it has seen an increase of 70% between 1970 and 2004. Atmospheric concentrations
of CO2, methane (CH4) and nitrous oxide (N2O) have increased markedly as a result of human
activities since 1750 and now far exceed pre-industrial values determined from ice cores spanning
many thousands of years. Human influences are there with increase of temperature, changes in
wind patterns, hot night, cold day, heat wave, draught, sea level rises ”.9

Activity Guidebook for NCSC 2014 & 2015: Version 2.0
85
These are the overt situations of Climate Change (CC). This trend of CC has negative impact on
human way of life by destabilizing practices related with food production, natural resource base like
water, land and soil, biodiversity etc. These may link to further destabilization of society through
climate induced migration, food crisis, disaster etc. IPCC also observed that discrimination in society
may worsen the situation (box-1). However, there is also some hope. There are many practices
among indigenous groups and their social system which may provide some ways for resilience and
adaptation through their traditional ecological and technological knowledge (Box-2). So, UNFCCC
stated that” “Indigenous, local, and traditional knowledge systems and practices, including
indigenous peoples’ holistic view of community and environment, are a major resource for adapting
to climate change; but these have not been used consistently in existing adaptation efforts.
Integrating such forms of knowledge with existing practices increases the effectiveness of
adaptation”.10
Model-I
(Source: Manual no -03, “Weather and Climate” of the Manual in the series “Explore and understand your environment, people and their practices”
developed for VIPNET Club of Vigyan Prasar , Edited by J.K. Sarma, B.K. Tyagi, SSEAEP, 2014,p. 10. )
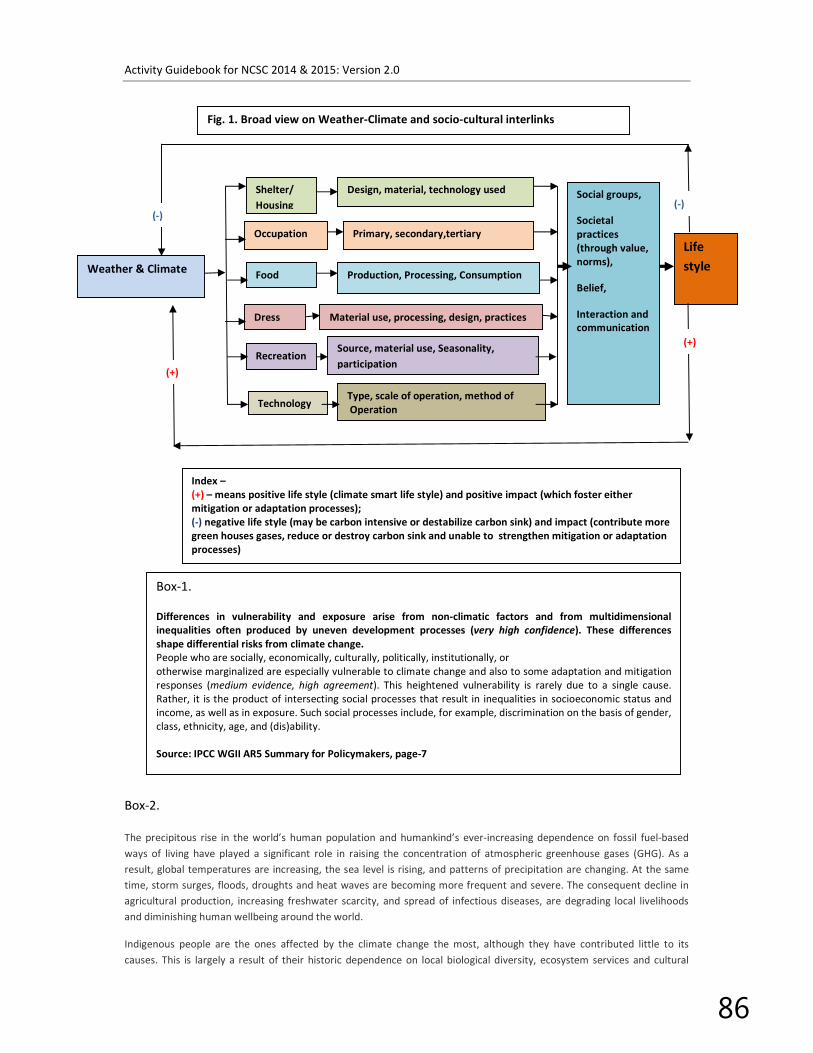
Activity Guidebook for NCSC 2014 & 2015: Version 2.0
86
Box-2.
The precipitous rise in the world’s human population and humankind’s ever-increasing dependence on fossil fuel-based
ways of living have played a significant role in raising the concentration of atmospheric greenhouse gases (GHG). As a
result, global temperatures are increasing, the sea level is rising, and patterns of precipitation are changing. At the same
time, storm surges, floods, droughts and heat waves are becoming more frequent and severe. The consequent decline in
agricultural production, increasing freshwater scarcity, and spread of infectious diseases, are degrading local livelihoods
and diminishing human wellbeing around the world.
Indigenous people are the ones affected by the climate change the most, although they have contributed little to its
causes. This is largely a result of their historic dependence on local biological diversity, ecosystem services and cultural
Weather & Climate
Shelter/
Housing
Occupation
Food
Dress
Technology
Design, material, technology used
Primary, secondary,tertiary
Production, Processing, Consumption
Material use, processing, design, practices
Type, scale of operation, method of
Operation
Social groups,
Societal
practices
(through value,
norms),
Belief,
Interaction and
communication
Life
style
Recreation Source, material use, Seasonality,
participation
(-) (-)
(+)
(+)
Index –
(+) – means positive life style (climate smart life style) and positive impact (which foster either
mitigation or adaptation processes);
(-) negative life style (may be carbon intensive or destabilize carbon sink) and impact (contribute more
green houses gases, reduce or destroy carbon sink and unable to strengthen mitigation or adaptation
processes)
Fig. 1. Broad view on Weather-Climate and socio-cultural interlinks
Box-1.
Differences in vulnerability and exposure arise from non-climatic factors and from multidimensional
inequalities often produced by uneven development processes (very high confidence). These differences
shape differential risks from climate change.
People who are socially, economically, culturally, politically, institutionally, or
otherwise marginalized are especially vulnerable to climate change and also to some adaptation and mitigation
responses (medium evidence, high agreement). This heightened vulnerability is rarely due to a single cause.
Rather, it is the product of intersecting social processes that result in inequalities in socioeconomic status and
income, as well as in exposure. Such social processes include, for example, discrimination on the basis of gender,
class, ethnicity, age, and (dis)ability.
Source: IPCC WGII AR5 Summary for Policymakers, page-7
Activity Guidebook for NCSC 2014 & 2015: Version 2.0
87
landscapes as a source of their sustenance, wellbeing, and resilience.
Indigenous peoples, however, are not mere victims of climate change. Comprising only four per cent of the world’s
population (between 250 to 300 million people), they utilize 22 per cent of the world’s land surface. In doing so, they
maintain 80% of the planet’s biodiversity in, or adjacent to,85% of the world’s protected areas. Indigenous lands also hold
hundreds of gigatons of carbon — a recognition that is gradually dawning on industrialized countries that seek to secure
significant carbon stocks in an effort to mitigate climate change.
Indigenous peoples are excellent observers and interpreters of change on the land, sea, and sky. Their community-based
and collectively held traditional knowledge accumulated and maintained through practice over countless generations,
offers valuable insights into the state of the environment. Indigenous knowledge possesses chronological and landscape-
specific precision and detail that is often lacking from scientific models developed by scientists at much broader spatial
and temporal scale, including those used to understand the magnitude of climate change consequences. Moreover,
indigenous knowledge provides a crucial foundation for community-based adaptation and mitigation actions that can
sustain resilience of social-ecological systems at the interdependent local, regional, and global scales.
Source:http://newswatch.nationalgeographic.com/2012/02/06/thclimate-change-indigenous-knowledge/( retrieved on
June 25,2014)
India’s weather and climate are mainly governed by her geographical location, surrounding
boundary conditions (the Himalayas, the Indian Ocean, Arabian Sea and Bay of Bengal). Further, the
variations in land and water distribution within the country, altitudinal differences, vegetation type
and cover along with the variations of sunshine hours within the country due to its latitudinal and
longitudinal extension formed different climatic and agro-climatic zones.There are six climatic zones
derived recently based on 0.5◦ X 0.5◦ grid level rainfall data and average potential evapo-
transpiration for 144 stations located across India to compute moisture index needed for delineation
of different climatic zones based on datasets refer to the period 1971–2005.These areas are –arid,
semi-arid, dry sub-humid, moist sub-humid, humid, per humid (as in map1)11
. Similarly A total of
127 agro-climatic zones (table-1) have been identified in India under National Agricultural Research
Project (NARP) based on a comprehensive research review of each state. While delineating zonal
boundaries the physiographic divisions of each of the state, its rainfall pattern, soil type, availability
of irrigation water, existing cropping pattern and administrative units have been considered in such
a manner that there are fewer variations on the parameters within a zone. Now in this context if we
look into people, their livelihood practices, socio-cultural practices in relation to food, shelter,
clothing; uses of water, energy and technology, we may able to identify wide variation. In each
climatic and agro-climatic zone, its practices are influenced by respective weather and climatic
attributes along with condition of topography, land, water, soil and biodiversity. There are many to
encouraging practices related to natural resource management and biodiversity conservation based
on traditional knowledge systems12
, like water harvesting13
,14
, land use management15
, conservation
practices16,17,18
, settlement and housing practices19
,20
etc having different components that can
strengthen climate change resilience and adaptation system. However, there are some practices
which have negative impact on natural assets in general and weather influencing factors in
particular21, 22, and 23
. Relook to in these situations from the perspective of understanding and
following ‘what, where, why and how’ question; these may reveal new know-how, skills and
techniques to face the challenges of climate change. It may also strengthen our capability to develop
a “climate smart” life style.
Focused research question:
• What type of influences exerted by weather and climate related factors impact human
social and cultural practices?
• What are the negative factors of human practices of a particular social and cultural
framework which impinge on weather and climatic condition or its associated factors?
• Where are such influences prominent?
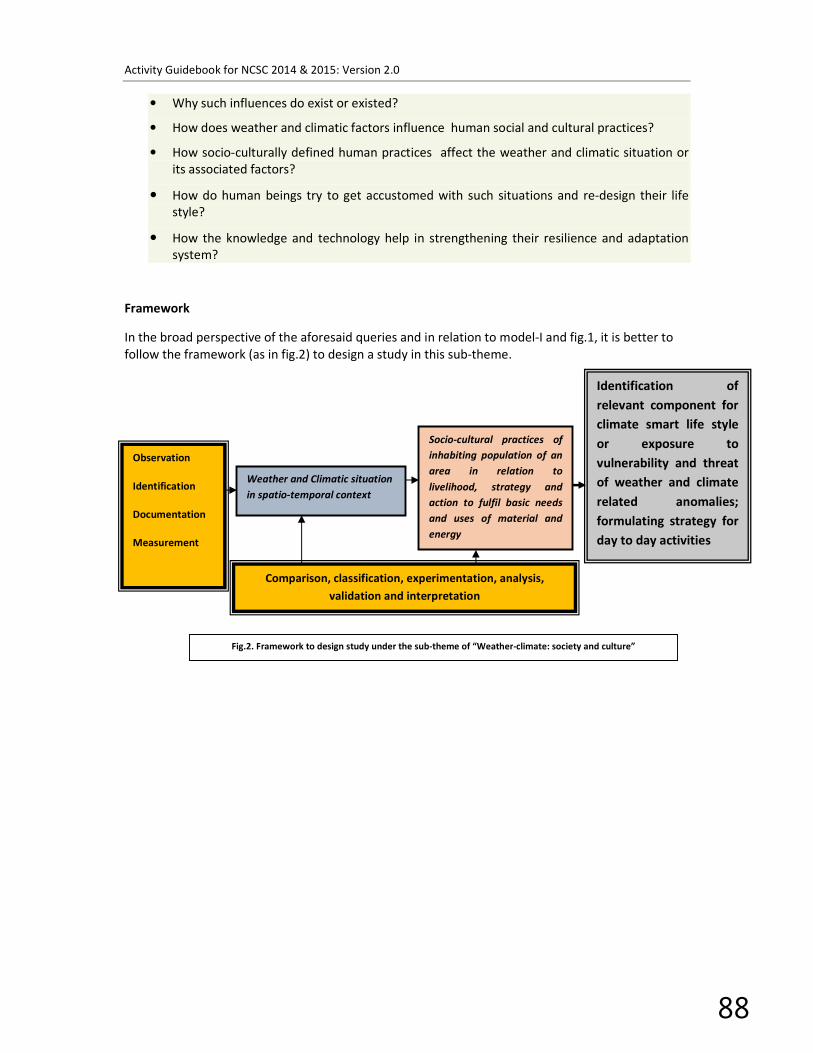
Activity Guidebook for NCSC 2014 & 2015: Version 2.0
88
• Why such influences do exist or existed?
• How does weather and climatic factors influence human social and cultural practices?
• How socio-culturally defined human practices affect the weather and climatic situation or
its associated factors?
• How do human beings try to get accustomed with such situations and re-design their life
style?
• How the knowledge and technology help in strengthening their resilience and adaptation
system?
Framework
In the broad perspective of the aforesaid queries and in relation to model-I and fig.1, it is better to
follow the framework (as in fig.2) to design a study in this sub-theme.
Identification of
relevant component for
climate smart life style
or exposure to
vulnerability and threat
of weather and climate
related anomalies;
formulating strategy for
day to day activities
Observation
Identification
Documentation
Measurement
Weather and Climatic situation
in spatio-temporal context
Socio-cultural practices of
inhabiting population of an
area in relation to
livelihood, strategy and
action to fulfil basic needs
and uses of material and
energy
Comparison, classification, experimentation, analysis,
validation and interpretation
Fig.2. Framework to design study under the sub-theme of “Weather-climate: society and culture”

Activity Guidebook for NCSC 2014 & 2015: Version 2.0
89
Table -1. Agro-climatic zones of India
Region: North India
State : Jammu & Kashmir
Abbrivation Agroclimatic Zone
AZ1 Low Altitude Subtropical
AZ2 Intermediate
AZ3 Valley Temperate
AZ4 Dry Temperate
AZ5 Cold Arid
State : Himachal Pradesh
Map-1. Climatic Zone of India
(Climatic classification at district level (1971–2005).
(Source: CURRENT SCIENCE, VOL. 105, NO. 4, 25 AUGUST 2013, p.495)
Activity Guidebook for NCSC 2014 & 2015: Version 2.0
90
AZ6 High hills Temperate Wet
AZ7 Sub Montaneb and low hills subtropical
AZ8 Mid hills subtropical
AZ9 Sub Montaneb and low hills subtropical
State : Punjab
AZ10 Undulating Plain
AZ11 Central Plain
AZ12 Western Plain
AZ13 Western
AZ14 Sub montane undulating
State : Haryana
AZ15 Eastern
AZ16 Western
State : Rajasthan
AZ17 Arid Western Plain
AZ18 Irrigated North Western Plain
AZ19 Transitional palin zone of Island
Drainage
AZ20 Transitional plain zone of Luni Basin
AZ21 Semiarid eastern plain
AZ22 Flood prone eastern plain
AZ23 Sub humid southern plain and alluvial hill
AZ24 Southern humid plain
AZ25 South eastern humid plain
State : Uttarakhand
AZ26 Hill
AZ27 Bhabar and Tarai
State : Uttar Pradesh
AZ28 Western Plain
AZ29 Mid Western Plain
AZ30 South Western Semi arid
AZ31 Central Plain
AZ32 BundelKhand
AZ33 North Eastern Plain
AZ34 Eastern Plain
AZ35 Vindyan Region : East & North east India
State : West Bengal
AZ36 Hilly
AZ37 Tarai
AZ38 Old Alluvial

Activity Guidebook for NCSC 2014 & 2015: Version 2.0
91
AZ39 New Alluvial
AZ40 Laterite and red soil Zone
AZ41 Coastal Saline
State : Assam
AZ42 Barak valley
AZ43 Upper Brahamaputra
AZ44 Hill
AZ45 Central Brahamaputra valley
AZ46 AZ47
AZ47 Lower Brahamaputra valley
State : Arunachal Pradesh
AZ48 Alpine
AZ49 Temperate Sub Alpine
State : Meghalaya
AZ50 Sub tropical Hill
State : Manipur
AZ51 Sub tropical plain
State : Nagaland
AZ52 Mid Tropical Hill
State : Tripura
AZ53 Mid Tropical Plain
State : Bihar and Jharkhand
AZ54 Northwest Alluvial Plain
AZ55 North east Alluvial plain
AZ56 South Bihar Alluvial Plain
AZ57 Central and northeastern plateau
AZ58 Western Plateau
AZ59 South eastern plateau
State : Odisha
AZ60 North western plateau
AZ61 North Central plateau
AZ62 North eastern Coastal plain
AZ63 East & southeastern coastal plain
AZ64 North eastern ghat
AZ65 Eastern gaht highland
AZ66 Southeastern ghat
AZ67 Western undulating
AZ68 West central table
AZ69 Mid Central table land
Peninsular India
State:Madhya Pradesh and Chattisgarh
AZ 70 Chattigarh plain zone including
Chattisgarh districts
Activity Guidebook for NCSC 2014 & 2015: Version 2.0
92
AZ71 Bastar Plateau
AZ72 North hill zone of Chattisgarh
AZ73 Kymora plateau and Satpara hill
AZ74 Vindya Plateau
AZ75 Central Narmada Valley
AZ76 Gird
AZ77 Bundelkhand
AZ78 Satpura plateau
AZ79 Malwa Plateau
AZ80 Nimar Valley
AZ81 Jhabua hills
State: Gujarat
AZ82 East Gujarat heavy rainfall
AZ83 South Gujarat
AZ84 Middle Gujarat
AZ85 North Gujarat
AZ86 North Western Gujarat
AZ87 South Saurashtra
AZ88 North Saurashtra
AZ89 Ghat and Coastal
State : Maharashtra
AZ90 South Konkan Coastal
AZ91 North Konkan Coastal
AZ92 Western Ghat
AZ93 Submontane
AZ94 Western Maharashtra Plain
AZ95 Scarcity
AZ96 Central Maharashtra plateau
AZ97 Central Vidarbha
AZ98 Eastern Vidarbha
State : Karnataka
AZ99 North East transition
AZ100 North east dry
AZ101 Northern dry
AZ102 Central dry
AZ103 Eastern dry
AZ104 Southern dry
AZ105 Southern transition
AZ106 Western transition
AZ107 Hill
AZ108 Coastal
State : Kerala
AZ109 Northern
AZ110 Southern
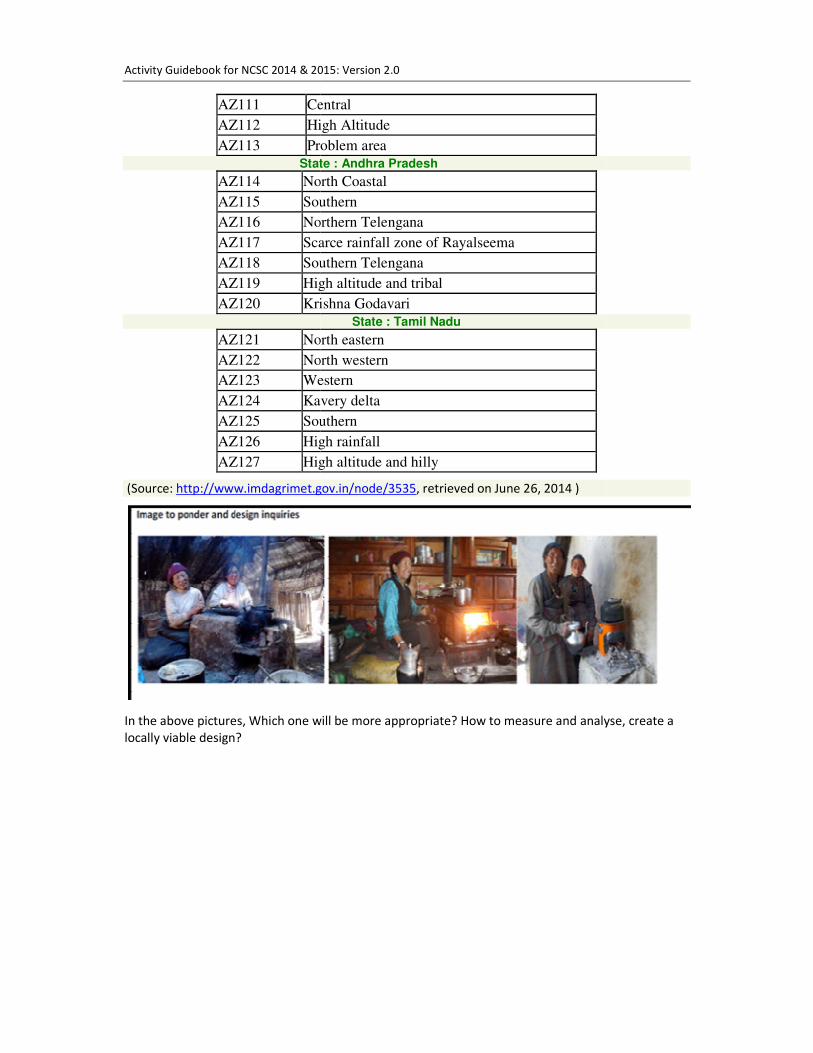
Activity Guidebook for NCSC 2014 & 2015: Ver
AZ111 Central
AZ112 High Altitude
AZ113 Problem area
State : Andhra
AZ114 North Coastal
AZ115 Southern
AZ116 Northern Telengana
AZ117 Scarce rainfall zone of Rayalseema
AZ118 Southern Telengana
AZ119 High altitude and tribal
AZ120 Krishna Godavari
AZ121 North eastern
AZ122 North western
AZ123 Western
AZ124 Kavery delta
AZ125 Southern
AZ126 High rainfall
AZ127 High altitude and hilly
(Source: http://www.imdagrimet.gov.in/node/3535
In the above pictures, Which one will be more appropriate? How to measure and analyse, create a
locally viable design?
Activity Guidebook for NCSC 2014 & 2015: Version 2.0
Central
High Altitude
Problem area
State : Andhra Pradesh
North Coastal
Southern
Northern Telengana
Scarce rainfall zone of Rayalseema
Southern Telengana
High altitude and tribal
Krishna Godavari
State : Tamil Nadu
North eastern
North western
Western
Kavery delta
Southern
High rainfall
High altitude and hilly
http://www.imdagrimet.gov.in/node/3535, retrieved on June 26, 2014 )
Which one will be more appropriate? How to measure and analyse, create a
93
Which one will be more appropriate? How to measure and analyse, create a
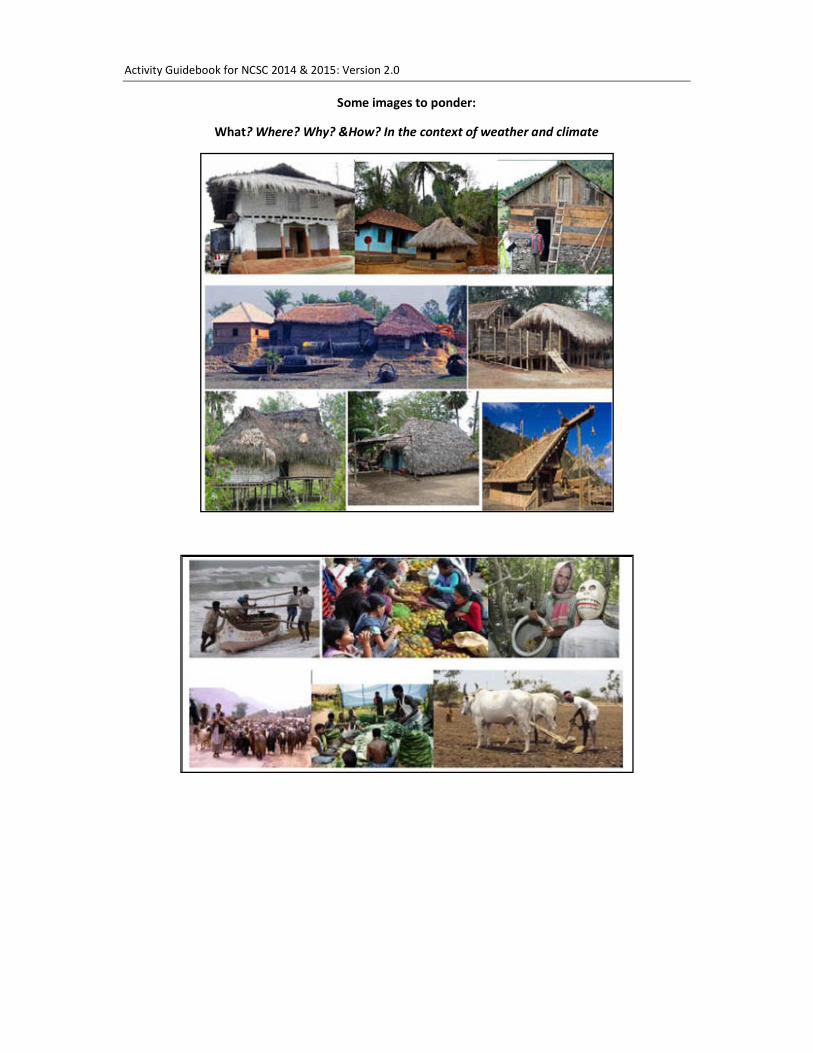
Activity Guidebook for NCSC 2014 & 2015: Version 2.0
94
Some images to ponder:
What? Where? Why? &How? In the context of weather and climate
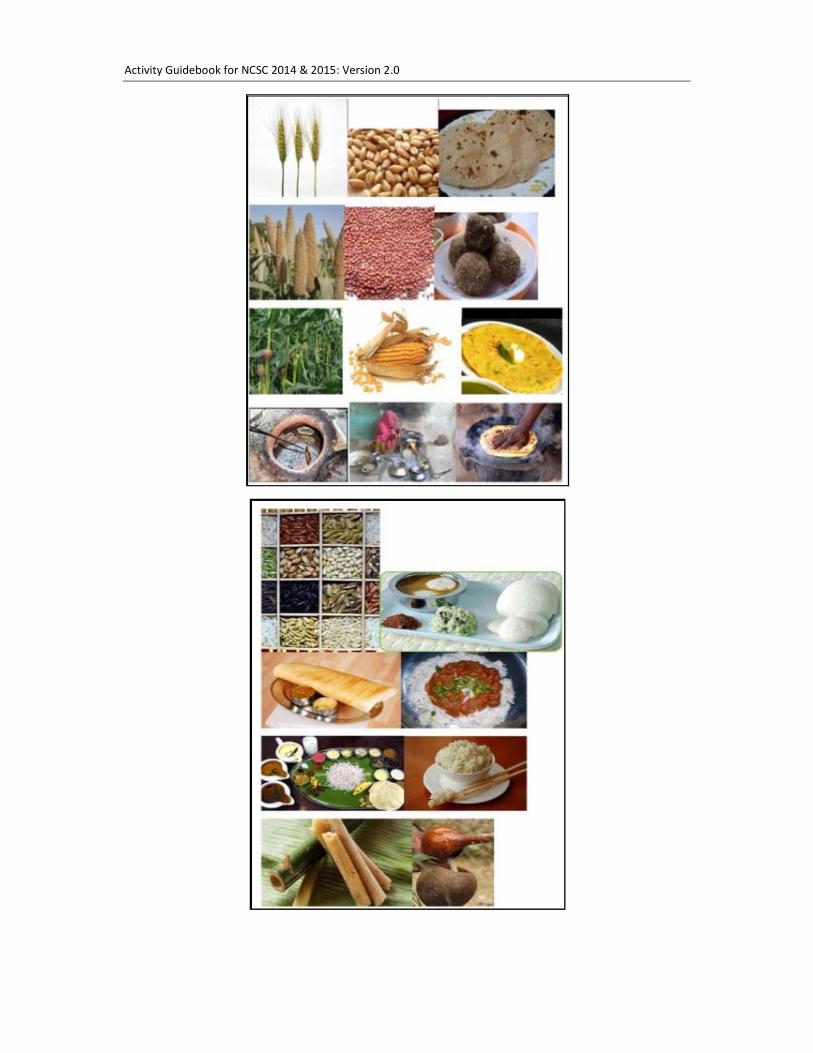
Activity Guidebook for NCSC 2014 & 2015: Version 2.0
95
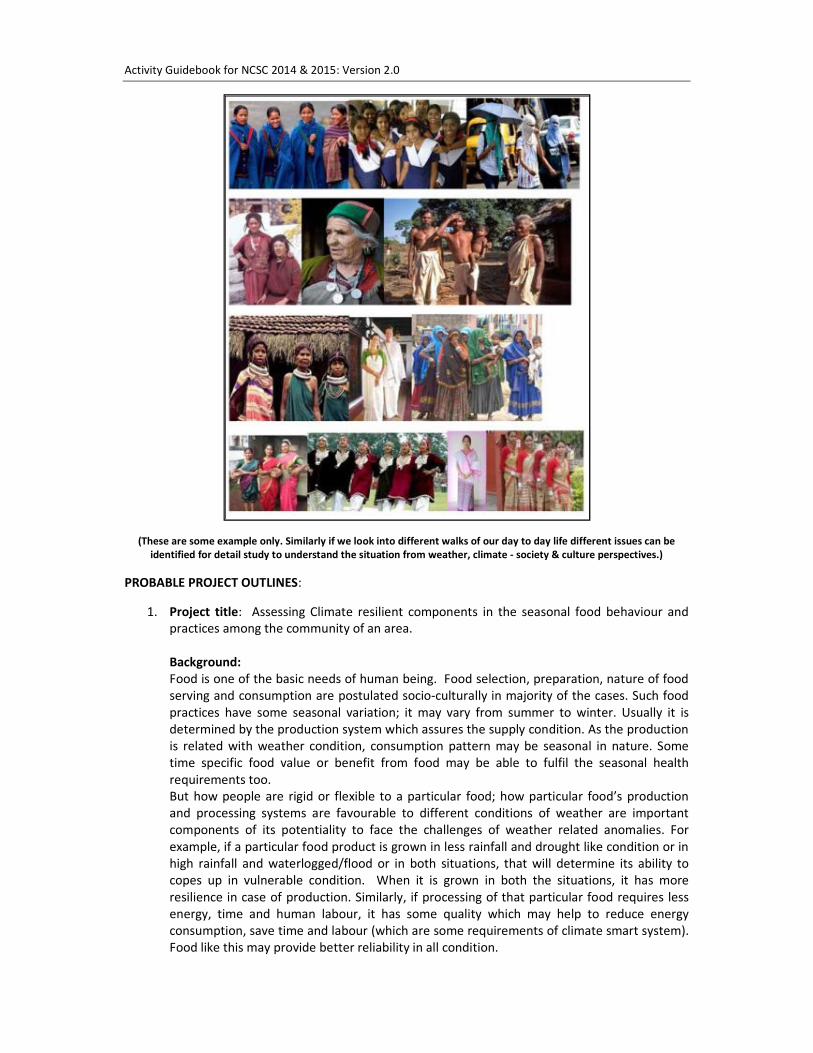
Activity Guidebook for NCSC 2014 & 2015: Version 2.0
96
(These are some example only. Similarly if we look into different walks of our day to day life different issues can be
identified for detail study to understand the situation from weather, climate - society & culture perspectives.)
PROBABLE PROJECT OUTLINES:
1. Project title: Assessing Climate resilient components in the seasonal food behaviour and
practices among the community of an area.
Background:
Food is one of the basic needs of human being. Food selection, preparation, nature of food
serving and consumption are postulated socio-culturally in majority of the cases. Such food
practices have some seasonal variation; it may vary from summer to winter. Usually it is
determined by the production system which assures the supply condition. As the production
is related with weather condition, consumption pattern may be seasonal in nature. Some
time specific food value or benefit from food may be able to fulfil the seasonal health
requirements too.
But how people are rigid or flexible to a particular food; how particular food’s production
and processing systems are favourable to different conditions of weather are important
components of its potentiality to face the challenges of weather related anomalies. For
example, if a particular food product is grown in less rainfall and drought like condition or in
high rainfall and waterlogged/flood or in both situations, that will determine its ability to
copes up in vulnerable condition. When it is grown in both the situations, it has more
resilience in case of production. Similarly, if processing of that particular food requires less
energy, time and human labour, it has some quality which may help to reduce energy
consumption, save time and labour (which are some requirements of climate smart system).
Food like this may provide better reliability in all condition.

Activity Guidebook for NCSC 2014 & 2015: Version 2.0
97
So, analysis of such aspects through a systematic study can help us develop an inventory of
local food to develop a climate smart food system.
Objectives:
• To know about seasonal variation of food practices among the community residing
in an area.
• To identify potentiality of this food in production, processing and consummation in
relation to weather condition and weather related anomalies.
• To identify potential food items ideal to different seasons and resistant to seasonal
weather related anomalies.
Methodology:
• Select a particular human settlement/residential area and identify the
communities/cultural groups living in the area;
• Conduct a survey taking household as the basic unit of observation and collect
information on their food practices in different seasons ( in this case following
information are very much essential)
� Type of food use against season;
� Source of production,growing season, essential condition or requirement
for production ( if such information are unable to provide by the specific
household, collect it from local farmers or agricultural experts);
� Involved system of processing ( like debarking, grinding, etc) and energy
and material uses for the purpose along with amount of requirement;
� System of cooking ( boiling, steaming, frying, etc) and requirement of
energy, additional material, labour and time;
� Reasons of taking a particular food in certain season;
• Set up some experiments to validates the collected information related to
production, processing and cooking, through comparing data of experiments with
the data collected from the households;
• Compiles the collected and experimental data, compare, analyses, classify the
same to identify suitable food item, processing and cooking system which can
help in developing a climate smart life style.
2. Project title: Study on prediction of weather through phenology of tree or insect behaviour
Background: There are many weather prediction practices among the indigenous people
based on their traditional knowledge system. Traditional weather forecaster relies on
observation of phenology of certain plants and behaviour of certain animals as indicator of
wet or dry years or onset of rainy season or dry years or adverse weather condition.24
For
example, many tribal people predict rainfall variation based on the flowering phenology of
night flowering Jasmine ( Nyctanthesarbortristis L.; verbenaceae).25
Similarly in the arid zone
of Rajasthan and Gujarat people consider phenology of ‘Kair’ ( Caparisdeciduas) as an
indicator of drought or normal monsoon. “Kair will be fully laden with flowers and fruits if
there are drought and high temperature, where as in case of good monsoon, it bears only
average flowers and fruits”. 26
In Mizoram Hmar people consider insect like Cricket and
Termite as indicators of weather. According to them “if a Cricket (Gryluapensylvanicus)
brings new soil particles out of its hole during the dry season, rain will be coming. When
winged Termite (Phingpuihup) come out of the soil in a group after a rainfall, rain will not
come again for some time”.27
So, there may be similar practices in other places, among other
communities too. Identification, documentation and validation of such information can
provide us new set of indicators for weather prediction.
Activity Guidebook for NCSC 2014 & 2015: Version 2.0
98
Objectives:
• To Observe, identify and document the indigenous weather forecasting practices
based on phenology of plant or behaviour of animal.
• To validate the collected information of the practices in view of scientific principles.
• Developing some sets of bio-indicators for weather forecasting.
Methodology:
• Select an area for the study;
• Interact with local people and conduct survey to know about people’s beliefs and
practices on weather forecasting;
• Identify actual practitioner, collect information from them through face to face
interview. Collect information about bio-indicator used by the particular person,
documentation of information of last two/ three forecasting with month and year (
if possible date also);
• Collect the information about particular species used for weather prediction, habitat
detail, weather and climatic requirement, phenology ( in case of flora), food and
reproduction behaviour ( in case of fauna);
• Collect weather related information of those days, months of the year for which
gave the practitioner given his/her observation information from a weather station
nearby;
• Compare the information given by the practitioner with the collected information
of weather station; assess the variation and consistency of observational facts’
• Repeat the observation through self initiation, verify again with station data;
• Through comparative analysis identify the consistency and find out appropriate
prediction practices.
3. Project Title: Study on thermal comfort of traditional housing assessing indoor temperature.
Background: Traditional housing designs have evolved through time as an adjustment
process to local weather and climatic condition of the area to enhance the level of safety
and security and assure the level of comfort. In the process focus on utilization of locally
available building materials which are specific to that area also get highlighted. Usually uses
of building materials for floor, wall, roof, etc are selected on the basis of their specific
requirements. The orientation and ventilation of houses are also determined by the local
condition of weather and climate, particularly temperature, wind, precipitation, sun shine
hours, humidity etc. Therefore, there is significant variation of traditional housing design
from high Himalayas to plains, desert and coastal region. There are significant observations
in certain research; a study in Jharkhand on mud houses indicates that “mudhouse provides
an insight for designing an energy efficient rural house that provides thermally comfortable
conditions, as well as leaving behind a very low environmental footprint.The various
parameters which were considered in the study of the existing mud house are – orientation, plan-
form, building exposure to sun, surface-volume ratio, openings, shading, building envelope
material, roofing materials and ventilation. The study observed insulating property of
thatches is more than mud tiles in case of roof materials. So, thatch roofing houses are
cooler than the mud tile roofing houses”.28
Similarly one can carry out some studies to
identify ideal thermally comfortable houses among the traditional houses, where available
energy is utilized efficiently for heating, cooling, lighting etc.
Objectives:
• To study the thermal comfort of traditional housing in relation to indoor
temperature;

Activity Guidebook for NCSC 2014 & 2015: Version 2.0
99
• To assess how it is linked with energy consumption for cooling, heating and
lighting;
• To identify ideal housing design for the locality.
Methodology:
• Identify a locality where traditional houses are there;
• Observe and identify different traditional houses in terms of design and material used;
• At the same time identify some modern houses with different designs and materials
used;
• Observe, identify and assess the building materials used in the building, its facing and
ventilation, etc for both categories of houses;
• Measures the room temperature using suitable thermometer, at different period of
time both in day and night. For this purpose fixed two or three room (if available) in
each of the houses considered for observation. These measurement need to be taken
both in traditional and modern houses. Keep the records separately for each of the
houses of observation.
• Assess the humidity level in each of the houses (in each room of observation
separately). For this purpose use wet bulb thermometer or design/adopt a separate
way of alternative measurement.
• Now, compare the temperature of traditional houses with modern ones and find out
the differences and also find out where it is lowest and where it is highest. Try to
correlate humidity level with the temperature.
• Now find out best housing design and material use for thermal comfort in particular
area.
SOME MORE PROJECT IDEAS:
• Study the relationship between traditional/indigenous pest management practices and
weather condition;
• Study the practices of traditional land use and land cover management and impact on
weather and climate;
• Assess the impact of traditional water harvesting and management practices (like Johad,
Vap, Kul, Longsor,Dong, etc) in developing sustainability of water resources in climate stress
period and developing resilience system;
• Study the traditional practices of animal rearing and their health management, their
relationship with weather condition and seasonality; identify components of adaptation and
resilience;
• Study cultural priority on selection of food crop for cultivation in the locality and its
relationship with local weather and climate induced disaster;
• Study on the efficiency of traditional utensil used for cooking and their contribution in
reduction of energy and carbon emission;
• Comparative study of distribution of rainy days against month in traditional calendar system
and English calendar system and find out the reliability aspects for agricultural planning;
• Study on fuel wood based cremation practices, assessment of carbon emission and
developing alternative system for cremation;
• Assessment of energy requirement in traditional cooking and modern way of cooking,
identify carbon emission factors and impact on weather and climate;
• Study on the alternative food sources of different cultural groups in disaster prone situation
(like flood,drought,etc) and assessing its potentiality for building resilience and adaptation
to climate change;

Activity Guidebook for NCSC 2014 & 2015: Version 2.0
100
• Assess the energy consumption and pollution of air, water, noise during festival ( like Diwali,
Pongal, MaghBihu, Durga Puja, etc ) and impact on developing resilience and adaptation to
climate change;
• Study on the traditional food storage practices among the community and its relation to
weather and climate;
• Prepare community based culturally adaptable Disaster Management Plan with proper assessment of
risk and vulnerability for climate induced disaster of your locality. □□□□□□□□
References:
1. Oxford advanced learner’s dictionary, 2010;
2. http://www.thefreedictionary.com/weather, retrieved on June 20,2014
3. http://www.thefreedictionary.com/climate, retrieved on June 20,2014
4. BasuBiman“Earth’s Changing Climate” , Vigyan Prasar, 2012, p.2.
5. http://www.sparknotes.com/sociology/society-and-culture/section5.rhtml, retrieved June 22,2014
6. Harris Marvin (1971) “Culture, people, nature”, Thomas Y Crowell,p.144.
7. Sarma JK and Tyagi B K ( edited ) “Weather and Climate” (Manual no -03) of the series on “Explore and
understand your environment, people and their practices” developed for VIPNET Club of Vigyan Prasar ,
SSEAEP, 2014,p. 10 8. Harris Marvin (1971) “Culture, people, nature”, Thomas Y Crowell,p.229.
9. IPCC “Climate Change 2007: Synthesis Report”
http://www.ipcc.ch/publications_and_data/ar4/syr/en/spms2.html ,retrieved June 24,2014
10. FCCC/SBSTA/2014/INF.11,8 May 2014,( Reissued for technical reasons on 16 May
2014),http://unfccc.int/resource/docs/2014/sbsta/eng/inf11.pdf (retrieved on June 25,2014) also available in
http://ipcc-wg2.gov/AR5/images/uploads/ IPCC_WG2AR5_SPM_Approved.pdf>. as mentioned in the previous
cited document
11. Raju B.M.K. et al (2013), “Revisiting climatic classification in India: a district-level analysis”, CURRENT SCIENCE,
VOL. 105, NO. 4, p. 492-495
12. Agarwal Anil and NarainSunita “Fourth Citizens' Report [SOE-4]: Dying Wisdom “Centre for Science and
Environment(CSE),New Delhi-110003
13. Sarma J.K. and Tyagi B.K. (edited) “Traditional Knowledge System” (Manual no -07) of the series on “Explore
and understand your environment, people and their practices” developed for VIPNET Club of Vigyan Prasar ,
SSEAEP, 2014
14. Sarma J.K. and Tyagi B.K. (edited) “Water Resources” (Manual no -02) of the series on “Explore and
understand your environment, people and their practices” developed for VIPNET Club of Vigyan Prasar ,
SSEAEP, 2014 15. Sarma J.K., Saikia R. (2013) “ IEKS and sustainable land resource management- a surveillance on the practices
among the Tangsa Naga and Tangkhul Naga of North East India” Indian Journal of Traditional Knowledge,Vol,
12(2),pp 252-258
16. Kothari A. And Pathak N. “Protected areas, community based conservation and decentralisation: lesson from
India” a report under EPP,IUCN,
(http://www.kalpavriksh.org/images/CCA/Consultation/Report_CCAsEcosystemsProtectedAreasPeopleProject
%20(EPP)IUCNWorldCommission_April2006.pdf) retrieved on June 20,2014
17. Chatterji S, Ghosh S , Sarma JK , et al (2011) “ Community conserved area in North East India: some
observation in Assam, Meghalaya and Arunachal Pradesh” in The Indian Forester, Vol.137,Issue.8a,
18. Sarma J.K. and Tyagi B.K. (edited) “Biodiversity” (Manual no -04) of the series on “Explore and understand
your environment, people and their practices” developed for VIPNET Club of Vigyan Prasar , SSEAEP, 2014 19. BEST PRACTICES IN RURAL HOUSING
http://rural.nic.in/sites/downloads/our-schemes-glance/BestPractices.pdf , retrieved on April 20,2014
20. Sarma J.K. and Tyagi B.K. (edited) “Our Settlement” (Manual no -05) of the series on “Explore and understand
your environment, people and their practices” developed for VIPNET Club of Vigyan Prasar , SSEAEP, 2014
21. Khongsa C. “ Jhum Cultivation and its impact on ecology, need for viable alternatives” http://e-
pao.net/epSubPageExtractor.asp?src=education.Science_and_Technology.Jhum_Cultivation_and_its_impact_
on_Ecology, retrived on 18 June,2014
22. Mandal P , et al ( 2012) “Impact of Diwali celebrations on urban air and noise quality in Delhi City, India”,
Environ Monit Assess. 2012 Jan;184(1):209-15.
23. Singh D.P. et al (2009) “ Study of temporal variation in ambient air quality during Diwali festival in India”
Environ Monit Assess. ,DOI 10.1007 /s10661-009-1145-9
24. Galacgae E S and Balisacan C M “ Traditional weather forecasting for sustainable agroforestrty practices in
Ilocos Norte Province, Philippines” Forest Ecol. Manage. 257 (2009), 2044-2053

Activity Guidebook for NCSC 2014 & 2015: Version 2.0
101
25. Acharya S ( 2011) “ Prediction of rainfall variation through flowering phenology of night –flowering jasmine
(Nyctanthesarbortristis L.; verbenaceae) in Tripura” in Indian Journal of Traditional Knowledge,
Vol.10(1),pp.96-101.
26. Singh D and Singh R K ( 2011) “ Kair (Caparisdeciduas) : a potential ethno-botanical weather predictor and
livelihood security shrub of Arid Zone of Rajasthan and Gujrat” in Indian Journal of Traditional Knowledge,
Vol.10(1),pp. 146-155
27. Chinlampinga M (2011) “ Traditional knowledge, weather prediction and bio-indicators – a case study of
Mizoram, Northeastern India” in Indian Journal of Traditional Knowledge, Vol.10(1),pp 207-211
28. Gupta J “Sustainability of rural mud houses in Jharkhand: analysis related to thermal comfort”
(http://www.academia.edu/3887802/SUSTAINABILITY_OF_RURAL_MUD_HOUSES_IN_JHARKHAND_ANALYSIS
_RELATED_TO_THERMAL_COMFORT, retrieve on June 25,2014) □□
Glossary of some important words mentioned in this document:
Adaptation:Adjustment or preparation of natural or human systems to a new or changing environment which moderates
harm or exploits beneficial opportunities.
Adaptive capacity: The ability of a system to adjust to climate change (including climate variability and extremes) to
moderate potential damages, to take advantage of opportunities, or to cope with the consequences.
Anthropogenic:Made by people or resulting from human activities. Usually used in the context of emissions that are
produced as a result of human activities.
Carbon Footprint:The total amount of greenhouse gases that are emitted into the atmosphere each year by a person,
family, building, organization, or company. A persons carbon footprint includes greenhouse gas emissions from fuel that an
individual burns directly, such as by heating a home or riding in a car. It also includes greenhouse gases that come from
producing the goods or services that the individual uses, including emissions from power plants that make electricity,
factories that make products, and landfills where trash gets dumped.
Climate:Climate in a narrow sense is usually defined as the "average weather," or more rigorously, as the statistical
description in terms of the mean and variability of relevant quantities over a period of time ranging from months to
thousands of years. The classical period is 3 decades, as defined by the World Meteorological Organization (WMO). These
quantities are most often surface variables such as temperature, precipitation, and wind. Climate in a wider sense is the
state, including a statistical description, of the climate system.
Climate change: Climate change refers to any significant change in the measures of climate lasting for an extended period
of time. In other words, climate change includes major changes in temperature, precipitation, or wind patterns, among
others, that occur over several decades or longer.
Climate Smart: Concept of Climate Smart has evolved with designing and execution of responsible human activities in all
walks of life, which can promote sustainable development, adapting and building resilience to climate change, reducing
and/or removing green house emission. So, efficient uses of material and energy with maximization of benefit from little
input along with responsible choice of material and energy for use are same of the best ways to step forward for such
condition.
Culture: Culture is the totally acquired life way of life or life style for a group of people. It consists of the patterned,
repetitive ways of thinking, feeling and acting that are characteristics of members of a particular society or segment of a
society.
Disaster management plan: It is a planning to manage disaster. Such plans cover aspects of prevention, preparedness,
relief and recovery.Disaster prevention is activities designed to provide permanent protection from disasters.
Disasterpreparednessis activities designed to minimise loss of life and damage – for example by removing people and
property from a threatened location and by facilitating timely and effective rescue, relief and rehabilitation. Preparedness
is the main way of reducing the impact of disasters. Disaster reliefis a coordinated multi-agency response to reduce the
impact of a disaster and its long-term results. Relief activities include rescue, relocation, providing food and water,
preventing disease and disability, repairing vital services such as telecommunications and transport, providing temporary
shelter and emergency health care.Disaster recovery means once emergency needs have been met and the initial crisis is
over, the people affected and the communities that support them are still vulnerable. Recovery activities include rebuilding
infrastructure, health care and rehabilitation.
Emissions: The release of a substance (usually a gas when referring to the subject of climate change) into the atmosphere.

Activity Guidebook for NCSC 2014 & 2015: Version 2.0
102
Mitigation:A human intervention to reduce the human impact on the climate system; it includes strategies to reduce
greenhouse gas sources and emissions and enhancing greenhouse gas sinks.
Phenology : The timing of natural events, such as flower blooms and animal migration, which is influenced by changes in
climate. Phenology is the study of such important seasonal events. Phenological events are influenced by a combination of
climate factors, including light, temperature, rainfall, and humidity.
Resilience :A capability to anticipate, prepare for, respond to, and recover from significant multi-hazard threats with
minimum damage to social well-being, the economy, and the environment.
Risk: It is a situation involving exposure to danger.
Society is a group of people with common territory, interaction, and culture. Society evolved through formation of groups
from family to occupation based to interest based group, etc.
Social control: Refer to social process by which behaviour and act of individuals or groups is regulated.
Social engineering: Planned social change and social development.
Sensitivity: The degree to which a system is affected, either adversely or beneficially, by climate variability or change. The
effect may be direct (e.g., a change in crop yield in response to a change in the mean, range or variability of temperature)
or indirect (e.g., damages caused by an increase in the frequency of coastal flooding due to sea level rise).
Traditional Knowledge System: A cumulative body of knowledge, practices and beliefs evolved by adaptive processes and
handed down through generations by cultural transmission. This knowledge system incorporates a complex combination of
belief, values and norms along with practices.
United Nations Framework Convention on Climate Change (UNFCCC): The Convention on Climate Change sets an overall
framework for intergovernmental efforts to tackle the challenges posed by climate change. It recognizes that the climate
system is a shared resource whose stability can be affected by industrial and other emissions of carbon dioxide and other
greenhouse gases. The Convention enjoys near universal membership, with 189 countries having ratified.
Vulnerability: The degree to which a system is susceptible to, or unable to cope with, adverse effects of climate change,
including climate variability and extremes. Vulnerability is a function of the character, magnitude, and rate of climate
variation to which a system is exposed; its sensitivity; and its adaptive capacity.
Weather: Atmospheric condition at any given time or place. It is measured in terms of such things as wind, temperature,
humidity, atmospheric pressure, cloudiness, and precipitation. In most places, weather can change from hour-to-hour, day-
to-day, and season-to-season. Climate in a narrow sense is usually defined as the "average weather", or more rigorously, as
the statistical description in terms of the mean and variability of relevant quantities over a period of time.
(Special note: The images use in the note can be drawn with the help of illustrator in line drawing or pencil sketch for
mono colour printing. For the map help can be taken from a cartographer to draw a mono colour map for the same
purpose. )

Activity Guidebook for NCSC 2014 & 2015: Version 2.0
103
Sub Theme 5
========================
Weather, Climate& Agriculture.
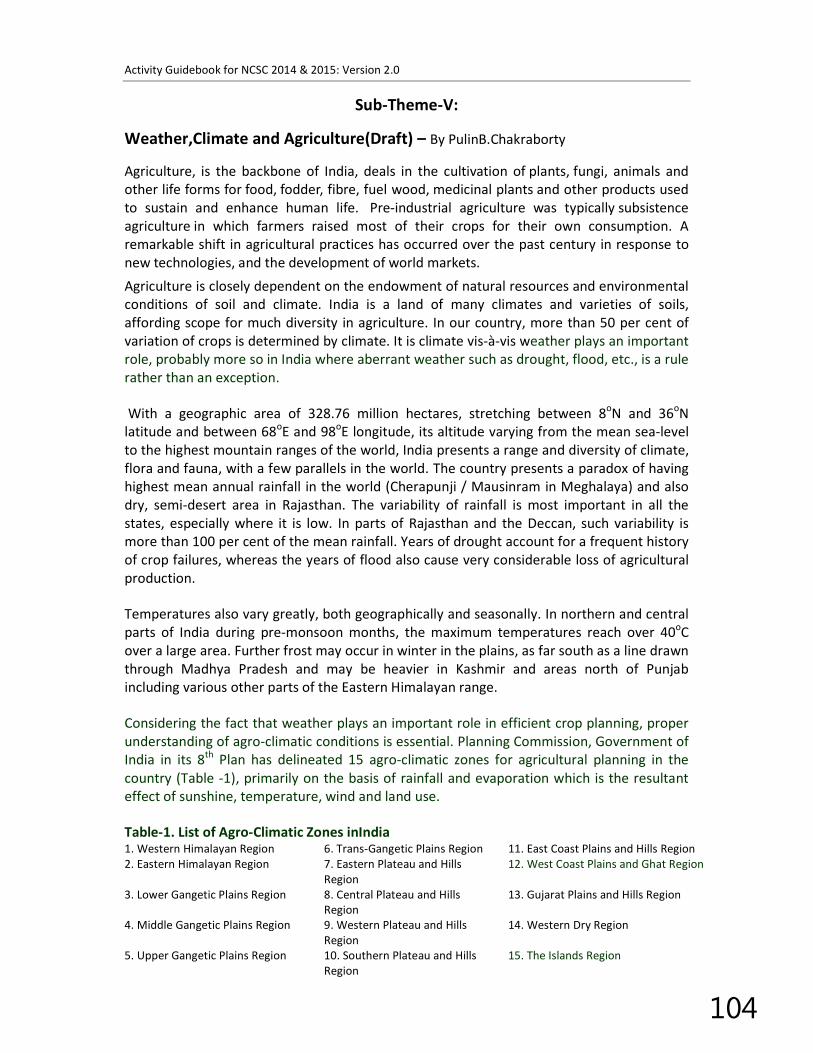
Activity Guidebook for NCSC 2014 & 2015: Version 2.0
104
Sub-Theme-V:
Weather,Climate and Agriculture(Draft) – By PulinB.Chakraborty
Agriculture, is the backbone of India, deals in the cultivation of plants, fungi, animals and
other life forms for food, fodder, fibre, fuel wood, medicinal plants and other products used
to sustain and enhance human life. Pre-industrial agriculture was typically subsistence
agriculture in which farmers raised most of their crops for their own consumption. A
remarkable shift in agricultural practices has occurred over the past century in response to
new technologies, and the development of world markets.
Agriculture is closely dependent on the endowment of natural resources and environmental
conditions of soil and climate. India is a land of many climates and varieties of soils,
affording scope for much diversity in agriculture. In our country, more than 50 per cent of
variation of crops is determined by climate. It is climate vis-à-vis weather plays an important
role, probably more so in India where aberrant weather such as drought, flood, etc., is a rule
rather than an exception.
With a geographic area of 328.76 million hectares, stretching between 8oN and 36
oN
latitude and between 68oE and 98
oE longitude, its altitude varying from the mean sea-level
to the highest mountain ranges of the world, India presents a range and diversity of climate,
flora and fauna, with a few parallels in the world. The country presents a paradox of having
highest mean annual rainfall in the world (Cherapunji / Mausinram in Meghalaya) and also
dry, semi-desert area in Rajasthan. The variability of rainfall is most important in all the
states, especially where it is low. In parts of Rajasthan and the Deccan, such variability is
more than 100 per cent of the mean rainfall. Years of drought account for a frequent history
of crop failures, whereas the years of flood also cause very considerable loss of agricultural
production.
Temperatures also vary greatly, both geographically and seasonally. In northern and central
parts of India during pre-monsoon months, the maximum temperatures reach over 40oC
over a large area. Further frost may occur in winter in the plains, as far south as a line drawn
through Madhya Pradesh and may be heavier in Kashmir and areas north of Punjab
including various other parts of the Eastern Himalayan range.
Considering the fact that weather plays an important role in efficient crop planning, proper
understanding of agro-climatic conditions is essential. Planning Commission, Government of
India in its 8th
Plan has delineated 15 agro-climatic zones for agricultural planning in the
country (Table -1), primarily on the basis of rainfall and evaporation which is the resultant
effect of sunshine, temperature, wind and land use.
Table-1. List of Agro-Climatic Zones inIndia 1. Western Himalayan Region 6. Trans-Gangetic Plains Region 11. East Coast Plains and Hills Region 2. Eastern Himalayan Region 7. Eastern Plateau and Hills
Region 12. West Coast Plains and Ghat Region
3. Lower Gangetic Plains Region 8. Central Plateau and Hills
Region 13. Gujarat Plains and Hills Region
4. Middle Gangetic Plains Region 9. Western Plateau and Hills
Region 14. Western Dry Region
5. Upper Gangetic Plains Region 10. Southern Plateau and Hills
Region 15. The Islands Region

Activity Guidebook for NCSC 2014 & 2015: Ver
SCENARIO OF RAINFED AGRICULTURE
In agriculture, water is an important factor that affects or determines plant growth and
development. Its availability or scarcity determines successful harvest, or diminution in yield,
or even total failure of a crop. Rainfall is the primary
allied agricultural practices. Quantum and nature of distribution of rainfall vary with location
and thereby affecting growth and yield of crops. Most plants are
adapted to conditions with moderate supply of water. But
water-logged habitats, while xerophytes
climatic factors, water too causes detrimental effect on growth and
plants and animals. Excess water in the soil can injure flood prone plants like corn (Maize),
due to lack of oxygen..
(a)
Fig-1. (a) Past, present and predicte
domestic and Industrial sectors(b) Spatial distribution of mean Annual
Rainfall over India
Globally 80 per cent of the agricultural land area is rainfed that depends on rainfall for its
successful crop production. The rainfed agriculture generates 65 to 70 per cent of staple
foods. However, 70 per cent of the population inhabiting in these areas are poor due to
low and variable productivity. India ranks first among the rainfed agricultural countries of
the world in terms of both extent and value of produce. Rainfed agriculture is practiced in
two-thirds of the total cropped area that accounts for162 million hectares (66 per cent)
and supports 40 per cent of the national food basket. Importance of such agricultur
practice is obvious from the fact that 55 per cent of rice, 91per cent coarse grains, 90 per
cent pulses, 85 per cent oilseeds and 65 per cent cotton are grown in rainfed areas. These
areas receive an average annual rainfall between 400 mm and 1000 mm.
the total annual rainfall does not exceed even 500mm. As a result of such low and erratic
monsoon rainfall, significant fall in food production is often noticed. Due to climate change,
the country is also experiencing shift of onset of mo
with erratic distribution and reduction in amount, which largely affected our crop
Activity Guidebook for NCSC 2014 & 2015: Version 2.0
CULTURE
water is an important factor that affects or determines plant growth and
development. Its availability or scarcity determines successful harvest, or diminution in yield,
or even total failure of a crop. Rainfall is the primary source of water for crop cultivation and
allied agricultural practices. Quantum and nature of distribution of rainfall vary with location
and thereby affecting growth and yield of crops. Most plants are mesophytes
adapted to conditions with moderate supply of water. But hydrophytes, require watery or
xerophytes, are more tolerant to dry conditions.
climatic factors, water too causes detrimental effect on growth and development of both
plants and animals. Excess water in the soil can injure flood prone plants like corn (Maize),
(b)
1. (a) Past, present and predicted future consumption of water byAgriculture,
domestic and Industrial sectors(b) Spatial distribution of mean Annual
Rainfall over India
Globally 80 per cent of the agricultural land area is rainfed that depends on rainfall for its
on. The rainfed agriculture generates 65 to 70 per cent of staple
foods. However, 70 per cent of the population inhabiting in these areas are poor due to
low and variable productivity. India ranks first among the rainfed agricultural countries of
d in terms of both extent and value of produce. Rainfed agriculture is practiced in
thirds of the total cropped area that accounts for162 million hectares (66 per cent)
and supports 40 per cent of the national food basket. Importance of such agricultur
practice is obvious from the fact that 55 per cent of rice, 91per cent coarse grains, 90 per
cent pulses, 85 per cent oilseeds and 65 per cent cotton are grown in rainfed areas. These
areas receive an average annual rainfall between 400 mm and 1000 mm. In certain areas,
the total annual rainfall does not exceed even 500mm. As a result of such low and erratic
monsoon rainfall, significant fall in food production is often noticed. Due to climate change,
the country is also experiencing shift of onset of monsoon from its normal date coupled
with erratic distribution and reduction in amount, which largely affected our crop
105
water is an important factor that affects or determines plant growth and
development. Its availability or scarcity determines successful harvest, or diminution in yield,
source of water for crop cultivation and
allied agricultural practices. Quantum and nature of distribution of rainfall vary with location
mesophytes, that are
, require watery or
, are more tolerant to dry conditions. Alike other
development of both
plants and animals. Excess water in the soil can injure flood prone plants like corn (Maize),
d future consumption of water byAgriculture,
domestic and Industrial sectors(b) Spatial distribution of mean Annual
Globally 80 per cent of the agricultural land area is rainfed that depends on rainfall for its
on. The rainfed agriculture generates 65 to 70 per cent of staple
foods. However, 70 per cent of the population inhabiting in these areas are poor due to
low and variable productivity. India ranks first among the rainfed agricultural countries of
d in terms of both extent and value of produce. Rainfed agriculture is practiced in
thirds of the total cropped area that accounts for162 million hectares (66 per cent)
and supports 40 per cent of the national food basket. Importance of such agricultural
practice is obvious from the fact that 55 per cent of rice, 91per cent coarse grains, 90 per
cent pulses, 85 per cent oilseeds and 65 per cent cotton are grown in rainfed areas. These
In certain areas,
the total annual rainfall does not exceed even 500mm. As a result of such low and erratic
monsoon rainfall, significant fall in food production is often noticed. Due to climate change,
nsoon from its normal date coupled
with erratic distribution and reduction in amount, which largely affected our crop

Activity Guidebook for NCSC 2014 & 2015: Version 2.0
106
production system vis-à-vis agriculture as a whole. Rainfed agriculture is highly vulnerable
to climate change including raise in air temperatures and variation in rainfall. In last three
decades India has experienced sharp rise in mean annual temperature, although most of
the rainfed crops can tolerate high temperatures. However, rainfed crops grown during
rabi are vulnerable to changes in minimum temperatures
Erratic rainfall and occurrence of frequent droughts bring tremendous change in both
surface as well as ground water. Many scientists opined that region-specific analysis is
required to evaluate in detail the agronomic and economic impact of weather changes. For
example, in Dharwad District of Karnataka state wherein, 82 per cent of the net sown area
was under rainfed condition during 2009-10, the yield of most of the crops decreased to a
large extent due to drought condition(Table-2).Rainfall anomaly during 2009 –’10 during
the monsoon season over India sis indicated in Figure-2.
Table- 2. Effect of 2009-’10 Drought on the yield(kg/ha) of few Rainfed
CropsinDharwad district, Karnataka
Crop
Per cent loss of normal yield
Sorghum 43.03
Maize 14.09
Tur 28.23
Groundnut 34.09
Wheat 48.68
Onion 29.56
Cotton 59.96
Fig-2. Deviation in Rainfall over India during 2009 –‘10
IMPACT OF CLIMATE CHANGE ON AGRICULTURE
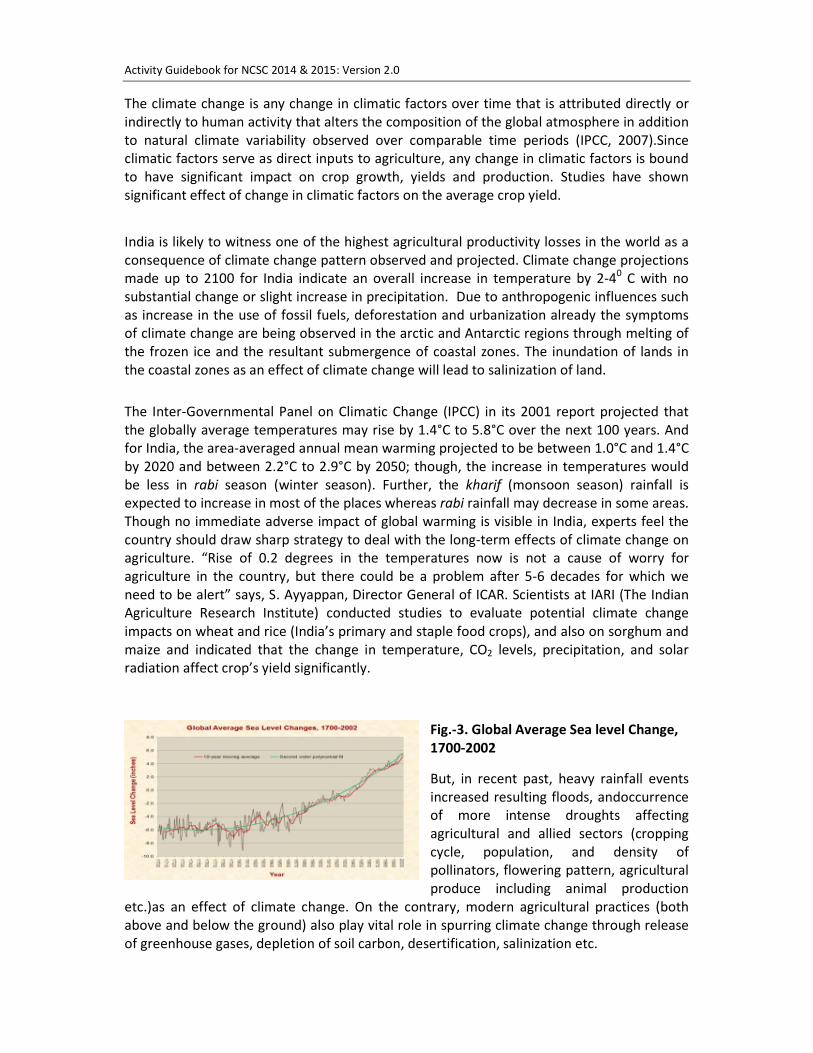
Activity Guidebook for NCSC 2014 & 2015: Version 2.0
107
The climate change is any change in climatic factors over time that is attributed directly or
indirectly to human activity that alters the composition of the global atmosphere in addition
to natural climate variability observed over comparable time periods (IPCC, 2007).Since
climatic factors serve as direct inputs to agriculture, any change in climatic factors is bound
to have significant impact on crop growth, yields and production. Studies have shown
significant effect of change in climatic factors on the average crop yield.
India is likely to witness one of the highest agricultural productivity losses in the world as a
consequence of climate change pattern observed and projected. Climate change projections
made up to 2100 for India indicate an overall increase in temperature by 2-40 C with no
substantial change or slight increase in precipitation. Due to anthropogenic influences such
as increase in the use of fossil fuels, deforestation and urbanization already the symptoms
of climate change are being observed in the arctic and Antarctic regions through melting of
the frozen ice and the resultant submergence of coastal zones. The inundation of lands in
the coastal zones as an effect of climate change will lead to salinization of land.
The Inter-Governmental Panel on Climatic Change (IPCC) in its 2001 report projected that
the globally average temperatures may rise by 1.4°C to 5.8°C over the next 100 years. And
for India, the area-averaged annual mean warming projected to be between 1.0°C and 1.4°C
by 2020 and between 2.2°C to 2.9°C by 2050; though, the increase in temperatures would
be less in rabi season (winter season). Further, the kharif (monsoon season) rainfall is
expected to increase in most of the places whereas rabi rainfall may decrease in some areas.
Though no immediate adverse impact of global warming is visible in India, experts feel the
country should draw sharp strategy to deal with the long-term effects of climate change on
agriculture. “Rise of 0.2 degrees in the temperatures now is not a cause of worry for
agriculture in the country, but there could be a problem after 5-6 decades for which we
need to be alert” says, S. Ayyappan, Director General of ICAR. Scientists at IARI (The Indian
Agriculture Research Institute) conducted studies to evaluate potential climate change
impacts on wheat and rice (India’s primary and staple food crops), and also on sorghum and
maize and indicated that the change in temperature, CO2 levels, precipitation, and solar
radiation affect crop’s yield significantly.
Fig.-3. Global Average Sea level Change,
1700-2002
But, in recent past, heavy rainfall events
increased resulting floods, andoccurrence
of more intense droughts affecting
agricultural and allied sectors (cropping
cycle, population, and density of
pollinators, flowering pattern, agricultural
produce including animal production
etc.)as an effect of climate change. On the contrary, modern agricultural practices (both
above and below the ground) also play vital role in spurring climate change through release
of greenhouse gases, depletion of soil carbon, desertification, salinization etc.
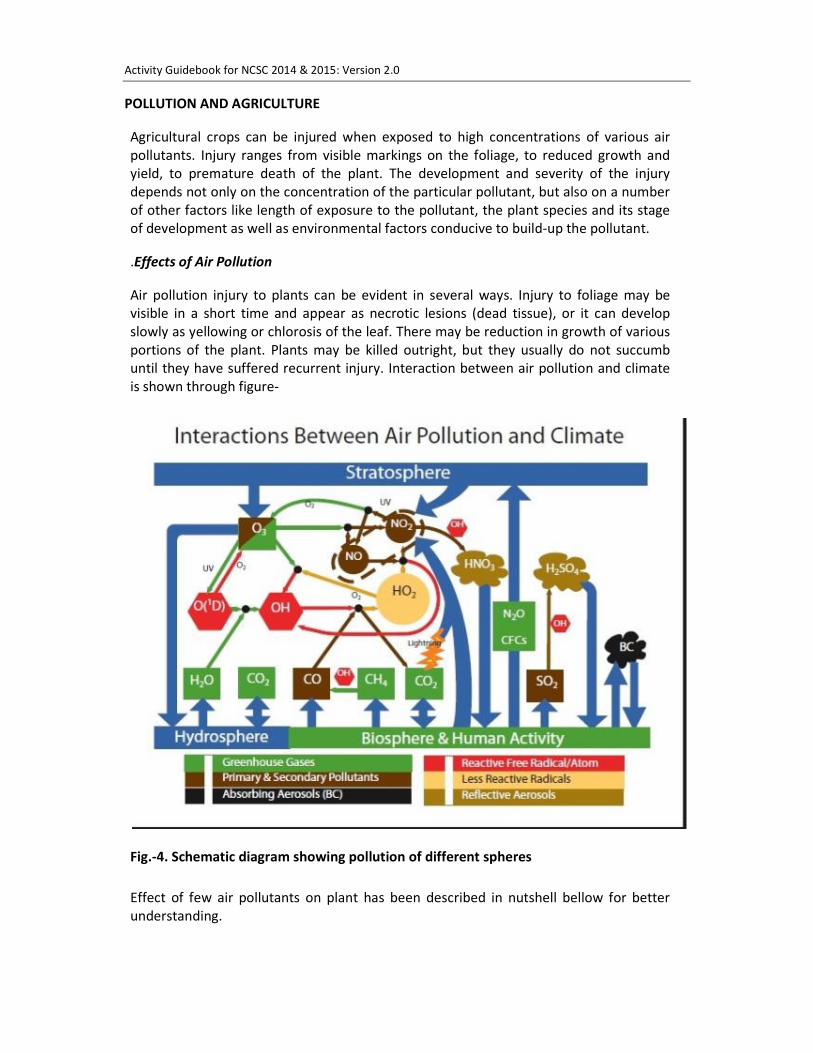
Activity Guidebook for NCSC 2014 & 2015: Version 2.0
108
POLLUTION AND AGRICULTURE
Agricultural crops can be injured when exposed to high concentrations of various air
pollutants. Injury ranges from visible markings on the foliage, to reduced growth and
yield, to premature death of the plant. The development and severity of the injury
depends not only on the concentration of the particular pollutant, but also on a number
of other factors like length of exposure to the pollutant, the plant species and its stage
of development as well as environmental factors conducive to build-up the pollutant.
.Effects of Air Pollution
Air pollution injury to plants can be evident in several ways. Injury to foliage may be
visible in a short time and appear as necrotic lesions (dead tissue), or it can develop
slowly as yellowing or chlorosis of the leaf. There may be reduction in growth of various
portions of the plant. Plants may be killed outright, but they usually do not succumb
until they have suffered recurrent injury. Interaction between air pollution and climate
is shown through figure-
Fig.-4. Schematic diagram showing pollution of different spheres
Effect of few air pollutants on plant has been described in nutshell bellow for better
understanding.

Activity Guidebook for NCSC 2014 & 2015: Version 2.0
109
Oxidants: Ozone is the main pollutant in the oxidant smog complex. Its effect on plants
was first observed in Los Angeles area in 1944. Ozone symptoms characteristically occur
on the upper surface of affected leaves and appear as a flecking, bronzing or bleaching
of the leaf tissues. Although yield reductions are usually with visible foliar injury, crop
loss can also occur without any sign of pollutant stress. Conversely, some crops can
sustain visible foliar injury without any adverse effect on yield. High relative humidity,
optimum soil-nitrogen levels and water availability increase susceptibility. Sensitive
species include cucumber, grape, green bean, lettuce, onion, potato, radish, spinach,
sweet corn, tobacco and tomato. Resistant species include pear and apricot.
Sulfur Dioxide:Sulfur dioxide enters the leaves mainly through the stomata (microscopic
openings) and the resultant injury is classified as either acute or chronic. Acute injury is
caused by absorption of high concentrations of sulfur dioxide in a relatively short time.
The symptoms appear as 2-sided (bifacial) lesions that usually occur between the veins
and occasionally along the margins of the leaves. The colour of the necrotic area can vary
from a light tan or near white to an orange-red or brown depending on the time of year,
the plant species affected and weather conditions. Recently expanded leaves usually are
the most sensitive to acute sulfur dioxide injury, the very youngest and oldest being
somewhat more resistant. However, different plant species vary considerably in their
sensitivity to sulfur dioxide. These variations occur because of the differences in
geographical location, climate, stage of growth and maturation. The crops those are
generally susceptible to sulfur dioxide are alfalfa, barley, oats, pumpkin, radish, spinach,
squash, and tobacco. Resistant crop plants include asparagus, cabbage, celery, corn,
onion and potato.
Fluoride: Fluorides are discharged into the atmosphere from the combustion of coal;
the production of brick, tile, enamel frit, ceramics, and glass; the manufacture of
aluminum and steel; and the production of hydrofluoric acid, phosphate chemicals and
fertilizers. The fluoride enters the leaf through the stomata and is moved to the margins
where it accumulates and causes tissue injury. The injury starts as a gray or light-green
water-soaked lesion, which turns tan to reddish-brown. With continued exposure the
necrotic areas increase in size, spreading inward to the midrib on broad leaves and
downward on monocotyledonous leaves. The characteristic dark band separating the
healthy (green) and injured (brown) tissues of affected leaves is the usual symptom of
fluoride pollution. Studies indicate that apricot, barley (young), peach (fruit), gladiolus,
grape, plum, sweet corn and tulip are most sensitive; whereas, alfalfa, asparagus, bean
(snap), cabbage, carrot, cauliflower, celery, cucumber, eggplant, pea, pear, pepper,
potato, squash, tobacco and wheat are resistant.

Activity Guidebook for NCSC 2014 & 2015: Version 2.0
110
Ammonia:Ammonia injury to vegetation usually occurs due to release of large quantities
of ammonia into the atmosphere for brief periods of time and cause severe injury to
vegetation in the immediate vicinity. Complete system expression on affected vegetation
usually takes several days to develop, and appears as irregular, bleached, bifacial,
necrotic lesions. Grasses often show reddish, interveinal necrotic streaking or dark upper
surface discolouration. Flowers, fruit and woody tissues usually are not affected, and in
the case of severe injury to fruit trees, recovery through the production of new leaves
can occur. Sensitive species include apple, barley, beans, radish and soybean. Resistant
species include alfalfa, beet, carrot, corn, cucumber, eggplant, onion, peach, and tomato.
Particulate Matter:Particulate matter such as cement dust, magnesium-lime dust and
carbon soot deposited on vegetation can inhibit the normal respiration and
photosynthesis mechanisms within the leaf. Cement dust may cause chlorosis and death
of leaf tissue by the combination of a thick crust and alkaline toxicity produced in wet
weather. Accumulation of alkaline dusts in the soil can increase soil pH to levels adverse
to crop growth.
Methane: Methane or natural gas is a greenhouse gas. It is 20 times more potent than
carbon dioxide (CO2) over a century, and researchers have repeatedly examined the
contribution of natural gas emitted by ruminant cattle to global warming. The Scientists
observed that any further rises in temperature are likely to accelerate the release of
methane from rivers, lakes, deltas, bogs, swamps, marshlands and rice paddy fields. Most of
the methane in freshwater systems is produced by an important microbes
called Archaea, that live in waterlogged, oxygen-free sediments.
Microbes, algae, freshwater plants and animals are all part of an active ecosystem and take
their nourishment from and return waste to the atmosphere. Healthy plants take CO2 from
the atmosphere with photosynthesis. Plant uptake of CO2 is affected by temperature, and so
is microbial methane production. Scientists are in view that the ratio of methane to CO2 also
goes up with temperature, which is the same whether it is for the microbes or for the whole
ecosystem. Methane fluxes are much more responsive to temperature than the processes
that produce and consume carbon dioxide highlights another mechanism by which the
global carbon cycle may serve to accelerate rather than mitigate future climate change.
Effect of Water and Land Pollution
Water Pollution is the contamination of streams, lakes, underground water, bays, or oceans
by substances harmful to living things. Water is one of the most essential things that pertain
to life for all living things. Impure water kills plants and animals. It also causes humans to fall
sick and acquire other illnesses like child-birth defects and cancer. Land pollution is similar
to that of water. It is the contamination of land with hazardous waste like garbage and other
waste materials that do not belong to the land. Plants and animals consume these and then
when the next consumer feeds on either the plant or the animal, it plies up and
contaminates the body.
Usually land water bodies get polluted by deposition of pollutant in the air. In addition the
pollutants added in the land and/or soil through fertilizers, pesticides, herbicides, garbage
and oil spills are deposited in the surface water bodies through run off and ground water

Activity Guidebook for NCSC 2014 & 2015: Version 2.0
111
through vertical movement of water inside the land mass, known as percolation. These
pollutants affect soil directly changing its pH, structure, salinity and many more functions.
Most of these are found detrimental to plant and aquatic animals and finally affect us
through food chain.
It is well known that agriculture is the single largest user of freshwater resources, using a
global average of 70% of all surface water supplies. Except for water lost through
evapotranspiration, agricultural water is recycled back to surface water and/or
groundwater. However, agriculture is both cause and victim of water pollution. It is a cause
through its discharge of pollutants and sediment to surface and/or groundwater, through
net loss of soil by poor agricultural practices, and through salinization and water logging of
irrigated land. It is a victim through use of wastewater and polluted surface and
groundwater which contaminate crops and transmit disease to consumers and farm
workers. Agriculture exists within a symbiosis of land and water and, as FAO (1990a) makes
quite clear, "... appropriate steps must be taken to ensure that agricultural activities do not
adversely affect water quality so that subsequent uses of water for different purposes are
not impaired."
SUSTAINABLE AGRICULTURE
As defined by FAO, sustainable development is the management and conservation of the
natural resource base and the orientation of technological and institutional change in such a
manner as to ensure the attainment and continued satisfaction of human needs for the
present and future generations. Such sustainable development (in the agriculture, forestry
and fisheries sectors) conserves land, water, plant and animal genetic resources, is
environmentally non-degrading, technically appropriate, economically viable and socially
acceptable.
THE FRAMEWORK
The charts (Fig.-5a and b) below will help in understanding and conceptualizing the
framework.

Activity Guidebook for NCSC 2014 & 2015: Version 2.0
112
(a)
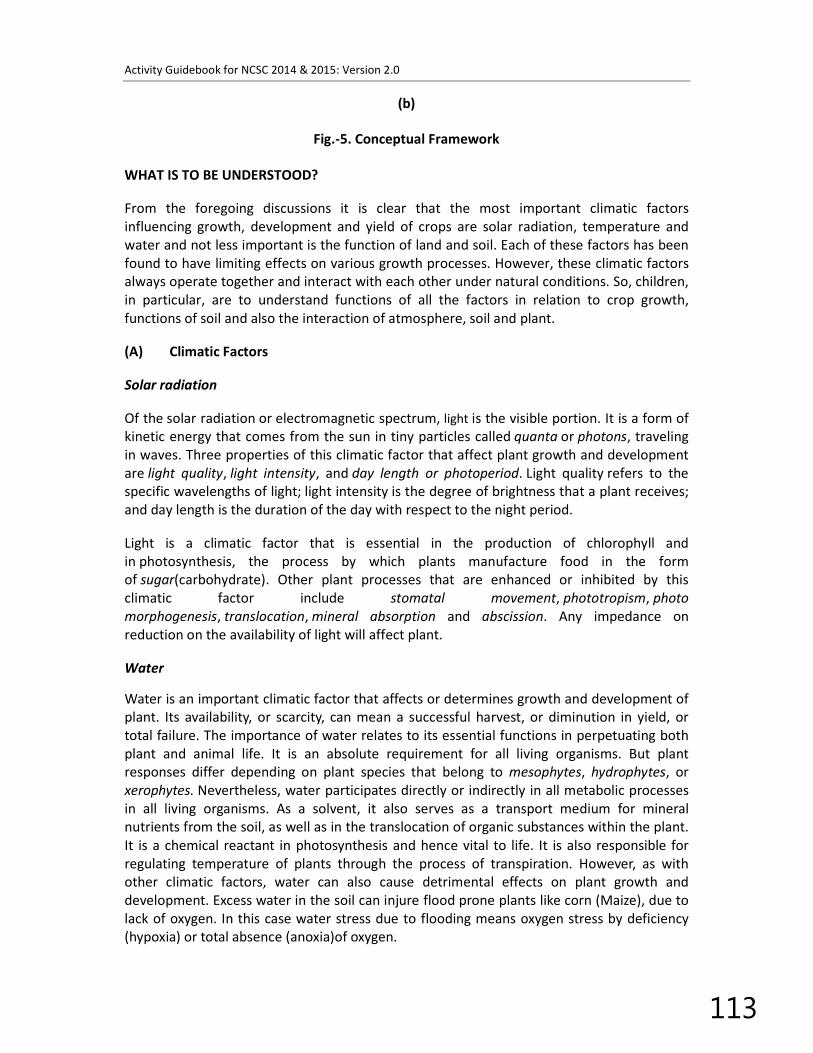
Activity Guidebook for NCSC 2014 & 2015: Version 2.0
113
(b)
Fig.-5. Conceptual Framework
WHAT IS TO BE UNDERSTOOD?
From the foregoing discussions it is clear that the most important climatic factors
influencing growth, development and yield of crops are solar radiation, temperature and
water and not less important is the function of land and soil. Each of these factors has been
found to have limiting effects on various growth processes. However, these climatic factors
always operate together and interact with each other under natural conditions. So, children,
in particular, are to understand functions of all the factors in relation to crop growth,
functions of soil and also the interaction of atmosphere, soil and plant.
(A) Climatic Factors
Solar radiation
Of the solar radiation or electromagnetic spectrum, light is the visible portion. It is a form of
kinetic energy that comes from the sun in tiny particles called quanta or photons, traveling
in waves. Three properties of this climatic factor that affect plant growth and development
are light quality, light intensity, and day length or photoperiod. Light quality refers to the
specific wavelengths of light; light intensity is the degree of brightness that a plant receives;
and day length is the duration of the day with respect to the night period.
Light is a climatic factor that is essential in the production of chlorophyll and
in photosynthesis, the process by which plants manufacture food in the form
of sugar(carbohydrate). Other plant processes that are enhanced or inhibited by this
climatic factor include stomatal movement, phototropism, photo
morphogenesis, translocation, mineral absorption and abscission. Any impedance on
reduction on the availability of light will affect plant.
Water
Water is an important climatic factor that affects or determines growth and development of
plant. Its availability, or scarcity, can mean a successful harvest, or diminution in yield, or
total failure. The importance of water relates to its essential functions in perpetuating both
plant and animal life. It is an absolute requirement for all living organisms. But plant
responses differ depending on plant species that belong to mesophytes, hydrophytes, or
xerophytes. Nevertheless, water participates directly or indirectly in all metabolic processes
in all living organisms. As a solvent, it also serves as a transport medium for mineral
nutrients from the soil, as well as in the translocation of organic substances within the plant.
It is a chemical reactant in photosynthesis and hence vital to life. It is also responsible for
regulating temperature of plants through the process of transpiration. However, as with
other climatic factors, water can also cause detrimental effects on plant growth and
development. Excess water in the soil can injure flood prone plants like corn (Maize), due to
lack of oxygen. In this case water stress due to flooding means oxygen stress by deficiency
(hypoxia) or total absence (anoxia)of oxygen.
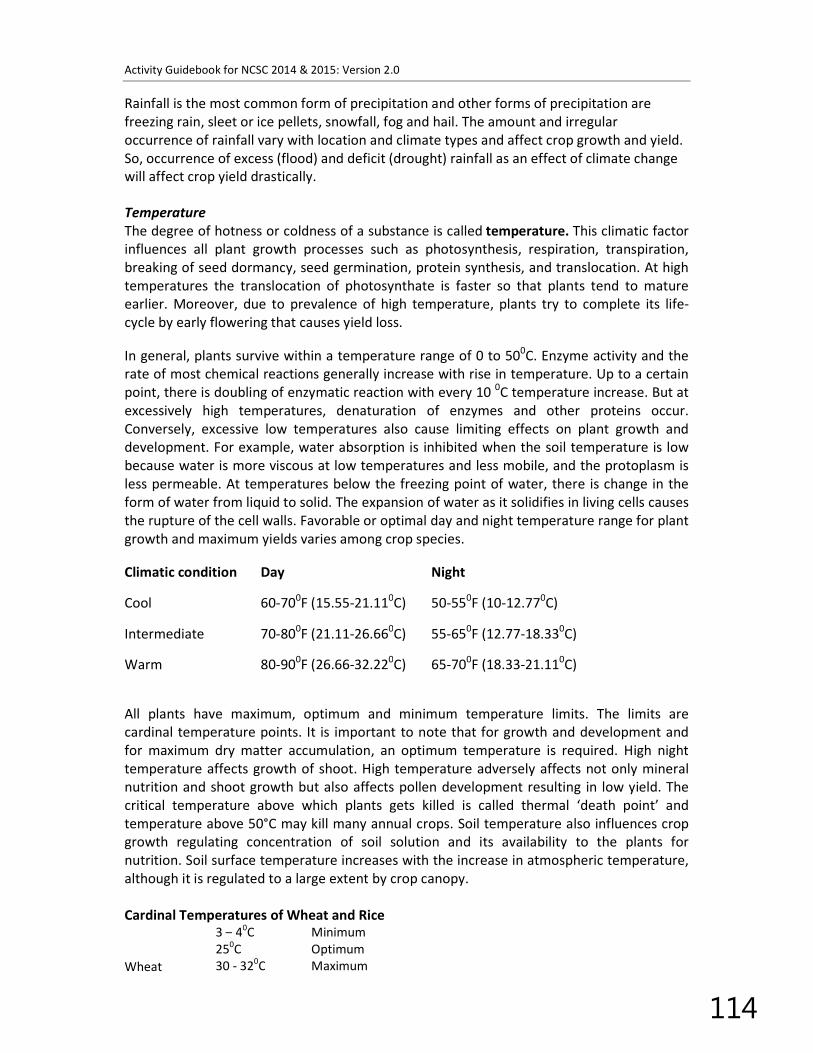
Activity Guidebook for NCSC 2014 & 2015: Version 2.0
114
Rainfall is the most common form of precipitation and other forms of precipitation are
freezing rain, sleet or ice pellets, snowfall, fog and hail. The amount and irregular
occurrence of rainfall vary with location and climate types and affect crop growth and yield.
So, occurrence of excess (flood) and deficit (drought) rainfall as an effect of climate change
will affect crop yield drastically.
Temperature
The degree of hotness or coldness of a substance is called temperature. This climatic factor
influences all plant growth processes such as photosynthesis, respiration, transpiration,
breaking of seed dormancy, seed germination, protein synthesis, and translocation. At high
temperatures the translocation of photosynthate is faster so that plants tend to mature
earlier. Moreover, due to prevalence of high temperature, plants try to complete its life-
cycle by early flowering that causes yield loss.
In general, plants survive within a temperature range of 0 to 500C. Enzyme activity and the
rate of most chemical reactions generally increase with rise in temperature. Up to a certain
point, there is doubling of enzymatic reaction with every 10 0C temperature increase. But at
excessively high temperatures, denaturation of enzymes and other proteins occur.
Conversely, excessive low temperatures also cause limiting effects on plant growth and
development. For example, water absorption is inhibited when the soil temperature is low
because water is more viscous at low temperatures and less mobile, and the protoplasm is
less permeable. At temperatures below the freezing point of water, there is change in the
form of water from liquid to solid. The expansion of water as it solidifies in living cells causes
the rupture of the cell walls. Favorable or optimal day and night temperature range for plant
growth and maximum yields varies among crop species.
Climatic condition Day Night
Cool 60-700F (15.55-21.11
0C) 50-55
0F (10-12.77
0C)
Intermediate 70-800F (21.11-26.66
0C) 55-65
0F (12.77-18.33
0C)
Warm 80-900F (26.66-32.22
0C) 65-70
0F (18.33-21.11
0C)
All plants have maximum, optimum and minimum temperature limits. The limits are
cardinal temperature points. It is important to note that for growth and development and
for maximum dry matter accumulation, an optimum temperature is required. High night
temperature affects growth of shoot. High temperature adversely affects not only mineral
nutrition and shoot growth but also affects pollen development resulting in low yield. The
critical temperature above which plants gets killed is called thermal ‘death point’ and
temperature above 50°C may kill many annual crops. Soil temperature also influences crop
growth regulating concentration of soil solution and its availability to the plants for
nutrition. Soil surface temperature increases with the increase in atmospheric temperature,
although it is regulated to a large extent by crop canopy.
Cardinal Temperatures of Wheat and Rice
Wheat
3 – 40C Minimum
250C Optimum
30 - 320C Maximum

Activity Guidebook for NCSC 2014 & 2015: Version 2.0
115
Rice
10 - 120C Minimum
30 - 320C Optimum
36 - 380C Maximum
Low temperature Injuries Chilling injury If the plants grown in hot temperature are exposed to low temperature,
they will be killed or severely injured. When the night temperature is below
15°C field crops may show yellowing symptoms (e.g. Tropical annuals).
Freezing injury When the plants are exposed to how temperature, water freezes into ice
crystals in the intercellular spaces (e.g. Cell dehydration)
Temperate crops (potato, tea etc.,)
Suffocation Formation of thick cover of ice/snow on the soil surface presents the entry
of oxygen and crop suffers. This presents the respiration and lead to
accumulation of harmful substances.
Heaving Lifting of plants along with soil from its actual position by ice, crystals. This
is a mechanical lifting.
Frost damage
If the cell size is large the probability of frost damage is high due to
Low temperature near the canopy resulting from earth’s re-radiation.
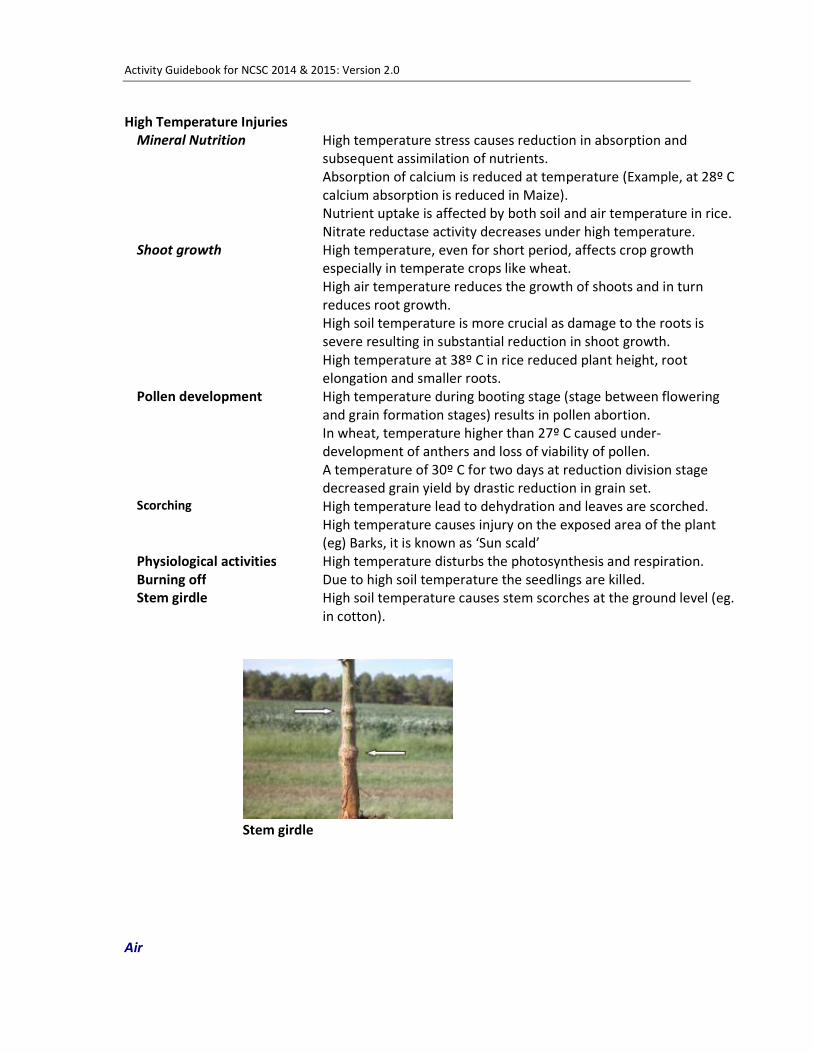
Activity Guidebook for NCSC 2014 & 2015: Version 2.0
116
High Temperature Injuries
Mineral Nutrition
High temperature stress causes reduction in absorption and
subsequent assimilation of nutrients.
Absorption of calcium is reduced at temperature (Example, at 28º C
calcium absorption is reduced in Maize).
Nutrient uptake is affected by both soil and air temperature in rice.
Nitrate reductase activity decreases under high temperature.
Shoot growth
High temperature, even for short period, affects crop growth
especially in temperate crops like wheat.
High air temperature reduces the growth of shoots and in turn
reduces root growth.
High soil temperature is more crucial as damage to the roots is
severe resulting in substantial reduction in shoot growth.
High temperature at 38º C in rice reduced plant height, root
elongation and smaller roots.
Pollen development
High temperature during booting stage (stage between flowering
and grain formation stages) results in pollen abortion.
In wheat, temperature higher than 27º C caused under-
development of anthers and loss of viability of pollen.
A temperature of 30º C for two days at reduction division stage
decreased grain yield by drastic reduction in grain set.
Scorching High temperature lead to dehydration and leaves are scorched.
High temperature causes injury on the exposed area of the plant
(eg) Barks, it is known as ‘Sun scald’
Physiological activities High temperature disturbs the photosynthesis and respiration.
Burning off Due to high soil temperature the seedlings are killed.
Stem girdle
High soil temperature causes stem scorches at the ground level (eg.
in cotton).
Stem girdle
Air
Activity Guidebook for NCSC 2014 & 2015: Version 2.0
117
The air is a mixture of gases in the atmosphere; about 75% of air is found in
the troposphere, the innermost layer of the atmosphere which extends about 17 km above
sea level at the equator and about 8 km over the poles. In addition, about 99% of the clean,
dry air in the troposphere consists of 78% nitrogen and 21% oxygen. The remainder consists
of argon (slightly less than 1%), carbon dioxide (0.036%), and traces of other gases. Oxygen
(O2) and carbon dioxide(CO2) in the air are of particular importance to the physiology of
plants. Oxygen is essential in respiration for the production of energy that is utilized in
various growth and development processes. Carbon dioxide(CO2) is a raw material in
photosynthesis.
The air also contains water vapour (H2O), suspended particles of dust and chemical air
pollutants such as carbon monoxide (CO), carbon dioxide (CO2), sulfur dioxide (SO2), sulfur
trioxide (SO3), nitrogen oxides, methane (CH4), propane, chlorofluorocarbons (CFCs), solid
particles of dust, soot, asbestos and lead, ozone and many more. However, the composition
of this climatic factor is susceptible of variation.
Air within the soil is also very important as it is used by roots of the plants and animals living
underground for their respiration. Any change in the composition of stratospheric air due to
climate change will affect quality of soil air too.
Plant Health
“For each carbon dioxide molecule that is incorporated into plants through
photosynthesis, plants lose about 200 molecules of water through their stomata. Elevated
CO2 reduces the stomatal density in leaves, this is at first sight beneficial for plants, as
they would lose less water. However, the reduction in the number of stomatal pores
decreases the ability of plants to cool their leaves during a heat wave via water
evaporation. Less evaporation adds to heat stress in plants, which ultimately affects crop
yield.”
“This change causes leaf temperature to rise because of a decrease in the plant’s
evapotranspirative cooling ability, while simultaneously increasing the transpiration
efficiency of plants,” the report says. “These phenomena, combined with the increasing
scarcity of fresh water for agriculture, are predicted to dramatically impact on plant
health.”
- Julian Schroeder, professor of biological sciences at the University of California San
Diego, who led the team that reports in Nature journal.
Humidity
The amount of water vapor that the air can hold depends on its temperature; warm air has
the capacity to hold more water vapor than cold air. There is almost one-half reduction in
the amount of water vapor that the air can hold for every 100C drop in temperature.
But, we are concerned mostly with Relative humidity (RH), which is the amount of water
vapor in the air, expressed as the proportion (in percent) of the maximum amount of water

Activity Guidebook for NCSC 2014 & 2015: Version 2.0
118
vapor it can hold at certain temperature. For example, an air having a relative humidity of
60% at 270C temperature means that every kilogram of the air contains 60% of the
maximum amount of water that it can hold at that particular temperature.
The amount of water vapor in the air ranges from 0.01% by volume at the frigid poles to 5%
in the humid tropics. In relation to each other, high RH means that the air is moist while air
with minimal content of moisture is described as dry air. Compared to dry air, moist air has a
higher relative humidity with relatively large amounts of water vapor per unit volume of
air.The relative humidity affects the opening and closing of the stomata, which regulates
loss of water from the plant through transpiration as well as photosynthesis. The amount of
humidity in air influences incidence of pest and diseases in plants resulting severe yield loss.
Wind,
The air movement, termed as wind,is due to the existence of pressure gradient on a global
or local scale caused by differences in heating. On a global scale it consists of the jet stream
flow and movement of large air masses. On the local scale only a smaller quantity of air
moves. Surface winds are lower and less turbulent at night due to the absence of solar
heating.
When air is close to the ground it cools, and subsequently it contracts and the pressure
rises; when it warms, it expands and pressure drops. Where both cold and warm air occur in
proximity, as over a lake and its adjacent shore, the cold flows to the direction of the warm
air or from high to low pressure area to correct the pressure imbalance. This also happens in
tropical Asia but in a larger and more complex way, as the monsoon winds. Moderate winds
favor gas exchanges, but strong winds can cause excessive water loss through
transpiration as well as lodging or toppling of plants. When transpiration rate exceeds that
of water absorption, partial or complete closure of the stomata may ensue which will
restrict the diffusion of carbon dioxide into the leaves. As a result, there will be a decrease
in the rate of photosynthesis, growth and yield. This climatic factor serves as a vector of
pollen from one flower to another thus aiding in the process of pollination. It is, therefore,
essential in the development of fruit and seed from wind-pollinated flowers as in many
grasses.
(B) Function of Soil
Soil performs multiple functions starting from providing physical, chemical and biological
support for plant growth. It provides habitat for variety of flora and fauna including human.
Lives. It acts as natural filter and buffer media against abrupt changes occurring in it. It also
acts as a sink of organic carbon and thus global CO2 flux.
The upper thin layer (usually 15 cm depth) of land surface is the most favourable medium
for plant growth. Plant anchors and draws nutrients and water from this layer. Soil in this
layer performs a number of ecosystem services like storage, decomposition,
transformation, and detoxification and thereby provides right soil condition for crop/plant
growth. Numbers of biogeochemical cycles like carbon, nitrogen, phosphorus and sulfur
cycles are being operated and nutrients are being released for plant and soil organisms and
thus biomass production are sustained in the earth.

Activity Guidebook for NCSC 2014 & 2015: Version 2.0
119
(C) Atmosphere-Soil-plant System
It is to be very much clear to the children that all the component of the earth system i.e.
atmosphere, lithosphere, hydrosphere and biosphere are interdependent and act by the
influence of solar energy (Fig.-3). Moreover, nature maintains a balance among them. So
any change at any level may lead to the catastrophe to the crop production system vis-à-vis
the agriculture as a whole.
Fig.-3. The Earth System
It has further been explained through figure-4 that there is strong relationship between
physical climate system and biogeochemical system.
Activity Guidebook for NCSC 2014 & 2015: Version 2.0
120
Fig.-4.
So, under this sub-theme, children can observe changes in the weather regulating factors
and their impact on agricultural system in their own area and find out some
method/technique to mitigate. Moreover, there are many practices related with seed
selection, irrigation, soil management etc., which can help in adaptation process.
PROJECT IDEAS
Project 1: Conservation agriculture for sustainable land use
Introduction:
Conservation agriculture is application of modern agricultural technologies to improve production
with concurrent protection and enhance the land resources on which the production depends. It
promotes the concept of optimizing yield and profits with minimal disturbance of land resources
along with balanced application of chemical inputs and careful management of crop residues and
waste.
Objectives
• To promote minimal mechanical disturbance of soil through zero/minimum tillage.
• To maintain permanent soil cover with available crop residues and other wastes.
• Efficient nutrient management practices through balanced application of organic and
inorganic source.
• Effective utilization of residual soil moisture.
Methodology
1. Selection of field
2. Selection of crop (Cereals/Oilseed/Pulse/ leafy vegetables)
3. Divide the field into two equal halves and mark as (a) and (b)
a) Dig lines of 2” – 3” depths with equal distance between the lines, place the fertilizer,
cover it with loose soil, place the seed on it and cover the lines.
b) Plough the soil and apply fertilizer (as per local practice) and sow the seeds.
4. Doses of fertilizer, pesticides etc. will be as per practice followed by farmers.
Observation:
1. Record economic yield/ biomass data of the crops
2. Workout the economic benefit.
3. Determine bulk density of soil at the time of harvest of the crops from all the plots.
4. Find out porosity of soil and compare the differences.
Procedure to measure bulk density:
1) Cut 4-6” length pieces (core) from a G I Pipe with > 2” diameter
2) Place the core on the soil surface.
3) Place a wooden block (approximately 4” width, 5” length, 1” thickness) on the top of the
core.
4) Hammer the wooden block to push the core into the soil
5) Cut the soil around the core with spade and take out the core with soil in it.
6) Cut the excess soil at both ends of the core with knife so that volume of the core will
represent volume of the soil

Activity Guidebook for NCSC 2014 & 2015: Version 2.0
121
7) Take the weight of core plus soil
8) Push the soil out, wash and clean the core and make it dry.
9) Take the weight of the core
10) Measure the inside diameter and length of the core, which will be used in calculating the
volume of soil
11) Divide the mass of the soil by the volume of soil this will give the bulk density of the soil.
Follow up:
1) Show the crops condition to others.
2) Discuss the results with the farmers/ students.
Note: Density is the mass of an object per unit volume. It is expressed as gm/cm
3
Soil has got two densities – Particle density and Bulk density.
• Particle density (pd) is the density of the solid soil particles (sand, silt and clay). For all
practical purposes and on-farm studies average particle density is considered as 2.65
gm/cm3
• Bulk density (bd) is the density for a volume of soil as it exists naturally, which includes any
air space and organic materials in the soil volume. Science bulk density is calculated for the
dried soil, moisture is not included in the sample. It is calculated using the following formula
bd = weight of soil/ volume of soil core
Volume of soil core = πr2h (π = 22/7 = 3.14)
Where, r is the radious of the core = d/2 (d is the diameter of the core)
h is the height of the soil core
A B
C
Suppose, in the figure of the cylinder, AB is the diameter (d) and AB/2 or d/2 is the radius (r). BC is
the height (h) of the cylinder.
Calculate (i) cross sectional area(A) of the cylinder (A = π r2
)
(ii) Volume of the cylinder (V) = A x h = π r2
xh = 3.14r2
xh (π = 3.14)
Soil porosity, % = (1- bd/2.65)x100
Project 2: Mitigate soil and water loss through runoff with suitable control measures.
Introduction:
Land degradation refers to the loss of inherent capacity of land to produce healthy and nutritious
crops. It may occur with various forms – physical, chemical and biological. Soil erosion is the most

Activity Guidebook for NCSC 2014 & 2015: Version 2.0
122
important forms of land degradation as the vast area of our country suffers due to such process. It is,
therefore, necessary to protect this shrinking valuable land resource to meet the demand of ever
increasing population. Some of the common measures are practiced for preventing the loss of runoff
water and soil particles from the sloppy land, which includes terracing, bunding, cover cropping,
strip cropping, conservation tillage, cultivation along or across the slope etc.
Objectives:
1) Quantify loss of soil and water through runoff.
2) Implement control measure to check the loss of soil and water.
3) Sustainable land use practice in areas prone to erosion.
Methodology:
1) Selection of a suitable sloppy land.
2) Divide the land into at least 3 parts along with the slope.
(Minimum width of each part shall be 3m)
3) Treatments
a) Keep fellow or undisturbed.
b) Grow cover crops.
c) Grow strip crop as per local practice.
4) Separate the adjoining parts by erecting suitable barriers with non porous inert materials
5) Place suitable notch at the middle part of the lower end through which runoff water and soil
particle will pass.
6) Place a large bucket or suitable tank to collect the run off water and soil particles.
How to calculate slope of a land?
A
B C
Suppose BC is the length of a land and AB is the height of the land;
So, Slope, % = (BC/ AB)x 100
Observation:
1) Length of slope
2) Percent of slope
3) Amount of water added at the upper end to initiate the runoff process
4) Measure the amount of water and soil collected in the tanks at lower end.
Follow-up:
1) Transfer the results of the experiments to the farmers and local people.
2) Demonstrate the experiment to students of the area.
Suggested Projects
1. How does organic component influence different Soil Properties?
2. Determining maximum loading limit for copper in agricultural land
3. Evaluating filtration capacity of soil
4. Influence of vegetation cover on microclimate
5. Influence of mulch on soil physical properties
6. Study of the influence of tillage on soil physical properties

Activity Guidebook for NCSC 2014 & 2015: Version 2.0
123
7. Effect of land use options on erosion loss of surface soil 8. Influence of tillage on ground water recharge from rice field.
9. Impact of saline water on soil properties like pH etc.
10. Germination of crop in soil with varying salinity level
11. Organic matter addition and crop growth
12. How pollutants affect soil biota?
Evapotranspiration (ET) is the sum of evaporation and planttranspiration from the Earth's
land and ocean surface to the atmosphere. Evaporation accounts for the movement of water to
the air from sources such as the soil, canopy interception, and waterbodies. Transpiration
accounts for the movement of water within a plant and the subsequent loss of water as vapor
through stomata in its leaves. Evapotranspiration is an important part of the water cycle.
Potential evapotranspiration (PET) is a representation of the environmental demand for
evapotranspiration and represents the evapotranspiration rate of a short green crop,
completely shading the ground, of uniform height and with adequate water status in the soil
profile. It is a reflection of the energy available to evaporate water, and of the windavailable
to transport the water vapour from the ground up into the loweratmosphere. Actual
evapotranspiration is equal potential evapotranspiration when there is ample water.
Literature Cited:
Mahi,G.S and Kingra, P.K.2007.Fundamentals of Agrameteorology, Kalyani Publishers,
Kolkata
De, A.K.1994.Environmental Chemistry (3rd
Edition).New Age International Limited. Kolkata
Asada H., and Matsumoto J. 2009. Effects of rainfall variation on rice production in the
Ganges–Brahmaputra Basin. Clim. Res. 38, 249–260.
GLOSSARY
Acid rain: rain having a pH lower than 5.6 (the pH of natural rainwater), usually caused by
sulfuric acid and/or nitric acid from air pollution.
Atmosphere: air enveloping earth due to earth's gravitational pull. Can be divided into layers
radiating out from the surface in the following order-
troposphere, stratosphere, mesosphere, thermosphere.
Biosphere: the zone between the earth and the atmosphere in which most life forms reside.
carbonsequestration: The uptake and storage of carbon in a carbon sink, such as the oceans,
or a terrestrial sink such as forests or soils, in order to keep the carbon out of the atmosphere.

Activity Guidebook for NCSC 2014 & 2015: Version 2.0
124
Climatology: scientific study of the climate, the causes of a climate, and the use of data to
solve climate related problems.
Degree-day unit: a measure of how much the mean daily temperature differs from a base
temperature in Fahrenheit and Celsius. Used to determine how much fuel will be needed to
heat or cool indoor environments.
Desalination: The process of removing salts from water, usually seawater, soil, or other
substances.
Desertification: when an area begins to develop desert-like conditions due to lack of water,
deforestation, overgrazing and over cropping.
Dew: when liquid water from the atmosphere condenses on plants and objects near the
ground.
Diurnal: referring to daily phenomena.
Drought: a long period of time where there is abnormally dry weather due to little or
no precipitation.
El Niño : warming of ocean waters in the eastern tropical pacific, resulting in warmer waters
off the coasts of Ecuador and northern Peru. Associated with heavy rainfall in those regions,
and also affects weather patterns in North America as well. Usually begins to occur around
Christmas, and is so named for El Niño, the Spanish name for the Christ Child.
Erosion: when rock and soil are moved from one place to another by running
water, precipitation, ice, or wind.
Evaporation: the change of state from a liquid to a vapor.
Evapotranspiration: the combined water vapor put into the air through evaporation from
water on earth's surface and plants giving off water to the atmosphere.
Flood: when water overflows the confines of a body of water and gathers over low-lying
areas.
Fog: a visible gathering of water droplets suspended in the air near the earth's surface.
Greenhouse gas: gases in the atmosphere that are more transparent to the short wavelength
radiation (mostly visible light) from the sun, than to the long wavelength radiation (infrared
radiation) leaving the Earth. These gases then reemit the trapped energy, partly toward the
Earth's surface. Examples are carbon dioxide, methane, CFCs, and nitrous oxides.

Activity Guidebook for NCSC 2014 & 2015: Version 2.0
125
Greenhouse effect: a natural occurrence caused by certain greenhouse gases in the Earth's
atmosphere. Because greenhouse gases traplongwave energy and reemit it back to the Earth's
surface, the global temperature is changed 33 degrees Celsius, or 59 degrees Fahrenheit
warmer than it would otherwise be. Some scientists think that the increase in greenhouse
gases in the atmosphere (caused by pollution- mainly the burning of fossil fuels and
deforestation) may be causing a rise in global temperature.
Humidity: the measure of how much water there is in the air.
Hydrologic cycle: the exchange of water between the earth, the oceans, and the atmosphere.
Also called the water cycle.
Hydroponics: Itis a method of growing plants using mineral nutrient solutions, in water,
without soil.
Hydrosphere: the part of planet earth that is covered with water and ice.
Isobar: a line of equal pressure resembling a contour line on a map.
Isotherm: a line passing through points of equal temperature on a map.
La Niña: a period of strong trade winds and abnormally low sea surface temperatures in the
central and eastern tropical Pacific. It is the opposite of an El Niño. Spanish for little girl
child.
Lithosphere: the outer solid portion of the planet earth, made up of the earth's crust and
upper mantle. All the rock on earth.
Meteorology: study of the phenomena of the atmosphere. Includes physics, chemistry and
dynamics of the atmosphere as well as the direct effects upon the earth's surface, oceans and
life in general.Oriented towards developing a complete understanding, accurate prediction,
and artificial control of atmospheric occurrences.
Monsoon: when the principal wind direction changes noticeably with the season. The main
cause is the heating and cooling of a nearby ocean depending on summer and winter, such as
the Indian Ocean and the India monsoon for example.
Ozone layer: a place in the stratosphere (about 10-50 kilometers up) where the high ozone
(O3 molecules) concentration shields the Earth from harmful ultraviolet radiation.
pH scale: a measure of the range of acidity and alkalinity of a substance, on a scale from 0-
14, with acids being on the lower end and bases on the higher end. A value of 7 is neutral.

Activity Guidebook for NCSC 2014 & 2015: Version 2.0
126
Precipitation: any form of water particles that fall from the clouds and reach the ground.
Examples are rain, snow, sleet, and hail. Fog, dew,frost, and clouds are not forms
of precipitation.
Relative humidity: ratio of the actual vapor pressure of the air to the saturation vapor
pressure for the surrounding air temperature. In other words, how much water the air is
holding divided by how much water the air is capable of holding.
Soil environment: A condition of the soil, whether physical, biological or chemical, that
influences the organisms and processes that occur in the soil.
Soil organic carbon: That portion of non-living organic compounds in the top one meter of
soil, e.g. humus, which is important to soil quality and plant nutrition and is replenished by
the decomposition of plant material.
Soil remediation: The removal of contaminants and pollutants from soil.
soil water regimes: The presence or absence either of ground water or of plant available
water (i.e., water held at a tension of less than 1500 kPa) in the soil or in specific horizons
during periods of the year. A generally accepted classification of soil moisture regimes from
wet to dry includes aquic, udic, ustic, aridic, and xeric.
Ultraviolet radiation: electromagnetic radiation with wavelengths ranging from 1-300
nanometers. Can be divided into three types-UVA (responsible for tanning the skin and some
types of skin cancers), UVB (responsible for sunburn and skin cancers), and UVC
(potentially lethal radiation, but does not reach the earth's surface because of protection from
the ozone layer).
Activity Guidebook for NCSC 2014 & 2015: Version 2.0
127
Sub Theme 6
========================
Weather, Climate and Health
Text by DrLalit Sharma

Activity Guidebook for NCSC 2014 & 2015: Version 2.0
128
Sub-theme VI: Weather, Climate, and Health
1. Background
Climate implies meteorological weather conditions including wind, temperature,
precipitation, snow, and clouds that characteristically prevail in a particular
region, calculated by averaging these weather conditions over an extended
period, usually at least 30 years. Weather describes a phenomenon that can
change quickly from hour to hour, day to day, season to season and year to year
at a given location or region, even within an unchanging climate.
Weather and climate influences
environmental and social
determinants, and in addition, it
affect health of the living beings.
Health is a state of complete
physical, mental, and social well
being and not merely absence of
disease. Public health depends on
availability of enough food, safe
drinking water, a decent home
protection against disasters, a
reasonable income and good social
and community relations (WHO,
2003). Weather and climate, thus,
have direct and indirect
relationship on human and animal health.
Climate change associated with global warming has already triggered weather
changes (from flooding and storms to heat waves and droughts), which are
taking a heavy toll on people’s health around the world. Over the Indian region,
the observed temperature during 1901 to 2008 indicated a rising trend at a rate
of 0.52°C in 100 years. Over the Indian region, there have been significant rising
trends in the frequency and magnitude of extreme rains during the monsoon
season. Climate change leads to health consequences through pathways of direct
exposures (e.g., extreme heat), indirect exposures (e.g., changes in water, air, and
food quality), and social and economic disruptions. Thus, climate change
produces a dynamic system where a change in one condition exerts influence in
multiple pathways with associated health consequences (Michael et al., 2012).
Climate change studies have shown that heat waves and higher temperatures
can lead to an increase in serious air pollution that may cause respiratory,
cardiovascular and cancerous diseases to people living in the urban and

Activity Guidebook for NCSC 2014 & 2015: Version 2.0
129
industrial zones. Heavy rainfall, floods, or droughts occurring frequently are
threatening global safety, drinking water supply and food security leading to an
increase in malnutrition, hunger, and famine.
The changes in environmental
temperature, air humidity, and
rainfall patterns are increasing
the sensitive of vector-borne
diseases such as malaria,
dengue, chikungunya,Lyme
disease, Japanese encephalitis,
diarrhea, kala-azar, filariasis
and cholera and the likes. In
addition, natural disasters and
abnormal weather phenomena
can cause chronic stress disorders and many other psychological or mental
health problems. Sea level rise resulting into the land loss, infrastructure
damage, and a reduction in farming productivity may lead to increasing forced
migration and several other socio-economic problems. Climate change also
affects infrastructure of public health care systems (Bush et al., 2011; Tuan,
2013).
Relationships between year-to-year variations in climate and infectious diseases
are most evident where climate variations are marked, and in vulnerable
populations. Elder people, children, economically weaker, and especially women
living in the undeveloped areas are the most vulnerable and sensitive to climate
change. The El Niño phenomenon provides an analogue for understanding the
future impacts of global climate change on infectious diseases.
Climate change will have a wide variety of health impacts, many are predictable,
but some are not. Higher maximum temperatures will lead to increased heat-
related deaths and illnesses and contribute to an extended range of some pest
and disease vectors. In some areas, there will be increased severity and
frequency of droughts leading to forest fires; in other areas, more intense rainfall
will lead to slope instability, flooding and contaminated water supplies. More
intense, large-scale cyclones will increase the risk of infectious disease epidemics
(e.g., via damaging water supplies and sewerage systems) and cause the erosion
of low-lying and coastal land through storm surges. Indirect effects of climate
change will occur from economic instability, loss of livelihoods and forced
migrations.

Activity Guidebook for NCSC 2014 & 2015: Version 2.0
130
In light of the fact, that weather and climate have potential impact on the health
of human beings and animals, child scientists are expected to understand the
causative factors, the concerns arising and the corrective measures that can be
adopted to lessen the adversity. Ailments like vector-borne diseases, infections
and infestations, water and / air borne diseases, zoonosis, emergence and
reemergence of certain diseases which are influenced by the variability of
weather and climate are some of the areas to ponder upon and take up the study.
2. Framework
a. What is to be understood?
Weather and Climate: India has a unique climatic regime with two monsoon
seasons (south-west and north-east), two cyclone seasons (pre- and post-
monsoon), hot weather season characterized by severe thunderstorms and heat
waves, and cold weather season characterized by violent snowstorms in the
Himalayan regions and cold waves. Heavy to very heavy rainfall during the
monsoon season (June–September) often cause floods over many parts of India.
Similarly, strong winds, heavy torrential rains, storm surges and astronomical
tides associated with tropical cyclone are also prevalent over the coastal belt of
India mainly during the pre-monsoon (April–May), early monsoon (June), and
post-monsoon (September– November) periods. These disasters often results in
epidemics.
Health:Weather and climate have both direct as well as indirect bearing on
human and animal health. Climate disasters such as floods and droughts affect

Activity Guidebook for NCSC 2014 & 2015: Version 2.0
131
health and lead to social and economic disruption. They, more often than not,
directly result in mortality and morbidity and may indirectly lead to an increase
in the transmission of communicable diseases as well as damages to local
infrastructure, displacement of population and ecological change. The majority of
disasters occur in regions where infectious diseases such as malaria and dengue
are either endemic or have a high endemic potential. Presumably, the impact of
communicable diseases is often very high in the aftermath of disasters. However,
the increase in endemic diseases and the risk of outbreaks are rather dependent
on other different factors also, such as population movement and water as well
as sanitation facilities that work synergistically to increase mortality resulting
from communicable diseases.
Relationships: Extreme
conditions such as heat wave and
cold wave, drought and flood,
storms and strong winds, have a
greater impact on health of
animals and human beings. The
current burden of disease due to
climate sensitive health outcomes,
including but not limited to
diarrhoea, vector-borne diseases,
malnutrition, deaths due to floods and landslides, and cardiovascular diseases in
cold waves and heat waves, is considerable.
During summer, most regions in India experience episodes of heat waves every
year causing sunstroke, dehydration, and death. An analysis of daily
climatological heat index (HI; combining temperature and humidity) over 41
districts well distributed over the country indicated that maximum HI exceeding
45°C characterizes many districts during March to May and June to September.
On the other hand, the wind chill index (combining temperature and wind speed)
is less than 10°C for a very few districts in northern India mainly in winter
(January–February) and the post monsoon season (October–December). Different
climatic conditions create favourable conditions for the transmission of vector-
borne and enteric diseases.
b. Why is it important?
The potential health impacts of climate change are immense and managing the
health impacts thereby is an enormous challenge. It is widely acknowledged that
climate change is only one of many important factors influencing the incidence of
infectious diseases and their effects are very unlikely to be independent of socio-
demographic factors (e.g., human migrations, transportation, nutrition), or of
Activity Guidebook for NCSC 2014 & 2015: Version 2.0
132
environmental influences (e.g., deforestation, agricultural development, water
projects, urbanization).
Extreme high air temperatures contribute directly to deaths from cardiovascular and respiratory
disease, particularly among elderly people. Urban air pollution causes millions of deaths every
year. Pollen and other aeroallergen levels also increase triggering asthmatic bouts (WHO, 2014).
A report from the Ministry of Health and Family Welfare estimates that waterborne diseases
affect nearly 40 million people, every year (Mandal, 2008).
The summer of 2010 was one of the hottest summers on record in India, with temperatures
approaching 50°C (122°F); the effects were far-reaching, including hospitalization because of
heatstroke, suffering of livestock, and severe drought in some regions that affected health as well
as agriculture (Burke 2010).
India has approximately 2 million confirmed cases of malaria every year (Kumar et al. 2007).
Like most infectious diseases, prevalence however varies by region. WHO concludes that
approximately 15,000 individuals die from malaria each year in India (WHO 2008). A study by
Dhingra et al. (2010) estimates approximately 200,000 malaria deaths per year in India before 70
years of age and 55,000 in early childhood.
1. Patterns of infections
Climatic conditions strongly affect water-borne diseases. Changes in climate are
likely to lengthen the transmission seasons of important vector-borne diseases
and alter their geographic range.
Malaria is a climate-sensitive disease transmitted by Anopheles mosquito. The
distribution map of India reveals Odisha, northeastern states, Jharkhand and
Chhattisgarh as endemic with stable malaria while Rajasthan, Uttar Pradesh,
Himachal Pradesh, and Uttarakhand with unstable malaria. In stable malaria,
transmission continues almost throughout the year as the temperature, rainfall
and resultant relative humidity are suitable for round the year. The states
having unstable malaria experience winters during which transmission does not
take place. Areas with unstable malaria are epidemic prone depending on
favorable conditions provided by unusual high rains at the threshold of the
transmission season. Distribution of malaria and its endemicity is the reflection
of suitable climatic conditions and availability of mosquito vectors in different
parts of the country (INCCA, 2010).
Dengue, primarily transmitted by Aedesaegyptiand secondarily by
Aedesalbopictus, is a major public health concern for over half of the world’s
population and is a leading cause of hospitalization and death, particularly for
children in endemic countries. Rise in temperature is potentially associated with
substantial increase in dengue outbreaks. Apart from climate factors other
important issues that potentially contribute to global changes in dengue
incidence and distribution include population growth, urbanization, lack of

Activity Guidebook for NCSC 2014 & 2015: Version 2.0
133
sanitation, increased human travel, ineffective mosquito control, and increased
reporting capacity ((Naishet al., 2014) .
2. Loss of life
Water-borne infectious diseases: A report from the Ministry of Health and
Family Welfare estimates that water-borne diseases affect nearly 40 million
people every year burdening both the health and the economic sectors.
Vector-borne disease: India has approximately 2 million confirmed cases of
malaria per year (Kumar et al. 2007). A study by Dhingra et al. (2010) estimates
approximately 200,000 malaria deaths per year in India before 70 years of age
and 55,000 in early childhood.
Heat stress: In recent past,the summer of 2010 was one of the hottest summers
on record in India, with temperatures approaching 50°C (122°F); the effects were
far-reaching, including hospitalization because of heat stroke, suffering of
livestock, and severe drought in some regions that affected health as well as
agriculture (Burke 2010).
Floods: Floods contaminate freshwater supplies, heighten the risk of water-
borne diseases, and create breeding grounds for disease-carrying insects such as
mosquitoes. Floods have been increasing in occurrence and intensity. Extreme
weather events such as floods cause water logging and contamination, which in
turn exacerbate diarrheal diseases such as cholera,vector-borne diseases,
malnutrition, and deaths.
3.Adaptations and mitigations
Potential adaptation strategies in India could focus on controlling infectious
diseases by removing vector-breeding sites, reducing vector–human contact via
improved housing, and coordinating monitoring of mosquitoes, pathogens, and
disease burden. In addition, improving sanitation and drinking water by
supporting inexpensive and effective water treatment and increasing rainwater
harvesting, safe storage, and gray-water reuse could be other means. In some
areas, the focus may shift to flood, heat wave, and emergency preparedness,
including strategies to address the additional risks placed on displaced
populations from these and other climate-sensitive hazards. Developing an
integrated early warning system, emergency response plans, and refugee
management plans, along with increased capacity to provide shelter, drinking
water, sanitation, and sustainable agricultural products to the most vulnerable
populations could be the outcome (Bush et al., 2011).
Environmental monitoring and surveillance:There is a great need to
improve environmental monitoring and surveillance systems in countries such as
India. New research initiatives should focus on collecting high quality, long-term

Activity Guidebook for NCSC 2014 & 2015: Version 2.0
134
data on climate-related health outcomes with the dual purpose of understanding
current climate–health associations and predicting future scenarios. Health
outcomes of interest, for which such data should be collected, include total mor-
bidity and mortality and non-communicable diseases such as cardiovascular and
respiratory diseases including asthma, as well as infectious diseases such as
cholera, malaria, tuberculosis, typhoid, hepatitis, dysentery, tick-borne
encephalitis, and other vector-borne and water-borne diseases. Such monitoring
also requires the collection of appropriate climatic (e.g., temperature and
precipitation) and non-climatic data (e.g., ozone). Surveillance of extreme
weather conditions and risk indicators such as mosquito abundance or pathogen
load is also necessary. Such data gathering should occur in conjunction with
already existing public health programs and health centers. Where the necessary
public health infrastructure does not exist, the anticipated risks associated with
climate change should motivate international action to build such infrastructure.
The collection of such diverse data necessitates the creation of linkable and
documented repositories for meteorological, air pollution, and health data (Bush
et al., 2011).
c. How to go about?
i. Identify vulnerable areas and groups: All populations will be affected by
climate change, but some are more vulnerable than others. People living in small
islands, developing states and other coastal regions, megacities, mountainous
regions are particularly vulnerable. Vulnerability of a population depends on
factors such as population density, level of economic development, food
availability, income level and distribution, local environmental conditions, pre-
existing health status, and the quality and availability of public health care.
ii. Identify health risks: Climate-sensitive health risks include those occurring
as a direct consequence of exposure to climatic stimuli (heat stroke, drowning
during flood), those mediated via climate-sensitive ecological systems (water-
borne and vector-borne diseases) and those resulting from the wider social
implications of climate change (malnutrition). Children in particular are among
the most vulnerable groups to the resulting health risks and will be exposed
longer to the health consequences. The health effects are also expected to be
more severe for elderly people and people with infirmities or pre-existing medical
conditions.Appropriately managed resources and infrastructure could further
help tackle the health risks of climate change as well as reduce greenhouse gas
emissions. Similarly, a suitable lifestyleincluding appropriate dietary habits
could not only further reduce the risks of non-communicable diseases but also
contribute to protecting the climate.
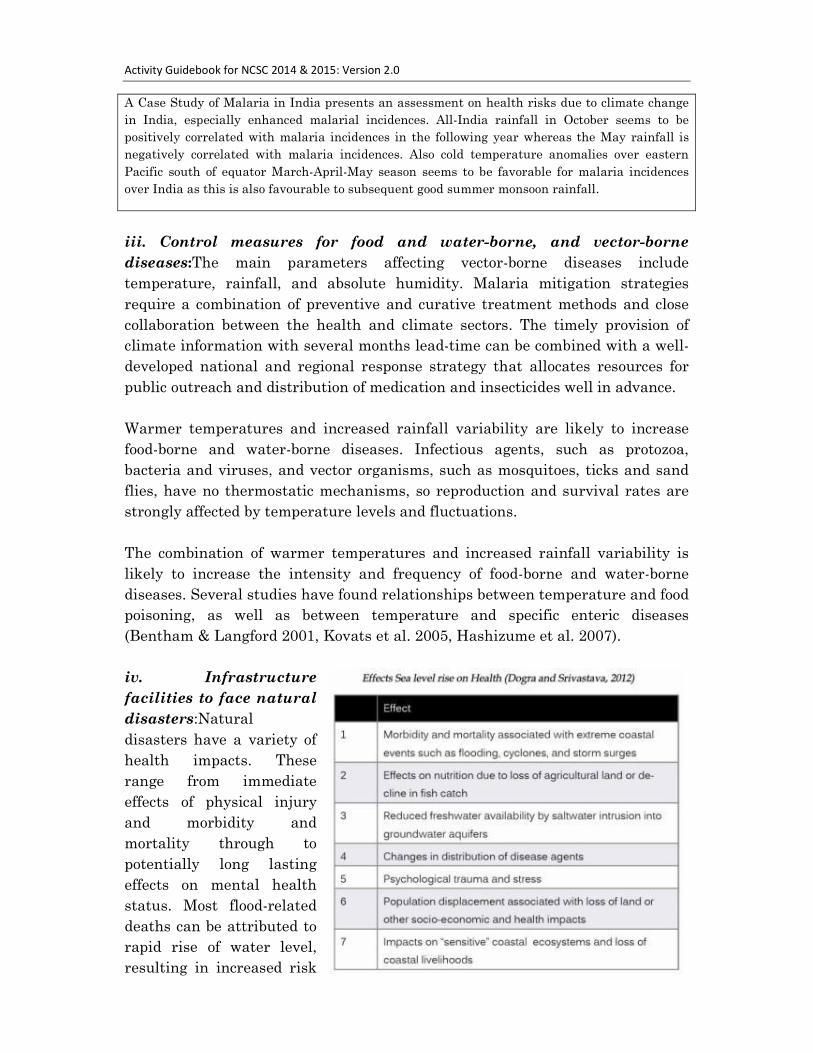
Activity Guidebook for NCSC 2014 & 2015: Version 2.0
135
A Case Study of Malaria in India presents an assessment on health risks due to climate change
in India, especially enhanced malarial incidences. All-India rainfall in October seems to be
positively correlated with malaria incidences in the following year whereas the May rainfall is
negatively correlated with malaria incidences. Also cold temperature anomalies over eastern
Pacific south of equator March-April-May season seems to be favorable for malaria incidences
over India as this is also favourable to subsequent good summer monsoon rainfall.
iii. Control measures for food and water-borne, and vector-borne
diseases:The main parameters affecting vector-borne diseases include
temperature, rainfall, and absolute humidity. Malaria mitigation strategies
require a combination of preventive and curative treatment methods and close
collaboration between the health and climate sectors. The timely provision of
climate information with several months lead-time can be combined with a well-
developed national and regional response strategy that allocates resources for
public outreach and distribution of medication and insecticides well in advance.
Warmer temperatures and increased rainfall variability are likely to increase
food-borne and water-borne diseases. Infectious agents, such as protozoa,
bacteria and viruses, and vector organisms, such as mosquitoes, ticks and sand
flies, have no thermostatic mechanisms, so reproduction and survival rates are
strongly affected by temperature levels and fluctuations.
The combination of warmer temperatures and increased rainfall variability is
likely to increase the intensity and frequency of food-borne and water-borne
diseases. Several studies have found relationships between temperature and food
poisoning, as well as between temperature and specific enteric diseases
(Bentham & Langford 2001, Kovats et al. 2005, Hashizume et al. 2007).
iv. Infrastructure
facilities to face natural
disasters:Natural
disasters have a variety of
health impacts. These
range from immediate
effects of physical injury
and morbidity and
mortality through to
potentially long lasting
effects on mental health
status. Most flood-related
deaths can be attributed to
rapid rise of water level,
resulting in increased risk
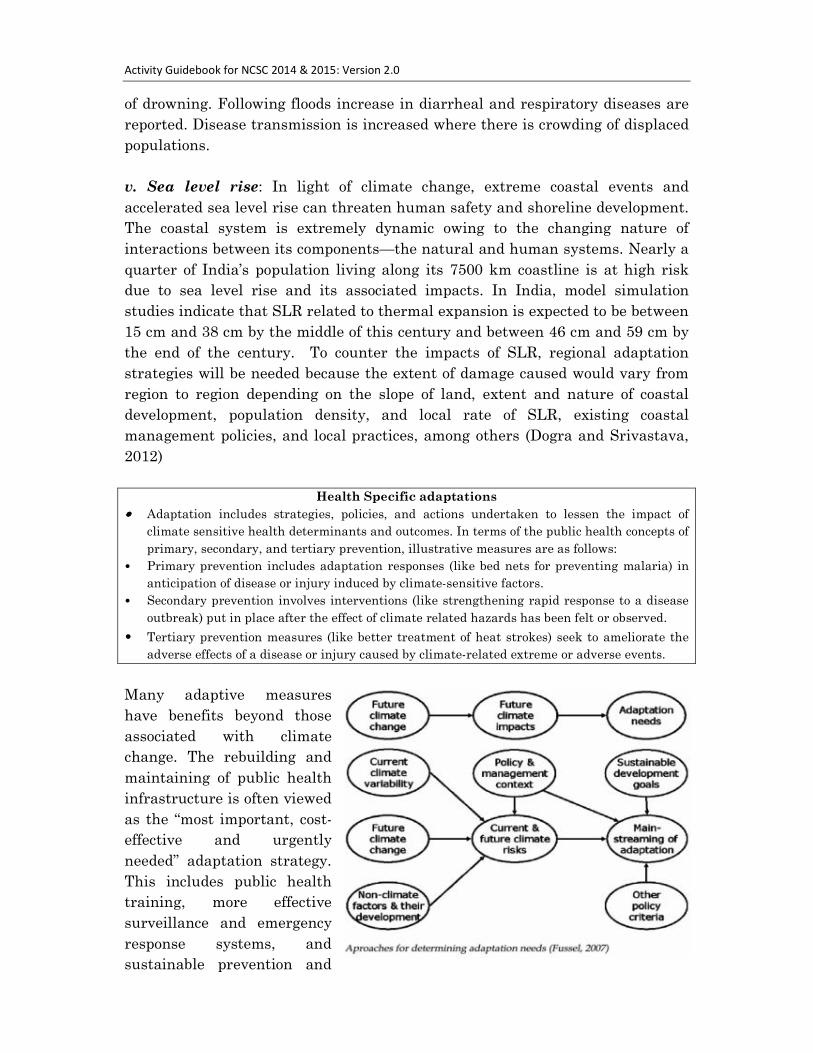
Activity Guidebook for NCSC 2014 & 2015: Version 2.0
136
of drowning. Following floods increase in diarrheal and respiratory diseases are
reported. Disease transmission is increased where there is crowding of displaced
populations.
v. Sea level rise: In light of climate change, extreme coastal events and
accelerated sea level rise can threaten human safety and shoreline development.
The coastal system is extremely dynamic owing to the changing nature of
interactions between its components—the natural and human systems. Nearly a
quarter of India’s population living along its 7500 km coastline is at high risk
due to sea level rise and its associated impacts. In India, model simulation
studies indicate that SLR related to thermal expansion is expected to be between
15 cm and 38 cm by the middle of this century and between 46 cm and 59 cm by
the end of the century. To counter the impacts of SLR, regional adaptation
strategies will be needed because the extent of damage caused would vary from
region to region depending on the slope of land, extent and nature of coastal
development, population density, and local rate of SLR, existing coastal
management policies, and local practices, among others (Dogra and Srivastava,
2012)
Health Specific adaptations
•••• Adaptation includes strategies, policies, and actions undertaken to lessen the impact of
climate sensitive health determinants and outcomes. In terms of the public health concepts of
primary, secondary, and tertiary prevention, illustrative measures are as follows:
• Primary prevention includes adaptation responses (like bed nets for preventing malaria) in
anticipation of disease or injury induced by climate-sensitive factors.
• Secondary prevention involves interventions (like strengthening rapid response to a disease
outbreak) put in place after the effect of climate related hazards has been felt or observed.
• Tertiary prevention measures (like better treatment of heat strokes) seek to ameliorate the
adverse effects of a disease or injury caused by climate-related extreme or adverse events.
Many adaptive measures
have benefits beyond those
associated with climate
change. The rebuilding and
maintaining of public health
infrastructure is often viewed
as the “most important, cost-
effective and urgently
needed” adaptation strategy.
This includes public health
training, more effective
surveillance and emergency
response systems, and
sustainable prevention and
Activity Guidebook for NCSC 2014 & 2015: Version 2.0
137
control programs.
Adaptation measures recommended for India include, among other aspects, the
following: awareness; capacity building of individuals, communities, and
institutions; disease and vector surveillance; preparedness for disaster
management, development of early warning systems as well as strengthening of
primary and secondary health-care facilities.
Suggested Projects
Project 1. Mapping of weather-related disease patterns in your locality
Background
Weather and climate affect the social and environmental determinants of health
particularly food sufficiency, safe drinking water, clean air and secure shelter. Weather
variations heavily impact the health of people and climate change has an amplifying
effect.Climate change affects disease dynamics directly (heat waves on stress induced
strokes) and indirectly (increased activity of disease transmitting vectors). It is expected
that, due to weather patterns, diseases alter their range, intensity, and timing.
It is imperative to develop measurable indicators of health impacts. Such assessments
would not only augment our understanding of the relationship between climate and
health but also help in designing better adaptation strategies. Mapping is a important
tool to gather information in its spatial dimensions and to help understanding spatial
interrelationship among various map-able parameters leading to planning process.
Detailed maps of such climate change-induced hot spots for all the sectors need to be
developed, as health risks are linked with food, water, environment, and socio-economic
conditions (Dogra and Srivastava, 2012).
Many national level disease maps were prepared by different agencies in our country.
Dengue and chikungunya epidemics in addition to malarial outbreaks with changing
types and forms have been major problems for the public healthcare system in India
that killed thousands of people in the past few years. Environmental determinants and
man-made factors have favourable to the breeding of Aedesspp, the mosquito responsible
for the spread of these dreaded diseases. In 2012, chikungunya hit 18 Indian states with
14, 277 clinically conformed cases while dengue was reported from as many as 24 states
with 37,070 confirmed cases (Palaniyandi, 2012). Based on the data, disease maps are
prepared which provide clear idea of disease intensity.
Objectives
• To identify diseases occurrence in your locality from secondary sources
• To collect the daily, weekly and monthly weather data (temperature, rainfall,
humidity, etc.) of minimum five years period for your locality.
• To draw disease mapping based on the weather patterns in your locality
Methodology:

Activity Guidebook for NCSC 2014 & 2015: Version 2.0
138
1. The periodic collection of the secondary data on various diseases prevalent in the
study area collected from different levels such as primary health centers or
Government hospitals, Private medical centers and also from the local
pharmacies for last five years.
2. Develop the questionnaire and collect data in relation to disease conditions in the
last five years from minimum 200 households at random in your locality. From
the individual data, a common data sheet to be prepared for analysis.
3. Collect the weather data of study area from local weather station or other
authenticated data sources for last five years
4. Collect the base map of your locality from any authenticated sources. Prepare the
disease maps based on the different seasons of your locality with gradations.
Interpretation
1. Correlate the season-wise weather parameters with disease occurrence and find
out significant association between weather changes and cluster of diseases.
2. Study the changes in the weather conditions of the study area and impact on
diseases condition in your locality.
3. Based on the results, prevention, preparedness, medications and warming
systems may be recommended.
Project 2. Incidences of sunstroke in your locality
Background
During summer, most areas of India
also experience episodes of heat
waves every year causing sunstroke,
dehydration and death. In the
national context, a number of
studies in India show that the
country has been experiencing
extreme weather events for the past
few decades, particularly after the
1990s. An analysis of daily
climatological heat index (HI: combining temperature and humidity) over 41 districts
well distributed over the country indicated that maximum HI exceeding 45°C
characterizes many districts during March to May and also during June to September.
On the other hand, the wind chill index (combining temperature and wind speed) is less
than 10°C for a very few districts of northern India mainly in winter (January -
February) and the post-monsoon period (October–December). In 1998, major parts of
north India and the northern parts of peninsular India experienced severe heat wave.
During the second half of May, the heat wave was one of the severest ones seen in the
last 50 years and led to the deaths of more than 2600 people. It is interesting to note
that mortalities due to both heat waves and cold waves were highest in India in 2003 as
compared to other years (Dogra and Srivastava, 2012).
Activity Guidebook for NCSC 2014 & 2015: Version 2.0
139
Recently many cases of sunstroke were reported in the media. Such cases were never
reported in the past as revealed from published literature, old hospitals records and
senior citizen of the locality. So we consider it as problem to be investigated, in order to
take precautions in the future to avoid such incidences.
Objectives
• To understand sunstroke and it consequences
• To identify area from secondary sources and published data where incidences of
sunstroke has been reported
• To collect the daily weather data of summer months for last five years for that
area
• To draw relationships between weather and sunstroke and recommend
precautions
Methodology
1. Collect of the secondary data on incidence of sunstroke in the study area from
different levels such as primary health centers or Government hospitals, private
medical centers and also from the local doctors and pharmacies of last five years
2. Develop the questionnaire and collect data in relation to sunstroke in the last
five years from household survey at random in the study area. From the
individual data, a common data sheet to be prepared for analysis
3. Collect the weather data of study area from local weather station or other
authentic data sources of last five years
4. Compare and analyze the weather and sunstroke data
Interpretation
1. To understand the indicators of sunstroke
2. Interpret the weather parameters on annual basis in relation to the occurrence of
sunstroke
3. Investigate whether there is any direct relationship between nature of work, life
styles, habits or place and sunstroke
4. Identify the precautions that can be taken to avoid sunstroke
5. Based on the results, recommendations may be drawn which include prevention,
preparedness, first-aid and warming system
Project 3. Prevalence of dengue fever in your locality. Is it weather related?
Background
Dengue fever is a mosquito-borne viral disease estimated to infect about 50-100 million
worldwide every year, of which 25,000 are fatal. Global incidence has risen rapidly in
recent decades with some 2.5 billion people, over half of the world's population, now at
Activity Guidebook for NCSC 2014 & 2015: Version 2.0
140
risk, mainly in urban centers of the tropics and subtropics. Demographic, societal and
weather changes, in particular urbanization, globalization, and increased international
travel, are major contributors to the rise in incidence and geographic expansion of
dengue infections. Major research gaps continue to hamper the control of dengue
(Wilder-Smith et al., 2012).
The spatial distribution of the main dengue vector, Aedesaegypti, has also increased over
the last 25 years. Increase in both, dengue incidence and A. aegypti distribution have
also been associated to variations in the climate system, including climate change. The
evidence of the effects of climate drivers on dengue incidence is still under debate
(Colo´n-Gonza´lez et al., 2013). Therefore, the present work is undertaken at local level
to find out the relation between weather conditions and dengue infection.
Objectives
• To collect information on the occurrence of dengue in a locality from various
published or authentic secondary sources available from different levels of last
five years.
• To collect the daily, weekly and monthly weather data (temperature, rainfall,
humidity, etc.) of five years for the study area.
• To study weather indicators that may influence dengue transmission dynamics in
a locality.
• To compare and analyze the weather data with infection pattern in the study
area.
• To develop a comprehensive, early warning based on the results of data analysis.
• To determine the most useful and cost-effective predictive factors for dengue.
Methodology
1. The periodic collection of the secondary data on dengue prevalent in the study
area collected from different levels such as primary health centers or
Government hospitals, private medical centers and also from the local
pharmacies of last five years.
2. Design and develop the questionnaire and collect data in relation to occurrence of
dengue in the last five years from a minimum of 200 households at random from
the study area. Fromthe individual data sheet, a common data sheet to be
prepared for analysis.
3. Collect the weather data of study area from local weather station or other
authentic data sources of last five years.
4. Compare and analyze the survey data with weather conditions data. Conclude
and infer on the basis of analysis.
Interpretation
1. Compare weather parameters with dengue occurrence and find out significant
association between weather changes and dengue.
Activity Guidebook for NCSC 2014 & 2015: Version 2.0
141
2. Study the changes in the weather conditions of the study area and find out
impact of dengue in the same.
3. Based on the results, recommendations may be drawn which include prevention,
preparedness, medications and warming systems.
List of Projects
1. Mapping of weather related diseases in your locality
2. Studies on prevalence of vector-borne diseases (malaria / dengue)
3. Occurrence of communicable diseases due to extreme weather conditions
4. Effect of temperature and humidity changes on incidences of skin diseases
5. Impact of weather on production and/or health of animals
6. Effect of extreme weather on the health of women and children
7. Effect of summer, winter and monsoon on incidence of respiratory diseases
8. Effect of heat on the health of farmers / industrial workers in your area
9. Studies on weather patterns and income loss of workers with daily wages
10. Studies on air-borne infections during variable weather conditions
Glossary of technical words
Adaptation isadjustment in natural or human systems to a new or changing
environment. Adaptation to climate change refers to adjustment in response to actual or
expected climatic stimuli or their effects, which moderates harm or exploits beneficial
opportunities. Various types of adaptation can be distinguished, including anticipatory
and reactive adaptation, public and private adaptation, and autonomous and planned
adaptation.
Adaptive capacity describes the general ability of institutions, systems and
individuals to adjust to potential damages, to take advantage of opportunities or to cope
with the consequences of climate change in the future.
Climate: Climate in a narrow sense is usually defined as the ‘average weather’, or more
rigorously, as the statistical description in terms of the mean and variability of relevant
quantities over a period of time ranging from months to thousands or millions of years.
These quantities are most often surface variables such as temperature, precipitation,
and wind. Climate in a wider sense is the state, including a statistical description, of the
climate system. The classical period of time is 30 years, as defined by the World
Meteorological Organization (WMO). In short, climateis the average state of the
atmosphere and the underlying land or water in a specific region over a specific time
scale.

Activity Guidebook for NCSC 2014 & 2015: Version 2.0
142
Climate change refers to any change in climate over time, whether due to natural
variability or as a result of human activity. Climate change is also defined as a
statistically significant variation in either the mean state of the climate or in its
variability, persisting for an extended period (typically decades or longer).
Climate model is a numerical representation of the climate system based on the
physical, chemical, and biological properties of its components, their interactions and
feedback processes, and accounting for all or some of its known properties. Climate
models are applied, as a research tool, to study and simulate the climate, and also for
operational purposes, including monthly, seasonal, and inter-annual climate predictions.
Climate prediction or climate forecast is the result of an attempt to produce an
estimate of the actual evolution of the climate in the future, e.g., at seasonal, inter-
annual or long-term time scales.
Climate projection isthe calculated response of the climate system to emissions or
concentration scenarios of greenhouse gases and aerosols, or radiative forcing scenarios,
often based on simulations by climate models. Climate projections are distinguished
from climate predictions, in that the former critically depend on the
emissions/concentration/radiative forcing scenario used, and therefore on highly
uncertain assumptions of future socio-economic and technological development.
Climate-sensitive disease is a disease that is sensitive to weather or climate factors,
with the current spatial distribution and seasonal transmission being affected.
Communicable disease is an infectious disease caused by transmission of an infective
biological agent (virus, bacterium, protozoan, or multi-cellular macro-parasite).
Comparative risk assessment,as defined by WHO is the systematic evaluation of the
changes in population health that result from modifying the population’s exposure to a
risk factor or a group of risk factors.
Coping capacity isthe means by which people or organizations use available resources
and abilities to face adverse consequences that could lead to a disaster. In general, this
involves managing resources, both in normal times as well as during crises or adverse
conditions. The strengthening of coping capacities usually builds resilience to withstand
the effects of natural and human induced hazards.
Drought is the phenomenon that exists when precipitation is significantly below
normal recorded levels, causing serious hydrological imbalances that often adversely
affect land resources and production systems.
Endemic (of a disease or condition) is the one that is regularly found among particular
people or in a certain area.

Activity Guidebook for NCSC 2014 & 2015: Version 2.0
143
Environmental burden of disease is the burden of disease caused by environmental
factors estimated using methods described by WHO.
Epidemicis widespread occurrence of an infectious disease in a community at a
particular time.
Extreme weather event is an event that is rare within its statistical reference
distribution at a particular place. By definition, the characteristics of what is called
“extreme weather” may vary from place to place. An “extreme climate event” is an
average of a number of weather events over a certain period of time, an average which is
itself extreme (e.g., rainfall over a season).
Health is a state of complete physical, mental and social well being and not merely the
absence of disease or infirmity (WHO, 1946).
Health impact assessment is a systematic process to assess the actual or potential,
and direct or indirect, effects on the health of individuals, groups or communities arising
from policies, objectives, programs, plans or activities.
Health risk assessment is the process of estimating the potential impact of a
chemical, biological, physical or social agent on a specified human population system
under a specific set of conditions and for a certain time-frame.
HVI heat vulnerability index
IPCC Intergovernmental Panel on Climate Change
Malaria is an endemic or epidemic parasitic disease caused by species of the genus
Plasmodium (Protozoa) and transmitted by mosquitoes of the genus Anopheles;
produces bouts of high fever and systemic disorders, affects about 300 million and kills
approximately 2 million people worldwide every year.
Morbidity is the rate of occurrence of disease or other health disorders within a
population, taking account of the age-specific morbidity rates. Morbidity indicators
include chronic disease incidence/prevalence, rates of hospitalization, primary care
consultations, disability-days (days of absence from work), and prevalence of symptoms.
Mortality is the rate of occurrence of death within a population. Calculation of
mortality takes account of age-specific death rates, and can thus yield measures of life
expectancy and the extent of premature death.
Outbreak is a sudden occurrence of something unwelcome, such as disease.
Pandemic(of a disease) is the one that is prevalent over a whole country or the world.
Activity Guidebook for NCSC 2014 & 2015: Version 2.0
144
Vector is a blood-sucking organism, such as an insect, that transmits a pathogen from
one host to another.
Vector-borne diseases are the diseases transmitted to the hosts by a vector organism
(such as a mosquito or tick); e.g., malaria, dengue and leishmaniasis.
Vulnerability is the degree to which a system is susceptible to, and unable to cope
with, adverse effects of climate change, including climate variability and extremes.
Vulnerability is a function of the character, magnitude, and rate of climate change and
variation to which a system is exposed, its sensitivity, and its adaptive capacity.
Weather describes the day-to-day changes in atmospheric conditions in a specific place
at a specific time. More simply, climate is what you expect and weather is what you get.
Zoonosis or Zoonotic diseases refer to diseases that can be passed from animals,
whether wild or domesticated, to human beings.
Health Tips for summer season-
Prickly heat
• Intake of fluid with salt and lesser sugar
• Bathing twice or thrice
• Loose fitting light coloured cotton clothes
• Avoid applying prickly heat powder
• Application of sandal paste
• Drink butter milk and coconut water
• Avoid soft drinks
Activity: Collect more information on existing traditional health tips and practices
and validate
References
Bentham, G., Langford, I.H. 2001. Environmental temperatures and the incidence of
food poisoning in England and Wales. International Journal of Biometeorology 45: 22-
26.
Burke J. 2010. Hundreds Die in Indian Heatwave. The Guardian - news paper 30 May.
Available: http://www.guardian.co.uk/world/2010/may/30/india-heatwave-deaths
[accessed on 07 May 2014].
Bush, K.F., Luber, G., Kotha, S.R., Dhaliwal, R.S., Kapil, V., Pascual, M., Brown, D. G.,
Frumkin, H., Dhiman, R.C., Hess, J., Wilson, M.L., Kalpana B., Eisenberg, J., Kaur,
T., Rood, R., Batterman, S., Joseph, A., Gronlund, C. J., Agrawal, A and Hu, H., 2011.
Impacts of Climate Change on Public Health in India: Future Research Directions.
Environmental Health Perspectives 119 (6): 765-770.
Colo´n-Gonza´lez, F.J., Fezz,i C., Lake, I.R and Hunter, P.R. 2013. The Effects of
Weather and Climate Change on Dengue. PLoSNegl Trop Dis7(11): e2503.
DOI:10.1371/journal.pntd.0002503

Activity Guidebook for NCSC 2014 & 2015: Version 2.0
145
DhingraN, Jha P, Sharma VP, Cohen AA, Jotkar RM, Rodriguez PS, et al. 2010. Adult
and child malaria mortality in India: a nationally representative mortality survey.
Lancet 376: 1768–1774.
Dogra N. and Srivastava, S., 2012.Climate Change and Disease Dynamics in India
[executive summary]. New Delhi: The Energy and Resources Institute (TERI), 27p.
Füssel, H.M., 2007. Adaptation planning for climate change: concepts, assessment
approaches and key lessons. In: Sustainability Science. vol. 2.pp. 265–275.
Hashizume, M., Armstrong, B., Hajat, S., Wagatsuma, Y., Faruque, A.S., Hayashi, T.,
Sack, D.A. 2007. Association between climate variability and hospital visits for non-
cholera diarrhoea in Bangladesh: effects and vulnerable groups. International Journal of
Epidemiology 36: 1030-1037.
INCCA, 2010.Climate Change and India: A 4x4 Assessment- A Sectoral and Regional
Analysis for 2030s. INCCA: Indian Network for Climate Change Assessment, Report
No.2, Ministry of Environment & Forests, Government of India, 160p.
IPCC Intergovernmental Panel on Climate Change. 2007. Climate Change 2007:
Synthesis Report. Contribution of Working Groups I, II and III to the Fourth
Assessment Report of the Intergovernmental Panel on Climate Change (Core Writing
Team, Pachauri RK, Reisinger A, eds). Geneva:Intergovernmental Panel on Climate
Change.
Kovats, R.S., Edwards, S.J., Charron, D., et al. 2005. Climate variability and
campylobacter infection: an international study. International Journal of
Biometeorology 49: 207-214.
Kumar A, Valecha N, Jain T, Dash AP. 2007. Burden of malaria in India: retrospective
and prospective view. Am J Trop Med Hyg 77(6 suppl):69–78.
Mandal K. 2008. Drinking Water Supply vis-a-vis Technological Interventions for
Social Empowerment of Rural India. Available: http://www.nistads.res.in/indiasnt2008/
[accessed on 07 May 2014].
Jerrett, Michael, Jason G. Su, Colleen E. Reid, Bill Jesdale, Alberto M. Ortega
Hinojosa, Seth B.Shonkoff, Edmund Seto, Rachel Morello-Frosch (University of
California, Berkeley). 2012. Mapping Climate Change Exposures, Vulnerabilities, and
Adaptation to Public Health Risks in the San Francisco Bay and Fresno Regions.
California Energy Commission. Publication number: CEC-500-2012-041.
Naish,S., Pat Dale, P., Mackenzie, J.S., McBride, J., Mengersen, K and Tong,S., 2014
Climate change and dengue: a critical and systematic review of quantitative modelling
approaches. BMC Infectious Diseases 2014 14:167
M. Palaniyandi, M., 2012. GIS for epidemic control in India. Geospatial World Weekly
22 July 2013 at ttp://www.geospatialworld.net/Paper/Application/ArticleView.aspx aid=
30612 [Accessed on 08-05-2014]
Tuan, L., 2013. Adaptation to Climate Change for Improving Public Health in Vietnam
– Commentary. Vietnam Journal of public health 1(1):9-11.
Wilder-Smith, A., Renhorn, KE., HasithaTissera, H., Bakar, S.A., Luke Alphey, L.,
Kittayapong, P., Lindsay, S., Logan, J., Hatz, C., Reiter, P., Rocklo, J., Byass, P., Louis,

Activity Guidebook for NCSC 2014 & 2015: Version 2.0
146
V.R., Yesim Tozan, Y., Massad, E., Tenorio, A., Lagneau, C., L’Ambert, G., Brooks, D.,
Wegerdt, J and Gubler, D., 2012. Dengue Tools: innovative tools and strategies for the
surveillance and control of dengue. Glob Health Action5: 17273 - DOI:
10.3402/gha.v5i0.17273.
WHO, (2003). Social determinants of health: the solid facts, Wilkinson R G, Marmot M
G (eds), World Health Organization, Copenhagen.
WHO. (World Health Organization). 2008. World Malaria Report 2008. Geneva:WHO.
WHO, 2014. Media Centre - Climate change and health - Fact sheet N°266 – Key facts
http://www.who.int/mediacentre/factsheets/fs266/en/ [Accessed on 08-05-2014]

Activity Guidebook for NCSC 2014 & 2015: Version 2.0
147
Additional project ideas from the National Orientation Workshop. – Sub Theme
2
1. Loss of forest/wilderness areas in the locality
2. Loss of water bodies with time
3. Changes in cropping pattern in the locality
4. loss of mangrove forest in coastal area and possible impact in terms of coastal
erosion
5. The effect of mangrove loss on the impact of cyclone in the coastal area.
6. Food wastage and carbon footprint
7. Life style and carbon foot print
8. Afforestation and carbon footprint
9. Use of fuel in industry and impact on weather and climate.
10. Artificial fish culture, fertilizing water and GHG emission
11. Use of bio waste as compost and reduction in carbon footprint
12. Replacement of non biodegradable plates, cups etc with biodegradable to
reduce carbon footprint
13. Use of bicycle in the place of motorised vehicle and reduction in carbon
footprint
14. Energy saving devises to reduce GHG emission
15. Use of natural light in place of artificial light.
16. Landscape /Land use changes in relation to past climate change for your
locality.
17. Studies on heat production by air condition systems in any study area and
analyzing alternatives.
18. Estimation of temperature in industrial / mining areas and its impact.
19. Monitoring air and water pollution in your locality.
20. Comparison of nature of houses (in terms of materials used, ventilation etc.)
their design in terms of heat absorption and other weather parameters.
21. Study the impact of developmental activities on the micro climate/weather of
your locality and compare the data with nearby areas not affected by the
developmental activity.
22. Analysis of pre and post harvest (paddy crop) air quality in an area and study
variations in different localities having visible weather conditions (this can be
done by having children from different localities and conducting simultaneous
observations in different locations with the same parameters)
23. Study the impact of vehicular pollution on micro climate at tourist destinations
with reference to pre-tourist seasons, tourist season and post tourist season.
24. To study the carrying capacity of micro water sheds / local entrepreneurs in
assisting pilgrims/tourists on religious routes and study seasonal variations,
damages to eco systems, pollution etc.
25. Study the solid waste random disposal /landfill and its effect on nearby water
resources and remedial measures.
26. Study the change in land use and land cover in your areas and its impact on

Activity Guidebook for NCSC 2014 & 2015: Version 2.0
148
climatic conditions.
27. Effect of coral and sand mining from sea shores and its changing impact with
changing weather.
28. Study the impact of over exploitation of sand mining on various environmental
parameters like water table, temperature of water in water bodies, change in
quality of water, (physical, chemical, biological parameters) and larger impact
on cropping/agriculture, livelihoods.
29. Impact of changing weather, climate on the mangrove forests, density, eco
system as a whole.
30. Impact of tourism on local weather, resources etc.
31. Impact of glass claddings in modern buildings – study of micro climate inside
versus ordinary buildings.
32. Impact of charcoal making (Prosopisjuliflora) on wild life.
33. Study the impact of multi-storied buildings on the local wind velocity and
sunlight intensity, temperature, humidity etc.
List of Projects suggested - Sub Theme 3
1. Studies on micro arthropods / flora and fauna profiles and its seasonal
variations in your study area.
2. Animal behavior as weather indicators – Collection of traditional experience
and scientific validation.
3. Study of the growth rate of invasive (example Parthenium) species and its
seasonal variations in your area and studying their adaptation capacities for
adverse weather conditions in comparison to major crops.
4. Study of group migration of animals/birds/fish/plants and correlating the
same with observed weather change / extreme weather events.
5. Study of Pond/Lake eco systems – temperature, water levels with reference to
rain fall, study of life forms during various seasons (fish, frog, fresh water
snakes, birds, aquatic plants, quality of water across seasons / varying
temperatures / varying turbidity, etc.
6. Study of sacred groves – seasonal variations of life forms biomass, micro
climate studies, interrelationships within the eco system, etc.
7. Study of coastal eco systems – Change of tides, High Tide Line, Low tide line
over the years and its impact on coastal eco system, life forms, habitats
etc.(Can be carried out as a combination of measuring tides – measured over
two to three months - and also oral interviews with elderly fishermen in the
area)
8. Study the impact of temperature variation on floral diversity and behavior of
plants in an area.
9. Study of phonological changes in a rich biodiversity area with respect to
changing weather/season.

Activity Guidebook for NCSC 2014 & 2015: Version 2.0
149
10. Study of flora and fauna of a wetland in your locality and study seasonal
changes if possible.
11. Study of aquatic and terrestrial ecosystems in terms of physical, chemical and
biological parameters with respect to seasonal changes.
12. Study of shells and shell fragments from sea beaches and study seasonal
variations in their diversity.
13. Study of fish catch in a coastal area and study the seasonal variations,
quantum of catch and economic implications with respect to changing
weather, seasons. (also oral interviews with elderly fishermen in the area).
14. Study of primary productivity in a pond ecosystem.
15. Study of carbon sequestration in pond/lake eco systems by studying bottom
sediments.
16. Study of carbon sequestration in forest/grasslandsoil.
17. Study/measurement of canopy cover in different seasons of a forest
(alternatively dense vegetation, sacred groves, large trees, school campus,
parks etc.)
18. Study of a tree as an eco system more specifically a habitat – seasonal
changes and changing diversity in niche specialization.
19. Study of sediment transport in a drainage channel/catchment by stakes-high
measurement over seasons. (Eutrophication)
20. Impact of climatic variations of agro-forestry in an area.
21. Impact of rainfall variability on production of crops of an area.
22. Study of insect diversity of a grassland eco system (alternatively in wet land /
dry land etc.)
23. Estimation of biomass in a grass species over the seasons.
24. Study of cow dung droppings and its disintegration as an indicator of soil
microbial health.
25. Estimation of micro fauna of a desert eco system.
26. Study of bird migration due to weather / climate shift.
27. Study of changing housing patterns on sparrow population in a city.
28. Study of wetlands reclamation and its impact on micro climates, birds and
other life forms – seasonal studies.
29. Study the impact of salty rains on the loss of grasslands in Banni region in
Gujarat,-impact of weather and climate.
30. Study the impact of changing weather and climate on the eastern Himalayan
glaciers
31. Study of local streams and seasonal variations and its impact on local
agricultural practices. (Flow rates can be studied as small experiments )
32. Study on impact analysis of deforestation on soil and nutrient loss due to
heavy rainfall and runoff in a simulated situation.
33. Effect of the pattern of weather parameters such as Rain, Temperature, Wind
and Humidity on
34. Abundance of various Insects and weather changes.
35. Changes of Behaviour of insects with respect to weather parameters
Activity Guidebook for NCSC 2014 & 2015: Version 2.0
150
36. Relationship between Dragon fly population changes and rainfall
37. Relationship of movement of social insects and weather parameters
38. Behaviour of birds in relation to the weather parameters
39. Behavior and movement of spider in relation to the weather parameters
40. Abundance and breeding of frogs in relation to the weather parameters
41. Variation in weather and climate Vs. presence and absence/ abundance of
plants such as weeds
42. Behavior of domestic animals in relation to the weather parameters
43. Seasonality of occurrence of plants
44. Weather pattern and flowering of plants
45. Soil Organisms and weather pattern
46. Fish migration and weather pattern/ tide pattern
47. Fish catch and weather pattern
48. Seasonality in fish catch
49. Seasonality of behavior of costal animals / tide pattern
50. Weather parameters and abundance of mushroom
51. Variable weather conditions can affect quality of air, water and soil. Some of
the changes are measurable such as measuring pH amount of dissolved salts
in water, organic matter in soil etc.
52. Quality of air in terms of air pollutants such as Carbon dioxide, methane, NOX
content in different seasons
53. Soil pH in different places/ different time.
54. Water pH in different places/ different time / rain water
55. Determination of dissolved minerals in different water samples in your locality
56. Comparing water quality before and after rain
57. Determination of organic matter present in soil in different periods of time.
58. Weather and soil erosion
59. Effect of light period, light intensity, atm. temperature, humidity and soil
moisture on growth of plants.
60. Stomatal count for as surrogate for the production of Oxygen – comparison of
different plants
61. Calculation of Carbon sequestration in different urban and rural gardens
62. Relation between Wind pattern and seed production in wind dispersed seeds.
63. Relation between wind pattern and flowering of anemophilic plants.
64.
65. Study on earthworm, wasp, ant and other insects under changing environment
due to change in climate and weather.
66. Litter disintegration studies in mono-crop and multi-crop soils
67. Impact of agricultural practices on soil faunal density and diversity
68. Soil faunal migrations in water logged paddy fields…. (pre-monsoon -
monsoon - post monsoon)
69. Crustacean larvae in estuaries (pre-monsoon - monsoon - post monsoon
comparison)
Activity Guidebook for NCSC 2014 & 2015: Version 2.0
151
70. Human adaptation in various ecosystems to food and livelihood….
Additional Project Ideas from the National Brainstorming Workshop. Sub Theme 4
Additional Project Ideas from the National Brainstorming Workshop. Sub Theme 5.
1. Using sun’s heat to dehydrate vegetables to prolong their shelf life and get a better price.
2. Study on the effect of different sowing dates on the growth, flowering and yield of paddy (or
of any other crop)
3. Impact of pollution on soil health
4. Study of climate, weather versus vegetation changes in an area.
5. Organic versus in-organic agriculture – Comparative Studies related to performance in
adverse weather and climatic conditions.
6. Study of traditional water harvesting and irrigation techniques and their relevance in
changing weather and climatic conditions.
7. Impact of micro climate on various parameters of a crop including yield, total biomass
production etc.
8. Effect of late monsoon on cropping pattern in your locality.
9. Change in irrigation pattern due to change in climatic conditions.
10. Impact of rainfall and temperature on horticulture and agricultural crops with special
reference to Apple scab disease.
11. Analysis of parameters of weather conditions on controlled and open agriculture.
12. Measuring the water holding capacities of terraces in hills/micro water sheds and relating
this to growth of vegetation/crops on different terrace systems.
13. Study the effect of “rab” method (burning dried leaves, twigs, bark, cowdung cakes soil layer
etc which is a practice of soil preparation during March throughout Konkan area of
Maharashtra before sowing rice).
14. Study the performance of different varieties of different crops which are adapted to extreme
weather conditions like drought or water logging, increased temperature etc.
15. Comparative study of mixed cropping systems with that of mono culture in terms of total
yield, total biomass yield, soil fertility etc. before and after cropping.
16. Study of mixed grains agriculture in Kutch region of Gujarat (Mixed grains are Isabgol, Jeera,
Til, Jowar, Moong and Bajra which are sown together. As the weather changes, different
crops grow at different times depending on the gestation period of them. Effect of weather
and climate on yield can be studied. This kind of method is called “sukhikheti” which does
not need irrigation and tilling carried out by camels).
17. To measure impact of sunlight on the growth of crops in different types of soil.
18. Study the impact of changing weather and climatic conditions on Makhana/Sugarcane
cultivation in North Bihar and UP.
19. Study of salt farms in coastal areas of Kutch in different seasons.
20. Study of various soil moisture retaining techniques and comparing those (mulching, drip
irrigation etc.)
21. Study of cropping pattern of a particular region as influenced by different seasons in the
year (why a particular crop is grown in a particular season only?)
22. Effect of weather parameters on various crop stages.

Activity Guidebook for NCSC 2014 & 2015: Version 2.0
152
23. Study of performance of hybrid livestock versus traditional livestock in terms of input costs
versus output.
24. Study of effect of heavy rainfall on different crop stages and its effect on production.
25. Study of the effect of dry spells on different crop stages and ultimate effect on production.
26. Study of soil parameters (physical, chemical and biological) in changing weather extremes
and its correlation with plant production, crop yields etc.
27. Study of recommended practices (Agricultural University, KVK etc.) like ideal dates of
sowing, distance of planting, pest/disease calendar etc. and documenting actual practices in
field and their rationale with reference to changing weather/climate.
28. Effect of changing weather and climate on crop diseases, pest occurrence, emergence of old
diseases/pests, whether minor pests emerging as major pests etc.
29. Study of different weeds with reference to changing weather on occurrence, growth,
flowering and reproduction (overall life cycle)
30. Studies on effect of weather and climate on different crops/grain storage
techniques/practices.
31. Study of modern agricultural practices which contribute for increasing levels of GHGs – eg.
Deep ploughing, using high inputs like chemical fertilizers, pesticides, weedicides, farm
machinery etc.
32. Study of innovative crop practices adapting to changing weather, climate and identifying
components which are critical for improved performance in adverse weather and climatic
conditions.
33. Study of sericulture in changing weather/climatic conditions.
34. Study of changing weather and climatic conditions on floriculture.
35. Comparative study of System of rice intensification (SRI) of paddy cultivation with
conventional paddy cultivation with respect to less water intensive method.
36. Study of impact of weather and climate change in the traditional paddy cum fish culture in
the Zino valley of Arunachal Pradesh.
37. Study of Jhum cultivation and its impacts on change of weather and climate of your locality.
38. Study of the practice of burning the stock of sugar cane on the next crop in Tamilnadu.
39. Study the impact of bio-char on crop growth and soil parameters.
40. Study of short term vegetable cultivation versus long term crops as a strategy to cope with
changing weather/ climate. (green vegetable cultivation).
41. Residual moisture based farming – Suitability for post monsoon crop.
42. Analysis of yield and quality of spices due to weather/climate change in hilly regions with
special relevance to onset of South west monsoon.

Activity Guidebook for NCSC 2014 & 2015: Version 2.0
153
ANNEXURE - I
Pond Measurements:
Implementing pond management practices necessitates knowing the surface area and volume
of the water impoundment. Aquatic herbicide applications, fish stocking rates and
fertilization treatments are prescribed on the basis of area and/or volume of the pond.
you can measure your own pond by following the steps listed below. To assure accuracy, take
all measurements carefully and carry all calculations to at least four or five decimal places
(i.e., 0.11478 acres). After the final calculation has been performed, round the number to one
decimal place.
Surface Area
Shoreline measurements are made with a tape measure or by pacing, and are then used in the
appropriate formula below.
If the pond is rectangular or square, use the following formula:
Length, in feet x Width, in feet
Surface area, in acres = ----------------------------------------
43,560 sqft / acre
Example: (Figure A)
80 feet X 140 feet
---------------------------- = 0.2571acre, or approximately 1/4 acre
43,560 sqft / acre
Figure A
If the pond is circular or nearly so, use this formula to determine surface area:
(total feet of shoreline) squared
Surface area, in acres = -------------------------------------
547,390

Activity Guidebook for NCSC 2014 & 2015: Version 2.0
154
Example: (Figure B)
(520 feet) X (520 feet)
------------------------------ = 0.4939 acre, or approximately 1/2 acre
547,390
Figure B
Many ponds are irregularly-shaped, which makes the area measurements more difficult. In
this case, approximate the pond shape as a square, rectangle or circle by measuring boundary
lines that most nearly represent the actual shoreline.
Example: This pond shape can be approximated as a rectangle (Figure C).
Length, in feet x Width, in feet 250 X 120
Surface area, in acres = ---------------------------------------- = -------------------
43,560 sqft / acre 43,560
= 0.6887 acre
Figure C

Activity Guidebook for NCSC 2014 & 2015: Version 2.0
155
Volume Measurements
Calculating the total volume of water in the pond is a two-step process:
Step 1: Determine average depth of the pond by taking uniformly-spaced soundings over the
entire pond surface. This can be done from a boat, or during the winter when ice covers the
entire surface. The measurements can be taken with a long pole, chain or weighted rope
marked off in feet. At least 15 measurements should be taken. Add the measurements and
divide by the number of measurements taken.
Example:
Average depth = (2+3+5+8+9+1+4+6+9+0+1+2+3+3+8)/ 15
64
= ---------- = 4.27 feet
15
Step 2: Once you have determined average depth and surface area, acre-feet are determined
by multiplying the two measurements:
Volume, in acre-feet = Surface area, in acres X Average depth, in feet
Example: A 1.5-acre pond has an average depth of 4.27 feet.
Acre-feet = 1.5 acres X 4.27 feet = 6.405 acre-feet
Measuring Small Areas Within a Pond
Some pond management activities involve the treatment of only a portion of the water
impoundment. In these situations, the same formulas are used but the treatment area
dimensions are much smaller.
Example: A pond owner desires to treat a 50' x 100' swimming area for algae, using a rate of
2.7 pounds (equivalent to 1 part per million) of copper sulfate per acre-foot (Figure D).
Figure D
50 X 100
Surface area to be treated = ________ = 0.11478 acres
43,560
1 + 2 + 3 + 5 + 2 + 3 + 4

Activity Guidebook for NCSC 2014 & 2015: Version 2.0
156
Average depth of swimming area = _________________________ = 2.8571 feet
7
Acre-feet in the swimming area = 0.11478 X 2.8571 = 0.32794 acre-feet
Amount of cooper sulfate to use = 0.32794 acre-feet X 2.7 lbs per acre-foot
= 0.88542 lbs of copper sulfate in swimming area
= 0.9 lbs

Activity Guidebook for NCSC 2014 & 2015: Version 2.0
157
ANNEXURE – II
CONVERSION TABLE
Units of Length
To
calculate:
Multiply
measurement
in: ↓
inches feet yards miles centimeters meters kilometers
inches by → 1 0.08333 0.02777 0.0000158 2.54 0.0254
0.0000254
feet by → 12 1 0.33333 0.000189 30.5 0.305 0.000305
yards by → 36 3 1 0.000567 91.5 0.915 0.000915
miles by → 63,400 5,280 1,760 1 161,000 1,610 1.61
centimeters
by → 0.394 0.0328 0.01093
0.00000621 1 .01 0.00001
meters by → 39.4 3.28 1.093 0.000621 100 1 0.001
kilometers
by → 39,400 3,280 1,093 0.621 100,000 1,000 1
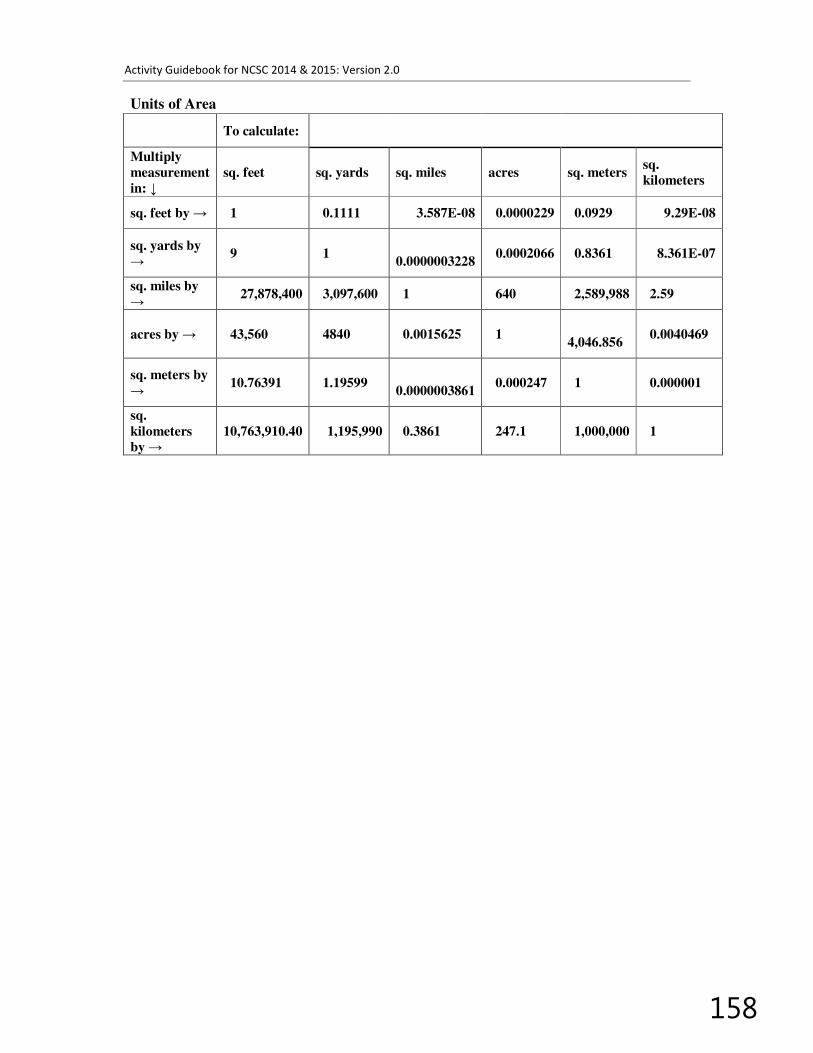
Activity Guidebook for NCSC 2014 & 2015: Version 2.0
158
Units of Area
To calculate:
Multiply
measurement
in: ↓
sq. feet sq. yards sq. miles acres sq. meters sq.
kilometers
sq. feet by → 1 0.1111 3.587E-08 0.0000229 0.0929 9.29E-08
sq. yards by
→ 9 1
0.0000003228 0.0002066 0.8361 8.361E-07
sq. miles by
→ 27,878,400 3,097,600 1 640 2,589,988 2.59
acres by → 43,560 4840 0.0015625 1
4,046.856 0.0040469
sq. meters by
→ 10.76391 1.19599
0.0000003861 0.000247 1 0.000001
sq.
kilometers
by →
10,763,910.40 1,195,990 0.3861 247.1 1,000,000 1

Activity Guidebook for NCSC 2014 & 2015: Version 2.0
159
Units of Volume (cubes)
To
calculate:
Multiply
measurement
in: ↓
cubic
inches cu. feet cu. yards
cu.
centimeters cu. meters
cubic inches
by → 1 0.0005787 0.000021433 16.387 1.639E-05
cu. feet by → 1728 1 0.037037 28,316.85 0.028317
cu. yards by
→ 46,656 27 1 764,554.86 0.764555
cu.
centimeters
by →
0.0610237 3.53147E-
05 1.30795E-06 1 0.000001
cu. meters by
→ 61,023.70 35.3147 1.30795 1,000,000 1
ounces by → 1.8047 0.0010444 0.00003868 29.5735 2.957E-05
quarts by → 57.75 0.03342 0.00123778 946.353 0.0009464
pints by → 28.875 0.01671 0.00061889 473.176 0.0004732
gallons by → 231 0.13368 0.00495113 3,785.41 0.0037854
liters by → 61.0237 0.0353147 0.00130795 1,000 0.001
Units of Volume (containers)
To
calculate:
Multiply
measurement
in: ↓
Ounces quarts pints gallons liters
cubic inches
by → 0.554113 0.017316 0.034632 0.004329 0.016387
cu. feet by → 957.5 29.922 59.844 7.48052 28.3168
cu. yards by
→ 25,852.70 807.896 1,615.79 201.974 764.555
cu.
centimeters
by →
0.033814 0.0010567 0.00211338 0.000264172 0.001
cu. meters by
→ 33,814 1,056.69 2,113.38 264.172 1,000
ounces by → 1 0.03125 0.0625 0.0078125 0.0295735
quarts by → 32 1 2 0.25 0.946353
pints by → 16 0.5 1 0.125 0.473176
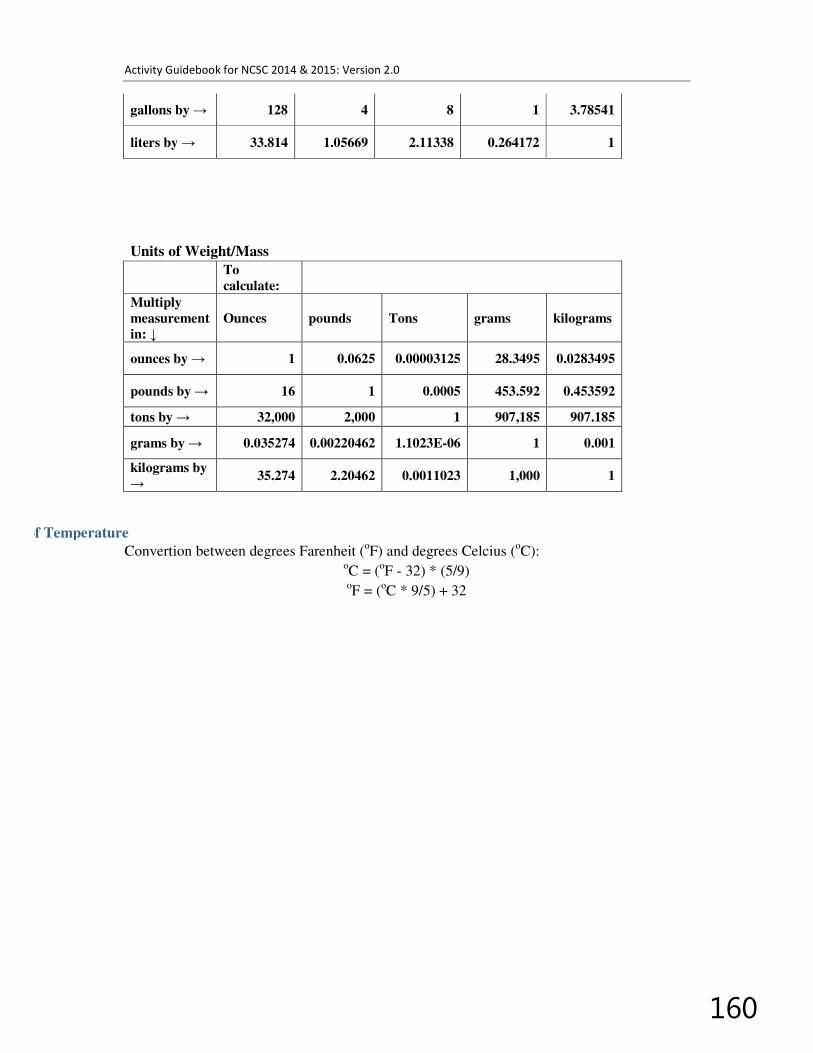
Activity Guidebook for NCSC 2014 & 2015: Version 2.0
160
gallons by → 128 4 8 1 3.78541
liters by → 33.814 1.05669 2.11338 0.264172 1
Units of Weight/Mass
To
calculate:
Multiply
measurement
in: ↓
Ounces pounds Tons grams kilograms
ounces by → 1 0.0625 0.00003125 28.3495 0.0283495
pounds by → 16 1 0.0005 453.592 0.453592
tons by → 32,000 2,000 1 907,185 907.185
grams by → 0.035274 0.00220462 1.1023E-06 1 0.001
kilograms by
→ 35.274 2.20462 0.0011023 1,000 1
Units of Temperature
Convertion between degrees Farenheit (oF) and degrees Celcius (
oC):
oC = (
oF - 32) * (5/9)
oF = (
oC * 9/5) + 32