activity-based performance management at strategic
TRANSCRIPT

Activity-based performance management at
Strategic Logistical Alliance
SJ Spratt Hons. B. Corn.
12127841
Mini-dissertation submitted in partial fulfilment of the requirements for the degree
Master of Commerce in Management Accounting at the Potchefstroom Campus of
the North-West University
Supervisor: FJ Bibbey
November 2006
Potchefstroom

ACKNOWLEDGEMENTS
I hereby wish to express my sincere appreciation towards:
My Jesus, my Saviour, Lord there is none like You. 'Thank you for your grace
and for granting me with this opportunity. Thank you for blessing me with
wisdom and strength to complete this study. You are my awesome King of Love.
Mr. F.J. Bibbey, my supervisor, for his valuable assistance, guidance, leadership
and encouragement throughout this study. I really appreciate your advice, time
and interest.
My colleagues at Strategic Logistical Alliance. Thank you for your time during
the structured interviews and thank you for your interest and understanding.
Mr. J. Blaauw for the language editing of the mini-dissertation.
Mrs. E. Roodt of the Ferdinand Postma Library for her friendly assistance with
literature searches.
My parents, Pat and Rina Spratt. Thank you for your love and support and for
always believing in me. I appreciate your moral and financial support throughout
my studies. I love you.
Antonie, Patrick and Jani for your support, motivation and understanding.
My friends, for your interest, prayers and support.
Psalm 37:3-4
Trust in the LORD and do good; dwell in the land and enjoy safe pasture.
Delight yourself in the LORD and he will give you the desires of your hart.
ABSTRACT
In the era of competitive global environment and technology-based
organisations, managers are pressured to find ways to maintain their competitive
advantage. Management has the responsibility to maintain their competitive advantage
whilst maintaining the profitability of the organisation. This responsibility includes
decisions regarding the retention of profitable customers, and the minimisation of costs
to improve profitability of services. The analysis of cost and profitability of individual
services and customers represents a critical issue with which Strategic Logistical
Alliance (SLA) should be concerned
SLA has proved to be a market leader within the logistics services market whilst
maintaining profitability in most of its core business functions, with the exception of the
warehousing and distribution function. The reasons for a lack of profitability in the
warehousing and distribution function are inadequate planning, controlling and
decision-making within these functions. The main reasons for these problems are
incorrect cost allocations, the non-reflection of the true cost of activities, unprofitable
pricing and the lack of effective performance management.
'The primary objective of this study is to analyse the existing cost allocation system, the
cost management system and the performance management system of SLA, focusing
on the warehousing and distribution functions. The study addresses the shortcomings
of the existing system and recommends activity-based performance management as a
possible solution. To achieve this primary objective, a number of secondary objectives
were relevant.
The research was conducted at SLA in Gauteng. The research comprised a literature
study and an empirical survey using structured interviews to obtain information from
relevant staff and managers. 'The err~pirical study was further extended by obtaining
permission from top management to gather information by observation of activities and
processes carried out by staff in the warehouse and distribution function.
For management of SLA to achieve their goal of becoming a profitable leading
third-party logistical service provider, a combination of tools should be used, which
include activity-based costing, cost management and performance management.
Activity-based performance management will enable management to gain useful
information for decision-making to achieve their goal.

OPSOMMING
In die era van die mededingende wgreldwye omgewing en tegnologiegebaseerde
organisasies is bestuurders onder druk om wyses te vind waarop hulle hul
mededingende voorsprong kan handhaaf. Bestuur is daarvoor verantwoordelik om
hul mededingende voorsprong te behou terwyl hulle terselfdertyd ook die
winsgewendheid van die organisasie handhaaf. Hierdie verantwoordelikheid behels ook
besluite oor die behoud van winsgewende kliente en die minimalisering van koste om
die winsgewendheid van dienste te verbeter. Die ontleding van die koste en
winsgewendheid van individuele dienste en kliente verteenwoordig 'n kritieke kwessie
waarby Strategic Logistical Alliance (SLA) betrokke behoort te wees.
SLA het hulself bewys as 'n markleier in die logistiekdienste-mark terwyl hulle
terselfdertyd winsgewend heid in die meeste van hul kern besig heidsfun ksies hand haaf,
met die uitsondering van hul pakhuis-en-verspreidingsfunksie. Die redes vir die gebrek
aan winsgewendheid in die pakhuis-en-verspreidingsfunksie is ontoereikende
beplanning, beheer en besluitneming binne hierdie funksie. Die hoofrede vir hierdie
probleme is foutiewe kostetoedelings, die nie-weerspieeling van die ware koste van
aktiwiteite, nie-winsgewende prysvasstelling en die gebrek aan doeltreffende
prestasiebestuur.
Die primere doelstelling van hierdie studie is om die bestaande kostetoedelingstelsel,
die kostebestuurstelsel en die prestasiebestuurstelsel van SLA te ontleed, met die fokus
op die pakhuis-en-verspreidingsfunksie. Die studie handel met die tekortkominge van
die bestaande stelsel en beveel aktiwiteitsgebaseerde prestasiebestuur as 'n moontlike
oplossing aan. Om hierdie primere doelstelling te verwesenlik, is daar ook 'n aantal
sekondere doelstellings wat betrokke is.
Die navorsing is gedoen by SLA Gauteng. Die navorsing het bestaan uit 'n
literatuurstudie en 'n empiriese opname met gebruik van gestruktureerde onderhoude
om inligting van toepaslike personeel en bestuurders te verkry. Die empiriese studie is
verder uitgebrei deur toestemming van die topbestuur te verkry om inligting te versamel
deur waarneming van aktiwiteite en prosesse wat personeel in die pakhuis-en-
verspreidingsfunksie uitvoer.

Vir die bestuur van SLA om hul doelstelling te verwesenlik om 'n winsgewende,
toonaangewende derdeparty-verskaffer van logistiekdienste te word, moet 'n
kombinasie van hulpmiddels aangewend word, wat aktiwiteitsgebaseerde
kostebepaling, kostebestu~lr en prestasiebestuur insluit. Aktiwiteitsgebaseerde
prestasiebestuur sal bestuur in staat stel om nuttige inligting in te win met die oog op
besluitneming ten einde hul doelstelling te verwesenlik.
LIST OF ABBREVIKTIONS USED
ABC - Activity-Based Costing
ABM - Activity-Based Management
AGOA - African Growth and Opportunity Act
BPR - Business process reengineering
BSC - Balanced Scorecard
EBlT - Earnings before Interest and Taxes
ED1 - Electronic Data Integration
EDA - Estimated Times of Arrival
ETD - Estimated Times of Departures
EVA - Economic Value Added
GAAP - Generally Accepted Accounting Principles
IS0 - lnternational Standards Organisation
INCO - lnternational Cooperation
ITAC - lnternational Trade Administration Commission
IT - Information Technology
.IIT - Just-in-time
LCC - Life cycle costing
MCE - Manufacturing Cycle Efficiency
NPV - Net Present Value
POD - Proof of delivery
PMS - Performance Measurement System
RI - Residual Income
ROI - Return on Investment
ROS - Return on Sales
SARS - South African Revenue Services
SLA - Strategic Logistical Alliance
TC - Target costing
TQM - Total quality management
USA - United States of America
WACC - Weighted Average Cost of Capital
WIP - Work in progress
vii
-. ---- --

LIST OF FIGURES
Figure 2.1 : Activity-based costing
Figure 2.2: An illustration of the two-stage allocation process for traditional
and activity-based costing systems
Figure 2.3: The activity-based costing model
Figure 3.1 : Product life-cycle phases: relationship between costs
committed and costs incurred.
Figure 3.2: The relationship between target and kaizen costing
Figure 3.3: Warehouse layout before BPR
Figure 3.4: Warehouse layout after BPR
Figure 3.5: The effect of quality costs on quality of compliance
Figure 3.6: The value chain
Figure 3.7: The integration between benchmarking and improvement
Figure 4.1 : The balanced scorecard
Figure 4.2: Delivery cycle time and throughput time
Figure 5.1 : Current process flow of the warehouse and distribution function
Figure 6.1: Process flow of the warehouse and distribution function
Pane
12
. . . Vlll

LIST OF TABLES
Pane
Table 4.1 : Six-dimensional performance matrix: non-financial measures
of performance
Table 4.2: BSC for SLA's warehouse and distribution function
Table 5.1: Ranking of major elements of the warehouse and
distribution's strategy
Table 5.2: Ranking of major key elements of the warehouse and
distribution's performance management.
LIST OF DIAGRAMS
Diagram 5.1 : The current position of the respondents
Diagram 5.2: Years of experience in the logistics industry
Diagram 5.3: Number of years worked for SLA
Diagram 5.4: Room for improvement regarding the profitability of the
warehouse and distribution function
Diagram 5.5: Number of employees in the warehouse and distribution
function
Diagram 5.6: Current use of an activity-based costing system
Diagram 5.7: The system currently used to allocate costs
Diagram 5.8: Effectiveness of the current cost allocation system
Diagram 5.9: Implementation of a formal system in the next two years
Diagram 5.1 0: Value-adding activities
Diagram 5.1 1 : Opi~iion on whether cost sliould be allocated to activities
Diagram 5.12: The use of ABC to determine the service fee more
accurately
Diagram 5.1 3: Changing to an ABC system
Diagram 5.14: The use of cost management tools
Diagram 5.1 5: 'The use of a formal performance management system
Diagram 5.16: Implementing performance management in the next two
years
Diagram 5.1 7: lmportance of competence
Diagram 5.18: Used as a measurement
Diagram 5.1 9: lmportance of quality of service
Diagram 5.20: Used as a measurement
Diagram 5.21 : lmportance of flexibility
Diagram 5.22: Used as a measurement
Diagram 5.23: lmportance of resource utilisa'tion
Diagram 5.24: Used as a measurement
Diagram 5.25: lmportance of innovation
Diagram 5.26: Used as a measurement
Diagram 5.27: Financial measures used for the warehouse and
distribution function
Pane
97
98
98
LIST OF DIAGRAMS (CONTINUED)
Diagram 5.28: Performance evaluation
Diagram 5.29: Training courses
Diagram 5.30: Employee informed about performance management
Diagram 5.31 : Opinion of the balanced scorecard
Diagram 5.32: Managing performance in the warehouse by using the
BSC
Diagram 5.33: Will performance management affect profitability
positively?
Diagram 5.34: Changing to the balanced scorecard

TABLE OF CONTENT
I . INTRODUCTION AND OBJEC'TIVE OF THE STUDY
1 . 1 SUGGESTED TITLE ............................................................................................... 1
1.2 BACKGROUND AND INTRODUCTION ................................................................. 1
1.2.1 The business vision of SLA .......................................................................... 2 ............................................................................... 1.2.2 Services offered by SLA 2
......................................................................................... 1.2.3 Business process 3 1.2.4 Leveraging technology ................................................................................ 6 1.2.5 SLA 's client approach ................................................................................. 6
1.3 PROBLEM STATEMENT ........................................................................................ 7
1.4 STUDY OBJECTIVE ............................................................................................... 8
1.4.1 Primary objective .......................................................................................... 8 1.4.2 Secondary objectives ................................................................................... 8
1.5 HYPOTHESIS ......................................................................................................... 9
1.6 METHOD OF RESEARCH ...................................................................................... 9
............................................................................................. 1.6.1 Literature study 9 1.6.2 Empirical study and field of research ............................................................ 9
.............................................................................. 1.7 CHAPTER CLASSIFICATION 10
2 . ACTIVITY-BASED COSTING AND ACTIVITY-BASED MANAGEMENT
2.1 INTRODUC'I-ION .................................................................................................. 11
2.2 DEFINI1-ION OF ABC ........................................................................................... 11
2.3 ABC VERSUS TRADITIONAL COSTING ............................................................. 13
2.3.1 Simple example to compare traditional costing with activity-based ........................................................................................................ costing 15
............................................................ 2.4 IMPLEMENTATION OF AN ABC MODEL 17
.................................................................................... 2.4.1 Identifying activities 17 2.4.2 Assigning costs to activity cost centres ...................................................... 19 2.4.3 Selecting appropriate cost drivers for assigning the cost of activities to
................................................................................................ cost objects 19 2.4.4 Assigning the cost of the activities to products or services ......................... 20 2.4.5 An example of implementing activity-based costing ................................... 21
xii
TABLE OF CONTENT (CONTINUED)
2.5 ADVANTAGES AND DISADVANTAGES OF -THE ABC APPROACH .................. 25
2.5. I Advantages of activity-based costing ......................................................... 25 2.5.2 Disadvantages of activity-based costing .................................................... 26
2.6 ACTIVITY-BASED MANAGEMENT ...................................................................... 27
2.6. I Defining activity-based management (ABM) .............................................. 28 2.6.2 Principles of activity-based management ............................................... 29
2.7 THE ACTIVITY-BASED COS'TING AND ACTIVITY-BASED MANAGEMENT MODEL ................................................................................................................. 31
............................................................................................................ 2.8 SUIWMARY 33
3 . COST MANAGEMENT
3.2 DEFINING COST MANAGEMENT ....................................................................... 35
3.2. I Life-cycle costing (LCC) ............................................................................. 36 3.2.2 Target costing (TC) .................................................................................. 39
3.2.2.1 An example of target costing in the warehouse and distribution function ....................................................................... 40
3.2.2.2 Value engineering ......................................................................... 41
3.2.3 Kaizen costing .......................................................................................... 42 3.2.4 Activity-based management (ABM) ............................................................ 44 3.2.5 Business process reengineering (BPR) ...................................................... 45
3.2.5.1 An example of BPR in the warehouse and distribution function .... 46
3.2.6 Cost of quality and Total Quality Management (TQM) ............................... 47 3.2.7 Cost management and the value chain ...................................................... 51 3.2.8 Benchmarking .......................................................................................... 55 3.2.9 Just-in-time system (JI T ) ............................................................................ 58
3.2.9.1 Just-in-time and value-adding activities ........................................ 59 3.2.9.2 Just-in-time purchasing arrangements .......................................... 60 3.2.9.3 Just-in-time performance measurement ....................................... 61
3.3 SUIWMARY ............................................................................................................ 62
xiii

TABLE OF CONTENT (CONTINUED)
4 . PERFORMANCE MEASUREMENT AND PERFORMANCE MANAGEMENT
4.2 PERFORMANCE MEASUREMENT ..................................................................... 65
4.2.1 Financial measures .................................................................................... 65
.......................................................... . 4.2.1 1 Return on investment (ROI) 66 4.2.1.2 Residual income (RI) .................................................................... 67 4.2.1.3 Economic value added (EVA) ....................................................... 68 4.2.1.4 Profit-based financial performance measurements ....................... 70
4.2.2 Non-financial measures .............................................................................. 72
4.3 PERFORMANCE MANAGEMENT ....................................................................... 76
4.3. I Defining the Balanced Scorecard ............................................................... 77 4.3.2 The four perspectives of the BSC ............................................................... 79
4.3.2.1 Financial perspective .................................................................... 79 4.3.2.2 Customer perspective ................................................................... 80 4.3.2.3 Internal business perspective ....................................................... 81 4.3.2.4 Post-sales service processes ....................................................... 85 4.3.2.5 Learning and growth perspective .................................................. 85
4.3.3 Implementing the balanced scorecard ........................................................ 87 4.3.4 An example of implementing the balanced scorecard ............................... 89 4.3.5 Key elements of the balanced scorecard ................................................... 91 4.3.6 Critical analysis of using a BSC .................................................................. 92
......................................... 4.3.6.1 Advantages of the balanced scorecard 92 4.3.6.2 Disadvantages of the balanced scorecard .................................... 93
............................................................................................................ 4.4 SUMMARY 94
5 . EMPIRICAL STUDY
5.1 INTRODUC'I'ION .................................................................................................. 96
5.2 ANALYSIS OF THE QUESTIONNAIRE ................................................................ 97
5.2. I Section A - Personal background .............................................................. 97 5.2.2 Section B - Background to the warehouse and distribution function .......... 99 5.2.3 Section C - Fundamentals ....................................................................... 102
.......................................................................................................... 5.3 SUMMARY 133
xiv

TABLE OF CONTENT (CONTINUED)
6 . CONCLUSIONS AND RECOMMENDATIONS
6.1 INTRODUCTION ................................................................................................ 135
6.2 ACTIVITY-BASED COSTING AND ACTIVITY-BASED MANAGEMENT ............ 136
. . ............................................................................... 6.2.1 Actrvrty-based costing 136 6.2.2 Activity-based management ..................................................................... 138
6.3 CONCLUSIONS AND RECOMMENDATIONS REGARDING COST MANAGEMENT .................................................................................................. 139
...................................................................................... 6.3. I Life cycle costing 139 .......................................................................................... 6.3.2 Target costing 140
.................................................................................... 6.3.3 Value engineering 140 .......................................................................................... 6.3.4 Kaizen costing 141
6.3.5 Business process reengineering .............................................................. 141 ......................................... 6.3.6 Cost of quality and Total Quality management 150
........................................................................................ 6.3.7 The value chain 150 .......................................................................................... 6.3.8 Benchmarking 151
............................................................................................... 6.3.9 Just-in-time 151
6.4 CONCLUSIONS AND RECOMMENDATIONS REGARDING PERFORMANCE MEASUREMENT AND PERFORMANCE MANAGEMENT ... 152
...................................................................... 6.4.1 Performance measurement 152
6.4.1 . 1 Financial performance measures ................................................ 153 ......................................... 6.4.1.2 Non-financial performance measures 155
6.4.2 Performance management ...................................................................... 157
6.4.2.1 The balanced scorecard ............................................................. 158
6.5 SUMMARY .......................................................................................................... 161
APPENDIX A: QUESTIONNAIRE .............................................................................. 163
BIBLIOGRAPHY ......................................................................................................... 182

CHAPTER 1
INTRODUCTION AND OBJECTIVE OF THE STUDY
1 .I SUGGESTED TITLE
Activity-based performance management at Strategic Logistical Alliance
1.2 BACKGROUND AND INTRODUCTION
Established in August 1996, Strategic Logistical Alliance (SLA) is a South African-based
third-party logistics provider operating around the globe through a network of more than
130 offices worldwide. Ownership of the business is held equally between management
and listed Italian corrlpany Savino del Bene, which has held interests in SLA since April
1999.
Based on innovation and a determination to deliver, SLA's business activities are
focused on providing an integrated logistics service to a range of business sectors.
Information technology (IT) plays a key role in realising this ambition, enabling full
control of all consignments, from collection (at the factory) to the point of delivery (SLA,
2006).
SLA's approach is one of partnership, ensuring an understanding of clients' needs and
the development of customised solutions. Something that attests to their quest for
quality is the fact that SLA obtained international standards organisation (ISO) 9002
listing in 1997, and they have maintained this status ever since (SLA, 2006).
SLA state ,that they strive to deliver the right logistics answer for every business they
serve. They are not constrained by traditional methodologies and conventions.
Instead, they thrive on thinking outside the box, applying the intellectual capital within
the business to design and irr~plement the best solution for every situation (SLA, 2006)

1.2.1 The business vision of SLA
SLA is committed to become and remain the number one third-party logistics service
provider in the local South Africa market. To this end they offer a range of standard-
setting logistics services that consistently exceed customer expectations, whether
implemented independently or as part of an integrated logistics solution (SLA, 2006).
1.2.2 Services offered by SLA
Collection
SLA controls the client's consignment through the whole of the logistics chain,
from the supplier to the recipient.
Expediting and forwarding (irnportlexport)
SLA's advanced computer-tracking system ensures the visibility of every
consignment throughout the logistics chain - a system that can be viewed on-line
24 hours a day, seven days a week. SLA also handles all the requisite
doc~~mentation - including instructions to expedite orders; routing orders; packing
lists/commercial invoices; ELIRllcertificates of origin; African Growth and
Opportunity Act (AGOA) registration in the United States of America (USA);
export clearances in countries of origin; air waybillslocean bills of lading; import
clearances; and statements of landed cost per unit.
Customs clearance
SLA has extensive clearing expertise. This, they say, together with a reputation
for compliance with customs and excise rules and regulations, has earned SLA
the trust and respect of customs offices across South Africa. SLA handles all
customs and excise matters, including obtaining clearances and permits,
applications, registrations, payments and rebates (SLA, 2006).

SLA also has experience in issues relating to the Department of Trade and
lndustry and the South African Revenue Service - including managing the
formalities and applying for refunds and drawbacks on behalf of importers. SLA
is familiar with the Motor lndustry Development Programme, and has the
know-how to manage the paperwork and administration for eligible exporters of
motor vehicles.
Warehouse management
SLA controls inventory in both their bonded warehouse (a warehouse at SLA's
premises, but under customs control) and their non-bonded warehouse (a
warehouse at SLA's premises, but not under customs control) by bar-coding and
scanning all consignments received, storage bins and consignments issued.
This allows for electronic management of the documentation and enables goods
to be tracked and traced at any stage in the process.
Local distribution
SLA delivers imports to their client's doors, striving to do so promptly and
cost-effectively.
1.2.3 Business process
Leg 1 : Origin Pick-Up
As the pick-up and placement of cargo at the relevant airport or port is the first
and vital step in the seamless flow of a shipment, SLA assumes responsibility for
this leg. SLA's extensive global presence allows them to co-ordinate shipments
according to each individual customer's tailor-made needs (SLA, 2006).
SLA also state (SLA, 2006) that they ensure that they understand their client's
country of origin pick-up requirement. SLA's central database is kept up to date
with each supplier's address details and any special requests which need to be in
place to stack cargo. SLA oversees that all the necessary equipment is in place
at the supplier's premises to load any abnormal cargo. SLA provides their
customers with relevant information regarding ETD (estimated times of
departure) for all carriers and ensure that the placement of cargo for export will
meet the required service level.
Leg 2: Origin Handling
SLA's overseas are responsible for processing overseas export formalities and
shipping documentation. SLA's overseas network was founded more than 90
years ago and it has achieved a high level of acknowledgement among customs
and port authorities in the relevant countries. Likewise, SLA respects their
partners for their high standards and expertise, which allow SLA complete peace
of mind.
Leg 3: Carrier Air and Sea
Whether SLA's clients require shipment by air, sea or road, containerised,
breakbulk (when a co~isolidated shipment arrives at the destination terminal, the
carrier must break down the many shipments in the vehicle for dispatch to the
individual consignees) or specialised, SLA advises on a continuous basis
regarding the features and benefits of the different modes of transport (SLA,
2006). SLA's priority is to ensure that their clients' uniq~re requirements are met
and that they are guided with regard to costs, risks factors and the relevant
shipping terms. Through the global network and secure relationships with
leading carriers, SLA offers its clients the buying power to manage ,their total
landing costs. Whilst their cargo is on the road, in the air or at sea, clients have
the benefit of track and trace systems that enable access to the status of
shipments (SLA, 2006).

Leg 4: Destination Handling
SLA is accredited with the South African Revenue Services (SARS). SLA has
expert knowledge of local airline procedures and South African Port Authority
requirements. SLA branches are strategically placed in Elandsfontein, Durban,
Cape Town and Port Elizabeth. Their operational staff specialises in and are
acknowledged for their dedication and hands-on approach. All premises boast
de-grouping, unpacking and bonded warehousing facilities (SLA, 2006).
Leg 5: Customs Clearing
SLA has extensive expertise in Customs Clearance (SLA, 2006). SLA records a
complete database of products and tariff codes, ensuring the accurate
processing of clearance documentation. SLA is EDI-compliant (electronic data
integration-compliant) which means that SLA guarantee entry release within 24
hours from submission. SLA has vast experience in managing
refundsldrawbacks (like customs stop or customs examination) and other
complex procedures with the International Trade Administration Commission of
SA (ITAC) or SARS. SLA is proud to have been chosen by SARS to be part of
the export pilot initiative regardirrg paperless F178 (SLA, 2006).
Leg 6: Warehousing
SLA operates beyond traditional boundaries to customise warehousing
requirements. SLA's information technology professionals design unique,
integrated electronic management system to streamline ordering and distribution
processes. SLA is the first logistics specialist in South Africa to obtain
permission from SARS to operate their computerised record-keeping system for
bonded warehouses. This system manages bonded warehouses and allows for
goods to be traded out of the bonded store on demand, whilst still complying with
SARS requirements (SLA, 2006).

Leg 7: Delivery
State of the art dispatch radios, cellular communication and satellite vehicle
tracking facilitate constant contact with SLA's fleet of vehicles, ensl-ring absolute
and time-bound efficiency (SLA, 2006).
1.2.4 Leveraging technology
Advanced information technology, developed by SLA, holds the key to the efficient
rendering of their services (SLA, 2006). Their extensive in-house information
technology department has the proven capacity and skill to develop proprietary
systems, both for SLA's purposes and to fulfil their client's specific needs.
1.2.5 SLA '3 client approach
SLA's approach is to understand their client's
required service levels and cycle times,
the volumes they move,
suppliers and end users,
lncoterms (developed by the Paris-based International Chamber of Commerce in
1936, lncoterms are internationally accepted rules defining trade terms (Coyle et
a/., 2003:388)), and
existing and potential problem areas, before devising the best solution for its
clients.
Only by understanding their clients' needs (as listed above) can SLA provide a
comprehensive door-to-door logistics service, complete with all the required paperwork,
leaving their clients to focus on their core business (SLA, 2006).

SLA currently serves a broad cross-section of industries, including 'the motor industry
(Nissan, Fiat, Ford, etc.), textiles, information technology, earthmoving equipment,
chemicals and plastics, tyres (Michelin, Pirelli, Yokohama), food products, paper,
cosmetics, catering equipment, petrochemicals, paper pulp, white goods, aviation,
ammunition, gaming and forklifts.
1.3 PROBLEM STATEMENT
SLA (2006) is committed to become and remain the number one third-party logistics
provider in the South African market. To this end SLA offers a range of standard-setting
logistics services that consistently exceed customer expectations, whether implemented
independently or as part of an integrated logistics solution. SLA is also committed to
delivering imports to their client's doors promptly and cost-effectively. SLA sets high
standards for itself, but these standards can only be achieved if the company is
profitable and financially successful.
In the era of competitive global environment and technology-based
organisations, managers are press~~red to find ways to maintain their competitive
advantage. Management has the responsibility to maintain their competitive advantage
whilst maintaining the profitability of the organisation. This responsibility includes
decisions regarding the retention of profitable customers, and the minimisation of costs
to improve profitability of services. The analysis of cost and profitability of individual
services and customers represents a critical issue with which SLA should be concerned
SLA has proved to be a market leader within the logistics services market whilst
maintaining profitability in most of its core business functions, with the exception of the
warehousing and distribution function. The reasons for a lack of profitability in the
warehousing and distribution function are inadequate planning, controlling and
decision-making within these functions. The main reasons for these problems are
incorrect cost allocations, the non-reflection of the true cost of activities, unprofitable
pricing and the lack of effective performance management.
1.4 STUDY OBJECTIVES
1.4.1 Primary objective
The primary objective of this study is to analyse the existing cost allocation system, the
cost management system and the performance management system of SLA, focusing
on the warehousing and distribution functions. The study will address the shortcomings
of the existing system and recommend Activity-Based Performance Management as a
solution.
1.4.2 Secondary objectives
Secondary objectives include the following:
1. To implement activity-based performance management systems effectively and
efficiently so as to ensure business success through continuous improvement.
2. To improve existing cost management systems and measure performance in
order to achieve an overall competitive advantage. (How can existing cost
management systems be modified and improved to optimise their effectiveness?)
3. To implement an activity-based performance management system to assist
management in decision-making, planning and controlling, by providing timely
and useful information to ensure accurate cost allocation, the ability to determine
the true cost of activities and facilitating performance management.

1.5 HYPOTHESIS
With the goal of becoming and remaining the number one third-party logistical services
provider in South Africa, SLA should focus on two strategic means to achieve and
sustain competitive advantage. The first of these is the achievement of high-quality
service levels, and the second a competitive pricing structure.
For management of SLA to achieve their goal of becoming a profitable leading
third-party logistical service provider, a combination of tools should be used, which
include activity-based costing, cost management and performance management.
Activity-based performance management will enable management to gain useful
information for decision-making to achieve their goal.
1.6 METHOD OF RESEARCH
1.6.1 Literature study
The study involved in-depth literature research of activity-based and performance
management systems, tools and relevant aspects by consulting books, journal articles,
the internet and other relevant sources.
1.6.2 Empirical study and field of research
Relevant information was obtained from SLA by means of an empirical study.
Structured interviews were used to obtain information from relevant staff and managers.
Permission to gather information by observation of activities and processes carried out
by staff in the warehouse was obtained from top management.
After completion of the questionnaires, information was analysed, followed by final
conclusions and recommendations for SLA.

1.7 CHAPTER CLASSIFICATION
Chapter 1: Introduction and objective of study. This chapter sets the background
for the study, giving a scenario for SLA. The problem statement, objective of the study,
hypothesis and method of research is set out.
Chapter 2: Activity-based costing and Activity-based management. A theoretical
framework of activity-based costing as a system is provided. A comparison between
activity-based costing and traditional costing is made. 'The steps necessary to
implement an activity-based costing system are explained and the advantages and
disadvantages of an activity-based costing system evaluated. Lastly the activity-based
costing and activity-based nianagement model is explained.
Chapter 3: Cost Management. A theoretical consideration of cost management is
provided. Different types of cost management tools are defined and evaluated.
Chapter4: Performance measurement and performance management. A
theoretical framework of Performance measurement; focussing on financial and
non-financial performance measurement, is provided. A theoretical framework for
performance mansrgement is discussed, foc~~ssing on the balanced scorecard in order
to link financial and non-financial measures. The steps necessary to implement the
balanced scorecard will be explained, key elements of the balanced scorecard will be
discussed and the advantages and disadvantages of the balanced scorecard will be
evaluated. The need to manage performance within SLA will be emphasised.
Chapter 5: Empirical study. The empirical study is set out. Findings are set out
and analysed.
Chapter 6: Conclusions and recommendations. Conclusions and
recommendations are made with regards to the activity-based performance
management in SLA.
Appendix
Bibliography

CHAPTER 2
ACTIVITY-BASED COSTING AND ACTIVITY-BASED MANAGEMENT
2.1 INTRODUCTION
The analysis of cost and profitability of individual products, services, and customers
represents a critical issue with which companies should be concerned and one where
activity-based costing (ABC) tries to help.
The shortcomings of traditional costing systems, in terms of validity, accuracy,
completeness, consistency, understanding and relevance, increased the need of
companies to refine their costing system. ABC evolved from the 1960s and the 1980s
and became one of the main ways in which companies around the globe refined their
costing systems.
ABC focuses on what is important for the organisation, and on what information is
needed to help management understand cost behaviour and absorption by
productlservices in order to make better decisions about pricing and to understand
exactly where to take actions that will drive profits. ABC does not only focus on
financial information for internal reporting but also focuses on non-financial information.
2.2 DEFINITION OF ABC
ABC is a costing method based on the principle that products and/or services require an
organisation to carry out activities and that those activities require of an organisation to
incur costs. In ABC, systems are designed so that any costs that cannot be directly
accredited to a product or service flow into the activities that makes ,the cost necessary.
The cost of each activity then flows to the product(s) or service(s) that make the activity
necessary, based on their particular use of that activity (Hicks, 1999:6 and
Griful-Miquela, 2001 :I 35).

ABC is a method of measuring the cost and performance of activities, and cost objects.
ABC assigns costs to business processes, also called activities, based on their use of
resources. The costs incurred by business processes are assigned to cost objects (i.e.
products, services, customers, etc.) based on their consumption of these processes
(activities). ABC recognises the fundamental relationship between cost drivers and
business processes (Sedgley & Jackiw, 2001 :369).
According to Horngren et a/. (2006:144-145), ABC refines a costing system by focusing
on individual activities as the essential cost objects. An activity is an event, task or unit
of work with a particular purpose; for example, designing products, setting up machines,
operating machines, and distributing products. ABC systems calculate the costs of
individual activities and assign costs by making use of cost drivers to cost objects such
as product and services on the basis of the activities needed to produce each product or
service:
Figure 2.1 : Activity-based costing
Fundamental Cost Objects Assignment to Other Cost
(Source: Horngren et a/., 2006:145)
ABC can therefore be defined as a system that calculates the costs of individual
activities and assigns costs by making use of cost drivers to cost objects such as
products and services on the basis of the activities undertaken to create each product or
service. ABC is designed to provide managers with cost information for strategic and
other decisions.
In essence, ABC uncovers the true cost of a product or service of a business.
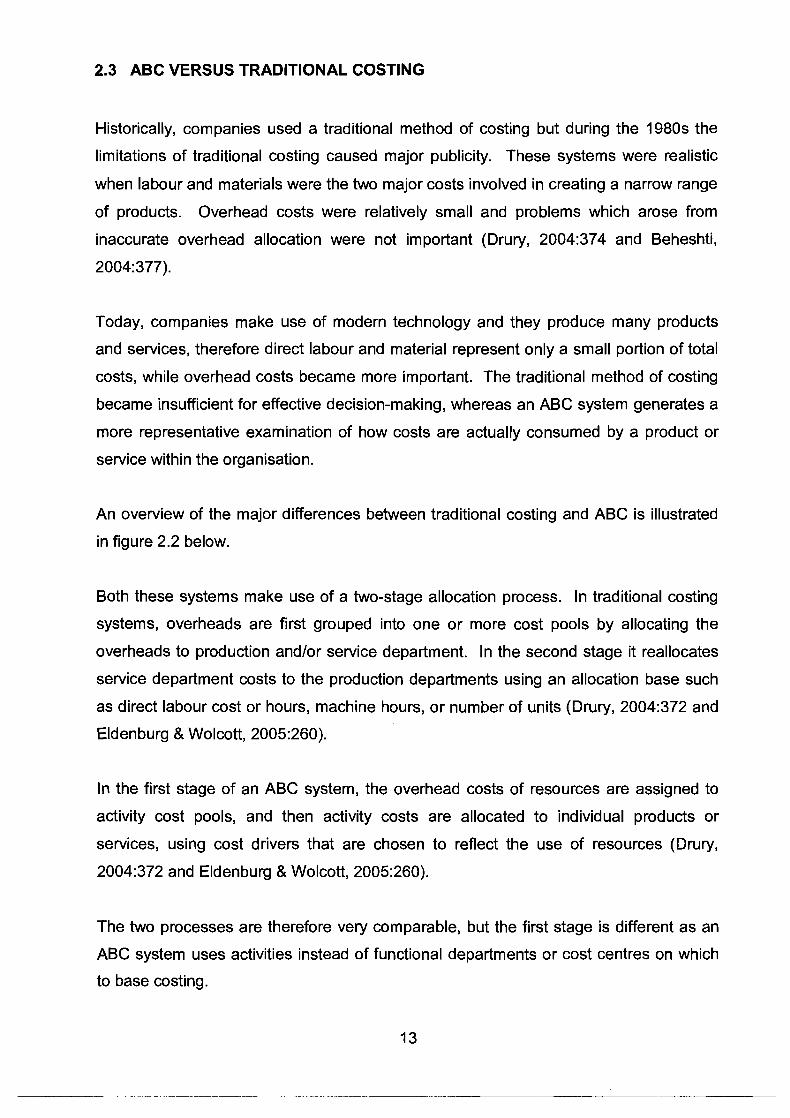
2.3 ABC VERSUS TRADITIONAL COS'TING
Historically, companies used a traditional method of costing but during the 1980s the
limitations of traditional costing caused major publicity. These systems were realistic
when labour and materials were the two major costs involved in creating a narrow range
of products. Overhead costs were relatively small and problems which arose from
inaccurate overhead allocation were not important (Drury, 2004:374 and Beheshti,
2004:377).
Today, companies make use of modern technology and they produce many products
and services, therefore direct labour and material represent only a small portion of total
costs, while overhead costs became more important. The traditional method of costing
became insufficient for effective decision-making, whereas an ABC system generates a
more representative exarrlination of how costs are actually consumed by a product or
service within the organisation.
An overview of the major differences between traditional costing and ABC is illustrated
in figure 2.2 below.
Both these systems make use of a two-stage allocation process. In traditional costing
systems, overheads are first grouped into one or more cost pools by allocating the
overheads to production and/or service department. In the second stage it reallocates
service department costs to the production departments using an allocation base such
as direct labour cost or hours, machine hours, or number of units (Drury, 2004:372 and
Eldenburg & Wolcott, 2005:260).
In the first stage of an ABC system, the overhead costs of resources are assigned to
activity cost pools, and then activity costs are allocated to individual products or
services, using cost drivers that are chosen to reflect the use of resources (Drury,
2004:372 and Eldenburg & Wolcott, 2005:260).
The two processes are therefore very comparable, but the first stage is different as an
ABC system uses activities instead of functional departments or cost centres on which
to base costing.

Figure 2.2: An illustration of the two-stage allocation process for traditional and
activity-based costing systems
a) Traditional costing systems
(Source: Kaplan & Cooper, 1998:83 and Drury, 2004:373, adapted)
r Overhead ' f- 'l
b) Activity-based costing systems
Cost Centre "f'tb'$ "-" , b ' ~ b b e i E ; i * I h", y%. it=- 7-tZC I
Activitv Cost Drivers
Direct Materials
(Source: Kaplan & Cooper, 1998183 and Drury, 2004:373, adapted)
Overhead
Cost Centre
K
Cost Centre
2 i J
Allocations f \
4) 4,
Production
Cost Centre
1 L 1 \ 1 \ /'
Machine Hours Direct /
Direct Materials- ' Labour Products Hours
Direct Labour -\ ,
Production
Cost Centre o 2
41
Production
Cost Centre
N

2.3.1 Simple example to compare traditional costing with activity-based costing
The following example is a simple introduction to ABC. The number of departments and activities is coincidental and is used just for simplicity in this demonstration.
An organisation produces three products for which the standard quantities per unit are as follows:
Source: Wilks & Burke (2005272-273) (adapted)
Production overhead analysis per department:
Department 1 R 1,400,000.00 Department 2 R 1,800,000.00
R 3,200,000.00
Department 1 is labour intensive and department 2 is machine intensive
Total labour hours in department 7 : Total machine hours in department 2:
Production overhead analysed by activity:
Inspection R 1,400,000.00 Production scheduling/machine set-up R 1,200,000.00
R 2,600,000.00
Number of batches inspected Number of batches for scheduling and set-up

Traditional costing
Absorption rates:
Department 1 = R1,400,000.00 1 75,000
- - R 8.00 per labour hour
Department 2 = R1,800,000.00 450,000
- - R 4.00 per machine hour
Product cost statement
Activity- based costing
Cost driver rates:
Inspection = R1,600,000.00 5000
R 280.00 per inspection
Production scheduling/ machine set-up - - R1,500,000.00
800
- - R 1,500.00 per set-up

Product cost statement
Should management have applied the traditional way of costing, Product Z (Rl80lunit)
would have appeared to be more expensive than if ABC had been used. Product X
(R152lunit) would appear to be cheaper when the traditional system is used and more
expensive (R172lunit) when ABC is used. The effect of making a decision not to use
ABC (with the assumption that ABC is more accurate) will lead management to over-
price product Z (R1801unit) and under-price product X (Rl52lunit). This can lead to
major failure in an organisation. The selling price of product Z will not be market related
and will lead to low selling volumes. Product X will be sold in high volumes, but the
organisation will unknowingly be making a loss per unit of product X.
Based on the above case it is extremely important to every company to achieve and
sustain a competitive advantage. The importance of ABC and the implementation of
ABC will form the content of the rest of this chapter.
2.4 IMPLEMENTATION OF AN ABC MODEL
2.4.1 identifying activities
An ABC system makes use of activities and not cost centres or departments, like in the
case of traditional costing systems. Activities are defined as a collection of actions (or
work) performed within an organisation to produce an output. Activities are described
by verbs related to objects (Glad & Becker, 1994:18; Beheshti, 20041378 and Turney,
1996:99).

A cost hierarchy is used to identify activities and to assign costs to these activities
(Eldenburg & Wolcott, 2005:261; Drury, 2004:382-383; Lere, 2000:24-25 and Garrison
ef a!., 2006:321-322). The following are the various activities.
Unit-level activities
Unit-level activities are the activities performed for every unit of product or
service produced. The quantity of unit-level activities should be proportional to
production and sales volumes, for example direct labour and direct material.
Typical examples of cost drivers for unit-level activities will be labour hours and
machine hours.
Batch-level activities
Batch-level activities are the activities that have to be performed for a collection
of products or services, regardless of how many units are in the batch. For
example processing a customer order and arranging for a shipment to a client.
The cost of batch-related activities varies from the number of batches, but is a
fixed cost for all units within the batch. For example, the cost of processing a
customer order will be the same regardless of whether the batch contains two or
50 items.
Product-sustaining activities or service-sustaining activities
Product-sustaining activities are the activities performed to enable the production
and sales of individual products or services. These activities are not unit- or
batch-related, but are related to individual products or services. For example,
inspection of individual products or services, and technical support for individual
products or services.
Facility-sustaining or business-sustaining activities
These activities occur regardless of how many customers are served, which
products are produced, how many batches are processed or how many units are
produced. Many of these costs are fixed and typically assigned to the facility or
business as a whole, for example insurance, depreciation, arranging for loans
and providing a computer network.
2.4.2 Assigning costs to activity cost centres
Once the activities are identified, the cost of resources consumed by these activities
can be determined. The aim of ABC is to determine the "true cosr of the organisation's
activities (Closs & Goldsby, 2000:500). The activities do not involve only production
costs, but rather all costs related to the activities, for example inspection of individual
products or services and development costs should be taken into consideration. This
includes fixed and variable costs. By identifying activities in paragraph 2.4.1 and the
cost of activities, ABC seeks a greater level of detail to understand how an organisation
uses its resources.
2.4.3 Selecting appropriate cost drivers for assigning the cost of activities to
cost objects
According to Stapleton et a/. (2004:586), activities and cost objects are linked by cost
drivers, therefore a cost driver is a unit of activity that causes or influences costs (Lin
eta/., 2001 :708).
According to Drury (2004:380-381) and Kaplan & Cooper (1998:95-97), activity cost
drivers consist of three types:

1. Transaction drivers
Transaction drivers, such as the number of purchase orders and the number of
customer orders processed, provide a count of how often an activity is
performed. Transaction drivers are the least expensive cost driver and are also
expected to be the least accurate cost driver because they expect that the same
quantity of resources is necessary every time an activity is performed.
2. Duration drivers
Duration drivers represent the amount of time necessary to perform an activity.
Duration drivers are useful when significant variation exists in the amount of
activity that is required for different outputs. For example the set-up hours for a
simple product will be 20-25 minutes, but complex products can require quite a
few hours. Using a transaction driver like number of set-ups will cause an over-
costing of simple products and an under-costing of complex products. Therefore
using set-up hours as a cost driver will overcome this problem.
3. Intensity drivers
Intensity drivers directly charge for the resources used every time an activity is
performed. A complex product may require skilled personnel for set-up.
Duration drivers will determine an average hourly rate to calculate the cost of the
activity, whereas intensity drivers would record the time required from skilled
personnel and assign the specific resources directly to the product.
2.4.4 Assigning the cost of the activities to products or services
The fourth step is also known as second-stage ailocation. Activity rates are used fo
apply costs to products and customers (Garrison et a/., 2006:328-330). The allocation
rate is determined by dividing the total cost of the activity by the total amount of times
the activity takes place (Eldenburg & Wolcott, 2005265).
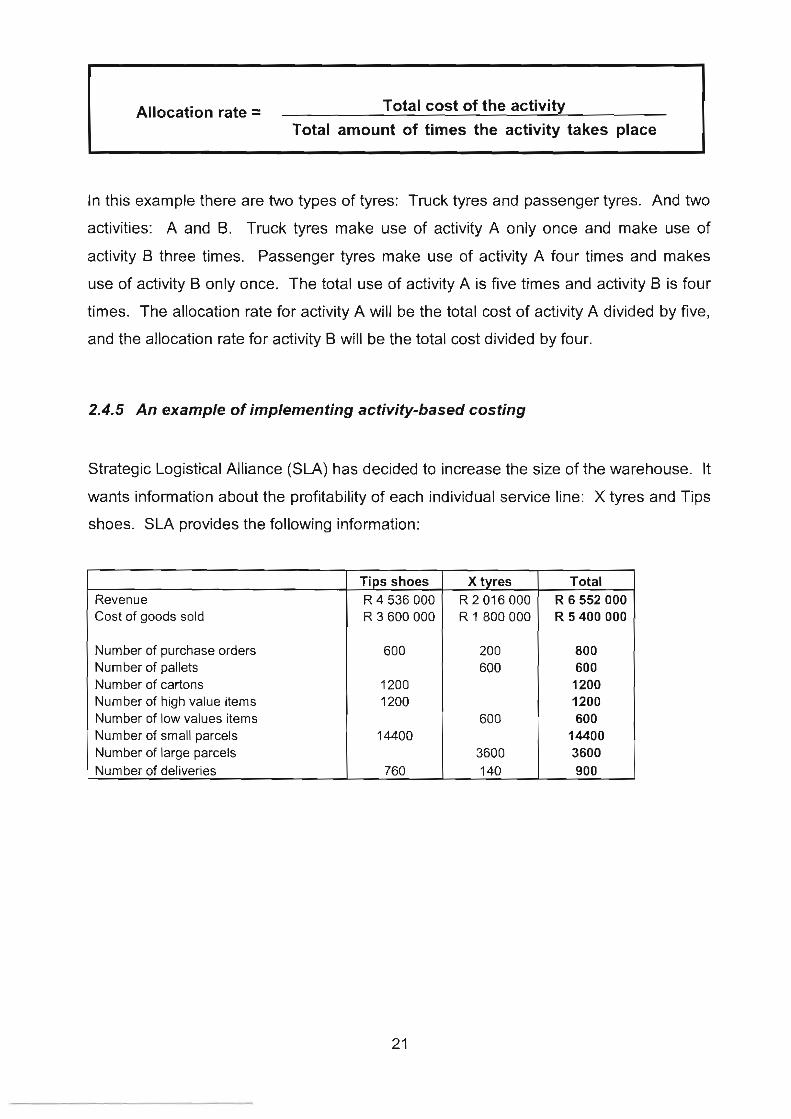
Allocation rate = Total cost of the activity
Total amount of times the activity takes place
In this example there are two types of tyres: Truck tyres and passenger tyres. And two
activities: A and 6. Truck tyres make use of activity A only once and make use of
activity B three times. Passenger tyres make use of activity A four times and makes
use of activity B only once. The total use of activity A is five times and activity 5 is four
times. The allocation rate for activity A will be the total cost of activity A divided by five,
and the allocation rate for activity B will be the total cost divided by four.
2.4.5 An example of implementing activity-based costing
Strategic Logistical Alliance (SLA) has decided to increase the size of the warehouse. It
wants information about the profitability of each individual service line: X tyres and Tips
shoes. SLA provides the following information:
Revenue Cost of goods sold
Number of purchase orders Number of pallets Number of cartons Number of high value items Number of low values items Number of small parcels Number of large parcels Number of deliveries
Tips shoes R4536000 R 3 600 000
600
1200 1200
14400
760
X tyres R2016000 R I 800 000
200 600
600
3600 140
Total R 6 5 5 2 0 0 0 R 5 400 000
800 600 1200 1200 600
14400 3600 900
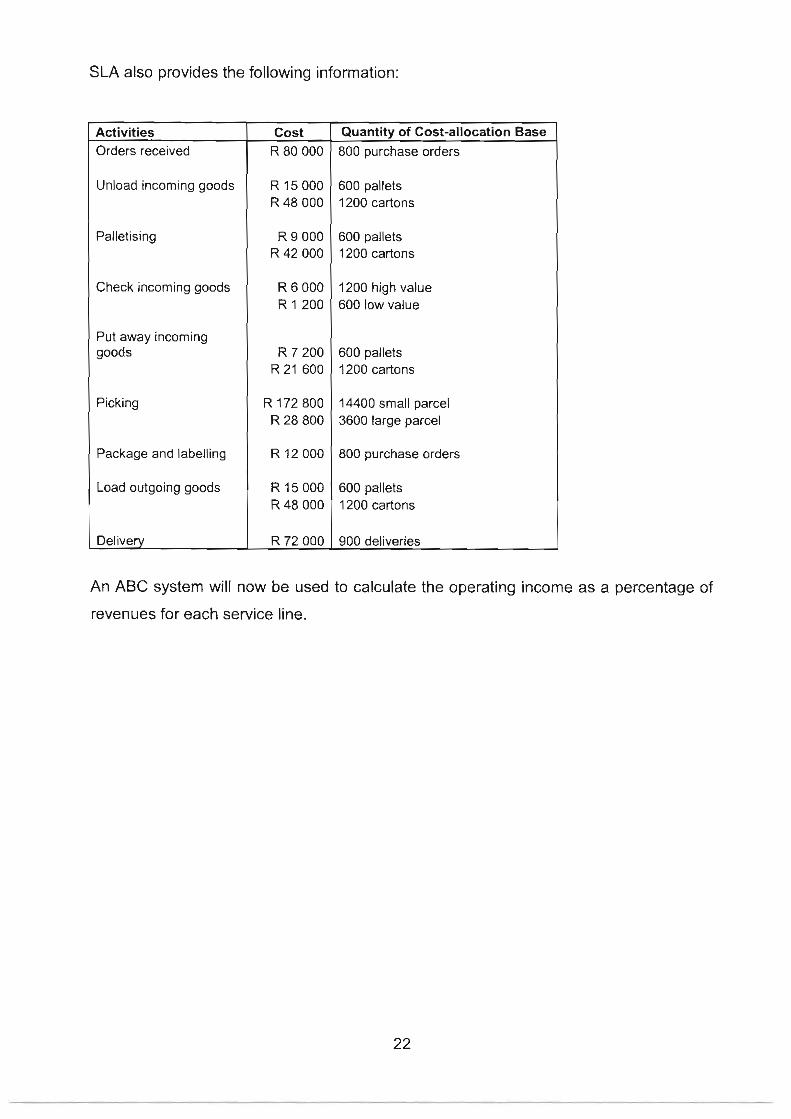
SLA also provides the following information:
Activities Orders received
Palletising
Unload incoming goods
Cost R 80 000
Put away incoming goods
Quantity of Cost-allocation Base
800 purchase orders
R 15 000 R 48 000
Check incoming goods
Picking
600 pallets 1200 cartons
R 6 000 R 1 200
1200 high value 600 low value
R 7 200 R 21 600
I Package and labelling I R 12 000 800 purchase orders I I
600 pallets 1200 cartons
R 172 800 R 28 800
14400 small parcel 3600 large parcel
1 Delivery ( R 72 000 1 900 deliveries
Load outgoing goods
An ABC system will now be used to calculate the operating income as a percentage of
revenues for each service line.
R 15 000 R 48 000
600 pallets 1200 cartons

Step 1 is to determine the activities in the warehouse as discussed in paragraph 2.4.1.
Step 2 is to assign cost to activity centres as discussed in paragraph 2.4.2. Step 3 is
selecting appropriate cost drivers for assigning the cost of activities to cost objects as
discussed in paragraph 2.4.3. Step 4 is assigning the cost of the activities to products
or service as discussed in paragraph 2.4.4; here SLA calculates cost-allocation rates for
each activity area. The activity rates are as follows:
Cost centres Receiving
Centre floor
Dispatch
identifying activities
(Step 1)
Activities Order received
Unload incoming goods
Palletising
Check incoming goods
Put away incoming goods
Picking
Package and labelling
Load outgoing goods
Delivery
Total cost
(Step 2)
Cost R 80 000
R 15 000
R 48 000
R 9 000
R 42 000
R 6 000
R 1 200
R 7 200
R 21 600
R 172 800
R 28 800
R 12 000
R 15 000
R 48 000
R 72 000
Cost drivers
(Step 3)
Cost Driver Number of purchase orders Quantity and packaging (pallets or cartons)
Quantity of pallets or cartons
Quantity and quality of supplier
Quantity and number of returns
Size of parcel picked
Num ber of orders picked
Quantity and packaging (pallets or cartons)
Quantity of deliveries
Assigning the cost of activities
(Step 4) Quantity of cost-
allocation base
800 purchase orders 600 pallets
1200 cartons
600 pallets
1200 cartons
7200 high value
600 low value
600 pallets
1200 cartons
14400 small parcel
3600 large parcel
800 purchase orders
600 pallets
1200 cartons
900 deliveries
Overhead allocation
rate Rl00 per order R25 per pal let R40 per carton R15 per pallet R35 per carton R5 per quantity R2 per quantity R12 per pallet R18 per carton R12 per parcel R8 per parcel R15 per purchase order R25 per pallet R40 per carton R80 delivery
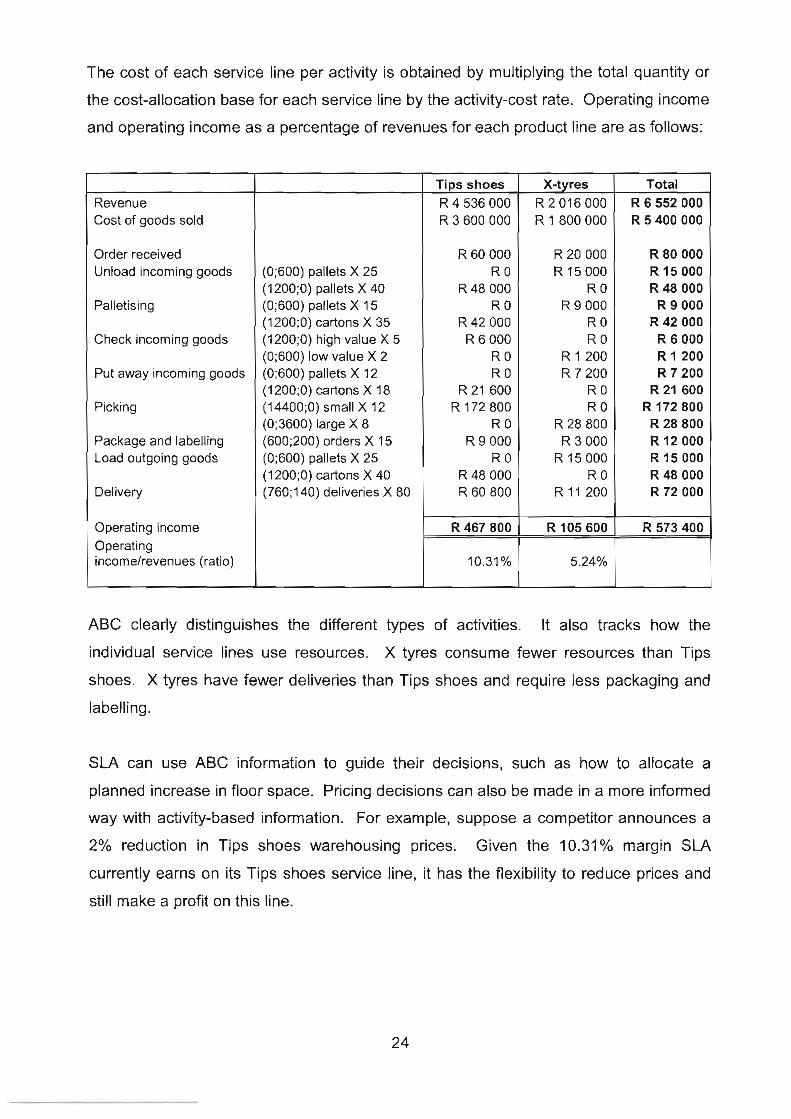
The cost of each service line per activity is obtained by multiplying the total quantity or
the cost-allocation base for each service line by the activity-cost rate. Operating income
and operating income as a percentage of revenues for each product line are as follows:
ABC clearly distinguishes the different types of activities. It also tracks how the
individual service lines use resources. X tyres consume fewer resources than Tips
shoes. X tyres have fewer deliveries than Tips shoes and require less packaging and
labelling.
Revenue Cost of goods sold
Order received Unload incoming goods
Palletising
Check incoming goods
Put away incoming goods
Picking
Package and labelling Load outgoing goods
Delivery
Operating income Operating incornelrevenues (ratio)
SLA can use ABC information to guide their decisions, such as how to allocate a
planned increase in floor space. Pricing decisions can also be made in a more informed
way with activity-based information. For example, suppose a competitor announces a
2% reduction in Tips shoes warehousing prices. Given the 10.31% margin SLA
currently earns on its Tips shoes service line, it has the flexibility to reduce prices and
still make a profit on this line.
(0;600) pallets X 25 (1 200;O) pallets X 40 (0;600) pallets X 15 (1 200;O) cartons X 35 (1200;O) high value X 5 (0;600) low value X 2 (0;600) pallets X 12 (1 200;O) cartons X 18 (1 4400;O) small X 12 (0;3600) large X 8 (600;200) orders X I S (0;600) pallets X 25 (1 200;O) cartons X 40 (760;140) deliveries X 80
Tips shoes R4536000 R 3 600 000
R 60 000 RO
R 48 000 RO
R 42 000 R 6 000
RO RO
R 21 600 R 172 800
R 0 R 9 000
RO R 48 000 R 60 800
R 467 800
10.31 %
X-tyres
R2016000 R I 800 000
R 20 000 R 15 000
RO R 9 000
RO RO
R 1 200 R 7 200
RO RO
R 28 800 R 3 000
R 15 000 RO
R 11 200
R 105 600
5.24%
Total R 6 5 5 2 0 0 0 R 5 400 000
R 80 000 R 15 000 R 48 000
R 9 000 R 42 000
R 6 000 R I 200 R 7 200
R 21 600 R 172 800 R 28 800 R 12 000 R 15 000 R 48 000 R 72 000
R 573 400

2.5 ADVANTAGES AND DISADVANTAGES OF THE ABC APPROACH
During the discussion of traditional costing systems versus ABC systems in paragraph
2.3, it became clear that traditional costing does not allocate cost accurately to
individual products or services. It is especially so where organisations:
Produce more than one product and service and where all products or services
do not make use of all the resources in the production or service line, or
make use of more indirect cost in the production or service line.
ABC has been developed to overcome the shortcomings of traditional costing systems.
It has certain advantages, and certain disadvantages, and these are discussed below.
2.5.1 Advantages of activity-based costing
ABC provides a clear picture of where resources are spent in an organisation.
ABC reduces the unpredictability in cost measurement by closely matching cost
allocations to the actual use of resources by operating activities (Stapleton ef a/.,
2004:591 and Eldenburg & Wolcott, 2005:276).
ABC helps managers focus on activity level measurement. After identifying
activities and cost drivers, managers are more aware of the cause-and-effect
relationships. This awareness motivates managers and employees to look for
ways to advance performance simply because they have more information
about the cost effects of an activity (Eldenburg & Wolcott, 2005:276).

ABC relies on a greater number of cost drivers to allocate overheads on a
cause-and-effect basis and therefore organisations can trace cost more
accurately and determine the areas andior customers that generate the greatest
profit or loss. Product and customer profitability analysis performed by the
organisation using activity-based management may significantly alter
management perceptions of the status of operations, as a more accurate and
effective allocation of costs is obtained (Drury, 2004:372-374 and Stapleton
et a/., 2004:591).
ABC identifies value-adding activities. Value-adding activities are those
activities that add value from the customer's point of view (Griful-Miquela,
2001 :I 36).
ABC helps managers identify non-value-adding activities so that they can be
improved to add value from the customer's point of view or so that the activity
can be eliminated (Stapleton et a/., 2004:591).
ABC identifies many activity costs that are not directly linked to production at all
but are traditionally allocated to products as production cost. On the other hand,
it identifies many marketing, selling and administrative costs that should be
included to establish better pricing estimates (Stapleton et at., 2004:592).
2.5.2 Disadvantages of activity-based costing
According to Horngren ef a/. (2006:157), the main costs and limiting factors of an
ABC system are the measurements necessary to implement the system. Cost-
allocation bases require management to estimate costs of activity pools and to
identify and measure cost drivers for these pools. ABC systems require many
calculations to determine costs of products and services. These measurements
are costly and rates need to be updated regularly.
Due to the lengthy procedures which ABC entails, it can be a very
time-consuming procedure (Stapleton et al., 2004:592).
It is not appropriate for every organisation; firms with low overhead costs will not
benefit from an ABC system (Stapleton eta/., 2004:592).
ABC is a very complex system, due to the near impossibility of tracking and
attaching every resource cost to a particular activity. Hundreds and possibly
thousands of activities take place in organisations every day. Some activities
may not be identifiable or quantifiable without a great amount of effort (Lin et a/.,
2001 :710).
Most organisations ask the following question: Are the costs of implementing an ABC
system worth the benefits achieved? ABC is clearly a more complicated and expensive
costing approach but the benefits of this system definitely justify these inputs.
2.6 ACTIVITY-BASED MANAGEMENT
To achieve continuous improvement, managers should remain informed. Managers
need timely and accurate information about the activities (work) done and the objects of
these activities (the products and the customers). This is what ABC is all about as
discussed throughout chapter 2. Obtaining good quality information is only one half of
the challenge. The key to success is putting ABC information to work to identify
appropriate strategies, improve product design, and remove waste from operating
activities (Turney, 1996: 139).
Using ABC to improve an organisation is called activity-based management (ABM) and
will form the content of the rest of this chapter.
2.6.7 Defining activity-based management (ABM)
According to Horngren et a/. (2006:A 52-1 55), activity-based management (ABM)
describes management decisions that use ABC information to please customers and
advance profitability, and more broadly defines ABM to include decisions about:
pricing and product mix,
how to reduce costs,
how to improve processes, and
product design.
According to Eldenburg & Wolcott (2005:270), ABM makes use of ABC information to
calculate the costs and benefits of production and internal activities and to identify and
implement opportunities for improvement in profitability, efficiency and quality within an
organisation.
ABC can be used to identify areas that would gain from process improvement, and
when ABC is used in this manner it is called ABM. ABM focuses on managing activities
to eliminate waste and reducing delays or defects (Garrison et a/., 2006:335).
ABM can be defined as a system that focuses on the management of activities.
Activities consume costs, therefore by managing activities, cost will be managed, which
leads to continuous improvement. ABM is very dependent on the quality of information
provided by ABC. ABM adds value to activities and thus leads to an increase in the
level of satisfaction of customers.
2.6.2 Principles of activity-based management
ABM is directly aimed at two goals. The first goal is to satisfy customers' needs by
improving the value of the product or service received by the customer. The second
goal is to improve profits by making fewer demands on organisational resources. These
goals will be obtained by managing activities (Drury, 2004:951 and Turney, 1996:141).
Knowing the cost of activities highlights those activities with the highest cost so that
management can prioritise the analysis of these activities so that they can be eliminated
or performed more efficiently.
Turney (1996:146) recommend using a Pareto rule to identify the activities with the
greatest potential for improvement. Pareto's rule or the 80120 rule states that 20% of
the activities cause 80% of the cost (Turney, 1996:146 and Wayne & Searcy, 2004:51).
This will help management identify activities that need to be analysed. Another way of
dealing with activities is to classify them as either value-adding or non-value-adding
activities.
Value-adding activities
A value-adding activity is an activity that customers recognise as adding value to
the product or service they purchase. For example, on-time deliveries of the right
quality and quantity will be a value-adding activity for the client. Other definitions
include an activity that is performed as efficiently as possible and/or an activity
that is in line with the primary objective of producing outputs (Drury, 2004:955
and Griful-Miquela, 2001 :I 36).
Non-value-adding activities
A non-value-adding activity is an activity that does not add value to a
product/service and therefore is unnecessary and can be reduced or eliminated.
This is an opportunity for cost reduction, without fotfeiting the value or quality of
the product or service to the customer (Drury, 2004:955 and
Griful-Miquela, 2001:136). For example, a third hundred percent audit check
(inspection) of inventory that has been previously picked and audited will be a
non-value adding activity in the warehouse.
According to Drury (2004:955), a value-adding or non-value-adding activity can be
classified in terms of the following five point scale.
1 Highly efficient, with little opportunity for improvement
2. Moderately efficient, with a few opportunities for improvement
3. Of average efficiency, with reasonable opportunity for improvement
4. Inefficient, with plenty of opportunities for improvement
5. Highly inefficient, should maybe not be done at all, opportunity for improvement
By identifying the cost of activities that make up the organisation and classifying them
into the above five categories, opportunities for cost reduction can be identified and
prioritised. Cost reduction can be achieved by eliminating the activities, performing
them more efficiently with fewer resources or redesigning them so that they are
performed entirely differently and more efficiently, also in terms of cost.

2.7 THE ACTIVITY-BASED COSTING AND ACTIVITY-BASED MANAGEMENT
MODEL
Figure 2.3 below illustrates a graphical model of activity-based performance
measurement. This model is defined by Turney (1 996:81) as second-generation ABC.
This model has three main views:
Figure 2.3: The activity-based costing model
Cost assignment
(Source: Turney, 1996:81 and Drury, 2004:392, adapted)
ABM view (indicated by the circle) illustrates the interrelationship between ABC
and ABM. ABC provides the information needed to manage activities. ABM
uses the information provided by activity-based costing as the route to
continuous improvement.
The cost assignment view (indicated by the vertical box). The vertical box
relates to product or customer costing, where costs are first assigned to
activities, and then to cost objects. The resources and activity drivers within the
model reflect the total time or other resources consumed in performing a specific
activity (La Londe & Ginter, 1999:17). Thus the vertical box focuses on financial
information. This information is important in order to analyse critical decisions.
These decisions include pricing, product mix, sourcing, product-design decisions
and setting priorities for improvement efforts.
The process view (indicated by the horizontal box). The horizontal box reflects
information about events that influence the performance of activities and activity
performance. What causes work and how well it is done? Thus the horizontal
box focuses on non-financial information. Organisations use this information to
help improve performance and the value received by customers.
This model indicates the connection between financial and non-financial information.
This connection enables performance to be translated into cost information and into
how performance affects process costs or profitability. Improved performance can also
be translated into a revised activity cost that requires fewer resources. The vertical box
or cost view of ABC allows the activity cost to be translated into changes in necessary
resources or into customer or product or service cost (La Londe & Ginter, 1999:17).
The aim of this chapter was to look at how ABC can be used to provide relevant
information for decision-making by more accurately assigning costs to cost objects.
ABM was also discussed to see how the information provided by ABC is used by ABM
to manage activities. Cost management and performance measurementtmanagement
are considered more valuable than pure financial evaluation to evaluate overall
organisational performance (Burk & Douglas, 1994:17). This statement will be
explained in Chapters 3 and 4.

2.8 SUMMARY
Knowledge of product cost or service cost is critical for any organisation that hopes to
maintain, or improve, its competitive advantage. This is especially true in small and
mid-sized organisations that face ever-increasing pressure from their key customers
continually to reduce the price of their products and services.
Traditional cost accounting methods suffer from several defects that can result in
distorted cost for decision-making purposes. All manufacturing costs - even those that
are not caused by any specific product - are allocated to products. Traditional methods
also allocate the costs of idle capacity to products. In effect, products or services are
charged for resources that they don't use. And finally, traditional methods tend to place
too much reliance on unit-level allocation bases, such as direct labour and
machine-hours. This results in over-costing high-volume products and under-costing
low-volume products and can lead to mistakes when making decisions.
ABC estimates the costs of the resources consumed by cost objects such as products
and customers. The approach taken in ABC assumes that cost objects generate
activities that in turn consume costly resources. Activities form the link between costs
and cost objects. ABC is concerned with overhead costs. The accounting for direct
labour and direct material is usually unaffected.
To build an ABC system, managers should choose a set of activities that summarises
much of the work performed in overhead departments and associate that with each
activity-cost pool. The remaining overhead costs are assigned to the activity-cost pools
in the first-stage allocation.
An activity rate is computed for each cost pool by dividing the costs assigned to the cost
pool by the measure of activity for the cost pool. Activity rates provide useful
information to managers concerning the costs of carrying out overhead activities. A
particularly high cost for an activity may trigger efforts to improve the way the activity is
carried out in the organisation.
In the second-stage allocation, the activity rates are used to apply costs to cost objects
such as products and customers. The costs computed under ABC are often quite
different from the costs generated by a company's traditional cost accounting system.
While the activity-based costing system is almost certainly more accurate, managers
should nevertheless exercise caution before making decisions based on activity-based
costing data. A vital part of any activity-based analysis of product or customer
profitability is an action analysis that identifies who is ultimately responsible for each
cost and the ease with which the cost can be adjusted.

CHAPTER 3
COST MANAGEMENT
3.1 INTRODUCTION
The aim of chapter 2 was to look at how activity-based costing can be used to provide
relevant information for decision-making by more accurately assigning costs to cost
objects. According to Drury (2004:391), activity-based costing can be used for a range
of cost management applications. The vertical box as illustrated in figure 2.3 in
paragraph 2.7 relates to product or customer costing, where costs are first assigned to
activities and then to cost objects. According to Drury (2004:391), the horizontal box as
illustrated in figure 2.3 in paragraph 2.7 relates to cost management, where a process
approach is adopted and costs are allocated to activities. This represents the basis for
cost management applications.
Therefore activity-based costing should not only be used to provide relevant information
for decision-making, but should also represent the basis for cost management
applications. Cost management will be discussed in this chapter.
3.2 DEFINING COST MANAGEMENT
According to Horngren et a/. (2006:Z-3), cost management describes the activities of
managers in the short- and long-term in which they
(i) implement programmes to control decisions that minimise costs of products or
services, and
(ii) increase the value or quality of the products or services to ensure customer
satisfaction.
Cost management forms an important part of management strategies and their
implementation.

Cost management focuses on cost reduction rather than cost control. Traditional
cost-control systems are applied on a continuous basis, while cost management tends
to be applied on an ad hoc basis when cost reduction opportunities are identified.
Cost-control systems rely heavily on accounting techniques, whereas cost management
sometimes makes use of accounting information, and sometimes not. Accounting
information for example is not needed for process improvements, where an opportunity
is identified to perform a process more effectively and efficiently in order to reduce
costs. Although cost management aims to reduce costs, it should not be at the expense
of customer satisfaction (Drury, 2004:943-944).
Managers commonly use the following cost management tools to implement an
organisation's strategy and to facilitate the achievement of success in respect of critical
success factors: life-cycle costing (LCC), target costing (TC), kaizen costing,
activity-based management (ABM), business process reengineering (BPR), costs of
quality and total quality management (TQM), value chain, benchmarking and
just-in-time (JIT). Everything except for the balanced scorecard (BSC) will be discussed
in this chapter. The BSC will be looked at in chapter 4.
3.2.1 Life-cycle costing (LCC)
Swain et a/. (2005579) define life cycle costing (LCC) as the method of measuring all
costs involved in creating, producing and utilising a product or service. LCC is not only
the costs incurred by the organisation measuring these costs but also the costs incurred
by the suppliers and the customers of the product or service.
LCC estimates and accumulates costs invotved over a product's entire life cycle. The
aim is to assist managers to determine if profits earned during the manufacturing phase
will cover the costs incurred during the pre- and post-manufacturing phase. Identifying
costs in different stages will give managers insight into understanding and managing the
total costs of the product or service and will help managers identify areas in which cost
reduction efforts are likely to be most effective (Drury, 2004:944).

Life-cycle costing considers the entire cost of a product or service. Therefore it provides
a long-term complete perspective of product costs and product or service profitability.
According to Drury (2004:944-945), LCC consists of three phases; the planning and
design stage, the manufacturing stage and the service and abandonment stage. Figure
3.1 below will illustrate a typical pattern of cost commitment and cost incurrence in
these three stages.
Figure 3.1: Product life-cycle phases: relationship between costs committed and
costs incurred
100% - Costs committed
P 80% .
3 E b
I I
I I I I
Produd Irfeqde phase
(Source: Drury, 2004:945)
As illustrated in figure 3.1 above, more or less 80% of the costs are committed in the
planning and design stage, and the majority of costs are incurred during the
manufacturing stage, but it has already been locked up in the planning and design
stage. Committed costs are costs that have not been incurred yet, but will be incurred
in future. Costs are incurred as soon as a resource is used or sacrificed.

According to Blocher et a/. (2005:392-394), managers should consider high investments
in the planning and design stage, because it will see to the following critical success
factors:
Reduce time to market - the speed of product development and the speed of
delivery are critical in a competitive environment and therefore the efforts to
reduce time to market should receive first priority.
Reduce expected service costs - the expected service costs can be greatly
reduced by careful, simple design and the use of modular, interchangeable
components.
Improved ease of manufacture - to reduce production costs and time, the
design should be easy to manufacture.
Process planning and design - the manufacturing process should be flexible,
allowing fast setups and product flow, using responsive manufacturing concepts,
computer-integrated manufacturing, computer-assisted design and synchronised
engineering.
The following is an example of different costs in the LCC of a warehouse and
distribution function in all three phases as illustrated in figure 3.1 above:
Planning
o Planning the layout of the warehouse in order to determine the number of
square meters needed for Tips shoes.
o Security
o Insurance
o Racks needed to stack shoes
o The numberof employees needed forthe process
o Scanners
o Number of vehicles needed for distribution
o Vehicle tracking system
Manufacturingtday to day operations
o Receiving
o Centre floor
o Dispatch
After-sales service
o Customer complaints
o Returns
LCC leads to target costing. Target costing is a technique that manages costs during
the planning and design stage of a product or service. Target costing will be discussed
in detail below.
3.2.2 Target costing (TC)
Target costing (TC) is a market-driven or customer-orientated strategy that was
developed by Toyota during the 1960s, and is widely used by Japanese organisations
(Dnrry, 2004:945-946 and Chen & Chung, 2002:l).
According to Cooper & Slagmulder (1997:72), TC is a structured process aimed at
insuring that a product launched with specified functionality, quality and sales price can
be produced at a life-cycle cost that generates a satisfactory level of profitability. TC is
linked to the organisation's competitive strategy and provides means for achieving the
organisation's goals of satisfying customer demands at an acceptable level of
profitability (Hibbets et a/., 2003:65-67).
According to Drury (2004:945-946), TC involves the following steps:
Step 1: Determine the target price which customers are willing to pay for the
product or service.
The first step requires market research to determine a competitive price
customers are willing to pay for the product or service, without forfeiting specified
functionalities and quality and risking substitute products offered by competitors.
Customers are either willing to pay higher prices for higher quality and
functionality or they are willing to give up on certain qualities and functionalities.
Management should determine this to differentiate their products and services
strategically (Drury, 2004:946; Lockamy Ill & Smith, 2000:213 and Eldenburg &
Wolcott, 2005:517).
Step 2: Subtract the target profit margin from the target price to determine the
target cost.
The second step is to determine the desired profit margin based on the
organisation's strategy and subtract it from the target price to determine the
target cost (Cooper & Slagmulder, 200546; Lockamy 1 1 1 & Smith, 2000:213;
Eldenburg & Wolcott, 2005517 and Drury, 2004:945-946). Therefore the
formula can be set out as follows:
Target cost = Competitive target price - Required profit margin
Step 3: Estimate the target (altowable) cost of the product or service
The product or service development team is given the responsibility of
designing the product or service for no more that the target cost (Drury,
20041945-946).
Step 4: Compare the actual cost to the target cost.
The actual cost is then compared to the target cost, and the whole process ends
either if the firm discovers a way to satisfy customer requirements at the target
cost or if the product or service gets abandoned (Drury, 2004:945-946).
3.2.2.1 An example of target costing in the warehouse and distribution function
To provide a simple example of TC, assume the following situation: The warehouse
and distribution function needs to deliver an estimate of 500 000 pairs of shoes to Tips
shoes in the Gauteng area. The price per delivery of their competitors is R2.80 per pair
of shoes delivered. To develop the infrastructure, the warehouse and distribution
function will need an investment of R2 200 000.00. SLA requires a 15% return on
investment (ROI). Given these data, the target cost to distribute one pair of shoes is
R2.14, as shown below.

Projected distribution (500 000 pairs X 2.80) R 1 400 000.00 Less desired profit (1 5% X R2 200 000) R 330 000.00
Target costs R I 070 000.00
Target cost per pair R 2.14
This target cost must be broken down into various functions, and each functional area
would be responsible for keeping its actual costs within the target.
3.2.2.2 Value engineering
According to Blocher et a/. (2005:381), value engineering is used in TC to reduce
product cost. Value engineering assists organisations in managing the trade-offs
between functionality and cost. The first important step in value engineering is to do a
consumer analysis during the design stage. To obtain this information, organisations
can make use of surveys and interviews with customers. The consumer analysis
identifies customer preferences that define the desired functionality of the product for
which the customer is willing to pay.
According to Cooper & Slagmulder (1997:51-52), value engineering is a efficient,
interdisciplinary examination of factors that affect the cost of a product so as to develop
a way of achieving the specified purpose at the required standard of quality and
reliability at the target costs.
Value engineering is an engineering approach applied during the design phase by a
multidisciplinary team. The team focuses on applying cost-reduction techniques during
the design phase of the product (Ingram et al., 2003:496 and Cooper & Slagmulder,
1 997:72).

According to Horngren ef a/. (2006:426-4271, managers implementing value engineering
will find it useful to distinguish between value-adding cost and non-value-adding costs.
Value-adding costs are costs that, if eliminated, will reduce the actual usefulness of
the product or service to the customer. Non-value-adding costs are costs that, if
eliminated, would not reduce the actual usefulness of the product or service to the
customer. The aim of value engineering is to reduce non-value-adding costs by
reducing the quantity of cost drivers of non value-adding activities. Value engineering
also focuses on reducing value-adding costs by achieving greater efficiency in
value-adding activities.
Drury (2004:947) states that the aim of value engineering is to achieve the assigned
target costs by
(i) reducing the product cost by identifying improved product designs without
sacrificing the functionality of the product, and
(ii) eliminating unnecessary functions that increase the product's cost, but customers
are not willing to pay for.
Value engineering requires the use of functionality analysis, a process of examining
the performance and cost of each major function of the product or service. A price, or
value, for each function is determined that reflects the amount the customer is willing to
pay. Benchmarking (see paragraph 3.2.8) is often used to determine which features
give the organisation a competitive advantage. If the cost of the function exceeds the
amount the customer is willing to pay, then the function should be eliminated, modified
to reduce costs or enhanced in terms of its supposed value so that its value exceeds
costs. Thus, the objective is to determine a desired balance of functionality
(performance) and cost.
3.2.3 Kaizen costing
According to Blocher et a/. (2005:384), "kaizen" can be defined as continuous
improvement, which is the ongoing process of finding new ways to minimise and
manage cost during the manufacturing process, without forfeiting the quality and
functionality of the product or service.

Kaizen costing focuses on reducing the costs of a process through constant small
incremental improvements, rather than through large innovations in the design and
development phase op the product or service (Modarress et a/., 2005:1753 and Drury,
2004:950). Kaizen costing relies on employee empowerment. Therefore management
should set cost-reduction goals for production processes and give workers the
responsibility to find ways to achieve these goals by improving the process and
reducing costs (Cooper & Slagmulder, 2005:47).
TC is applied during the design stage of the product life cycle and the objective of cost
reduction is primarily achieved through improvements during the design stage of the
product. Kaizen costing is applied during the manufacturing stage of the product life
cycle and the objective cost reduction is primarily achieved through increasing the
efficiency of the production process (Drury, 2004:950 and Cooper & Slagmulder,
1997:56).
Despite the differences between target and kaizen costing as mentioned above, there is
a close relationship between target and kaizen costing, as indicated by Blocher et a/.
(2005384) in figure 3.2 below. Price is assumed to be stable or could decrease over
time. TC ensures that a product is profitable at the introduction stage, but innovations
by competitors can lead to a product becoming unprofitable in the future. Innovations
by competitors pressure organisations to periodically redesign their product by making
use of TC to add value to the product and to reduce the product price. The time period
between the first and second TC and redesign in figure 3.2 below is approximately the
product's sales life cycle. Kairen costing is used during TC redesign to decrease cost,
and to increase efficiency during the manufacturing process. Target and kaizen costing
are used together continuously to reduce cost and improve value.
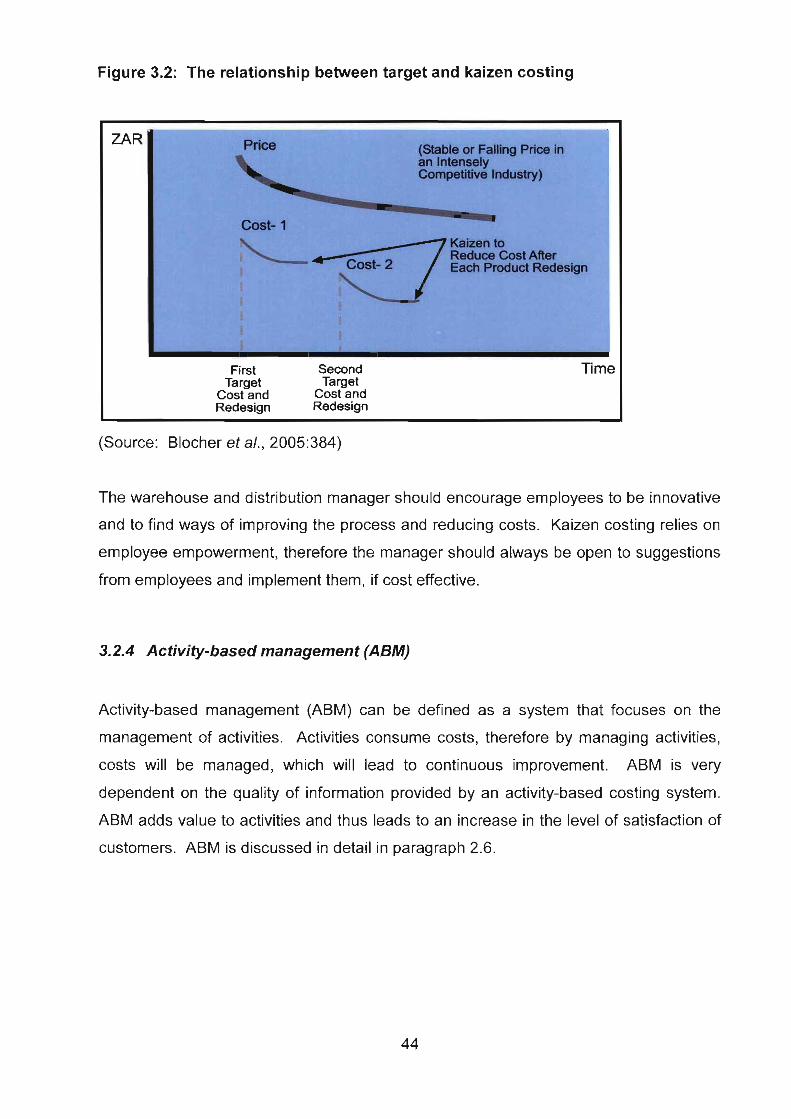
Figure 3.2: The relationship between target and kaizen costing
tirst aecona Time Target Target
Cost and Cost and Redesign Redesign
(Source: Blocher et al., 2005:384)
The warehouse and distribution manager should encourage employees to be innovative
and to find ways of improving the process and reducing costs. Kaizen costing relies on
employee empowerment, therefore the manager should always be open to suggestions
from employees and implement them, if cost effective.
3.2.4 Activity-based management (ABM)
Activity-based management (ABM) can be defined as a system that focuses on the
management of activities. Activities consume costs, therefore by managing activities,
costs will be managed, which will lead to continuous improvement. ABM is very
dependent on the quality of information provided by an activity-based costing system.
ABM adds value to activities and thus leads to an increase in the level of satisfaction of
customers. ABM is discussed in detail in paragraph 2.6.

3.2.5 Business process reengineering (BPR)
Business process reengineering (BPR) concerns a detailed examination of the current
business processes and making radical changes to how the organisation currently
operates. It involves fundamental rethinking and radical redesign in order to eliminate
unnecessary steps (or activities), to reduce opportunities for error, reduce cost and
improve quality, service, lead time, flexibility, innovation and customer satisfaction
(Drury, 2004:956-957 and Garrison et a/., 2006:16).
A business process is a series of related activities that are foltowed in order to carry
out a specific task in the organisation that adds value for a customer
(Drury, 2004:956-957; Garrison et a/., 2006:16 and Gunasekaran & Kobu, 2002:2523).
For example the steps followed in receiving a container at the warehouse constitute a
business process.
According to Drury (2004:957), the objective of BPR is to improve the key business
processes in an organisation by focusing on simplification, minimising cost, and
improving quality and customer satisfaction. In order to do this all activities that do not
add value to a product or service must be identified and eliminated (Drury, 2004:957
and Garrison etal., 2006:16). Non-value-adding activities are activities that do not
add value to a product or service and that customers are unwilling to pay for (see
paragraph 2.6.2). The example mentioned before of a third hundred percent audit
check (inspection) of inventory that has been previously picked and audited is be a
non-value-adding activity in the warehouse.
According to Blocher et al. (2005:634), BPR and productivity go hand in hand and will
help organisations achieve higher levels of profitability and improve competitiveness.
BPR are for ambitious companies that are willing to make radical changes to improve
productivity and achieve significant performance improvements (Gunasekaran & Kobu,
2002:2524). Therefore BPR focuses on the whole process, identifying non-value-
adding activities, and should reduce the inputs needed for the same output or should
increase the level of output from the same input (Blocher et a/., 2005634 and
Gunasekaran & Kobu, 20022524).
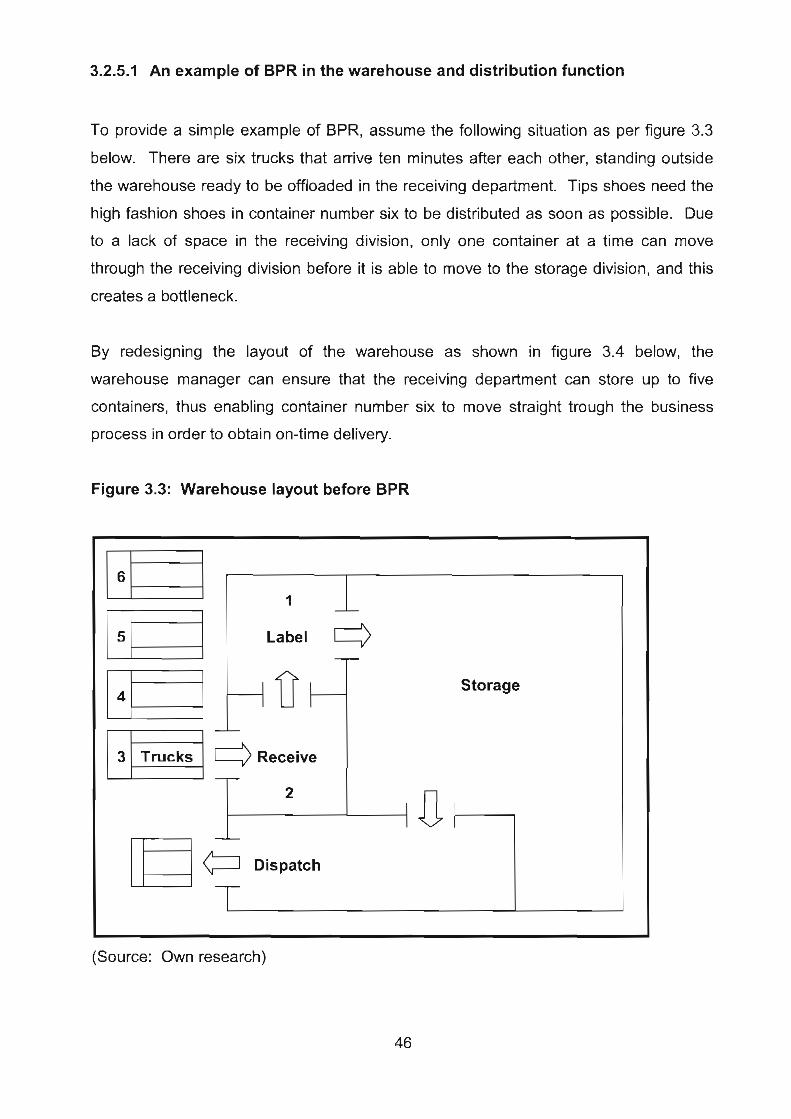
3.2.5.1 An example of BPR in the warehouse and distribution function
To provide a simple example of BPR, assume the following situation as per figure 3.3
below. There are six trucks that arrive ten minutes after each other, standing outside
the warehouse ready to be offloaded in the receiving department. Tips shoes need the
high fashion shoes in container number six to be distributed as soon as possible. Due
to a lack of space in the receiving division, only one container at a time can move
through the receiving division before it is able to move to the storage division, and this
creates a bottleneck.
By redesigning the layout of the warehouse as shown in figure 3.4 below, the
warehouse manager can ensure that the receiving department can store up to five
containers, thus enabling container number six to move straight trough the business
process in order to obtain on-time delivery.
Figure 3.3: Warehouse layout before BPR
3 Trucks I Storage
(Source: Own research)
I -
Label a 1Dl
-
a Receive -
2
-
-
@ Dispatch
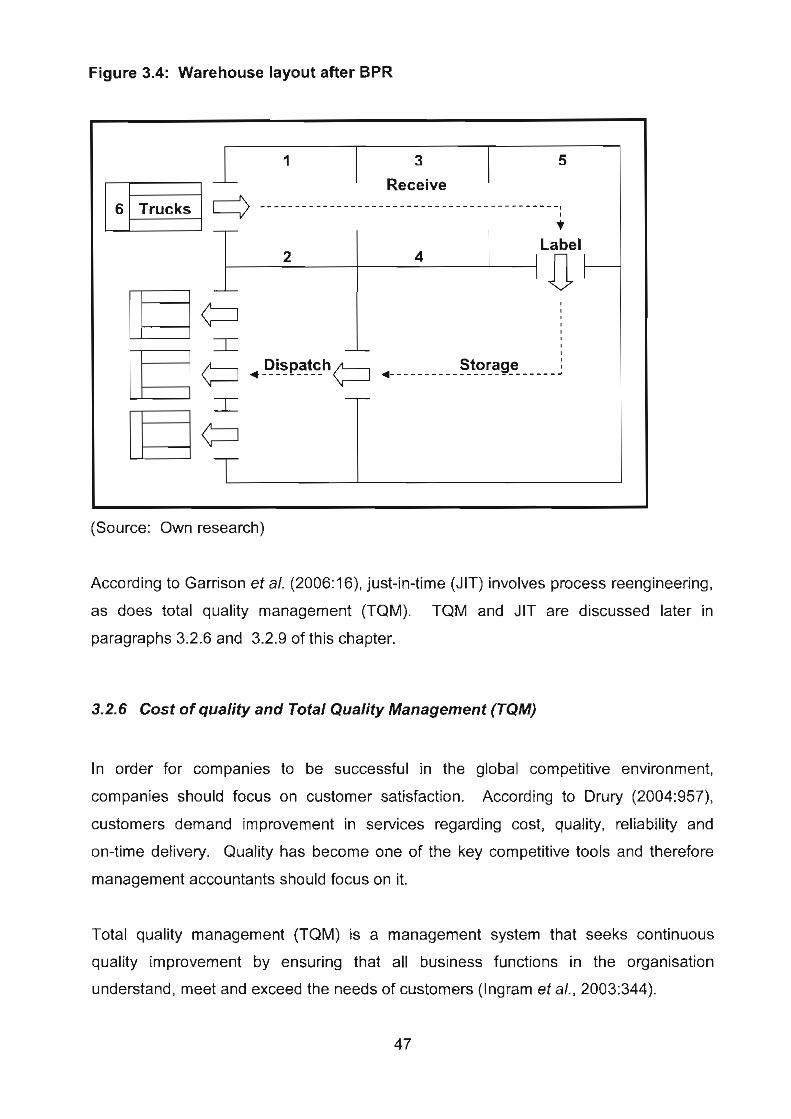
Figure 3.4: Warehouse layout after BPR
6 Trucks 1
(Source: Own research)
According to Garrison et a/. (2006:16), just-in-time (JIT) involves process reengineering,
as does total quality management (TQM). TQM and JIT are discussed later in
paragraphs 3.2.6 and 3.2.9 of this chapter.
5 1 -
3.2.6 Cost of quality and Total Quality Management (TQM)
3
In order for companies to be successful in the global competitive environment,
companies should focus on customer satisfaction. According to Drury (2004:957),
customers demand improvement in services regarding cost, quality, reliability and
on-time delivery. Quality has become one of the key competitive tools and therefore
management accountants should focus on it.
Receive
a - - - - - - - - - - - - - - - - - - - - - - - - - - - - - - - - - - - - - - - - - - - I *
Total quality management (TQM) is a management system that seeks continuous
quality improvement by ensuring that all business functions in the organisation
understand, meet and exceed the needs of customers (Ingram et al., 2003:344).
La be1 -
2 4
-
1
I I I
I I I
I - I
Storage @ +!!!s~=t=ha 4- - - - - - - - - - - - - - - - - - - - -: 1
-
a
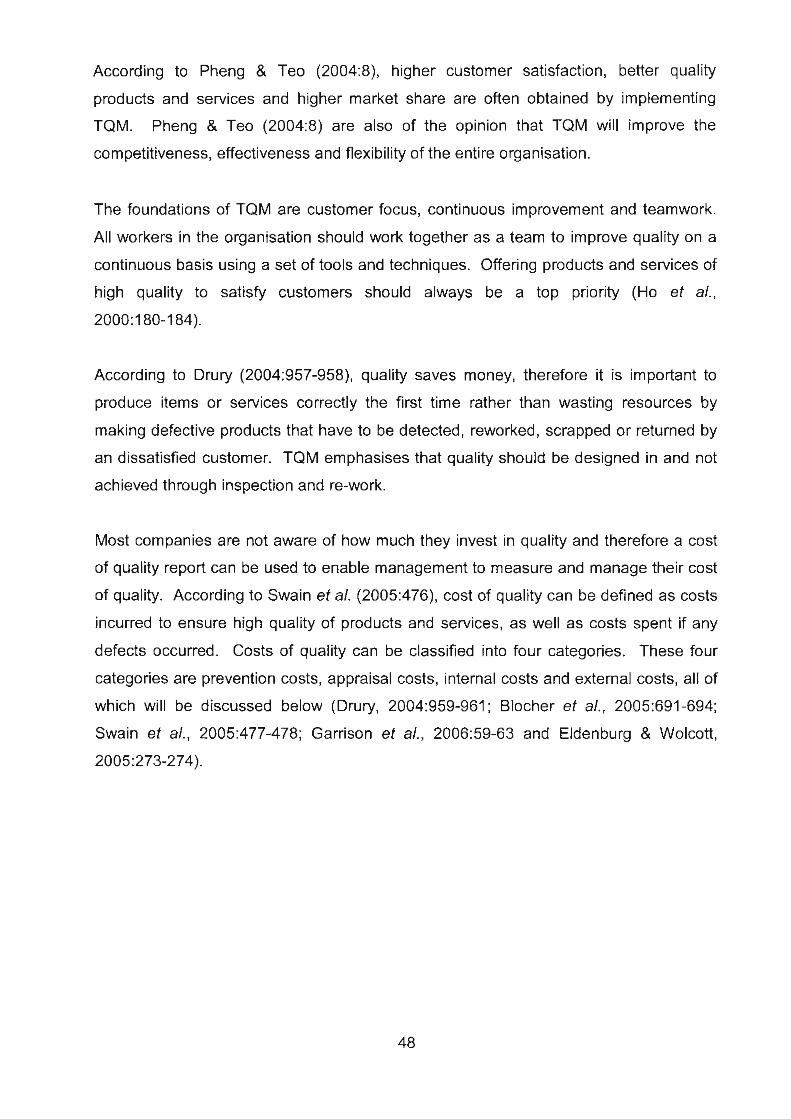
According to Pheng & Teo (2004:8), higher customer satisfaction, better quality
products and services and higher market share are often obtained by implementing
TQM. Pheng & Teo (2004:8) are also of the opinion that TQM will improve the
competitiveness, effectiveness and flexibility of the entire organisation.
The foundations of TQM are customer focus, continuous improvement and teamwork.
All workers in the organisation should work together as a team to improve quality on a
continuous basis using a set of tools and techniques. Offering products and services of
high quality to satisfy customers should always be a top priority (Ho et a/.,
2000:180-184).
According to Drury (2004:957-958), quality saves money, therefore it is important to
produce items or services correctly the first time rather than wasting resources by
making defective products that have to be detected, reworked, scrapped or returned by
an dissatisfied customer. TQM emphasises that quality should be designed in and not
achieved through inspection and re-work.
Most companies are not aware of how much they invest in quality and therefore a cost
of quality report can be used to enable management to measure and manage their cost
of quality. According to Swain et a/. (2005:476), cost of quality can be defined as costs
incurred to ensure high quality of products and services, as well as costs spent if any
defects occurred. Costs of quality can be classified into four categories. These four
categories are prevention costs, appraisal costs, internal costs and external costs, all of
which will be discussed below (Drury, 2004:959-961; Blocher et a/., 2005:691-694;
Swain ef a/., 2005:477-478; Garrison et a/., 200659-63 and Eldenburg 8 Wolcott,
2005:273-274).

1. Prevention costs
Prevention costs are expenditure incurred to ensure that activities are performed
correctly the first time and that the product or service meets customer
requirements. Prevention is better than cure; it is much less costly to prevent a
problem than it is to find and correct the problem after it occurred. Examples of
prevention costs include quality training and planning costs, equipment
maintenance costs, education of suppliers, information system costs, process or
product design costs, information system costs and other quality improvement
costs.
2. Appraisal costs
Appraisal costs (also known as inspection costs) are expenditures incurred on
inspection, testing, sampling of purchased parts, work in progress, and finished
goods or services. These costs are incurred to identify defective products prior
to delivery to customers. Examples of appraisal costs include quality inspectors,
costs to adjust measuring and testing equipment, quality audits and field tests.
3. Internal failure costs
Internal failure costs are expenditures incurred when a product fails to meet
quality standards. These costs are incurred to identify defective products prior to
deliveries to customers, are non-value-adding and are never necessary.
Examples of internal costs are costs of scrap and rework, repair downtime and
work stoppages caused by defects.
4. External failure costs
External failure costs are expenditures incurred when a defective product or
service reaches the customer. External failure costs are usually the highest
costs of a poor quality process. Examples of external costs are repair and
replacement costs, costs of handling customer complaints, product recall,
product liability costs, lost sales due to a reputation of bad quality and costs to
restore reputation.
49

The above-mentioned cost can further be classified either as the price of compliance,
or the price of non-compliance. Prevention and appraisal costs are compliance costs,
because they are incurred to eliminate the costs of defects by ensuring products and
services meet customer expectations. Internal and external costs are non-compliance
costs, because they are incurred due to production imperfections and lead to the
rejection of products or services (Drury, 2004:959 and Blocher et a/., 2005:694-695).
Prevention of poor quality reduces all other costs of quality, therefore optimal
investment in compliance cost is essential (Drury, 2004:959 and Blocher et al.,
2005:694-695). Figure 3.5 below shows the total quality costs as a function of
compliance costs.
Figure 3.5: The effect of quality costs on quality of compliance
9 0 0
r 0 Quallty of conformance 100
(percent of output without defects)
(Source: Garrison et a/., 2006:62-63)
Figure 3.5 above shows that if the costs of compliance are low, total quality costs are
high, and that most of the quality costs consist of non-compliance costs. If the
organisation spends more on compliance costs, the defect rate drops, which leads to
lower internal: and external failure costs and lower total quality costs. Therefore by
spending more on compliance costs, organisations will spend less on non-compliance
costs (Garrison et a/., 2006:62-63).

In accordance with the above, it is clear that prevention costs are the most important
costs in regard to TQM. Examples of prevention costs in the warehouse and
distribution function are: inspection costs for damages once the goods have been
received, vehicle maintenance costs, and 100% accurate labelling costs (ensure that
the label corresponds with the number and colour of the pair of shoes inside the box). It
is important for the warehouse manager to implement TQM tools in the receiving
division, seeing that any mistakes made in the receiving division will impact on the
dispatch department, and eventually on the customer.
The warehouse and distribution function should always focus on delivering a service of
consistently high quality in a timely fashion. The right quantity of the correctly picked
shoes must be delivered to the right destination at the right time. The warehouse and
distribution function should make use of financial and non-financial measurements to
determine how well they meet Tips shoes' needs and expectations. Performance
measures will be discussed in chapter 4.
3.2.7 Cost management and the value chain
The value chain can be defined as a sequence of business activities in which
usefulness is added to the products or service of the organisation to ensure value to the
customer and therefore competitive advantage (Homgren ef a/., 2006:4).
According to Drury (2004:961), the increasing attention to the value chain will lead to
managing costs more effectively and an increase in customer satisfaction. The value
chain is the linked set of value-creating activities that extends all the way from the
production of raw materials through to the end-user of the product or service. These
activities should be coordinated to improve customer satisfaction in terms of
cost-effectiveness, quality and delivery.

lngram ef al. (2003:17) state that the value chain includes internal and external
activities. Each organisation occupies a selected part or parts of the entire value chain.
Managing the value chain requires the organisation to look beyond its own operations to
those of its customers and suppliers. Therefore organisations must develop a close
relationship with customers and suppliers in order to reduce costs of excess inventories.
In other words, value chains explicitly recognise that no organisation operates in
isolation from suppliers and customers.
According to Coyle et a/. (2003:18), the supply chain is a series of integrated
organisations that must share information and coordinate physical execution to ensure a
smooth, integrated flow of goods, services, information and cash.
Information flow is an extremely important success factor in the value chain. According
to Jiambalvo (2004:13), the key is to take advantage of information flows up and down
the value chain by making use of advanced information technology.
Figure 3.6 below illustrates the six business functions within the value chain, namely
research and development, design, production, marketing, distribution and customer
care.
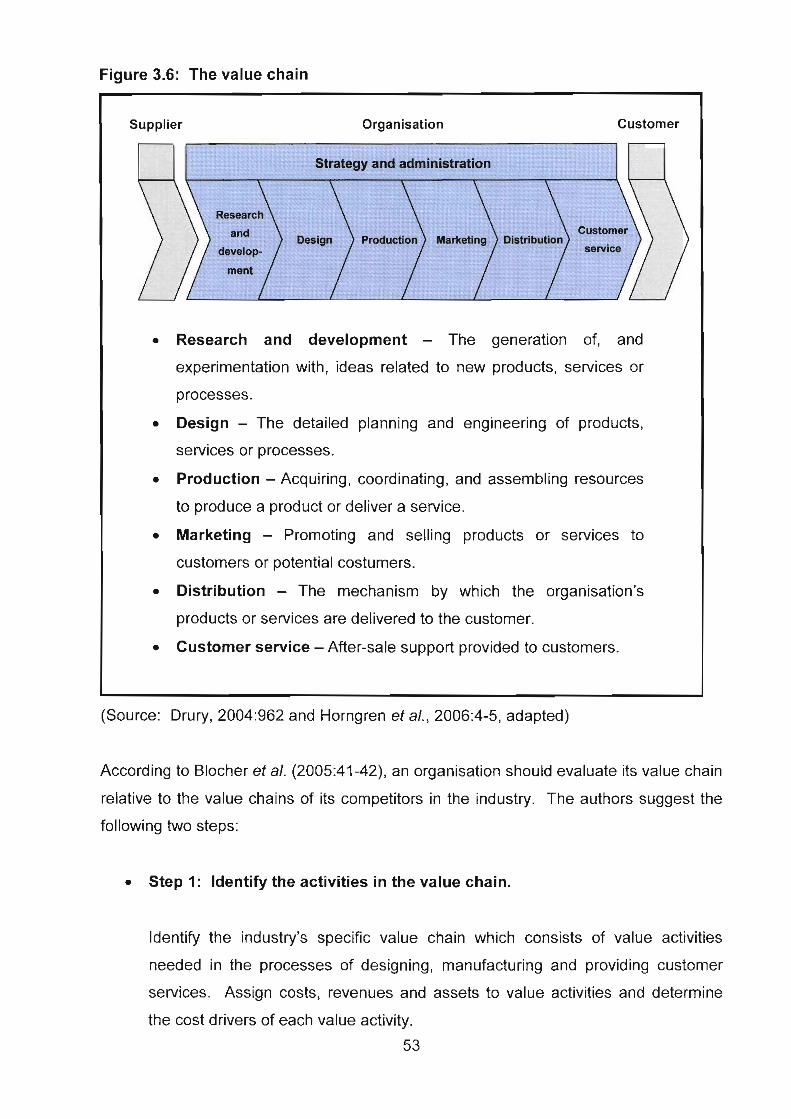
Figure 3.6: The value chain
Research and development - The generation of, and
experimentation with, ideas related to new products, services or
processes.
Design - The detailed planning and engineering of products,
services or processes.
Production - Acquiring, coordinating, and assembling resources
to produce a product or deliver a service.
Marketing - Promoting and selling products or services to
customers or potential costumers.
Distribution - The mechanism by which the organisation's
products or services are delivered to the customer.
Customer service - After-sale support provided to customers.
Supplier Organisation Customer
(Source: Drury, 2004:962 and Horngren et a/., 2006:4-5, adapted)
According to Blocher et al. (2005:41-42), an organisation should evaluate its value chain
relative to the value chains of its competitors in the industry. The authors suggest the
following two steps:
Step I: Identify the activities in the value chain.
Identify the industry's specific value chain which consists of value activities
needed in the processes of designing, manufacturing and providing customer
services. Assign costs, revenues and assets to value activities and determine
the cost drivers of each value activity.
53

Step 2: Develop a competitive advantage.
By studying the value activities and cost drivers identified in the previous step,
the organisation deternines the nature of its current and potential competitive
advantages. The organisation should consider the following:
o ldentify competitive advantage
Managers can better understand the organisation's strategic competitive
advantage, whether it is cost leadership or differentiation, by analysing the
value activities. Managers should determine whether each individual activity
in the value chain is consistent with the overall strategy. Managers should
determine those activities in which the organisation is most and least
competitive.
o Identify opportunities to add value
By analysing value activities, activities which can add significant value for the
customer can be identified. The warehouse and distribution function should
be located close to the airport and dose to their largest customers in order to
provide faster and cheaper delivery.
o Identify opportunities to reduce costs
By analysing value activities the organisation can identify those parts of the
value chain where it is not competitive. The warehouse and distribution
function can outsource some of the smaller deliveries in order to reduce cost
and improve speed and competitiveness.
o Develop linkages among activities in the value chain
It is important for managers to understand that activities in the value chain are
not independent activities but are interdependent activities in which
performance of one activity affects the performance and cost of the next
activities in the value chain. The warehouse and distribution function's
receiving stage should be a hundred percent correct, otherwise it will lead to
faulty orders from the customer.

3.2.8 Benchmarking
According to Grinyer & Goldsmith (1 995:2), benchmarking is the ongoing structured and
objective process of measuring and improving products, services, practices and
processes against the best identified in the world in order to achieve and sustain
competitive advantage.
A benchmark is a standard or norm that others want to copy. Benchmarking is much
more than comparing an organisation's processes with those of others and copying
them. It is a strategic approach followed to ensure the achievement of best practices by
implementing proven tools and methodologies (Hugo ef a/., 2004:108).
According to Holloway et a/. (1999:53), benchmarking is a process by which
organisations study the best practices of other organisations and learn from them to
enhance their own performance. It is an ongoing process of monitoring performance,
adjusting key intemal processes, comparing performance with the current best
performances and examining changes. Mutual benefit over a period of time is expected
if information about key processes is obtained through a co-operative partnership
between organisations.
Swain et a/. (2005:519-520) state that benchmarking involves the comparison of
financial and operating performance against competitors or amongst internal
departments. Swain et a/. (2005:519-520) state that benchmarking usually consists of
four steps:
Step 1 is to analyse the organisation's current practices, procedures and
performance in a given process and to set objectives for improving them. This is
a very important step, seeing that the practices of other organisations will not be
as revealing if the organisation is not aware of its own strengths and
weaknesses.
Step 2 involves selecting a benchmark or benchmarks. These benchmarks can
be competitive organisations or internal departments. It is important to select the
right benchmarks, because selecting the wrong benchmarks can lead to
inappropriate procedures and unrealistic goals for the organisation.
55

In Step 3 detailed information on the benchmark's practices and procedures for
the specific process identified in step 1 is collected and shared. Difficulty is often
experienced in collecting data from competitor companies, but various sources
offer benchmark data, and companies are often willing to share information with
each other, especially when it leads to a win-win situation.
Step 4 involves carefully analysing the data selected in step 3 to determine
which of the policies and procedures used by the benchmark organisations can
be implemented in the organisation to determine its goals as specified in step 2.
According to Botten & Sims (2005:86), there are four types of benchmarking, namely:
I. Internal benchmarking
Internal benchmarking is a comparison between the different processes,
divisions, business units or manufacturing operations within the same
organisation. Internal warehousing activities that could be benchmarked are the
costs activities, such as handling, material flow efficiency and effectiveness of
communication.
2. Functional benchmarking
Functional benchmarking is a comparison between an organisation's internal
functions and the best external practitioners of those functions, regardless of the
industry. The warehouse and distribution function can compare its service with
those of a commercial bank in order to isolate excellent processes that can be
adopted to improve overall customer services.
3. Competitive benchmarking
Competitive benchmarking is a comparison between an organisation and its
direct competitors within the same industry. The warehouse and distribution
function can compare the delivery rates with those of its competitors.
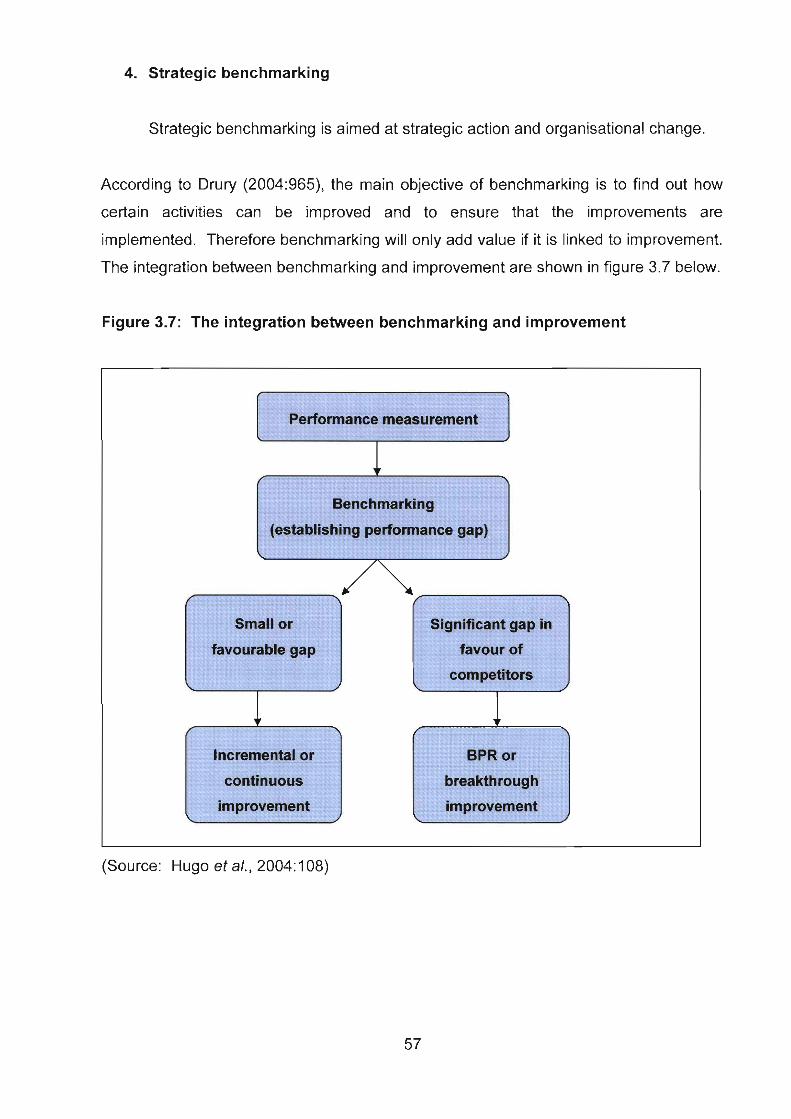
4. Strategic benchmarking
Strategic benchmarking is aimed at strategic action and organisational change.
According to Drury (2004:965), the main objective of benchmarking is to find out how
certain activities can be improved and to ensure that the improvements are
implemented. Therefore benchmarking will only add value if it is linked to improvement.
The integration between benchmarking and improvement are shown in figure 3.7 below.
Figure 3.7: The integration between benchmarking and improvement
Performance measurement
establishing performance gap)
Significant gap in
Incremental or
I
(Source: Hugo et al., 2004: 108)
Benchmarking of processes or activities reveals differences or performance gaps
between the issues compared. The performance gap needs to be identified and
evaluated to determine the implication and potential for improvement. Knowing the size
of the gap will help the organisation to move from where it is to where it wants to be. If
there is a small or favourable gap no radical changes should be made to the process or
activity. Continuous improvement usually associated with TQM (as discussed in
paragraph 3.2.6) and kaizen costing (as discussed in paragraph 3.2.3) are then used to
ensure that the organisation improves in particular areas at a rate consistent with its
vision and strategy. If there is a significant gap in favour of the competitor, more drastic
measures are required. BPR (as discussed in paragraph 3.2.5) is then used to improve
business processes or activities (Hugo eta/. , 2004:109-110).
Drury (2004:965) states that benchmarking is cost beneficial, because an organisation
can save time and money by avoiding mistakes made by the company that has been
benchmarked. Benchmarking also assists organisations in avoiding duplicating the
efforts of other companies.
Benchmarking can be used by managers in the warehouse and distribution function to
monitor and control productivity and quality of their services. Managers can also benefit
from using benchmarking as it aims at improving warehouse and distribution
performance in terms of competitive and strategic advantage. Benchmarking can be
used to achieve more with the same resources, which will lead to a reduction in costs
and an improvement in profitability.
3.2.9 Just-in-time sys tern (JIV
Japanese companies, following the lead of Toyota Motor Company, were the first to use
a management accounting system which focused on controlling the cost, quality and
timeliness of inventory. This system became known as the just-in-time (JIT) system
(Swain et a/., 2005:420-421; Garrison et a!., 2006:12-13 and Jiambalvo, 200456).
According to Swain et a/. (2005:420), a JIT system can be defined as a system that
emphasises removing waste of effort, time and inventory cost from the organisation.
This leads to a decrease in or elimination of needless inventory in a production system.

In organisations that use a JIT production and inventory control system, materials are
purchased and units are produced only as needed to meet actual customer demand.
JIT is also considered a demand-pull system due to the fact that demand triggers each
step in the manufacturing process (Horngren et a/., 2006:703-704). Close coordination
among organisations and suppliers are essential to ensure that goods or materials are
delivered just as they are needed for production or sale (Swain et al., 2005:420-421 and
Garrison et a/. , 2006: 1 3).
JIT seeks to achieve the following goals:
The meeting of customer demand in a timely way
High-quality products
Lowest possible costs
Elimination of non-value-adding activities
A decrease in or elimination of inventories
100% on time delivery service
(Drury, 2004:967; Garrison et a/., 2006:13 and Jiambalvo, 2004:56).
According to Eldenburg & Wolcott (2005:514), the successful implementation of a JIT
system requires organisations to:
Find reliable suppliers
Find a manageable number of suppliers
Find suppliers with short transit times
Develop efficient and effective handling processes
Develop the commitment of management to the JIT system
3.2.9.1 Just-in-time and value-adding activities
The fundamental philosophy of .llT is to eliminate waste. Waste is defined as anything
which does not add value to a product or service, such as non-value-adding activities.
Non-value-adding activities as discussed in, paragraph 2.6.2 are activities that are
unnecessary and can be reduced or eliminated, for example setup work, material
handling, and inspection. Value-adding activities as discussed in, paragraph 2.6.2 are
59

activities that customers recognise as adding value to the product or service they
purchase (Pheng & Tan, 1998:621; Gunasekaran et al., 1999:328; Drury, 2004:967-968
and Swain eta/., 2005:420-421).
Cycle time involved in manufacturing a product consists of process time, inspection
time, move time, queue time and storage time. Only process time adds value to the
product, the rest of the activities add cost to the product and are therefore
non-value-adding activities within the JIT system. The JlT system focuses on reducing
lead times in order to reduce the total costs. Cycle time measures will be discussed in
more detail in paragraph 4.3.2.3(i).
3.2.9.2 Just-in-time purchasing arrangements
According to Horngren et al. (2006:698), JIT purchasing is the purchase of materials or
goods to ensure that delivery is made just in time for production or sales. JIT
purchasing works effectively if all materials or goods arrive at the right time, in the right
place and in the right quantity. All materials and goods that arrive should be usable
(Gunasekaran et al., 1999:331).
Under a JIT purchasing system (Garrison & Noreen, 2000:12-13):
An organisation relies on a few ultra-reliable suppliers. SLA's management
should reduce their transporters from the port of discharge to the warehouse to
only two reliable transporters that are rewarded with long-term contracts.
Suppliers should make frequent deliveries of small orders just before the goods
are needed. Stocks can be cut to the minimum. Undependable suppliers who do
not meet delivery schedules must be weeded out.
Suppliers must deliver zero defect goods. Suppliers must become so reliable
that incoming goods should not need to be inspected. This will lead to savings in
material handling expenses.

Retail organisations like Tip shoes must maintain some inventories or they would not be
able to operate. But the amount of time the product spends on the shelf or in the
warehouse can be reduced to a large extent. The JIT approach is in contrast to the
warehousing operating system because (Drury, 2004:970 and Gunasekaran et a/.,
1 999:331):
it reduces investment in raw materials and work in progress (WIP) stocks,
throughput time and space requirements in the warehouse are reduced,
process flow in the warehouse becomes continuous, and
negotiating with fewer suppliers leads to a saving in the queuing time of batches.
3.2.9.3 Just-in-time performance measurement
According to Drury (2004:970), management accounting must support a JIT system.
Therefore time-based performance measures are critical for management to evaluate
and control a JIT system. Great emphasis must be placed on effective information
systems that provide information regarding sales forecast, supplier reliability, set-up
times, throughput cycle time, lead time, percentage of customer and suppliers' on-time
deliveries, inventory level and defect rates (Swain et a/., 2005:422-423 and
Drury, 2004:970).
For a JIT system to work effectively in the warehouse and distribution function there
should be proper communication, co-operation and trust between the customer and the
supplier. Removing non-value-adding activities along the whole supply chain should be
the purpose of both the supplier and the customer.
3.3 SUMMARY
Activity-based costing represent the basis for cost management applications. Cost
management describes the activities of managers in the short- and long-term in which
they, implement programmes to control decisions that minimise costs of products or
services, andlor increase the value or quality of the products or services (or at least
maintain current value or quality) to ensure customer satisfaction. Cost management
forms an important part of management strategies and their implementation. Therefore
several approaches have been described throughout this chapter that fall within the cost
management area.
Managers commonly use the following cost management tools to implement an
organisation's strategy and to facilitate the achievement of success in respect of critical
success factors: LCC, (TC), kaizen costing, ABM, BPR, costs of quality and TQM,
value chain, benchmarking and JIT.
LCC estimates and accumulates costs involved over a product's entire life cycle. LCC
assist managers to determine if profits earned during the manufacturing phase will
cover the costs incurred during the pre- and post-manufacturing phase. LCC
contributes to target costing (TC). TC is a technique that manages costs during the
planning and design stage of a product or service. It is a structured process aimed at
insuring that a product launched with specified functionality, quality and sales price can
be produced at a life-cycle cost that generates a satisfactory level of profitability. Value
engineering is used in TC to reduce product cost. Value engineering assists
organisations in managing the trade-offs between functionality and cost.
TC is applied during the design stage of the product life cycle whereas, kaizen
(continuous improvement) costing is the ongoing process of finding new ways to
minimise and manage cost during the manufacturing process of the product life cycle.
'There is a close relationship between target and kaizen costing and they must be used
together continuously to reduce cost and improve value.
BPR concerns a detailed examination of the current business processes and making
radical changes to how the organisation currently operates. It involves fundamental
rethinking and radical redesign in order to identify and eliminate non-value added
activities, to reduce opportunities for error, reduce cost and improve quality, service,
lead time, flexibility, innovation and customer satisfaction.
62
Total quality management (TQM) is a management system that seeks continuous
quality improvement by ensuring that all business functions in the organisation
understand, meet and exceed the needs of customers.
The value chain is a sequence of business activities in which usefulness is added to the
products or service of the organisation. The value chain ensure value to the customer
and therefore competitive advantage. In order to achieve and sustain competitive
advantage benchmarking can be used, benchmarking is the ongoing structured and
objective process of measuring and improving products, services, practices and
processes against the best identified in the.
A JIT system is a system that emphasises removing waste of effort, time and inventory
cost from the organisation. This leads to a decrease in or elimination of needless
inventory in a production system. Which minimise costs and increase profitability.
SLA's management should consider making use of the relevant cost management tools
described throughout chapter 3 in order to manage and reduce costs where possible so
as to improve the current lack of profitability in the warehouse and distribution function.
CHAPTER 4
PERFORMANCE MEASUREMENT AND PERFORMANCE
MANAGEMENT
4.1 INTRODUCTION
According to Swain et a/. (2005:572), the increase in competitiveness in the market
requires that organisations continually improve their information systems in order to
support their strategy and assist management to operate its organisation more
effectively and efficiently. Management needs more than only the traditional financial
measures in order to measure their performance. Non-financial measures of quality
and time, customer service, internal business processes, and learning and growth are
becoming more important in the current competitive market.
Performance measurement is an effective way of increasing the competitiveness and
profitability of an organisation through encouragement of productivity improvements.
According to Tangen (2003:347), appropriate financial and non-financial performance
measures can ensure that managers adopt a long-term perspective and allocate the
organisation's resources to the most effective improvement activities.
The balanced scorecard (BSC) introduces by Kaplan and Norton in 1992 is a
performance management system that focuses on conveying financial and non-financial
information and assist managers in translating the organisation's vision, core
competencies and strategies.
In this chapter, performance measures are firstly discussed, focusing on financial and
non-financial measures. Secondly, the BSC is discussed as a performance
management system that conveys financial and non-financial performance measures
and focuses on the strategy of the organisation.
4.2 PERFORMANCE MEASUREMENT
Without performance measurement, there cannot be performance management.
Performance measurement is the act of measuring performance, whereas performance
management aims to respond to the measured outcome, using it to manage
performance (Radnor & McGuire, 2003:246).
Neely et a/. (1995:81) define performance measurement as the process of quantifying
action, where measurement is the process of quantification and action correlates with
performance. Performance is the efficiency and effectiveness of action, which leads to
the following definitions:
Performance measurement is defined as the process of quantifying the
efficiency and effectiveness of action.
A performance measurement is defined as a metric used to quantify the
efficiency and/or effectiveness of an action.
A performance measurement system (PMS) is defined as the set of mctrics
used to quantify the efficiency and effectiveness of action.
According to Venveire & Van Den Berghe (2004:6), performance measures should
provide information from data that have been collected, analysed and reported. Such
information should be used to make sound business decisions. Therefore performance
measures should be clear, comprehensible, understandable, result-orientated, useful,
valid, verifiable and accurate.
There are two types of performance measures; firstly, financial performance measures
and secondly, non-financial measures. These are discussed below.
4.2.1 Financial measures
Traditionally managers relied on financial measures that provide information measured
in rands or ratios of rands (Eldenburg & Wolcott, 2005:634). Some of the frequently
used financial measures are discussed next.

4.2.1 .I Return on investment (ROI)
Return on investment (ROI) is a financial measure that measures the return (how much
has been earned) on assets (investments) of an organisation (Swain ef a/., 2005:355).
The higher the ROI of an organisation or department in an organisation, the greater the
profit earned per rand invested in the organisation or department in an organisation
(Garrison et al., 2006:556).
ROI is calcujated as net operating income divided by average operating assets
(Garrison et a/., 2006556). Therefore the formula can be set out as follows:
Net operating income ROI =
Average operating assets
Or according to the Du Pont Perspective ROI should look at both margin and turnover in
assessing performance management. The above calculation can be modified by
introducing sales, as follows (Garrison ef a/., 2006556-557):
ROI = Margin x Turnover
- - Net operating income X Sales
Sales Average operating assets
Net operating income is calculated as earnings before interest and taxes and is
sometimes referred to as EBlT (earnings before interest and taxes). Net operating
assets are all assets used in the production of goods and/or services. Examples of net
operating assets that would be included are cash, accounts receivable, inventory, and
plant and equipment. Examples of non-operating assets that would not be included in
the above calculation are investment in other companies or property, or a building
rented to another company. The average of the operating assets between the
beginning and the end of the year is generally used because of two reasons. First, the
measure is intended to capture operations over a period of time. Secondly, it is used to

prevent manipulation by decreasing the investment at the time performance is
measured (Eldenburg & Wolcott, 2005:597 and Garrison et al., 2006556).
a) Advantages of ROl
R01 can be used for inter-departmental comparisons within a company as well as
comparisons of the company with others in the industry (benchmarking) (Eldenburg 8
Wolcott, 2005:597 and Drury, 2004:845). ROI prevents managers from over-investing
in projects. Another advantage of ROI is that its components (sales, costs,
investments) represent profitability as a single percentage (Horngren et a/., 2006:793-
794) and motivates managers to increase sales, decrease costs and minimise asset
investment (Eldenburg & Wolcott, 2005597).
6) Disadvantages of ROl
However, the problem with ROI emerges when departmental managers are
discouraged to invest in projects that reduce the departmental R01, even though it
improves the ROI for the overall organisation (Drury, 2004:845 and Eldenburg &
Wolcott, 2005:599). Another disadvantage is that ROI does not include measures of
risk. Managers can increase ROI by investing in riskier projects, which will have higher
returns in the short term, but will add risk to the company in the long term (Eldenburg &
Wolcott, 2005:600).
Although R01 is widely used to evaluate investment centres, because of its
disadvantages, some organisations use a closely related measure called residual
income, which is discussed next.
4.2.4.2 Residual income (RI)
Residual income (RI) is a financial measure that measures the rand amount of profits in
excess of a required rate of return (Eldenburg 8 Wolcott, 2005:600). According to
Garrison et al. (2006:561) and Swain et al. (2005:357), RI is the amount of net operating
income that an investment centre is able to earn above the required rate of return on the
average operating assets.

RI can be calculated as follows (Eldenburg & Wolcott, 2005:601; Garrison et a/.,
2006:561 and Swain eta/., 2005357):
RI = Net operating income - (Required rate of return X Average operating
assets)
a) Advantages of R/
The RI approach encourages managers to invest in any project with returns equal or
greater than the required rate of retum. This means making investments that benefit
the entire organisation (Garrison et a/., 2006:563; Swain et a/., 2005357-358 and
Eldenburg & Wolcott, 2005:601). An additional advantage is that when differences in
risk occur, the organisation can adjust the required rate of return. Therefore
departments with a higher risk can be evaluated at a higher required rate of retum
(Blocher el a/., 2005:778). Another advantage of R1 is that it is possible to calculate a
different investment charge for different types of assets. Therefore a higher required
rate of return could be used for long-term assets (Blocher eta/., 2005778).
b) Disadvantages of Rl
According to Drury (2004:847), the problem with RI, however, is that it is not a
percentage, thus managers find it difficult to compare the performance of departments
with that of other departments or organisations, if they are different sizes.
4.2.1.3 Economic value added (EVA)
Economic value added (EVA) is an organisation's returns after taxes and after
deducting the cost of capital (Blocher et a/., 2005:779). RI has been refined and
renamed as EVA. EVA incorporates a number of adjustments to reduce the
disadvantages of RI. EVA uses the organisation's cost of capital instead of a required
rate of return (Blocher et a/., 2005:779). According to Drury (2004:848), the EVA
concept extends the RI measure by incorporating adjustments to the divisional financial
performance measure for distortion introduced by generally accepted accounting
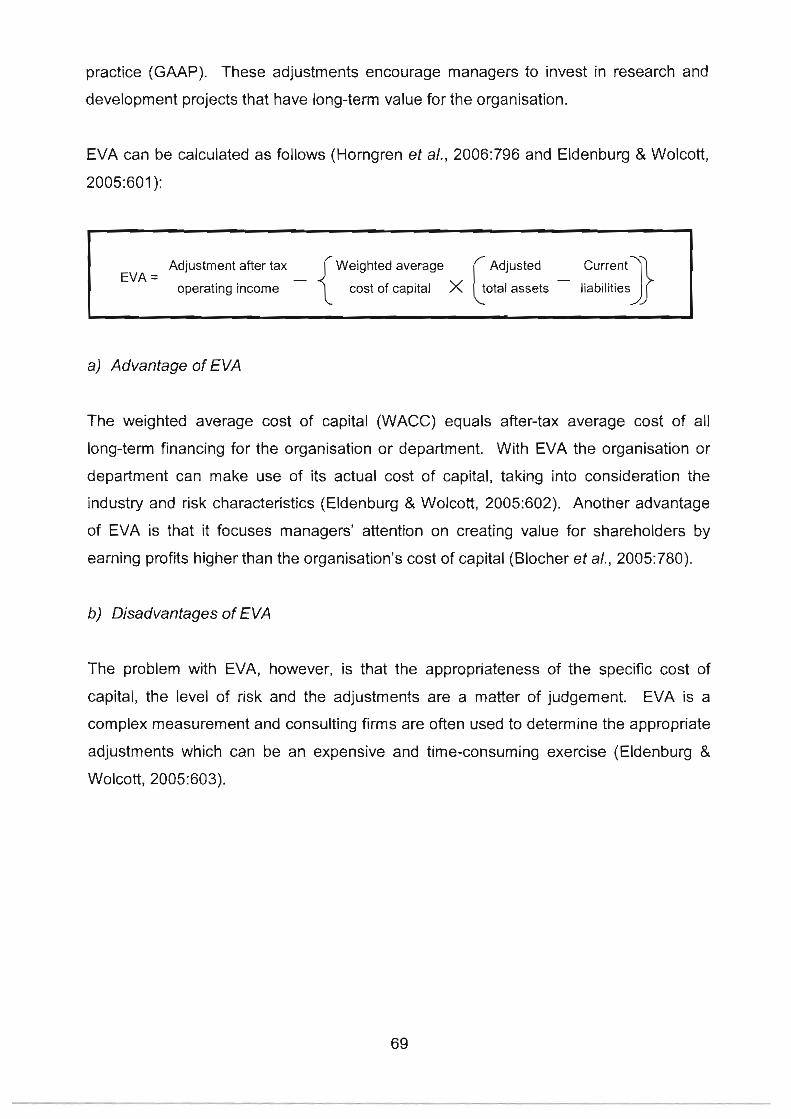
practice (GAAP). These adjustments encourage managers to invest in research and
development projects that have long-term value for the organisation.
EVA can be calculated as follows (Horngren et a/., 2006:796 and Eldenburg & Wolcott,
2005:601):
Adjustment after tax Weighted average i Adjusted EVA = -
operating income cost of capital X total assets liabilities
a) Advantage of EVA
The weighted average cost of capital (WACC) equals after-tax average cost of all
long-term financing for the organisation or department. With EVA the organisation or
department can make use of its actual cost of capital, taking into consideration the
industry and risk characteristics (Eldenburg & Wolcott, 2005:602). Another advantage
of EVA is that it focuses managers' attention on creating value for shareholders by
earning profits higher than the organisation's cost of capital (Blocher et a/., 2005:780).
b) Disadvantages of EVA
The problem with EVA, however, is that the appropriateness of the specific cost of
capital, the level of risk and the adjustments are a matter of judgement. EVA is a
complex measurement and consulting firms are often used to determine the appropriate
adjustments which can be an expensive and time-consuming exercise (Eldenburg &
Wolcott, 2005:603).

4.2.1.4 Profit-based financial performance measurements
a) Contribution margin
Contribution margin = Sales revenue - variable cost
Contribution margin is the amount of revenue that remains to cover fixed costs or fixed
overheads and provide a profit for an organisation (Horngren et a/., 2006:62; Drury,
2004:271-272 and Swain et a/., 200558).
b) Controllable profit
Controllable profit = Sales revenue - (Divisional variable costs + divisionally separable
controllable fixed costs)
Controllable profit is the most appropriate measure used to measure the performance of
a department, since it measures the skill of managers to use the resources under their
control effectively (Botten & Sirns, 2005:397).
c) Net income
Net income = Operating income - Income taxes
Net income is operating income plus non-operating revenues, such as interest revenue,
minus non-operating costs, such as interest cost, minus income taxes (Horngren et a/.,
2003:63).
d) Operafing income (Horngren etal., 2006:40).
Operating income = Total revenues from operations - Cost of goods sold and operating
costs excluding income taxes
e) Net profit
Net profit = Revenues - expenses (Firer etal., 2004:27)
70
f) Return on sales (ROS)
ROS = Operating income/revenues
ROS is one component of ROI in the DuPont method of profitability analysis and it is
also referred to as the income-to-revenue (or sales) ratio (Horngren eta/., 2006:797).
g) Revenues
Revenues = inflows of assets
Inflows of assets are usually cash or accounts receivable, received from customers for
products and/or services provided (Horngren et al., 2006:38-39).
h) Sales margin
Sales margin = Sales - Variable cost
This measurement determines the return on a specific product or service. It shows the
effect of different selling prices and different priced input on a product or service. This
measurement will assist management to make the best decisions regarding the making
or selling of a given product or service (Botten & Sims, 2005:397).
i ) Shareholder value
Shareholder value = Corporate value - Debt
Where: Corporate value = present value of cash flows from its activities over the
forecast period + any residual cash flows following the
end of that period, such as from disposal of assets
(Botten & Sims, 2005:398).
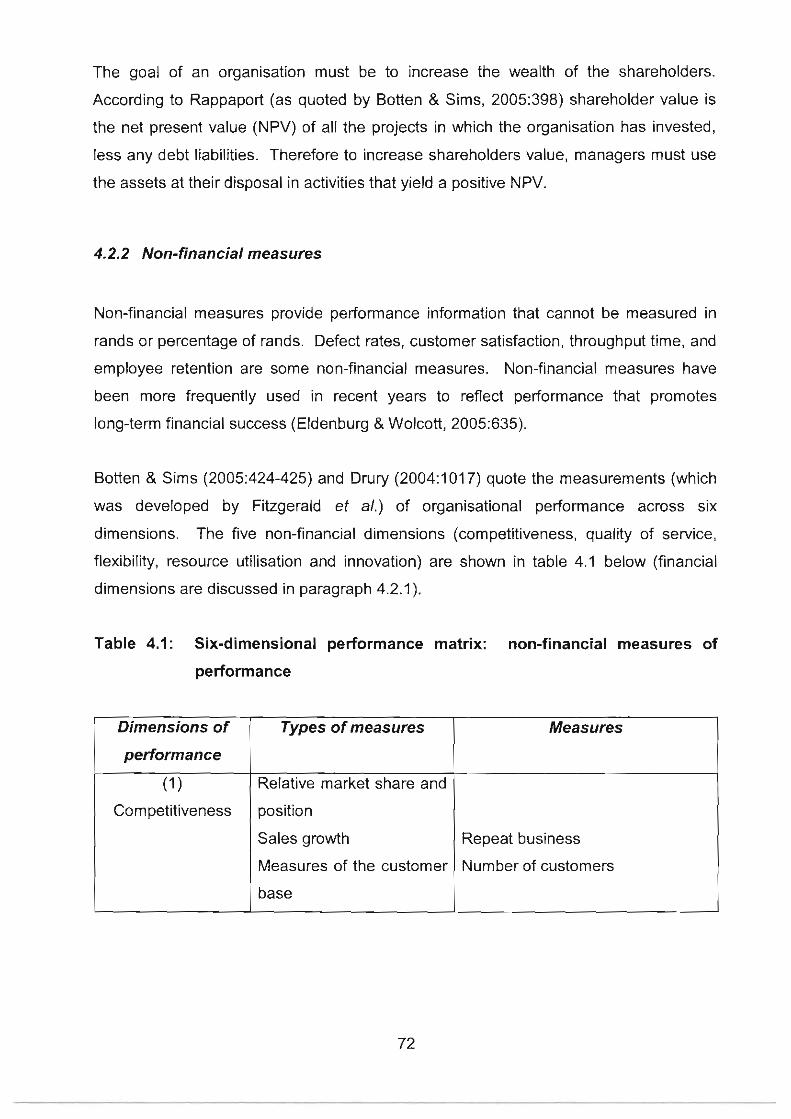
The goal of an organisation must be to increase the wealth of the shareholders.
According to Rappaport (as quoted by Botten & Sims, 2005:398) shareholder value is
the net present value (NPV) of all the projects in which the organisation has invested,
less any debt liabilities. Therefore to increase shareholders value, managers must use
the assets at their disposal in activities that yield a positive NPV.
4.2.2 Non-financial measures
Non-financial measures provide performance information that cannot be measured in
rands or percentage of rands. Defect rates, customer satisfaction, throughput time, and
employee retention are some non-financial measures. Non-financial measures have
been more frequently used in recent years to reflect performance that promotes
long-term financial success (Eldenburg & Wolcott, 2005:635).
Botten & Sims (2005:424-425) and Drury (2004:1017) quote the measurements (which
was developed by Fitzgerald et a/.) of organisational performance across six
dimensions. The five non-financial dimensions (competitiveness, quality of service,
flexibility, resource utilisation and innovation) are shown in table 4.1 below (financial
dimensions are discussed in paragraph 4.2.1).
Table 4.1: Six-dimensional performance matrix: non-financial measures of
performance
Dimensions of
performance
(1 1 Competitiveness
Types of measures
Relative market share and
position
Sales growth
Measures of the customer
base
Measures
Repeat business
Number of customers

Table 4.1: Six-dimensional performance matrix: non-financial measures of
performance (continued)
Responsiveness
Measures Dimensions of
performance
(2)
Quality of service
Aestheticslappearance
1 Types of measures
Reliability
Comfort
Friendliness
Communication
Courtesy
Product reliability
Punctuality
Dependability of service and staff
Delivery speed
Response times
Number of phone lines
Average time of phone call
Appearance of staff
Appearance or taste of foods
Look of buildings
Of staff
Of premises
Of goods
Congestion
Seating comfort
Atmosphere
Ambience
Helpfulness of staff
Attentiveness
Intelligibility of information
Clarity of signposting
Clarity of staff-customer interaction
Politeness
Respect
Propriety of staff towards
customers
Staff skill
Expertise
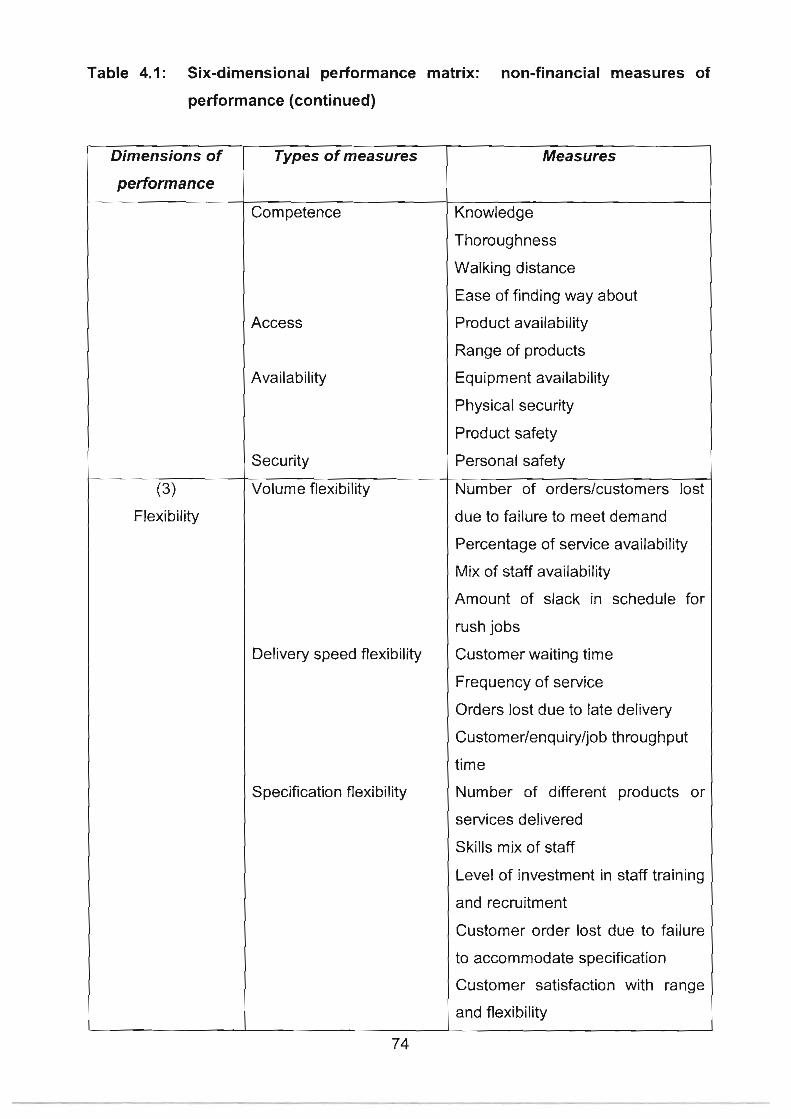
Table 4.1: Six-dimensional performance matrix: non-financial measures of
performance (continued)
Dimensions of
performance
(3)
Flexibility
Types of measures
Competence
Access
Availability
Security
Volume flexibility
Delivery speed flexibility
Specification flexibility
Measures
Knowledge
Thoroughness
Walking distance
Ease of finding way about
Product availability
Range of products
Equipment availability
Physical security
Product safety
Personal safety
Number of orders/customers lost
due to failure to meet demand
Percentage of service availability
Mix of staff availability
Amount of slack in schedule for
rush jobs
Customer waiting time
Frequency of service
Orders lost due to late delivery
Customerlenquiryljob throughput
time
Number of different products or
services delivered
Skills mix of staff
Level of investment in staff training
and recruitment
Customer order lost due to failure
to accommodate specification
Customer satisfaction with range
and flexibility

Table 4.1: Six-dimensional performance matrix: non-financial measures of
performance (continued)
In Batten & Sims (2005424-425) and Drury (2004:1017), developed by Fitzgerald et a/.
Measures
Labour hours
Percentage of slack or transit time
Skill level of work performed by
grade of staff
Percentage of area used to serve
customers
Occupancy loading
InputlOutput ratios
Cost per unit
Average development cost per
service
Development cost of individual
service
Percentage of turnover spent
developing new
serviceslproductslprocesses
How many new services
developed per annum
Five new services that are
successful
Concept to service launch time
Prototype to launch time
Time to adopt new concept from
outside the firm
Dimensions of
performance
(4)
Resource utilisation
(5)
Innovation
Types of measures
Productivity
Efficiency
Performance of the
innovation process
Performance of individual
innovations

According to Tangen (2003:353), the choice of suitable measurement techniques,
whether financial or non-financial, depends on a number of factors:
the purpose of the measurement
the level of detail required
the time available for the measurement
the existence of available predetermined data
the cost of the measurement.
All financial and non-financial measurements have advantages and disadvantages,
some are more complex than others and some are more appropriate to particular
circumstances. Management should use the measures that offer data that are useful to
monitor performance and take appropriate action.
4.3 PERFORMANCE MANAGEMENT
According to Folan B Browne (2005:674), performance management makes use of
performance measurement data in order to effect positive change in organisational
culture, systems and processes, by helping set performance goals, allocating and
prioritising resources, informing managers either to confirm or to change current policy
or programme directions to meet these goals, and sharing the results of performance in
pursuing those goals.
Performance management is a process that helps managers of an organisation to
develop, implement and change its strategy and objectives in order to satisfy its
stakeholders' needs (Verweire & Van den Berghe, 2004:7).
According to Armstrong & Baron (2003:51), the basic objectives of performance
management is to ensure that everyone understands where the organisation stands and
what is to be achieved, to develop the capacity of people and the organisation to
achieve it, and to provide support and guidance to individuals and teams to ensure
continuous improvement. Thus the primary objective is to achieve organisational
effectiveness, in order to ensure better results so as to meet shareholders' needs.

Communication between management and employees plays an important role in
performance management. Organisational objectives should be well communicated to
employees to ensure that they work as effectively and efficiently as possible and to
ensure that they take responsibility for achieving their own goals in order to improve and
meet the organisation's mission, vision and objectives (Verweire & Van den Berghe,
2004:7 and Armstrong & Baron, 2003:51).
The growth from performance measurement to performance management is perfectly
illustrated by the development of the BSC, which will be discussed below.
4.3. I Defining the Balanced Scorecard
The balanced scorecard (BSC) was developed by Robert Kaplan and consultant David
Nortan in the early 1990s. The need to link financial and non-financial measures of
performance and the identification of key performance measures led to the appearance
of the BSC. The BSC consists of a set of measures that gives top management a quick
but comprehensive view of the organisational unit (i.e. a divisionlstrategic business unit)
(Drury, 2004:lOO I ).
According to Horngren et a/. (2006:457), the BSC balances the use of financial and
non-financial performance measures to evaluate short-term and long-term
performances in a single report. Horngren ef a/. (2006:457) define the BSC as a model
that translates the organisation's mission and strategy into a set of performance
measures that provides the framework for implementing the strategy.
The BSC is a performance management system that can be used in any organisation to
support vision and mission with customer requirements and day-to-day work, manage
and evaluate business strategy, monitor improvements in operational efficiency, build
organisational capacity, and communicate progress to employees (Rohm, 2005:l).
Chan (2004:205) defines the BSC as a customer-based planning and process
improvement system. The primary focus is to drive an organisation to change process
by identifying and evaluating relevant performance measures. It is an essential part of
the mission identification, strategy formulation and process implementation, with the
emphasis on translating strategy into a related set of financial and non-financial
measures.
This strategy is a matter of choosing the market and customers segments the business
unit intends to serve, identifying the critical internal an business processes that the unit
must accept so as to deliver the value propositions to customers in the targeted market
segments, and selecting the individual and organisational capabilities required by the
internal, customer and financial objectives (Hansen & Mowen, 2003:594).
The BSC as illustrated in figure 4.1 below allows managers to look at the organisation
from four different perspectives by seeking to provide answers to the following four
basic questions (Drury, 2004:1001; Brewer & Speh, 2000:83-84 and Hendricks et a/.,
2004:2):
I. To succeed financially, how should we appear to our shareholders?
(Financial perspective)
2. To achieve our vision, how should we appear to our customers?
(Customer perspective)
3. To satisfy our shareholders and customers, what business processes must we
excel at? (Internal business perspective)
4. To achieve our vision, how will we sustain our ability to change and improve?
(Learning and growth)
According to Swain et a/. (2005:575), the answers to the above questions verify the
management objectives for the organisation, the measures that support those
objectives, the short-term and long-term targets for those measures, and what
initiatives need to be put into place to begin working toward the targets.
The four perspectives will be discussed in more detail in paragraph 4.3.2.

Figure 4.1 : The balanced scorecard
"To succeed financially, how should "To satisfy our
we appear to our shareholders?" shareholders
"To achieve and customers,
our mission, what busmess
how should we
appear to our must we excel
CUS
Objective8 Targets Measures Initiatives
"To achieve our vision, how will we sustain
our ability to change and improve?"
- (Source: Kaplan & Norton, 1996:9)
4.3.2 The four perspectives of the BSC
The BSC focuses on four perspectives of performance: financial, customer, internal
business process, and learning and growth perspective. These four perspectives are
discussed in greater detail below.
4.3.2.1 Financial perspective
According to Garrison et al. (2006:450), most organisations exist to provide financial
reward (level of ROI) to the owners of the organisation. However, financial measures
are not sufficient in themselves and by improving the non-financial measures in a well
79

designed BSC, improved financial measures should follow (Garrison et at., 2006:450
and Dnrry, 2004:1006). According to Garrison et al. (2006:450), financial measures
report on the results of past actions, whereas non-financial measures of key success
drivers such as customer satisfaction are leading indicators of future financial
performance.
According to Eldenburg 8 Wolcott (2005:638), the financial perspective assists
management in determining an organisation's progress towards the desired financial
goal and encourages managers to evaluate the effectiveness of their vision and
strategy. Therefore, this perspective evaluates the profitability of the strategy. Financial
measures are usually related to profitability, growth and owner's value. Common
measures include R01, Rl, EVA (as per paragraph 4.2.1).
Because the financial performance measures have already been described in
paragraph 4.2.1 we shall concentrate on the remaining three scorecard perspectives.
4.3.2.2 Customer perspective
-The customer perspective is concerned with identifying the customer and market
segment in which the organisation will compete, and with developing strategies to get
them and keep them. Market share is the proportion of sales in a particular market that
an organisation obtains. Market share can be measured in terms of sales revenues,
unit sales volume or number of customers. The market share can be increased in two
ways: retaining current customers or acquiring new customers (Drury, 2004:1006-1007
and Swain ef a/., 2005:579).
According to Swain eta/. (2005:577-580), there are two types of customer performance
measures: leading measures and outcome measures. Leading measures focus on
fulfilling customer expectations regarding cost, quality and time factors, thus customer
value. Increasing customer value builds customer loyalty and increases customer
satisfaction which brings us to outcome measures. Outcome measures determine if
the improvements in leading measures result in more satisfied and loyal customers,
thus the customer perspective.

According to Hansen 8 Mowen (2003:596), customer value is the difference between
realisation and sacrifice, where realisation is what the customer receives (for example:
product quality, reliability of delivery, delivery response time, image and reputation) and
sacrifice is what is given up (for example: the price of the product or service and time
required to learn to use the product or service). Thus, customers value the right
combination of cost, quality and time (Hansen & Mowen, 2003596 and Swain et a/.,
2005577).
The customer perspective is measured by customer satisfaction and loyalty.
Customer satisfaction can be measured by making use of questionnaire surveys and
customer response cards (Drury, 2004:1007 and Eldenburg & Wolcott, 2005638). The
number and nature of customer complaints and feedback from sales representatives will
also be an indicator of customer satisfaction. The drawback of customer satisfaction
measures is that they measure attitudes and not actual buying behaviour. Customer
loyalty can be measured by the number of new customers referred by existing
customers, since only a highly satisfied customer will recommend organisations'
products or services to others (Drury, 2004:1007).
An organisation does not only want satisfied customers, it also wants profitable
customers. This measure is the only financial measure in the customer perspective;
this measure, however is critical to emphasise the importance of the right kind (the
profitable kind) of customer. Activity-based costing as discussed in chapter 2 is a key
tool in assessing customer profitability, seeing that it will assist management in
identifying unprofitable segments of customers. For unprofitable existing customers,
actions such as consuming less resources, or increasing prices should be taken. If
neither of these strategies is successful, the customer should not be retained (Drury,
2004:1008 and Hansen & Mowen, 2003:596).
4.3.2.3 Internal business perspective
The internal business perspective helps managers identify the critical internal processes
in which the organisation must excel in implementing its strategy. One goal of this
analysis it to improve processes that will have the greatest impact on customer
satisfaction. Another goal is to improve the efficiency of operations, which contributes

directly to achieving the organisation's financial objectives (Drury, 2004:1009 and
Eldenburg & Wolcott, 2005:597).
According to Horngren et a/. (2006:459), the internal business perspective comprises
three sub-processes. They are
innovation processes,
operation processes, and
post-sales service processes.
a) Innovation processes
The innovation processes are concerned with processes to identify customer needs and
to create products, services and processes that will meet those needs (Eldenburg &
Wolcott, 2005639; Horngren et a/., 2006:459; Swain et a\., 2005:580 and Drury,
2004:1009). Organisations identify new markets, new customers and the needs of
existing customers. Organisations then design and develop new products or services
that enable them to reach the new identified markets and customers (Drury,
2004:1009).
According to Drury (2004:1010), as part of the innovation process, managers undertake
market research to identify customer preferences in regard to quality, functionality and
price, and also predict the potential market size. Accurate information on market size
and customer preferences become essential for successful performance.
Organisations need to become aware that identifying and creating new products and
services can provide a competitive advantage, therefore research and development
have become a more important element in the value chain (Drury, 2004:lO'lO and
Swain ef a/., 2005:581).
b) Operating processes
Operation processes are concerned with production and delivery of existing products,
services and processes that will meet the needs of customers. This process starts
when a customer's order is received and finishes with the delivery of the product or
82

service to the customer (Drury, 2004:1010; Eldenburg & Wolcott, 2005640 and
Homgren et al., 2006:459). The goals of these processes are to provide quality,
efficiency, consistency and on-time delivery of products and services to customers
(Eldenburg & Wolcott, 2005:640). According to Eldenburg & Wolcott (2005:640), in
order to be competitive, organisations must improve their operational processes to meet
or beat their competitors' prices, quality and on-time delivery, therefore measurements
are developed to monitor and enhance performance in these critical areas.
(i) Cycle time measures
Many customers attach a high value to short and reliable lead times, measured from the
time they place an order until the time when they receive the desired product or service.
Many organisations have adopted a just-in-time (JIT) production system to achieve both
low-cost and short lead time objectives. Cutting the delivery cycle time may therefore
give an organisation a competitive advantage, hence most organisations should include
this performance measure in their BSC (Drury, 2004:1011).
Throughput time is the time required to turn raw materials into completed products.
The relationship between the delivery cycle time and throughput time are illustrated in
figure 4.2 below. Throughput time consists of process time, inspection time, move time
and queue time. Process time is the only activity that adds value to the service, while
all the other activities are non-value-adding activities and should be eliminated as much
as possible (Garrison et a/., 2006:456).
The throughput time, which is considered to be the key measure in delivery
performance, can be put into perspective by using the performance measure of
manufacturing cycle efficiency (MCE) (Garrison et a/., 2006:457).
MCE = value added timelthroughput time
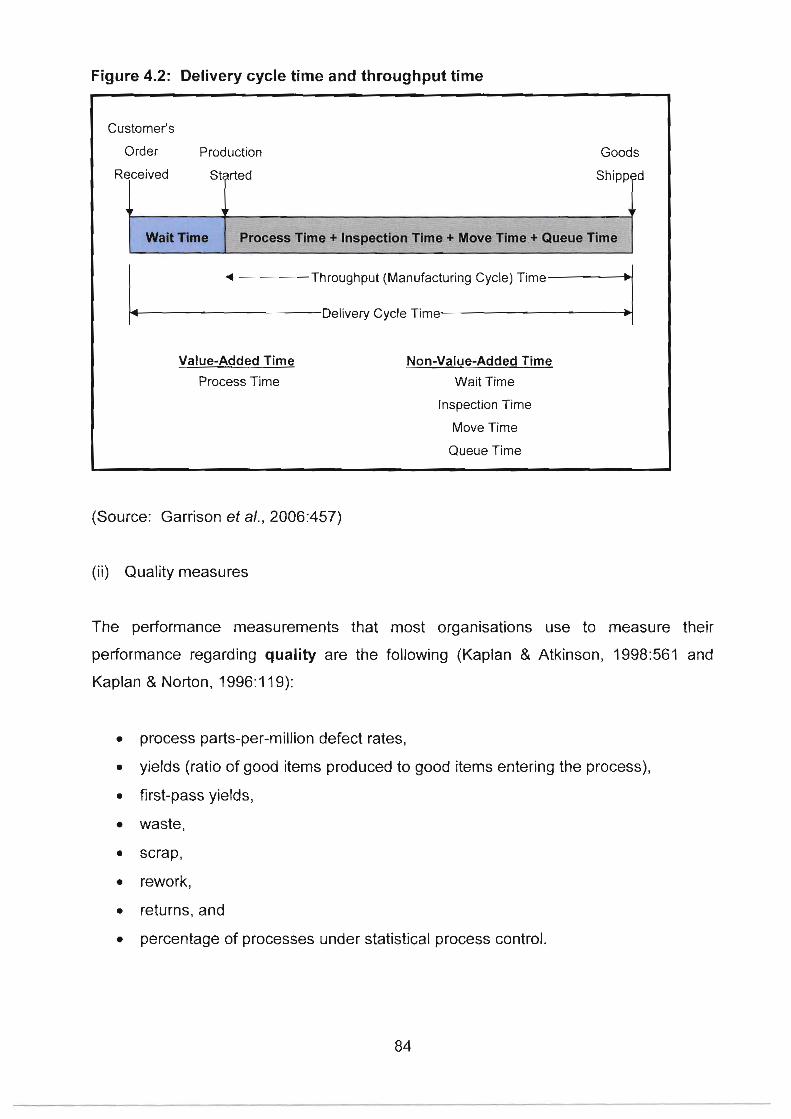
Figure 4.2: Delivery cycle time and throughput time
Customer's
Order Product~on Goods
Received Started Shipped
!I I -
Wait Time Process Time 4 inspection Tlmr + Mow Time + Queue Time
+------Throughput (Manufacturing Cycle) T~me
Delivery Cycle Time
Non-Value-Added Time
Wait Time
Inspect~on Time
Move Time
Queue Time
Value-Added Time
Process Time
(Source: Garrison ef a/., 2006:457)
(ii) Quality measures
The performance measurements that most organisations use to measure their
performance regarding quality are the following (Kaplan & Atkinson, 1998:561 and
Kaplan & Norton, 1996: 1 19):
process parts-per-million defect rates,
yields (ratio of good items produced to good items entering the process),
first-pass yields,
waste,
scrap,
rework,
returns, and
percentage of processes under statistical process control.

(iii) Cost measurement
The performance measurement that will best measure the performance on the cost of
the internal business processes of the organisation will be the concepts of
activity-based costing (ABC) and activity-based management (ABM), as discussed in
chapter 2 (Drury, 2004:1012 and Swain et a/., 2005:583).
4.3.2.4 Post-sales service processes
Post-sales service processes consider the service provided to customers after the
sale of a product or service. Post-sales service includes warranty work, handling
returns, correcting defects, and collecting and processing payments (Drury, 2004:1012-
101 3 and Swain et a/., 2005:640).
4.3.2.5 Learning and growth perspective
The learning and growth perspective defines the capabilities that an organisation must
build to create long-term growth and improvement. The learning and growth
perspective emphasises three capabilities (Drury, 2004:1013; Hansen & Mowen,
2003:600-601 and Homgren et a/., 2006:459):
employee capabilities,
information system capabilities, and
motivation, empowerment and alignment.
a) Employee capabilities
Organisations make use of three core measurement outcomes which are the drivers of
employee capabilities (Drury, 2004:1013 and Swain ef al., 2005584):
employee satisfaction,
employee retention, and
employee productivity.
Employee satisfaction is the driver of the other two measurements. Satisfied
employees lead to employee productivity and the maximum percentage of retention.
Employee satisfaction also leads to customer satisfaction (Drury, 2004: 101 3 and Swain
ef a/., 2005:584).
b ) Information system capabilities
The strength of organisations' information system capabilities is critical to employee
productivity. For employees to be effective in today's competitive environment they
need relevant, accurate and timely information on the effects of their hard work to
improve processes, satisfy customers and strengthen financial performance within the
organisation (Swain et al., 2005584 and Drury, 2004:1014).
c) Motivation, empowerment and alignment
According to Drury (2004:1014), motivation plays an important role in the performance
of employees. Motivation is maximised when individual objectives are aligned with the
organisation's objective articulated in the BSC.
A reward system should be considered as an important part of motivation. According to
Vetweire & Van Den Berghe (2004:216), not only financial elements like incentives and
bonuses should be taken into consideration, but non-financial elements, like recognition,
involvement, information sharing and work-life balance should be taken into
consideration as well. Therefore Venveire & Van Den Berghe (2004:216) suggest that
organisations work on a "total reward" approach which they refer to as all forms of
returns - direct andlor indirect, short and long term, financial and non-financial rewards
which employees should receive in order to motivate them.
According to Armstrong & Baron (2003:210), performance management can motivate
people by:
clarifying the goals and expectations of the organisation,
providing reinforcement through constant feedback,
providing opportunities for employees to use and develop their skills,
helping people increase their self-confidence by achievements and growth
through their work - intrinsic motivation,
providing opportunities for employees to feel that they add value to the
organisation through recognition and praise - extrinsic non-financial motivation,
and
rewarding employees financially - extrinsic motivation.
The warehouse and distribution function must ensure that the performances of their
employees are linked to a total reward system in order to ensure that employees are
motivated to achieve performance in line with the organisations goal.
4.3.3 Implementing the balanced scorecard
Organisations can follow the following seven steps proposed by Eldenburg & Wolcott
(2005642-646) to implement their BSC:
Step 1: Clarify the vision, core competencies and strategies of the
organisation
The vision, core competencies and strategies of the organisation are central to
the BSC approach, therefore they should be clarified. The vision must clearly
indicate where the organisation wants to go, whereas the core competencies and
strategy provide guidance to the vision of the organisation. By clarifying the
vision, core competencies and strategies of the organisation, employees are
assisted to understand where the organisation is going.

Step 2: Analyse perspectives to develop performance objectives and
measures
The next step is to analyse the four perspectives as discussed in paragraph
4.3.2. A set of performance objectives within each perspective must be
formulated in order to achieve the vision and strategies identified in the previous
step. These objectives must be monitored by making use of financial and
non-financial measures as discussed in paragraph 4.2.1 and 4.2.2.
Step 3: Communicate, link throughout the organisation and refine
Top management usually develops the BSC, but the success of the BSC
depends on the efforts of employees throughout the organisation. In order for
the BSC to succeed, it must be communicated both upwards (among top
management) and downwards (to other employees) in the organisation. Links
(common measures) must be developed to increase the likelihood that all
employees will work together to achieve the same goal. The original BSC can be
refined after organisations have implemented it at the lower levels.
Step 4: Establish performance targets and action plans
The BSC should not only consist of measures to determine long-term vision and
strategies, but should also establish specific performance targets and related
action plans. Performance targets are set for three- to five-year periods and
assist organisations to focus on their long-term results. Organisations must
reward their employees for achieving performance targets as discussed in
paragraph 4.3.2.5(c). Action plans give employees guidance about their efforts
towards achieving targets.
Step 5: Analyse the collected BSC data
The BSC measures are captured periodically and data are collected and
analysed for different measures using different time frames. Systems to collect
financial and non-financial data must be established before calculations and
comparisons to performance targets can be made.
88

Step 6: Investigate variances and reward employees
Actual results are compared to performance targets to determine variances.
Significant variances are investigated to identify the causes, and lead to
modification of action plans. If the BSC is used for employee compensation,
rewards are distributed.
Step 7: Provide feedback and refine the BSC
Feedback is an important part of the BSC, where results and experience are
used to refine the process. Managers make use of the BSC to evaluate the
success of their vision, core competencies and strategies as identified in
paragraph 4.3.3.
4.3.4 An example of implementing the balanced scorecard
Table 4.1 presents an example of a BSC for SLA's warehouse and distribution function.
It highlights the four perspectives of performance: financial, customer, internal business
process, and learning and growth. SLA's warehouse and distribution department
should set objectives, measures and performance targets to meet their vision and
strategy. Performance measures can be adapted in order to provide better information
on achievements.
An example of the implementation of the BSC in the warehouse and distribution function
is provided next.
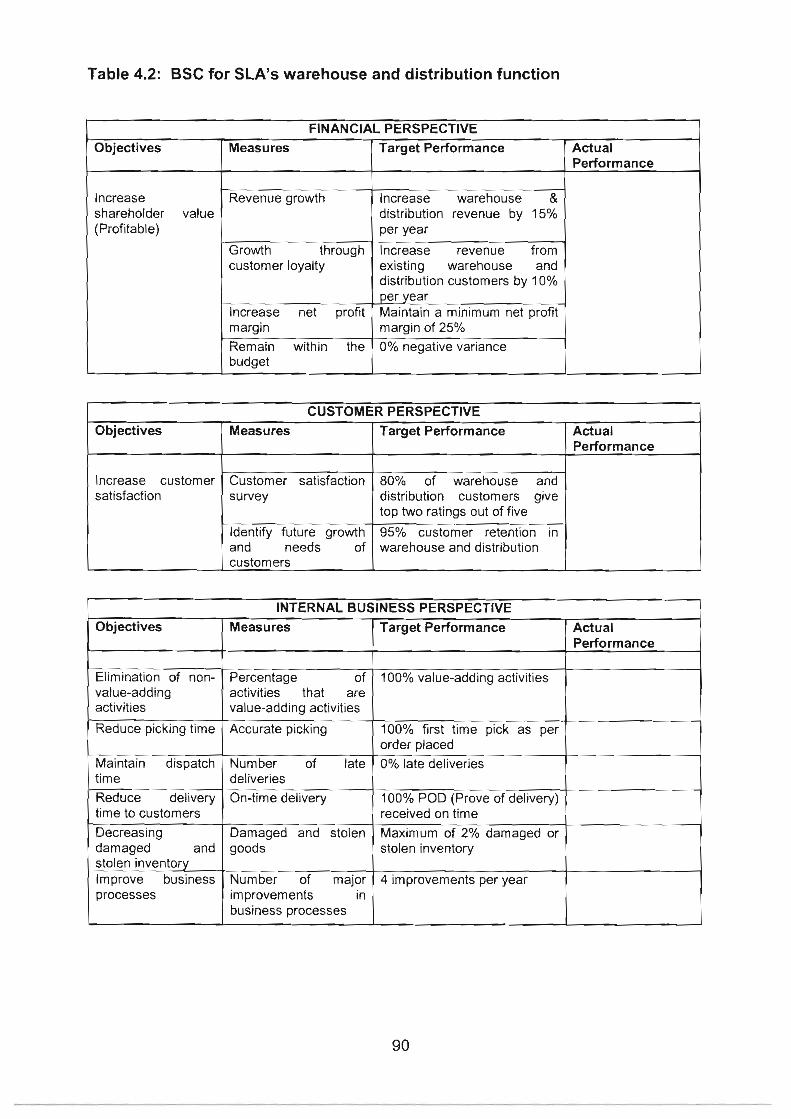
Table 4.2: BSC for SLA's warehouse and distribution function
FINANCIAL PERSPECTIVE
CUSTOMER PERSPECTIVE
Actual Performance
Objectives
lncrease customer satisfaction
INTERNAL BUSINESS PERSPECTIVE Objectives Measures Target Performance Actual
Performance
Elimination of non- Percentage of 100% value-adding activities value-adding activities that are activities value-adding activities
100% first time pick as per
Target Performance
Increase warehouse & distribution revenue by 15% per year
Increase revenue from existing warehouse and distribution customers by 7 0% per year Maintain a minimum net profit margin of 25% 0% negative variance
Objectives
Increase shareholder value (Profitable)
Maintain dispatch time Reduce delivery time to customers Decreasing damaged and stolen inventory Improve business processes
Measures
Revenue growth
Growth through customer loyalty
lncrease net profit margin Remain within the budget
Measures
Customer satisfaction survey
Identify future growth and needs of customers
Number of late deliveries On-time delivery
Damaged and stolen goods
Number of major improvements in business processes
Target Performance
80% of warehouse and distribution customers give top two ratings out of five
95% customer retention in warehouse and distribution
0% late deliveries
100% POD (Prove of delivery) received on time Maximum of 2% damaged or stolen inventory
4 improvements per year
Actual Performance
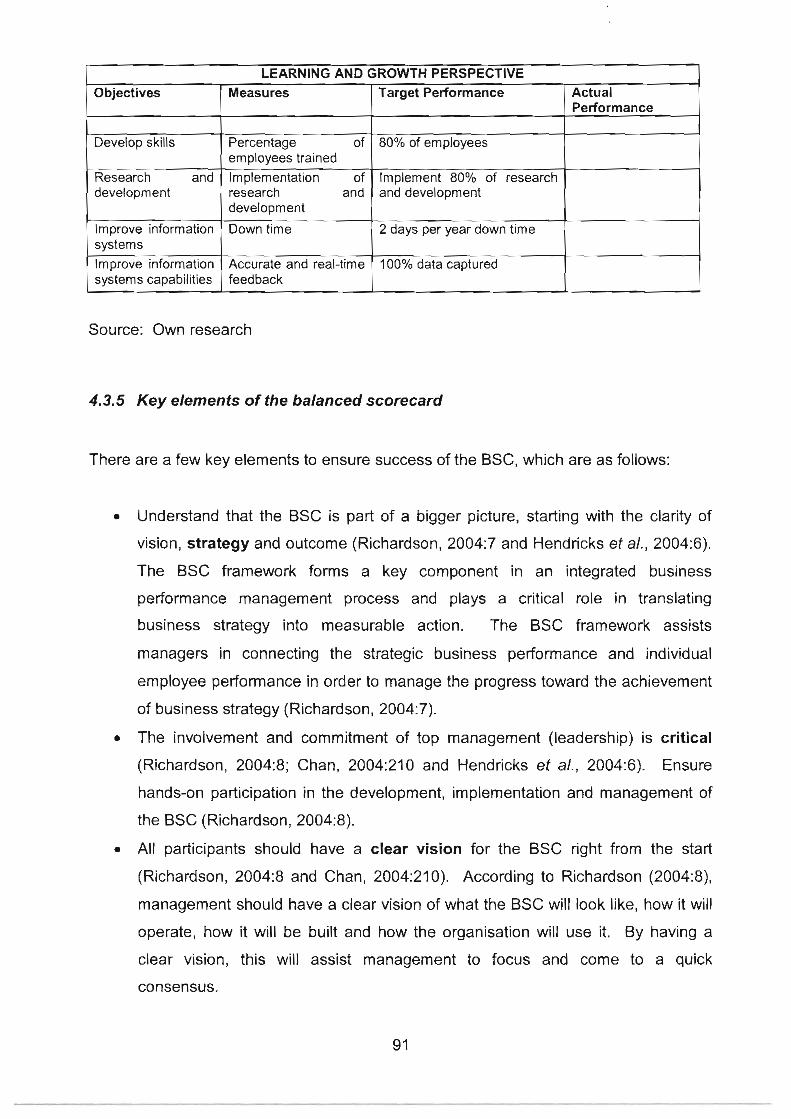
Source: Own research
LEARNING AND GROWTH PERSPECTIVE
4.3.5 Key elements of the balanced scorecard
There are a few key elements to ensure success of the BSC, which are as follows:
Actual Performance
Objectives
Develop skills
Research and development
Improve information systems lmprove information systems capabilities
Understand that the BSC is part of a bigger picture, starting with the clarity of
vision, strategy and outcome (Richardson, 2004:7 and Hendricks et a/., 2004:6).
The BSC framework forms a key component in an integrated business
performance management process and plays a critical role in translating
business strategy into measurable action. The BSC framework assists
managers in connecting the strategic business performance and individual
employee performance in order to manage the progress toward the achievement
of business strategy (Richardson, 2004:7).
The involvement and commitment of top management (leadership) is critical
(Richardson, 20043; Chan, 2004:210 and Hendricks et a/., 2004:6). Ensure
hands-on participation in the development, implementation and management of
the BSC (Richardson, 2004:8).
All participants should have a clear vision for the BSC right from the start
(Richardson, 20043 and Chan, 2004:210). According to Richardson (2004:8),
management should have a clear vision of what the BSC will look like, how it will
operate, how it will be built and how the organisation will use it. By having a
clear vision, this will assist management to focus and come to a quick
consensus.
Measures
Percentage of employees trained Implementation of research and development
Down time
Accurate and real-time feedback
Target Performance
80% of employees
Implement 80% of research and development
2 days per year down time
100% data captured
Maximise the usage of the BSC by fully deploying it at all levels of the
organisation (Richardson, 2004:8). According to Richardson (2004:8-9) and
Hendricks et at. (2004:6), deploying the BSC across all levels (team, division and
functional levels) in the organisation develops strategic awareness amongst all
employees, ensuring that employees make "strategy their job. 'This will assist
employees in making decisions that will contribute to the business strategy in
their day to day work. It is important to keep the BSC relatively simple and easy
to use and understand in order to ensure cooperation by employees (Richardson,
2004:8-9).
Communicate (Richardson, 2004:9 and Hendricks et a/., 2004:6). According to
Richardson (2004:9), communication and education (training) on the
organisation's strategy and the BSC are very important. Organisations must
make use of every type of communication method available to ensure employees
understand the strategy and the BSC. This will ensure a culture of performance
excellence.
Extend the BSC and make it "the way we work". Extend the BSC until it
becomes not only the measurement framework, but the framework within which
the organisation operates (Richardson, 2004:9).
4.3.6 Critical analysis of using a BSC
The BSC has certain advantages and disadvantages, which will be discussed below.
4.3.6. f Advantages of the balanced scorecard
It encourages clarification and updating of the organisation's vision and strategy
(Eldenburg & Wolcott, 2005:651);
It improves communication and consensus of the strategy throughout the
organisation, which leads to aligning departmental and personal goals to the
vision and strategy of the organisation (Eldenburg & Wolcott, 2005:651 and
Horngren et a/., 2006:462);
It links strategic objectives to short-term and long-term performance objectives
(Eldenburg & Wolcott, 2005:651);
It places strong emphasis on financial and non-financial objectives and
measures, which emphasis leads to improved financial performance (Horngren
eta!., 2006:463 and Eldenburg 8 Wolcott, 2005:651);
It helps managers use operational data for decision-making (Eldenburg &
Wolcott, 2005:651);
It limits the number of measures, identifying only the most critical ones with the
purpose to help managers focus attention on measures that mostly effect the
implementation of strategy (Horngren et a/., 2006:463);
It motivates employee effort (Eldenburg & Wolcott, 2005:651);
It promotes action toward achieving strategies (Eldenburg 8 Wolcott, 2005:651);
It enables periodic performance reviews of development toward vision and
strategy (Eldenburg & Wolcott, 2005:651);
It provides feedback to assist learning or strategy development (Moodley,
2003:60);
It is a simple and accessible model for performance, based on priority areas for
attention in each of the four perspectives (Moodley, 2003:63);
It minimises reliance on a single performance measure (Horngren et a/.,
2006:463);
It reduces optimisation of departments at the expense of the organisation as a
whole (Horngren ef a/., 2006:463);
It avoids management dependence on short-term or incomplete financially based
performance measures (Horngren et at., 2006:463);
It increases accountability. Goals are incorporated into the evaluation process
and accountability is linked to compensation (Moodley, 2003:63), and
It can assist stakeholders in their evaluation of the organisation (Moodley,
2003:64).
4.3.6.2 Disadvantages of the balanced scorecard
Its implementation is expensive and time-consuming (Eldenburg & Wolcott,
2005:651);
Non-financial performance measures are often ignored when evaluating
employees (Horngren et a/., 2006:463);
If too many performance measures are used, it takes the attention away from
measures that are critical for implementing strategy (Horngren et a/., 2003:453);
Improvements across all of the measures all of the time may be inconsistent with
long-term profit maximisation (Horngren et a!., 2006:463);
Performance measures may give contradicting signals and confuse management
(Botten & Sims, 2005:430);
It may cause resistance from departments or individuals (Eldenburg & Wolcott,
2005:651);
The links among the four perspectives are not always accurate (Eldenburg &
Wolcott, 2005:651);
There is no apparent relation between the BSC and shareholder value (Botten &
Sirns, 2005:430);
Both the cost and the benefits of initiatives should be considered before including
them in the BSC (Horngren et al., 2006:463);
4.4 SUMMARY
According to Swain et a/. (2005:572), the increase in competitiveness in the market
requires that organisations continually improve their information systems in order to
support their strategy and assist management to operate its organisation more
effectively and efficiently.
Performance measurement is an effective way of increasing the competitiveness and
profitability of an organisation through encouragement of productivity improvements.
Traditionally organisations were primarily just relying on financial measures that provide
information measures in rands and ratios of rands, but that don't give the true reflection
of the performance that are being measured, and thus, non-financial measures must
also be taken into account during performance evaluation.
The balanced scorecard (BSC) introduced by Kaplan and Norton in 1992 is a
performance management system that focuses on conveying financial and non-financial
information and assist managers in translating the organisation's vision, core
competencies and strategies.

This chapter illustrated how the BSC can be a basis for developing an effective
performance measurement and management system. Managers can easily become
overloaded with information, but the key of the 8SC is to clearly clarify the vision and
strategy of an organisation and then establish a set of performance measures that
supports managers in achieving their goal. The BSC can therefore be used as a central
tool in the implementation of the organisation's strategy.
The BSC approach recognises that management needs information on financial,
customer, internal process, and learning and growth activities. Furthermore, the BSC
approach recognises that measurement of these activities should not be limited to
financial measures only, but should include non-financial measures as well.
Management of SLA can use the BSC approach in the warehouse and distribution
function in order to find appropriate financial and non-financial performance measures
to ensure a long-term perspective and that resources in the organisation are allocated
to the most effective improvement activities, namely those identified in Chapter 2, by
making use of activity-based costing.
CHAPTER 5
EMPIRICAL STUDY
5.1 INTRODUCTION
SLA has proved to be a market leader within the logistics services market whilst
maintaining profitability in most of its core business functions, with the exception of the
warehousing and distribution function.
The empirical study was conducted at SLA to analyse its warehouse and distribution
function's existing cost management system. Relevant information was obtained from
SLA by means of a structured questionnaire (Appendix A) used during interviews to
obtain useful information from relevant employees and managers. The questionnaire
consisted of 37 closed and 20 open questions regarding the use of activity-based
performance management in the warehouse and distribution function.
In order to obtain the most accurate information regarding activity-based performance
management in the warehouse and distribution function, employees and managers
were identified to take part in the survey. They included the following five positions: the
director, the financial manager, the business analyst, the warehouse manager and the
warehouse team leader. 100% of the planned structured interviews took place. The
information gathered by the interviews was used exclusively for research purposes and
treated as highly confidential.
Permission to gather information by observation of activities and processes carried out
by employees in the warehouse and distribution function was obtained from top
management in SLA. The warehouse was visited and inspected, while the whole
process, from beginning (receiving) to end (dispatch), was observed.

The following precautionary measures were taken regarding the structured
questionnaire and the interviews:
Professional advice regarding information gathering, interviews and
questionnaires was obtained by referring to Struwig & Stead (2001 ).
Appointments were scheduled with each of the participants.
One day before the appointment, participants were reminded of the interview.
An informational letter containing the background to the study was given to each
participant one day before the interview.
In this chapter, the results of the interviews are given in chronological order of the
questionnaire (Appendix A).
5.2 ANALYSIS OF THE QUESTIONNAIRE
5.2.1 Section A - Personal background
In Section A of the questionnaire, personal background regarding the respondents was
obtained. The results were as follows.
1. In section A question 1 of the questionnaire (Appendix A) regarding the
respondents' current position. The results were as follows:
Diagram 5.1 : The current position of the respondents
Director Senior Manager Team leader Other
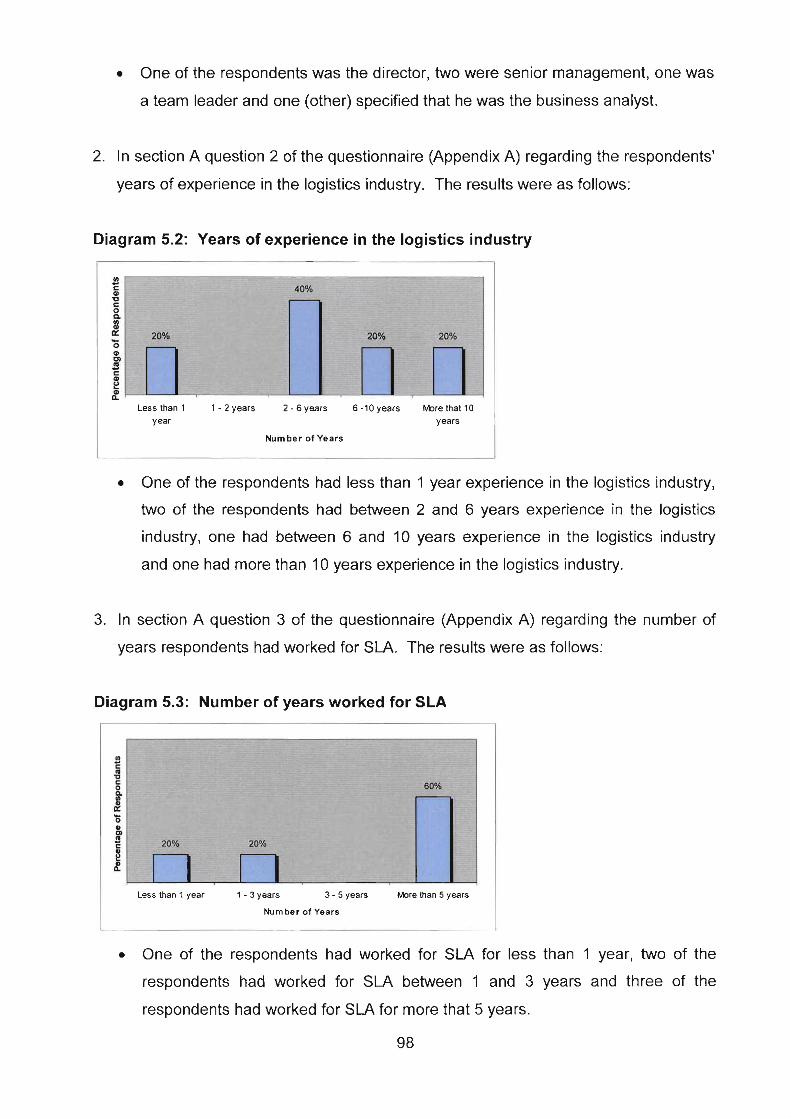
One of the respondents was the director, two were senior management, one was
a team leader and one (other) specified that he was the business analyst.
2. In section A question 2 of the questionnaire (Appendix A) regarding the respondents'
years of experience in the logistics industry. The results were as follows:
Diagram 5.2: Years of experience in the logistics industry
Less Vlan 1 1 - 2 years 2 - 6 years 6 -10 years More that 10 year years
Num her of Years
One of the respondents had less than 1 year experience in the logistics industry,
two of the respondents had between 2 and 6 years experience in the logistics
industry, one had between 6 and 10 years experience in the logistics industry
and one had more than 10 years experience in the logistics industry.
3. In section A question 3 of the questionnaire (Appendix A) regarding the number of
years respondents had worked for SLA. The results were as follows:
Diagram 5.3: Number of years worked for SLA
Less than 1 year 1 - 3 years 3 - 5 years More than 5 years
Number of Years
One of the respondents had worked for SM for less than 1 year, two of the
respondents had worked for SLA between 1 and 3 years and three of the
respondents had worked for SLA for more that 5 years.
98

4. In section A question 4 of the questionnaire (Appendix A) respondents were asked
to describe their responsibility and involvement in the warehouse and distribution
function. The results were as follows:
The warehouse manager said that he took full responsibility for all activities in the
warehouse and distribution function, from the receiving right through to the
delivery of the shoes. He was also responsible for the invoicing, making out
purchase orders and monitoring the employees in the warehouse.
The director said that the warehouse manager reported to him.
The team leader was responsible for the quality checks of invoicing and was
involved in the warehouse and distribution project team.
The financial manager was responsible for budget planning and variance
analysis, and he compiled financial statements each month regarding SLA. The
financial manager stated that there were no individual statements regarding the
Tips shoes warehouse and distribution function, which formed part of the overall
warehouse and distribution function.
The business analyst was responsible for analysing distribution routes, testing
the cost-effectiveness of the warehouse and the vehicles, seeing to it that rates
were correctly loaded onto the software program and for ensuring that everything
was invoiced out.
5.2.2 Section B - Background to the warehouse and distribution function
In Section B, background regarding the warehouse and distribution function was
obtained. The results were as follows:
1. In section B question I .a of the questionnaire (Appendix A) regarding the room for
improvement in the profitability of the warehouse and distribution function. The
results were as follows:


20% of the respondents indicated that in the past equipment was just purchased
without doing further research regarding the price. The respondent indicated that
much money could be saved in the long term on packaging and labelling,
provided they invested in the right resources in the short term.
3. In section B question 2 of the questionnaire (Appendix A) regarding the number of
employees in the warehouse and distribution function. The results were as follows:
Diagram 5.5: Number of employees in the warehouse and distribution function - - - -
10 to 15 10 to30 30 to 50 More that 50
Number of employees
!
100% of the respondents indicated that there were between 10 and 30
employees in the warehouse and distribution function.
4. In section B question 3 of the questionnaire (Appendix A) regarding the major
elements of the warehouse and distribution function's strategy. The results were as
follows:
Table 5.1: Ranking of major elements of the warehouse and distribution's
strategy

The element with the lowest average was the most important to the respondents. Thus
the order of importance is as follows:
Customer satisfaction
lncrease efficiency
lncrease profitability
Reduce process time
Reduce cost
Improve quality
Develop new services
Develop skills
Expand the market share
5.2.3 Section C - Fundamentals
In Section C, information was obtained regarding the use of activity-based costing, cost
management and performance management in the warehouse and distribution function.
The results were as follows:
1. In section C question 4 of the questionnaire (Appendix A) regarding the usage of an
activity-based costing system in the warehouse and distribution function. The
results were as follows:
Diagram 5.6: Current use of an activity-based costing system
n Yes NO
Yes or No
100% of the respondents indicated that they do not currently make use of an
activity-based costing system in the warehouse and distribution function.

2. In section C question 9 of the questionnaire (Appendix A) regarding the current
system used to allocate costs in the warehouse and distribution function. The
results were as follows:
Diagram 5.7: The system currently used to allocate costs
Square meters 8 No formal system headcount
The majority, 80% of the respondents indicated that no formal system was used
to allocate costs in the warehouse and distribution function and only 20%
indicated that the warehouse and distribution function make use of square
metres and headcount.
3. In section C question 10.a of the questionnaire (Appendix A) regarding the
effectiveness of the current allocation system in the warehouse and distribution
function. The results were as follows:
Diagram 5.8: Effectiveness of the current cost allocation system
I
Yes 1
Yes
Yes or No -
100% of the respondents indicated that the current cost allocation system in the
warehouse and distribution function is not effective.
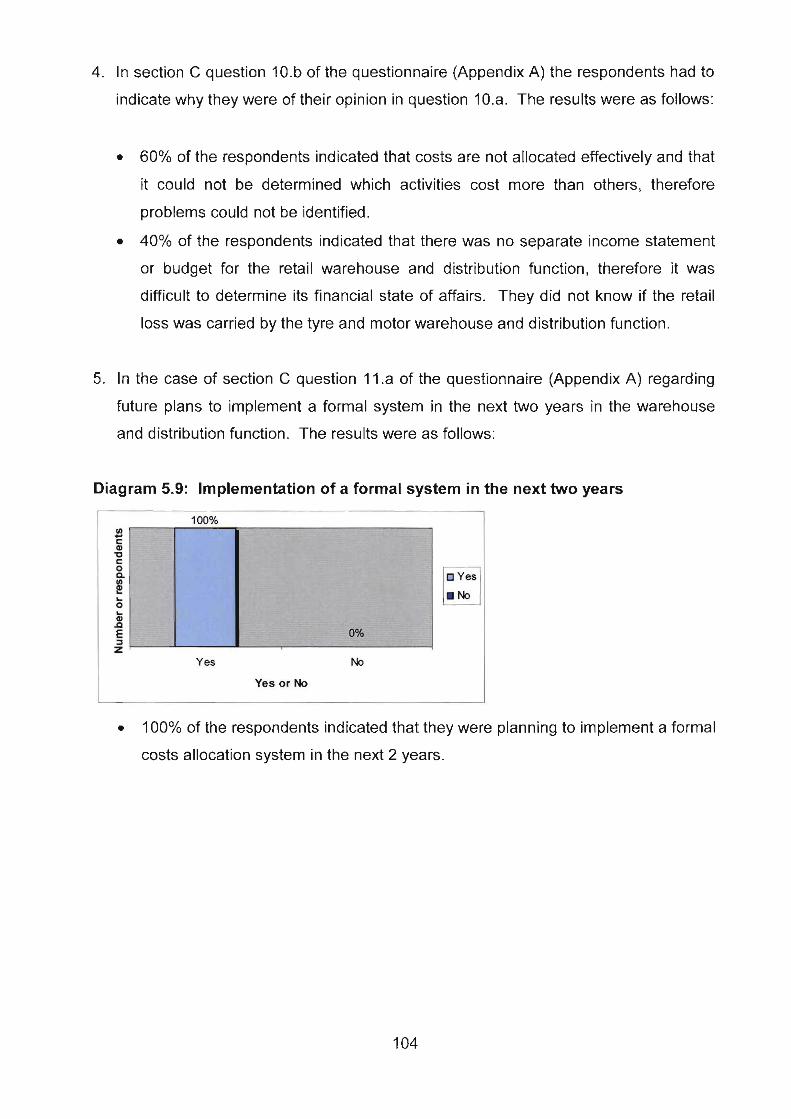
4. In section C question 1O.b of the questionnaire (Appendix A) the respondents had to
indicate why they were of their opinion in question 10.a. The results were as follows:
60% of the respondents indicated that costs are not allocated effectively and that
it could not be determined which activities cost more than others, therefore
problems could not be identified.
40% of the respondents indicated that there was no separate income statement
or budget for the retail warehouse and distribution function, therefore it was
difficult to determine its financial state of affairs. They did not know if the retail
loss was carried by the tyre and motor warehouse and distribution function.
5. In the case of section C question I I .a of the questionnaire (Appendix A) regarding
future plans to implement a formal system in the next two years in the warehouse
and distribution function. The results were as follows:
Diagram 5.9: Implementation of a format system in the next two years
Yes
I Yes or No 1 1 00°' of the respondents indicated that they were planning to implement a formal
costs allocation system in the next 2 years.
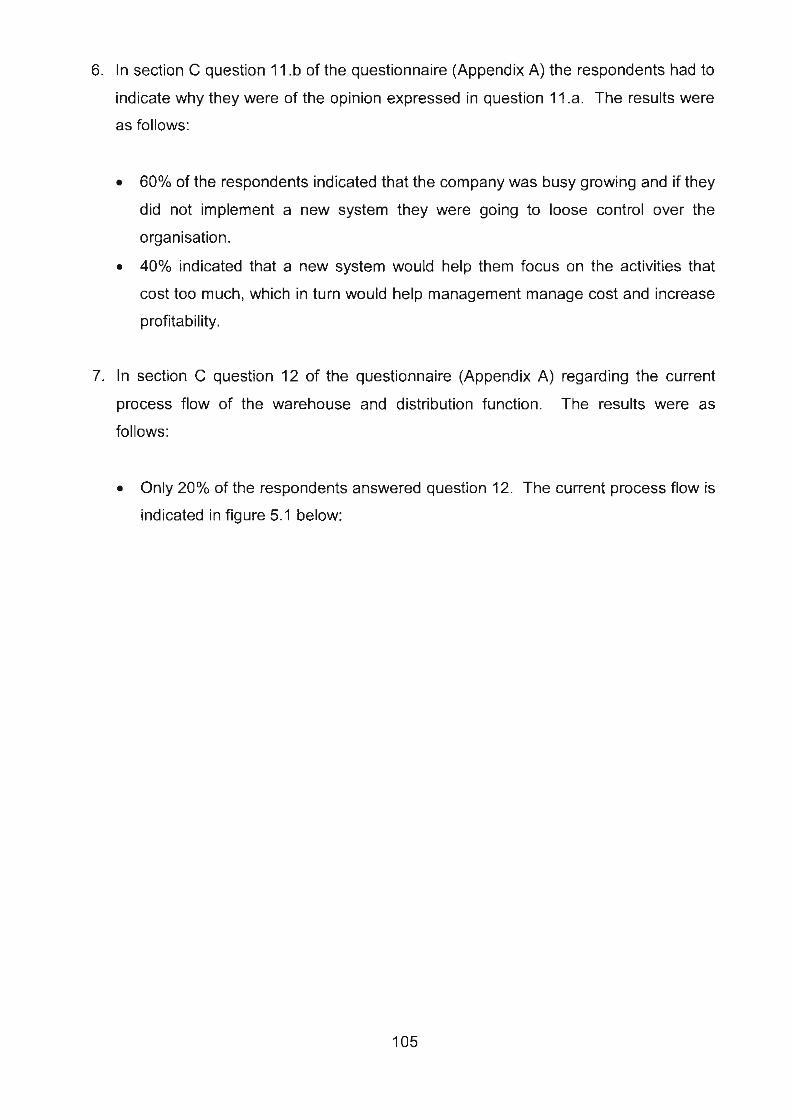
6. In section C question I I .b of the questionnaire (Appendix A) the respondents had to
indicate why they were of the opinion expressed in question I l .a. The results were
as follows:
60% of the respondents indicated that the company was busy growing and if they
did not implement a new system they were going to loose control over the
organisation.
40% indicated that a new system would help them focus on the activities that
cost too much, which in turn would help management manage cost and increase
profitability.
7. In section C question 12 of the questionnaire (Appendix A) regarding the current
process flow of the warehouse and distribution function. The results were as
follows:
Only 20% of the respondents answered question 12. The current process flow is
indicated in figure 5.1 below:

Figure 5.4 : Current process flow of the warehouse and distribution function
Clearing Department/
Import Department
(See fioure 5.1 -1 1
Keceivlng
(See figure 5.1.2) 1
- - Centre floor1
Storage
Prove of delivery
(See figure 5.1 -7)
- - Off-loading of returns
See figure 5.1.8)

Figure 5.1 .I : Clearing Departmentllmport department
import Department
Figure 5.1.2: Put away

Figure 5.1.3: Receiving
sr;lppller ordpv brocurnertts-
correspondents with original
documentation
supplier order document

Figure 5.1.4: Centre FloorlStorage
Centre Floor1
J &. R4wt.b . . *lo by .bin: &ci,@hn Y
. .,.
system 0 . . . % . .. . . d
1 .a . . .. . .>, " - .. . nYthGkp gRitirf066k Ts:y
on hand gnd in system). i. . . . . - . , - .
1 . . . . . i= ?kdy% lj(d;i*,
, . . . . . - - -.-

Figure 5.1 -5: Picking
Pick s t o ~ k by making use
into a eartbn box

listance
ielivery
I carton
Continuing I + f
/ \ /' 3 Cart t
for It
C
f
d
>n is
ocal
delivery
C \ 1
'. 1
,' f X
Repack into /' v
\ Cartons are
a manually
shrink
wrar

Figure 5.1 -6: Deliveries
Deliveries czl I
Invoices per picking slip are printed. Determine the size of transport required and
then calls the truck driver I
1 ' The delivery route areas are divided into the following route areas: -'l
East Rand, Randburg, Pretoria, Durban and Cape Town
There are two scheduled delivery ttrnes per day:
1o:w
14:OO \ ,'
1 ' The selected driver brings his bakkie into the warehouse or if it is a five ton truck ',
parks it by the loading bay. The loading commences with the checking from the
invoice. When the loading is completed, the manifest is printed for the driver to
sign and the truck is ready to leave. /
[The driver must understand his route and try to keep to the schedules and'
sequence at each stop the driver must do the following:
Time arrived, time deported
Get signature of person receiving the items on invoice
Manifest any comments regarding delivery instruction
Make sure his load is secure before departing
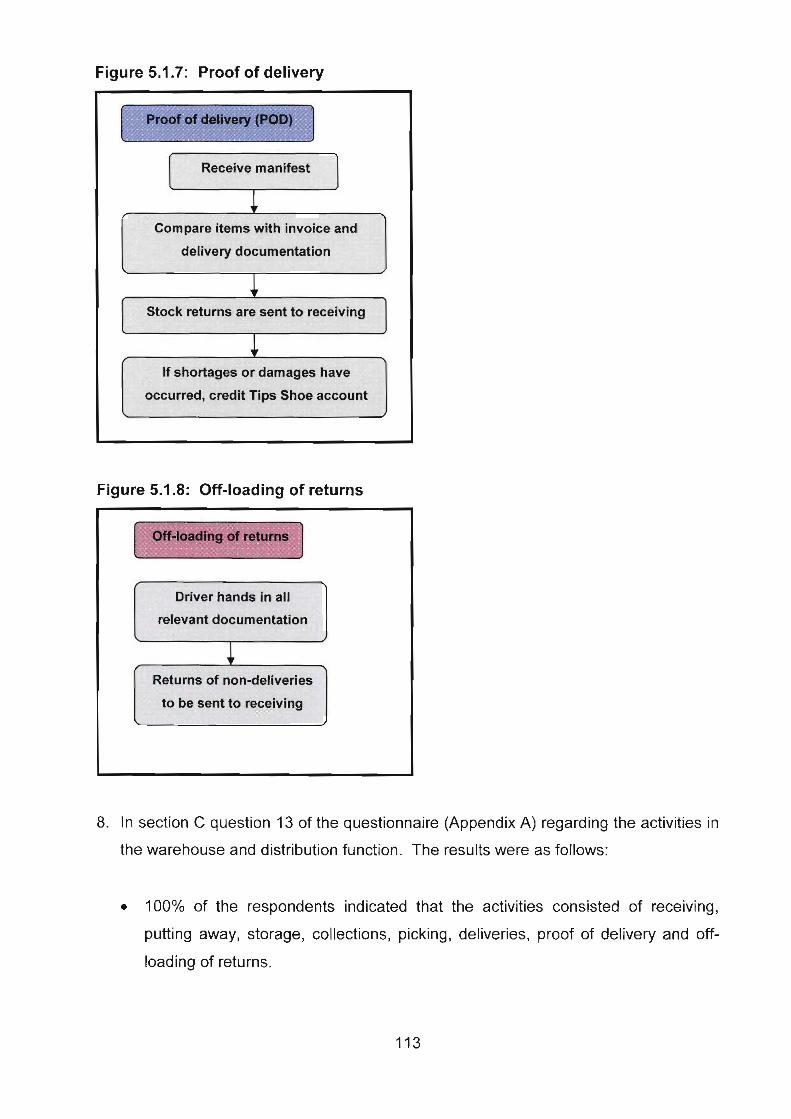
Figure 5.1.7: Proof of delivery
- I F - 3 d *
'1 k~ewmanH$st
1 Compare iMs wlth im~ic. md
' delivery documentation
2
1 Stock retv& are ient fo wiving
\
occurred, credlt Tips ShW account \ jr
Figure 5.1.8: Off-loading of returns
Off-loading of returns
f \
Mver hands in all
relevant documentation C /
1 ' ~ e t u ~ o i n o n 4 ~ i v w i . s
to be sent to receiving *
< /
8. In section C question 13 of the questionnaire (Appendix A) regarding the activities in
the warehouse and distribution function. The results were as follows:
100% of the respondents indicated that the activities consisted of receiving,
putting away, storage, collections, picking, deliveries, proof of delivery and off-
loading of returns.
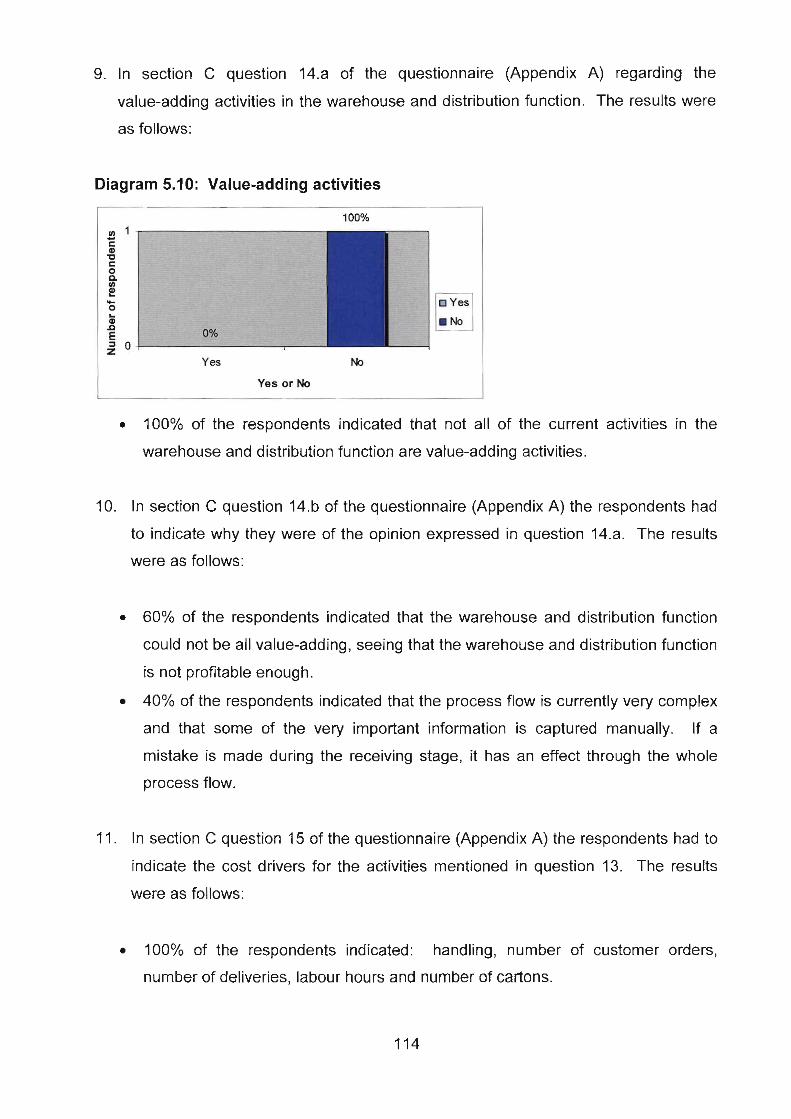
9. In section C question 14.a of the questionnaire (Appendix A) regarding the
value-adding activities in the warehouse and distribution function. The results were
as follows:
Diagram 5.10: Value-adding activities
10096
t e ' 0
w.. 0
b P E 1 0
Yes No
Yes or No
100% of the respondents indicated that not all of the current activities in the
warehouse and distribution function are value-adding activities.
10. In section C question 14.b of the questionnaire (Appendix A) the respondents had
to indicate why they were of the opinion expressed in question 14.a. The results
were as follows:
60% of the respondents indicated that the warehouse and distribution function
could not be all value-adding, seeing that the warehouse and distribution function
is not profitable enough.
40% of the respondents indicated that the process flow is currently very complex
and that some of the very important information is captured manually. If a
mistake is made during the receiving stage, it has an effect through the whole
process flow.
11. In section C question 15 of the questionnaire (Appendix A) the respondents had to
indicate the cost drivers for the activities mentioned in question 13. The results
were as follows:
100% of the respondents indicated: handling, number of customer orders,
number of deliveries, labour hours and number of cartons.


14. In the case of section C question 17 of the questionnaire (Appendix A) regarding
the use of ABC to determine the price or service fee more accurately. The results
were as follows:
Diagram 5.12: The use of ABC to determine the service fee more accurately
100%
No
Yes or No
Yes
100% off the participants indicated that by implementing ABC the service fee
could be determined more accurately.
15. In the case of section C question 18.a of the questionnaire (Appendix A) regarding
changing to an ABC system. The results were as follows:
Diagram 5.1 3: Changing to an ABC system
Yes
Yes or No
100% of the participants would consider changing to an ABC system.
16. In section C question 18.b of the questionnaire (Appendix A) the respondents had
to indicate why they were of the opinion stated in question 18.a. The results were
as follows:
100% of the respondents indicated that ABC would assist them in managing the
warehouse and distribution function's costs. 116

17. In section C question 19.a of the questionnaire (Appendix A) regarding the usage
of cost management tools. The results were as follows:
Diagram 5.14: The use of cost management tools
100% 90%
To a moderate exten : 80* o 70% Q " 60% 2 - 50% 0
40% m 30%
a 20% 2 10% 0. 0%
W C C y . E O , .- '-
v , ; i i z m . - 9 r . E ' " " a , 8 8 S , ~ z ~ 2 . ,
$ Z C w . ; ; r o g r n c 0 - .N * C .- > a, G ? g o g ~ a g c
E .- 1 C
U) 3 7
8 0
I Cost management tool I 100% of the participants indicated that life-cycle costing and business process
reengineering were not used in the warehouse and distribution function.
60% of the respondents indicated that target costing (TC) was not used at all,
whereas 40% of the respondents indicated that TC was used to a moderate
extent.
40% of the respondents indicated that kaizen costing was not used at all,
whereas 20% indicated that was used to a moderate extent and 40% indicated
that was used to a large extent.
The majority of the respondents, 80% indicated that cost of quality is used to a
moderate extent, whereas 20% indicated that it is not used at all.
40% of the respondents indicated that benchmarking was not used at all, 40%
indicated to a moderate extent and 20°/0 indicated that benchmarking was used
to a large extent.
The majority of the respondents, 80%, indicated that just-in-time (JIT) was not
used at all, whereas 20% indicated that it was used to a moderate extent.
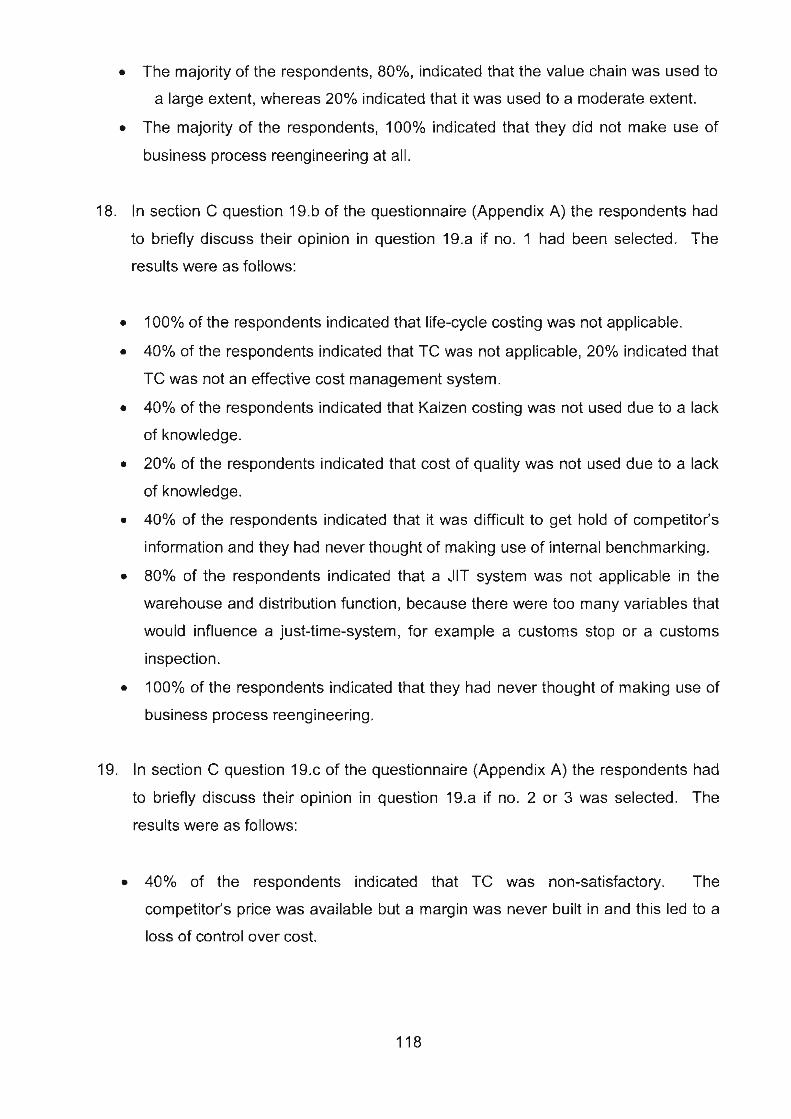
The majority of the respondents, 80%, indicated that the value chain was used to
a large extent, whereas 20% indicated that it was used to a moderate extent.
The majority of the respondents, 100% indicated that they did not make use of
business process reengineering at all.
18. In section C question 19.b of the questionnaire (Appendix A) the respondents had
to briefly discuss their opinion in question 19.a if no. ? had been selected. The
results were as follows:
f 00% of the respondents indicated that life-cycle costing was not applicable.
40% of the respondents indicated that TC was not applicable, 20% indicated that
TC was not an effective cost management system.
40% of the respondents indicated that Kaizen costing was not used due to a lack
of knowledge.
20% of the respondents indicated that cost of quality was not used due to a lack
of knowledge.
40% of the respondents indicated that it was difficult to get hold of competitor's
information and they had never thought of making use of internal benchmarking.
80% of the respondents indicated that a ,IIT system was not applicable in the
warehouse and distribution function, because there were too many variables that
would influence a just-time-system, for example a customs stop or a customs
inspection.
100% of the respondents indicated that they had never thought of making use of
business process reengineering.
19. In section C question 19.c of the questionnaire (Appendix A) the respondents had
to briefly discuss their opinion in question 19.a if no. 2 or 3 was selected. The
results were as follows:
40% of the respondents indicated that TC was non-satisfactory. The
competitor's price was available but a margin was never built in and this led to a
loss of control over cost.
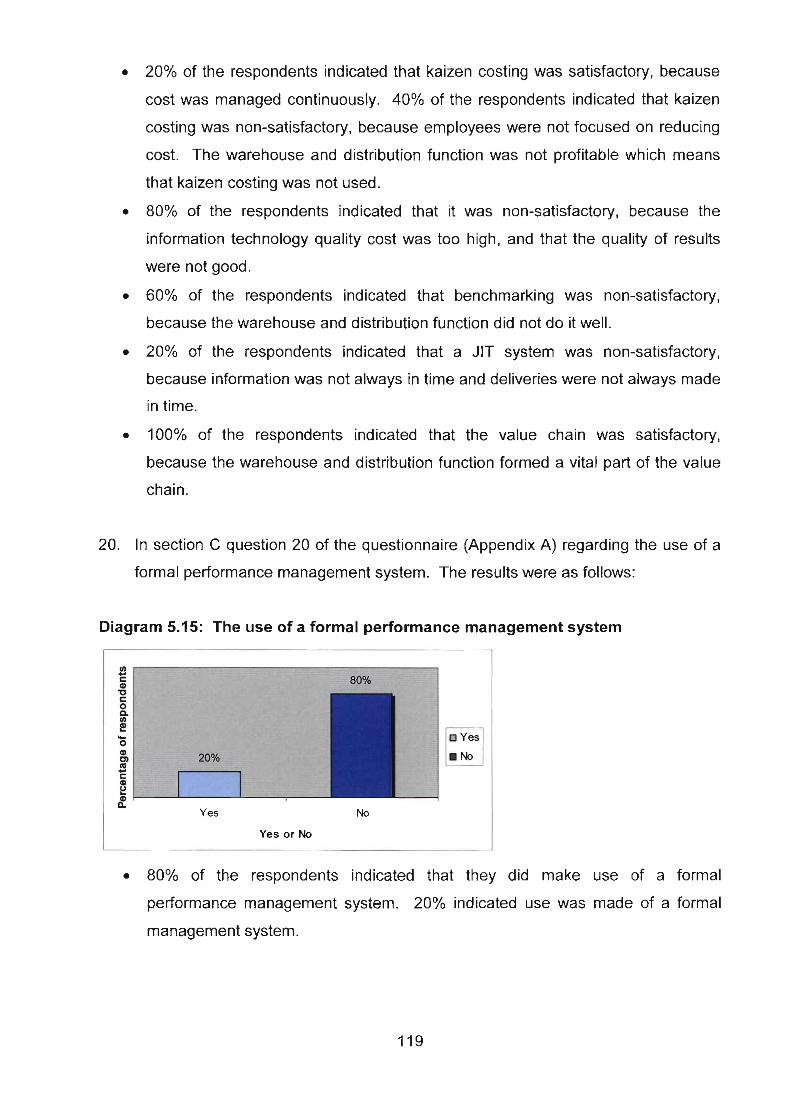
20% of the respondents indicated that kaizen costing was satisfactory, because
cost was managed continuously. 40% of the respondents indicated that kaizen
costing was non-satisfactory, because employees were not focused on reducing
cost. The warehouse and distribution function was not profitable which means
that kaizen costing was not used.
80% of the respondents indicated that it was non-satisfactory, because the
information technology quality cost was too high, and that the quality of results
were not good.
60% of the respondents indicated that benchmarking was non-satisfactory,
because the warehouse and distribution function did not do it well.
20% of the respondents indicated that a JIT system was non-satisfactory,
because information was not always in time and deliveries were not always made
in time.
100% of the respondents indicated that the value chain was satisfactory,
because the warehouse and distribution function formed a vital part of the value
chain.
20. In section C question 20 of the questionnaire (Appendix A) regarding the use of a
formal performance management system. The results were as follows:
Diagram 5.15: The use of a formal performance management system
Yes
Yes or No
80% of the respondents indicated that they did make use of a formal
performance management system. 20% indicated use was made of a formal
management system.
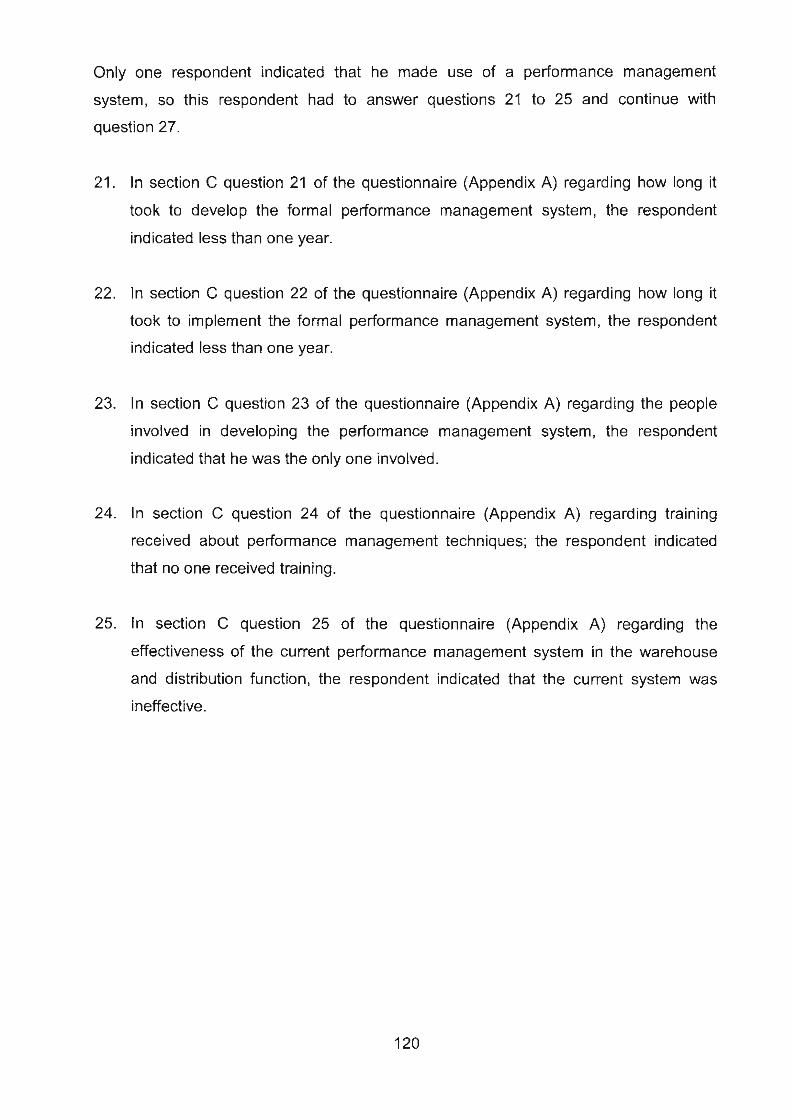
Only one respondent indicated that he made use of a performance management
system, so this respondent had to answer questions 21 to 25 and continue with
question 27.
21. In section C question 21 of the questionnaire (Appendix A) regarding how long it
took to develop the formal performance management system, the respondent
indicated less than one year.
22. In section C question 22 of the questionnaire (Appendix A) regarding how long it
took to implement the formal performance management system, the respondent
indicated less than one year.
23. In section C question 23 of the questionnaire (Appendix A) regarding the people
involved in developing the performance management system, the respondent
indicated that he was the only one involved.
24. In section C question 24 of the questionnaire (Appendix A) regarding training
received about pedorrnance management techniques; the respondent indicated
that no one received training.
25. In section C question 25 of the questionnaire (Appendix A) regarding the
effectiveness of the current performance management system in the warehouse
and distribution function, the respondent indicated that the current system was
ineffective.
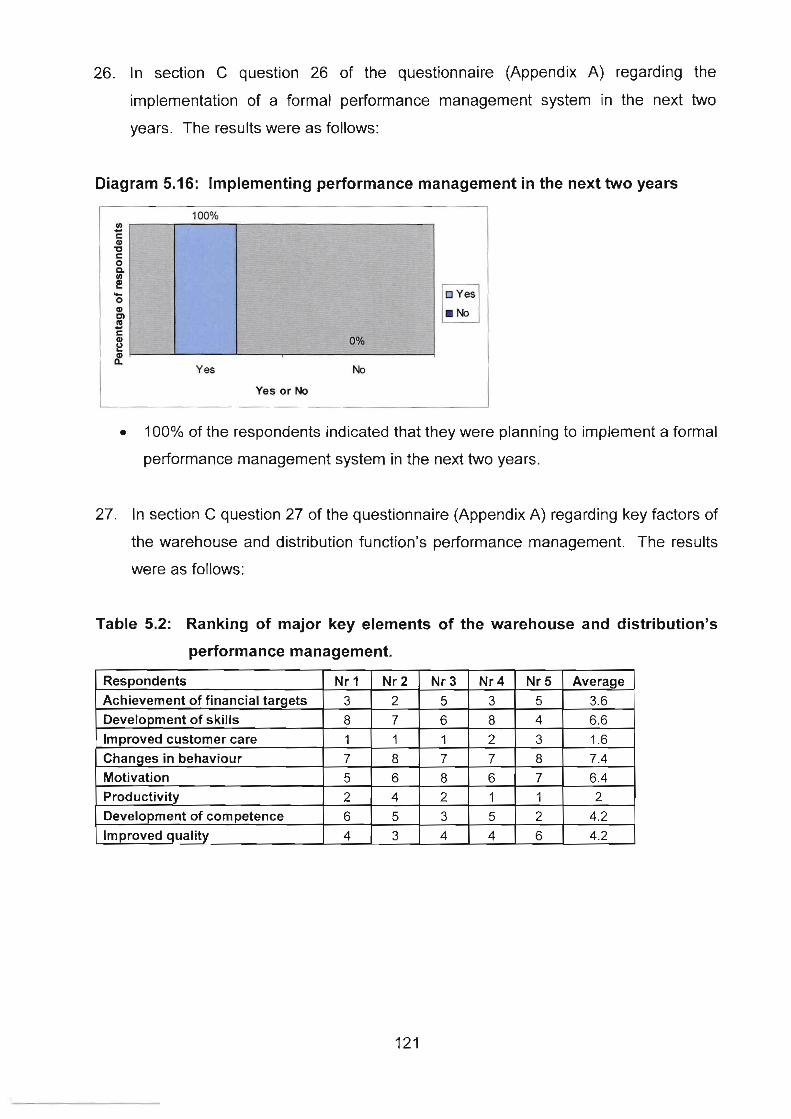
26. In section C question 26 of the questionnaire (Appendix A) regarding the
implementation of a formal performance management system in the next two
years. The results were as follows:
Diagram 5.16: Implementing performance management in the next two years
I Yes or No I 100% of the respondents indicated that they were planning to implement a formal
performance management system in the next two years.
27. In section C question 27 of the questionnaire (Appendix A) regarding key factors of
the warehouse and distribution function's performance management. The results
were as follows:
Table 5.2: Ranking of major key elements of the warehouse and distribution's
performance management.

The key element with the lowest average is the most important to the respondents.
Thus, the order of importance is as follows:
lmproved customer care
Productivity
Achievement of financial targets
Improved quality
Development of competence
Motivation
Development of skills
Changes in behaviour
28. In section C question 28 of the questionnaire (Appendix A) regarding the
importance of non-financial criteria of performance management in the warehouse
and distribution function. The results were as follows:
Diagram 5.17: Importance of competence
100%
L 80% 0 2 : 60% :; .CI m hortant 5 8 40%
$ $ ai. 20%
0% Market share Sales growth
Category
Diagram 5.18: Used as a measurement
10044
80% 0 E a! c p 4 60%
2 40% $ Q
2 20%
0% Market share Sales growth
Category

100% of the respondents indicated that market share was not important to them
and 100% of the respondents indicated that it did not get measured.
The majority (80%) of the respondents indicated that sales growth was important
to them, whereas 20% indicated that it was not important. 60% of the
respondents indicated that sales growth was measured, whereas 40% indicated
that it did not get measured.
Diagram 5.19: Importance of quality of service
Category
Diagram 5.20: Used as a measurement
VI = 100% m
80% r :: 60% # 40%
20%
0% m +. E V) V) (II In ln rn
U) )I
c .- P) L) a! al
(0
w n c c ((I C I -- - C
i? ir: .- F c -
.- z m w C
4 z $ tn c B - a, a, .-
L S
B 2 0 IL
tn
d Category
100% of the respondents indicated that reliability was very important to them,
and 100% indicated that reliability gets measured.
60% of the respondents indicated that responsiveness was very important to
them, whereas 40% indicated that responsiveness was important to them. 4 00%
of the respondents indicated that responsiveness was used as a measurement.

100% of the respondents indicated that appearance is important to them and the
majority (80%) indicated that appearance did not get measured, whereas 20%
indicated that appearance did get measured.
The majority (80%) of the respondents indicated that cleanliness was important
to them, whereas 20% indicated that cleanliness was not important. 100% of the
respondents indicated that cleanliness did not get measured.
The majority (80%) of the respondents indicated that friendliness was important
to them, whereas 20% indicated that friendliness was not important. 100% of the
respondents indicated that friendliness did not get measured.
The majority (80%) of the respondents indicated that courtesy was important to
them, whereas 20% indicated that courtesy was very important. 100% of the
respondents indicated that courtesy did not get measured.
Diagram 5.21: Importance of flexibility
i P Volume Defivery Specification
f lexibili speed flexibility flexibility
Category
Diagram 5.22: Used as a measurement
L Volume flexibility Delivery speed Specification
flexibility flex ibil i
Category
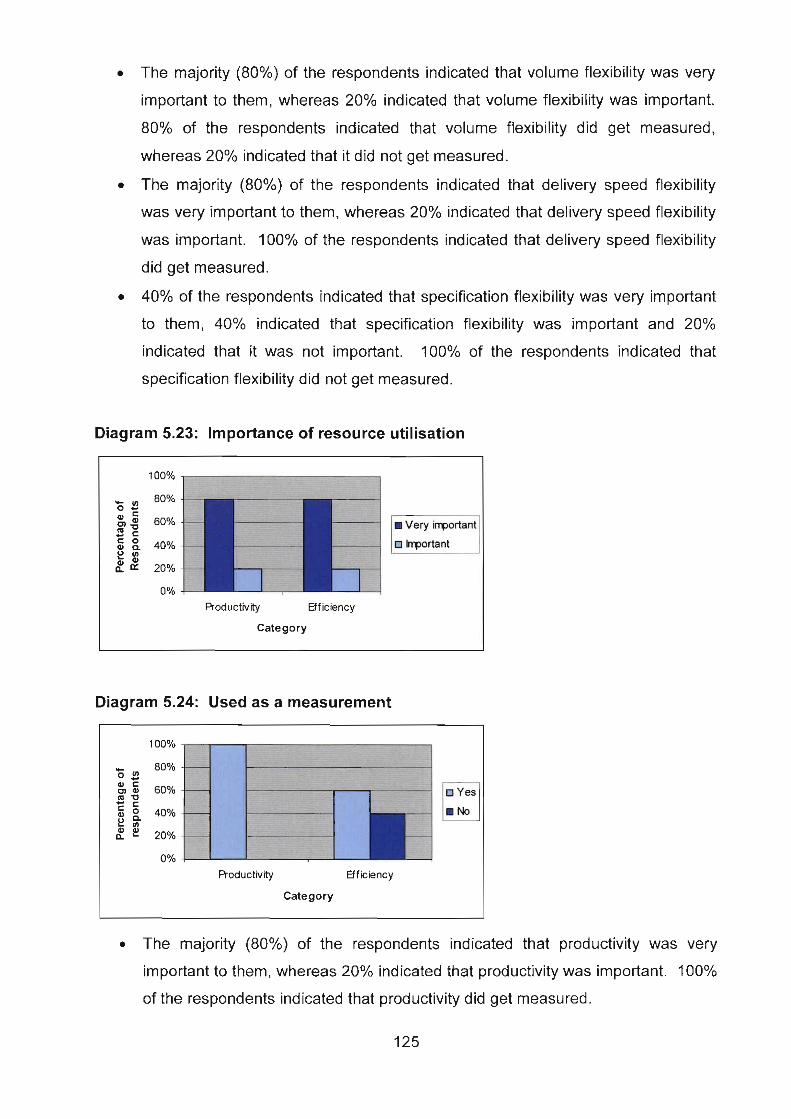
The majority (80%) of the respondents indicated that volume flexibility was very
important to them, whereas 20% indicated that volume flexibility was important.
80% of the respondents indicated that volume flexibility did get measured,
whereas 20% indicated that it did not get measured.
The majority (80%) of the respondents indicated that delivery speed flexibility
was very important to them, whereas 20% indicated that delivery speed flexibility
was important. 100% of the respondents indicated that delivery speed flexibility
did get measured.
40% of the respondents indicated that specification flexibility was very important
to them, 40% indicated that specification flexibility was important and 20%
indicated that it was not important. 100% of the respondents indicated that
specification flexibility did not get measured.
Diagram 5.23: Importance of resource utilisation
Roductivity Efficiency
Category
Diagram 5.24: Used as a measurement
The majority (80%) of the respondents indicated that productivity was very
important to them, whereas 20% indicated that productivity was important. 100%
of the respondents indicated that productivity did get measured.

The majority (80%) of the respondents indicated that efficiency was very
important to them, whereas 20% indicated that efficiency was important. 60% of
the respondents indicated that eficiency did get measured, whereas 40%
indicated that efficiency did not get measured.
Diagram 5.25: Importance of innovation
100%
80%
60% Inportant
40%
20%
0%
I Warehouse innovation Individual performance I
Diagram 5.26: Used as a measurement
100%
80%
60%
40%
20%
0% Warehouse innovation Individual performance
40°/0 of the respondents indicated that innovation is very important to them and
20% of the respondents indicated that innovation was important to them,
whereas 40% indicated that innovation was not important to them. 100% of the
respondents indicated that innovation did not get measured.
The majority (80%) of the respondents indicated that individual performance was
very important to them, whereas 20% indicated that individual performance was
important. 100% of the respondents indicated that individual performance was
not measured.
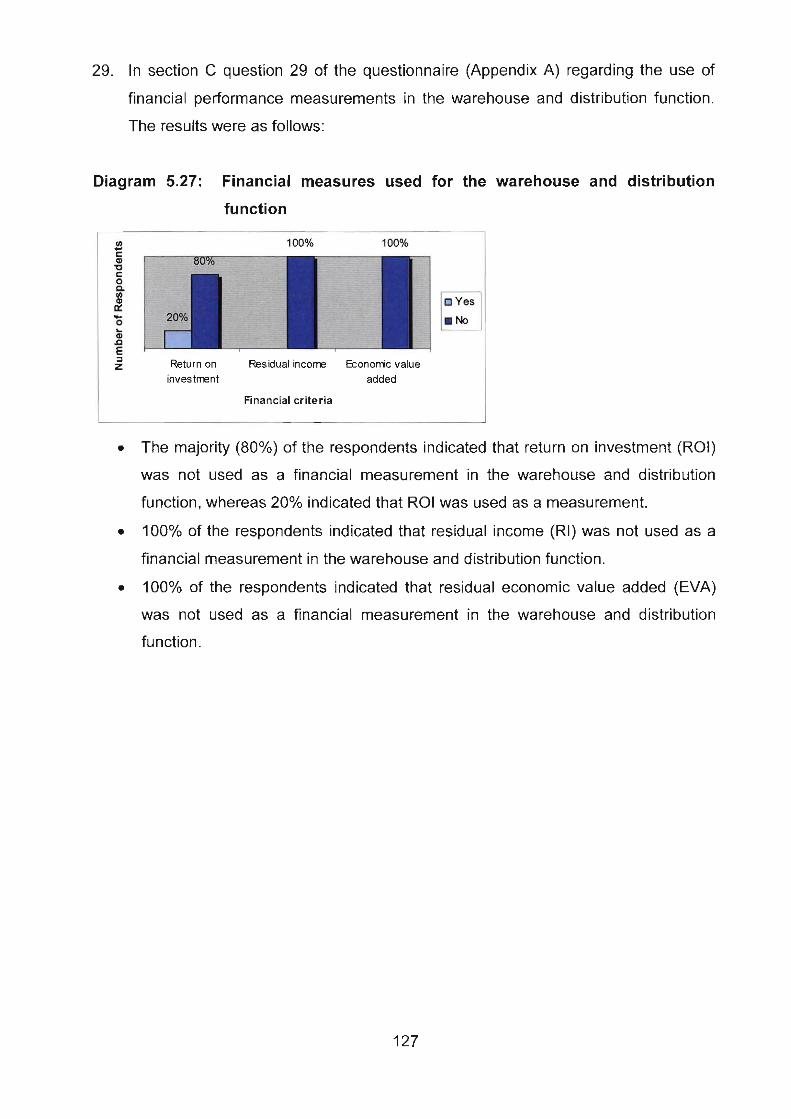
29. In section C question 29 of the questionnaire (Appendix A) regarding the use of
financial performance measurements in the warehouse and distribution function.
The results were as follows:
Diagram 5.27: Financial measures used for the warehouse and distribution
function
- 3 z Return on Residual income Econorric value
investment added
Financial criteria
The majority (80%) of the respondents indicated that return on investment (ROI)
was not used as a financial measurement in the warehouse and distribution
function, whereas 20% indicated that ROI was used as a measurement.
100% of the respondents indicated that residual income (RI) was not used as a
financial measurement in the warehouse and distribution function.
400% of the respondents indicated that residual economic value added (EVA)
was not used as a financial measurement in the warehouse and distribution
function.

30. In section C question 30 of the questionnaire (Appendix A) the respondents had to
indicate if they made use of any other financial measurements in the warehouse
and distribution function, The results were as follows:
60% of the respondents answered this question and indicated that they made
use of
o Contribution margin
o Net income
o Operating income
o Net profit
o Budget variance analysis
o Cost analysis
6O0/0 of the respondents also indicated that the above measurements are used
for the warehouse as a whole and that it had never been done for a specific
client.
31. In section C question 31 of the questionnaire (Appendix A) regarding how regularly
performance measurements in the warehouse and distribution function are
evaluated. The results were as follows:
Diagram 5.28: Performance evaluation
3 5 z 0
f r 0
b a f Z
Not at all Each day Monthly Quarterly Annually
Time period
40% of the respondents indicated that performance does not get evaluated at all,
20% indicated that performance was evaluated every day, whereas 40%
indicated that performance was evaluated monthly in the warehouse and
distribution function.

32. In section C question 32 of the questionnaire (Appendix A) regarding how regularly
employees were sent on training courses in the warehouse and distribution
function. The results were as follows:
Diagram 5.29: Training courses
VI C1 C Q P C 0 Q UJ 2 * 0 L Q a E Z
Not at all Monthly Quarterly Annualty
Time perfod
40% of the respondents indicated that employees were sent on training courses
quarterly and 60% indicated that employees in the warehouse and distribution
function were sent on training courses annually.
33. In section C question 33 of the questionnaire (Appendix A) regarding how
adequately employees in the warehouse and distribution function were informed
about performance management. The results were as follows:
Diagram 5.30: Employee informed about pefiormance management
I & ' Yes
Yes or No
40°/0 of the respondents indicated that employees were adequately informed
about performance management, whereas 60% indicated that employees in the
warehouse and distribution function were not adequately informed about
performance management.
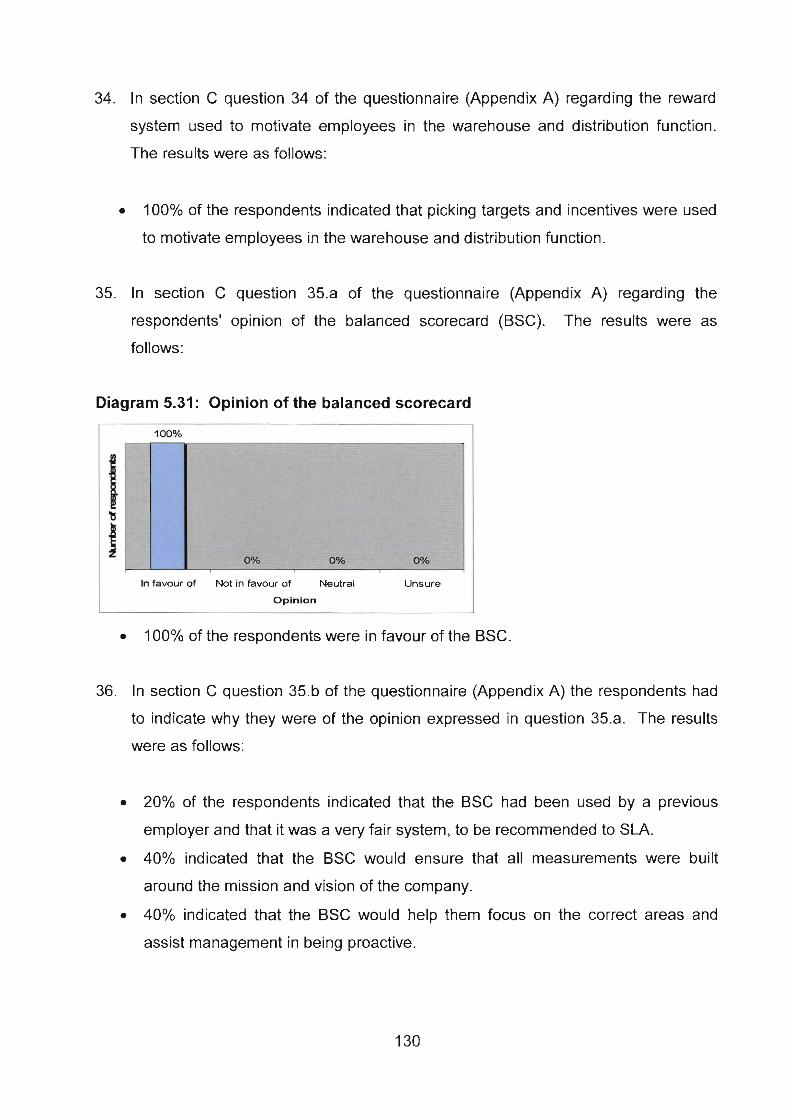
34. In section C question 34 of the questionnaire (Appendix A) regarding the reward
system used to motivate employees in the warehouse and distribution function.
The results were as follows:
100% of the respondents indicated that picking targets and incentives were used
to motivate employees in the warehouse and distribution function.
35. In section C question 35.a of the questionnaire (Appendix A) regarding the
respondents' opinion of the balanced scorecard (BSC). The results were as
follows:
Diagram 5.31 : Opinion of the balanced scorecard
In favour of Not In favour of Neutrat Unsure
Opinion
100% of the respondents were in favour of the BSC.
36. In section C question 35.b of the questionnaire (Appendix A) the respondents had
to indicate why they were of the opinion expressed in question 35.a. The results
were as follows:
20% of the respondents indicated that the BSC had been used by a previous
employer and that it was a very fair system, to be recommended to SLA.
40% indicated that the BSC would ensure that all measurements were built
around the mission and vision of the company.
40% indicated that the BSC would help them focus on the correct areas and
assist management in being proactive.
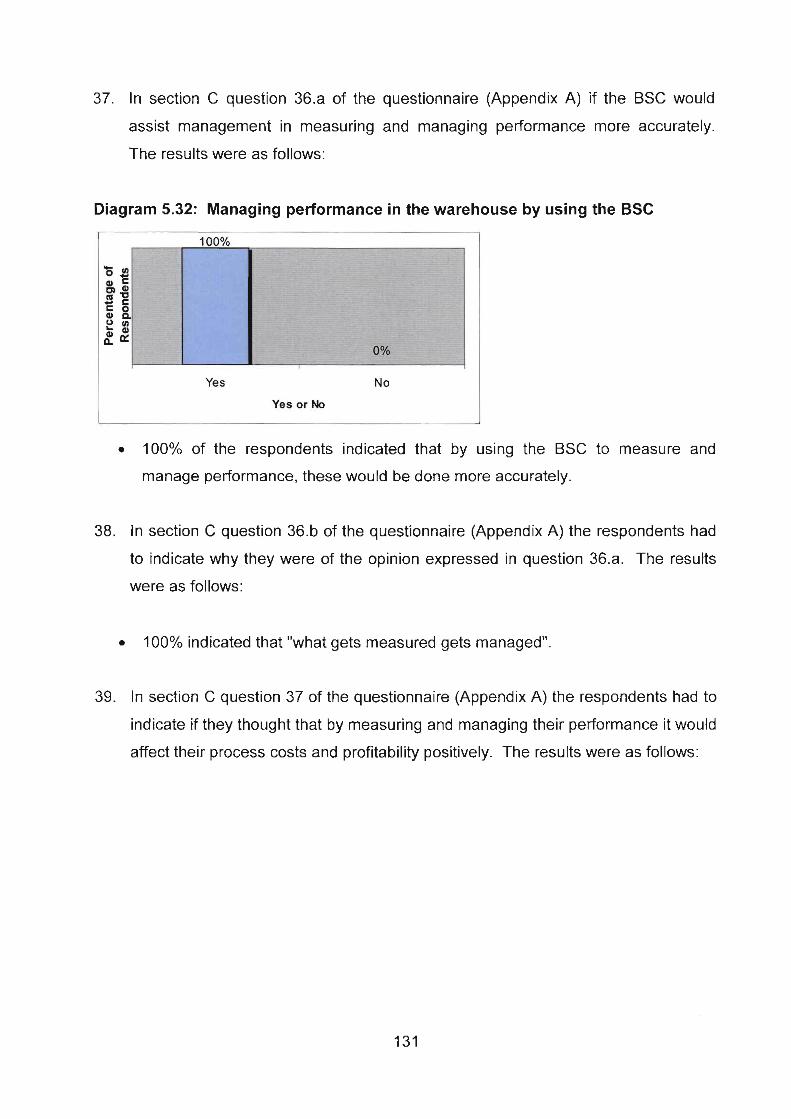
37. In section C question 36.a of the questionnaire (Appendix A) if the BSC would
assist management in measuring and managing performance more accurately.
The results were as follows:
Diagram 5.32: Managing performance in the warehouse by using the BSC -
100%
0 2 2 irn Yes Yes y or No N o I
100% of the respondents indicated that by using the BSC to measure and
manage performance, these would be done more accurately.
38. In section C question 36.b of the questionnaire (Appendix A) the respondents had
to indicate why they were of the opinion expressed in question 36.a. The results
were as follows:
100% indicated that "what gets measured gets managed".
39. In section C question 37 of the questionnaire (Appendix A) the respondents had to
indicate if they thought that by measuring and managing their performance it would
affect their process costs and profitability positively. The results were as follows:

Diagram 5.33: Will performance management affect profitability positively?
Yes
Yes or No
100% of the respondents indicated that measuring and managing their
performance would influence cost and profitability positively.
40. In section C question 38 of the questionnaire (Appendix A), asking if the
respondent would consider changing to the BSC. The results were as follows:
Diagram 5.34: Changing t o the balanced scorecard
Yes No
Yes or No
100% of the respondents indicated that they would consider changing to the BSC
approach.
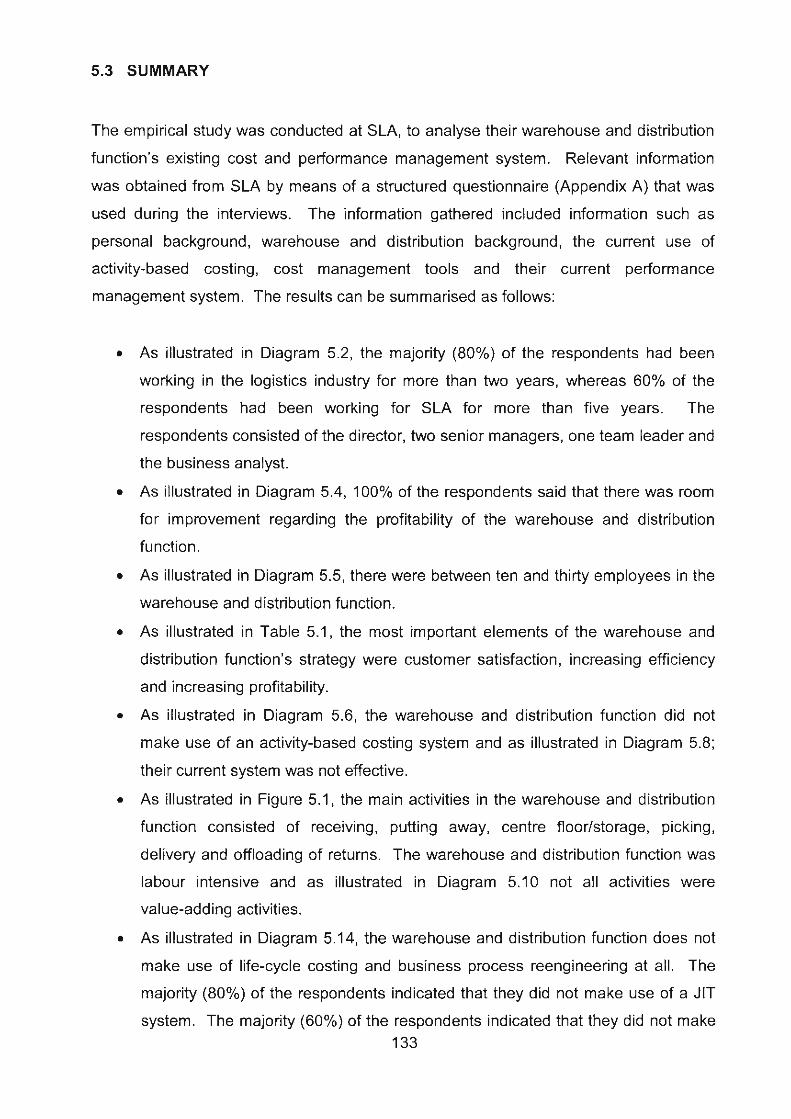
5.3 SUMMARY
The empirical study was conducted at SLA, to analyse their warehouse and distribution
function's existing cost and performance management system. Relevant information
was obtained from SLA by means of a structured questionnaire (Appendix A) that was
used during the interviews. The information gathered included information such as
personal background, warehouse and distribution background, the current use of
activity-based costing, cost management tools and their current performance
management system. The results can be summarised as follows:
As illustrated in Diagram 5.2, the majority (80%) of the respondents had been
working in the logistics industry for more than two years, whereas 60% of the
respondents had been working for SLA for more than five years. The
respondents consisted of the director, two senior managers, one team leader and
the business analyst.
As illustrated in Diagram 5.4, 100% of the respondents said that there was room
for improvement regarding the profitability of the warehouse and distribution
function.
As illustrated in Diagram 5.5, there were between ten and thirty employees in the
warehouse and distribution function.
As illustrated in Table 5.1, the most important elements of the warehouse and
distribution function's strategy were customer satisfaction, increasing efficiency
and increasing profitability.
As illustrated in Diagram 5.6, the warehouse and distribution function did not
make use of an activity-based costing system and as illustrated in Diagram 5.8;
their current system was not effective.
As illustrated in Figure 5.1, the main activities in the warehouse and distribution
function consisted of receiving, putting away, centre flooristorage, picking,
delivery and offloading of returns. The warehouse and distribution function was
labour intensive and as illustrated in Diagram 5.10 not all activities were
value-adding activities.
As illustrated in Diagram 5.14, the warehouse and distribution function does not
make use of life-cycle costing and business process reengineering at all. The
majority (80%) of the respondents indicated that they did not make use of a JIT
system. The majority (60%) of the respondents indicated that they did not make 133
use of TC. The majority 80% of the respondents indicated that they did make
use of kaizen costing. 80% of the respondents indicated that they made use of
cost of quality. 60% indicated that they made use of benchmarking, and 80%
indicated that they made use of the value chain.
The above indicate the current use of activity-based costing, cost management and
performance management in the warehouse and distribution function. In chapter 6,
conclusions and recommendations regarding activity-based petformance management
for the warehouse and distribution function in SLA will be made.
CHAPTER 6
CONCLUSIONS AND RECOMMENDATIONS
6.1 INTRODUCTION
Strategic Logistical Alliance (SLA) is committed to become and remain the number one
third-party logistics provider in the South African market. SLA sets high standards for
itself, but these standards can only be achieved if the company is profitable and
financially successful.
In the era of a competitive global environment and technology-based
organisations, managers are pressured to find ways to maintain their competitive
advantage. SLA needs to position itself as a well-known and respected competitor
through the use of two strategic weapons. The first of these is the achievement of high
quality service levels, and the second a competitive pricing structure.
As stated in the problem statement in chapter 1, paragraph 1.3, SLA has proven to be a
market leader within the logistics services market whilst maintaining profitability in most
of its core business functions, with the exception of the warehousing and distribution
function.
In this chapter the achievement of the objectives as stated in paragraph 1.4 will be
addressed in order to solve the problem as stated in paragraph 1.3. The data gathered
from the literature study in chapters 2, 3 and 4 and the data obtained from the
structured interviews were taken into account to reach conclusions and
recommendations regarding the use of an activity-based performance management
system in the warehouse and distribution function of SLA.
Conclusions and recommendations will be made under the following headings:
Activity-based costing, cost management and performance management.
6.2 ACTIVITY-BASED COSTING AND ACTIVITY-BASED MANAGEMENT
6.2.1 Activity-based costing
Part of the primary objective as stated in paragraph 7.4.1 is to analyse the existing cost
allocation system in the warehouse and distribution function. Most of the respondents
indicated that the warehouse and distribution function does not currently make use of a
formal allocation system (see diagram 5.7). One person indicated that they make use
of square metres and headcount to allocate the costs, but all participants indicated that
it is not an effective method (see diagram 5.8).
The main shortcoming of the current allocation system is that the true cost of the service
is not revealed.
The true cost is needed to analyse cost and profitability of individual products,
services and customers. If the true cost is incorrect, this will lead to an incorrect
net income, incorrect cost of sales and incorrect profitability of a product or
service.
The true cost is a tool which assists management in decision-making, which
forms part of the secondary objective (see paragraph 1.4.2). To determine a
competitive and accurate pricing structure of a product or service, it is very
important to determine the true cost of the product or service.
True cost is a tool which assists management during planning and control, and it
forms part of the secondary objective (see paragraph 1.4.2). The true cost is
important for variable budgeting purposes, the use of these budgetary techniques
relies heavily on the accuracy of the calculation of true cost.
The above sets out the importance of determining the true cost of a product or service.
This means that the correct cost allocation system must be used to ensure that costs
(fixed or variable) are accurately allocated and that the true cost can be determined.

ABC is a cost allocation system that will assist management in making more accurate
cost allocations. ABC is a costing method based on the principle that products andlor
services require an organisation to carry out activities, that these activities require
resources and that these resources require an organisation to incur cost.
The use of ABC in the warehouse and distribution function is therefore highly
recommended, seeing that:
ABC provides an understandable representation of where resources are spent in
an organisation. ABC reduces the unpredictability in cost measurement by
closely matchjng cost allocations to the actual use of resources by operating
activities.
ABC assists managers in focusing on activity-level measurement. After
identifying activities and cost drivers, managers are more aware of the
cause-and-effect relationships. This awareness motivates managers and
employees to look for ways to advance performance simply because they have
more information about the cost effects of an activity.
ABC relies on a greater number of cost drivers to allocate overheads on a
cause-and-effect basis and therefore cost can be traced more accurately. ABC
also assists in determining the areas andlor customers that generate the greatest
profit or loss. Product and customer profitability analysis can be performed by
making use of activity-based management (ABM), which may significantly alter
management perceptions of the status of an operation as a more accurate and
effective allocation of costs is obtained.
ABC identifies value-adding activities, which are those activities that add value
from the customer's point of view.
ABC assists managers in identifying non-value adding activities so that they can
be improved, or in order to add value from the customer's point of view, or so that
the activity can be eliminated in order to decrease cost.
ABC identifies many activity costs that are not directly linked to production at all
but are traditionally allocated to products as production cost. On the other hand,
it identifies many marketing, selling and administrative costs that should be
included to establish better pricing estimates.
The first secondary objective of the study is to implement activity-based performance
management systems effectively and efficiently so as to ensure business success
through continuous improvement. In order to implement an ABC system effectively and
efficiently, refer to paragraph 2.4, where the steps of implementing an ABC system are
discussed. For an example of the implementation of an ABC system in the warehouse
and distribution function, refer to paragraph 2.4.5.
6.2.2 Activity-based management
The warehouse and distribution function does not currently make use of activity-based
management (ABM), seeing that they indicated that not all of their activities are
value-adding activities (see diagram 5.10). ABM is a cost management system that
focuses on the management of activities, therefore the warehouse and distribution
function should consider making use of ABM (see paragraph 2.6), together with ABC.
Activities consume costs, therefore by managing activities, cost will be managed,
which will lead to continuous improvement. ABM is very dependent on the quality of
information provided by activity-based costing. ABM adds value to activities (by
eliminating waste and reducing delays due to defects) and thus leads to an increase in
customer satisfaction, profitability (by making fewer demands on resources),
efficiency and better quality within the warehouse and distribution function. ABM will
also assist management of the warehouse and distribution function to make decisions
about
pricing and product mix,
how to reduce costs,
how to improve processes, and
product or service design.
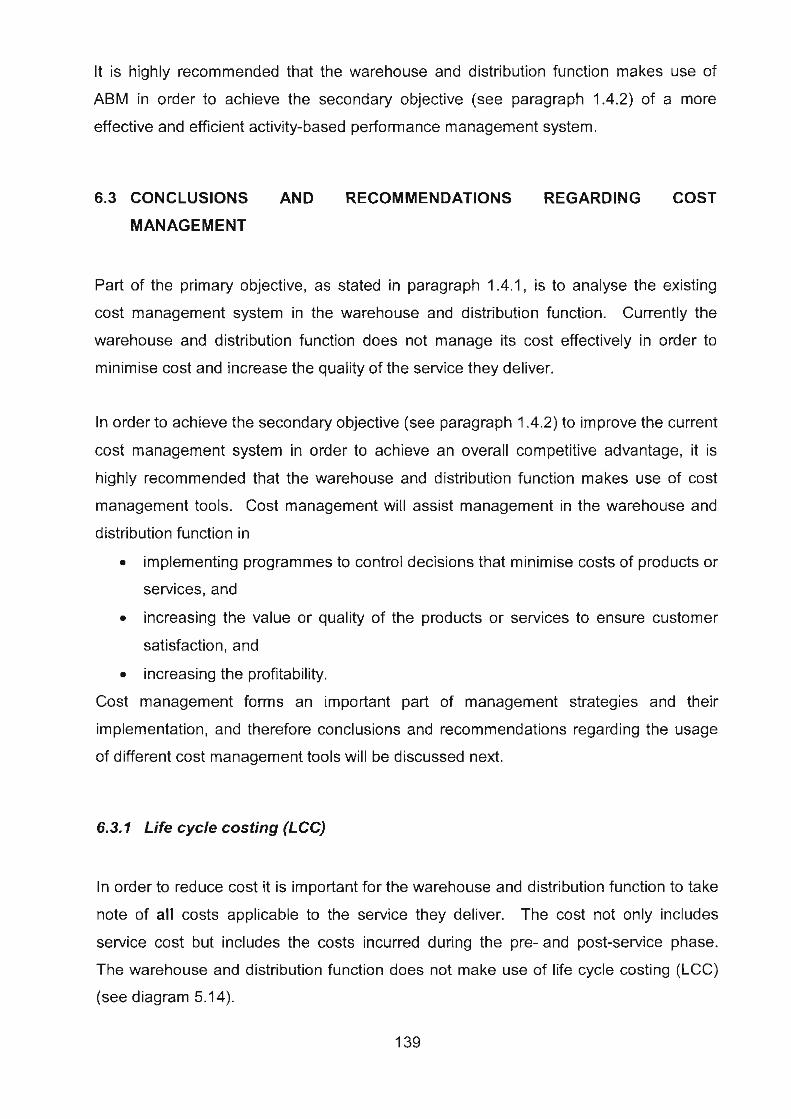
It is highly recommended that the warehouse and distribution function makes use of
ABM in order to achieve the secondary objective (see paragraph 1.4.2) of a more
effective and efficient activity-based performance management system.
6.3 CONCLUSIONS AND RECOMMENDATIONS REGARDING COST
MANAGEMENT
Part of the primary objective, as stated in paragraph I .4.1, is to analyse the existing
cost management system in the warehouse and distribution function. Currently the
warehouse and distribution function does not manage its cost effectively in order to
minimise cost and increase the quality of the service they deliver.
In order to achieve the secondary objective (see paragraph 1.4.2) to improve the current
cost management system in order to achieve an overall competitive advantage, it is
highly recommended that the warehouse and distribution function makes use of cost
management tools. Cost management will assist management in the warehouse and
distribution function in
implementing programmes to control decisions that minimise costs of products or
services, and
increasing the value or quality of the products or services to ensure customer
satisfaction, and
increasing the profitability.
Cost management forms an important part of management strategies and their
implementation, and therefore conclusions and recommendations regarding the usage
of different cost management tools will be discussed next.
6.3.f Life cycle costing (LCC)
In order to reduce cost it is important for the warehouse and distribution function to take
note of all costs applicable to the service they deliver. The cost not only includes
service cost but includes the costs incurred during the pre- and post-service phase.
The warehouse and distribution function does not make use of life cycle costing (LCC)
(see diagram 5.1 4).

The warehouse and distribution function should seriously consider making use of
LCC, seeing that there is a possibility that costs are currently determined inaccurately.
The cost of a service should include all costs from the planning and design, service
delivery and post-service delivery stages.
LCC contributes to target costing (TC). TC is a technique that manages costs during
the planning and design stage of a product or service. Conclusions and
recommendations regarding TC are discussed below.
6.3.2 Target costing (TC)
The warehouse and distribution function does not make use of target costing (TC), a
finding that is based on the research done in chapter 5. It is highly recommended that
the warehouse and distribution function consider making use of TC.
TC is a cost management tool which assists management in determining whether cost
should be decreased in order to satisfy customer demands at an acceptable level of
profitability. TC involves four steps (see paragraph 3.2.2) which the warehouse and
distribution function should consider. Value engineering is used in TC to reduce cost
and is discussed next.
6.3.3 Value engineering
Value engineering (see paragraph 3.2.2.2) requires the use of functionality analysis, a
process of examining the performance and cost of each major function of the product or
service in order to find ways to attain a desired balance of functionality and target cost.
It is recommended that the warehouse and distribution function make use of value
engineering in order to support TC. The warehouse and distribution function should
make use of value engineering to examine all types of service functions as well as the
total service costs in order to achieve the target cost. This will assist management in
achieving TC more easily, which will lead to lower prices for the service and give them a
competitive advantage.

6.3.4 Kaizen costing
The warehouse and distribution function does not make use of Kaizen costing
effectively (see diagram 5.j 4 and paragraph 5.2.3(4 9)). The warehouse and distribution
function should consider making use of Kaizen costing. Kaizen costing together with
TC is used to reduce costs (see figure 3.2). Kaizen costing can be defined as
continuous improvement, being the ongoing process of finding new ways to minimise
and manage cost during the service process without folfeiting the quality and
functionality of the product or service.
When making use of Kaizen costing the warehouse and distribution function must
realise that it relies on employee empowerment (see paragraph 3.2.3). Therefore the
warehouse and distribution manager should encourage employees to be innovative and
to find ways of improving the process and reducing costs. It is also very important that
employees must be motivated never to forfeit the quality and functionality of the service
when making suggestions to improve the process in order to reduce costs.
6.3.5 Business process reengineering (BPR)
The warehouse and distribution function does not make use of business process
reengineering (BPR) at all (see diagram 5.14). BPR requires a detailed examination of
the current business processes and radical changes to organisational operation. This
involves fundamental rethinking and radical redesign in order to eliminate unnecessary
activities, to reduce opportunities for error, reduce cost and improve productivity.
Improved quality, service, lead time, flexibility, innovation and customer satisfaction (see
paragraph 3.2.5) should also be included in the process. Based on the above it is
recommended that the warehouse and distribution function make use of BPR.
'The warehouse and distribution function must consider making use of BPR together
with ABC and ABM in order to identify and eliminate non-value-adding activities. BPR
will lead to higher profitability and improve competitiveness.
The process flow of the warehouse and distribution function with recommendations will
now follow in figure 6.1 :

Figure 6.1 : Process flow of the warehouse and distribution function
(See figure 6.1.1)
(See figure 6.1.2)
I
Oft-~oaa~ng of returns
(See figure 6.1.8)
See figure 6.1.5)
Prove of delivery
[See figure 6.1.7)
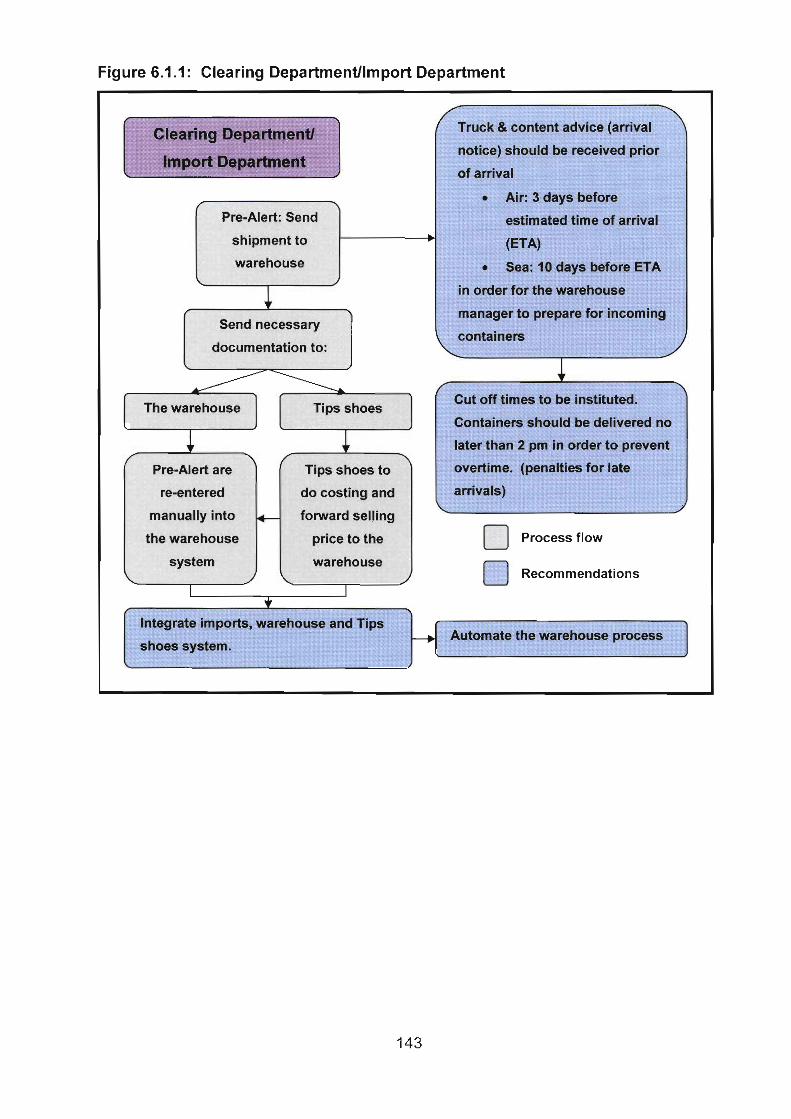
Figure 6.1 .I : Clearing Departrnentllmport Department
Air: 3 days before
estimated time of arrival
Sea: 10 days before ETA
in order for the warehouse
manager to prepare for incoming
ut off times to be instituted.
ter than 2 pm in order to prevent
vertime. (penalties for late
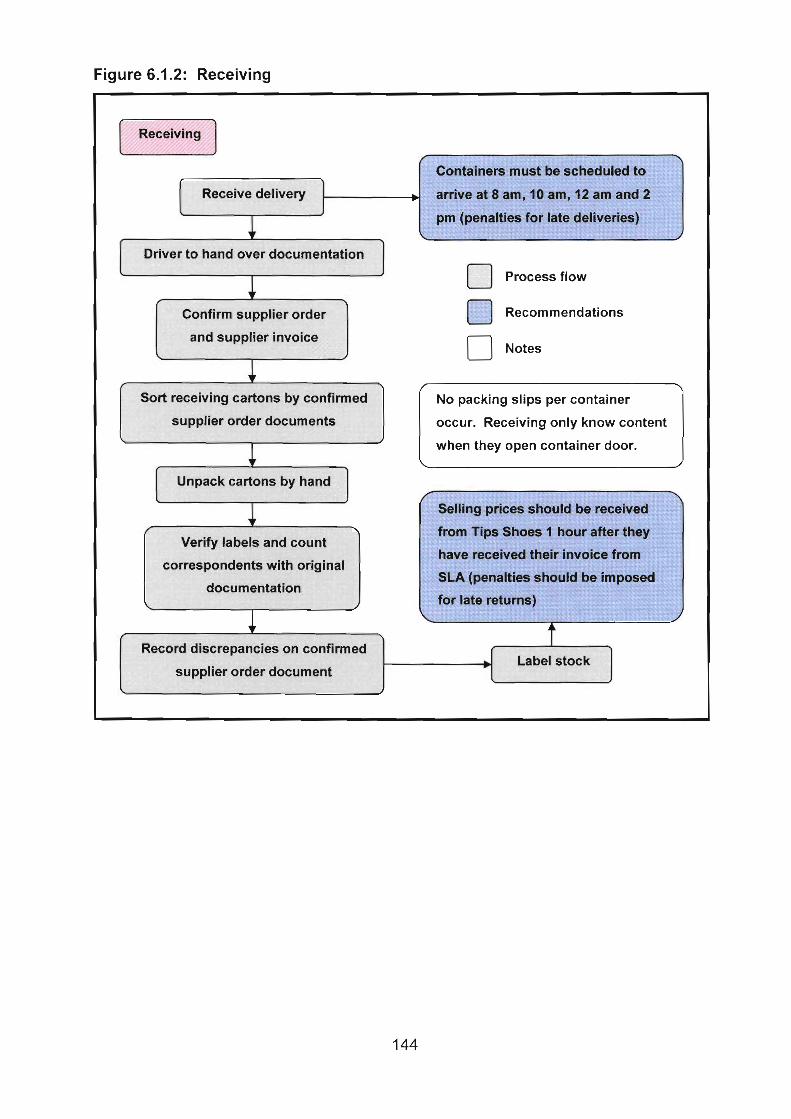
Figure 6.1.2: Receiving
arrive at 8 am, 10 am, 12 am and 2
rn (penalties for late deliveries)
Recommendations
supplier order documents occur. Receiving only know content
when they open container door.
Selling prices should
from Tips Shoes 1 hour after they
have received their invoice from correspondents with original
SLA (penalties should be imposed documentation
supplier order document
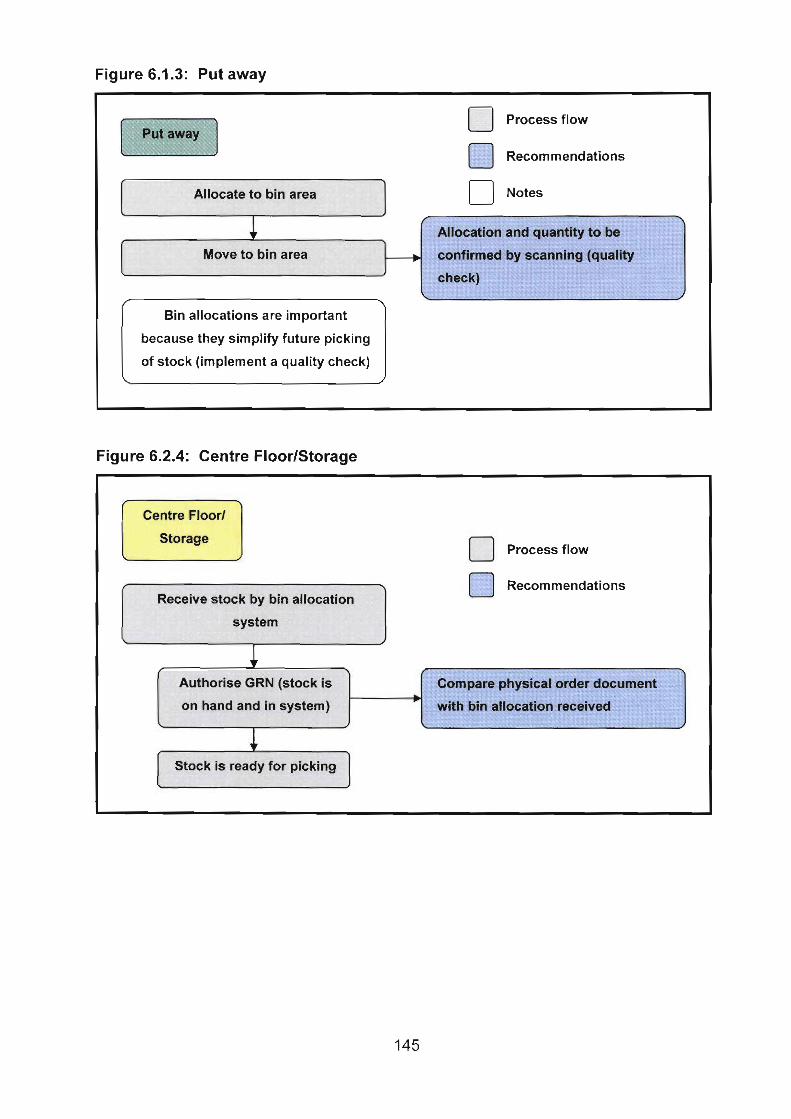
Figure 6.1.3: Put away
0 Process flow
Recommendations
Al lacate to bin aha Notes
because they simplify future picking
Figure 6.2.4: Centre FloorlStorage - - -
Process flow
Recommendations
m I F
on hand and in system)

Figure 6.1.5 Picking
n
request from Tips shoes
individual picker
Amount of cartons pic
what amount of time
in order to measure and manage of s&annsm (I" scan)
individual performance
is the second scan and there is still
belts to move the stock from picking
into a caittan bcrx* zone to audit zone (less labour
Process flow
Recommendations
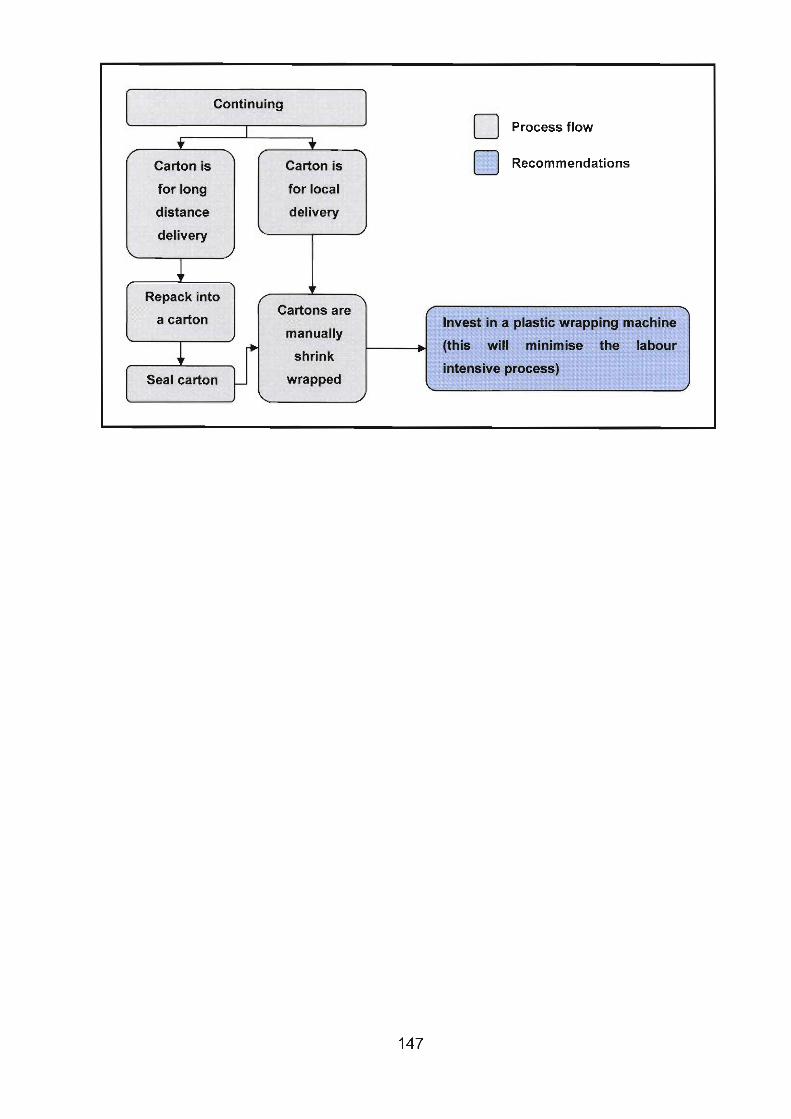
Recommendations
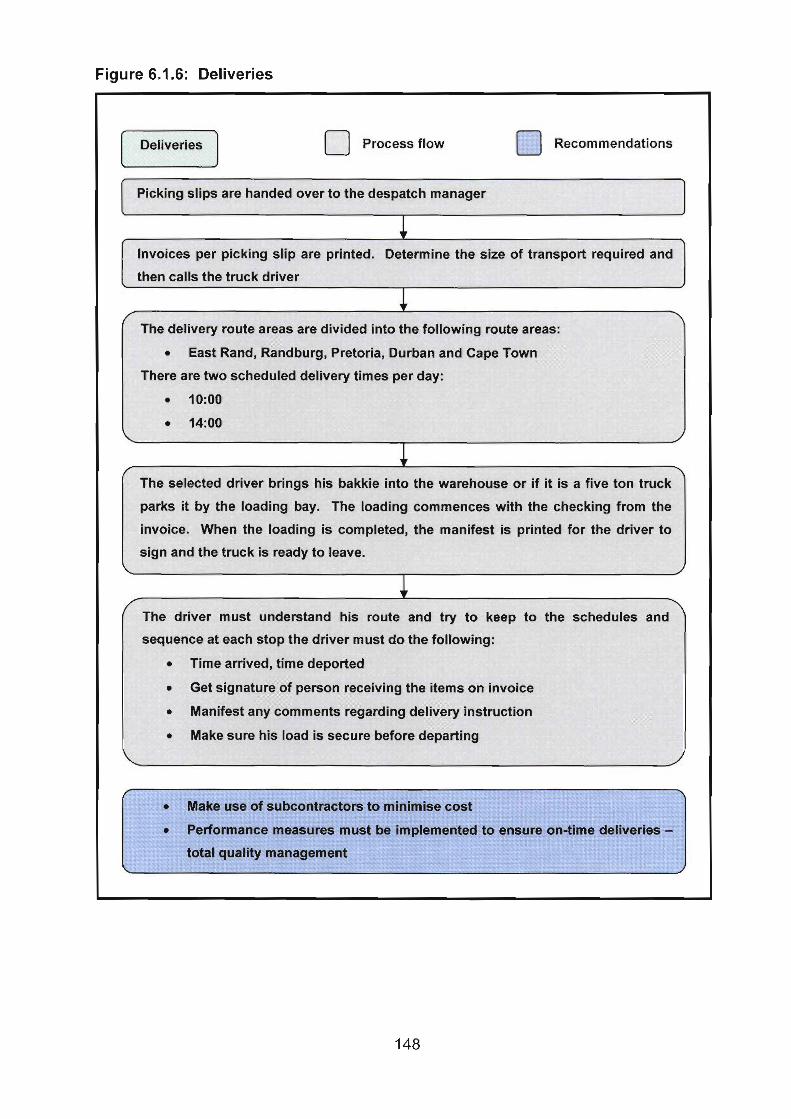
Figure 6.1.6: Deliveries
Deliveries C I I 0 process flow Recommendations
East Rand, Randburg, Pretoria, Durban and Cape Town
There are two scheduled delivery times per day:
The selected driver brings his bakkie into the warehouse or if it Is a five ton truck
parks it by the loading bay. The loading commences with the checking from the
invoice. When the loading is completed, the manifest is printed fur the driver to
sign and the truck is ready to leave.
sequence at each stop the driver must do the following:
9 Time anived, time deported

Figure 6.1.7 Proof of delivery
0 Process flow
Recommendations
occurred, credit Tips Shoe account
Figure 6.f.8: Off loading of returns
0 Process flow
Recommendations
documentatio
stock returns and arrange the
. to be sent to receivin necessary documentation and
actions to be taken

6.3.6 Cost of quality and Total Quality management
The warehouse and distribution function currently makes use of cost of quality and total
quality management (TQM) to a moderate extent (see diagram 5.14). Results of
research performed has indicated that the current use hereof is unsatisfactory owing to
the fact that they are not aware of how much investment is made in quality, and that the
quality of their service is still too low.
It is recommended that the warehouse and distribution function make use of a cost of
quality report (see paragraph 3.2.6). Cost of quality can be classified into four
categories. These four categories are prevention costs, appraisal costs, and internal
and external costs, which will enable management to measure and manage their cost of
quality. It is highly recommended that the warehouse and distribution function spend
more on compliance costs (prevention and appraisal costs), in order to spend less on
non-compliance costs (internal and external costs). This will lead to lower total cost of
quality.
The foundations of TQM (see paragraph 3.2.6) are customer focus, continuous
improvement and teamwork. It is highly recommended that the warehouse and
distribution function focus on these foundations. Making use of TQM should encourage
employees to work together as a team to improve quality on a continuous basis, using a
set of tools and techniques.
If the warehouse and distribution function implement the above it will lead to lower
quality costs, higher customer satisfaction, continuous quality improvement of services
and the improvement of competitiveness, effectiveness, and flexibility.
6.3.7 The value chain
The warehouse and distribution function makes use of the value chain and indicated
that this is satisfactory; they see themselves as a vital part of the value chain.

-The warehouse and distribution function must realise that the value chain is a sequence
of business activities in which usefulness is adding to the products or services of the
organisation to ensure value to the customer and therefore a competitive advantage.
By increasing the attention to the value chain and developing a close relationship
(sharing information) with suppliers and customers in order to reduce costs and excess
inventories costs will be managed more effectively in the warehouse and distribution
function and customer satisfaction will be increased.
6.3.8 Benchmarking
The warehouse and distribution function does make use of benchmarking. Its current
use is insufficient due to its infrequency.
SLA is committed to become and remain the number one third-party logistics provider in
the South African market (see paragraph 1.3), therefore the use of benchmarking (see
paragraph 3.2.8) on a regular basis is highly recommended to assist them in achieving
their goal. Benchmarking is a very powerful cost management tool, which will assist
management in the ongoing measurement and improvement of services delivered by
the warehouse and distribution function. Benchmarking will assist the warehouse and
distribution function to achieve and sustain a competitive advantage.
Most of the respondents indicated that the warehouse and distribution function does not
make use of a just-in-time (JIT) system (see diagram 5.14). As the products are
imported, there are too many variables for effective use of a JIT system. These
variables include: truck breakdowns, customs stop and customs inspection, as well as
the warehouse and distribution function. A further hindrance to the application of a JIT
system is that none of the parties have control over the process.
A hundred percent JIT system cannot be implemented in a warehouse, due to the fact
that a warehouse must maintain some inventories for it to be able to operate. By
making use of JIT purchasing principles (see paragraph 3.2.9.2) the amount of time the
product spends in the warehouse can be reduced to a large extent. The JIT approach
contrasts the warehousing operating systems because of the following factors:
Reduction in investment in raw materials and work in progress (WIP) stocks;
reduced throughput time and space requirements in the warehouse;
continuous process flow in the warehouse; and
negotiating with fewer suppliers le.ading to saving queue time of batches.
Therefore it is recommended that some of the JIT principles be implemented in the
warehouse and distribution function.
6.4 CONCLUSIONS AND RECOMMENDATIONS REGARDING PERFORMANCE
MEASUREMENTANDPERFORMANCEMANAGEMENT
6.4. I Performance measurement
There was no correspondence among the respondents as to how regular performance
measurements in the warehouse and distribution function are evaluated (see diagram
5.28). 40% of persons interviewed indicated that it is not evaluated at all, 20% indicated
that it happened on a daily basis, and 40% indicated that it happened on a monthly
basis. Performance evaluation must be conducted at least on a monthly basis, to act as
an early warning system, in order to implement remedial action. Employees must also
be aware of the standards against which their performance will be evaluated.
Management will need to put a system in place by means of which employees will
receive feedback on their performance on a regular basis. This feedback will assist
management of the warehouse and distribution function to implement corrective action
before it is too late.
Performance measurement is an effective way of increasing the competitiveness and
profitability of the warehouse and distribution function through encouragement of
productivity improvements. Therefore it is recommended that the warehouse and
distribution function make use of appropriate financial and non-financial performance
measures to ensure that managers adopt a long-term perspective and allocate the
organisation's resources to the most effective improvement activities.
When the warehouse and distribution function makes choices concerning which
financial and non-financial measurement to use, they should keep the following factors
in mind (see paragraph 4.2.2):
The purpose of the measurement;
the level of detail required;
the time available for the measurement;
the existence of available predetermined data; and
the cost of the measurement
6.4.1.1 Financial performance measures
80% of the respondents indicated that the warehouse and distribution function does not
make use of return on investment (ROI), and 20% of the respondents indicated that
they make use of ROI as a financial measurement for the SLA as a whole. The
warehouse and distribution function does not make use of residual income (RI) or
economic value-adding financial measurements at all. The latter are essential in order
to analyse the profitability and performance of the warehouse and distribution function
by comparing the financial ratios from month to month as well as by comparing it with
competitors.

ROI is a financial measure that measures the return on assets of an organisation or
department. It is highly recommended that the warehouse and distribution function
make use of ROI as a financial measurement because:
ROI can be used for inter-departmental comparisons within SLA as well as
comparisons of SLA with others in the industry;
ROI prevents managers over investing in projects; and
ROI represents profitability as a single percentage and motivates managers to
increase sales, decrease costs and minimise asset investment
RI is a financial measure that measures the rand amount of profits in excess of a
required rate of return. It is highly recommended that the warehouse and distribution
function make use of RI as a financial measurement because:
The RI approach encourages managers to invest in any project with returns
equal or greater than the required rate of return; this means making investments
that benefit the entire;
when differences in risk occur the warehouse and distribution function can adjust
the required rate of return; and
RI makes it is possible to calculate a different investment charge for different
types of assets.
Economic value added (EVA) is an organisation's returns after taxes and after
deducting the cost of capital. It is highly recommended that the warehouse and
distribution function make use of EVA as a financial performance measurement
because:
With EVA the SLA or the warehouse and distribution function can make use of its
actual cost of capital, taking into consideration the industry and risk
characteristics;
EVA focuses managers' attention on creating value for shareholders by earning
profits higher than the organisation's cost of capital.

6.4.1.2 Non-financial performance measures
Regarding the non-financial measurement of competence (see diagram 5.1 7 and 5.1 8)
the warehouse and distribution function indicated that sales growth is important to them
and that it does get measured. The warehouse and distribution function indicated that
market share is not important to them, and they did not use it as a performance
measurement. It is highly recommended that the warehouse and distribution function
measure their market share. Market share is the proportion of sales in a particular
market that an organisation obtains. Market share can be measured in terms of sales
revenue, unit sales volume or number of customers. The market share will assist
management in determining customer satisfaction and customer loyalty (see paragraph
4.3.2.2), which form an important part of the balanced scorecard (BSC).
Regarding quality of service (see diagrams 5.19 and 5.20) reliability and
responsiveness it is very important to the warehouse and distribution function and it is
measured, whereas appearance, cleanliness, friendliness and courtesy are also
important to the warehouse and distribution function, but these are not used as a
measurement. Although the warehouse and distribution function does not measure the
above, it is important for management to motivate employees to be aware of their
appearance, cleanliness, friendliness and courtesy, by setting an example and by
making use of a total reward system.
Regarding flexibility (see diagrams 5.21 and 5.22) of the service delivered by the
warehouse and distribution function, volume flexibility, delivery speed flexibility and
specification flexibility are important to them. Volume flexibility and delivery speed
flexibility are used as a measurement, whereas specification flexibility is not used as a
measurement.

Regarding resource utilisation (see diagram 5.23 and 5.24), productivity and efficiency
are very important to the warehouse and distribution function and these are used as a
measurement. It is recommended that BPR be used to improve productivity, seeing
that BPR and productivity go hand in hand (see paragraph 3.2.5) and will help the
warehouse and distribution function achieve higher levels of profitability and improve
competitiveness. Benchmarking can be used by managers in the warehouse and
distribution function to monitor and control productivity. Performance measurement of
productivity and efficiency is an effective way of increasing the competitiveness and
profitability of the warehouse and distribution function. The warehouse and distribution
function must make use of the learning and growth perspective (see paragraph 4.3.2.5)
in order to improve productivity and efficiency. They must focus on employee
capabilities, information system capabilities, and motivational empowerment and
alignment.
Regarding innovation in the warehouse and distribution function, 40% of the
respondents indicated that warehouse innovation is very important to them, 20%
indicated that is important and 40% indicated that it is not important. Most of the
respondents indicated that individual performance is very important to them. The
respondents also indicated that warehouse innovation and individual performance do
not get measured. It is highly recommended that warehouse innovation be used as a
non-financial performance measurement. The innovation process (see paragraph
4.3.2.3(a)) is concerned with processes to identify customer needs and to create
services to meet those needs. Making use of innovation as a measurement will assist
management in the warehouse and distribution function to design and develop new
products or services that enable them to achieve newly identified markets and
customers.
It is highly recommended that the warehouse and distribution function measure
individual performances. This will assist management in determining whether
individuals are motivated, and whether they work in a productive manner.
Increased competitiveness in the market requires that the warehouse and distribution
function continually improves its information systems in order to support its strategy and
assist management in operating the warehouse and distribution function more
effectively and efficiently. Management in the warehouse and distribution function
cannot only make use of financial measurements in order to measure their
performance. Non-financial measurements of competitiveness, quality of service,
flexibility, research utilisation (productivity and efficiency) and innovation are important
measures in the current competitive market (see table 4.1 in chapter 4), which
management of the warehouse and distribution function must consider using.
6.4.2 Performance management
Part of the primary objective, as stated in paragraph 1.4.1, is to analyse the existing
performance management system in the warehouse and distribution function. There
are a few shortcomings regarding the current performance management system, which
will be discussed below.
Regarding how adequately employees in the warehouse and distribution function were
informed regarding performance management (see diagram 5.30), 40% of the
respondents indicated that employees are adequately informed about performance
management and 60% indicated that employees are not adequately informed about
performance management. It is highly recommended that management of the
warehouse and distribution function inform their employees about performance
management, its uses and benefits. Managers will have to communicate (see
paragraph 4.3.3) with their employees on a regular basis and inform them about issues
that will affect them or will be affected by them. The above will increase the success
and likelihood that all employees work together to achieve the goal of the warehouse
and distribution function.

According to the respondents, 40% indicated that employees in the warehouse and
distribution function are sent on training courses (see diagram 5.29) quarterly, whereas
60% indicated that they are sent on training courses on an annual basis. It is highly
recommended that management of the warehouse and distribution function develop
their employees' skills levels (see paragraph 4.3.2.5(c)) on a regular basis by sending
them on relevant training or development courses.
The respondents indicated (see section C question 34) that picking targets and
incentives are used to motivate employees in the warehouse and distribution function.
Motivation plays an important role in the performance of employees. It is highly
recommended that not only financial elements (see paragraph 4.3.2.5(c)) like incentives
be used as a reward system, but that non-financial elements, like recognition,
involvement, information sharing and work-life balance should be considered as well.
The warehouse and distribution function must ensure that the performances of its
employees is linked to a total reward system in order to ensure that employees are
motivated to achieve performance in line with the goal of the warehouse and distribution
function.
6.4.2.1 The balanced scorecard
The balanced scorecard (BSC) balances the use of financial and non-financial
performance measures to evaluate the short-term and long-term performances in a
single report (see paragraph 4.3.1). The BSC is a performance management system
that can be used in any organisation to support the vision and mission with customer
requirements and day-to-day work, manage and evaluate business strategy, monitor
improvements in operational efficiency, build organisational capacity and communicate
progress to employees
The BSC will assist managers in looking at the warehouse and distribution function from
four different perspectives and will provide answers to the following four basic questions
To succeed financially, how should the warehouse and distribution function
appear to their shareholders? (Financial perspective.)
To achieve their vision, how should the warehouse and distribution function
appear to their customers? (Customer perspective.)
To satisfy their shareholders and customers, what business processes must the
warehouse and distribution function excel at? (Internal business perspective.)
To achieve their vision, how will the warehouse and distribution function sustain
their ability to change and improve? (Learning and growth.)
80% of the respondents (see diagram 5.15) indicated that the warehouse and
distribution function does not make use of a formal performance management system.
According to 20% of the respondents the warehouse and distribution function does
make use of a formal performance management system, but only one respondent was
involved in the development of that system, it is less than a year old, no one has
received training in performance management and the system is ineffective.
The usage of the BSC in the warehouse and distribution function is therefore highly
recommended, seeing that
the BSC encourages clarification and updating of the warehouse and distribution
function's vision and strategy,
the BSC improves communication and consensus of the strategy throughout the
organisation, which leads to aligning the warehouse and distribution functions
and personal goals to the vision and strategy of the organisation,
the BSC links strategic objectives to short-term and long-term performance
objectives,
the BSC places strong emphasis on financial and nan-financial objectives and
measures, which leads to improved financial performance,
the BSC helps managers use operational data for decision-making,

the BSC limits the number of measures, identifying only the most critical ones
with the purpose of helping managers focus attention on measures that mostly
affect the implementation of strategy,
the BSC motivates employee effort,
the BSC promotes action toward achieving strategies,
the BSC enables periodic performance reviews of development toward vision
and strategy,
the BSC provides feedback to assist learning or strategy development,
the BSC is a simple and accessible model for performance, based on priority
areas for attention in each of the four perspectives,
the BSC minimises reliance on a single performance measure,
the BSC reduces optimisation of departments at the expense of the organisation
as a whole,
the BSC avoids dependence on short-term or incomplete financially based
performance measures,
the BSC increases accountability; goals are incorporated into the evaluation
process and accountability is linked to compensation, and
the BSC assists stakeholders in their evaluation of the organisation.
The first secondary objective is to implement activity-based performance management
systems effectively and efficiently so as to ensure business success through continuous
improvement. In order to implement a performance management system effectively
and efficiently, refer to paragraph 4.3.3, where the steps of implementing a BSC
approach is discussed. For an example of the implementation of the BSC in the
warehouse and distribution function, refer to paragraph 4.3.4. 160

6.5 SUMMARY
The primary objective (see paragraph I .4.1) of this study was to analyse the existing
cost allocation system, the cost management system and the performance
management system of SLA, focusing on the warehousing and distribution function. In
paragraphs 6.2 to 6.4 an analysis was made of the existing systems in order to draw
conclusions and make recommendations to address the shortcomings of the existing
systems.
In paragraph 6.2 it became clear that the warehouse and distribution function did not
make use of an efficient cost allocation system and this led to the shortcoming that true
cost of the warehouse and distribution function services could not be determined
accurately. The first secondary objective (see paragraph 1.4.2) is to implement an
activity-based performance management system effectively and efficiently so as to
ensure business success through continuous improvement. An activity-based costing
system is therefore recommended to uncover the true cost of the warehouse and
distribution function's services by more accurately allocating cost to their services (see
the secondary objective in paragraph 1.4.2). The true cost is a tool which assist
management in decision making, planning and controlling, which forms part of the
secondary objective (see paragraph 1.4.2). The true cost will assist management in
analysing the cost and profitability of their services. It will assist them in determining a
competitive and accurate pricing structure. Therefore by implementing an effective and
efficient activity-based costing system the third secondary objective as stated in
paragraph 1.4.2 it will assist management in better decision-making, planning and
controlling, by providing timely and useful information to ensure accurate cost allocation,
the ability to determine the true cost of activities and facilitating performance
management.
In paragraph 6.3 it was made clear that the warehouse and distribution function did not
manage its cost effectively. In order to achieve the secondary objective (see paragraph
1.4.2) to improve the current cost management system in order to achieve an overall
competitive advantage, managers of the warehouse and distribution function should
make use of the following cost management tools to implement their strategy and
facilitate the achievement of success in respect of critical success factors: life-cycle
costing (LCC), target costing (TC), kaizen costing, activity-based management (ABM),
161

business process reengineering (BPR), costs of quality and total quality management
(TQM), value chain, benchmarking and just-in-time (JIT). By implementing the above
cost management techniques it will assist management in maintaining customer
satisfaction, strengthening their competitive position, minimising the cost of their
services and increasing profitability without forfeiting the value or quality of the service
to the customer.
In paragraph 6.4 conclusions were drawn and recommendations made regarding the
current use of performance measurement and performance management in the
warehouse and distribution function. In order to achieve the secondary objective (see
paragraph 1.4.2) to measure performance in order to achieve an overall competitive
advantage the BSC is highly recommended. The BSC balances the use of financial and
non-financial performance measures to evaluate the short-term and long-term
performances in a single report. The BSC is a performance management system that
can be used by the warehouse and distribution function to support the vision and
mission with customer requirements and day-to-day work, manage and evaluate
business strategy, monitor improvements in operational efficiency, build organisational
capacity and communicate progress to employees
In the era of the competitive global environment and technology-based organisations,
managers are pressured to find ways of maintaining their competitive advantage.
Management has the responsibility to maintain their competitive advantage whilst
maintaining the profitability in all departments of the organisation. SLA has proven to be
a market leader within the logistics services market whilst maintaining profitability in
most of its core business functions, with the exception of the warehousing and
distribution function.
For management of the warehouse and distribution function to achieve their goal of
becoming and remaining a profitable department within SLA, a combination of tools
should be used, which include activity-based costing, cost management and
performance management. Therefore it can be concluded that the effective and
efficient use of activity-based performance management will enable management in the
warehouse and distribution function achieve their goal of becoming and remaining a
profitable department within SLA.

Appendix

Appendix A: Questionnaire
The following questionnaire was used during the empirical study.
QUESTIONNAIRE
REGARDING THE SUGGESTED
lMPLEMENTATlON OF
ACTIVITY-BASED PERFORMANCE MANAGEMENT IN THE
WAREHOUSE AND DISTRIBUTION FUNCTION
Instructions for the completion of the questionnaire:
1. Please be assured that the information gathered by the questionnaire will be used
exclusively for research purposes and will at all times be treated as highly
confidential.
2. In order for the study to be successful, participants will need to answer all questions
in as much detail as possible. If you cannot answer the question, please indicate it
by writing down NIA (not applicable).
3. Objective and unbiased responses are encouraged to ensure the further success of
this process.
4. Please indicate your answer by marking the relevant block with an " X .
5. Some questions need to be written out; therefore no block will be provided to be
marked with an "X".
6. Please complete the questionnaire in upper case.
7. If you do not understand a question, please do not hesitate to ask the researcher for
clarification.
8. After completing the questionnaire, the researcher might contact you for a follow-up
discussion on certain questions for clarification purposes.
Your contribution is much appreciated.

Section A - Personal background
1. What is your current position?
- -
2. How many years of experience do you have in the logistics industry?
Less than 1 year
1 - 2 years
2 - 6 years
6 -1 0 years More than 10 years
3. How long have you been working for SLA?
4. Describe your responsibilities and involvement regarding the warehouse and
distribution function.

Section B - Warehouse and distribution background
I .a Would you say that there is room for improvement regarding the profitability of the
warehouse and distribution function?
Yes
I .b Why are you of this opinion?
2. Approximately how many people does SLA employ in the warehouse and
distribution function?
3. What are the major elements of the warehouse and distribution function's strategy?
(Please rank factors in order of importance, with I being most important.)
Other:

Section C - Fundamentals
1. Does SLA currently make use of an activity-based costing system in the warehouse
and distribution function?
Yes 0
If your answer to question 1 is "yes", please continue from question 2 below. If your
answer is "no", continue from question 9.
2. How did the company implement the activity-based costing system?
Only external consultants
Mostly external consultants
Only internal implementations
Mostly internal implementations Other (specify below)
Other:
3. Did you have any difficulty in implementing the activity-based costing system?
Yes I 1
If yes, briefly discuss the difficulties:
4. For what duration has the warehouse and distribution function made use of an
activity-based costing system?

5. Do you consider the activity-based costing system to be more accurate in
comparison to your traditional costing system?
yes n NO D
Brie'l'ly discuss your answer above:
6. What is your general feeling about the results achieved by an activity-based costing
system?
Satisfied Neutral Unsatisfied Unsure R
Briefly discuss your answer above:
7. What advantages does an activity-based costing system have for your company?
8. What disadvantages does an activity-based costing system have for your company?
Please continue from question 13.
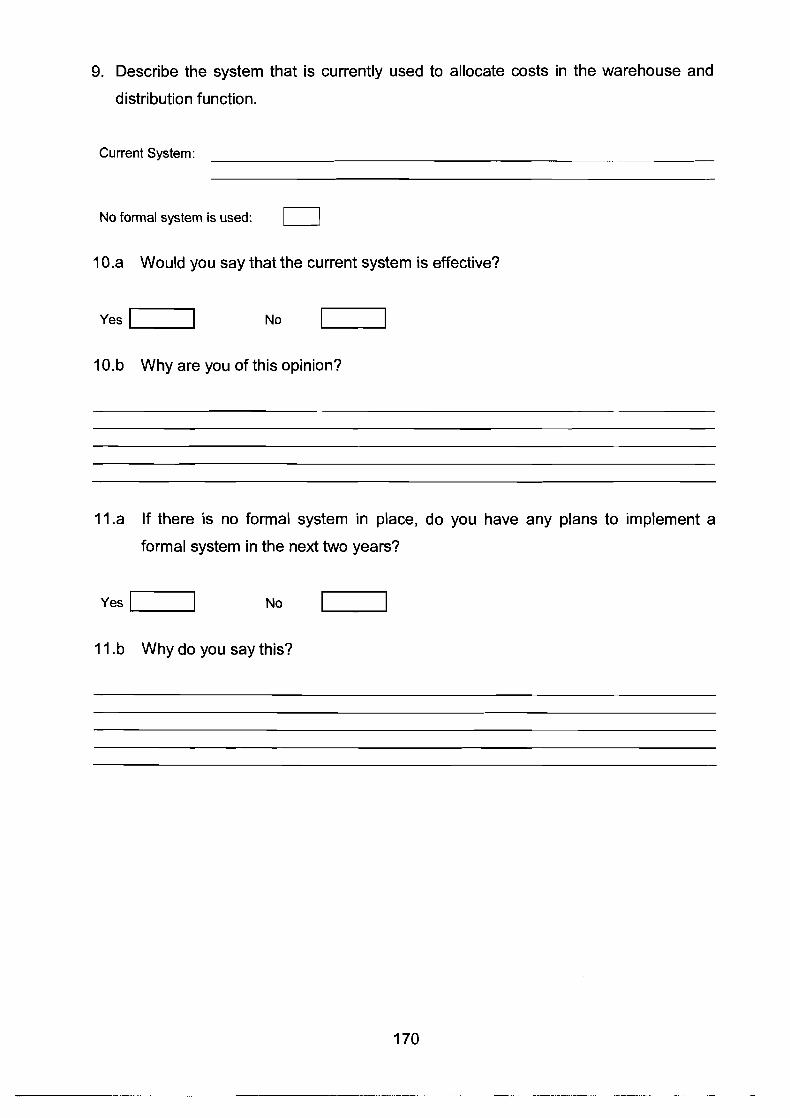
9. Describe the system that is currently used to allocate costs in the warehouse and
distribution function.
Current System:
No formal system is used: I 1
1 O.a Would you say that the current system is effective?
Yes n 10.b Why are you of this opinion?
I I .a If there is no formal system in place, do you have any plans to implement a
formal system in the next two years?
yes 1 NO 0
1l.b Whydoyousaythis?

12. What is the current process flow in the warehouse and distribution function?
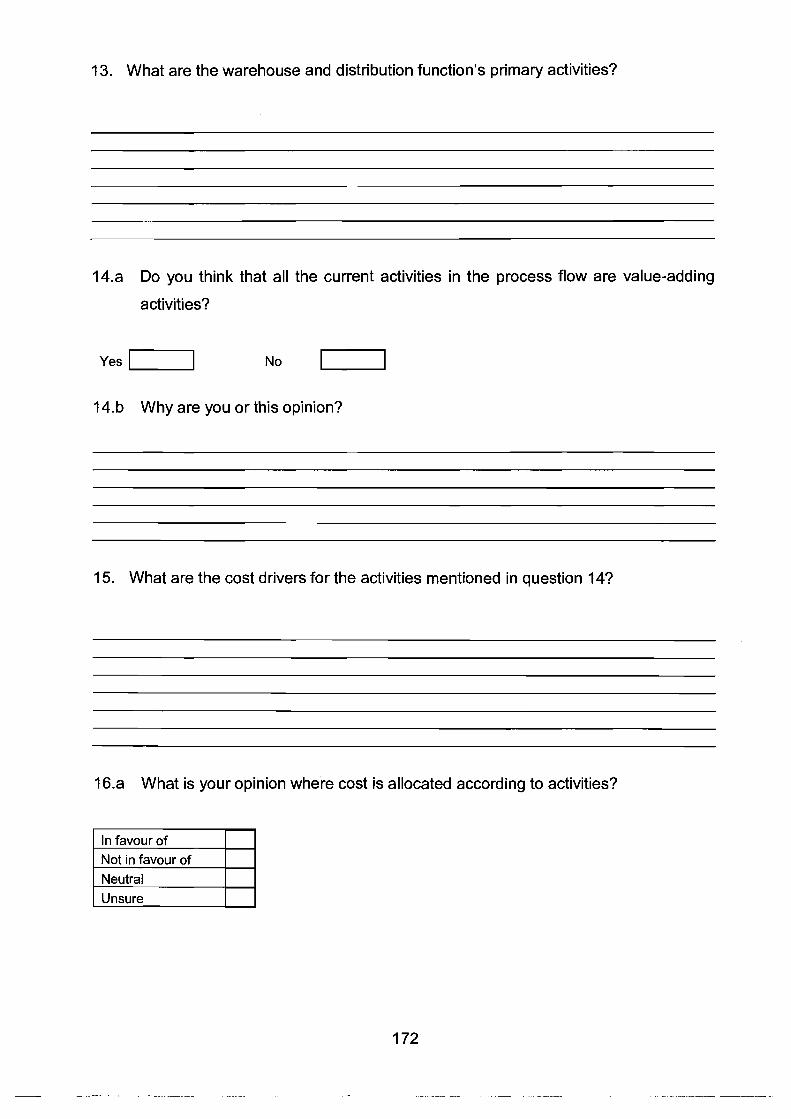
13. What are the warehouse and distribution function's primary activities?
14.a Do you think that all the current activities in the process flow are value-adding
activities?
yes 1 NO O 14.b Why are you or this opinion?
15. What are the cost drivers for the activities mentioned in question 14?
16.a What is your opinion where cost is allocated according to activities?
Unsure

16.b Why are you of this opinion?
17. Do you think that the price or service fee could be determined more accurately by
implementing an activity-based costing system?
Yes I I
18.a Would you consider changing to an activity-based costing system?
Yes 1 1
18.b Why do you say this?
19.a To what extent are the following cost management tools used in SLA's
warehouse?
1. Not at all
2. To a moderate extent
3. To a large extent
4. Totally
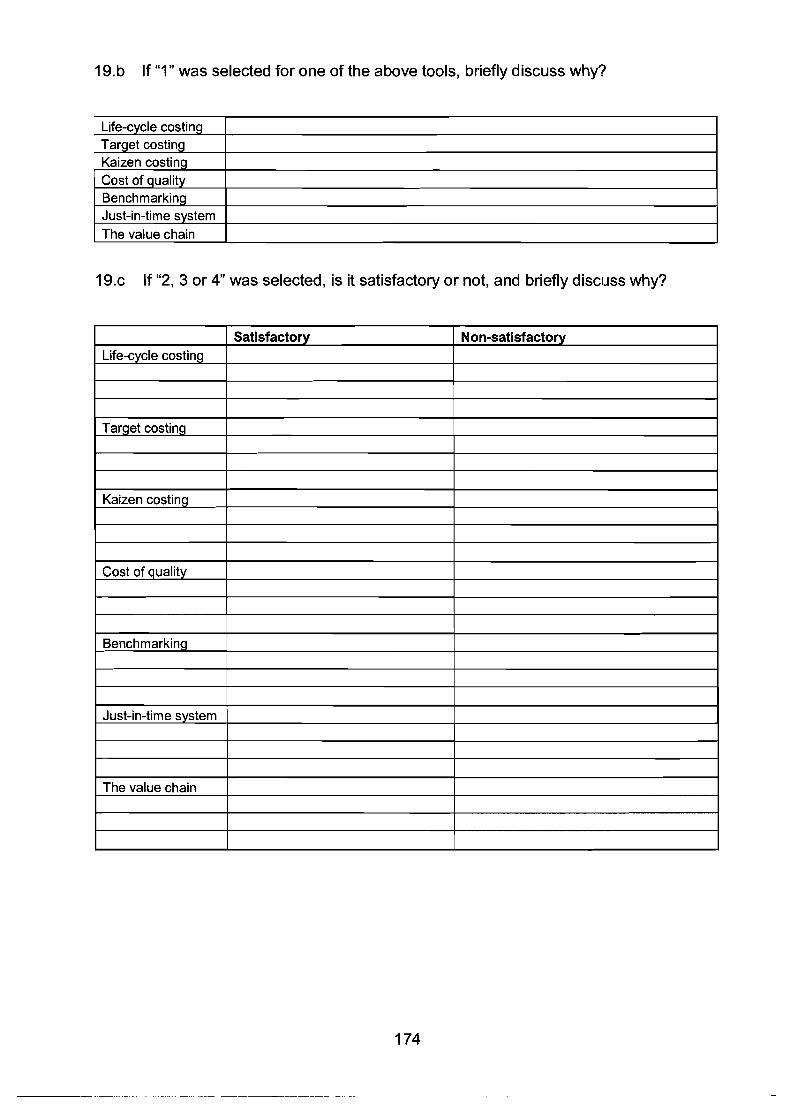
19.b If "1" was selected for one of the above tools, briefly discuss why?
Life-cycle costing Target costing Kaizen costing Cost of quality Benchmarking Just-in-time system The value chain
19.c If "2, 3 or 4 was selected, is it satisfactory or not, and briefly discl-lss why?
Benchmarking
Just-in-time system
The value chain
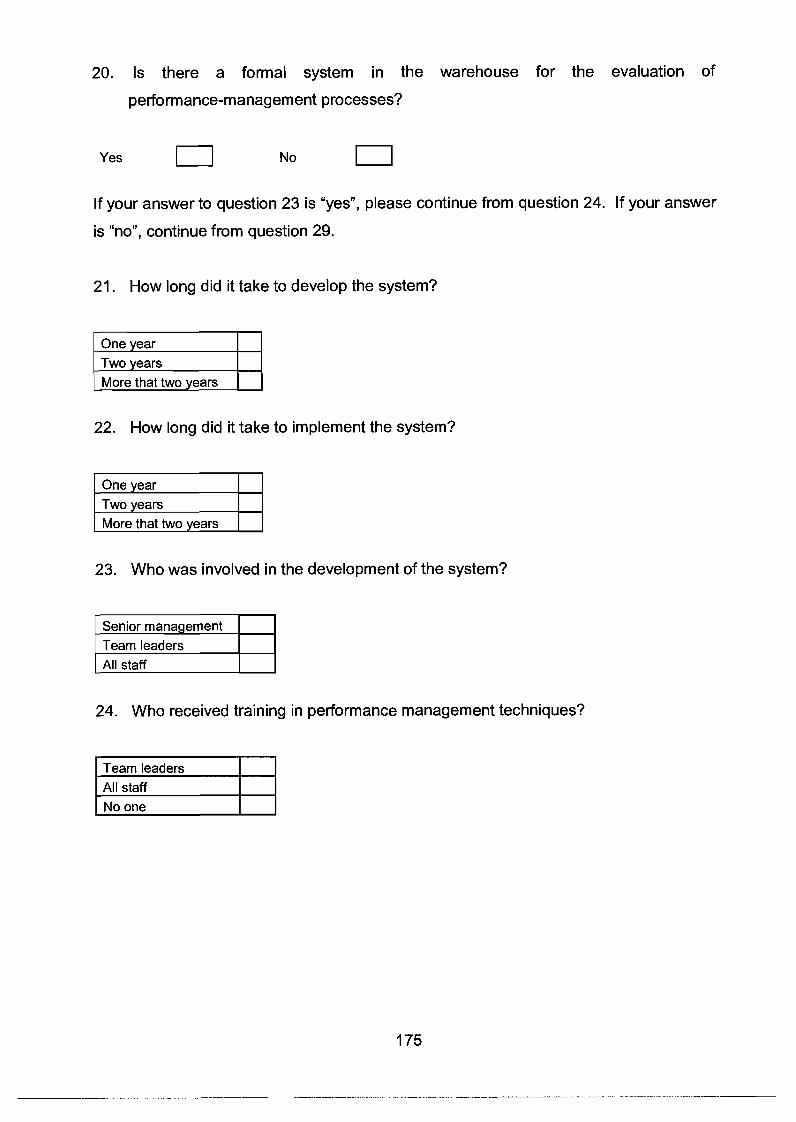
20. Is there a formal system in the warehouse for the evaluation of
performance-management processes?
Yes 0
If your answer to question 23 is "yes", please continue from question 24. If your answer
is "no", continue from question 29.
21. How long did it take to develop the system?
22. How long did it take to implement the system?
23. Who was involved in the development of the system?
Team leaders
24. Who received training in performance management techniques?
All staff

25. How effective is SLA's current warehouse and distribution's
performance-management system?
No formal system is used: I I
Please continue from question 30.
26. If you do not operate formal performance-management processes, do you plan to
implement a performance management system in the next two years?
Yes
27. What are the key factors which you use to determine whether performance
management is effective? (Please rank factors in order of importance, with 1 being
most important)
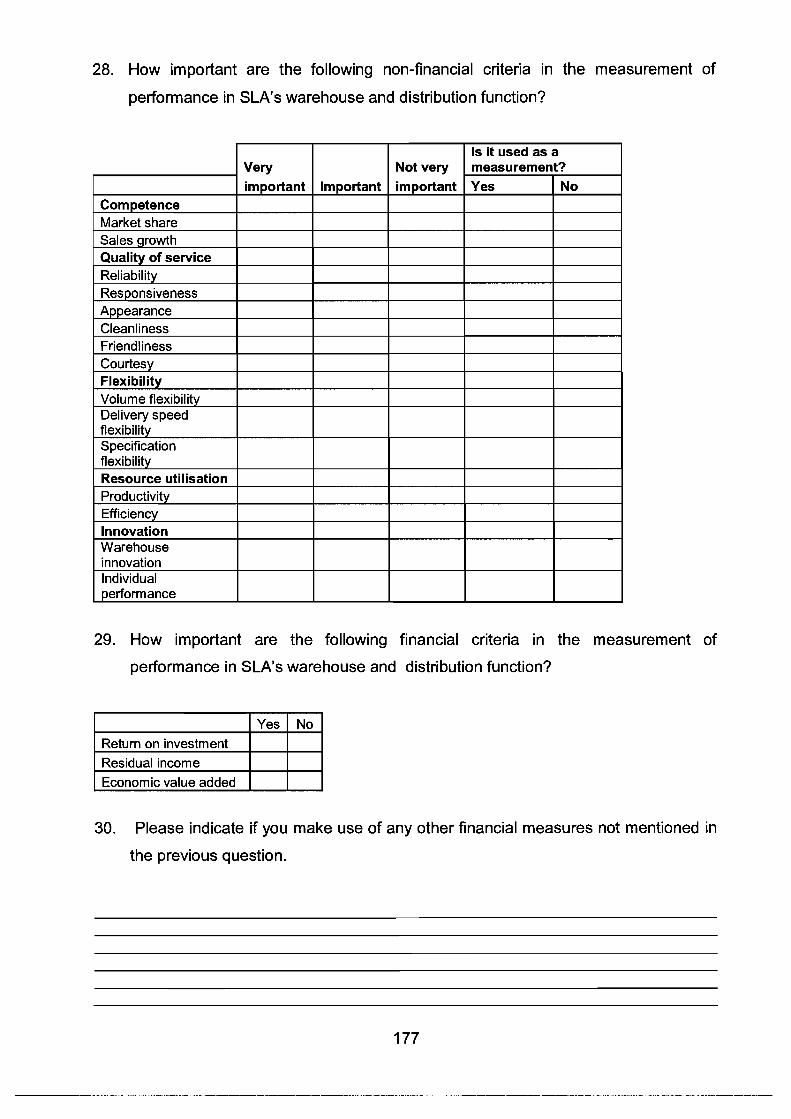
28. How important are the following non-financial criteria in the measurement of
performance in SLA's warehouse and distribution function?
29. How important are the following financial criteria in the measurement of
performance in SLA's warehouse and distribution function?
Return on investment
30. Please indicate if you make use of any other financial measures not mentioned in
the previous question.

31. How regular is performance in the warehouse and distribution function evaluated?
Monthl
32. How often are employees in the warehouse and distribution function sent on
training courses to enable them to improve their performance?
Monthl
33. Are employees adequately informed about performance management?
Yes
34. What reward system is used to motivate employees in the warehouse and
dish-ibution function?
35.a What is your opinion of the balanced scorecard?
Not in favour of
35.b Why are you of this opinion?

36.a Do you think that performance in the warehouse and distribution function can be
measured and managed more accurately by implementing the BSC approach?
yes 1 I No U
36.b Why are you of this opinion?
37. Do you think by measuring and managing your performance it will affect your
process cost and profitability positively?
yes -1 NO O
38. Would you consider changing to a balanced scorecard model?
yes n NO 0
DEFINITIONS OF TERMS
Activity-based costing (ABC) - is a costing method based on the principle that
products and/or services require an organisation to carry out activities and that those
activities require of an organisation to incur costs. In activity-based costing, systems
are designed so that any costs that cannot be directly accredited to a product or service
flow into the activities that makes the cost necessary. 'The cost of each activity then
flows to the product(s) or service(s) that make the activity necessary, based on their
particular use of that activity (Hicks, 1999:6 & Griful-Miquela, 2001 : I 35).
Activity - is an event, task or unit of work with a particular purpose; for example,
designing products, setting up machines, operating machines, and distributing products.
A type of task or function performed in an organisation (Horngren et a/., 2006:144-145).
Balanced scorecard - a formal approach used to help organisations translate their
vision into objectives that can be measured and monitored using both financial and
non-financial performance measures (Horngren et a/., 2006:457).
Benchmarking - is the ongoing structured and objective process of measuring and
improving products, services, practices and processes against the best identified in the
world in order to achieve and sustain competitive advantage (Grinyer & Goldsmith,
1995:2).
Cost driver - activities and cost objects are linked by cost drivers, therefore a cost
driver is a unit of activity that causes or influences costs (Lin etal., 2001:708 and
Stapleton etal., 2004:586).
Cost of quality - cost incurred to ensure high quality and/or the costs arising as a
result of, the production of a low-quality product or service (Horngren et a/., 2006:847).
Economic value added (EVA) -is an organisation's returns after taxes and after
deducting the cost of capital (Blocher etal., 2005:779).
Just-in-time (JIT) - the purchase of materials (or goods) so that they are delivered just
as needed for production (or sales) (Horngren et a/., 2006:850).
180
Kaizen costing - planning process for achieving continuous improvement in product
cost, quality and functionality. It is similar to target costing, but occurs after the product
has been designed and the first production cycle has been completed (Blocher et a/.,
Life-cycle costing (LCC) - is the method of measuring all costs involved in creating,
producing and utilising a product or service. LCC is not only the costs incurred by the
organisation measuring these costs but also the costs incurred by the suppliers and the
customers of the product or service (Swain etal., 2005:579).
Residual income (RI) - is a financial performance measure that measures the rand
amount of profits in excess of a required rate of return (Eldenburg & Wolcott,
2005:600).
Return on investment (ROI) - is a financial performance measure that measures the
return (how much has been earned) on assets (investments) of an organisation (Swain
etal., 2005:355).
Target costing (TC) - is a structured process aimed at insuring that a product launched
with specified functionality, quality and sales price can be produced at a life-cycle cost
that generates a satisfactory level of profitability (Cooper & Slagmulder, 1997:72).
Value chain - the sequence of business activities in which usefulness is added to the
products or service of the organisation to ensure value to the customer and therefore
competitive advantage (Horngren et a/., 2006:4).
BIBLIOGRAPHY
*Quoted sources
*ARMSTRONG, M. & BARON, A. 2003. Performance management the new realities.
London: CIPD. 466p.
*BEHESHTI, H.M. 2004. Gaining and sustaining competitive advantage with activity
based cost management system. Industrial management & data systems, 104(5):377-
383.
*BLOCHER, E.J., CHEN, K.H., COKINS, G. & THOMAS, W.L. 2005. Cost
management: a strategic emphasis. 3rd ed. London: McGraw-Hill. 930 p.
*BOTTEN, N. & SIMS, A. 2005. Management accounting - business strategy. Oxford:
CIMA. 601 p.
*BREWER, P.C. & SPEH, T.W. 2000. Using ,the balanced scorecard to measure
supply chain performance. Journal of business logistics, 21 (1 ):75-93.
*BURK, K.B. & DOUGLAS, W. 1994. Activity based costing and performance. Fairfax:
American Management Systems. 141 p.
CARDINAELS, E., ROODHOOFT, F. & WARLOP, L. 2004. The value of activity-based
costing in com petitive pricing decisions. Journal of management accounting research,
16(1): 133-1 48, NOV.
*CHAN, Y.L. 2004. Performance measurement and adoption of balanced scorecards:
a survey of municipal governments in the USA and CANADA. International journal of
public sector management, 1 7(3):204-221.
*CHEN, C. & CHUNG, C.H. 2002. Cause-effect analysis for target costing.
Management accounting quarterly, 3(2): 1 -9, Winter.
*CLOSS. D.J. & GOLDSBY. T.J. 2000. Using activity-based costing to reengineer the
reverse logistics channel. International journal of physical distribution & logistics
management, 30(6):500-514, March.
COKINS, G. 1999. Learning to love ABC. Journal of accountancy, 188(2):37-39, Aug.
COKINS, G. 2004. Performance management: finding the missing pieces (to close the
intelligence gap). Hoboken: Wiley. 284 p.
*COOPER, R. & SLAGMULDER, R. 1997. Target costing and value engineering.
Portland: Production Press. 371 p.
*COOPER, R. & SLAGMULDER, R. 2005. Achieving full-cycle cost management.
Industrial engineer, 37(12):45-52, Dec.
CORREIA, C., FLYNN, D. ULIANA, E. & WORMALD, M. 2003. Financial
management. 5th ed. Lansdowne: Juta. (Various paging.)
*COYLE, J.J., BARDI, E.J. & LANGLEY, C.J. 2003. The management of business
logistics: a supply chain perspective. 7th ed. Belmont: Thomson Learning. 707 p.
DEKKER, H.C. & VAN GOOR, A.R. 2000. Supply chain management and
management accounting: a case study of activity-based costing. International journal
of logistics: research and applications, 3(1):41-52.
DOYLE, P.D. 2002. Cost control: a strategic guide. London: CIMA. 230 p.
*DRURY, C. 2004. Management & cost accounting. 6th ed. London: Thomson
Learning. 1280 p.
*ELDENBURG, L.G. & WOLCOTT, S.K. 2005. Cost management: measuring,
morritol-ing, and motivating performance. Hoboken: Wiley. 704 p.
ELLRAM, L.M. 2002. Supply management's involvement in the target costing process.
European journal of purchasing & supply management, 8(4):235-244.

EPSTEIN, M.J. & MANZONI, J. 2002. Performance measurement and management
control: a compendium of research. Amsterdam: Elsevier. 379 p.
FERNIE, J., FREATHY, P. & TAN, E. 2001. Logistics costing techniques and their
application to a Singaporean wholesaler. lnternational journal of logistics, 4(1):117-131.
*FIRER, C., ROSS, S.A., WESTERFIELD, R.W. & JORDAN, B.D. 2004. Fundamentals
of corporate finance. 3rd ed. London: McGraw-Hill. 862 p.
*FOLAN, P. & BROWNE, J. 2005. A review of performance measurement: towards
performance management. Computers in industry, 56(1):663-680.
*GARRISON, R.H. &, NOREEN, E.W. 2000. Managerial Accounting. gth ed. Boston:
McGraw-Hill. 923 p.
*GARRISON, R.H., NOREEN, E.W. & BREWER, P.C. 2006. Managerial Accounting.
1 lth ed. Boston: McGraw-Hill. 863 p.
*GLAD, E., BECKER, H. 1994. Activity-based costing and management. Cape Town:
Juta. 228 p.
*GRIFUL-MIQUELA, C. 2001. Activity based costing methodology for third-party
logistics companies. IAER, 7(1):133-145, Feb.
*GRINYER, M. & GOLDSMITH, H. 1995. Benchmarking for competitive advantage.
London: BBC for business. 824 p.
*GUNASEKARAN, A. & KOBU, B. 2002. Modelling and analysis of business process
reengineering. lnternational of production research, 40(11):2521-2546, Nov.
*GUNASEKARAN, A., MARRI, H.B. & MENCI, F. 1999. Improving the effectiveness of
warehousing operations: a case study. Industrial management & data systems,
99(8):328-339.

*HANSEN, D.R. & MOWEN, M.M. 2003. Cost Management: accounting and control.
4'h ed. Cincinnati: South Western College Publishing. 1029 p.
HELMS, M.H., ETTKIN, L.P., BAXTER, J.T. & GORDON, M.W. 2005. Managerial
implications of target costing. Competitiveness review, 15(1):49-56.
*HENDRICKS, K., MENOR, L. & WIEDMAN, C. 2004. The balanced scorecard: to
adopt or not to adopt? lvey business journal, 69(2):1-7, Nov.
*HIBBETS, R.H., ALBRIGHT, T. & FUNK, W. 2003. The competitive environment and
strategy of target costing irr~plementers: evidence from the field. Journal of
management issues. 15(1):65-81, Sep.
*HICKS, T. 1999. Activity based costing: making it work for small and mid-sized
companies. 2nd ed. New York: Wiley. 357 p.
*HOT D.C.K., CHENG, E.W.L. & FONG, P.S.W. 2000. Integration of value analysis and
total quality management: the way ahead in the next millennium. Total quality
management, 1 l(2): 1 79-1 86.
*HOLLOWAY, J., HINTON, C.M., FRANCIS, G. & MAYLE, D. 1999. Identifying best
practice in benchmarking. London: Elsevier. 77 p.
*HORNGREN, C.T., DATAR, S.M. & FOSTER, G. 2003. Cost Accounting: a
managerial emphasis. I lth ed. Upper Saddle River: Prer~tice Hall. 856 p.
*HORNGREN, C.T., DATAR, S.M. & FOSTER, G. 2006. Cost Accounting: a
managerial empahasis. 12'~ ed. Upper Saddle River: Prentice Hall. 868 p.
*HUGO, W.M.J., BADENHORST-WEISS, J.A. &VAN BILJON, E.H.B. 2004. Supply
chain management: logistics in perspective. Pretoria: Van Schaik. 369 p.
HUSSAIN, M.D. & GUNASEKARAN, A. 2001. Activity-based cost management in
financial services industry. Managing service quality, 11 (3):213-223.
*INGRAM, W.I., THOMAS, L.A. & HILL, J.W. 2003. Managerial information for
decisions accounting. 3rd ed. Belmont: South Western - Thomson Learning. 520 p.
IP, P.C., LI, P.W. & YAU, S.W. 2003. Application of activity based costing: the case of
a non-government organization. lnternational journal of management, 20(3):282-293,
Sept.
*JIAMBALVO, J. 2004. Managerial accounting. 2nd ed. Hoboken: Wiley. 512 p.
*KAPLAN, R.S. & ATKINSON, A.A. 1998. Advanced management accounting. 3rd ed.
Upper Saddle River: Prentice Hall. 789 p.
*KAPLAN, R.S. & COOPER, R. 1998. Cost & effect: using integrated cost systems to
drive profitability and performance. Boston: Harvard Business School Press. 357 p.
*KAPLAN, R.S. & NORTON, D.P. 1996. Translating strategy into action: The Balanced
Scorecard. Boston: Harvard Business School. 322 p.
KLIEM, R.L. 2000. Risk management for business process reengineering projects.
Information systems management, 1 7(4):71-73.
*LA LONDE, B. & GINTER, J. 1999. A summary of activity-based costing: best
practices. Columbus, OH: Ohio State University's Supply Chain Management Research
Group. 20p. (Paper no. 606.) http://www.cob.ohio-
state.edu/supplychain/pdf files/ABC%20Best%20Practices%200397.~df Date of
access: 10 Nov. 2006.
LEA, B. & MIN, H. 2003. Selection of management accounting systems in just-in-time
and theory of constraints-based manufacturing. lnternational journal of production
research, 41 (1 3):2879-2910.
*LERE, J.C. 2000. Activity-based costing: a powerful tool for pricing. Journal of
business & industrial marketing, 15(1):23-33.

*IAN, B., COLLINS, J. & SU, R.K. 2001. Supply chain costing: an activity-based
perspective. lnternational journal of physical distribution & logistics management,
31 (1 0):702-713, Sept.
*LOCKAMY Ill, A. & SMITH, W.I. 2000. Target costing for supply chain management:
criteria and selection. Industrial management & data systems, 100(5):210-218.
LOKMAN, M. 2000. Just-in-time manufacturing, management accounting systems and
profitability. Accounting and business research, 30(2): 1 37-1 51 , Spring.
MAIGA, A.S. 2003. Balanced scorecard, activity-based costing and company
performance: an empirical analysis. Journal of managerial issues, 15(3):283-301.
MISHRA, B. & VAYSMAN, 1. 2001. Cost-systems and incentives - Traditional vs.
activity based costing. Journal of accounting research, 30(3):619-641, Nov.
*MODARRESS, B., ANSARI, A. & LOCKWOOD, D.L. 2005. Kaizen costing for lean
manufacturing: a case study. lnternational journal of production research, 43(9): 1751 - 1760, May.
*MOODLEY, N. 2003. Performance management in developmental local government.
Pretoria: University of Western Cape. 82 p.
NAIR, N. 1999. Activity-based information systems: an executive's guide to
implementation. New York: Wiley. 221 p.
*NEELY, A., GREGORY, M. & PLATTS, K. 1995. Performance measurement system
design: a literature review and research agenda. lnternational journal of operations &
production management, 17(4):80-116.
NOLAN, P.M. 2004. Critical success factors for implementing an enterprise-wide ABC
solution. Journal of performance management, 1 7(3): 1 5-22.
PAPER, D. & CHANG, R. 2005. The state of business process reengineering: a
search for success factors. Total quality management, 1 6(1): 1 21 -1 33, Jan.
187
*PHENG, L.S. & TAN, S.K.L. 1998. How 'just-in-time' wastages can be quantified:
case study of a private condominium project. Construction management and
economics, 16(6):621-635, Nov.
*PHENG, L.S. & TEO, J.A. 2004. Implementing total quality management in
construction firms. Journal of management in engineering, 20(1):8-15, Jan.
POLITO, T. & WATSON, K. 2006. Just-in-time under fire: the five major constraints
upon JIT practices. The journal of American academy of business, 9(1):8-13,
March.
*RADNOR, Z. & MCGUIRE, M. 2003. Performance management in the public
sector: fact or fiction? International journal of productivity and performance
management, 53(3):245-260, Dec.
*RICHARDSON, S. 2004. The key elements of balanced scorecard success. lvey
business journal, 69(2):7-9, Dec.
*ROHM, H. 2005. Perform performance measurement in action. Perform, 2(2):1-8.
SAPP, R.W., CRAWFORD, D.M. & REBISCHKE, S.A. Activity-based information for
financial institutions. Journal of performance management, 18(2):22-34.
*SEDGLEY, D.J. & JACKIW, C.F. 2001. 'The 123s of ABC in SAP. New York:
Wiley. 393 p.
SHARMA, R. & RATNATUNGA, J. 1997. Teaching note: traditional and activity
based costing systems. Accounting Education, 6(4):337-345, May.
*SLA (Strategic Logistical Alliance). 2006. Marketing Information for SLA.
Elandsfontein. (Unpaginated.) htt~://www.sla.co.za Date of access: 24 Jan. 2006.
*STAPLETON, D., PATI, S., BEACH, E. & JULMANICHO1-I, P. 2004. Activity-
based costing for logistics and marketing. Business process management journal,
1 0(5):584-597, Dec.
*STRUWIG, F.W. & STEAD, G.B. 2001. Planning, designing and reporting
research. Cape Town: Pearson. 279 p.
*SWAIN, R., ALBRECHT, W., STICE, D. & SI-ICE, K. 2005. Management
accounting. 3rd ed. London: Thomson Learning. 607 p.
*TANGEN, S. 2003. An overview of frequently used performance measures. Work
study, 52(7):347-354.
TRUSSEL, J.M. & BITNER, L.N. 1998. Strategic cost management: an activity-
based management approach. Management decision, 36(7):441-447.
*TURNEY, B.B. 1996. Activity based costing: the performance breakthrough.
London: Kogan. 322 p.
*VERWEIRE, K. & VAN DEN BERGHE, L. 2004. Integrated performance
management: a guide to strategy implementation. Thousand Oaks: Sage. 334 p.
*WAYNE, L. & SEARCY, L. 2004. Using activity-based costing to assess
channel/customer profitability. Management accounting quarterly, 5(2):51-60,
Winter.
*WILKS, C. & BURKE, L. 2005. Management accounting - decision management.
Oxford: CIMA. 539 p.
WINCEL, J.P. 2004. Lean supply chain management: a handbook for strategic
procurement. New York: Productivity press. 239 p.