activity based management in a hospital setting: an...
TRANSCRIPT

Activity Based Management in a Hospital Setting:An Exploratory Study
HBO & Company’sAmherst Product Group1995 Northeast Regional
Trendstar User’s Conference
November 15, 1995
Anne FarmerTriNet Healthcare Consultants, Inc.
Michele SweeneyThe Medical Center ofCentral MA

Outline
This session will focus on the results of a preliminary study of theapplicability of Activity-Based Costing/Activity-Based Managementtechniques in a health care environment.
I. Introduction to The Medical Center of Central Massachusetts and its Cost Accounting initiatives.
II. Brief overview of ABC/ABM definitions and concepts.
III. Description of the pilot study of the Chronic Dialysis unit.
IV. Illustration of adapting the HBOC Trendstar System to accommodate ABC/ABM without creating an entirely new system.

Introduction to the Medical Center Of Massachusetts
Part I
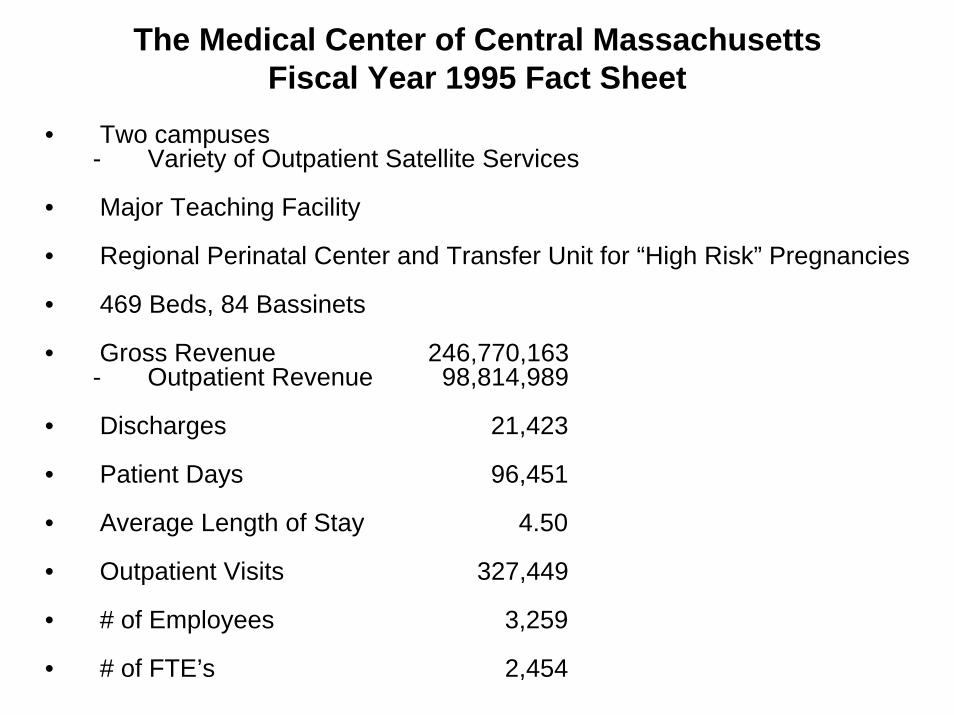
The Medical Center of Central MassachusettsFiscal Year 1995 Fact Sheet
• Two campuses- Variety of Outpatient Satellite Services
• Major Teaching Facility
• Regional Perinatal Center and Transfer Unit for “High Risk” Pregnancies
• 469 Beds, 84 Bassinets
• Gross Revenue 246,770,163- Outpatient Revenue 98,814,989
• Discharges 21,423
• Patient Days 96,451
• Average Length of Stay 4.50
• Outpatient Visits 327,449
• # of Employees 3,259
• # of FTE’s 2,454

Cost Accounting History
• Implementation of the HBOC Trendstar System (WorcesterHahnemann and Worcester Memorial)
- 1986
• Worcester Memorial Merged with Worcester Hahnemann
- 1989 (Consolidated Decision Support System)
• Conversion to Single Provider
- 1994
• Current Trendstar modules include: CCA, RUA, HSL, MCA and Paysim

Cost Standards: Development/Maintenance
Cost Standards: Development
• 80/20 Rule (Pareto Principle)
• Studied All Departments
• Focused on Direct Variable Costs
• Evolution of Standards
Cost Standards: Maintenance
• Study 1/12th of the Departments Per Month
• Addition of New Departments

Cost Stepdown Model
Steps
1. General Ledger Expenses
2. Interdepartmental Expense Transfers
3. Offset Other Operating Revenue
4. Assign Physician Expense
5. Apply Fixed/Variable Breakouts to Create Cost Components i.e. Direct Fixed Costs, Direct Variable Costs
6. Perform Allocation
7. Develop Cost Data
8. Generate Reports and Audit Results

Cost Allocation Process
• Started with Medicare 2552 Structure
• Detailed Overhead Structure
• Appropriate Statistics
• Generate Reports and Audit Results

Cost AllocationExamples of Alternative Overhead Statistics
• Clinical Engineering
• Milk Bank
• Translation Services
• IV Therapy
• Inpatient Phlebotomy

Direct and Indirect ReportFIXED VARIABLE FIXED VARIABLE INDIRECT INDRECT PHYS OTHER TOTAL % GROSS
SALARY SALARY NONSAL NONSAL CAPITAL CAPITAL ALLOC OPER EXPENSE OF REVENUEBLDG/FIX MME REVENUE TOTAL
202 HEMODIALYSIS-CHRONIC
NET DIRECT EXPENSES111 DIRECT FIXED SALARIES 327,194 0 0 0 0 0 0 0 327,194 17.43% 0113 DIRECT FIXED SUPPLIES 0 0 7,680 0 0 0 0 0 7,680 0.41% 0121 DIRECT VARIABLE SALARIES 0 218,129 0 0 0 0 0 0 218,129 11.62% 0123 DIRECT VARIABLE SUPPLIES 0 0 0 458,638 0 0 0 0 458,638 24.44% 0
TOTAL NET DIRECT EXPENSES 327,194 218,129 7,680 458,638 0 0 0 0 1,011,641 53.91% 0
FRINGE BENEFIT RELATED1003 EMP BENEFITS-SALARY 154 52 73,490 0 0 0 0 (1,293) 72,403 3.86% 01004 EMP BENEFITS-FTE 0 0 4,109 0 0 0 0 0 4,109 0.22% 01005 MEDICAL INSURANCE 0 0 69,797 0 0 0 0 0 69,797 3.72% 01009 CAFETERIA 3,121 323 1,117 12 885 89 0 (2,954) 2,593 0.14% 0
TOTAL FRINGE BENEFIT RELATED 3,275 375 148,513 12 885 89 0 (4,247) 148,902 7.93% 0
SPACE & EQUIPMENT RELATED1001 DEPRECIATION-BLDG/INTEREST 0 0 0 0 89,818 0 0 (7,082) 82,736 4.41% 01002 DEPRECIATION-MAJOR MOVABLE 0 0 0 0 251 18,231 0 0 18,482 0.98% 01010 PLATN ENG ADMIN/PLANT OP 35,426 220 26,431 162 8,154 2,050 0 (7,229) 65,214 3.47% 01011 POWER PLANT 13,700 274 62,089 220 5,277 1,243 0 (2,036) 80,767 4.30% 01012 BIOMEDICAL ENGINEERING 20,139 135 17,406 99 1,491 1,672 0 (775) 40,167 2.14% 0
TOTAL SPACE & EQUIPMENT RELATED 69,265 629 105,926 481 104,991 23,196 0 (17,122) 287,366 15.31% 0
SUPPORT SERVICES RELATED1013 HOUSEKEEPING 46,121 4,667 36,498 3,338 2,170 1,451 0 (2,002) 92,243 4.91% 01016 LINEN DISTRIBUTION 1,668 1,876 9,575 2,769 707 243 0 (312) 16,526 0.88% 01017 PATINET ACCOUNTS 4,298 8,549 6,480 983 940 366 0 (491) 21,125 1.13% 01018 PATIENT REGISTRATION 8,661 20,980 11,120 1,142 1,899 1,328 0 (1,059) 44,071 2.35% 01035 IN-SERVICE ED/NURSING QA 6,139 1,117 3,095 82 934 430 0 (301) 11,496 0.61% 01041 SOCIAL SERVICE 7,799 12,764 7,003 88 980 474 0 (592) 28,516 1.52% 01042 MEDICAL RECORDS 105 11 82 23 3 8 0 (6) 226 0.01% 01069 CSR-O/H 215 53 191 253 40 31 1 (16) 768 0.04% 01070 PHARMACY-O/H 147 32 456 388 5 15 1 (14) 1,030 0.05% 0
TOTAL SUPPORT SERVICES RELATED 75,153 50,049 74,500 9,066 7,678 4,346 2 (4,793) 216,001 11.51% 0
ADMINSTRATIVE & GENERAL RELATED1006 ADMINISTRATIVE SERVICES 60,718 4,132 57,891 3,389 5,484 17,173 0 (13,297) 135,490 7.22% 01007 EMPLOYEE SERVICES 13,829 69 7,802 56 298 603 0 (2,572) 20,085 1.07% 0
TOTAL ADMIN & GENERAL 74,547 4,201 65,693 3,445 5,782 17,776 0 (15,869) 155,575 8.29% 0
PHYSICIAN RELATED1050 HEM/ONC-O/H 243 16 4,272 13 23 68 0 (52) 4,583 0.24% 01053 CARDIOLOGY-O/H 97 7 1,705 6 9 28 0 (22) 1,830 0.10% 01054 SURGERY-O/H 5,555 137 11,253 50 111 580 0 (236) 17,450 0.93% 01055 FAMILY PRACTICE-O/H 224 15 3,935 12 20 63 0 (86) 4,183 0.22% 01056 PRIMARY CARE-O/H 320 22 5,640 18 29 92 0 (70) 6,051 0.32% 01057 INT MED-O/H 3,228 567 17,013 75 349 956 1,234 (325) 23,097 1.23% 0
TOTAL PHYSICIAN RELATED 9,667 764 43,818 174 541 1,787 1,234 (791) 57,194 3.05% 0
GROSS REVENUE 0 0 0 0 0 0 0 0 0 0.00% 1,712,456
TOTAL 202 HEMODIALYSIS-CHRONIC 559,101 274,147 446,130 471,816 119,877 47,194 1,236 (42,822) 1,876,679 100.00% 1,712,456

Key Factors for Success
• Look to Improve Our Understanding of What Drives Overhead Costs
• Communicate With Department Managers
• Educate Department Managers
• Automate Wherever Possible
• Audit, Audit, Audit
• Create Good Process Documentation
ABC/ABM Definitions and Concepts
Part II

Activity- Based Management (ABM)
ABM is a discipline that focuses on the management of activities asthe route to continuously improving the value received by patientsand the efficiency achieved by providing this value. The primarytools of ABM are:
• Cost Drive Analysis
• Activity Analysis
• Performance Analysis
Activity-based management draws on activity-based costing as amajor source of information.
Source: The definitions are adapted from Common Cents and the ABC PerformanceBreak Through by Peter B.B. Turney (Cost Technology, Inc. 1992)

Activity-Based Costing (ABC)
• ABC is a method of measuring the cost and performance of activities and cost objects.
• ABC assigns costs to activities based on their use of resources,and assigns cost to product based on their use of activities.
• An activity is a unit of work performed within an organization which consumes resources.
• A cost object is the reason for performing an activity. Cost objects include products, services, projects, contracts, and patients.
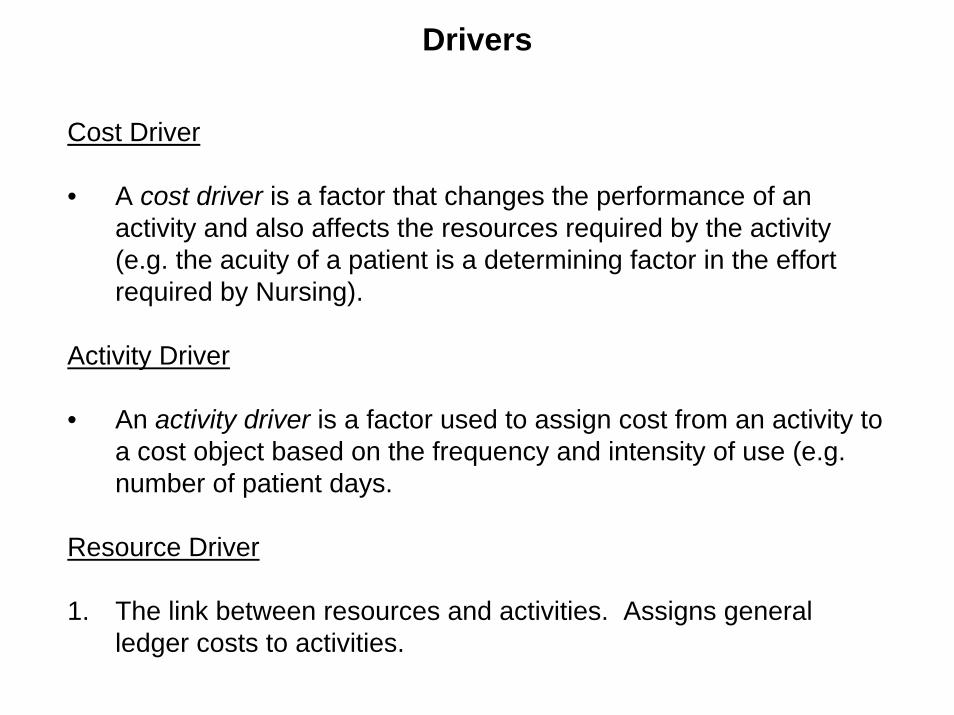
Drivers
Cost Driver
• A cost driver is a factor that changes the performance of an activity and also affects the resources required by the activity(e.g. the acuity of a patient is a determining factor in the effort required by Nursing).
Activity Driver
• An activity driver is a factor used to assign cost from an activity to a cost object based on the frequency and intensity of use (e.g. number of patient days.
Resource Driver
1. The link between resources and activities. Assigns general ledger costs to activities.

A Cost Assignment Review
List Resources
• General Ledger
• Internal/External
Assign Resources to Activities
• Develop estimates from observation and discussion. These estimates are resource drivers.
• The part of each resource assigned to each activity is a costelement of that activity.
Assign the Cost of Activities to Cost Objects
• Use activity drivers determines from a study of the activity.

Benefits of ABM ApproachFocusing on Department Managers
• Preserve process analysis from TQM efforts.
• Overhead costs are assigned on a “cause-and-effect” basis.
• Increase business awareness and action orientation of department managers.
• Encourage cross-functional teamwork (partnership network).
• Avoid massive top-down system.
• Leverage the investment in the Decision Support System.
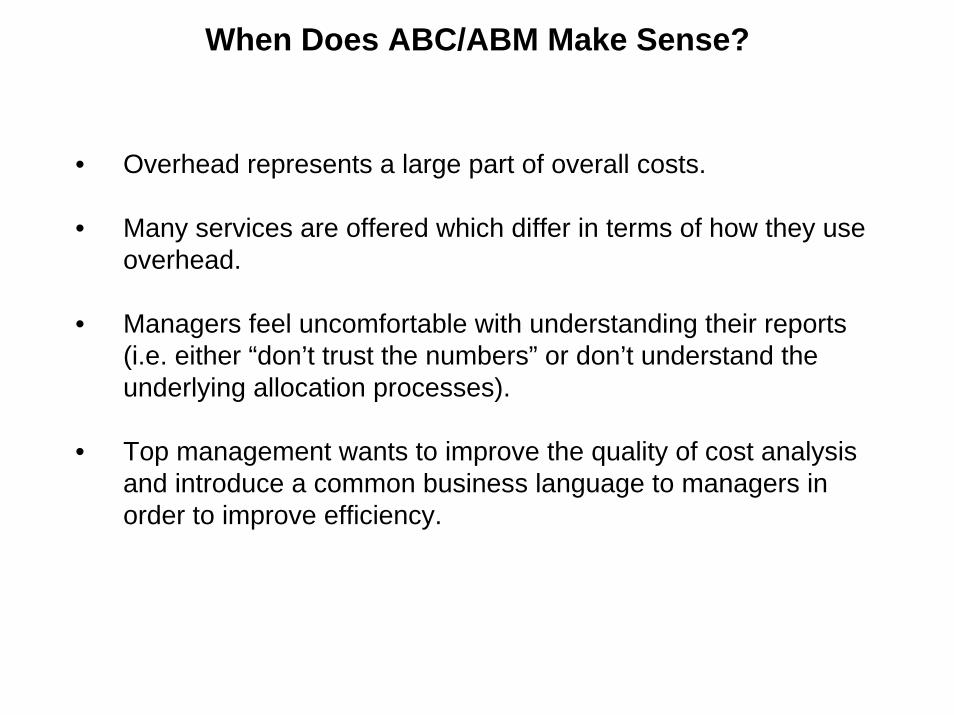
When Does ABC/ABM Make Sense?
• Overhead represents a large part of overall costs.
• Many services are offered which differ in terms of how they use overhead.
• Managers feel uncomfortable with understanding their reports (i.e. either “don’t trust the numbers” or don’t understand the underlying allocation processes).
• Top management wants to improve the quality of cost analysis and introduce a common business language to managers in order to improve efficiency.

The Pilot Study
Part III
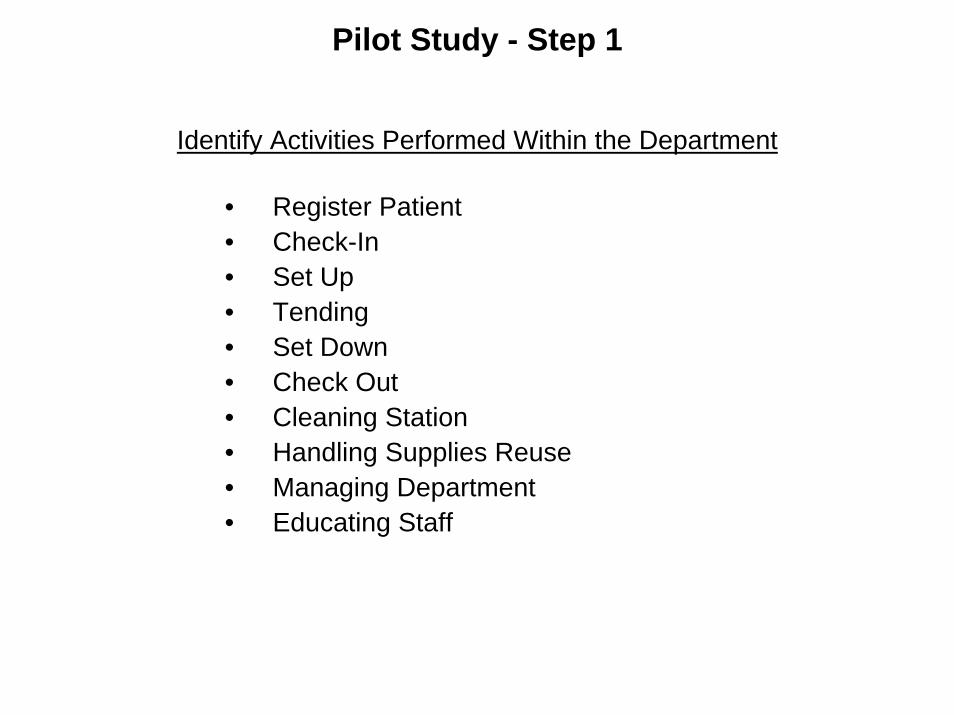
Pilot Study - Step 1
Identify Activities Performed Within the Department
• Register Patient• Check-In• Set Up• Tending• Set Down• Check Out• Cleaning Station• Handling Supplies Reuse• Managing Department• Educating Staff
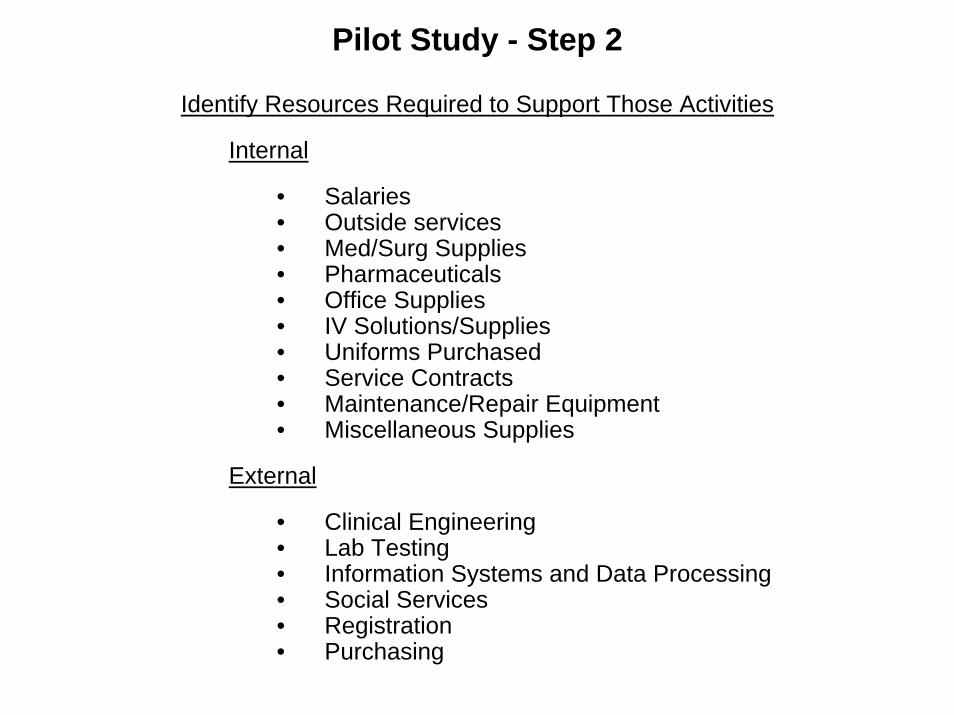
Pilot Study - Step 2
Identify Resources Required to Support Those Activities
Internal
• Salaries• Outside services• Med/Surg Supplies• Pharmaceuticals• Office Supplies• IV Solutions/Supplies• Uniforms Purchased• Service Contracts• Maintenance/Repair Equipment• Miscellaneous Supplies
External
• Clinical Engineering• Lab Testing• Information Systems and Data Processing• Social Services• Registration• Purchasing

Pilot Study - Step 3
Determine Cost Assignment Method for Each Resource by Interacting with Relevant Department Managers.
• Six overhead areas targeted (Information Systems, Social Services, Purchasing, Lab Testing, Clinical Engineering, Registration).
• Other Resources (Potential for ABC analysis)
• Sustaining Resources (No clear connection to department).

Selected Examples
OVERHEAD TOTALTOTAL ACTIVITY HOSPITAL DEPT. DRIVER
HOSPITAL DRIVERS VOLUME VOLUME FORMULA
CLINICAL ENGINEERING $91,840 #FTE'S 7 1 91,840 * (1/7) = $13,120
LAB TESTING $2.21 reimb/treatment # of treatments --- 3,461 $2.21 * 3,461 = $7,649
SOCIAL SERVICES $221,769 # FTE's 20.3 1.5 221,769 * (1.5/20.3) = $16,386
INFO SYSTEMS & DP $394,290 # of trans. 480,520 781 394,290 * (781/480,520) = $641
PURCHASING $70,555 # of purch. req's 5,412 46 70,555 * (46/5,412) = $599
REGISTRATION $50/hour # of patients --- 3,461 $50/60 * (.5 * 3,461) = $1,442
Costs Assigned to Chronic Dialysis Based on Activity Drivers

Cost Comparisons of the Six Indirect Cost Areas Studied
RegistrationABM$.42
Current$0.00
CHANGE = $.42 / Rx
Lab ServicesABM$2.21
Current$0.00
CHANGE = $2.21 / Rx
Clinical Engineering
ABM$3.68Current
$0.25
CHANGE = $3.43 / Rx
Social Service
ABM$4.89
Current$10.48
CHANGE = ($5.60) / Rx
Data Processing
ABM$.19
Current$1.49
CHANGE = ($1.30) / Rx
Purchasing
ABM$.18
Current$.22
CHANGE = ($.04) / Rx

Sustaining Resources and Other ResourcesDetailed Listing
Sustaining Resources Other Resources
DEPARTMENT $ AMOUNT DEPARTMENT $ AMOUNT
Medical Education 3,386 Depreciation Bldg. Int. 621
Medical Staff Development 563 Depreciation MME 4,519
Cardiology/Overhead 546 Employee Benefits 28,167
Hematology Overhead 477 Employee Benefits FTE 19,029
Surgery Overhead 916 Employee Services 1,920
Primary Care Overhead 1,838 Dietary 30
Internal Medicine Overhead 5,371 Housekeeping 13,119
Interns & Residents 4,500 Admin Services 48,030
Total 17,597 (Less Purch. and I.S.)
Telecommunications 2,379
Sewing 5,623
Nurse Admin. 19,240
CSR Overhead 607
Pharmacy Overhead 10,054
Research 2,902
Total 156,240
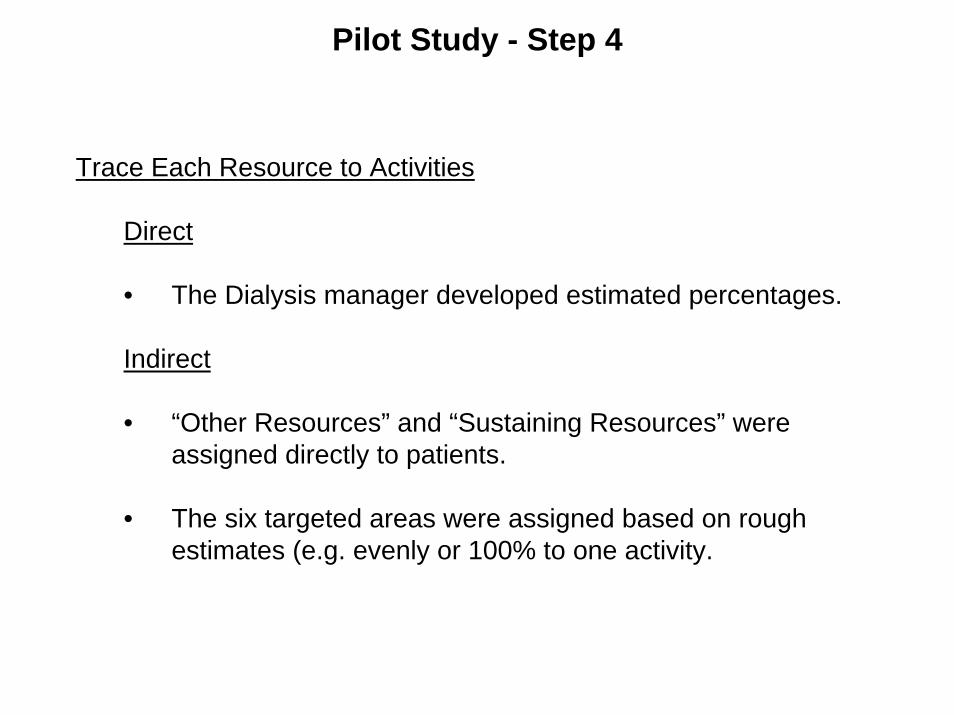
Pilot Study - Step 4
Trace Each Resource to Activities
Direct
• The Dialysis manager developed estimated percentages.
Indirect
• “Other Resources” and “Sustaining Resources” were assigned directly to patients.
• The six targeted areas were assigned based on rough estimates (e.g. evenly or 100% to one activity.

Departmental ABM Model: Chronic Dialysis Department
COSTRESOURCES ACTIVITIES OBJECT
Direct DialyzePatient
Office Supplies Outside Services Salaries Check-In2263 7497 260627 53587 Set up
52195IV Sol/Supplies Med/Surg Supplies Pharmaceuticals Tending
3935 107396 2151 61726 Set down51982
Uniforms Purchased Misc Supplies Maint/Repairs Equip Check-out1821 318 312 51982 Cleaning
StationService Contracts 48720
3533TOTAL COST/
# OFTREATMENT
Registering PatientClinical Social Services Purchasing Patient Handling 603526
Engineering 16386 599 4092 Supplies13120 2574 COST
Managing PATIENTLab Testing Registration Info Systems Dept. Maintaining =$174.38
7649 1442 and D.P. 24894 Equipment641 13120
Reuse15038 Educating
Staff9943
Other SustainingActivities Activities156240 17596
Indirect

Chronic Dialysis Department-Proposed Service Line ModelBased on ABC Analysis
Total $ Per Rx %
REVENUE 435,350$ 125.78$ 100%
DIRECT COSTS BY ACTIVITYPatient Check In 53,587$ 15.48$ 12%Patient Set Up 52,195 15.08 12%Patient Tending 61,726 17.83 14%Patient Set Down 51,982 15.02 12%Patient Check Out 51,982 15.02 12%Registering Patient 4,092 1.18 1%Cleaning Station 48,720 14.08 11%Handling Supplies 2,574 0.74 1%Reuse 15,038 4.34 3%Managing Department 24,894 7.19 6%Educating Staff 9,943 2.87 2%Direct Costs per GL which could 13,120 3.79 3% not be locatedTotal Direct Costs by Activity 389,853$ 112.40$ 90%
DIRECT MARGIN 45,497.00$ 13.14$ 10%
COSTS OF PARTNERSHIP NETWORKRegistering 1,442.00$ 0.42$ 0%Lab Testing 7,649 2.21 2%Maintaining Equipment 13,120 3.79 3%Providing Social Services 16,386 4.73 4%Computing 641 0.19 0%Purchasing 599 0.17 0%Costs of Depts not yet analyzed but which may be 156,240 45.14 36% subject to Activity Driver AnalysisTotal Partnership Network Costs 196,077.00$ 56.65$ 45%
CONTRIBUTION TO SUSTAINING ACTIVITIES (150,580.00)$ (43.51)$ -35%
COSTS OF SUSTAINING ACTIVITIES 17,597.00$ 5.08$ 4%
NET PROFIT/(LOSS) (168,177.00)$ (48.59)$ -39%

Pilot Study - Step 5
Assign Costs Generated by all Activities Among the Different “CostObjects” (e.g. Dialysis Treatment)
Dialysis Department
• Only one “cost object”.
Other Departments
• Standards would be developed at an activity level.

HBOC Trendstar
Part IV

Adapting Trendstar for ABC/ABM
Variations from Traditional Costing Models
• Creating alternative stepdown structures and statistics.
• Identifying “cost drivers” for indirect costs.
• Looking at costs by activities as well as resources.

Goals in Integrating ABC/ABM Into Trendstar
• Integrate with other DSS/Cost Accounting applications.
- Patient/Product Costing- Flexible Budgeting- Contracting
• Enable phasing- by department.
• Ensure consistency.
• Consider time required to maintain.
• Limit complexity and detail.

Integration Into Trendstar: Issues
Stepdown Model
• Statistic chosen for an overhead department by an “ABC” department should also be used for all other departments supported by that area.
Cost Drivers and Indirect Costs
• Identification at the charge code level (i.e. intermediate product) may not always be feasible.
• Must reduce costs to be allocated.
Costs By Activity
• Must adapt DSS data structures for this layer of detail.

Trendstar Implementation Steps
1. Break out G/L costs by activity using %’s or $ amounts.
2. Set up alternative stepdown structure.
3. Input alternative statistics, and perform cost allocation.
4. Assign indirect costs to activities.
5. Build cost profiles by activity as well as cost item.
6. Identify which indirect costs should be linked to “cost drivers”at the procedure level, and set up within profile.

Example: Assign Direct Costs to Activities(HSL Allocation Table)
COST COMPONENT DEFINITIONS:
Direct IndirectComponent Direct Component Component Component Indirect Component
Number Title Type Number Title
1 PATIENT CHECK-IN VARIABLE 1 PATIENT CHECK-IN2 PATIENT SETUP VARIABLE 2 PATIENT SETUP3 PATIENT TENDING VARIABLE 3 PATIENT TENDING4 PATIENT SETDOWN VARIABLE 4 PATIENT SETDOWN5 PATIENT CHECKOUT VARIABLE 5 PATIENT CHECKOUT6 CLEANING STATION VARIABLE 6 CLEANING STATION
10 HANDLING SUPPLIES FIXED 10 HANDLING SUPPLIES11 REUSE FIXED 11 REUSE12 MANAGING DEPARTMENT FIXED 12 MANAGING DEPARTMENT13 EDUCATING STAFF FIXED 13 EDUCATING STAFF14 MAINTAINING EQUIPMENT FIXED 14 MAINTAINING EQUIPMENT15 OTHER DIRECT FIXED COSTS FIXED 15 OTHER DIRECT FIXED COSTS

Example: Assign Direct Costs to Activities(HSL Allocation Table)
EXTRACTION RULES:
Cost Data Adj. Fixed Variable FixedTitle/Type Center Type Account Cls Q Amount Amount Component Component
DIALYSIS: PATIENT CHECK-IN (CLERK)202 E 1131 ALL 50% 0% 1 1
DIALYSIS: PAT CHECKOUT (CLERK)202 E 1131 ALL 505 0% 5 5
DIALYSIS: PATIENT SETUP (RN/LPN)202 E 2613 ALL 20% 0% 2 2
2705DIALYSIS: PAT TENDING (RN/LPN)
202 E 2613 ALL 60% 0% 3 32705
DIALYSIS: PAT SETDOWN (RN/LPN)202 E 2613 ALL 20% 0% 4 4
2705DIALYSIS: MANAGING DEPARTMENT (NURSE MGR)
202 E 2707 ALL 85% 0% 12 12
DIALYSIS: MAINTAIN EQUIP (REPAIRS/SVC CONTRACTS)202 E 7196 ALL 100% 0% 14 14
DIALYSIS: HANDLING SUPPLIES (PURCHASING DEPT)202 E 1081 ALL 100% 0% 10 10
DIALYSIS: MAINTAIN EQUIPMENT (BIOMED ENGIENERING)202 E 1012 ALL 100% 0% 14 14
DIALYSIS: PATIENT TENDING (SOCIAL SERVICES)202 E 1041 ALL 100% 0% 3 3
DIALYSIS: CLEANING (HOUSEKEEPING DEPT)202 E 1013 ALL 100% 0% 6 6
DIALYSIS: OTHER INDIRECT (NO ASSIGNED TO AN ACTIVITY)202 E 001-1011 ALL 100% 0% 25 25
1014-10401042-1079
10801082-1999

Procedure Cost ProfileChronic Dialysis Treatment
Account Subaccount Unit TotalName Code Name Code Resource Name Code Quantity Cost Cost
Check-In 1Unit Clerk 1131 Check-in 101 10 min. 0.188 1.88Reg. Clerk 1132 Registration Costs 102 .50 min. 0.833 0.42
M/S Supplies 7076 Med Ctr Kit 13 1 kit 3.850 3.856.15
Set Up 2LPN/RN 2613 Set up 201 10 min 0.332 3.32
M/S Supplies 7076 I.V. Adm Set 293085 1 set 0.400 0.40Protective Gown 761 1 each 3.007 3.01
6.73
Tending 3LPN/RN 2613 Tending 301 100 min. 0.332 33.20Lab Costs 7011 Lab Testing 302 1 test 2.210 2.21M/S Supplies 7076 .9% NaCl 1000 ml 695010 2 each 0.600 1.20
4x4 gauze pad-sterile 8010 1 pkg 0.452 0.45Acid Concentrate 35010 1.5 gallon 2.500 3.75Aldetect 235020 2 each 0.150 0.30Artificial Kidney 70097 .40 each 15.500 6.20
50.31
Set-down 4LPN/RN 2613 Set down 401 15 min. 0.332 4.98
Check-out 5Unit Clerk 1131 CheckOut 501 5 min. 0.188 0.94
Cleaning 6Aide 2828 Cleaning Station 601 10 min. 0.167 1.67M/S Supplies 7076 Cleaning Supplies 602 $/treatment 5.490 5.49
7.16
PROCEDURE TOTAL 76.26
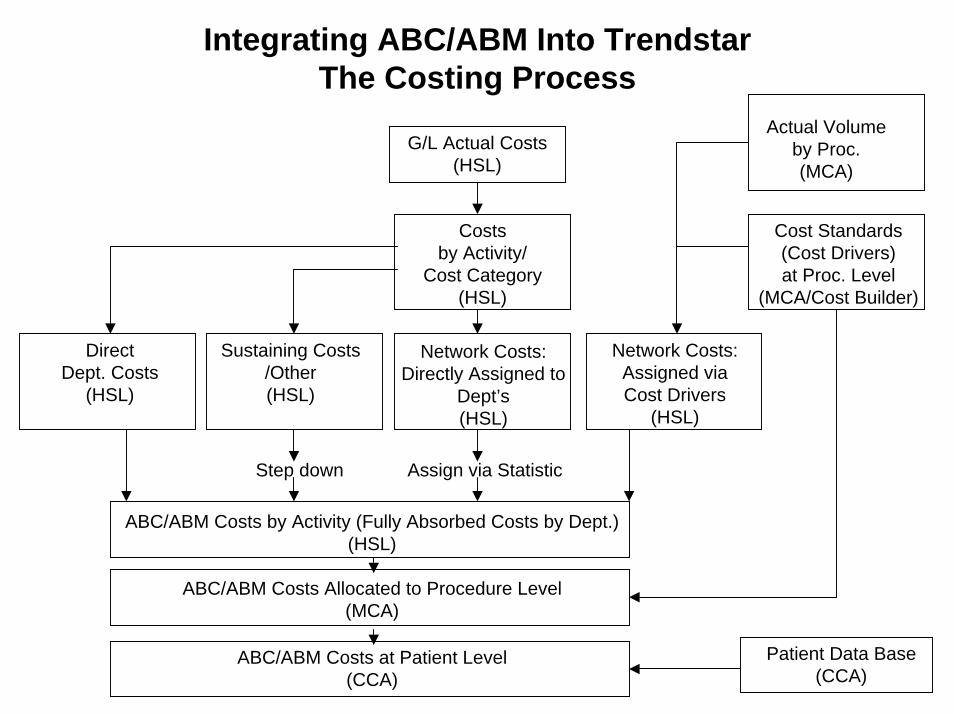
Integrating ABC/ABM Into TrendstarThe Costing Process
G/L Actual Costs(HSL)
Costsby Activity/
Cost Category(HSL)
Network Costs:Directly Assigned to
Dept’s(HSL)
Actual Volumeby Proc.(MCA)
Cost Standards(Cost Drivers)at Proc. Level
(MCA/Cost Builder)
Network Costs:Assigned viaCost Drivers
(HSL)
Sustaining Costs/Other(HSL)
DirectDept. Costs
(HSL)
Step down Assign via Statistic
ABC/ABM Costs by Activity (Fully Absorbed Costs by Dept.)(HSL)
ABC/ABM Costs Allocated to Procedure Level(MCA)
ABC/ABM Costs at Patient Level(CCA)
Patient Data Base(CCA)

Moving Toward ABC/ABM
• Improve detail on stepdown model.
• Explore use of alternative statistics.
• Talk to managers of overhead departments.
• Improve record-keeping and logging (for better statistics).
• Break out costs by activity when studying or restudying a department’s procedures.
• Get managers of revenue centers to think about indirect costs (partnership network).

Conclusions
• It’s possible!
• Need to get people “around the table” (communication is the key).
• Information from the study must be used to manage costs (ABM, not just ABC).
• Phase it in gradually vs. hospital-wide.