activity 24: graphs of functions (section 3.2, pp. 224-232)
TRANSCRIPT
ACTIVITY 24:
Graphs of Functions (Section 3.2, pp. 224-232)
Graphing Functions:
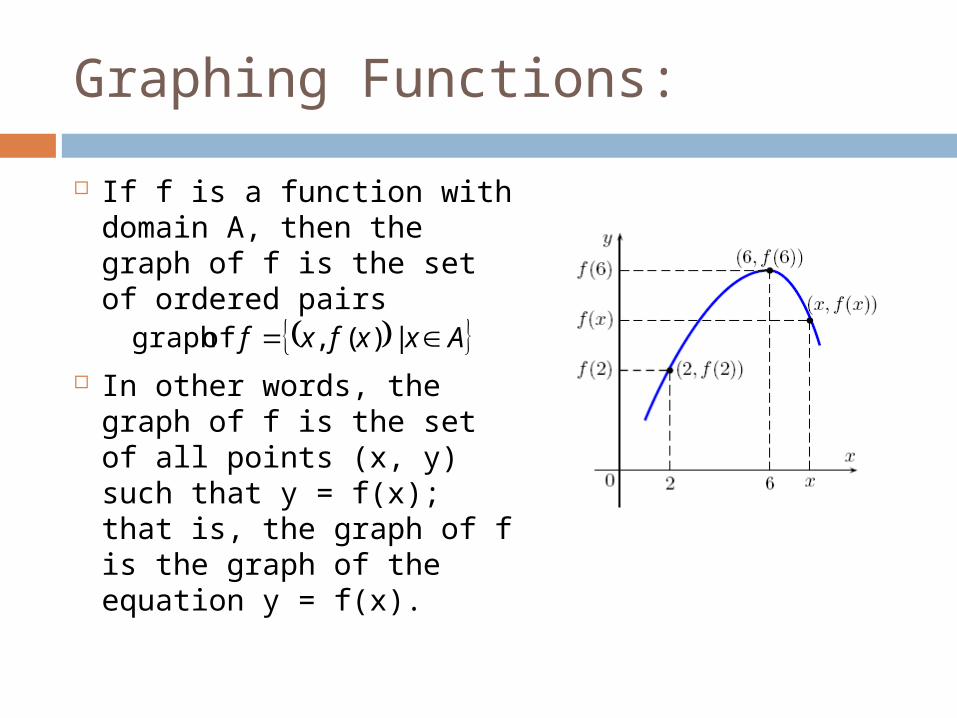
If f is a function with domain A, then the graph of f is the set of ordered pairs
In other words, the graph of f is the set of all points (x, y) such that y = f(x); that is, the graph of f is the graph of the equation y = f(x).
Axxfxf |)(, of graph
Example 1:
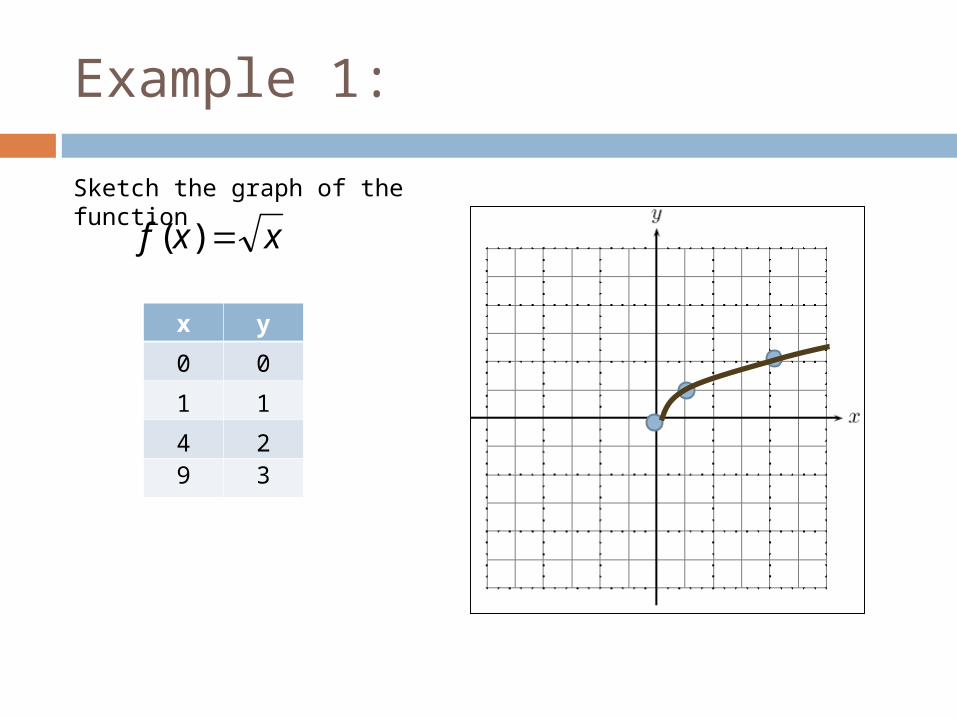
x y
0 0
1 1
4 29 3
Sketch the graph of the function
xxf )(

Obtaining Information from the Graph of a Function:
The values of a function are represented by the height of its graph above the x-axis. So, we can read off the values of a function from its graph.In addition, the graph of a function helps us picture the domain and range of the function on the x-axis and y-axis as shown in the picture:

Example 2 (Hurdle Race):
Three runners compete in a 100-meter hurdle race. The graph depicts the distance run as a function of time for each runner.Describe in words what the graph tells you about this race.
1.Who won the race? 2.Did each runner finish the race? 3.What do you think happened to runner B?
Runner B started out first then stopped during which time runners A and C passed B.
Runner AYes
Maybe stopped to tie the shoe laces!

Example 3:
The picture shows the graph of2252)( xxg
•From the graph, find the domain and range of g.
•Find •g(4) =•g(−2) =
•If g(x) = −2, what is x?
-5 < x < 5 or [-5,5]
-1-2.5
x = 3 and -3

Graphing Piecewise Defined Functions:
A piecewise defined function is defined by different formulas on different parts of its domain. As you might expect, the graph of such a function consists of separate pieces.

Example 4:
Sketch the graph of the piecewise function
2 if 5
2 if )(
2
xx
xxxf
Example 5:
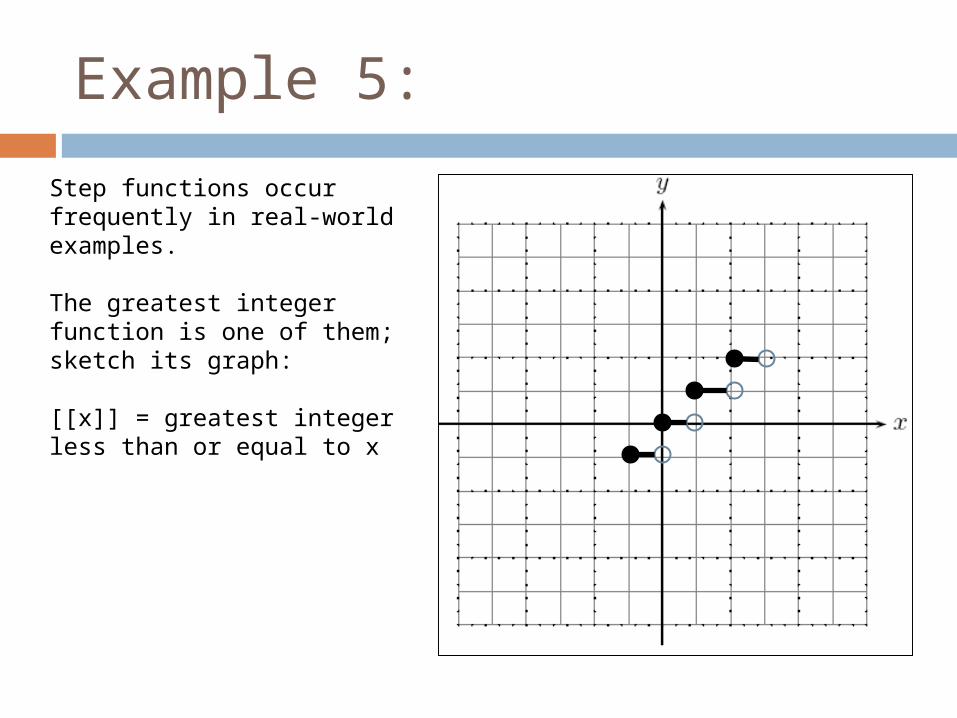
Step functions occur frequently in real-world examples.
The greatest integer function is one of them; sketch its graph:
[[x]] = greatest integer less than or equal to x
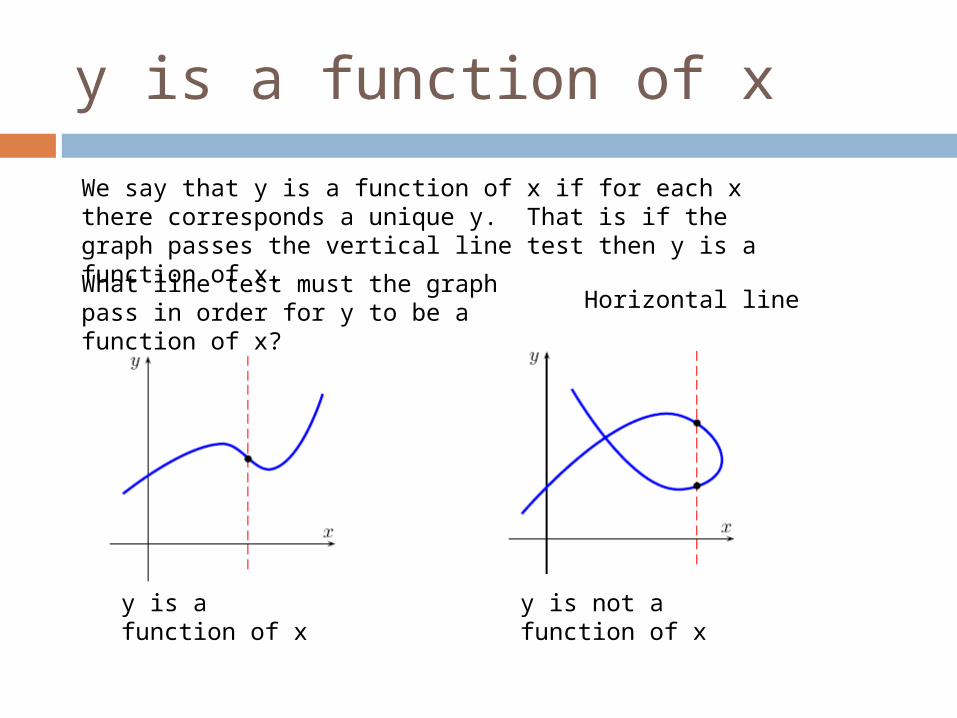
y is a function of x
y is a function of x
We say that y is a function of x if for each x there corresponds a unique y. That is if the graph passes the vertical line test then y is a function of x.
What line test must the graph pass in order for y to be a function of x? Horizontal line test
y is not a function of x

Example 6
Determine which of the curves drawn below is the graph of a function of x.
y is a function of xx is not a function of y
y is not a function of xx is a function of y

y is a function of xx is not a function of y
y is not a function of xx is a function of y

Example 7:
Which of the equations that follow define y as a function of x?
422 yx This is a parabola so yes y is a function of x
2yx If we put in x = 4 then we have 24 y
So y = 2 and y = -2.
Consequently, y is not a function of x
922 yx This is a circle so no y is not a function of x