active mobility and health - pasta project :: home · active mobility and health: insights from the...
TRANSCRIPT
Active mobility and health:
Insights from the PASTA project
Evi Dons, VITO, Belgium
Thomas Götschi, UZH, Switzerland
on behalf of the PASTA consortium
This project has received funding from the European Union‟s Seventh
Framework Programme for research; technological development and
demonstration under grant agreement no 602624-2.

www.pastaproject.eu
A Broadband Project on Active Travel and Health
HEALTH.2013.3.3-1: Social innovation for health promotion. FP7-HEALTH-2013-INNOVATION-1. EU research should aim to identify, develop and better understand innovative
approaches to reduce sedentary behaviour and enhance the level of physical activity in the population. Research
should include the evaluation of innovative on-going initiatives that reduce sedentary behaviour, enhance the level of
physical activity combined with dietary or other interventions. In this context, research should include the identification
of "good practices", as well as the analysis of their economic and social benefits and impact. Correlates will have to
be detected (such as cultural, environmental, economic, psychological and others) that inhibit or promote the
individuals capacity to increase physical activity, reduce sedentary behaviour and self-regulate their dietary or other
relevant behaviour. Research may cover various areas affecting lifestyle (e.g.
sports, health, education, transport, urban planning, working environment, leisure) as well as different intervention
levels (local, national, European). As a social innovation it should address the role of diverse public and private
entities, such as business, including social enterprises, civil society organisations and public authorities, as well as
their interaction. The views of potential end-users should be integrated in the design of the project as well as the
methodology for assessing impact and outcomes throughout the project. The project should have a strong
communication strategy.

www.pastaproject.eu
FP7 Call Title: Social Innovation for Health Promotion
What could possibly be innovative about walking and biking?• Judging from footprints discovered on a former shore in Kenya, it is thought possible that
ancestors of modern humans were walking in ways very similar to the present activity as
many as 1.5 million years ago.
• Bicycles were introduced in the 19th century in Europe.

Background
What‟s our starting point?
| 4Götschi-ICTH-2015

www.pastaproject.eu
Health Associated with Active Travel in the Course of Life

www.pastaproject.eu
Individual vs. Public Health Perspective
Individual perspective
How healthy or unhealthy (risky) is AT?
Public health perspective
What is it worth to society?

www.pastaproject.eu
The Role of Public Health in the Promotion of Active Travel
Adapted from „Moving Active Transportation to Higher Grounds“ Conference, Washington DC, April 2015
Policies, measures(infrastructure investments,
campaigns)
Active travel(surveys, diary, app)
Health impacts (benefits and risks)
Modifiable Factors(e.g., land use, road
design, socioeconomics, attit
udes)
Fixed Factors(e.g., topography, weather,
demographics) 3
1
2
1
1
1. Determinants
2. Behaviour
3. Impacts
www.pastaproject.eu
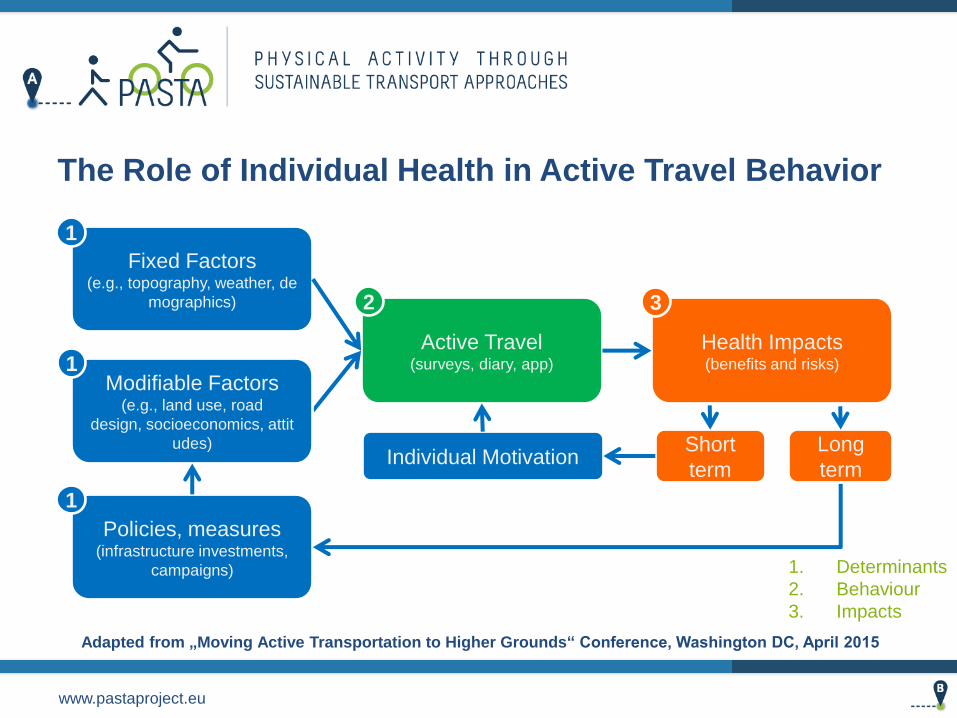
The Role of Individual Health in Active Travel Behavior
Adapted from „Moving Active Transportation to Higher Grounds“ Conference, Washington DC, April 2015
Policies, measures(infrastructure investments,
campaigns)
Active Travel(surveys, diary, app)
Health Impacts (benefits and risks)
Modifiable Factors(e.g., land use, road
design, socioeconomics, attit
udes)
Fixed Factors(e.g., topography, weather, de
mographics) 3
1
2
1
1
1. Determinants
2. Behaviour
3. Impacts
Long
term
Short
termIndividual Motivation

www.pastaproject.eu

www.pastaproject.eu
Literature Review (quasi systematic)
• Found 26 «new and conceptual» frameworks.
• Identified common and unique features.
• Integrated in a single diagram.

Götschi, T., de Nazelle, A., Brand, C., Gerike, R., & PASTA Consortium. (2017). Towards a Comprehensive Conceptual Framework of
Active Travel Behavior: a Review and Synthesis of Published Frameworks. Current Environmental Health Reports, 1-10.

Götschi-Velocity 2017
Götschi, T., de Nazelle, A.,
Brand, C., Gerike, R., & PASTA
Consortium. (2017). Towards a
Comprehensive Conceptual
Framework of Active Travel
Behavior: a Review and
Synthesis of Published
Frameworks. Current
Environmental Health Reports,
1-10.

www.pastaproject.eu
Known Determinants of Active Mobility
• Rationale factors (mode choice)
• Distance, duration, purpose
• Psychological factors
• Attitudes, TPB, etc.
• Geographical factors
• Topography, neighborhood, routes
• Time factors
• Weather, time of day, day of week
• Safety
• Perceived and objective

www.pastaproject.eu
Description and Classification of Active Mobility Measures
Literature review and assessment of state-of-the-
art of AM WP1 (PASTA - Deliverable – D1.1)
Authors:The primary authors are:Clark, Anna; Eriksson, Ulf; Witzell, Jacob (Trivector Traffic)
With text input from:Brand,Christian (University of Oxford) Götschi, Thomas; Kahlmeier, Sonja(University of Zurich) Dons, Evi; Int Panis, Luc (VITO) Gerike, Regine (TU Dresden) Anaya, Esther; De Nazelle, Audrey(Imperial College London) Rojas Rueda, David; Thomas ColeHunter(CREAL)
Uhlmann, Tina; Wegener, Sandra(BOKU) All of the PASTA consortium havebeen involved in this work
Project internal reviewer: Boschetti, Florinda (Polis)
Policies to increase walking and cycling, Design of urban environment,
Residential densities, Mixed land use, Bikeability, Walkability, Infrastructure,
street connectivity, facility provision, Slope, Weather, Travel time / distance,
Effort, Perceived safety, Safety, (Motorised) traffic speeds, Higher volume
vehicles, Traffic calming , Cycle tracks, Large vehicles, Compulsory bicycle
helmets, Safety in numbers, Social norm, Normalisation of active mobility, Social
support, Socio-economic factors generally, Age, seniors , Age, children, No
access to car, Car ownership, Physical ability, Ethnic groups, Lower income,
Higher income, Higher socioeconomic position and not owning a motor vehicle,
Low socio-economic status areas , Educational level , Area- and individual-level
income , Dog ownership, Costs of other modes

www.pastaproject.eu
Review of Reviews: Measures to Promote Active Mobility
Buehler, R, Götschi, T, Winters, M. Moving Toward Active Transportation: How Policies Can Encourage Walking and Bicycling. San Diego, CA: Active
Living Research; 2016. Available at www.activelivingresearch.org
Winters, Meghan, Ralph Buehler, and Thomas Götschi. "Policies to promote active travel: evidence from reviews of the literature." Current environmental
health reports (2017): 1-8.
http://activelivingresearch.org/ActiveTravelreview


www.pastaproject.eu
54%
16%
29%
1%
35%
18%
46%
1%
29% 28%
6%37%
54%
9%
12%
25%
31%3%
42%
24%
26%
34%
36%
4%
41%
16%
23%
20%
London /
NewhamAntwerp
Oerebro
Vienna
RomeBarcelona
Zurich
Walking
Cycling
Public Transport
Private motorised
Seven Case-study Cities

www.pastaproject.eu
What are the determinants of active travel? What are effective measures to promote active travel?
What is the interrelation between active travel and physical activity?What are the health impacts of active travel?
IndividualContext
Individual
characteristics
Socio-
demographics
Home and work
loccationSocio-psychological factors
Extended theory of planned
behaviour
Social Environment
Physical environment
Built enviroment
Natural enviroment
Transport options
Socio-geographical factors
Neighborhood perceptions
Perception of travel choices
Trips
Planning practice
Travel choices Travel behaviour
Physical activity
PASTA Research Objectives
Impacts
Health benefits
from PA
Health risks from AP
Injury risks from travel
Environmental
impacts
Net health impactsSafety incidents

Study design, methods and tools
www.pastaproject.eu
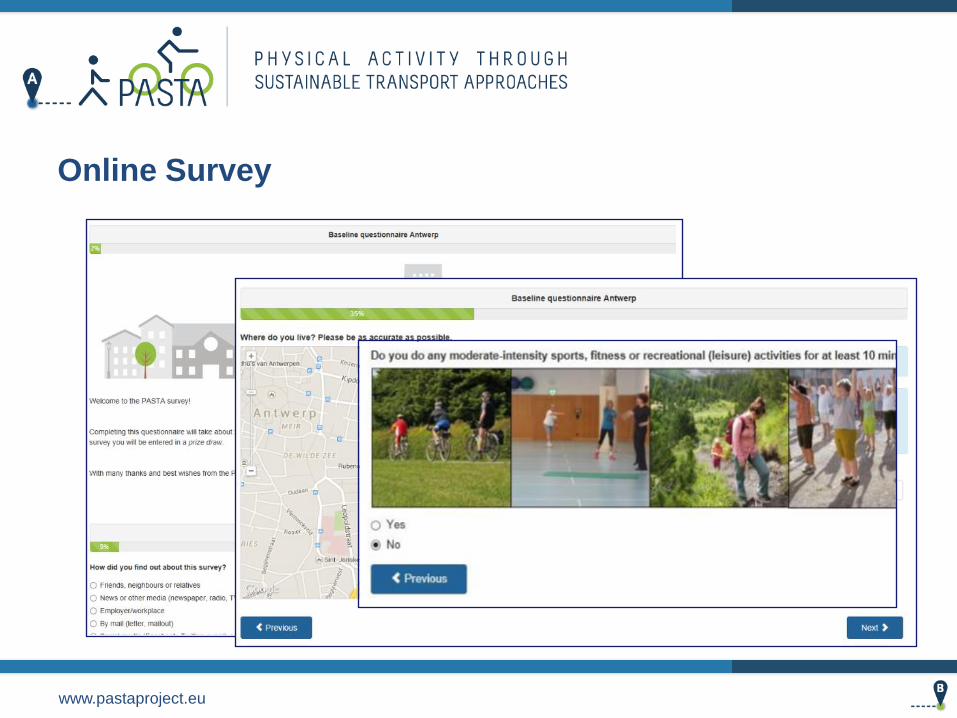
Online Survey

www.pastaproject.eu
Longitudinal Online Survey
• Before/after, trend evaluation
• Active travel and physical activity vary in time
• Lots of questions to ask
Baseline
Q
Socio-d.
Commute route
Health status
GPAQ
Mobility scale
Travel D
Psychology
Top measure FU shortMobility –scale
PA single item
Crash-q
FU short
FU long
GPAQ
Travel-D
Crash-qFU short
Crash Q(only in case of crash
or near-miss)
FU short
Participant
burden

www.pastaproject.eu
Rolling recruitment, hibernation for participants affected
by „top measures“

www.pastaproject.eu
Health and Air Pollution Add-on
• Real-life study design
• 40 healthy adults / city (Antwerp, London, Barcelona)
• 1 week, 3 seasons
Personal exposure to black carbon, GPS, Sensewear, ExpoApp, Zephyr bioharness
Health parameters: HRV, blood pressure, fundus photography, eNO, spirometry
Zephyr Bioharness Blood pressure Retinal picturesConcentrations eNO
Lung inflammation
Spirometry
Lung function

www.pastaproject.eu
Tracking Add-on: “PASTA on the Move”
• 546 participants were followed for up to 6 months
• using the commercial smartphone application “Moves” (https://www.moves-app.com/)
• track journeys and automatically detect travel modes
• 29 April 2016 – 9 January 2017
0
100
200
300
400
500
600

www.pastaproject.eu
Tracking add-on: “PASTA on the Move”
City n %
Antwerp 71 13.00
Barcelona 107 19.60
London 66 12.09
Oerebro 31 5.68
Rome 131 23.99
Vienna 54 9.89
Zurich 86 15.75
TOTAL 546 100.00
13%
19%
12%
6%
24%
10%
16%
Participants per city
Antwerpen
Barcelona
London
Örebro
Roma
Wien
Zürich

Sample Description
Who are the PASTA participants?

www.pastaproject.eu
Recruitment Progress over Time
1000
483
407351
949 961
488
396 391
210
551
425
736
247
111
203
371
457
722
381345 366
6131 31 8 9
12,825 registrations

www.pastaproject.eu
How did participants find out about the survey?
22%
12%
13%22%
8%
18%
Work
Word of mouth
Other organisations
Outreach activities
News
Social media
Public notice
Random sampling

www.pastaproject.eu
Sample description
54% 46%
12%
15%
14%
17%
16%
14%
12%
Participants by city
Antwerp
Barcelona
London
Oerebro
Rome
Vienna
Zurich

www.pastaproject.eu
Distribution across Cities
1575
1939
1792
21412090
1804
14841445
1727
1446 1401
1844
14721356
1244
1372
1030 1042
1562
1182 1135
Antwerp Barcelona London Örebro Rome Vienna Zurich
Number of registrations
Number of people who started baseline questionnaire
Number of people who finalized baseline questionnaire
Registrations n = 12,825
People started baseline n = 10,691
People finalized baseline n = 8,567

www.pastaproject.eu
10’000+ Participants, 87’000 Questionnaires

www.pastaproject.eu
How Representative is the PASTA Sample? (age)
20-29 30-39 40-49 50-59 60+
Antwerp
City Census 18.7 20.2 16.9 15.4 28.7
PASTA 13.2 29.6 24.4 21.7 11
∆ -5.5 9.4 7.5 6.3 -17.7Barcelona City Census 13.4 20 18.4 15.7 32.5
Barcelona PASTA 30 32.1 19.4 12.6 5.9
Barcelona Delta 16.6 12.1 1 -3.1 -26.6
London City Census 21.5 24.5 18.6 14.8 20.6
London PASTA 22.9 30.6 20.6 16.2 9.7
London Delta 1.4 6.1 2 1.4 -10.9
Oerebro City Census 21.2 17 16.6 14.9 30.4
Oerebro PASTA 18.6 20.4 19.5 19.9 21.6
Oerebro Delta -2.6 3.4 2.9 5 -8.8
Rome City Census 11.7 17 20.8 16.4 34.1
Rome PASTA 19.8 29.8 25.5 20.3 4.5
Rome Delta 8.1 12.8 4.7 3.9 -29.6
Vienna City Census 19.6 19 18.1 16.6 26.7
Vienna PASTA 27.3 27.7 19.8 16.9 8.4
Vienna Delta 7.7 8.7 1.7 0.3 -18.3
Zurich City Census 20.1 25.1 17.9 13.8 23.1
Zurich PASTA 21.7 28.6 21.7 19.7 8.2
Zurich Delta 1.6 3.5 3.8 5.9 -14.9

Travel Data
Understanding travel patterns and their determinants

www.pastaproject.eu
PASTA
officialPAST
A official
PASTA
officialPAST
A official
PASTA
officialPAST
A official
PASTA
official
Antwerp Barcelona London Oerebro Rome Vienna Zurich
Walking 11% 20% 38% 46% 29% 24% 13% 12% 16% 16% 24% 28% 22% 27%
Cycling 54% 23% 17% 1% 24% 3% 36% 25% 22% 1% 27% 6% 24% 4%
Car 28% 41% 17% 35% 12% 31% 46% 54% 32% 54% 14% 27% 13% 30%
PT 7% 16% 28% 18% 34% 42% 5% 9% 29% 29% 34% 39% 40% 39%
0%
10%
20%
30%
40%
50%
60%
70%
80%
90%
100%
Oversampling of Cyclists

www.pastaproject.eu
Contrasts in active transport behaviour across four countries: How do they translate into
public health benefits? Götschi et al. 2015
Cyclist:
♂ 54.5% | ♀ 45.5%
Non-cyclist:
♂ 45.4% | ♀ 54.6%
N = 5,650
Gender Split in Cycling
cyclist
non-
cyclist
cyclist
non-
cyclist
cyclist
non-
cyclist
cyclist
non-
cyclist
cyclist
non-
cyclist
cyclist
non-
cyclist
cyclist
non-
cyclist
Antwerp Barcelona London Oerebro Rome Vienna Zurich
♀ 50, 49, 49, 59, 46, 63, 58, 59, 22, 39, 39, 56, 47, 58,
♂ 49, 50, 50, 40, 54, 36, 41, 40, 77, 60, 60, 43, 52, 41,
0
100
200
300
400
500
600
700
800
num
ber
of part
icip
ants

www.pastaproject.eu
Cycling as a Mode of Transport
• 77% think that “it saves time”
• 57% “find it comfortable”
• 23% consider it “safe with regards to the risk of traffic”

www.pastaproject.eu
Health Attitude: Does it matter?
• “Cycling for travel offers personal health benefits”: 92% agree
• “Very much agree” bike 4 minutes more than “very much disagree”
• “Health is a criterion when choosing mode of transport”
• “Very much agree” bike 20 minutes (+ 30%) more than “very much
disagree” (72 min vs. 55 min/day)
| 42Götschi-ICTH-2015

www.pastaproject.eu
Electric-assist Bikes (E-bikes/Pedelecs)
• E-bikers tend to be heavier than
conventional cyclists
• E-bikers travel longer distances
• E-bikers achieve similar levels of
physical activity as conventional
cyclists
E-biking is a valuable source of
physical activity, in particular for
older people who benefit even more
from physical activity.
12.2
5.1
20.4
9.3
Distance per day (km) Distance per trip (km)
Distance covered by e-bikes vs. non-electric bikes
Non-electric bike E-bike
Infrastructure Evaluation
What is the effectiveness of specific infrastructures?

www.pastaproject.eu
London Case Study: Spatial analysis of cycling
infrastructures
Dose – response
analysis = multiple
exposures (quantity) and
quality of interventions.
Exposure = affected
population within buffers

www.pastaproject.eu
Behaviour Change Model (Stages of Change Diagnosis)
Trans-theoretical Model of the five stages of change. Based on Prochaska and
Diclemente (1986)
Precontemplation
Contemplation
Preparation
Action
Maintenance
•Donot cycle regularly•Donot intend to
•Donot cycle reg.•Intend to•Have noaccess
•Donot cycle reg.•Intend to•Have access
•Cycle regularly•Hasincreased lately•Have access
•Cycle regularly•Hasnot increased lately•Doit automatically
0
500
1000
1500
2000
2500
3000
3500
BaselineQuestionnaireStagediagnosisgeneralsample

www.pastaproject.eu
Cycling Networks are Associated with Cycling Mode Shares
Mode share 25%
Mueller N. Et al. forthcoming

www.pastaproject.eu
Antwerp Cycling Highway
Cost-benefit ratios indicate that the benefits of the cycling
highway Antwerp-Mechelen (Belgium) are 2 to 14 times higher
than the initial investment.
Impact factor euro
Physical activity (reduced mortality) 1.2 × 10⁷
Physical activity (reduced morbidity) 2.3 × 10⁶
Reduced air pollution society (mortality) 7.4 × 10⁴
Air pollution active mobility -8.9 × 10⁵
Crash risk -1.4 × 10⁶
Total +1.2 × 10⁷
Infrastructure construction costs -6.0 × 10⁶
Benefit:cost ratio 2.0

Active Mobility and Physical Activity
Is active mobility a net gain, or does it substitute for other forms of physical activity (e.g. going to the gym)?

www.pastaproject.eu
AM – PA relationship
Does an increase in walking and cycling translate into more physical activity?
YES: active mobility helps to increase physical activity levels

www.pastaproject.eu
Is self-reported PA reliable?
Vigorous-intensity PA: YES
Moderate-intensity PA: underestimated
Sedentary time: inaccurate
SenseWear vs. GPAQ

Safety
Exposure adjusted crash risks

www.pastaproject.eu
Exposure Adjusted Crash Rates
Valid comparisons
Identification of safety factors
Crashes
Exposure

www.pastaproject.eu
Exposure Adjusted Bicycle Crash Rates
Per «hours cycled» Per «km cycled»
Travel Diary Sub-Sample (participants = 2,101 ; crashes = 496 )

www.pastaproject.eu
Crash Risk Factors (Preliminary Results)
Effects Hazard Ratio (95%
CI)
Sex - Female 0.80 (0.63, 1.01).
Age – 35-50 0.78 (0.61, 1.00).
Age – 50+ 0.90 (0.66, 1.21)
City - Barcelona 1.18 (0.79, 1.77)
City - London 1.47 (1.04, 2.09)*
City - Oerebro 0.22 (0.09, 0.49)***
City - Roma 1.27 (0.89, 1.79)
City - Wien 1.44 (1.08, 1.91)*
City - Zurich 1.53 (1.10, 2.11)*
(based on km)Signif. codes: 0 „***‟ 0.001 „**‟ 0.01 „*‟ 0.05 „.‟ 0.1 „ ‟ 1

Concerns about Air Pollution
Are they justified?

www.pastaproject.eu
Concern over health effects of air pollution
27%
7%13%8%
11%
29%
7%
25%
30%
13%14%
21%
32%
19%
26%
23%
48%65%
49%
11%
51%
36%29%
29%16% 15% 21%
7% 5%
0%
10%
20%
30%
40%
50%
60%
70%
80%
90%
100%
Antwerp Barcelona London Oerebro Rome Vienna Zurich
Not worried at allNot worriedNeither worried nor not worriedWorriedExtremely worried
NO2
PM2.5

www.pastaproject.eu
Concern over health effects of air pollution
NO2
PM2.5
Antwerp Barcelona
London
Oerebro
Rome
Vienna
Zurich
y 1.4 0.057 x ,r2=0.752y 1.4 0.057 x ,r
2=0.752y 1.4 0.057 x ,r
2=0.752y 1.4 0.057 x ,r
2=0.752y 1.4 0.057 x ,r
2=0.752y 1.4 0.057 x ,r
2=0.752y 1.4 0.057 x ,r
2=0.752
2.5
3.0
3.5
4.0
20 30 40
NO2
Concern
over
health
effects
of T
RA
P
Being male, having children in the household, being more
physically active, and higher NO2 at the home address higher
concern over health effects of air pollution

BMI
What happens when you start cycling?

www.pastaproject.eu
BMI analysis
Key gaps addressed:
• Cross-sectional analysis vs. longitudinal analysis
• Taking into account important covariates like leisure-time PA
• Many participants using many different modes
• Multicentre study
Baseline questionnaire (t0)
- height
- weight
- transport mode
- etc.
Final questionnaire (t1)
- height
- weight
- transport mode
- etc.
N=8,579 N=3,292
<< 476 days >>

www.pastaproject.eu
BMI analysis
Results from the cross-sectional analysis
-0,015
-0,01
-0,005
0
0,005
0,01
0,015
0,02
0,025
0,03
0,035
Bik
e
Walk
Pu
blic t
ran
sp
ort
Mo
torc
ycle
E-b
ike
Car
BM
I diffe
rence (
kg/m
²) per
additio
nal
day p
er
month
-0,5
-0,45
-0,4
-0,35
-0,3
-0,25
-0,2
-0,15
-0,1
-0,05
0
No
n-c
yclist
Occasio
nal
cyclist
Fre
qu
en
t cyclist
BM
I diffe
rence (
kg/m
²)

www.pastaproject.eu
BMI analysis
• Translate BMI in kilograms.
• Reverse causality.

Conclusions
Achievements and outlook

www.pastaproject.eu
Conclusions
- Contributions in terms of innovative research
- Successful implementation of a cutting-edge online survey
- Recruitment, online platform,
- Innovative longitudinal study design
- Unique data set in terms of size and contents
- Some unique findings
- Crash rates
- Effects of active mobility on BMI, (and other health endpoints)
- E-bikes
- ...and many more to come!

www.pastaproject.eu
Recap and Outlook
Ample gaps in (quantitative)
understanding of active travel remain!
PASTA research progress timeline
2014: can we measure it?
2015: can we find particpants?
2016: can we clean all that data?
2017: can we analyze all this?
2018: can we find funds to continue analyzing?
(Research) progress is a slow vehicle! - keep pushing!

www.pastaproject.eu
Thanks to our Collaborators
B. Alasya, E. Anaya, I. AvilaPalencia,
D. Banister, I. Bartana, F. Benvenuti, F. Boschetti, C. Brand, M. Brannion-
Calles, J. Buekers, L. Carniel, G. Carrasco Turigas, A. Castro, M.
Cianfano, A. Clark, T. Cole-Hunter, V. Copley, P. De Boever, A. de
Nazelle, C. Dimajo, E. Dons, M. Duran, U. Eriksson, H. Franzen, M. Gaupp-
Berghausen, R.Gerike, R.Girmenia, T.Götschi, F.Hartmann, F.
Iacorossi, L. Int Panis, S. Kahlmeier, H. Khreis, M. Laeremans, T.
Martinez, M. Meschik, P. Michelle, P. Muehlmann, N. Mueller, M.
Nieuwenhuijsen, A. Nilsson, F. Nussio, J.P. Orjuela Mendoza, S.
Pisanti, J. Porcel, F. Racioppi, E. Raser, S. Riegler, H. Robrecht, D.
Rojas Rueda, C. Rothballer, J. Sanchez, A. Schaller, R. Schuthof, C.
Schweizer, A. Sillero, L. Smidfeltrosqvist, G. Spezzano, A. Standaert,
E. Stigell, M. Surace, T. Uhlmann, K. Vancluysen, S. Wegener, H.
Wennberg, G. Willis, J. Witzell, and V. Zeuschner.
Advisory Board: K. Dziekan, A. Ahrens, M. Jerrett, A. Davis
| 67Footer

Thomas Götschi
University of Zurich, Switzerland
Evi Dons
VITO, Belgium
This project has received funding from the European Union‟s Seventh
Framework Programme for research; technological development and
demonstration under grant agreement no 602624-2.