active lives adult survey november 2019/20 report
TRANSCRIPT

sportengland.org
Published April 2021
Active Lives Adult SurveyNovember 2019/20 Report

This report presents data from the Active Lives Adult Survey for the period mid-November 2019 to mid-November 2020. Data is presented for adults aged 16+ in England.
This report contains the first eight months of coronavirus (Covid-19) restrictions, from mid-March to mid-November 2020.
Contents
Key information
This release: 29 April 2021
Next release: 21 October 2021
Release dates
For more information on the data presented in this report, please visit the Active Lives section of our website.
Find out more
Levels of activity
Types of activity
Outcomes
Local level data
Definitions
Notes
Welcome
Loneliness
2
05
24
44
53
54
55
03
50
Muscle strength 22
Attitudes 30
Volunteering 34

WelcomeCovering the period from mid-November 2019 to mid-November 2020, this reportprovides an update on the sport and physical activity behaviours of adults in England.
The period covered includes the eight months of restrictions imposed in response to thecoronavirus pandemic, including the full national lockdown from March-May 2020, theeasing of restrictions in the summer and the start of the second national lockdown inNovember 2020. It reveals that, despite a huge effort from activity providers to adaptthroughout the year and continued efforts by the population to remain active byswitching to alternative or adapted activities, the pandemic has had an unprecedentedimpact on our ability to take part in sport and physical activity.
The scale of that disruption has been so great that many of the gains achieved over thelast five years have been hit, as the number of active adults fell by 1.9% or 710,000compared to 12 months earlier, whilst the number of inactive adults rose by 2.6% or 1.2million. We are working hard with our partners, through our advocacy, investment andresources to help get these levels increasing, back to where they were and evenbeyond – you can read more about that on our website.
In addition to the overall picture of activity, this report will provide a 12-month picture bydemographic audience, broken down by each stage of the year. This reveals the initialimpact of the first lockdown, the extent to which we switched into alternative activitiesand, importantly, which audiences have found it tougher to return as restrictions eased.
As ever, this report provides the headlines with the opportunity to dig deeper into theresults via links to the more detailed data tables.
If you’re interested in further information about how the pandemic is affecting attitudestowards being active and how the public is feeling about returning to activities, checkout our April report on understanding the impacts of coronavirus.
LisaO’Keefe Insight Director3
4
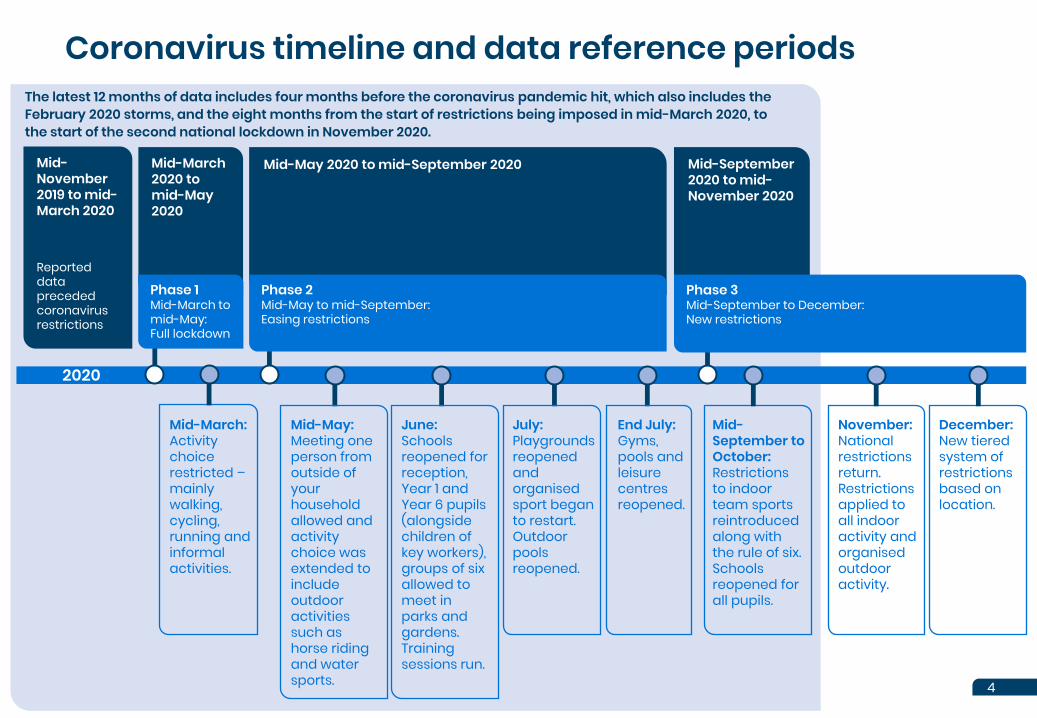
Mid-March:Activity choice restricted –mainly walking, cycling, running and informal activities.
Mid-September to October:Restrictions to indoor team sports reintroduced along with the rule of six. Schools reopened for all pupils.
November: National restrictions return. Restrictions applied to all indoor activity and organised outdoor activity.
Mid-March 2020 to mid-May 2020
Mid-May 2020 to mid-September 2020 Mid-September 2020 to mid-November 2020
The latest 12 months of data includes four months before the coronavirus pandemic hit, which also includes the February 2020 storms, and the eight months from the start of restrictions being imposed in mid-March 2020, to the start of the second national lockdown in November 2020.
2020
Coronavirus timeline and data reference periods
Phase 1 Mid-March to mid-May:Full lockdown
Phase 2Mid-May to mid-September:Easing restrictions
Phase 3 Mid-September to December:New restrictions
June:Schools reopened for reception, Year 1 and Year 6 pupils (alongside children of key workers), groups of six allowed to meet in parks and gardens. Training sessions run.
Mid-May: Meeting one person from outside of your household allowed and activity choice was extended to include outdoor activities such as horse riding and water sports.
July: Playgrounds reopened and organised sport began to restart. Outdoor pools reopened.
End July: Gyms, pools and leisure centres reopened.
December: New tiered system of restrictions based on location.
Mid-November 2019 to mid-March 2020
Reported data preceded coronavirus restrictions
Levels of activity
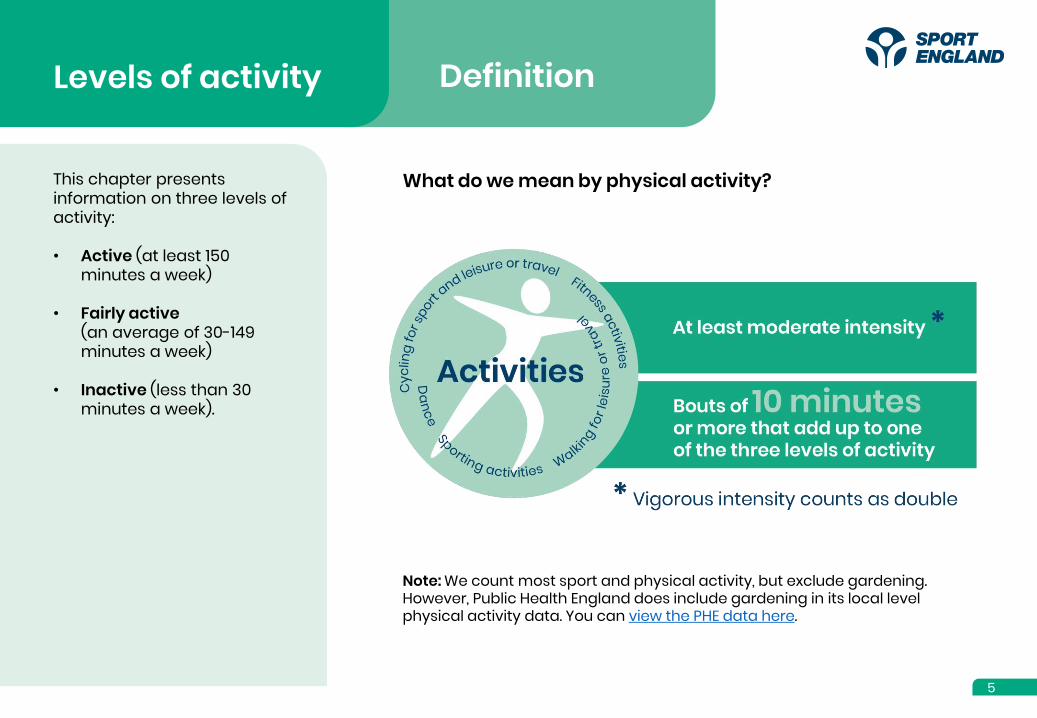
This chapter presents information on three levels of activity:
• Active (at least 150 minutes a week)
• Fairly active(an average of 30-149 minutes a week)
• Inactive (less than 30 minutes a week).
What do we mean by physical activity?
Note: We count most sport and physical activity, but exclude gardening. However, Public Health England does include gardening in its local level physical activity data. You can view the PHE data here.
Definition
5

HeadlinesOur data shows that between mid-November 2019 and mid-November 2020, just over six in 10 adults (27.9m) achieved 150+ minutes of activity a week.
Link to data tables
Levels of activity
11.5% 61.4%27.1%
27.1% of people(12.3m) did less than
an average of 30minutes a week
11.5% (5.2m) were fairly active but
didn’t reachan average
of 150 minutesa week
61.4% (27.9m)did an average of
150 minutes ormore a week
Less than an average of 30
minutes a week
An average of 30-149minutes a
week
An average of 150+ minutes a week
ActiveInactive Fairly active
6

Summary of changeActivity levels in England were increasing until the combined impact of the storms in February 2020, and measures to counter the coronavirus pandemic were introduced in mid-March 2020.
The pandemic led to unprecedented decreases in activity levels and, as a result, the latest annual results show the following changes compared to 12 months earlier:
• 0.7m (-1.9%) fewer active adults
• 1.2m (+2.6%) more inactive adults.
This, however, masks the scale of the changes seen during the impacted months, which are shown on the next page.
Link to data tables For details on how we measure change, see the notes pages.
Levels of activity
All adults (aged 16+)
7

Changes through the yearActivity levels were hit hardest during the initial phase of the pandemic, and the proportion of the population classed as active dropped by 7.1%. This represents just over 3m fewer active adults.
During the second phase, as restrictions were eased, activity levels were still down compared to 12 months ago, but the reductions were smaller:
• 4.4%/2.0m fewer active adults across mid-May to mid-July
• 3.1%/1.4m fewer active adults across mid-July to mid-September.
During the third phase of the pandemic, as new restrictions were imposed but before the full impact of the national lockdown was felt, activity levels decreased by 1.8% (0.8m fewer active adults). This was notably a smaller decrease than during the lockdown phase, indicating some recovery.
Link to data tables For details on how we measure change, see the notes pages.
Levels of activity
Active: 150+ minutes a weekAll adults (aged 16+)
8
Full lockdown
Easing restrictions
New restrictions
The rest of this section explores how different demographic groups followed and deviated from this pattern and what that means for the inequalities we observe amongst activity levels overall.

Our data shows there are significant inequalities:Summary of demographic differences
* See our definitions page for the full definition of each demographic group.
GenderMen (63% or 13.9m) are more likely to be active than women (60% or 13.9m).
1
Disability and long-termhealth conditions
Link to data tables
3
4
5
Socio-economic groupsThose in routine/semi-routine jobs and those who are long-term unemployed or have never worked(NS-SEC 6-8*) are the least likely to be active (52%).
AgeActivity levels generally decrease with age, with the sharpest decrease coming at age 75+ (to 38%).
Activity is less common for disabled people or those with a long-term health condition* (45%) than those without (66%).
EthnicityThere are differences observed in activity levels based on ethnic background.
Levels of activity
9
2
Gender
Link to data tables
Levels of activity
10
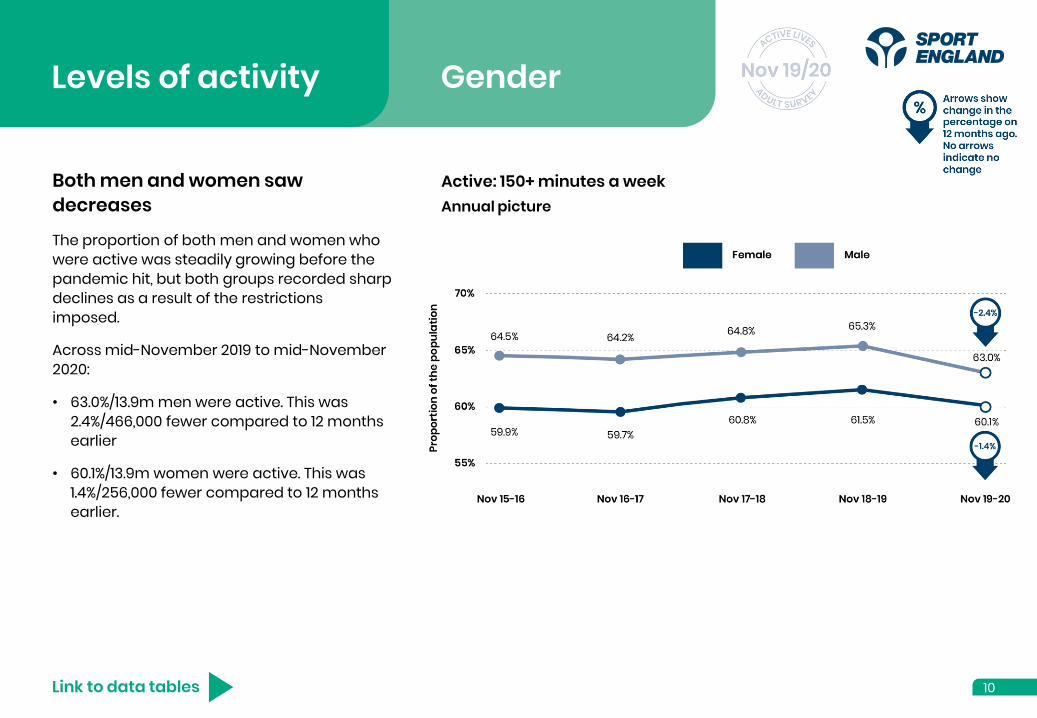
Both men and women saw decreases
The proportion of both men and women who were active was steadily growing before the pandemic hit, but both groups recorded sharp declines as a result of the restrictions imposed.
Across mid-November 2019 to mid-November 2020:
• 63.0%/13.9m men were active. This was 2.4%/466,000 fewer compared to 12 months earlier
• 60.1%/13.9m women were active. This was 1.4%/256,000 fewer compared to 12 months earlier.
Annual pictureActive: 150+ minutes a week

Gender
Link to data tables
Levels of activity
11
Men saw greater initial drops, but women saw more sustained drops
As the pandemic hit, male activity levels fell more quickly with a larger drop during the initial lockdown (mid-March to mid-May). They then recovered more quickly, whereas female activity levels remained more consistently lower than 12 months earlier.
This indicates that, despite their activity levels initially seeming more resilient to the pandemic, women who’ve seen activity levels fall may take longer and require more support to return.
Seasonal variation
Socio-economic groups
Link to data tables
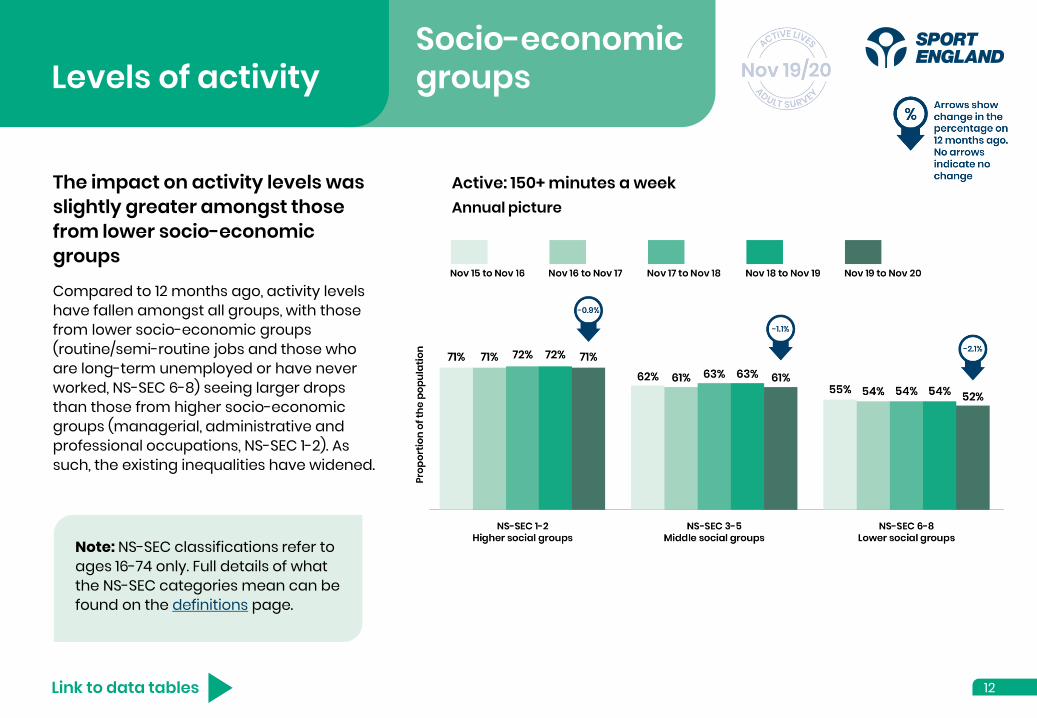
The impact on activity levels was slightly greater amongst those from lower socio-economic groups
Compared to 12 months ago, activity levels have fallen amongst all groups, with those from lower socio-economic groups (routine/semi-routine jobs and those who are long-term unemployed or have never worked, NS-SEC 6-8) seeing larger drops than those from higher socio-economic groups (managerial, administrative and professional occupations, NS-SEC 1-2). As such, the existing inequalities have widened.
Note: NS-SEC classifications refer to ages 16-74 only. Full details of what the NS-SEC categories mean can be found on the definitions page.
Levels of activity
12
Active: 150+ minutes a weekAnnual picture

Socio-economic groups
Link to data tables
Seasonal variation was similar for both socio-economic groups
Both higher and lower socio-economic groups saw the largest drops during the initial lockdown period (mid-March to mid-May), which was also observed for adults overall.
Levels of activity
13
Seasonal variation

Ages 16-54
The youngest age group saw their downward trend in activity levels exacerbated in the pandemic
Activity levels have fallen for both the 16-34 and 35-54 age groups compared to 12 months ago.
This continues the downward trend seen before the pandemic for the 16-34 age group, with the proportion who are active having fallen a further 2.6%/408,000 compared to 12 months ago. Within this, it’s the 16-24 age group particularly driving the decreases.
Levels of activity
14Link to data tables
Active: 150+ minutes a weekAnnual picture
Ages 16-54
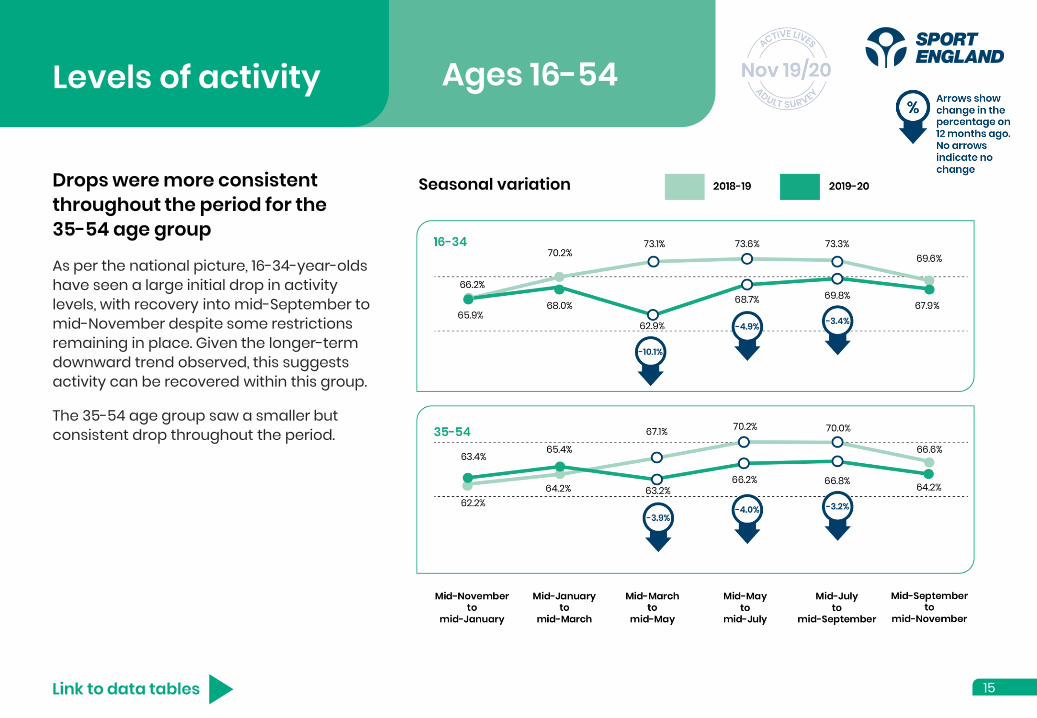
Drops were more consistent throughout the period for the35-54 age group
As per the national picture, 16-34-year-olds have seen a large initial drop in activity levels, with recovery into mid-September to mid-November despite some restrictions remaining in place. Given the longer-term downward trend observed, this suggests activity can be recovered within this group.
The 35-54 age group saw a smaller but consistent drop throughout the period.
Levels of activity
15Link to data tables
Seasonal variation

Ages 55+
Previous growth in activity levels has been stalled amongst older adults
Activity levels had been growing strongly amongst the 55-74 and 75+ age groups prior to the coronavirus pandemic, however, many of these gains have been lost as activity levels fell notably when restrictions were introduced.
The 75+ age group was particularly affected and this may be linked to the requirement for many of those aged 70+ to shield during the earlier stages of the pandemic.
Levels of activity
16Link to data tables
Active: 150+ minutes a weekAnnual picture
Ages 55+
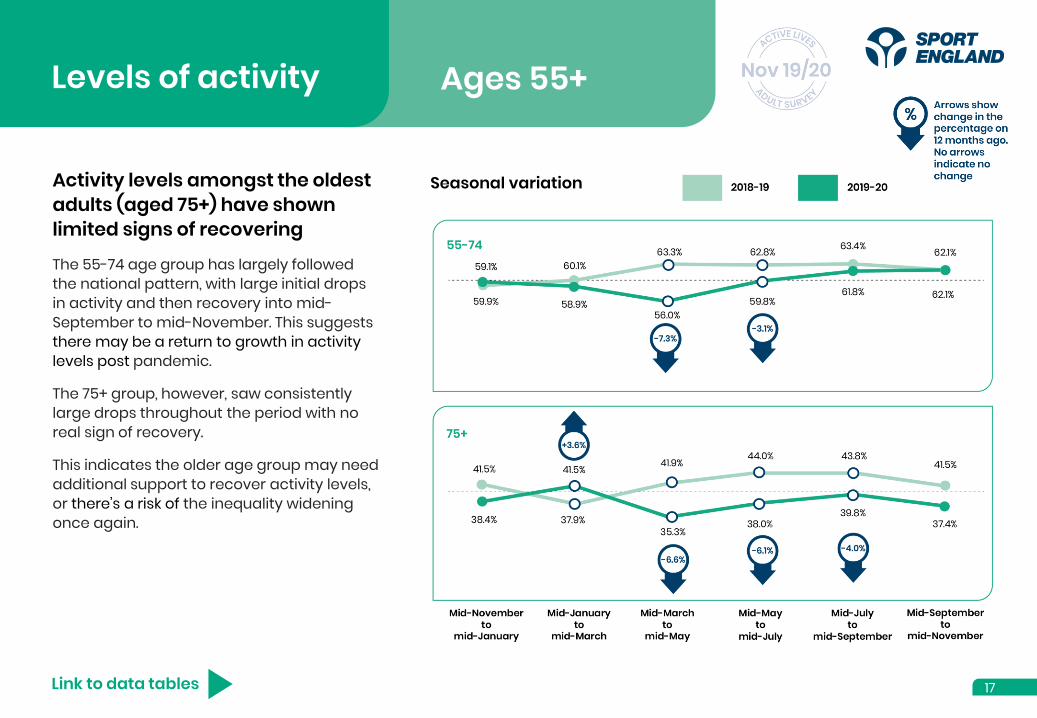
Activity levels amongst the oldest adults (aged 75+) have shown limited signs of recovering
The 55-74 age group has largely followed the national pattern, with large initial drops in activity and then recovery into mid-September to mid-November. This suggests there may be a return to growth in activity levels post pandemic.
The 75+ group, however, saw consistently large drops throughout the period with no real sign of recovery.
This indicates the older age group may need additional support to recover activity levels, or there’s a risk of the inequality widening once again.
Levels of activity
17Link to data tables
Seasonal variation

Disability and long-term health conditions
Link to data tables
Drops have been seen consistently across both those with, and without, a disability or long-term health condition
Disabled adults and people with a long-term health condition are less likely to be active than those without, with activity levels decreasing sharply the more impairments an individual has.
However, until the coronavirus pandemic and restrictions were introduced, there were steady increases in activity levels amongst all levels of impairment and, as such, a slight narrowing of the inequality.
The impact of the pandemic has been seen across all impairment groups, with an overall drop of 1.9% compared to 12 months ago amongst disabled people and those with a long-term health condition who were active, in line with the population as a whole.
Levels of activity
18
Active: 150+ minutes a weekAnnual picture
Nov 19 to Nov 20Active: 150+ minutes a week

Disability and long-term health conditions
Link to data tables
Seasonal variation is similar for both those with, and without, a disability or long-term health condition
Decreases were the strongest during the initial lockdown phase amongst both those with and without a disability or long-term health condition - in line with the national picture.
The scale of drops was slightly greater for disabled people or those with a long-term health condition, which may be attributed to the requirement for those with health conditions to shield.
Levels of activity
19
Seasonal variation

Ethnicity
Link to data tables
Levels of activity
20
The impact of the pandemic has disproportionately impacted Asian and Black adults
There’s a clear divide whereby Black and Asian adults, as well as those in the ‘other ethnic group’, are less likely to be active than those who are White or Mixed race.
The pandemic’s had a disproportionately negative impact on those with the lowest activity levels and as such the inequalities have widened.
Amongst those from Asian (excluding Chinese) backgrounds, men have driven the drops. Despite this, women of Black and Asian (excluding Chinese) ethnicities remain the least active and have the largest gender gap to their male equivalents.
Active: 150+ minutes a week
Annual picture

Ethnicity
Link to data tables
Levels of activity
21
Seasonal variation is similar for both Asian (excluding Chinese) and Black adults
For both groups, the drops were largest at the start of the pandemic, as per the national picture.
For those of Asian (excluding Chinese) ethnicities specifically, we also saw a notable drop in mid-September to mid-November, suggesting activity levels might be slow to recover and more support may be required for this group.
Seasonal variation

Muscle strength
Alongside recommending adults do at least 150+ minutes of physical activity a week, the Chief Medical Officer’s physical activity guidelines also recommend adults should do activities to develop or maintain strength in the major muscle groups. Muscle strengthening activities should be done at least two days a week.
Data has been collected to measure muscle strength since November 2019 and as such this report presents the first annual set of data.
Data has previously been, and continues to be, captured through the Health Survey for England – please see the notes page for differences in methodologies and resulting estimates.
What do we mean by muscle strength?
Definition
22
Building on the definition of physical activity, to analyse muscle strength we add a component linked to muscle tension.
Muscle strength
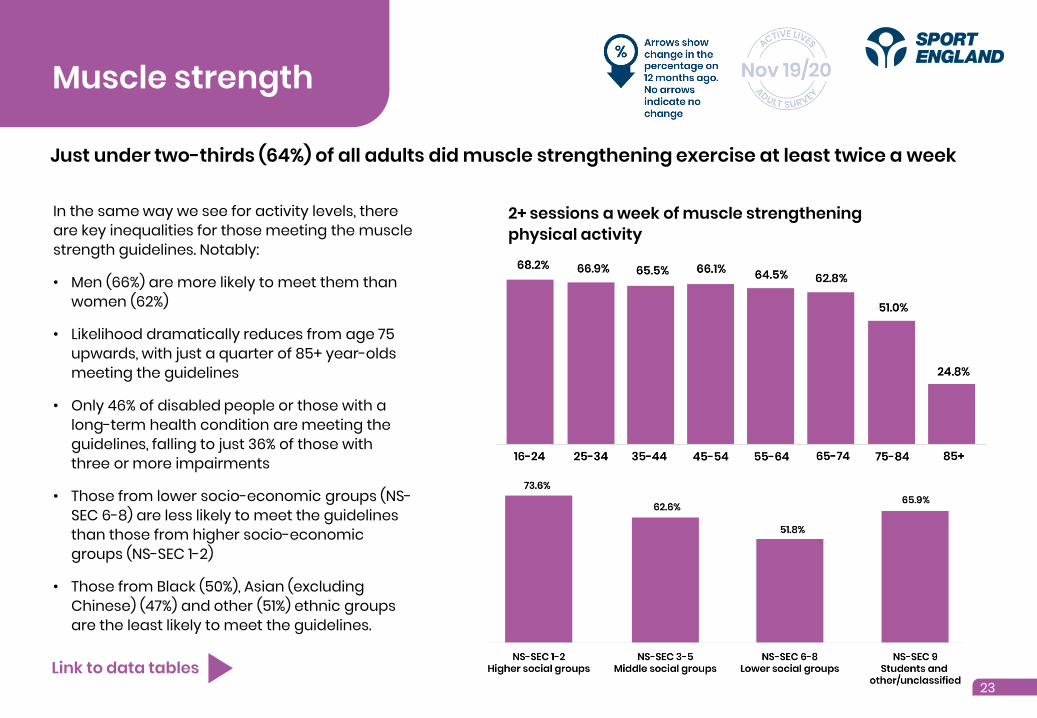
Just under two-thirds (64%) of all adults did muscle strengthening exercise at least twice a week
23Link to data tables
2+ sessions a week of muscle strengthening physical activity
In the same way we see for activity levels, there are key inequalities for those meeting the muscle strength guidelines. Notably:
• Men (66%) are more likely to meet them than women (62%)
• Likelihood dramatically reduces from age 75 upwards, with just a quarter of 85+ year-olds meeting the guidelines
• Only 46% of disabled people or those with a long-term health condition are meeting the guidelines, falling to just 36% of those with three or more impairments
• Those from lower socio-economic groups (NS-SEC 6-8) are less likely to meet the guidelines than those from higher socio-economic groups (NS-SEC 1-2)
• Those from Black (50%), Asian (excluding Chinese) (47%) and other (51%) ethnic groups are the least likely to meet the guidelines.

Types of activity Definition
This chapter presents data broken down by activity group and looks at those who’ve participated at least twice in the last 28 days.
Looking at participation at least twice in the last 28 days provides:
• a useful measure of engagement in different sports and physical activities• an understanding of the contribution of activities to achieving 150+ minutes
a week.
24

Types of activity Activity groups
We’ve seen unprecedented change in the activities adults have taken part in
Link to data tables
The accessibility of activities between mid-March to mid-November differed greatly as a result of the pandemic.
Whilst the restrictions severely limited the ability to take part in some activities such as active travel and swimming, the data indicates significant attempts by the population to find alternatives through increases in activities like walking, running and cycling.
The following pages explore how activity levels within the different types of activity changed through the different phases of the pandemic and how this reflected the restrictions in place at the time.
25
Taken part at least twice in the last 28 days (age 16+) for selected activity groups

Types of activity Activities available
Link to data tables 26
People turned to walking, cycling and running
Throughout the pandemic, walking, cycling and running have often been the activities people turned to and, as such, numbers taking part increased – in stark contrast to overall activity levels.
Walking for leisure didn’t record any increases until the second phase of the pandemic, as restrictions started to ease in mid-May. However, since then it’s largely held the gains made.
Cycling for leisure or sport saw more immediate gains, although the scale increased, and peaked, in mid-May to mid-July. Through late summer and into autumn the gains reduced, which might be linked to deteriorating weather and busier roads as more of the economy reopened.
Running or jogging saw more consistent gains, with more than 1m more adults going for a run across mid-May to mid-November compared to 12 months earlier.
Walking for leisure
Cycling for leisure or sport

Types of activity At home activity
Link to data tables 27
At home alternatives emerged
At home fitness/exercise was also encouraged during the period, however, whilst drops were undoubtedly smaller than they would otherwise have been, this was not sufficient to compensate for gyms being closed.
Fitness classes and interval sessions (e.g. yoga, circuits, high intensity interval training etc.), saw numbers hold initially but then drop, particularly as restrictions eased and other leisure activities became more readily available. Despite gyms reopening in late July, class capacity was reduced and drops remained substantial. Women are typically more likely than men to take part in these activities.
More generic fitness training (e.g. body weight exercises, skipping etc.) saw increases consistently throughout the period. Whilst typically more likely to be done by men, during the pandemic women have been equally likely to take part. This could be linked to the convenient nature of the activity.
Fitness class
Generic fitness training

Types of activity Activities that were recovering
Link to data tables 28
Team sports numbers dropped significantly as restrictions were imposed, but informal versions (individual skills or family play in the garden, for instance) meant some participation was retained. An ability to mix in small groups saw more informal play resume first before a level of indoor organised participation was permitted, which is reflected in the gradual recovery seen. The restrictions in place in early 2021 will undoubtedly lead to further drops in the following months.
Active travel also saw some recovery as more people returned to the workplace. Walking for travel saw drops reduce from over 7m fewer adults to just over 4m fewer adults, whilst by mid-September to mid-November cycling for travel numbers had returned to the levels seen 12 months earlier.
Walking for travel
Team sports
Following a similar pattern to activity levels overall with larger drops initially, some activities showed signs of recovery
Types of activity Facility-dependent activities
Link to data tables 29
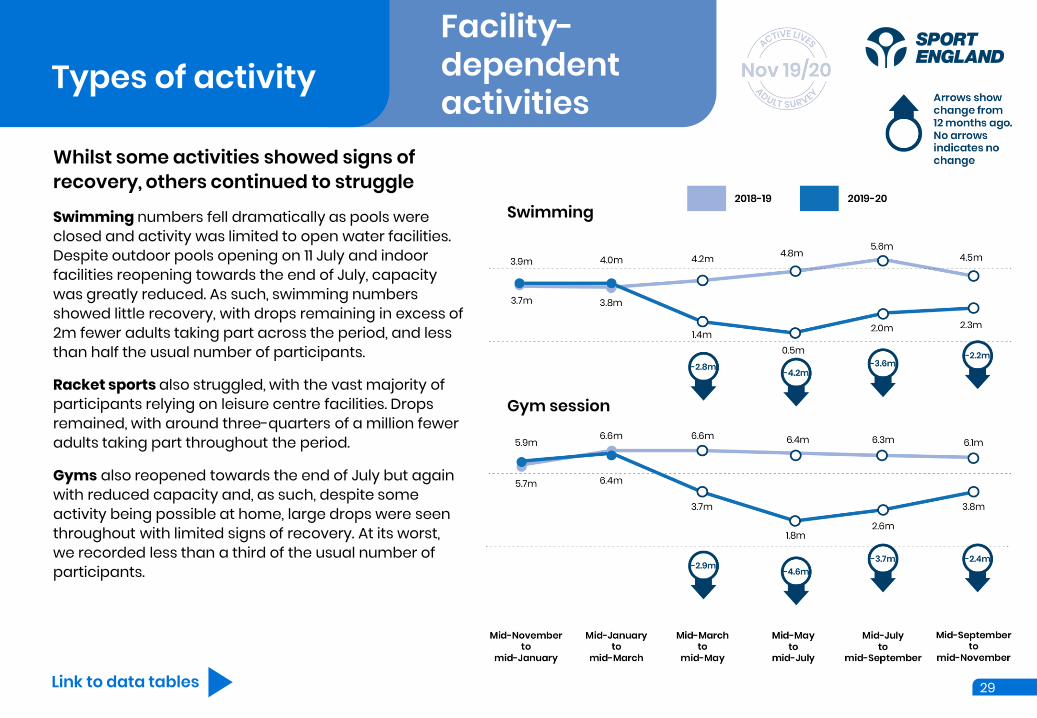
Whilst some activities showed signs of recovery, others continued to struggle
Swimming numbers fell dramatically as pools were closed and activity was limited to open water facilities. Despite outdoor pools opening on 11 July and indoor facilities reopening towards the end of July, capacity was greatly reduced. As such, swimming numbers showed little recovery, with drops remaining in excess of 2m fewer adults taking part across the period, and less than half the usual number of participants.
Racket sports also struggled, with the vast majority of participants relying on leisure centre facilities. Drops remained, with around three-quarters of a million fewer adults taking part throughout the period.
Gyms also reopened towards the end of July but again with reduced capacity and, as such, despite some activity being possible at home, large drops were seen throughout with limited signs of recovery. At its worst, we recorded less than a third of the usual number of participants.
Gym session
Swimming

Attitudes
We ask the following attitude questions:
Capability• I feel that I have the ability to be
physically activeAbility includes physical ability and confidence.
Opportunity• I feel that I have the opportunity to be
physically activeOpportunity includes things such as having somewhere to do it, being able to afford it, having the right kit, support from family, someone to take part with etc.
Motivation• I find sport enjoyable and satisfying• It’s important to me to do sport
regularly• I feel guilty when I don’t do sport• I do sport because I don’t want to
disappoint other people.
Results are presented for those saying strongly agree to each.
Definition
30
The attitudes of capability, opportunity and motivation combine to drive behaviour. The absence of just one of these can lead to someone becoming inactive. This awareness provides us with a key diagnosis tool in analysing and understanding changes in activity levels.
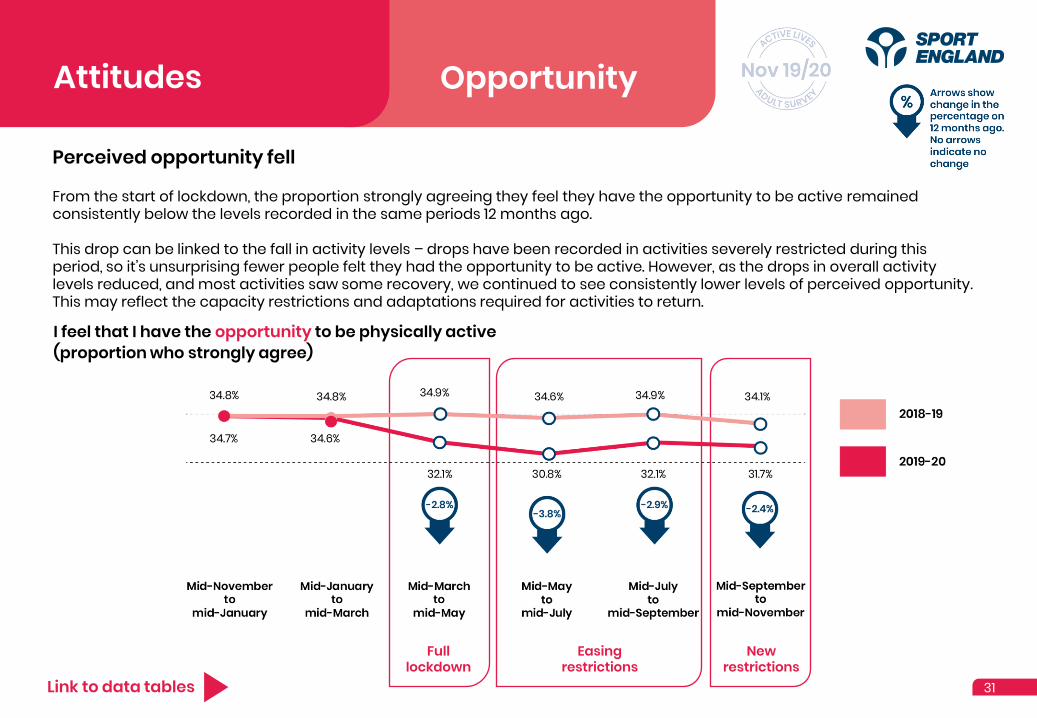
Perceived opportunity fell
31Link to data tables
From the start of lockdown, the proportion strongly agreeing they feel they have the opportunity to be active remained consistently below the levels recorded in the same periods 12 months ago.
This drop can be linked to the fall in activity levels – drops have been recorded in activities severely restricted during this period, so it’s unsurprising fewer people felt they had the opportunity to be active. However, as the drops in overall activity levels reduced, and most activities saw some recovery, we continued to see consistently lower levels of perceived opportunity. This may reflect the capacity restrictions and adaptations required for activities to return.
I feel that I have the opportunity to be physically active (proportion who strongly agree)
Attitudes Opportunity
Full lockdown
Easing restrictions
New restrictions

Perceived capability increased
32Link to data tables
I feel that I have the ability to be physically active (proportion who strongly agree)
Perceived ability to take part in sport and physical activity increased slightly ahead of the pandemic and has, throughout the period, remained slightly higher than 12 months ago.
Positive messaging around the importance of staying active, encouragement to leave the house once a day to exercise and the increased promotion of digitally-consumed fitness activities are likely to have created spaces for exercise away from the fear of judgement, which may have contributed to this finding.
Attitudes Capability
Full lockdown
Easing restrictions
New restrictions

Demographic variations
33
Attitudes
Link to data tables
GenderThe drops in perceived opportunity were greater for men, compared to women, across mid-March to mid-September. The magnitude of the drops reduced over time for men, which coincided with activity levels starting to recover, whereas for women both opportunity and activity levels remained consistently down. This indicates choice of activity, and so perceived opportunity, has clearly impacted activity levels.
Women have driven the increases in perceived capability.
Lower socio-economic groups (NS-SEC 6-8)Perceived opportunity is greatest amongst the higher socio-economic groups (NS-SEC 1-2) and as such it’s not surprising these groups have reported decreases when restrictions were in place. It’s likely many of the restricted activities were more accessible to those better off and so their opportunities have decreased proportionately more than those from lower socio-economic groups (NS-SEC 6-8).
AgeDrops in perceived opportunity were driven by the 16-34 age group throughout the period and also by the 75+ age group from mid-July to mid-November. Increases in perceived capability were initially seen amongst the 75+ age group and latterly by the 55-74 age group.
I feel that I have the opportunity to be physically active (proportion who strongly agree)
Age 16-34
Age 75+
Disability or long-term health conditionBoth opportunity and capability are notably lower for disabled people or those with a long-term health condition, compared to those without.
Opportunity decreased for both groups, whereas capability remained unchanged for disabled people or those with a long-term health condition, whilst increasing for those without.

Volunteering Definition
A volunteer makes all the difference. Volunteering benefits both the volunteer and the person receiving the support. Whether it’s serving refreshments, coaching a player or assisting disabled people to take part, the sport and activity sector needs people to give their time.
We count a person as having volunteered if:
They’ve taken part in a volunteering role to support sport/physical activity in the past 12 months.
• Volunteered once/one-off in the past year• Volunteered a few times in the past year• Volunteered at least once a month, but not once a week,
throughout the year• Volunteered at least once a week throughout the year.
(A full list of roles can be found in our definitions at the end of this report on page 54).
34
We capture volunteering across four levels of frequency (in the past 12 months):
And at six different lengths of time (per usual session):
• Less than half an hour• Around half an hour• Around 45 minutes to an hour• Around two hours• Three or four hours• More than four hours.

Volunteering Frequency
A slightly higher proportion volunteered, on average, once a month throughout the year (but not once a week), with similar proportions volunteering either a few times in the year or once/as a one-off.
In total, this equates to over one in five, or just under 10m adults who’ve given up their time to support sport and physical activity at some point across the 12-month period.
Link to data tables 35
Seasonal variation4.9%/2.2m adults volunteered at least once a week throughout the year Across mid-March to mid-September, volunteering once a week across
the year was lower than earlier in the year, but this was compensated by volunteering an average of once a month. It’s likely that volunteering activity reduced or stopped during the pandemic, but due to the annual measure for volunteering, some volunteer activity from before the pandemic will still be captured in the average of once a month measure.
In contrast, the proportions volunteering a few times or once in the past year both gradually fell during the pandemic period, indicating lost opportunities for more infrequent volunteers.
Volunteering Duration
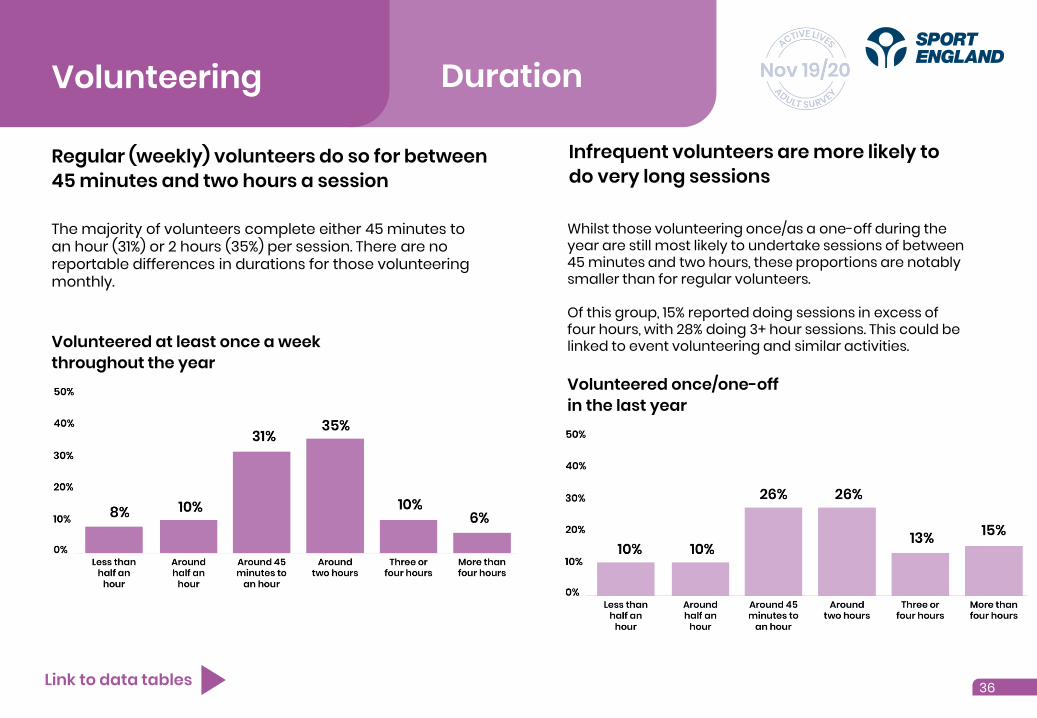
The majority of volunteers complete either 45 minutes to an hour (31%) or 2 hours (35%) per session. There are no reportable differences in durations for those volunteering monthly.
Link to data tables 36
Infrequent volunteers are more likely to do very long sessions
Regular (weekly) volunteers do so for between 45 minutes and two hours a session
Whilst those volunteering once/as a one-off during the year are still most likely to undertake sessions of between 45 minutes and two hours, these proportions are notably smaller than for regular volunteers.
Of this group, 15% reported doing sessions in excess of four hours, with 28% doing 3+ hour sessions. This could be linked to event volunteering and similar activities.Volunteered at least once a week
throughout the yearVolunteered once/one-off in the last year

Volunteering Roles
Across all adults who reported doing any volunteering over the past 12 months, organising fundraising for a sports club, organisation or event, and providing transport which helps people take part in sport (other than for family members) are the most common roles undertaken.
Link to data tables 37
A variety of different roles are performed by volunteers

Our data shows there are significant inequalities:Summary of demographic profile
* See our definitions page for the full definition of each demographic group.
GenderMen are more likely to regularly volunteer to support sport and physical activity than women, comprising 64% ofall volunteers.
1
Disability and long-term health conditions
Volunteering
Link to data tables
Socio-economic groupsPeople from lower socio-economic backgrounds (NS-SEC 6-8) are under-represented in volunteering, comprising just 11% of all sport volunteers but 31% of the adult population (aged 16-74).
AgeThe greatest shares of regular volunteers come from the 16-24, 35-44 and 45-54 age groups.
Disabled people or those with a long-term health condition* account for 14% of regular volunteers, despite accounting for 21% of the population as a whole.
EthnicityAsian (excluding Chinese), White Other and Black adults are slightly under-represented amongst regular volunteers.
2
3
4
5
38
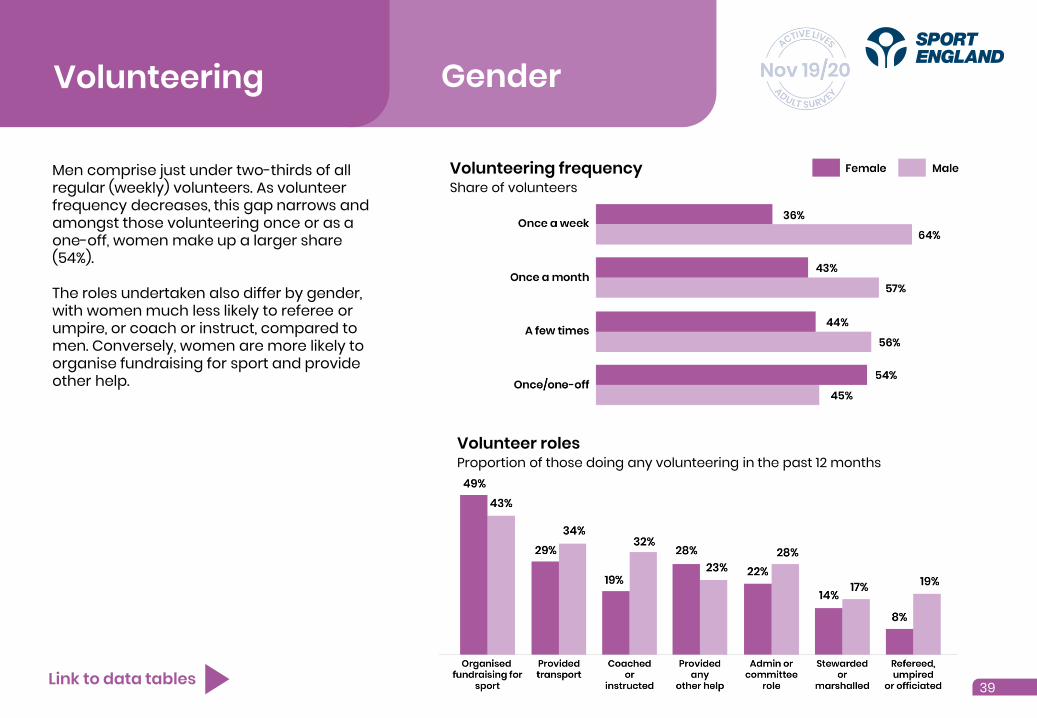
Volunteering Gender
Men comprise just under two-thirds of all regular (weekly) volunteers. As volunteer frequency decreases, this gap narrows and amongst those volunteering once or as a one-off, women make up a larger share (54%).
The roles undertaken also differ by gender, with women much less likely to referee or umpire, or coach or instruct, compared to men. Conversely, women are more likely to organise fundraising for sport and provide other help.
Link to data tables 39
Volunteering frequencyShare of volunteers
Volunteer rolesProportion of those doing any volunteering in the past 12 months
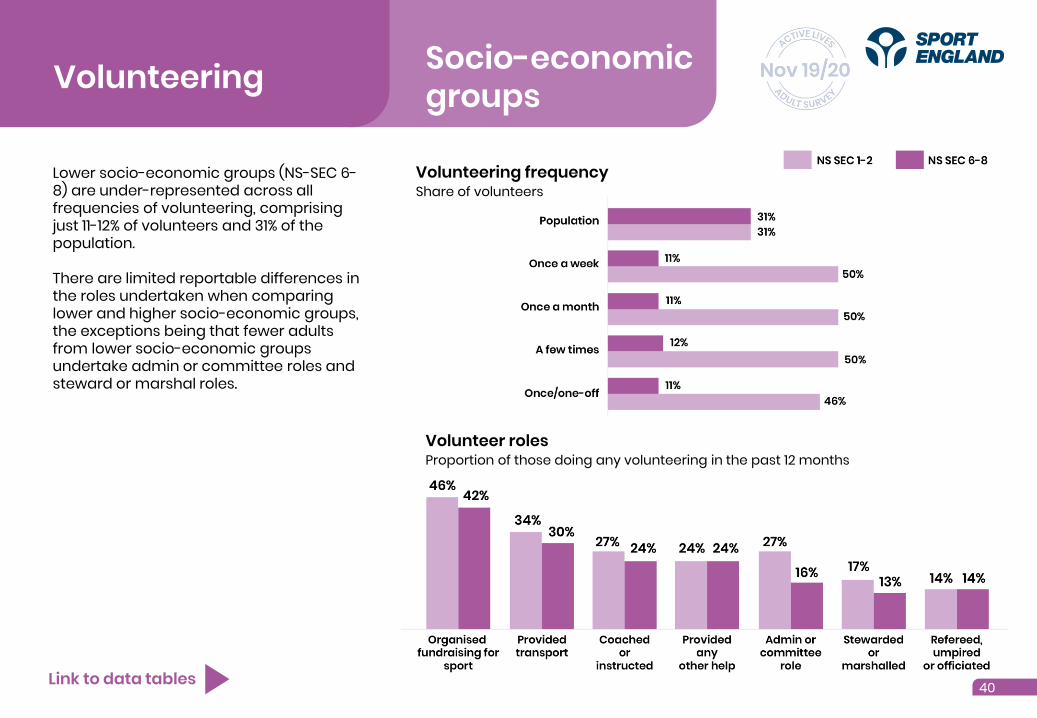
Volunteering Socio-economic groups
Lower socio-economic groups (NS-SEC 6-8) are under-represented across all frequencies of volunteering, comprising just 11-12% of volunteers and 31% of the population.
There are limited reportable differences in the roles undertaken when comparing lower and higher socio-economic groups, the exceptions being that fewer adults from lower socio-economic groups undertake admin or committee roles and steward or marshal roles.
Link to data tables 40
Volunteering frequencyShare of volunteers
Volunteer rolesProportion of those doing any volunteering in the past 12 months

Volunteering Age
The 16-24 age group is over-represented amongst volunteers, comprising 13% of the population and more than 16% of volunteers. This is greatest amongst infrequent volunteers (once or one-off), where they comprise 22% of volunteers.
In contrast, those aged 75+ are under-represented, with the greatest disparity being amongst infrequent volunteers.
The roles undertaken differ by age, with coaching or instructing and refereeing or umpiring decreasing with age, and admin or committee roles and other help generally increasing with age. Providing transport peaks at age 35-54.
Link to data tables 41
Volunteering frequencyShare of volunteers
Selected volunteer rolesProportion of those doing any volunteering in the past 12 months

VolunteeringDisability and long-term health conditions
Disabled adults or those with a long-term health condition are under-represented at all frequencies of volunteering, comprising 21% of the population and just 13-15% of volunteers. Furthermore, amongst this group those with three or more impairments are further under-represented, comprising half of all disabled adults and just 28% of all disabled volunteers.
Disabled volunteers or those with a long-term health condition are more likely to undertake roles such as organising fundraising for sport and providing other help, and less likely to coach or instruct and steward or marshal compared to disabled people or those with a long-term health condition.
Link to data tables 42
Volunteering frequencyShare of volunteers
Selected volunteer rolesProportion of those doing any volunteering in the past 12 months
Weekly volunteeringShare of disabled volunteers or those with a long-term health condition
Volunteering Ethnicity
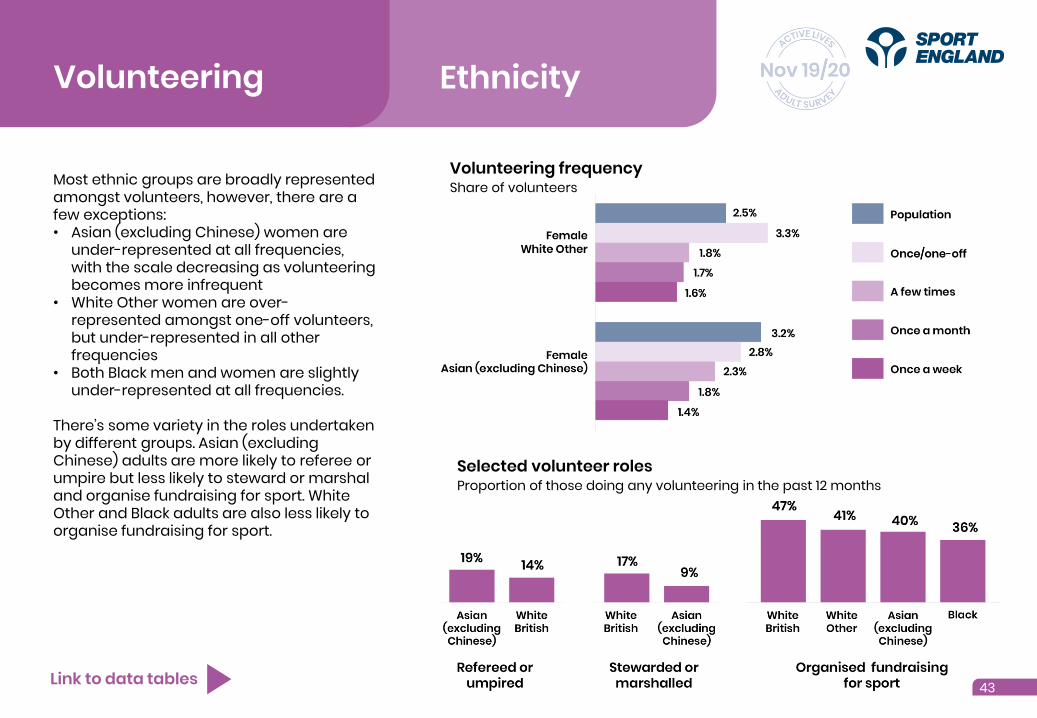
Most ethnic groups are broadly represented amongst volunteers, however, there are a few exceptions:• Asian (excluding Chinese) women are
under-represented at all frequencies, with the scale decreasing as volunteering becomes more infrequent
• White Other women are over-represented amongst one-off volunteers, but under-represented in all other frequencies
• Both Black men and women are slightly under-represented at all frequencies.
There’s some variety in the roles undertaken by different groups. Asian (excluding Chinese) adults are more likely to referee or umpire but less likely to steward or marshal and organise fundraising for sport. White Other and Black adults are also less likely to organise fundraising for sport.
Link to data tables 43
Volunteering frequencyShare of volunteers
Selected volunteer rolesProportion of those doing any volunteering in the past 12 months

Mental wellbeing and individual and community development Definition
Sport and physical activity –and volunteering to support it –has the power to improve lives.
In addition to capturing the behaviour of adults when it comes to sport and physical activity, Active Lives also captures data designed to better understand impact against four of the five social outcomes identified within the government’s sport and physical activity strategy –Sporting Future.
Chapter one of this report covered the first of those outcomes – physical wellbeing. This chapter will focus on mental wellbeing, individual development and social and community development.
For further details on the outcomes, see our evidence review.
44
Mental wellbeing
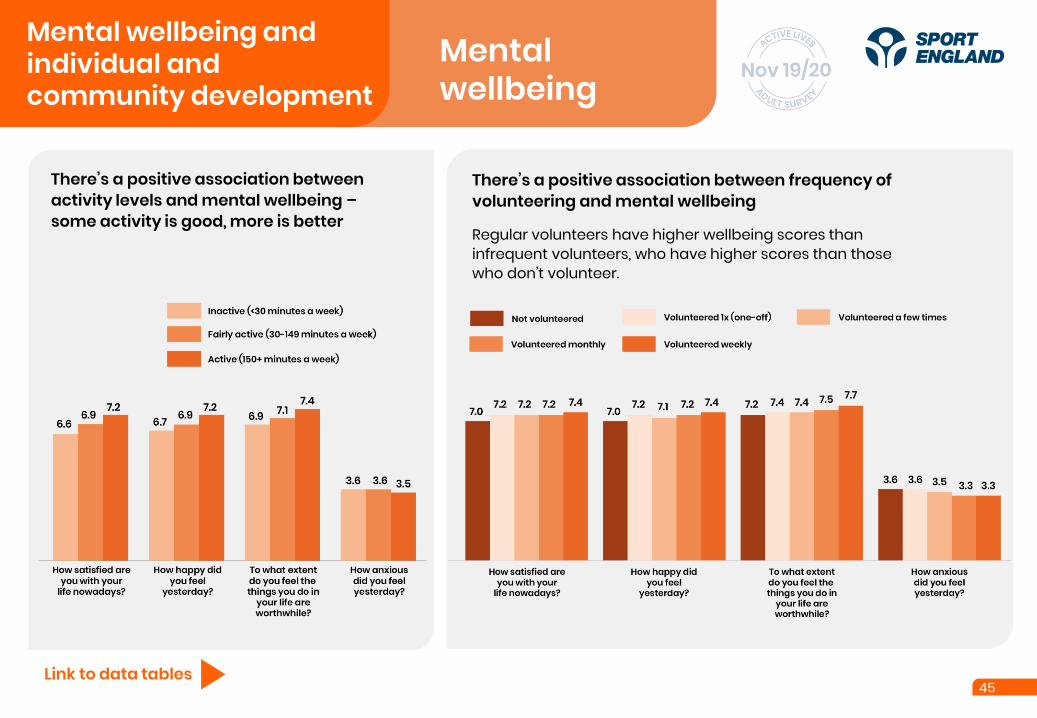
There’s a positive association between activity levels and mental wellbeing –some activity is good, more is better
There’s a positive association between frequency of volunteering and mental wellbeing
Regular volunteers have higher wellbeing scores than infrequent volunteers, who have higher scores than those who don’t volunteer.
45Link to data tables
Mental wellbeing and individual and community development

Mental wellbeing
Summary of change
46Link to data tables
It’s typical to see limited change in mental wellbeing scores in the short term, however, the unprecedented nature of the coronavirus pandemic means some changes have been observed.
Life satisfaction decreased across mid-May to mid-November and life worthwhileness across mid-May to mid-September. These are often viewed as more medium and long-term markers of mental wellbeing, so it makes sense it came slightly later in the pandemic. As such, both recorded a small decrease in the annual figure compared with 12 months ago.
Anxiety increased and happinessdecreased across the periods of full lockdown and easing restrictions (mid-March to mid-September) with the largest changes coinciding with the largest drops in activity levels and falls in regular volunteering.
It remains the case that wellbeing is positively associated with activity levels through the pandemic.
Both metrics have recorded small changes in the annual figures when compared with 12 months ago.
Mental wellbeing and individual and community development
How anxious did you feel yesterday?

Mental wellbeing
Demographic variation
AgeThe increases in anxiety were initially greater amongst the 75+ age group, but across mid-September to mid-November it was the 16-34 age group that saw increases. This may be linked to anxiety around the return of more formal activity that tends to be more popular amongst the younger age groups.
Those aged 75+ saw the largest drops in happiness and life satisfaction, they’ve also recorded some of the largest drops in activity levels.
47Link to data tables
GenderThe increases in anxiety and decreases in happiness are greater for women, compared to men. Women have also seen a drop in their life satisfaction and life worthwhileness scores.
How anxious did you feel yesterday?
Age 16-34
Age 75+ Those with three or more impairments have seen the largest increase in anxiety, whilst those with one impairment have seen the largest drop in happiness.
Disability or long-term health condition
Mental wellbeing and individual and community development
Women

Individual development
There’s a positive association between activity levels and individual development
Those who are active have higher scores than those who are fairly active and inactive.
48Link to data tables
There’s a positive association between frequency of volunteering and individual development
Those who volunteer weekly have higher scores than those who volunteer as a one-off who, in turn, have higher scores than those who don’t volunteer.
Mental wellbeing and individual and community development

Social and community development
There’s a positive association between activity levels and social and community development
Those who are active have higher social trust scores than those who are inactive.
49Link to data tables
Those who’ve volunteered have higher social and community development scores than those who haven’t
There’s a small positive association between volunteering and social and community development overall, but not between the different frequencies of volunteering.
Mental wellbeing and individual and community development

Definition
Tackling loneliness is a key government objective.
In October 2018, the Department for Digital, Culture, Media and Sport published ‘A Connected Society’, its first strategy for tackling loneliness in England.
This chapter sets out the role sport and physical activity –and volunteering to support it – has in this.
Loneliness
Supporting people to have meaningful social relationships isn’t just crucial to people’s physical and mental health. It also affects their engagement in the workplace and wider community cohesion.
We’ve focused on those who are often/always lonely, as policy is centred around this group.
50
How often do you feel lonely?

Loneliness
People who engage in sport and physical activity are less likely to feel lonely
Those who are active or fairly active are less likely to feel lonely than those who are inactive. Many forms of sport and physical activity include a social element, so this is perhaps not surprising.
Seasonal variation
Loneliness levels haven’t changed during the different phases of the pandemic, either overall or for any of the levels of activity, and as such the association noted continues to hold.
51
Often/always feel lonely (all activity levels)
Link to data tables
This association holds across demographic groups, with one exception:
• Disabled adults or those with a long-term health condition are equally likely to be lonely, whether they're active or not.
Often/always feel lonely
Full lockdown
Easing restrictions
New restrictions

Loneliness
52
Often/always feel lonely (all activity levels)
Link to data tables
Demographic variation
GenderWomen (6.2%) are more likely to report feeling lonely often or always, compared to men (4.3%).
AgeFeeling lonely often or always is most common amongst the oldest and youngest age group. Until ages 75+, it decreases with age.
Socio-economic groupsLoneliness is higher amongst those from lower socio-economic groups (NS-SEC 6-8, 9.2%), compared to those from higher socio-economic groups (NS-SEC 1-2, 3.6%).
Disability and long-term health conditionsLoneliness is higher amongst disabled people or those with a long-term health condition compared to those without, and increases further for those with three or more impairments.
Often/always feel lonely (all activity levels)

Local level data
Link to data tables
Data for local areas (regions, Active Partnerships, local authorities) are available for the following measures:
• Levels of activity• Volunteering at
least twice in thepast 12 months
• Loneliness (regions and Active Partnerships only)
53
Activity across England
Active(an average of at least150 minutes per week)
Definitions
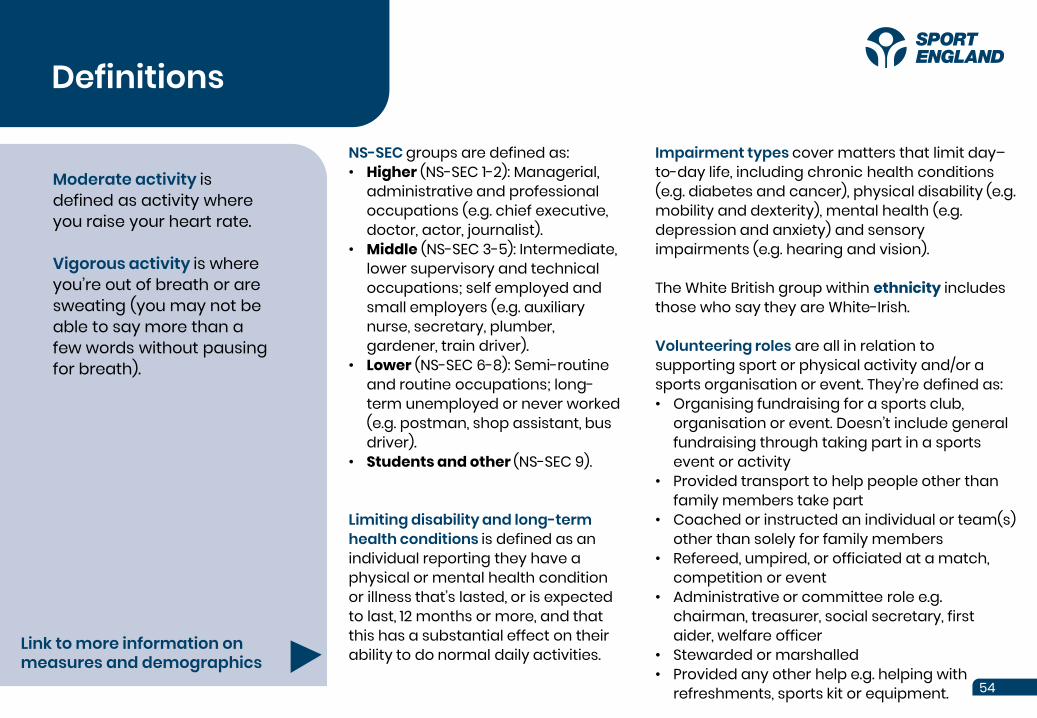
Moderate activity is defined as activity where you raise your heart rate.
Vigorous activity is where you’re out of breath or are sweating (you may not be able to say more than a few words without pausing for breath).
54
NS-SEC groups are defined as:• Higher (NS-SEC 1-2): Managerial,
administrative and professional occupations (e.g. chief executive, doctor, actor, journalist).
• Middle (NS-SEC 3-5): Intermediate, lower supervisory and technical occupations; self employed and small employers (e.g. auxiliary nurse, secretary, plumber, gardener, train driver).
• Lower (NS-SEC 6-8): Semi-routine and routine occupations; long-term unemployed or never worked(e.g. postman, shop assistant, bus driver).
• Students and other (NS-SEC 9).
Limiting disability and long-term health conditions is defined as an individual reporting they have a physical or mental health condition or illness that’s lasted, or is expected to last, 12 months or more, and that this has a substantial effect on their ability to do normal daily activities.
Impairment types cover matters that limit day–to-day life, including chronic health conditions (e.g. diabetes and cancer), physical disability (e.g. mobility and dexterity), mental health (e.g. depression and anxiety) and sensory impairments (e.g. hearing and vision).
The White British group within ethnicity includes those who say they are White-Irish.
Volunteering roles are all in relation to supporting sport or physical activity and/or a sports organisation or event. They’re defined as:• Organising fundraising for a sports club,
organisation or event. Doesn’t include general fundraising through taking part in a sports event or activity
• Provided transport to help people other than family members take part
• Coached or instructed an individual or team(s) other than solely for family members
• Refereed, umpired, or officiated at a match, competition or event
• Administrative or committee role e.g. chairman, treasurer, social secretary, first aider, welfare officer
• Stewarded or marshalled• Provided any other help e.g. helping with
refreshments, sports kit or equipment.
Link to more information on measures and demographics
Notes
The Active Lives Adult Survey is a push-to-web survey.
Carried out by Ipsos MORI, it involves postal mailouts inviting participants to complete the survey online.
The survey can be completed on mobile or desktop devices. A paper questionnaire is also sent out to maximise response rates. More information on the survey can be found here.
Sample and weightingThe achieved sample was 177,735 (16+).
Data have been weighted to Office for National Statistics (ONS) population measures for geography and key demographics.
Confidence intervals can be found in the linked tables. These indicate that if repeated samples were taken and confidence intervals computed for each sample, 95% of the intervals would contain the true value. Only significant differences are reported within the commentary. Where results are reported as being the same for two groups, any differences fall within the margin of error.
Significance tests can be found in the linked tables. The tests indicate that if repeated samples were taken, 95% of the time we would get similar findings, i.e. we can be confident that the differences seen in our sampled respondents are reflective of the population. When sample sizes are smaller, confidence intervals are larger, meaning differences between estimates need to be greater to be considered statistically significant.
Population totals are estimated values and have been calculated using ONS mid-2015, mid-2016, mid-2017, mid-2018 and mid-2019 estimates. Confidence intervals also apply to these. More detail can be found here.
55
Link to more information on measures and demographics
Notes
Link to more information on measures and demographics
Sport spectatingWhilst not covered in this report, data tables showing the number of people attending live sports events form part of this release.
VolunteeringThe volunteering questions were updated in year five to provide more detailed data on the frequency, duration and longevity of volunteers. As such, there’s no comparison data available with earlier years of the survey.
LonelinessData collection was extended to the full sample for year five, however this uncovered an ordering effect with the questions following the outcomes data. As such, only data not impacted is presented.
Data considerations
How we measure changeActive Lives figures are based on the response of 177,735 adults, which we then scale up to provide an England-wide picture. That means there’ll naturally be small fluctuations when we compare the figures we have now with 12 months ago.
In accordance with Government Statistical Service good practice guidance, we highlight changes within the report where we're confident there are genuine differences. If the data is showing only small differences which are within the margin of error, they’re noted as “no change”.
Where we comment on change this refers to a percentage point (absolute) change.
Suppressed dataDuring the first six months of surveying, a number of respondents were double counting a gym session and the individual activities they did within the gym. We resolved this problem by rewording the question from May 2016. Due to exercise bike being counted within cycling for leisure and sport, this means we can’t report November 15/16 data for either fitness activities or cycling for leisure and sport.
AssociationsWhere associations between wellbeing, individual and community development and engagement in sport and physical activity are referenced, this doesn’t tell us about causality. We don’t know the direction of the association or whether we’re seeing a direct or indirect link.
Link to data tables
56
Notes
Link to more information on measures and demographics
Health Survey for EnglandThe Health Survey for England (HSE) was designed to monitor trends in the nation's health, estimating the proportion of people in England who have specified health conditions, and the prevalence of risk factors and behaviours associated with these conditions.
The HSE includes core questions and modules of questions on topics that vary from year to year. Physical activity including muscle strength questions were last included in 2016 and achieved a sample of 8,011 adults.
Unlike Active Lives, the HSE is a face-to-face survey with a mix of interviews and self-completion. The physical activity questions were part of the interview which differs from the self-completion method of Active Lives.
Further details on the methodology can be found here.
You can view the data here.
Measuring Muscle Strength Collecting the dataData contained in this report, covering mid-November 2019 to mid-November 2020, represents the first data recorded from Active Lives measuring muscle strength. The muscle strength question used, matches that used in the Health Survey for England (HSE) whereby respondents are asked a follow up question for each activity they select to establish whether the activity causes muscle tension.
Muscle tension is where the effort of that activity was usually enough to make their muscles feel some tension, shake or feel warm.
Reasons for DifferencesThe HSE (28%) reports a notably lower prevalence of muscle strengthening activity as compared to Active Lives (64%). For the reasons set out below, and methodological differences highlighted in the left panel, these two data sources are not comparable.1. Whilst both surveys assume muscle tension for some activities such as
football, running and water sports, Active Lives includes additional activities where muscle tension is assumed. This followed an initial review of responses, where it was found that most respondents reported them as muscle strengthening activities. Activities in this category include most fitness activities, boxing and martial arts, netball and hockey.
2. Whilst neither survey includes activity that forms part of work activity, housework or heavy manual gardening or DIY as part of their muscle strength estimates, HSE also doesn’t include walking whereas Active Lives includes it where the respondent reports muscle tension. Whilst only around a third of those walking report muscle tension, the high prevalence of this activity accounts for the majority of the differences between the two estimates.
Link to data tables
57