activation of thermogenesis in brown adipose tissue and
TRANSCRIPT
Cancer Research Tsoli et al
1
Activation of Thermogenesis in Brown Adipose Tissue and Dysregulated Lipid
Metabolism Associated with Cancer Cachexia in Mice.
Maria Tsoli1*, Melissa Moore1*, Dominic Burg1, Arran Painter1, Ryland Taylor1, Sarah H.
Lockie2, Nigel Turner3, Alessandra Warren4, Greg Cooney3, Brian Oldfield2, Stephen Clarke5
and Graham Robertson1
Affiliations:
1Cancer Pharmacology Unit, ANZAC Research Institute, Concord Repatriation General
Hospital, Hospital Road, Concord, NSW, 2139, Australia
2Department of Physiology, Monash University, Wellington Road, Clayton, VIC, 3800,
Australia
3Garvan Institute of Medical Research, 384 Victoria Street, Darlinghurst, NSW, 2010,
Australia
4Centre for Education and Research on Ageing, ANZAC Research Institute, Concord
Repatriation General Hospital, Hospital Road, Concord, NSW, 2139, Australia
5Northern Clinical School, University of Sydney, Royal North Shore Hospital, Reserve Road,
St Leonards, NSW, 2065, Australia
Correspondence to:
Maria Tsoli, PhD
Cancer Pharmacology Unit,
Anzac Research Institute
Concord Repatriation General Hospital,
Hospital Road, Concord, NSW, 2139, Australia
Research. on January 22, 2019. © 2012 American Association for Cancercancerres.aacrjournals.org Downloaded from
Author manuscripts have been peer reviewed and accepted for publication but have not yet been edited. Author Manuscript Published OnlineFirst on June 19, 2012; DOI: 10.1158/0008-5472.CAN-11-3536

Cancer Research Tsoli et al
2
Email: [email protected]
Phone: +61 2 9767 9847
Fax: +61 2 9767 9860
and
Graham Robertson, PhD
Cancer Pharmacology Unit,
Anzac Research Institute
Concord Repatriation General Hospital,
Hospital Road, Concord, NSW, 2139, Australia
Email: [email protected]
Phone: +61 2 9767 9816
Fax: +61 2 9767 9860
* These two authors contributed equally
Running title: Brown adipose tissue activation in cancer cachexia syndrome
Key words: cancer cachexia, brown adipose tissue, thermogenesis, diurnal rhythm, lipid
metabolism
ABBREVIATIONS
AP2: fatty acid binding protein 2
BAT: brown adipose tissue
BMI: body mass index
CCS: cancer cachexia syndrome
Research. on January 22, 2019. © 2012 American Association for Cancercancerres.aacrjournals.org Downloaded from
Author manuscripts have been peer reviewed and accepted for publication but have not yet been edited. Author Manuscript Published OnlineFirst on June 19, 2012; DOI: 10.1158/0008-5472.CAN-11-3536

Cancer Research Tsoli et al
3
CD36: cluster of differentiation 36
C26: colon 26 adenocarcinoma
C/EBPα: CCAAT/enhancer-binding protein alpha
CPT1a: carnitine palmitoyltransferase 1a
DGAT2: diacylglycerol O-acyltransferase
ELOVL3: elongation of very long chain fatty acids
FAS: fatty acid synthase
18FDG: [18F]fluorodeoxyglucose
GYK: glycerol kinase
IL-6: interleukin-6
INFγ: interferon gamma
LPL: lipoprotein lipase
TNFα: tumour necrosis alpha
UCP1: uncoupling protein 1
PBE: peroxisomal bifunctional enzyme
PPAR: peroxisome proliferator-activated receptor
PGC1α: peroxisome proliferator-activated receptor gamma coactivator 1-alpha
PET: positron emission tomography
RER: respiratory exchange rate
The authors declare no conflict of interest.
Research. on January 22, 2019. © 2012 American Association for Cancercancerres.aacrjournals.org Downloaded from
Author manuscripts have been peer reviewed and accepted for publication but have not yet been edited. Author Manuscript Published OnlineFirst on June 19, 2012; DOI: 10.1158/0008-5472.CAN-11-3536

Cancer Research Tsoli et al
4
ABSTRACT
Cancer cachexia/anorexia is a complex syndrome that involves profound metabolic
imbalances and is directly implicated as acause of death in at least 20-30% of all cancers.
Brown adipose tissue (BAT) plays a key role in thermogenesis and energy balance and
potentially contributes to the physiological perturbations associated with cachexia. In this
study, we investigated the impact of cachexia –inducing colorectal tumour on BAT in mice.
We found that brown adipocytes were smaller and exhibited profound delipidation in
cachectic tumour-bearing mice. Diurnal expression profiling of key regulators of lipid
accumulation and fatty acid beta-oxidation and their corresponding target genes revealed
dramatic molecular changes indicative of active BAT. Increased Ucp1, Pbe and
Cpt1α expression at specific points coincided with higher BAT temperatures during the dark
cycle, suggestive of a temporal stimulation of thermogenesis in cachexia. These changes
persisted when cachectic mice were acclimatized to 28°C, confirming inappropriate
stimulation of BAT despite thermoneutrality. Evidence of inflammatory signaling also was
observed in the BAT as an energetically wasteful, maladaptive response to anorexia during
the development of cachexia.
Research. on January 22, 2019. © 2012 American Association for Cancercancerres.aacrjournals.org Downloaded from
Author manuscripts have been peer reviewed and accepted for publication but have not yet been edited. Author Manuscript Published OnlineFirst on June 19, 2012; DOI: 10.1158/0008-5472.CAN-11-3536

Cancer Research Tsoli et al
5
INTRODUCTION
Cancer Cachexia Syndrome (CCS) is a progressive metabolic syndrome clinically
characterized by profound weight loss, fat depletion, skeletal muscle wasting and asthenia,
that are not solely attributable to inadequate nutritional intake (1). The incidence of this
debilitating condition varies with tumour type, and is more common in patients with upper
gastrointestinal, colorectal and lung cancer while uncommon in breast cancer. While cachexia
is implicated in ~30% of cancer deaths, it is also responsible for reduced quality of life and
increased health care costs in many other cancer patients (2). There are currently no
prognostic tests to indicate which cancer patients are at risk of developing cachexia, and once
clinical signs of cachexia are apparent there are no effective treatments.
The molecular mechanisms that produce the profound clinical manifestations of cancer
cachexia have not been elucidated. However, it is suspected that interactions between tumors
and metabolic organs, in particular muscle & adipose tissue, trigger catabolic events that
promote asthenia and depletion of lipid stores (3). In addition, it is unclear whether fat loss is
due to cachectic mediators produced by tumors or inappropriate action of endogenous
regulators in neuro/endocrine organs. Both experimental and clinical studies implicate
cytokines as mediators of catabolism during cancer cachexia (4, 5) and markers of systemic
inflammation have recently been incorporated into consensus clinical definitions of cachexia
in multiple clinical settings including cancer (6).
Adipose tissue plays a vital role in metabolic balance by acting as an energy reserve organ,
providing stored lipids to other tissues during periods of fasting or increased metabolic
demand. However, regions of BAT are not only lipid depots but can significantly contribute
to energy expenditure through diet- and cold-induced thermogenesis. Activation of BAT
thermogenesis is thought to be mediated by thyroid hormone and β3-adrenergic signaling
Research. on January 22, 2019. © 2012 American Association for Cancercancerres.aacrjournals.org Downloaded from
Author manuscripts have been peer reviewed and accepted for publication but have not yet been edited. Author Manuscript Published OnlineFirst on June 19, 2012; DOI: 10.1158/0008-5472.CAN-11-3536

Cancer Research Tsoli et al
6
pathways, which stimulate β-oxidation of fatty acids and heat production via the electron
transport chain-uncoupling protein UCP1. Until recently, the physiological function of BAT
was only thought to be relevant in small mammals and infants. However, recent reports
demonstrated activated BAT in adult humans acutely exposed to cold conditions and in up to
20% of cancer patients using 18F-FDG PET scans (7). In addition, BAT activity correlates
with BMI, with decreased BAT activation potential in obese vs. lean males (8-12). While
BAT has emerged as having a significant role in regulating energy balance and fat
accumulation in rodents and humans, its involvement in hypermetabolic diseases such as
cancer cachexia has not been extensively studied.
Energy homeostasis in metabolic organs is controlled by central and peripheral circadian
clocks through tight regulation of expression and activity of enzymes involved in metabolic
pathways (13). Apart from the core CLOCK-BMAL1-Reverbα mediated transcriptional
regulation, nuclear receptors have also been found to exhibit distinct diurnal expression
patterns in liver, muscle and BAT (14). Aberrant circadian rhythms result in hyperphagia,
obesity and features of the metabolic syndrome. High fat diets can also disrupt circadian
rhythms, and therefore further contribute to the metabolic syndrome (15, 16). Apart from the
ability of melatonin – a key factor in controlling diurnal rhythms –to reduce circulating levels
of TNF and IL6 in advanced cancer patients (17), little is known about whether circadian
regulation of metabolism occurs in cancer cachexia.
In this study we demonstrate activation of thermogenesis in BAT of cachectic mice bearing
C26 tumours. The diurnal expression pattern of transcription factors and target genes
involved in lipid metabolism and heat production in BAT showed distinct temporal changes
that coincide with increased BAT temperature. Therefore, the development of cancer
cachexia involves disruption of diurnal regulation of lipid homeostasis and thermogenesis in
Research. on January 22, 2019. © 2012 American Association for Cancercancerres.aacrjournals.org Downloaded from
Author manuscripts have been peer reviewed and accepted for publication but have not yet been edited. Author Manuscript Published OnlineFirst on June 19, 2012; DOI: 10.1158/0008-5472.CAN-11-3536

Cancer Research Tsoli et al
7
BAT. We also demonstrate evidence of cytokine signaling in BAT tissue implicating a role
for tumour induced systemic inflammation in modification of BAT physiology.
Research. on January 22, 2019. © 2012 American Association for Cancercancerres.aacrjournals.org Downloaded from
Author manuscripts have been peer reviewed and accepted for publication but have not yet been edited. Author Manuscript Published OnlineFirst on June 19, 2012; DOI: 10.1158/0008-5472.CAN-11-3536

Cancer Research Tsoli et al
8
MATERIALS AND METHODS
Cachectic Colon 26 cells were kindly provided by AMGEN (USA). The non-cachectic
variant of Colon 26 was supplied by Tohuku University (Japan). Both cell lines were grown
and maintained in RPMI medium (Invitrogen) containing 10% fetal bovine serum
(Invitrogen) and 100 μg/ml Penicillin / Streptomycin (Invitrogen) in a 5% CO2 environment.
Animal Studies
Pathogen-free, 8-10 week-old male and BALB/c*DBA/1 (F1 Hybrid) mice were purchased
from ARC, Perth (Australia), and kept at an ambient temperature of 22°C under a 12 hour
light cycle (6:00 am to 6:00 pm). Cachectic and non-cachectic colon 26 cells were inoculated
subcutaneously at 1x10⁶ cells/100 μl into the right flank of mice. Control mice were similarly
injected with 100 μl of RPMI medium containing antibiotics. Over a period of 14 days
following inoculation, body weight, food intake and tumor dimensions were recorded daily.
Tumor-bearing and free-fed control mice had ad libitum access to food. One group of control
mice was pair-fed to the food intake of cachectic C26-bearing group. Pair feeding was
achieved by giving each pair-fed control the previous days intake of its respective C26-
bearing animal. Mice were euthanased by cervical dislocation before harvesting tumors and
organs, which were snap frozen in liquid nitrogen. For the thermoneutrality experiments mice
were acclimated for 5 weeks at 28°C prior to inoculation with either cachectic colon 26
carcinoma cells or RPMI medium. The experimental protocol was then followed as described
above with the exception that the mice continued to be housed at 28°C for the duration of the
experiment until harvest. All animal experimentation was carried out according to the
Australian Code of Practice for the Care and Use of Animals for Scientific Purposes under
the Animal Research Regulation (2005) of NSW and under a protocol approved by the
Animal Welfare Committee of Sydney South-West Area Health Service.
Research. on January 22, 2019. © 2012 American Association for Cancercancerres.aacrjournals.org Downloaded from
Author manuscripts have been peer reviewed and accepted for publication but have not yet been edited. Author Manuscript Published OnlineFirst on June 19, 2012; DOI: 10.1158/0008-5472.CAN-11-3536

Cancer Research Tsoli et al
9
Plasma cytokine analysis
Plasma was collected from control, pair-fed and C26-bearing mice (cachectic and non-
cachectic clones) via cardiac puncture and placed in EDTA or heparin coated sample tubes to
prevent clotting. IL-6, TNFα and INFγ levels were measured using the RnD Biosystems
Quantkine Mouse IL-6, TNFα and INFγ ELISA Kits respectively (Bioscientific Australia).
Indirect calorimetry studies.
Oxygen consumption rate (Vo2) and respiratory exchange rate (RER) of individual mice was
determined using an eight-chamber indirect calorimeter (Oxymax series; Columbus
Instruments, Columbus, OH) as previously described (18).
Biotelemetry
Mice were anesthetized using 5% isoflurane in oxygen in an induction chamber, then
maintained on 2% isofluorane delivered by face mask. Temperature sensitive transmitters (E-
mitters, Mini Mitter, Bend, OR) were implanted into the interscapular BAT of the mice who
had previously had intracerebroventricular (ICV) cannulae implanted. Mice were shaved and
a 1 cm incision was made just posterior to the scapulae to reveal the hindmost section of the
white fat overlaying the interscapular area. A pocket was blunt dissected on the ventral side
of the white fat to access the brown fat underneath. The E-mitter was then placed in the
exposed pocket and the white fat sutured around the device. The wound was then sutured
closed. After surgery, the animals received a single subcutaneous dose of 5 mg/kg m
eloxiocam (Metacam, Boehringer Ingelheim) in a volume of 1 ml/kg and were maintained on
a heated pad until full recovery. Mice were then allowed at least four days recovery before
ICV injections and recording began. Temperature and activity data were collected via
receiver plate below the home cage and recorded on a PC.
Research. on January 22, 2019. © 2012 American Association for Cancercancerres.aacrjournals.org Downloaded from
Author manuscripts have been peer reviewed and accepted for publication but have not yet been edited. Author Manuscript Published OnlineFirst on June 19, 2012; DOI: 10.1158/0008-5472.CAN-11-3536

Cancer Research Tsoli et al
10
Adipose Tissue Histology and Microscopy
Brown adipose tissue samples were fixed in 10% formalin neutral buffered solution (Sigma-
Aldrich), embedded in paraffin wax, and 5-μm sections cut and mounted on glass slides.
After dehydration, the sections were stained with hematoxylin-eosin (H/E) for histological
examination. Histology was viewed by light microscopy and examined by CAST grid
software (Olympus Corp., Albertslund, Denmark). For electron microscopy brown adipose
fat pads were fixed in 2% Glutaraldehyde in PBS for 2 hours. The fixative was then removed
and tissue was rinsed with PBS. Fixed tissue was osmicated (1% OsO4/0.1 mol/L sodium
cacodylate buffer), dehydrated in an ethanol gradient to 100% and embedded in Spurr's resin.
Ultrathin sections (80nm thick), were obtained and viewed on a Phillips CM10 transmission
electron microscope.
Quantitative Real-Time PCR analysis
Total RNA was isolated using Trizol (Invitrogen) according to the manufacturer’s protocol.
First-strand cDNA was synthesized from 1 μg of total RNA using SuperScript III with
random primers (Invitrogen) and oligo(dT)12-14 (Invitrogen). All primer sequences were
BLASTed against the NCBI mouse genomic sequence database to ensure specificity for the
corresponding gene. Primer sequences will be provided upon request. qPCR reactions
contained 1.25 ng cDNA, 300 nM gene-specific primers and 12 μl SybrGreen (Invitrogen).
All reactions were performed using the Corbett Rotor Gene 6000 (Corbett Life Science).
Relative mRNA levels were calculated by the comparative threshold cycle method by using
Tfrc, Hmbs and 36b4 genes as the housekeeping controls (19). The results were then
expressed as fold changes of Ct (cycle threshold) value relative to controls.
Research. on January 22, 2019. © 2012 American Association for Cancercancerres.aacrjournals.org Downloaded from
Author manuscripts have been peer reviewed and accepted for publication but have not yet been edited. Author Manuscript Published OnlineFirst on June 19, 2012; DOI: 10.1158/0008-5472.CAN-11-3536

Cancer Research Tsoli et al
11
Western blotting
Whole-cell extracts were obtained using Cell Lysis Buffer according to manufacturer
protocol, (Cell Signaling Technologies) and were quantified by BCA protein acid assay kit
(Pierce). Mitochondrial extracts were obtained as described in (20). Proteins were resolved on
10% Tris-HCl SDS-PAGE gels (Bio-Rad), and blotted (iBlot, Invitrogen) as described by
manufacturers. Cell lysates were analyzed with the following antibodies: anti-signal
transducer and activator of transcription 3 (STAT3) and anti-phospho-STAT3-Ser727, anti-
uncoupling protein 1. All antibodies were obtained from Cell Signaling Technology.
Densitometric analysis was performed for western blots from three independent experiments
using ImageJ software. Expression values of phosphorylated signals were normalized with
corresponding total expression and indicated as fold change over the controls.
Statistical Analysis
Data are presented as the mean ± S.E.M. One-way ANOVA followed by Tukey’s multiple
comparison tests were used to assess statistical significance between groups. Differences at P
< 0.05 were considered to be statistically significant. ANCOVA was performed using SPSS
for Mac OS X v16.0.1 (SPSS Inc, Chicago, IL, USA) with the final body mass as covariate
and n=7 mice for each group. Other calculations were performed with Minitab statistical
software.
Research. on January 22, 2019. © 2012 American Association for Cancercancerres.aacrjournals.org Downloaded from
Author manuscripts have been peer reviewed and accepted for publication but have not yet been edited. Author Manuscript Published OnlineFirst on June 19, 2012; DOI: 10.1158/0008-5472.CAN-11-3536

Cancer Research Tsoli et al
12
RESULTS
Colon-26 adenocarcinoma affects body weight, food intake and brown adipose tissue
mass while maintaining energy expenditure. A significant loss of body weight (Fig. 1A),
accompanied by decreased food intake and BAT mass (Fig. 1B-C), occurred 14 days after
C26 tumour inoculation. In contrast, pair-fed controls experienced only a moderate reduction
in body weight and BAT mass indicating that anorexia alone could not completely account
for the weight change in cachectic mice (Fig. 1A-B). To differentiate the impact of cachexia
from the indirect effects of reduced food intake on energy expenditure, oxygen consumption
and respiratory exchange ratio (RER) were measured in C26-tumour bearing mice, calorie-
restricted and control mice. Diurnal oxygen consumption was identical between control and
cachectic animals (Fig. S1A) while RER reduced to ~0.72 in C26 tumour-bearing animals,
indicating lipids as the predominant fuel source (Fig. S1B). The effect of food-restriction on
energy expenditure was examined over a shorter period of time, in an effort to minimize the
technical difficulties in precise food delivery to pair-fed animals housed in metabolic cages.
Non-tumour bearing mice were presented with the same amount of food ingested by C26
tumour-bearing mice corresponding to days 11, 12 and 13 post-tumor inoculation. A striking
reduction in oxygen consumption in food-restricted animals during the entry to light cycle
(Fig. S1C) coincided with milder reduction in RER compared to cachectic mice (Fig. S1D).
When energy expenditure/heat production was calculated as kcals/mouse over the final 3
days of C26 tumor growth or food restriction, both groups were less than the corresponding
control mice (Fig 1D and 1E). This is likely due to the progressive reductions in body
weights in cachectic and calorie-restricted mice compared to ad lib fed control mice.
However when the total energy expenditure over the final 12hr of the testing period is
compared using ANCOVA with final body weight as covariate, there is a significant
difference between cachectic C26 and pair-fed mice at the common body weight of 24.4g
Research. on January 22, 2019. © 2012 American Association for Cancercancerres.aacrjournals.org Downloaded from
Author manuscripts have been peer reviewed and accepted for publication but have not yet been edited. Author Manuscript Published OnlineFirst on June 19, 2012; DOI: 10.1158/0008-5472.CAN-11-3536

Cancer Research Tsoli et al
13
(Fig. 1F). BAT tissue showed significant morphological alterations in cachectic mice (Fig.
1Giii) with apparent reductions in adipocyte size compared to free-fed and pair-fed controls
(Fig. 1Gi-ii). Additional examination of BAT by transmission electron microscopy confirmed
the reduction in fat droplet area in cachectic mice (Fig. 1Hii).
Cytokine signaling in BAT of cachectic C26 tumour-bearing mice. It is widely believed
that pro-inflammatory cytokines are crucial for the development of cancer cachexia (6). We
therefore examined the levels of IL-6, TNFα and INFγ in the plasma of C26-bearing mice.
Consistent with previous studies, IL-6 concentrations were elevated in plasma from cachectic
mice (Fig. 2A) while TNFα and INFγ were below the detection limit (data not shown).
Increased expression of the IL-6 receptor and SOCS3 genes was apparent in BAT of C26
tumour-bearing mice (Fig. 2C-D). Further evidence for cytokine signaling via the JAK/STAT
pathway was shown by substantially higher phosphorylation and hence activation of STAT3
within BAT of cachectic C26 mice compared to the minor change apparent in pair-fed mice
(Fig. 2D). In order to differentiate the effect of tumour-derived cytokines on BAT from a
non-cachectic cancer setting, we investigated the impact of a variant of the colon 26 tumour
cell line that does not elicit cachexia. Despite the comparable growth of the non-cachectic
C26 tumor, plasma IL6 levels were significantly lower while overall body, BAT weights and
mRNA expression levels of IL6Ra and SOCS3 were unchanged (Fig 3.).
Perturbed diurnal expression pattern of lipid uptake and accumulation pathways in
cachectic mice. To examine the impact of cancer-induced cachexia on lipid handling and de
novo synthesis of fatty acids in brown adipocytes, we investigated the diurnal expression
profile of metabolic genes and nuclear receptors at 6 timepoints in the light-dark cycle.
Lipoprotein lipase (LPL), the major enzyme involved in hydrolysis of lipoproteins to release
Research. on January 22, 2019. © 2012 American Association for Cancercancerres.aacrjournals.org Downloaded from
Author manuscripts have been peer reviewed and accepted for publication but have not yet been edited. Author Manuscript Published OnlineFirst on June 19, 2012; DOI: 10.1158/0008-5472.CAN-11-3536

Cancer Research Tsoli et al
14
fatty acids for uptake into cells, normally exhibits a daily rhythm in BAT reaching its
maximum peak during the dark cycle at 10pm (Fig. 4A). Cachexia resulted in four-fold
higher expression as well as loss of cycling of Lpl. There was no significant impact of
cachexia on fatty acid transporter CD36 or carrier protein AP2. In control mice, Pparγ and
associated target genes in lipogenic and adipogenic pathways peaked during the light cycle,
while in the tumor-bearing animals Pparγ, C/ebpα, Fas, Dgat2 and Perilipin lost rhythmicity
and were markedly decreased in BAT at several time points (Fig. 4B).
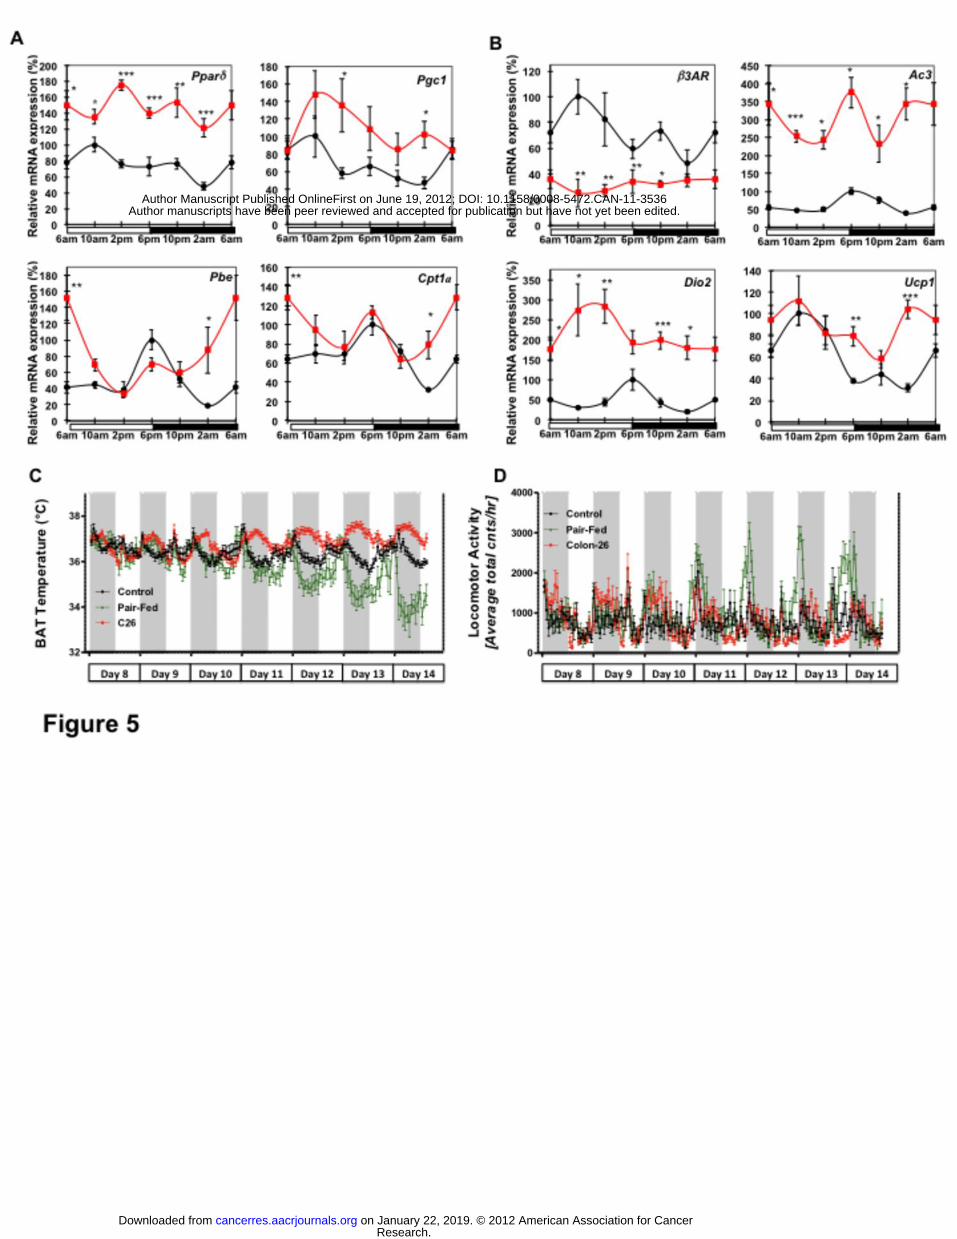
Altered diurnal expression of lipid utilization and thermogenesis pathways in cachectic
mice. An important function of BAT is dissipation of energy in the form of heat through
activation of fatty acid β-oxidation and thermogenic pathways. To understand the role of
BAT in energy expenditure during cancer cachexia, we investigated the diurnal expression of
transcription factors involved in regulating fatty acid catabolism and corresponding target
genes (Fig. 5A). Pparδ normally has a diurnal oscillation peaking at 10am, while in cachectic
mice this diurnal cycling was disrupted with higher expression at all time points. Pgc1, a key
regulator of fatty acid metabolism, mitochondrial biogenesis & thermogenesis, maintained its
diurnal peak at 10am but was elevated at most timepoints (Fig. 5A). PPARδ target genes
peroxisomal bifunctional enzyme (PBE) and mitochondrial carnitine palmitoyl transferase
1α (Cpt1α) exhibited a similar diurnal peak at early dark cycle (6pm) with a 3-4 fold
amplitude in healthy mice. BAT from cachectic mice showed higher abundance of both Pbe
and Cpt1α mRNAs, as well as a significant 12-hour phase advance peaking at 6am. There
was no change in expression of Pbe, Pgc1 and Pparδ in pair-fed mice (supplementary Figure
S1).
Consistent with previous studies (17), key mediators of the thermogenic program in BAT
exhibited oscillatory patterns at specific times of the diurnal cycle (Fig. 5B). β3 adrenergic
Research. on January 22, 2019. © 2012 American Association for Cancercancerres.aacrjournals.org Downloaded from
Author manuscripts have been peer reviewed and accepted for publication but have not yet been edited. Author Manuscript Published OnlineFirst on June 19, 2012; DOI: 10.1158/0008-5472.CAN-11-3536

Cancer Research Tsoli et al
15
receptor (β3AR) transcripts peaked during the light cycle, however in cachectic animals this
rhythm was attenuated and expression levels were reduced. Mediators of β3AR downstream
signaling - adenylate cyclase 3 (Ac3) and deiodinase type 2 (Dio2) - behaved similarly at the
mRNA level in healthy animals, peaking at 6pm. But in cachectic mice, the rhythmic
expression was disrupted and was significantly higher at all time points. In control mice, the
essential mediator of heat production in BAT – Ucp1 - displayed a diurnal pattern similar to
β3AR. However in cachectic mice, the Ucp1 transcript lost its daily oscillation with maximal
expression shifted towards the dark cycle. In contrast in pair-fed mice Ucp1 expression was
reduced at 2pm (Fig. S1). These data provide compelling evidence that cachectic animals
exhibited increased expression of genes involved in energy expenditure and non-shivering
thermogenesis. Furthermore, the expression of genes such as Ucp1 involved in lipolysis and
thermogenesis is unaltered in BAT of mice with the non-cachectic C26 tumor (Figure S2)
that doesn’t produce IL-6 (Figure 3).
To determine whether these changes in gene expression coincided with heat production in
cachectic animals we assessed BAT temperature using biotelemetry devices (Fig. 5C-D).
Implanted telemetry devices recorded that C26 tumour-bearing mice exhibited elevated BAT
temperatures, particularly during the dark cycle, between days 10-14 (Fig. 5C). BAT
temperature was ~3-4ºC higher in cachectic mice than in the pair-fed group. Pair fed animals
had the lowest temperatures, which is in accord with the expected response to conserve
energy during caloric restriction. In addition, physical activity appeared unchanged or even
slightly reduced on days 11-13 in the cachectic mice indicating the source of increased
temperature is unlikely to be heat from skeletal muscle activity (Fig. 5D). In contrast, pair-fed
animals exhibited excessive physical activity despite reduced BAT temperature, likely due to
foraging behavior. Therefore, activation of BAT in C26 tumour-bearing mice leads to
inappropriate production of heat.
Research. on January 22, 2019. © 2012 American Association for Cancercancerres.aacrjournals.org Downloaded from
Author manuscripts have been peer reviewed and accepted for publication but have not yet been edited. Author Manuscript Published OnlineFirst on June 19, 2012; DOI: 10.1158/0008-5472.CAN-11-3536

Cancer Research Tsoli et al
16
Activation of thermogenic program in BAT of cachectic mice persists at thermoneutral
temperatures. To determine whether activation of BAT is due to an inability to maintain
core body temperature when cachectic mice are housed under the mild cold stress of 22oC,
we acclimatized the cachectic C26 mice to thermoneutral conditions - defined as a
temperature (eg 28oC for mice) at which thermogenesis from mitochondrial electron transport
chain uncoupling in BAT is not required. Similar to the previous experiments with mice
housed at 22oC (Fig. 5), β3ar transcripts remained at lower levels in C26-bearing animals
acclimated to thermoneutrality than in free- and pair-fed controls (Fig. 6). Ucp1, Ac3 and
Dio2 exhibited significantly higher levels in cachectic mice, unlike food-restricted animals.
In contrast to experiments performed at 22°C, Ucp1 expression at 28oC was significantly
higher at both 2pm and 2am. Other genes known to be up-regulated during adaptation to cold
conditions such as glycerol kinase (GYK) and elongation of very long chain fatty acids-like 3
(Elovl3) were also increased in cachectic mice at 28°C.
We assessed UCP1 protein abundance to determine whether the cumulative, temporal-
specific increments in Ucp1 mRNA in BAT during the development of cachexia results in a
net increase of UCP1 protein. Mitochondrial protein preparations of BAT from cachectic
animals contained significantly more UCP1 protein compared to controls, while pair-fed
mice had decreased mitochondrial UCP1 protein (Fig. 6B-C). Interestingly, the total
mitochondrial protein yield per BAT in pair-fed mice was significantly reduced relative to
control mice (Fig. 6D), presumably as part of the normal response to conserve energy by
dampening BAT activity when calorie intake is chronically restricted. Therefore, when total
UCP1 protein content is expressed per BAT organ (Fig. 6E), the increase exhibited by
cachectic C26 tumour-bearing mice is even more striking when compared to pair-fed mice.
Research. on January 22, 2019. © 2012 American Association for Cancercancerres.aacrjournals.org Downloaded from
Author manuscripts have been peer reviewed and accepted for publication but have not yet been edited. Author Manuscript Published OnlineFirst on June 19, 2012; DOI: 10.1158/0008-5472.CAN-11-3536
Cancer Research Tsoli et al
17
DISCUSSION
The importance of weight loss in cancer has been recognized for many years and has been
generally attributed to muscle wasting and fat depletion (21). Earlier studies investigated
limited molecular features of BAT in tumor-bearing or cytokine-administered animals (22-
27). However, no systematic evaluation of lipid regulatory and metabolic genes in BAT,
combined with energy expenditure and temperature assessment, has been performed in mice
that exhibit sufficient features of cancer cachexia to satisfy the consensus clinical definition
(6). Furthermore, diurnal regulation of thermogenesis in BAT has not been considered in
cancer or other disease settings. We demonstrate, for the first time, thermogenic activation of
BAT in cachectic animals that cannot be attributed to the effects of reduced food intake or
inability to maintain core body temperature.
Since anorexia is associated with cachexia in cancer patients, we assessed changes in pair-fed
animals presented with the same progressive food reduction as cachectic mice. The profound
delipidation of BAT and increased expression of molecular regulators of lipid metabolism
and target genes were not evident in pair-fed mice (Fig. 6 & S2). Indeed, UCP1 - the
hallmark of thermogenic activation in BAT - was reduced at both mRNA and protein levels
in response to food restriction while being increased in cachexia (Fig. 6). The observation
that anorectic C26 cachectic mice maintain whole body energy expenditure at a higher level
than corresponding sized calorie-restricted mice (Fig 1F & S1) while showing increased BAT
and body surface temperatures provides further evidence of energetically wasteful processes
in cachectic animals. This directly contrasts the effort to conserve energy in response to
reduced calorie intake observed in pair-fed mice (Fig. 1 & 5). This apparent maladaptive
response to caloric restriction in cachexia could have clinical relevance, as hypermetabolism
is prominent in certain cancers such as lung, pancreatic, and leukemia (28, 29). The changes
in the diurnal pattern of gene expression in BAT of cachectic mice are striking, especially the
Research. on January 22, 2019. © 2012 American Association for Cancercancerres.aacrjournals.org Downloaded from
Author manuscripts have been peer reviewed and accepted for publication but have not yet been edited. Author Manuscript Published OnlineFirst on June 19, 2012; DOI: 10.1158/0008-5472.CAN-11-3536

Cancer Research Tsoli et al
18
increases in Pbe, Cpt1α and Ucp1 that coincide with elevated BAT temperatures during the
dark cycle when heat generation from increased physical activity would normally diminish
the requirement for BAT-mediated thermogenesis. To our knowledge this is the first
demonstration of altered diurnal expression of genes involved in lipid metabolism and
thermogenesis linked to diurnal increases in BAT temperature due to cancer. Most of the
genes examined in this study normally exhibit a diurnal rhythm, peaking either during the
light cycle or at entry to the dark cycle (14). A recent study by Zvonic et al (30) found ~5,000
genes rhythmically expressed in BAT indicating synchronization of diurnal functions with
physiological processes mediated primarily by circadian clock regulators and nuclear
receptors (31). C26 tumour-bearing mice exhibited disrupted diurnal rhythmicity and phase
shifting in BAT indicative of diminished de novo synthesis and storage of lipids (Pparγ,
C/ebpα, Fas, Dgat2, Perilipin), increased uptake of lipids for β-oxidation rather than storage
(Lpl) and energy expenditure (Pparδ). It will be interesting to explore the interplay of
cytokine & neuro-endocrine signals responsible for the temporal coupling of increased BAT
temperatures with up-regulated Ucp1, Pbe and Cpt1α expression alongside the uniform
changes in thermogenic regulators Pgc1α, Ac3, β3ar and Dio2.
Our initial findings of activation of BAT in cachexia were derived from experiments with
tumour-bearing mice housed at 22ºC, a temperature that elicits mild chronic cold stress.
Therefore, it is possible that this response may be due to an inability of cachectic mice to
maintain core body temperature, as observed in hypothermic MAC16 tumour-bearing mice
that had increased UCP1 (32). To distinguish whether the observed changes in BAT are due
to such a compensatory adaptation or a more active signal emanating directly from the
tumour, we housed the cachectic C26 mice under thermoneutral conditions - defined as a
temperature (eg 28-30oC for mice) at which obligatory heat dissipation is sufficient to defend
normothermic body temperature without thermoregulatory heat production. The changes in
Research. on January 22, 2019. © 2012 American Association for Cancercancerres.aacrjournals.org Downloaded from
Author manuscripts have been peer reviewed and accepted for publication but have not yet been edited. Author Manuscript Published OnlineFirst on June 19, 2012; DOI: 10.1158/0008-5472.CAN-11-3536

Cancer Research Tsoli et al
19
cachectic mice persisted at thermoneutrality (Fig. 6) and were even greater than those
apparent at 22oC relative to both control and pair-fed mice. Furthermore, expression of 2
genes associated with BAT-hypertrophy during cold conditions (33), Elovl3 and Gyk were
also increased. The value of performing such investigations of complex metabolic
syndromes involving energy imbalance at thermoneutrality is reinforced by recent studies
with Ucp1 knockout mice that defined a role for UCP1 in diet-induced thermogenesis (34).
This finding had eluded previous attempts at uncovering a phenotype for UCP1 when mice
were acclimated to normal animal housing temperatures (35).
While the type of tumour, stage and duration of disease can influence resting energy
expenditure, the systemic inflammatory status may also play an important role as high levels
of cytokines and acute phase proteins have been observed in hypermetabolic patients with
lung and pancreatic cancer (36, 37). Since cytokines are considered etiologic factors of
cancer-induced energy wastage, as well as part of the consensus clinical definition of
cachexia (5, 6), we investigated their potential involvement in the C26 model and observed
plasma IL-6 levels within the range reported in cancer patients. IL-6 may enhance
thermogenesis via direct action on BAT or by sympathetic nervous system (SNS) stimulation.
For example, ventricular administration or hypothalamic expression of IL-6 increased energy
expenditure, lipolysis & UCP1 expression via the SNS (38, 39). However, IL-6 induced fat-
burning can also be exerted by an SNS-independent mechanism such as AMPK activation
(40). Another pathway by which IL-6 could mediate direct effects on BAT is via MAP
kinases. In response to SNS stimulation catecholamines signal through β-adrenergic receptors
to enhance thermogenesis in BAT by activating p38 MAPK, thereby increasing
mitochondrial biogenesis, expression of Pgc1α and Ucp1 and uncoupling (41, 42). The
recent demonstration of a parallel pathway involving systemic cardiac derived natriuretic
Research. on January 22, 2019. © 2012 American Association for Cancercancerres.aacrjournals.org Downloaded from
Author manuscripts have been peer reviewed and accepted for publication but have not yet been edited. Author Manuscript Published OnlineFirst on June 19, 2012; DOI: 10.1158/0008-5472.CAN-11-3536

Cancer Research Tsoli et al
20
peptides, cGMP and protein kinase B, that also operates via p38 (43) further highlights the
importance of MAPKs in BAT thermogenic regulation. As IL-6 is a potent activator of
MAPKs via Ras/raf, it may bypass the β−adrenergic and natriuretic protein receptors and
their downstream effectors cAMP/PKA and cGMP/PKG to up-regulate UCP1. Increased
UCP1 mRNA and protein abundance may augment net UCP1 uncoupling activity promoted
by elevated fatty acid availability in brown adipocytes due to enhanced lipolysis.
While the effects of IL-6 through the SNS have not been investigated in the present study,
our work supports the concept of cytokine-driven hypermetabolism and fat depletion in the
cachectic animals. The exploration of the differences between cachectogenic and non-
cachectogenic variants of the colon 26 tumour provides further intriguing evidence of
cytokine involvement in BAT activation. This is evident in the failure of the non-
cachectogenic, C26 variant to affect BAT (Fig. 3 & S3) coupled with a lack of corresponding
circulating cytokines. Further studies into IL-6 or other cytokine signaling cascades operative
in BAT of cachectic animals are required to define the links between tumour-derived
cytokines and enhanced thermogenesis in cancer.
Clinical studies have found an association between cancer cachexia, systemic cytokines and
fever (44). In particular, leukemia/lymphoma patients with B-symptoms (night sweats,
weight loss and fever > 380C) have elevated C-reactive protein together with reduced survival
compared to patients without B-symptoms (45). These issues also occur in pediatric
malignancies where there is greater concern due to the limited energy reserves and higher
nutrient requirements in children (46). Despite the longstanding awareness of BAT in
newborns and recent confirmation in adults through 18FDG PET imaging (8, 10, 11), there is
no information about the association of active brown fat, plasma cytokines or CRP levels and
weight loss in cancer patients. An early study found morphological evidence of brown
adipose tissue in the peri-renal fat pad from 80% of cancer patients with cachexia (47). In
Research. on January 22, 2019. © 2012 American Association for Cancercancerres.aacrjournals.org Downloaded from
Author manuscripts have been peer reviewed and accepted for publication but have not yet been edited. Author Manuscript Published OnlineFirst on June 19, 2012; DOI: 10.1158/0008-5472.CAN-11-3536

Cancer Research Tsoli et al
21
view of the high prevalence of functionally active BAT in cancer patients, which approached
20% after serial PET scans (7), it will be interesting to correlate weight loss & inflammatory
markers with activated BAT in sequential PET scans. Nevertheless, we cannot rule out the
impact of other unidentified, yet tumor-derived factors or the involvement of SNS system on
BAT activation.
In conclusion, based on these studies in a clinically relevant murine model of cachexia,
reduced food intake is not the sole mechanism leading to weight loss during the development
of cachexia. Rather, dysregulated diurnal expression of transcription factors that control lipid
metabolism and thermogenesis in brown adipose tissue are likely to contribute to the fat
depletion, elevated temperatures and hypermetabolic state of cancer cachexia.
ACKNOWLEDGEMENTS
This work was funded by the SCRIPT Cancer Institute NSW Translational Program Grant for
Colorectal Cancer (#06/TPG/1-02). We would like to thank the MPU facility at the ANZAC
Research Institute for their technical support, the Garvan Institute and Monash University
Animal Services and AMGEN for supplying the C26 tumour cells. We would also like to
acknowledge Drs Glen Reid and Noeris Salam for reading this manuscript and Dr Erdahl
Teber for advice on statistics.
Research. on January 22, 2019. © 2012 American Association for Cancercancerres.aacrjournals.org Downloaded from
Author manuscripts have been peer reviewed and accepted for publication but have not yet been edited. Author Manuscript Published OnlineFirst on June 19, 2012; DOI: 10.1158/0008-5472.CAN-11-3536

Cancer Research Tsoli et al
22
REFERENCES
1. Bruera E. ABC of palliative care. Anorexia, cachexia, and nutrition. Br Med J.
1997;315:1219-22.
2. Palesty JA, Dudrick SJ. What we have learned about cachexia in gastrointestinal
cancer. Dig Dis. 2003;21:198-213.
3. Skipworth RJE, Stewart GD, Dejong CHC, Preston T, Fearon KCH. Pathophysiology
of cancer cachexia: much more than host-tumour interaction? Clin Nutr. 2007;26:667-76.
4. Bennani-Baiti N, Davis MP. Cytokines and cancer anorexia cachexia syndrome. Am J
Hosp Palliat Care. 2008;25:407-11.
5. Carson JA, Baltgalvis KA. Interleukin 6 as a key regulator of muscle mass during
cachexia. Exerc Sport Sci Rev. 2010;38:168-76.
6. Evans WJ, Morley JE, Argilés J, Bales C, Baracos V, Guttridge D, et al. Cachexia: a
new definition. Clin Nutr. 2008;27:793-9.
7. Lee P, Greenfield JR, Ho KKY, Fulham MJ. A critical appraisal of the prevalence and
metabolic significance of brown adipose tissue in adult humans. Am J Physiol Endocrinol
Metab. 2010;299:E601-6.
8. Cypess AM, Lehman S, Williams G, Tal I, Rodman D, Goldfine AB, et al.
Identification and importance of brown adipose tissue in adult humans. N Engl J Med.
2009;360:1509-17.
9. Nedergaard J, Bengtsson T, Cannon B. Unexpected evidence for active brown
adipose tissue in adult humans. Am J Physiol Endocrinol Metab. 2007;293:E444-52.
10. van Marken Lichtenbelt WD, Vanhommerig JW, Smulders NM, Drossaerts JMAFL,
Kemerink GJ, Bouvy ND, et al. Cold-activated brown adipose tissue in healthy men. N Engl
J Med. 2009;360:1500-8.
Research. on January 22, 2019. © 2012 American Association for Cancercancerres.aacrjournals.org Downloaded from
Author manuscripts have been peer reviewed and accepted for publication but have not yet been edited. Author Manuscript Published OnlineFirst on June 19, 2012; DOI: 10.1158/0008-5472.CAN-11-3536

Cancer Research Tsoli et al
23
11. Virtanen KA, Lidell ME, Orava J, Heglind M, Westergren R, Niemi T, et al.
Functional brown adipose tissue in healthy adults. N Engl J Med. 2009;360:1518-25.
12. Yoneshiro T, Aita S, Matsushita M, Kameya T, Nakada K, Kawai Y, et al. Brown
adipose tissue, Whole-Body Energy Expenditure, and Thermogenesis in Healthy Adult Men.
Obesity. 2010:1-4.
13. Maury E, Ramsey KM, Bass J. Circadian Rhythms and Metabolic Syndrome: From
Experimental Genetics to Human Disease. Circ Res. 2010;106:447-62.
14. Yang X, Downes M, Yu RT, Bookout AL, He W, Straume M, et al. Nuclear receptor
expression links the circadian clock to metabolism. Cell. 2006;126:801-10.
15. Kennaway DJ, Owens JA, Voultsios A, Boden MJ, Varcoe TJ. Metabolic homeostasis
in mice with disrupted Clock gene expression in peripheral tissues. Am J Physiol Regul
Integr Comp Physiol. 2007;293:R1528-R37.
16. Kohsaka A, Laposky AD, Ramsey KM, Estrada C, Joshu C, Kobayashi Y, et al. High-
fat diet disrupts behavioral and molecular circadian rhythms in mice. Cell Metab.
2007;6:414-21.
17. Mahmoud F, Sarhill N, A MM. The therapeutic application of melatonin in supportive
care and palliative medicine. Am J Hosp Palliat Care. 2005;22:295-309.
18. Turner N, Bruce CR, Beale SM, Hoehn KL, So T, Rolph MS, et al. Excess lipid
availability increases mitochondrial fatty acid oxidative capacity in muscle: evidence against
a role for reduced fatty acid oxidation in lipid-induced insulin resistance in rodents. Diabetes.
2007;56:2085-92.
19. Vandesompele J, De Preter K, Pattyn F, Poppe B, Van Roy N, De Paepe A, et al.
Accurate normalization of real-time quantitative RT-PCR data by geometric averaging of
multiple internal control genes. Genome Biol. 2002;3:RESEARCH0034.
Research. on January 22, 2019. © 2012 American Association for Cancercancerres.aacrjournals.org Downloaded from
Author manuscripts have been peer reviewed and accepted for publication but have not yet been edited. Author Manuscript Published OnlineFirst on June 19, 2012; DOI: 10.1158/0008-5472.CAN-11-3536

Cancer Research Tsoli et al
24
20. Cannon B, Lindberg O. Mitochondria from brown adipose tissue: isolation and
properties. Methods Enzymol. 1979;55:65-78.
21. Fearon KCH. Cancer cachexia: developing multimodal therapy for a
multidimensional problem. Eur J Cancer. 2008;44:1124-32.
22. Arruda AP, Milanski M, Romanatto T, Solon C, Coope A, Alberici LC, et al.
Hypothalamic actions of tumor necrosis factor provide the thermogenic core for the wastage
syndrome in cachexia. Endocrinology. 2010;151:683-94.
23. Bing C, Russell S, Becket E, Pope M, Tisdale MJ, Trayhurn P, et al. Adipose atrophy
in cancer cachexia: morphologic and molecular analysis of adipose tissue in tumour-bearing
mice. Br J Cancer. 2006;95:1028-37.
24. Roe S, Cooper AL, Morris ID, Rothwell NJ. Mechanisms of cachexia induced by T-
cell leukemia in the rat. Metab Clin Exp. 1996;45:645-51.
25. Brooks SL, Neville AM, Rothwell NJ, Stock MJ, Wilson S. Sympathetic activation of
brown-adipose-tissue thermogenesis in cachexia. Biosci Rep. 1981;1:509-17.
26. Oudart H, Calgari C, Andriamampandry M, Le Maho Y, Malan A. Stimulation of
brown adipose tissue activity in tumor-bearing rats. Can J Physiol Pharmacol. 1995;73:1625-
31.
27. Edström S, Kindblom LG, Lindmark L, Lundholm K. Metabolic and morphologic
changes in brown adipose tissue from non-growing mice with an isogeneic sarcoma.
Evaluation with respect to development of cachexia. Int J Cancer; 1986. p. 753-60.
28. Cao D-X, Wu G-H, Zhang B, Quan Y-J, Wei J, Jin H, et al. Resting energy
expenditure and body composition in patients with newly detected cancer. Clin Nutr.
2010;29:72-7.
29. Lerebours E, Tilly H, Rimbert A, Delarue J, Piguet H, Colin R. Change in energy and
protein status during chemotherapy in patients with acute leukemia. Cancer. 1988;61:2412-7.
Research. on January 22, 2019. © 2012 American Association for Cancercancerres.aacrjournals.org Downloaded from
Author manuscripts have been peer reviewed and accepted for publication but have not yet been edited. Author Manuscript Published OnlineFirst on June 19, 2012; DOI: 10.1158/0008-5472.CAN-11-3536

Cancer Research Tsoli et al
25
30. Zvonic S, Ptitsyn AA, Conrad SA, Scott LK, Floyd ZE, Kilroy G, et al.
Characterization of peripheral circadian clocks in adipose tissues. Diabetes. 2006;55:962-70.
31. Yang X, Downes M, Yu RT, Bookout AL, He W, Straume M, et al. Nuclear receptor
expression links the circadian clock to metabolism. Cell; 2006. p. 801-10.
32. Bing C, Brown M, King P, Collins P, Tisdale MJ, Williams G. Increased gene
expression of brown fat uncoupling protein (UCP)1 and skeletal muscle UCP2 and UCP3 in
MAC16-induced cancer cachexia. Cancer Res. 2000;60:2405-10.
33. Watanabe M, Yamamoto T, Mori C, Okada N, Yamazaki N, Kajimoto K, et al. Cold-
induced changes in gene expression in brown adipose tissue: implications for the activation
of thermogenesis. Biol Pharm Bull; 2008. p. 775-84.
34. Feldmann HM, Golozoubova V, Cannon B, Nedergaard J. UCP1 Ablation Induces
Obesity and Abolishes Diet-Induced Thermogenesis in Mice Exempt from Thermal Stress by
Living at Thermoneutrality. Cell Metab. 2009;9:203-9.
35. Cannon B, Nedergaard J. Nonshivering thermogenesis and its adequate measurement
in metabolic studies. J. Exp. Biol. 2011. p. 242-53.
36. Falconer JS, Fearon KC, Plester CE, Ross JA, Carter DC. Cytokines, the acute-phase
response, and resting energy expenditure in cachectic patients with pancreatic cancer. Ann
Surg. 1994;219:325-31.
37. Simons JP, Schols AM, Buurman WA, Wouters EF. Weight loss and low body cell
mass in males with lung cancer: relationship with systemic inflammation, acute-phase
response, resting energy expenditure, and catabolic and anabolic hormones. Clin Sci.
1999;97:215-23.
38. Li G, Klein RL, Matheny M, King MA, Meyer EM, Scarpace PJ. Induction of
uncoupling protein 1 by central interleukin-6 gene delivery is dependent on sympathetic
Research. on January 22, 2019. © 2012 American Association for Cancercancerres.aacrjournals.org Downloaded from
Author manuscripts have been peer reviewed and accepted for publication but have not yet been edited. Author Manuscript Published OnlineFirst on June 19, 2012; DOI: 10.1158/0008-5472.CAN-11-3536

Cancer Research Tsoli et al
26
innervation of brown adipose tissue and underlies one mechanism of body weight reduction
in rats. Neuroscience. 2002;115:879-89.
39. Wallenius K, Wallenius V, Sunter D, Dickson SL, Jansson JO. Intracerebroventricular
interleukin-6 treatment decreases body fat in rats. Biochem. Biophys. Res. Commun.
2002;293:560-5.
40. Kelly M, Keller C, Avilucea PR, Keller P, Luo Z, Xiang X, et al. AMPK activity is
diminished in tissues of IL-6 knockout mice: the effect of exercise. Biochem. Biophys. Res.
Commun. 2004;23:449-54.
41. Cao W, Daniel KW, Robidoux J, Puigserver P, Medvedev AV, Bai X, et al. P38
mitogen-activated protein kinase is the central regulator of cyclic AMP-dependent
transcription of the brown fat uncoupling protein 1 gene. Mol. Cel. Biol. 2004;24:3057-67.
42. Collins S, Yehuda-Shnaidman E, Wang H. Positive and negative control of Ucp1
gene transcription and the role of beta-adrenergic signalling networks. Int. J. Obes.
2010;34:S28-S33.
43. Bordicchia M, Liu D, Amri EZ, Ailhaud G, Dessì-Fulgheri P, Zhang C, et al. Cardiac
natriuretic peptides act via p38 MAPK to induce the brown fat thermogenic program in
mouse and human adipocytes. J. Clin. Invest. 2012;122:1022-36.
44. Kurzrock R. The role of cytokines in cancer-related fatigue. Cancer. 2001;92:1684-8.
45. Sharma R, Cunningham D, Smith P, Robertson G, Dent O, Clarke SJ. Inflammatory
(B) symptoms are independent predictors of myelosuppression from chemotherapy in Non-
Hodgkin Lymphoma (NHL) patients--analysis of data from a British National Lymphoma
Investigation phase III trial comparing CHOP to PMitCEBO. BMC Cancer. 2009;9:153.
46. Andrassy RJ, Chwals WJ. Nutritional support of the pediatric oncology patient.
Nutrition. 1998;14:124-9.
Research. on January 22, 2019. © 2012 American Association for Cancercancerres.aacrjournals.org Downloaded from
Author manuscripts have been peer reviewed and accepted for publication but have not yet been edited. Author Manuscript Published OnlineFirst on June 19, 2012; DOI: 10.1158/0008-5472.CAN-11-3536
Cancer Research Tsoli et al
27
47. Shellock F, Riedinger M, Fishbein M. Brown adipose tissue in cancer patients:
possible cause of cancer-induced cachexia. J. Cancer Res. Clin. Oncol. 1986.;111:82-5.
Research. on January 22, 2019. © 2012 American Association for Cancercancerres.aacrjournals.org Downloaded from
Author manuscripts have been peer reviewed and accepted for publication but have not yet been edited. Author Manuscript Published OnlineFirst on June 19, 2012; DOI: 10.1158/0008-5472.CAN-11-3536

Cancer Research Tsoli et al
28
FIGURE LEGENDS
Figure 1. Metabolic parameters of mice bearing the Colon-26 tumour. (A) Body weight
difference at day 14 (*P<0.05; ***P<0.001 vs initial body weight) (B) BAT adipose tissue
weight changes at day 14 (**P<0.01; ***P<0.01 C26 vs control; ¥¥¥ P<0.001 C26 vs pair-
fed); (C) Food intake at day 14 (**P<0.01 C26 vs control); (D) Energy expenditure in
cachectic animals corresponding to days 11-13; (E) Energy expenditure in pair-fed mice
corresponding to days 11-13; (F) Total energy expenditure during the final 12 hours of day
13 calculated by ANCOVA using final body mass as a covariate (¥¥ P<0.01 C26 vs pair-fed).
(G) Haematoxylin/Eosin staining of BAT in (i) control free-fed, (ii) control pair-fed, (iii) C26
mice, Black bar represents 50 μm; (H) Electron microscopy images of BAT from (i) control
free-fed, (ii) C26 mice. Black bar represents 2 μm, L lipid droplet, M mitochondrion; For A,
B and C values are presented as a mean ± s.e.m. for 8-10 animals per group.
Figure 2. STAT3 signalling pathway is active in the BAT of cachectic mice but not in
food-restricted mice; (A) Circulating IL-6 plasma levels from control, pair-fed and C26
tumour bearing mice (***P<0.001 C26 vs control). (B , C) mRNA analysis of Il6Ra and
Socs3 isolated from BAT at 2am and 2pm from free-fed control (black circle), pair-fed
control (green triangle) and C26 tumour-bearing mice (red square) (***P<0.01 C26 vs
control). 2am values are duplicated in each graph to illustrate diurnal rhythmicity; (D) Protein
levels of STAT3 and phosphorylated STAT3 (Ser727) in BAT of ad lib, pair-fed and C26
tumour–bearing mice assessed by immunoblotting. Protein extractions were performed in
BAT harvested at 2 am. Values are mean ± s.e.m. presented as percentages relative to the
controls for 4-6 animals per group (**P<0.01 C26 vs control).
Research. on January 22, 2019. © 2012 American Association for Cancercancerres.aacrjournals.org Downloaded from
Author manuscripts have been peer reviewed and accepted for publication but have not yet been edited. Author Manuscript Published OnlineFirst on June 19, 2012; DOI: 10.1158/0008-5472.CAN-11-3536

Cancer Research Tsoli et al
29
Figure 3. Metabolic parameters of mice bearing the non-cachectic Colon-26 tumour and
expression of genes involved in IL-6 signalling. (A) Body weight change between day 0
and day 14 (***P<0.001, cachectic C26 vs control ), (B) BAT weight changes at day 14
(§P<0.05 non-cachectic C26 vs control; ***P<0.001 cachectic C26 vs control ); (C) Plasma
analysis for IL6 cytokine from control, non-cachectic C26 tumour-bearing and cachectic C26
mice (**P<0.01 cachectic C26 vs control); (D-E) mRNA analysis of IL6Ra and Socs3
isolated from BAT of free-fed control (black circle) and non-cachectic C26 tumour-bearing
mice (orange square); 2am values are duplicated in each graph to illustrate diurnal
rhythmicity. Values are mean ± s.e.m. presented as percentages relative to the controls for 4-5
animals per group.
Figure 4. Expression of genes involved in lipid uptake, trafficking and accumulation;
mRNA analysis of Lpl, Cd36, Ap2, Pparγ, C/ebpα, Fas, Dgat2 and Perilipin isolated from
BAT of of free-fed control (black circle), and C26-bearing mice (red square). 6 am values are
duplicated in each graph to illustrate a complete 24-h cycle; Values are mean ± s.e.m.
presented as percentages relative to the controls for 4-5 animals per group. (* P<0.05;
**P<0.01; ***P<0.001 C26 vs control).
Figure 5. Expression of genes involved in lipolysis and activation of thermogenesis in
BAT; (A, B) mRNA analysis of Pparδ, Pgc1, Pbe, Cpt1a, b3AR, Ac3, Dio2, and Ucp1
isolated from BAT of free-fed control (black circle), and C26-bearing mice (red square);
Values are mean ± s.e.m. presented as percentages relative to the controls for 4-5 animals per
group (* P<0.05; **P<0.01; ***P<0.001 C26 vs control). 6 am values are duplicated in each
graph to illustrate a complete 24-h cycle; (C, D) Changes in BAT temperatures and
locomotor activity measured by implanted biotelemetry devices. Data represent the group
Research. on January 22, 2019. © 2012 American Association for Cancercancerres.aacrjournals.org Downloaded from
Author manuscripts have been peer reviewed and accepted for publication but have not yet been edited. Author Manuscript Published OnlineFirst on June 19, 2012; DOI: 10.1158/0008-5472.CAN-11-3536

Cancer Research Tsoli et al
30
means of the temperature and physical activity for each animal at each time point for the final
7 days; C26-bearing mice (red), free-fed control (black), pair-fed control (green).
Figure 6. Expression of cold-adaptive genes and increased protein levels of UCP1 in
brown adipose tissue under conditions of thermoneutrality; (A) mRNA analysis of B3Ar,
Ac3, Dio2, Ucp1, Gyk and Elovl3 isolated from BAT of free-fed control (black circle), pair-
fed control (green triangle) and C26-bearing mice (red square); 2am values are duplicated in
each graph to illustrate diurnal rhythmicity. (B,C) Relative protein concentration of UCP1 in
mitochondria isolated from cachectic, control and pair-fed animals; (D) Total mitochondrial
protein content in C26-bearing, control and pair-fed mice; (E) Protein levels of UCP1
expressed per total mitochondrial protein content in BAT from cachectic, control and pair-fed
animals; Values are mean ± s.e.m. presented as percentages relative to the controls for 4-5
animals per group (* P<0.05; **P<0.01; ***P<0.001 C26 vs control; ¥P<0.05; ¥¥P<0.01;
¥¥¥P<0.001 C26 vs pair-fed; §§ P< pair-fed vs control)
Research. on January 22, 2019. © 2012 American Association for Cancercancerres.aacrjournals.org Downloaded from
Author manuscripts have been peer reviewed and accepted for publication but have not yet been edited. Author Manuscript Published OnlineFirst on June 19, 2012; DOI: 10.1158/0008-5472.CAN-11-3536

Published OnlineFirst June 19, 2012.Cancer Res Maria Tsoli, Melissa Moore, Dominic Burg, et al. in micedysregulated lipid metabolism associated with cancer cachexia Activation of thermogenesis in brown adipose tissue and
Updated version
10.1158/0008-5472.CAN-11-3536doi:
Access the most recent version of this article at:
Material
Supplementary
http://cancerres.aacrjournals.org/content/suppl/2012/06/19/0008-5472.CAN-11-3536.DC1
Access the most recent supplemental material at:
Manuscript
Authoredited. Author manuscripts have been peer reviewed and accepted for publication but have not yet been
E-mail alerts related to this article or journal.Sign up to receive free email-alerts
Subscriptions
Reprints and
To order reprints of this article or to subscribe to the journal, contact the AACR Publications
Permissions
Rightslink site. Click on "Request Permissions" which will take you to the Copyright Clearance Center's (CCC)
.http://cancerres.aacrjournals.org/content/early/2012/06/19/0008-5472.CAN-11-3536To request permission to re-use all or part of this article, use this link
Research. on January 22, 2019. © 2012 American Association for Cancercancerres.aacrjournals.org Downloaded from
Author manuscripts have been peer reviewed and accepted for publication but have not yet been edited. Author Manuscript Published OnlineFirst on June 19, 2012; DOI: 10.1158/0008-5472.CAN-11-3536