actionable agile metrics for predictability · actionable agile metrics for ... your process is...
TRANSCRIPT

Daniel S. VacantiActionableAgileTM
[email protected]@danvacanti
Actionable Agile Metrics for
Predictability

“When will it be done?”

“When will it be done?”
Date (number of days)
Elapsed Time

“When will it be done?”
Date (number of days)
Story Points / Velocity

Stop me if you’ve heard this
one before…

“Relative Complexity is the
best predictor of how long it
takes an item to complete”


Why do we even bother with
Story Points?


I’m going to suggest something
radical…

As an example:
How long does it take you to get
to work in the morning?

“It depends…”

Here’s a spot!!

4 4 2
Active Done
Testing DoneDoneActive
DevelopmentReady Analysis
3
Here’s a spot!!

Try an experiment for
me…

Calendar Time
Elapsed Time


Try the same thing
for your process

Backlog Analysis Develop Test Deployed
Start Timer Stop Timer

This chart is called a (Cycle Time) Scatterplot

If you track nothing else, track the
date that an item starts and the
date that an item completes
(for all work items)

That will give you a
measure of the flow
metric of
Cycle Time*

Cycle Time is the
amount of
elapsed time
it takes for a given work
item to complete
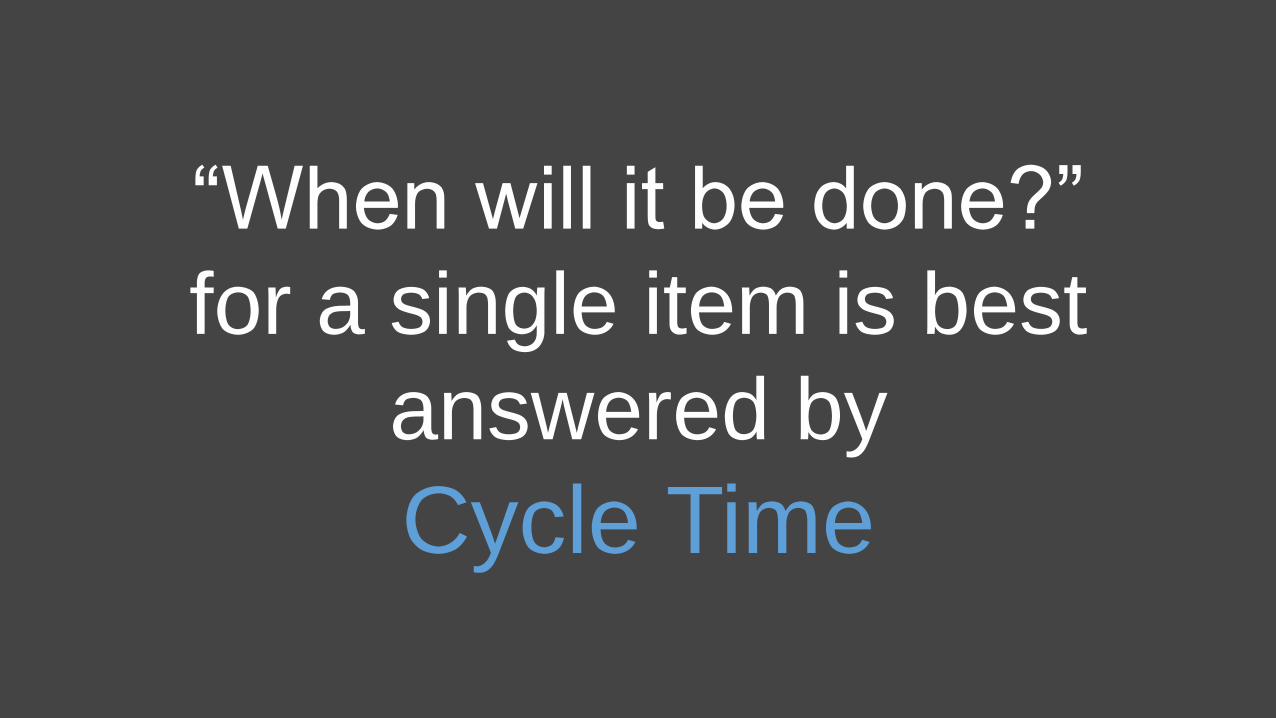
“When will it be done?”
for a single item is best
answered by
Cycle Time

“Huh?”

How does generating a chart like this help us
answer “When will it be done”?

How do we make sense of this randomness?

Your process is “random”.
Therefore, you can’t think
deterministically.
You need to think
probabilistically.

What does it mean to
think probabilistically?

Let’s try another experiment…
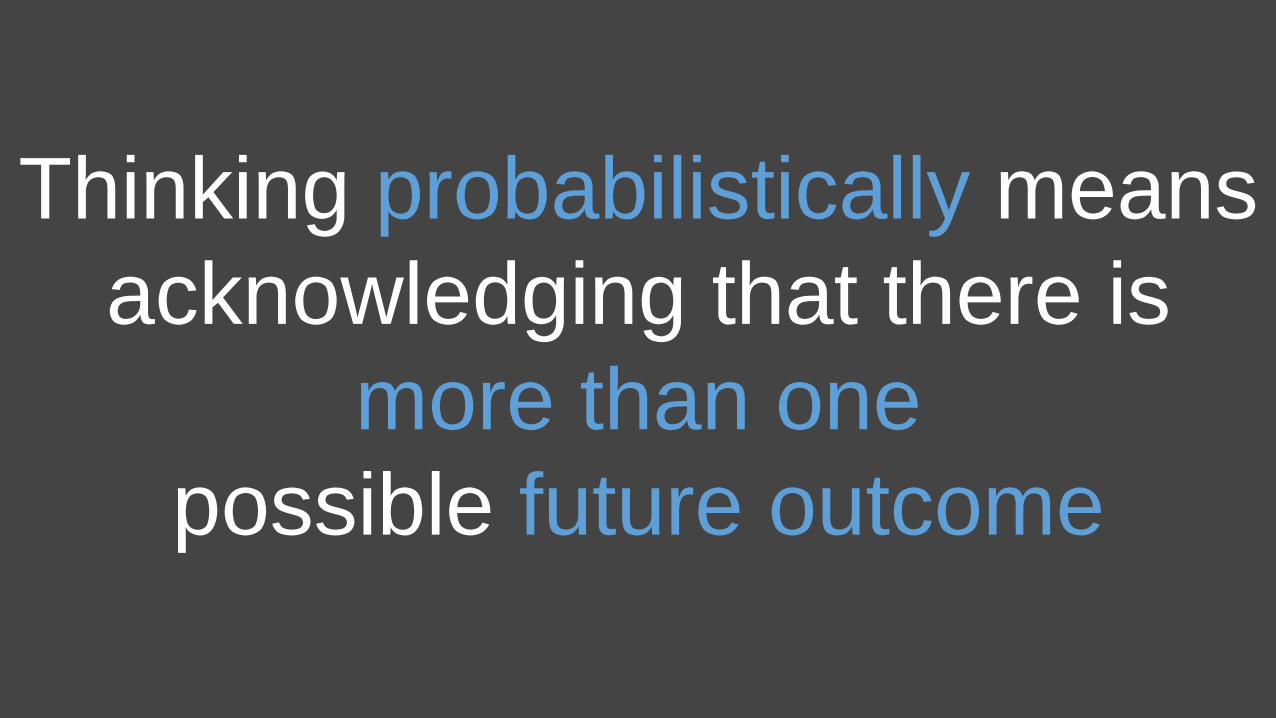
Thinking probabilistically means
acknowledging that there is
more than one
possible future outcome

How many people can we “expect”
to be standing after 3 flips?
12.5%
Does that mean 12.5% was the
only possible outcome?

Backlog Analysis Develop Test Deployed
2
Start Timer Stop Timer

Backlog Design Develop Test Deployed
2
Exactly
this dot?
Exactly
this dot?
Or Exactly
this dot?
Will Item #3
end up as…

Backlog Design Develop Test Deployed
2
There is more than one possible outcome
for Item #3 while it is sitting in the backlog

What are the possible
outcomes?

40
How do we make sense of this
“randomness”?

41
50th Percentile = 6 days or less

42
85th Percentile = 15 days or less

43
95th Percentile = 22 days or less

44
50th Percentile = 6 days or less
95th Percentile = 22 days or less
85th Percentile = 15 days or less
Scatterplot Percentiles (making a forecast)


85th Percentile = 33 days or less

85th Percentile = 13 days or less


What factors
affect
Cycle Time?

WIP

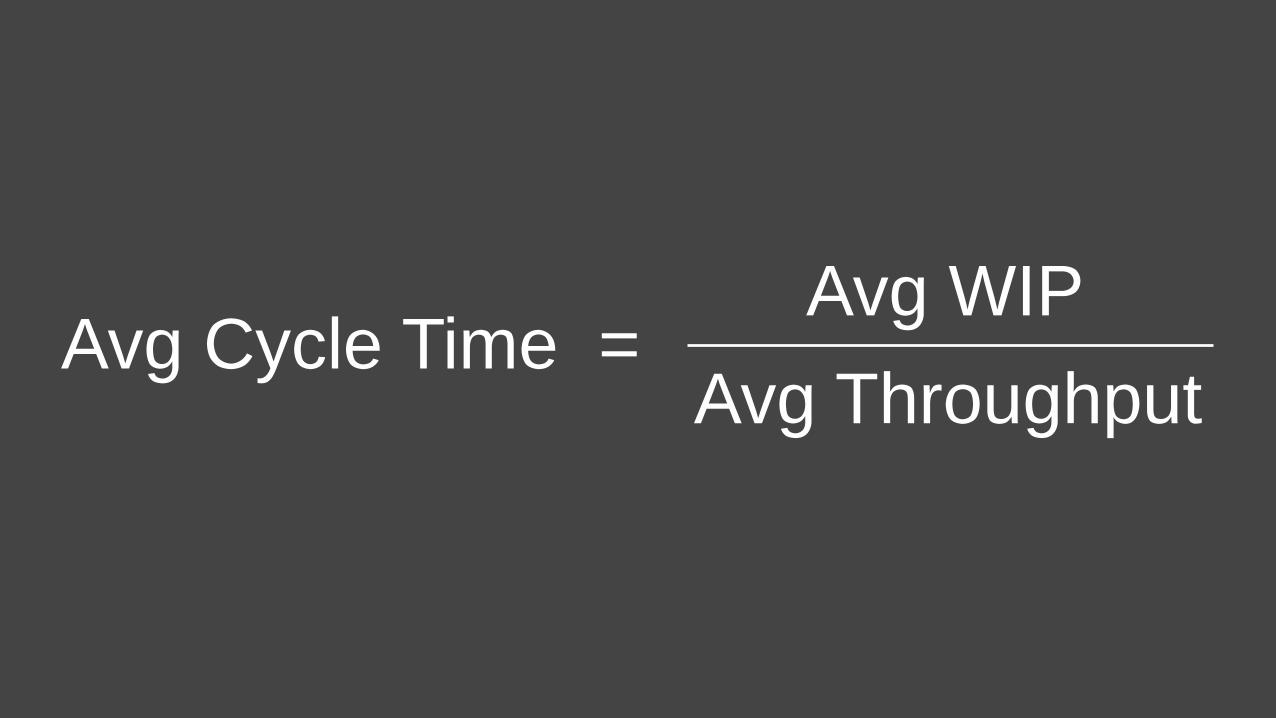
Avg Cycle Time = Avg WIP
Avg Throughput

What else?

Poor Pull Policies,
Blockers,
External Dependencies,
…

“Actionable Agile
Metrics for
Predictability”
https://leanpub.com/actionableagilemetrics

What does a 19th century
Yorkshire cotton
industrialist have to do
with the Manhattan
Project?
For next time…


All charts created by:
Thank-you!
