action prediction based on anticipatory brain potentials during
TRANSCRIPT

Action Prediction Based on Anticipatory Brain1
Potentials during Simulated Driving2
Zahra Khaliliardali*, Ricardo Chavarriaga*, Lucian Andrei3
Gheorghe * **, and Jose del R. Millan*4
* Defitech Chair in Brain-Machine Interface, Center for Neuroprosthetics, Institute of5
Bioengineering and School of Engineering, Ecole Polytechnique Federale de Lausanne6
(EPFL), Campus Biotech H4, 1202, Geneva, Switzerland.7
** Nissan Motor Co., Ltd. Research Division, Research Planning Department,8
Atsugi, Japan.9
E-mail: [email protected]
11
Abstract12
Objective. The ability of an automobile to infer the driver’s upcoming actions directly13
from neural signals could enrich the interaction of the car with its driver. Intelligent14
vehicles fitted with an on-board brain-computer interface (BCI) able to decode the15
driver’s intentions can use this information to improve the driving experience. In16
this study we investigate the neural signatures of anticipation of specific actions,17
namely braking and accelerating. Approach. We investigated anticipatory slow cortical18
potentials (SCPs) in electroencephalogram (EEG) recorded from 18 healthy participants19
in a driving simulator using a variant of the contingent negative variation (CNV)20
paradigm with Go and No-go conditions: count-down numbers followed by ‘Start’/‘Stop’21
cue. We report decoding performance before the action onset using a quadratic22
discriminant analysis (QDA) classifier based on temporal features. Main Results. (i)23
Despite the visual and driving related cognitive distractions, we show the presence of24
anticipatory event related potentials locked to the stimuli onset similar to the widely25
reported CNV signal (with an average peak value of -8µV at electrode Cz). (ii) We26
demonstrate the discrimination between cases requiring to perform an action upon27
imperative subsequent stimulus (Go condition, e.g. a ‘Red’ traffic light) versus events28
that do not require such action (No-go condition; e.g. a ‘Yellow’ light); with an29
average single trial classification performance of 0.83±0.13 for braking and 0.79±0.12 for30
accelerating (area under the curve). (iii) We show that the centro-medial anticipatory31
potentials are observed as early as 320±200 ms before the action with a detection rate32
of 0.77±0.12 in offline analysis. Significance. We show for the first time the feasibility of33
predicting the driver’s intention through decoding anticipatory related potentials during34
simulated car driving with high recognition rates.35

Action Prediction Based on Anticipatory Brain Potentials during Simulated Driving 2
Keywords: BCI; Anticipation ; EEG; CNV; Intention detection; Car simulator;36
SCP.37
1. Introduction38
Car drivers are constantly involved in anticipatory and preparatory tasks prompted39
by processes that can be either internal (endogenous) or triggered by cues from the40
environment (exogenous). Brain-computer interface (BCI) systems can potentially be41
used to recognize the driver’s intention for a movement such as pressing pedals, or42
turning left or right before any overt action is performed. Predicting the driver’s will43
can help the driving assistance system of an intelligent car to provide support that is not44
only in-line with the situations on the road (based on the in-car sensors), but also and45
more importantly, aligned with the driver’s intention (mediated by the driver’s BCI).46
This will ensure a seamless interaction between the car and the driver.47
To date, studies on monitoring the driver’s brain state have mainly focused on the48
driver’s drowsiness/arousal using a combination of Electroencephalogram (EEG) and49
electrooculogram (EOG) signals [1, 2]. EEG-based systems have been also employed50
for the detection of driver’s workload [2, 3]. Haufe et al. [4] explored the detection of51
emergency braking before the action onset using EEG and electromyography (EMG).52
The results of this offline study indicate that the driver’s intention to perform emergency53
braking can be detected as early as 130 ms before the car pedal responses . More recently,54
they assessed the applicability of their system in real-world driving [5] replicating the55
findings obtained with the car simulator [4]. Kim et al. [6] have extended these findings56
in different simulated driving situations, and were also capable to different emergency57
braking from normal braking.58
In this work, we investigate the prediction of driver’s action based on the decoding59
of anticipatory brain potentials. Anticipation generates an endogenous pre-activation of60
underlying neural structures, during which a person actively engages in a preparatory61
phase after a warning stimulus, in order to execute a specific action after a relevant62
imperative stimulus [7]. An example in the driving scenario is the color changes of a63
traffic light, when the traffic light is turning from ‘Green’ to ‘Yellow’ to ‘Red’. In this64
case, ‘Yellow’ is the warning stimulus, as it does not require any mandatory action and65
simply predicts the appearance of the imperative stimulus ‘Red’, upon whose appearance66
the subject is supposed to brake immediately. Therefore, we evaluate the feasibility of67
predicting the movement onset (e.g. pressing the brake pedal) through anticipatory68
brain potentials. This will be beneficial in scenarios where the driver is engaged by69
external events for which he/she needs to perform an immediate action (e.g. ‘Red’70
light) in contrast to occasions where there is no need for an immediate response (e.g.71
‘Yellow’ light).72
As an example of how a BCI based on anticipatory brain potentials can enhance73
driving, consider a junction with a traffic light turning ’Red’. Two cases might happen.74
(i) For an inattentive driver who is not aware of the need to brake, the BCI does75

Action Prediction Based on Anticipatory Brain Potentials during Simulated Driving 3
not detect the presence of anticipation-related potential. Then, the driving assistance76
generates a warning feedback to the driver while it also initiates the braking action77
smoothly, so that the driver has the time to become aware of the situation and finish78
braking the car by him/herself. This kind of driving assistance would prevent an79
automatic emergency braking at the last moment, which may result in a negative surprise80
and unpleasant experience for the driver who could feel under the control of the smart car81
rather than controlling it. (ii) If the driver is aware of the turning traffic light and has the82
intention to brake, the BCI detects the presence of a CNV and an automatic braking83
is unnecessary. Still, further driving assistance could be also provided by facilitating84
the driver’s intended action (i.e. initiating the braking action smoothly). We believe85
that a smart car endowed with a such BCI will lead to a more pleasant and seamless86
interaction between the two as its driving assistance will always be in accord with the87
driver’s intention. It is worth noting that, the real-time information about the presence88
and status of a traffic lights can be detected by the embedded sensors in the car [8, 9]89
which could be transferred to the proposed BCI system. Furthermore, the advent of90
autonomous cars is accelerating the use of communication networks among cars and91
key traffic elements, such as traffic lights, that will provide an intelligent car with the92
necessary information about the status of traffic and other vehicles on the road.93
In the standard paradigms for studying anticipatory processes, a first warning94
stimulus (S1) predicts the appearance of second imperative stimulus (S2), signaling95
that the user has to perform a specific action. A central negative deflection has been96
observed in the scalp EEG during the interval between the warning (S1) and imperative97
stimuli (S2) [7]. This signal, termed Contingent negative variation (CNV) potential,98
develops during most of the inter-stimulus interval and can last from about 300 ms to99
several seconds with magnitudes up to 50µV. Generally, the negativity ends sharply with100
the onset of Go cue. This potential is linked to the preparatory processing required for101
appropriate actions at the arrival of future events [7, 10, 11]. Interestingly, recent studies102
have shown the possibility of detecting similar potentials in complex experimental set-103
ups that involve a simulated tele-presence robot [12] or operation of Internet browsers104
[13].105
Recently, Garipelli et al. [13] studied offline the anticipation-related brain signals106
and highlighted the advantages of using weighted average spatial smoothing filters107
and removal of the infra-slow oscillations (below 0.1 Hz). However, the single-trial108
analysis results of this study were confined only to synchronous classification. Similar109
preprocessing methods have been proposed for the detection of movement intention110
through slow Movement-related cortical potentials (MRCPs) or Readiness potentials111
(RPs) pointing to similar frequency ranges. Both CNVs and MRCPs result in a similar112
deflections in the slow brain potentials of EEG called Slow cortical potentials (SCPs).113
SCPs are changes in cortical polarization of the EEG lasting from 300 ms to several114
seconds before the movements. Negative polarization have received different labels,115
depending upon the experimental scenarios in which they were observed: MRCPs or RPs116
in preparation for voluntary movements, and CNV if it occurs between two consecutive117

Action Prediction Based on Anticipatory Brain Potentials during Simulated Driving 4
stimuli or responses [14]. Niazi et al. [15] as well as Lew at al. [16] have exploited, in118
offline experiments, the RPs for the prediction of a forthcoming self-paced movement119
66.6±121 ms and 167±68 ms before the action onset with an average maximum true120
positive rate (TPR) of 82.5±7.8 and 0.76±0.07, respectively. More recently, Xu et al.121
showed the online detection of MRCPs with a TPR up to 0.79 [17]. However, the peak122
of decoding performance is achieved about 300 ms after the movement onset, unlike123
our approach for the prediction of movement intention that works before the movement124
onset.125
Following the main goal of this study, we recorded EEG signals from 18 healthy126
volunteers using a variation of the classical CNV paradigm in a simulated driving127
experiment. In this study, we address the following questions: (i) Is it possible128
to observe anticipatory related potentials during driving? Considering that, unlike129
controlled psycho-physical experiments: driving task involves multitasking (upper and130
lower limb movements) and the visual input is richer (including the moving stimuli131
and other distractions). (ii) If this is the case, can these potentials be recognized in132
single trials? (iii) We further investigate the possibility of detecting asynchronously the133
movement intention with a moving window. To the best of our knowledge, no study has134
been reported on the use of anticipatory brain potentials in order to detect movement135
intention. How early could these potentials be detected in real-time?136
The experiments and proposed methods are detailed in Section 2. Section 3 presents137
the results of single-trial recognition of anticipation related potentials. Finally, we138
discuss the results in Section 4, and suggest future directions in Section 5.139
2. Materials and Methods140
2.1. Experimental protocol and set-up141
Eighteen healthy, right-handed subjects (2 female, average age 25.5±4.1 yrs)142
participated in the experiment. All had normal or corrected-to-normal vision and all143
had an ample driving experience. The experimental protocols were approved by the144
local ethical committee and subjects provided informed consent. Subjects sat in a car145
simulator where a virtual roadway environment was displayed using the open source146
VDrift software on the screen (experimental setup can be seen in Figure 1.a). The147
participants were asked to drive the virtual car along a highway with soft turns, at a148
speed of 100 Km/h, using the steering wheel, accelerate/brake pedals. There was no149
other car on the virtual road. Visual cues were provided to the subjects at random150
times indicating them to stop or resume their journey. The virtual environment was151
shown on a projection screen for six of the subjects (see Figure 1.a: the size of the152
screen was 100 inch and placed approximately 1.5 meter from the subject’s seat). For153
the remaining participants we used three 27 inch 3D monitors.154
During the task one or more warning stimuli predicted the imperative stimulus155
(see Figure 1.b and c). This design allowed us to test the difference between predictable156

Action Prediction Based on Anticipatory Brain Potentials during Simulated Driving 5
future events from the environment, some of them did not require the subjects to perform157
an action (No-go), and imperative ones (Go). At a random time point during driving,158
a visual cue appeared at the center of the screen showing a count-down from ‘4’ to159
‘1’, in seconds, followed by a text cue ‘Stop’. Upon this cue subjects were instructed160
to immediately push the brake pedal. After a given period, a similar count-down of 4161
seconds appeared, but this time it was followed by a ‘Start’ cue. Upon the onset of162
this cue subjects had to push the acceleration pedal briskly. The interval between two163
count-downs was drawn from a uniform distribution in the range of [10 20] s (mean and164
standard deviation of 15 ± 2.87). In this paradigm, cues with numbers (‘4’, ‘3’, ‘2’,165
‘1’) corresponded to the warning stimuli, predicting the appearance of the imperative166
stimulus (‘Start’/‘Stop’). The size of stimulus (0.1 rad) in the driver’s visual field was167
similar for both setups (i.e. using the projection screen and the 3D monitors).168
As can be seen in Figure 1.c, we defined two types of trials in our experiment:169
Drive and Brake trials. The former comprises the time interval preceding the ‘Start’170
cue, while the latter comprised the time interval before the ‘Stop’ cue. In both cases,171
each trial contained three No-go epochs and one Go epoch, in terms of the classical Go172
and No-go definition [7]. A No-go epoch is defined as the time interval between the173
appearance of one number in the count-down to the next one, in which subjects were174
not supposed to do any action after the cue. The time interval between cue ‘1’ and the175
‘Start/Stop’ cue, in which subjects were supposed to perform an action, is defined as a176
Go epoch.177
Each subject performed one experimental session composed of four runs of 15178
minutes, each with resting periods of 5-10 min in between. Each session contained179
an average of 91 ± 9.5 and 86 ± 9.5 trials for Drive and Brake trials, respectively.180
During the Drive trials the car was stopped, and during the Brake trials, the car was181
moving and subjects were continuously pressing the gas pedal fully. Therefore, the visual182
information flow was richer in the Brake trials than in the Drive trials. Moreover, the183
Brake trials required a different movement, switching from the gas pedal to the brake184
pedal, while for Drive trials the subject only had to press the gas pedal. To reduce185
EEG contamination due to movement artifacts , the subjects were instructed to fixate186
a cross (size is around 0.02 rad) on the center of the screen to minimize facial or eye187
movements during the appearance of the stimuli.188
For 10 (out of 18) subjects we also provided their Reaction-time (RT) after the189
Brake trials as a behavioral feedback. We hypothesized this feedback can help subjects190
to better synchronize their actions (pressing the brake pedal) with the onset of the191
imperative cue (‘Stop’). To summarize, we defined two sets of recordings, Group1192
and Group2. Group1 included the recordings of subjects S1-S9, in which no feedback193
was provided to the subjects (S1-S6 with flat screen, S7-S9 with 3D screens). Group2194
contained the recordings of subjects S10-S18, where the subjects received RT feedback195
for the Brake trials (all subjects worked with 3D screens).196

Action Prediction Based on Anticipatory Brain Potentials during Simulated Driving 6
Figure 1. a) The experimental setup with the projection screen showing the virtualroadway environment and the car meters. b) Snapshots of the screen with the count-down stimuli. c) Time-line of the protocol: the first round of count-down stimulifollowed by the ‘Stop’ cue to brake, waiting for around 15 seconds, and second roundof count-down and ‘Start’ cue to accelerate. It corresponds to the two types of trials:Brake and Drive each containing one Go and three No-go epochs.
2.2. Data acquisition and preprocessing197
The EEG was acquired using 64 electrodes arranged in the modified 10-20 international198
standard along with three EOG electrodes and two EMG electrodes using a Biosemi Inc199
ActiveTwo system. The EOG electrodes were placed above the nasion and below the200
outer canthi of the eyes, to derive horizontal, vertical and radial components. A pair of201
surface EMG electrodes were mounted on the tibialis anterior muscle of the subject’s202
right leg.203
Event markers such as the triggers of the pedals (accelerate/brake) and steering, as204
well as the position of the car were provided by the car simulator at a sampling rate of205
256 Hz. Physiological signals (i.e. EEG, EMG, and EOG) were acquired at a sampling206
frequency of 2048 Hz, then down-sampled offline to 256 Hz and synchronized with the207
car simulator data.208
The EEG data were spatially filtered by a common average reference (CAR) [18].209
Then, EEG was further filtered in the spatial domain using a weighted average filter210
(WAVG), as it has been shown to improve the classification performance of CNV211

Action Prediction Based on Anticipatory Brain Potentials during Simulated Driving 7
potentials [13]. WAVG can be seen as the opposite of the Laplacian filter, where the212
average neighboring activity is added, rather than subtracted. Given the value of the213
ith electrode, eCARi (t) after CAR, WAVG returns e(t) = eCAR
i (t)+ 1K
∑Kj eCAR
j (t), where,214
K represents the number of nearest neighbor electrodes considered. Afterwards, EEG215
was spectrally filtered by means of a non-causal narrow band-pass IIR filter (4th order,216
Butterworth) with cutoff frequencies between 0.1–1 Hz. EMG signals were rectified and217
then filtered with a bandpass Butterworth filter in the range of 20 to 50 Hz and smoothed218
with a moving average filter (window of 25 samples) [16]. EEG and EMG signals were219
segmented into Go, and No-go epochs (see Figure 1.c). The onset of the appearance of220
‘Start/Stop’ cue on the screen is defined as time 0 s. For each epoch (Go and No-go)221
the data were baseline corrected to the value of the sample at the onset of each cue.222
2.3. Feature extraction and classification223
2.3.1. Single trial classification224
We evaluated the possibility of differentiating between Go and No-go epochs on a225
single-trial basis using well-known pattern recognition methods. We decoded activity at226
vortex (central-midline) where anticipation-related SCPs are most prominent [13]. For227
each epoch, the processed Cz potentials at 4 equally spaced time points (i.e. at -0.8 s, -228
0.6 s, -0.4 s, and -0.2 s) were used as a feature vector, x = [eCz(T1) eCz(T2) . . . eCz(T4)] ∈229
R4 where, Tk represents kth time point. The choice for the number and timing of the230
features was based on previous studies from our group [13, 19]. In order to investigate231
the possibility of early detection, the proposed feature vector includes information only232
until 0.2 s before the onset of the imperative stimulus ‘Start’/‘Stop’.233
For classification, we use the quadratic discriminant analysis (QDA) [20]. This234
choice was based on a preliminary evaluation where we compared, Linear discriminant235
analysis (LDA) and QDA and found that the latter yielded slightly higher classification236
performance [19]. We report here results using a 4-fold cross-validation method which237
maintain the chronological order of the data [21]; i.e each fold corresponds to a separate238
run.239
The performance of the single trial classification was evaluated using the area under240
the curve (AUC) in the receiver operating characteristics (ROC) space [22]. ROC curves241
show the trade-off between the false positive rates (FPR) and true positive rates (TPR)242
of the classifier for different decision thresholds. In our case, TPR is the portion of Go243
epochs that are classified as Go and FPR is portion of No-go epochs detected as Go244
epochs. The results of this analysis are described in Section 3.2.245
2.3.2. Movement intention detection246
In order to evaluate the possibility of using anticipatory SCPs for predicting the247
driver’s movement intention, the performance of the classifier is tested in a moving248
window fashion. In this case, we pooled the data of Drive and Brake trials. It has249
been shown recently that there is a compromise between the value of the peak and its250
Action Prediction Based on Anticipatory Brain Potentials during Simulated Driving 8
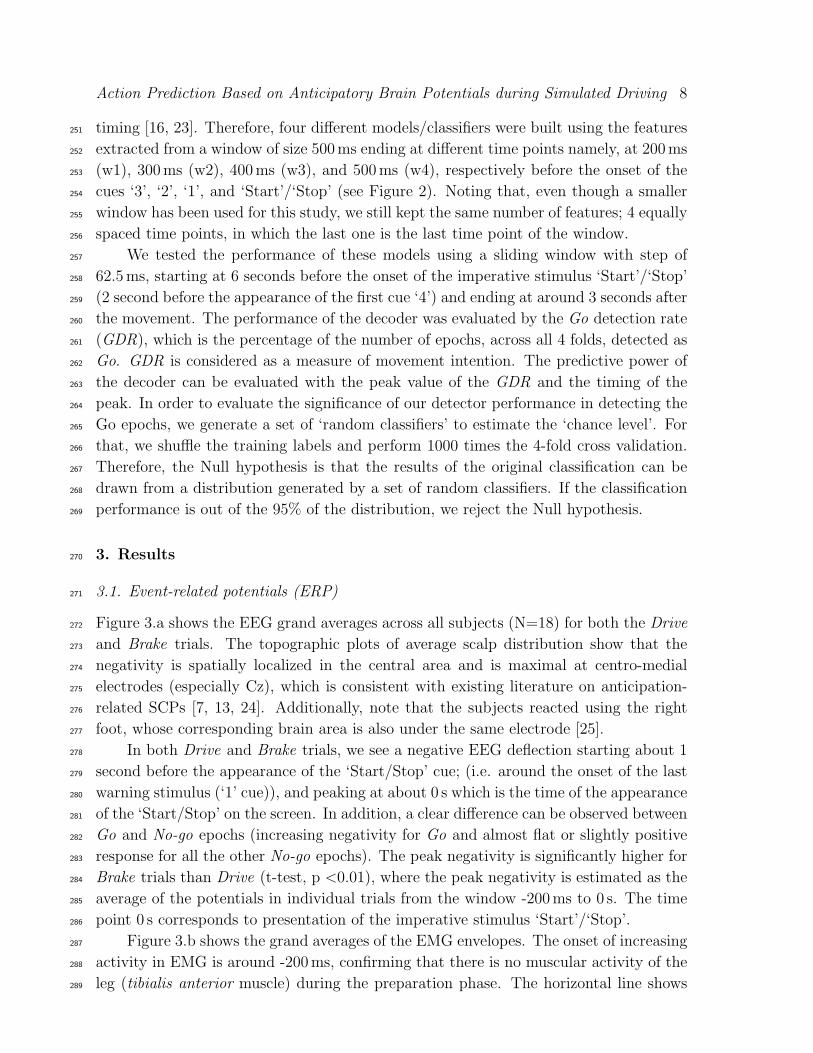
timing [16, 23]. Therefore, four different models/classifiers were built using the features251
extracted from a window of size 500 ms ending at different time points namely, at 200 ms252
(w1), 300 ms (w2), 400 ms (w3), and 500 ms (w4), respectively before the onset of the253
cues ‘3’, ‘2’, ‘1’, and ‘Start’/‘Stop’ (see Figure 2). Noting that, even though a smaller254
window has been used for this study, we still kept the same number of features; 4 equally255
spaced time points, in which the last one is the last time point of the window.256
We tested the performance of these models using a sliding window with step of257
62.5 ms, starting at 6 seconds before the onset of the imperative stimulus ‘Start’/‘Stop’258
(2 second before the appearance of the first cue ‘4’) and ending at around 3 seconds after259
the movement. The performance of the decoder was evaluated by the Go detection rate260
(GDR), which is the percentage of the number of epochs, across all 4 folds, detected as261
Go. GDR is considered as a measure of movement intention. The predictive power of262
the decoder can be evaluated with the peak value of the GDR and the timing of the263
peak. In order to evaluate the significance of our detector performance in detecting the264
Go epochs, we generate a set of ‘random classifiers’ to estimate the ‘chance level’. For265
that, we shuffle the training labels and perform 1000 times the 4-fold cross validation.266
Therefore, the Null hypothesis is that the results of the original classification can be267
drawn from a distribution generated by a set of random classifiers. If the classification268
performance is out of the 95% of the distribution, we reject the Null hypothesis.269
3. Results270
3.1. Event-related potentials (ERP)271
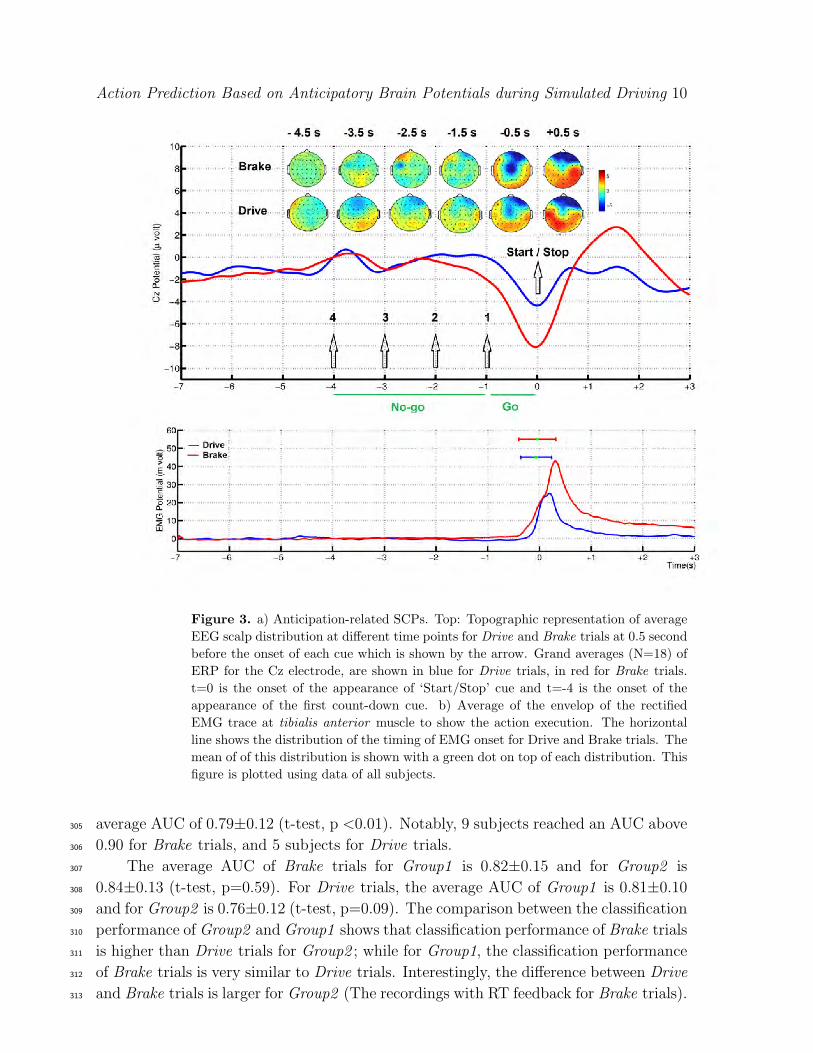
Figure 3.a shows the EEG grand averages across all subjects (N=18) for both the Drive272
and Brake trials. The topographic plots of average scalp distribution show that the273
negativity is spatially localized in the central area and is maximal at centro-medial274
electrodes (especially Cz), which is consistent with existing literature on anticipation-275
related SCPs [7, 13, 24]. Additionally, note that the subjects reacted using the right276
foot, whose corresponding brain area is also under the same electrode [25].277
In both Drive and Brake trials, we see a negative EEG deflection starting about 1278
second before the appearance of the ‘Start/Stop’ cue; (i.e. around the onset of the last279
warning stimulus (‘1’ cue)), and peaking at about 0 s which is the time of the appearance280
of the ‘Start/Stop’ on the screen. In addition, a clear difference can be observed between281
Go and No-go epochs (increasing negativity for Go and almost flat or slightly positive282
response for all the other No-go epochs). The peak negativity is significantly higher for283
Brake trials than Drive (t-test, p <0.01), where the peak negativity is estimated as the284
average of the potentials in individual trials from the window -200 ms to 0 s. The time285
point 0 s corresponds to presentation of the imperative stimulus ‘Start’/‘Stop’.286
Figure 3.b shows the grand averages of the EMG envelopes. The onset of increasing287
activity in EMG is around -200 ms, confirming that there is no muscular activity of the288
leg (tibialis anterior muscle) during the preparation phase. The horizontal line shows289

Action Prediction Based on Anticipatory Brain Potentials during Simulated Driving 9
Figure 2. Training windows for the movement detection classifier. Four differentmodels were built using the features extracted from a window of size 500 ms that endedat 200 ms (w1), 300 ms (w2), 400 ms (w3), and 500 ms (w4), respectively before theonset of the cues (‘3’, ‘2’, ‘1’, ‘Start’/‘Stop’). The segments that appeared beforethe warning stimulus were No-go epochs, whereas those appeared just before theimperative stimulus (‘Start’/‘Stop’) were Go epochs. For testing (bottom trace), asimilar window (500 ms) is used for extracting the features. Unlike the training phase,these windows were not time-locked but shifted with a step of 62.5 ms continuously.
the distribution of the timing of EMG onset for the Drive and Brake trials. This290
is defined as the time when the EMG activity exceeds a threshold equal to µ + 6σ,291
where µ and σ are the mean and standard deviation of EMG signals of a one second292
window after the first warning cue (4) [26]. Theses results provide evidence that it is293
possible to observe anticipation-related EEG potentials during driving and before the294
muscular onset. As can be seen in Figure 3.a, a small negative deflection starting after295
the first warning stimulus (‘4’ cue) is also observed. The presence of a small negativity296
after the first warning stimulus and a relatively bigger negativity before the imperative297
stimulus (preceding the movement) is consistent with the bi-phasic negativity reported298
in previous studies on CNV potentials with a single pair of warning-imperative stimuli299
[7, 24].300
3.2. Single trial classification301
Figures 4 and 5 show the individual results of single-trial classification for Brake and302
Drive trials, respectively. The average AUC across subjects (N=18) is 0.83±0.13 for303
Brake trials. A slight decrease in performance is observed for Drive trials with an304
Action Prediction Based on Anticipatory Brain Potentials during Simulated Driving 10
Figure 3. a) Anticipation-related SCPs. Top: Topographic representation of averageEEG scalp distribution at different time points for Drive and Brake trials at 0.5 secondbefore the onset of each cue which is shown by the arrow. Grand averages (N=18) ofERP for the Cz electrode, are shown in blue for Drive trials, in red for Brake trials.t=0 is the onset of the appearance of ‘Start/Stop’ cue and t=-4 is the onset of theappearance of the first count-down cue. b) Average of the envelop of the rectifiedEMG trace at tibialis anterior muscle to show the action execution. The horizontalline shows the distribution of the timing of EMG onset for Drive and Brake trials. Themean of of this distribution is shown with a green dot on top of each distribution. Thisfigure is plotted using data of all subjects.
average AUC of 0.79±0.12 (t-test, p <0.01). Notably, 9 subjects reached an AUC above305
0.90 for Brake trials, and 5 subjects for Drive trials.306
The average AUC of Brake trials for Group1 is 0.82±0.15 and for Group2 is307
0.84±0.13 (t-test, p=0.59). For Drive trials, the average AUC of Group1 is 0.81±0.10308
and for Group2 is 0.76±0.12 (t-test, p=0.09). The comparison between the classification309
performance of Group2 and Group1 shows that classification performance of Brake trials310
is higher than Drive trials for Group2 ; while for Group1, the classification performance311
of Brake trials is very similar to Drive trials. Interestingly, the difference between Drive312
and Brake trials is larger for Group2 (The recordings with RT feedback for Brake trials).313

Action Prediction Based on Anticipatory Brain Potentials during Simulated Driving 11
The classification results reported in Figure 4 and 5 are based on features from314
a single electrode (Cz). We also tested whether classification performance improves315
when information from several electrodes is taken into account. To this end, we choose316
a Bayesian fusion technique at the level of classifiers [13]. Alternatively, the fusion317
could have been applied at the level of features (e.g. putting together the features318
of different EEG channels). However, the latter requires a larger amount of data due319
to the increased feature dimensionality. Figure 6 shows the classification results for320
different combinations of electrodes. The electrode configurations are chosen by the321
order of increased Euclidean distance from the Cz electrode location. As can be seen322
in the Figure 6, increasing the number of electrodes lead to very similar classification323
performance to just using the Cz electrode (The configuration with three electrodes on a324
vertical line resulted in slightly higher AUC than just using a single electrode. However,325
the difference is not statistically significant). Hence, these results suggest that a single326
classifier trained with single electrode data is sufficient for the single trial classification.327
This can potentially be due to the pre-processing using the WAVG spatial filter, which328
corresponds to a smoothing function that includes the information of the surrounding329
electrodes.330
Having demonstrated the feasibility of differentiating between the Go and No-331
go conditions in single trials based on the activity of the electrode Cz for both332
types of events (Drive and Brake), we further analyzed the temporal behavior of the333
classification. To this end, as described in Section 2.3.2, we tested the classifiers using334
features computed from moving windows across time from the Cz electrode potentials.335
Note that for the purpose of detection of movement intention, we pooled the data of336
Drive and Brake trials. We tested four different classifiers -each trained on different337
windows with respect to the stimulus onset (w1-w4; c.f., Section 2.3.2)- on features338
extracted from moving windows starting from -6 s till 3 s, where 0 s correspond to the339
appearance of imperative stimulus (i.e. ‘Start’/‘Stop’ cue) and t=-4 s is the onset of340
appearance of the first stimulus ‘4’ cue on the screen.341
Figure 7 illustrates the results of the movement intention detection for each single342
subject using electrode Cz, and for the classification model trained based on the window343
w1 (ending at -200 ms before the stimuli). Each plot reports the average Go detection344
rate (GDR), across the four test folds. Each point of the curve corresponds to the345
percentage of trials being detected as Go epoch, which we denote as a measure of346
movement intention at time t. The time points of the plot’s x-axis correspond to the347
latest sample of the moving window decoded by the classifier. The chance level for each348
time point is calculated by shuffling the labels of the training data and performing 1000349
times 4-fold cross validation (the mean of chance level in blue and the 95% confidence350
interval in blue shadow).351
The GDR is above chance level for most participants (15 out of 18, except S5, S6,352
and S13) around the onset of the imperative stimulus. For all these participants, the353
GDR gradually raised above chance level and peaked earlier than the onset of imperative354
stimulus and the onset of movement. Interestingly, for most participants (e.g. S2) there355

Action Prediction Based on Anticipatory Brain Potentials during Simulated Driving 12
exist another peak on the GDR around -3 s, which seem to signify detection of the early356
negativity of the CNV potential. Interestingly, we obtain low GDR values (except for357
S5, S6, and S15) in the periods of -6 s to -4 s and 1 s to 3 s, i.e. outside the windows358
used for training the classifier, suggesting the decoder has high specificity.359
Figure 8 shows the peak GDR value for each window and its latency (the time360
when the highest performance is achieved) for the different training configurations (c.f.361
Figure 2). No statistical differences in the peak GDR were found across all training362
windows, what it is not the case for the latency (c.f., Figure 8). The earlier the training363
window, the earlier the GDR peak is detected. These results suggest that the movement364
intention can be detected based on the anticipation potentials as early as 320±200 ms365
before movement with an average detection rate of 0.77±0.12.366
0 0.5 10
0.5
1
mean AUC=0.78
S1
0 0.5 10
0.5
1
mean AUC=0.94
S2
0 0.5 10
0.5
1
mean AUC=0.95
S3
0 0.5 10
0.5
1
mean AUC=0.80
S4
0 0.5 10
0.5
1
mean AUC=0.67
S5
0 0.5 10
0.5
1
mean AUC=0.49
S6
0 0.5 10
0.5
1
mean AUC=0.92
S7
0 0.5 10
0.5
1
mean AUC=0.88
S8
0 0.5 10
0.5
1
mean AUC=0.96
S9
0 0.5 10
0.5
1
mean AUC=0.90
*S10
0 0.5 10
0.5
1
mean AUC=0.94
*S11
0 0.5 10
0.5
1
mean AUC=0.99
*S12
0 0.5 10
0.5
1
mean AUC=0.60
*S13
0 0.5 10
0.5
1
mean AUC=0.88
*S14
0 0.5 10
0.5
1
mean AUC=0.67
*S15
0 0.5 10
0.5
1
mean AUC=0.95
*S16
0 0.5 10
0.5
1
mean AUC=0.76
*S17
0 0.5 10
0.5
1
mean AUC=0.92
*S18
Figure 4. Individual classification performance for Brake trials. Subjects S1-S9,Group 1, did not receive RT feedback (S1-S6 with projection screen, S7-S9 with3D screens), whereas subjects S10-S18, Group 2, with 3D screen and received RTfeedback for the Brake trials. ROC curves and mean AUC values for all subjects (4-fold cross-validation). The dotted red line represents random performance and solidlines represents the ROC curves for each of the 4 folds. The mean AUC values areshown at the bottom of each ROC curve.

Action Prediction Based on Anticipatory Brain Potentials during Simulated Driving 13
4. Discussion367
In this study we investigated the existence of EEG correlates of anticipatory signals368
during driving. Firstly, the experiments conducted with 18 healthy participants shows369
that anticipatory event-related potentials, consistent with CNV signals reported in370
the literature [10, 11, 13], can be also observed in a simulated driving environment.371
Additionally, as can be seen in Figure 3.a, a small negative detection starting after the372
first warning stimulus (‘4’ cue) is also observed. The presence of a small negativity373
after the first warning stimulus and a relatively bigger negativity before the imperative374
stimulus (preceding the movement) is consistent with the bi-phasic negativity reported375
in previous studies with a single pair of warning-imperative stimuli [7, 24].376
Secondly, although our experiments involve realistic settings —and not simple377
setups and stimuli as it is customary—, single-trial detection rates are promising. In the378
current experiment, the EEG signatures of anticipatory processes may be affected by379
visual distractors that naturally occur in driving tasks. Despite this, high performances380
up to an average AUC of 0.83±0.13 for discrimination between the Go and No-go epochs381
0 0.5 10
0.2
0.4
0.6
0.8
1
mean AUC=0.76
S1
0 0.5 10
0.2
0.4
0.6
0.8
1
mean AUC=0.91
S2
0 0.5 10
0.2
0.4
0.6
0.8
1
mean AUC=0.91
S3
0 0.5 10
0.2
0.4
0.6
0.8
1
mean AUC=0.75
S4
0 0.5 10
0.2
0.4
0.6
0.8
1
mean AUC=0.73
S5
0 0.5 10
0.2
0.4
0.6
0.8
1
mean AUC=0.62
S6
0 0.5 10
0.2
0.4
0.6
0.8
1
mean AUC=0.90
S7
0 0.5 10
0.2
0.4
0.6
0.8
1
mean AUC=0.81
S8
0 0.5 10
0.2
0.4
0.6
0.8
1
mean AUC=0.93
S9
0 0.5 10
0.2
0.4
0.6
0.8
1
mean AUC=0.79
*S10
0 0.5 10
0.2
0.4
0.6
0.8
1
mean AUC=0.82
*S11
0 0.5 10
0.2
0.4
0.6
0.8
1
mean AUC=0.89
*S12
0 0.5 10
0.2
0.4
0.6
0.8
1
mean AUC=0.56
*S13
0 0.5 10
0.2
0.4
0.6
0.8
1
mean AUC=0.79
*S14
0 0.5 10
0.2
0.4
0.6
0.8
1
mean AUC=0.60
*S15
0 0.5 10
0.2
0.4
0.6
0.8
1
mean AUC=0.83
*S16
0 0.5 10
0.2
0.4
0.6
0.8
1
mean AUC=0.66
*S17
0 0.5 10
0.2
0.4
0.6
0.8
1
mean AUC=0.92
*S18
Figure 5. Individual classification performance for Drive trials. Subjects S1-S9,Group 1, did not receive RT feedback (S1-S6 with projection screen, S7-S9 used3D screens), whereas subjects S10-S18, Group 2, used 3D screen and received RTfeedback for the Brake trials. ROC curves and mean AUC values for all subjects (4-fold cross-validation). The dotted red line represents random performance and solidlines represent the ROC curves for each of the 4 folds. The mean AUC values areshown at the bottom of each ROC curve.

Action Prediction Based on Anticipatory Brain Potentials during Simulated Driving 14
Figure 6. Average performance, AUC, across all subjects for different electrodeconfigurations. The x-axis shows these electrode configurations in increasing thenumber of electrodes. The configuration with three electrodes on a vertical line resultedin slightly higher AUC than just using a single electrode. However, the difference isnot statistically significant (t-test performed on the AUC values of Drive and Braketrials across 18 subjects)
for Brake trials have been achieved. We also observed a difference in the peak of the382
CNV potentials for the Drive and Brake trials. The Brake trials exhibit a larger negative383
peak, and classification results also show better performance compared to Drive trials384
(mean AUC of 0.79±0.12). One possible explanation for these difference concerns the385
kind of movement that is performed in each case: for Drive trials, the subject waits for386
the ‘Go’ signal with the foot already placed on the gas pedal and just needs to push387
it, whereas, for the Brake trials the subject has to first release the gas pedal, move the388
foot to the brake pedal and then push it.389
Thirdly, movement detection using the moving window shows that these390
anticipatory potentials can be detected as early as 320±200 ms before the imperative391
stimulus with an average detection rate of 0.77±0.12 across 18 participants. Our results392
of movement intention detection from CNV potentials are in in-line with previous393
work on the self-paced movement intention detection [23, 15, 16]. Remarkably, we394
demonstrate low GDR values in the normal driving intervals (-6 s to -4 s and 1 s to 3 s),395
clearly outside the period of appearance of cues which is used for training. Such high396
specificity across time may be beneficial for online application.397

Action Prediction Based on Anticipatory Brain Potentials during Simulated Driving 15
−6 −5 −4 −3 −2 −1 0 1 2 30
0.5
1
S1
GD
R
−6 −5 −4 −3 −2 −1 0 1 2 30
0.5
1
S2
−6 −5 −4 −3 −2 −1 0 1 2 30
0.5
1
S3
−6 −5 −4 −3 −2 −1 0 1 2 30
0.5
1
S4
GD
R
−6 −5 −4 −3 −2 −1 0 1 2 30
0.5
1
S5
−6 −5 −4 −3 −2 −1 0 1 2 30
0.5
1
S6
−6 −5 −4 −3 −2 −1 0 1 2 30
0.5
1
S7
GD
R
−6 −5 −4 −3 −2 −1 0 1 2 30
0.5
1
S8
−6 −5 −4 −3 −2 −1 0 1 2 30
0.5
1
S9
−6 −5 −4 −3 −2 −1 0 1 2 30
0.5
1
S10*
GD
R
−6 −5 −4 −3 −2 −1 0 1 2 30
0.5
1
S11*
−6 −5 −4 −3 −2 −1 0 1 2 30
0.5
1
S12*
−6 −5 −4 −3 −2 −1 0 1 2 30
0.5
1
S13*
GD
R
−6 −5 −4 −3 −2 −1 0 1 2 30
0.5
1
S14*
−6 −5 −4 −3 −2 −1 0 1 2 30
0.5
1
S15*
−6 −5 −4 −3 −2 −1 0 1 2 30
0.5
1
S16*
GD
R
Time (s)
−6 −5 −4 −3 −2 −1 0 1 2 30
0.5
1
S17*
Time (s)
−6 −5 −4 −3 −2 −1 0 1 2 30
0.5
1
S18*
Time (s)
Figure 7. The results of movement intention detection through the Go detection rate(GDR) measure for all subjects. Classification performance is estimated using thetraining window ending -200 ms (w1) and testing during the time interval [-6,+3] s.The shaded region surrounding the average GDR illustrates the standard deviationat each point. The vertical red line in red color refers to the onset of the imperativestimulus; ‘Start/Stop’. The black vertical line corresponds to the onset of the lastwarning stimulus. The chance level for each time point is calculated by shuffling thelabels of the training data and performing 1000 times 4-fold cross validation (the meanof chance level in blue and the 95% confidence interval in blue shadow).

Action Prediction Based on Anticipatory Brain Potentials during Simulated Driving 16
Figure 8. Performance of classifiers trained on different windows: on the left, thepeak detection rates are indicated and on the right, the timing of the peak detectionrates for various training windows (w1: 200 ms, w2: 300 ms, w3: 400 ms, w4: 500 ms).No statistical differences in the peak GDR were found across all training windows,what it is not the case for the latency. The earlier the training window, the earlier theGDR peak is detected.
5. Conclusions and Future works398
This study presents and demonstrates the possibility of discriminating the anticipation-399
related potentials and predicting movement onset from scalp EEG during simulated car400
driving. It is worth noting that during the experiment, the subjects needed to process401
changing visual inputs. The immediate future step, before testing our methods in a real402
car, is to conduct online experiments with more realistic driving scenarios (real traffic403
lights, inclusion of other vehicles) to assess the real-time detection of anticipatory signals.404
Complementary to other approaches for the early detection of movement onset or405
intention to move by means of various EEG correlates appearing in self-paced movement406
tasks [15, 17, 16], we are the first, to the best of our knowledge, to prove the possibility407
of predicting the subject’s voluntary intention in response to external events during408
driving (e.g. the count-down warning cues resemble the traffic lights in real driving) by409
means of detecting anticipatory brain potentials. This approach also complements other410
efforts on decoding neural correlates during driving tasks, in particular, the recent study411
on the detection of the intention of emergency braking [4, 5, 6]. Our results support412
the feasibility of BCI systems for future cars in order to predict the driver’s movement413
intentions. Predicting the driver’s will can be beneficial as the driving assistance system414
will be aligned with the driver’s intention. Thus, in the scenario of the traffic lights415
described in this paper, the driving assistance system can exploit the BCI output to416
provide support as follows. In the case that the driver is not aware of the traffic light417
changing colors, no anticipatory brain potentials are generated and the BCI detects no418
intention to execute a movement. The driving assistant could then provide a warning419

Action Prediction Based on Anticipatory Brain Potentials during Simulated Driving 17
to the driver who would have time to brake by himself, preventing the car to generate420
an emergency brake at the last moment that may cause him a negative surprise. On the421
other hand, detecting the planned action before its execution also brings advantages as422
it enhances the driver’s experience: it will ensure a seamless interaction between the car423
and the driver, promoting the car to behave as a truly extension of driver’s body.424
6. Acknowledgement425
The work was supported by Nissan Motor Co. Ltd., under the ‘Research on Brain426
Machine Interface for Drivers’. The authors would like to thank Gangadhar Garipelli,427
Huaijian Zhang, and Serafeim Perdikis for their valuable comments and help with the428
design of the experimental protocol, as well as valuable discussions regarding the analysis429
and proofreading.430
References431
[1] C. H. Chuang, P. C. Lai, L. W. Ko, B. C. Kuo, and C. T. Lin, “Driver’s cognitive state432
classification toward brain computer interface via using a generalized and supervised technology,”433
in International Joint Conference on Neural Networks, 2010, pp. 1–7.434
[2] F. C. Lin, L. W. Ko, S. Chen, C. Chen, and C. Lin, “EEG-based cognitive state monitoring and435
predition by using the self-constructing neural fuzzy system,” in International Symposium on436
Circuits and Systems, 2010, pp. 2287–2290.437
[3] C. Dijksterhuis, D. de Waard, K. Brookhuis, B. Mulder, and R. de Jong, “Classifying visuomotor438
workload in a driving simulator using subject specific spatial brain patterns.” Frontiers in439
Neuroscience, vol. 7, no. 149, 2013.440
[4] S. Haufe, M. S. Treder, M. F. Gugler, M. Sagebaum, G. Curio, and B. Blankertz, “EEG potentials441
predict upcoming emergency brakings during simulated driving,” Journal of Neural Engineering,442
vol. 8, no. 5, pp. 1–11, 2011.443
[5] S. Haufe, J. Kim, I. H. Kim, A. Sonnleitner, M. Schrauf, G. Curio, and B. Blankertz,444
“Electrophysiology-based detection of emergency braking intention in real-world driving,”445
Journal of Neural Engineering, vol. 11, no. 5, p. 056011, 2014.446
[6] I. H. Kim, J. W. Kim, S. Haufe, and S. W. Lee, “Detection of braking intention in diverse situations447
during simulated driving based on EEG feature combination,” Journal of Neural Engineering,448
vol. 12, no. 1, p. 016001, 2015.449
[7] W. G. Walter, R. Cooper, V. J. Aldridge, and W. C. Mccallum, “Contingent negative variation :450
An electric sign of sensorimotor association and expectancy in the human brain,” Nature, vol.451
203, pp. 380–384, 1964.452
[8] R. De Charette and F. Nashashibi, “Real time visual traffic lights recognition based on spot light453
detection and adaptive traffic lights templates,” in IEEE Intelligent Vehicles Symposium, 2009,454
pp. 358–363.455
[9] M. Omachi and S. Omachi, “Traffic light detection with color and edge information,” in 2nd IEEE456
International Conference on Computer Science and Information Technology. IEEE, 2009, pp.457
284–287.458
[10] W. Kirsch and E. Hennighausen, “ERP correlates of linear hand movements: Distance dependent459
changes.” Clinical Neurophysiology, vol. 121, pp. 1285–1292, 2010.460
[11] P. Kropp, A. Kiewitt, H. Gbel, P. Vetter, and W. Gerber, “Reliability and stability of contingent461
negative variation.” Applied Psychophysiology and Biofeedback, vol. 25, no. 1, pp. 33–41, 2000.462
[12] R. Chavarriaga, X. Perrin, R. Siegwart, and J. d. R. Millan, “Anticipation and error-related EEG463

Action Prediction Based on Anticipatory Brain Potentials during Simulated Driving 18
signals during realistic human-machine interaction: A study on visual and tactile feedback,”464
34th International Conference of the IEEE Engineering in Medicine and Biology Society, 2012.465
[13] G. Garipelli, R. Chavarriaga, and J. d. R. Millan, “Single trial analysis of slow cortical potentials:466
a study on anticipation related potentials,” Journal of Neural Engineering, vol. 10, p. 036014,467
2013.468
[14] N. Birbaumer, T. Elbert, A. G. Canavan, and B. Rockstroh, “Slow potentials of the cerebral cortex469
and behavior,” Physiological Reviews, vol. 70, pp. 1–41, 1990.470
[15] I. Niazi, N. Jiang, O. Tiberghien, J. Nielsen, K. Dremstrup, and D. Farina, “Detection of movement471
intention from single-trial movement-related cortical potentials,” Journal of Neural Engineering,472
vol. 8, p. 066009, 2011.473
[16] E. Lew, R. Chavarriaga, S. Silvoni, and J. d. R. Millan, “Detection of self-paced reaching movement474
intention from EEG signals,” Frontiers in Neuroengineering, vol. 5, p. 13, 2012.475
[17] R. Xu, N. Jiang, C. Lin, N. Mrachacz-Kersting, K. Dremstrup, and D. Farina, “Enhanced476
low latency detection of motor intention from EEG for closed loop brain computer interface477
applications,” IEEE Transactions on Biomedical Engineering, vol. 61, no. 2, pp. 288–296, 2014.478
[18] D. J. McFarland, L. M. McCane, S. V. David, and J. R. Wolpaw, “Spatial filter selection for EEG-479
based communication,” Electroencephalography and Clinical Neurophysiology, vol. 103, no. 3,480
pp. 386–394, 1997.481
[19] Z. Khaliliardali, R. Chavarriaga, L. A. Gheorghe, and J. d. R. Millan, “Detection of Anticipatory482
Brain Potentials during Car Driving,” in 34th Annual International Conference of the IEEE483
Engineering in Medicine and Biology Society, 2012, pp. 3829–3832.484
[20] R. O. Duda, P. E. Hart, and D. G. Stork, Pattern Classification, 2nd ed. New York: Wiley, 2001.485
[21] N. Bourdaud, R. Chavarriaga, F. Galan, and J. d. R. Millan, “Characterizing the EEG correlates of486
exploratory behavior,” IEEE Transactions on Neural Systems and Rehabilitation Engineering,487
vol. 16, no. 6, pp. 549–556, 2008.488
[22] T. Fawcett, “An introduction to ROC analysis,” Pattern recognition letters, vol. 27, no. 8, pp.489
861–874, 2006.490
[23] L. Gheorghe, R. Chavarriaga, and J. d. R. Millan, “Steering timing prediction in a driving simulator491
task,” in 35th Annual International Conference of the IEEE Engineering in Medicine and Biology492
Society, 2013, pp. 6913–6916.493
[24] N. Loveless and A. Sanford, “The impact of warning signal intensity on reaction time and494
components of the contingent negative variation.” Biological Psychology, vol. 2, no. 3, p. 217,495
1975.496
[25] G. Pfurtscheller, C. Neuper, C. Andrew, and G. Edlinger, “Foot and hand area mu rhythms,”497
International Journal of Psychophysiology, vol. 26, no. 1-3, pp. 121–135, 1997.498
[26] D. Bilt and D. Glas, “Detection of onset and termination of muscle activity in surface499
electromyograms,” Journal of Oral Rehabilitation, vol. 25, no. 5, pp. 365–369, 1998.500