act public service · 2.2 act public sector 31 2.3 act public service ... remain a quality ... the...
TRANSCRIPT
ACT Public ServiceState of the Service Report 2014

ACT Public ServiceState of the Service Report 2014

For further information please contact:
Commissioner for Public Administration Chief Minister, Treasury and Economic Development Directorate T: +61 (02) 6205 0358 or visit the Chief Minister, Treasury and Economic Development Directorate website at www.cmd.act.gov.au
Designed and typeset by:
ACTPS Shared Services GPO Box 158 Canberra City ACT 2601
© ACT Government, Canberra 2014
ISBN: 978-0-642-60622-8
Publication number: 14/1039
ACT Public Service - State of the Service Reportii

Contents Transmittal Certificate 1
Introduction 2
Commissioner for Public Administration Annual Report 4
B. Performance Reporting 5
B1. Organisational Overview 5
B2. Performance Analysis 8
B3. Community Engagement and Support 18
C. Governance and Accountability Reporting 19
C1. Internal Accountability 19
C4. Legislative Assembly Inquiries and Reports 21
D. Legislation Based Reporting 23
D1. Public Interest Disclosure 23
D2. Freedom of Information 23
D3. Human Rights Act 24
E. Human Resource Management Reporting 25
E2. Learning and Development 25
Appendix 1 – Compliance Index 26
The ACT Public Sector/Service Workforce 2013‐14 27
2.1 Workforce Profile 2013‐14 29
2.2 ACT Public Sector 31
2.3 ACT Public Service 34
2014 People Matter Survey 50
2014 Agency Survey 58
Introduction and Methodology 59
Study Results 61
Appendix 2 ‐ Definitions 100
Appendix 3 - Workforce Profile Information 104
iii

ACT Public Service - State of the Service Reportiv

1
C o m m i s s i o n e r f o r P u b l i c A d m i n i s t r a t i o n
Ms Katy Gallagher MLA
Chief Minister
ACT Legislative Assembly
London Circuit
CANBERRA ACT 2601
Dear Chief Minister
I am pleased to submit the annual report for the Commissioner for Public Administration (which is incorporated into the State of the Service Report 2014). The report provides an account of the management of the ACT Public Service during the reporting period 1 July 2013 to 30 June 2014, and focuses on the exercise of the Commissioner’s statutory powers and functions under the Public Sector Management Act 1994.
This report has been prepared in accordance with Section 7 of the Annual Reports (Government Agencies) Act 2004 (Annual Report Act) and the requirements prescribed in the Chief Minister’s 2013‐2014 Annual Report Directions. It has also been prepared in conformity with other relevant legislation.
I certify that the report is an honest and accurate account of the operations of the Office of Commissioner for Public Administration during the reporting period 1 July 2013 to 30 June 2014, that all relevant material and information is included, and that it complies with the Annual Report Directions. I also certify that fraud prevention has been managed in accordance with the Public Sector Management Standards 2006, Chapter 2, Division 2.1.3.
Section 13 of the Annual Report Act requires that you present the report to the Legislative Assembly within 3 months of the end of the reporting period.
Yours Sincerely
Bronwen Overton‐Clarke
Commissioner for Public Administration

ACT Public Service - State of the Service Report2
C o m m i s s i o n e r f o r P u b l i c A d m i n i s t r a t i o n
Introduction
As the ACT Public Service continues on its journey to embed the One Service model, 2013‐14 provided numerous activities which provided ongoing crucial and valued infrastructure and services to the citizens of the Australian Capital Territory and the surrounding region.
The year has been one of maturation for the ACT Public Service as the Values and Signature Behaviours articulated in the ACT Public Service Code of Conduct start to be subsumed into everyday practice. Further, the building of a high performing public service has been supported by the ACT Public Service Performance Framework, which enters its second year of operation since its implementation in July 2013.
To measure the effectiveness of the Framework, employees took part in the inaugural 2014 People Matter Survey in May 2014, which provided insights about the extent to which the ACT Public Service core Values and Signature Behaviours are known and are being demonstrated and applied within all workplaces across the ACT Public Sector.
The results show particular strength in the awareness of the ACT Public Service Values and Signature Behaviours, informal feedback and change management. While pleasing overall, the results reinforce the need to further embed the ACT Public Service Respect, Equity and Diversity Framework (RED Framework) and the ACT Public Service Performance Framework, to help allay the perceptions and realities of bullying. These results were not unexpected or dissimilar to results benchmarked against the Victorian Public Sector.
In support of innovation, and in the vein of continuous improvement, the RED Framework is being thoroughly reviewed to identify areas for improvement and maturation, and determine the RED Framework’s relevance going forward.
Stage One of the review of the RED Framework sought the ACT Public Service’s view of how the RED Framework sits and was undertaken in April 2014. It outlined that the RED Framework has successfully served its purpose as a foundation to support an ongoing dialogue about workplace behaviour. Indeed, directorates highlighted that the RED Framework remains relevant in the contemporary environment, and continues to add value.
The review was timely, as it aligns with the recommendations coming out of the Standing Committee on Health, Ageing, Community and Social Services Report No.2 on its Inquiry into ACT Public Service Aboriginal and Torres Strait Islander Employment ‐ particularly in regards to improvement opportunities for the ACT Public Service Employment Strategy for Aboriginal and Torres Strait Islander People, which is an element of the RED Framework. Importantly, the ACT Public Service Employment Strategy for People with Disability is also an element which is being reviewed.
Stage Two of the review seeks the ‘lived’ experience from internal and external stakeholders, and remains ongoing into the 2014‐15 reporting period. Stage Three will provide a report to the Commissioner for Public Administration (Commissioner) on the review, and will include recommendations.
The integrity framework across the ACT Public Service is being further supported by the roll‐out of a whole‐of‐government Public Interest Disclosure Tracking System which provides a mechanism for the tracking of public interest disclosures in line with the Public Interest Disclosure Act 2012, and provides notification to the Commissioner and respective heads of

3
C o m m i s s i o n e r f o r P u b l i c A d m i n i s t r a t i o n
entity’s that a disclosure has been received and tracks the movement of a disclosure through the relevant stages of the process.
The Public Interest Disclosure Guidelines were reviewed in March 2014 to ensure they remain a quality guidance tool since the implementation of the Public Interest Disclosure Act 2012. Relevant updates include further guidance about entity procedures and the tracking system, and minor and technical changes.
The coming year brings much opportunity as the ACT Public Service matures. Indeed, the ACT Public Service turns 20 years old in this reporting period, and thus it is also timely that our employment framework be renewed to ensure it suits our requirements as a developing organisation.
The Public Sector Bill 2014 (the Bill) will repeal the Public Sector Management Act 1994 and replace it with new legislation that removes overlaps and inconsistencies with the enterprise agreements. The repeal and replacement was recommended by Dr Allan Hawke AC in Governing the City State, and in recent times a number of other Australian jurisdictions have modernised the legislative basis for their public services. In this context, the Bill represents a significant step towards streamlining and modernising the ACT Public Service employment framework.
During 2014‐15 we will be examining opportunities for consolidation that One Service brings, including for single employment policies and learning and development projects. Collaboration and agility are important One Service themes that will be explored further in 2014‐15.
Bronwen Overton‐Clarke Commissioner for Public Administration

Commissioner for Public Administration Annual Report 2014
ACT Public Service - State of the Service Report4

5
C o m m i s s i o n e r f o r P u b l i c A d m i n i s t r a t i o n
CommissionerforPublicAdministrationAnnualReport2014
B.PerformanceReporting
B1.OrganisationalOverview
CommissionerforPublicAdministrationSection 18 of the Public Sector Management Act 1994 (the PSM Act), provides that the Chief Minister may appoint a person as Commissioner for Public Administration (the Commissioner). Under the PSM Act and the Public Sector Management Standards 2006 (the Standards) the Commissioner held the following powers in relation to the management of the ACT Public Service (the Service) during the 2013‐14 reporting period:
advise the Chief Minister on the management of the Service as a whole; in conjunction with the Chief Minister, make or amend Standards; with the approval of the Chief Minister, authorise management reviews in relation to
the Service or function of the Service, in whole or in part; conduct inspections of, make inquiries or undertake investigations into the
operations of government agencies; exercise any function given to the Commissioner by law; and redeploy an officer from the Service in certain circumstances.
In addition to powers prescribed in the PSM Act and Standards, the Commissioner holds powers and/or obligations under the:
Public Interest Disclosure Act 2012; Safety, Rehabilitation and Compensation Act 1988 (Cwlth); Commissioner for Environment Act 1993; ACT Public Service Enterprise Bargaining Agreements; Freedom of Information Act 1989; Legal Aid Act 1977 and; Legislative Assembly (Office of the Legislative Assembly) Act 2012.
The role of the Commissioner is a part‐time Statutory Office Holder role and was occupied by Mr Andrew Kefford, who also served as the Deputy Director‐General Workforce Capability and Governance Division (WCGD) within the (then) Chief Minister and Treasury Directorate (CMTD), for the reporting period.
For the purposes of management efficiency, the Commissioner made and continues to make use of the staff resources in the WCGD, particularly the Public Sector Management Group (PSMG). PSMG provides a central agency policy and advisory role for ACT Public Service employment, including developing and driving sector wide frameworks. WCGD also supports the Deputy Director‐General WCGD, and hence is well placed to support the Commissioner in the execution of his functions. In particular during the reporting period, the Commissioner relied on the services of a Principal Investigator employed within the PSMG of WCGD.

ACT Public Service - State of the Service Report6
C o m m i s s i o n e r f o r P u b l i c A d m i n i s t r a t i o n
The Commissioner plays a key role in promoting a positive workplace culture and standards of professional conduct across the ACT Public Sector (Sector). The review of the ACT Public Service Respect, Equity and Diversity Framework (RED Framework) and the strengthening of the ACT Public Service Code of Conduct (Code of Conduct) and Public Interest Disclosure Act 2012 (PID Act) are key examples of this work.
The Commissioner also acts in an advisory capacity across the Sector.
The Commissioner has investigative powers under the PSM Act which allows him to provide information and recommendations to the Head of Service, Directors‐General and agency heads. The Commissioner is often approached to use his good offices, to establish whether there are any systemic issues or systemic learnings for application across the Sector (as shown in the CIT investigation, which is now complete).
DelegationofPowersThe Commissioner has the power to make delegations under section 36 of the PSM Act. During the reporting period the Commissioner delegated the powers of the office to:
the Acting Executive Director, Continuous Improvement and Workers' Compensation Branch in CMTD (Mr. Michael Young) for the period 23 December 2013 to 20 January 2014.
2013‐14PrioritiesThe Commissioner’s annual priorities outline areas for specific focus and are endorsed by the Chief Minister. The Commissioner’s priorities for 2013‐14 comprised:
embedding a positive workplace culture and high standards of behaviour in the Service, in partnership with the Head of Service;
examining individual employment related grievances with a view to extract systemic learnings that might be applied across the Sector and assisting individuals to attain improved process outcomes;
promoting and embedding high standards of public administration across the Service, including in relation to complaints handling, and providing guidance on acceptable behaviours and standards of conduct for officials; and
exploring opportunities to remove or reduce internal red tape, and creating more efficient administrative procedures, for example the development of a streamlined tracking mechanism for handling Public Interest Disclosures (PID).
OutlookThe focus of the Commissioner for 2014‐15 will be to continue to foster a positive workplace culture and inculcate proper standards of conduct and behaviours across the Service. Opportunities for initiatives include:
using the ACT Public Service All Staff Survey (People Matter Survey) to establish a benchmark measure against which future improvements in workplace cultures and behaviour can be tracked and encourage the development of future workforce management strategies and response;

7
C o m m i s s i o n e r f o r P u b l i c A d m i n i s t r a t i o n
considering the recommendations resulting from the final report of the Review of the RED Framework to assess its currency and relevance as a document that supports a positive workplace culture;
finalising the implementation of the new Public Service Act 2015;
ensuring the streamlined approach to reporting Public Interest Disclosures continues through use of the newly developed Public Interest Disclosure Tracking System; and
promoting the newly revised Public Interest Disclosure Guidelines (the Guidelines) to further entrench the processes and approaches contained in the PID Act.
During the 2014‐15 period, there are likely to be significant changes to arrangements relating to the Office of the Commissioner. This change will result from the anticipated introduction of a new Public Sector Bill 2014 (the Bill), which at the time of writing, is intended to repeal and replace the PSM Act. The Bill will propose the establishment of the Office of Public Sector Standards Commissioner (PSS Commissioner), replacing the Commissioner. The occupier of the PSS Commissioner will be prohibited under the Bill from also being a member of the ACT Public Service. It is envisaged this will be a part‐time role, supported by Chief Minister, Treasury and Economic Development Directorate (CMTEDD) (which was established 7 July 2014 as part of changes to Administrative Arrangements). The PSS Commissioner will be established as a separate body and it is anticipated that the Office of PSS Commissioner will commence early to mid 2015.
It should be noted that upon appointment of the PSS Commissioner the outlook for 2014‐15 may be altered, dependant on the priorities of the PSS Commissioner. However, it is likely that some high priorities for the PSS Commissioner, in partnership with the Head of Service, will be driving the Code of Conduct and standards of behaviour, as well as ensuring consistency in the management and performance of executives including statutory office holders under the Bill.
IndustrialRelations,EnterpriseAgreementsEnterprise Agreements made under the Fair Work Act 2009 (Cwlth) grant the Commissioner certain powers. In limited circumstances, agreement provisions permit the Commissioner to carry out certain tasks related to employment in the service. These powers were not exercised in the reporting period.

ACT Public Service - State of the Service Report8
C o m m i s s i o n e r f o r P u b l i c A d m i n i s t r a t i o n
B2.PerformanceAnalysis
WorkSafety,RehabilitationandWorkers’CompensationBy notice under the Safety, Rehabilitation and Compensation Act 1988 (Cwlth) (‘SRC Act’), the Commissioner is identified as the principal officer of the Territory for the purposes of that Act and in that capacity has overall responsibility for workers’ compensation for the Sector (excluding ACTEW Corporation Limited).
The ACT Public Service Workers’ Compensation and Work Safety Improvement Plan (‘the Improvement Plan’) was instigated by the ACT Government as part of the 2011‐12 Budget. The Improvement Plan consists of a series of aligned and mutually reinforcing elements designed to significantly improve the management of workers’ compensation and work health and safety issues. The elements include:
a sector‐wide case management model; strengthening the capability of case managers; building stronger people management skills in managers of staff; implementing enhancements to the existing ACT Public Service redeployment
framework; a strengthened partnership agreement and working relationship with Comcare; enhanced performance monitoring and reporting; implementation of the Work Health and Safety Act 2011 (‘WHS Act’) in the Service;
and development and implementation of a new accident and incident ICT system.
2013‐14 saw the continued delivery of a number of key initiatives against the improvement plan, further supporting the strategies initiated the previous year including:
continued delivery and implementation of the revised case management model focused on improved screening and triage of injured workers, the application of new policy, processes and procedures to support injured workers to return to work and the regular and systematic review of progress in returning injured workers to work;
continued implementation of the revised assurance framework that articulates the standards against which the case management of injured workers will be measured, providing for a quarterly internal audit against the standards to identify areas of strength and opportunities to improve performance; and
enhanced approaches to building people management capabilities for managers and supervisors across the Service continued to be implemented with the ongoing implementation of:
HR master class training for experienced supervisors and managers;
training for supervisors and managers on managing workers with an injury; and
additional specific training on managing workers with a psychological injury provided by an organisational and clinical psychologist.
The CMTD has continued to co‐ordinate a meeting of work health and safety professionals from across the Service to identify, develop and execute strategies to assist with the

9
C o m m i s s i o n e r f o r P u b l i c A d m i n i s t r a t i o n
implementation of the WHS Act. Work health and safety refresher training has been provided to executives to assist with ongoing compliance with the WHS Act, associated regulations and codes of practice.
In addition to this ongoing service delivery, during 2013‐14 CMTD:
finalised and rolled out an on‐line accident and incident reporting system enabling faster reporting and improved support services to maintain an injured worker while at work or in returning them to work; and
piloted the first stage of a whole of government allied healthcare professionals panel which will be executed under the improvement plan. Members of the panel will provide for clinical assessment, advisory, review and treatment services for ACT Government injured workers. The objectives of this pilot initiative are to support ACT Government injured workers to stay at work or return to work as quickly and safely as possible post injury, by providing access to independent and impartial expert medical opinion on a workers’ injury and their capacity for employment. Further, the pilot seeks to reduce workers’ compensation claim numbers and associated insurance premiums by providing injured workers access to timely medical assessment, treatment and ongoing clinical review services. As we move forward into a new reporting year, CMTEDD will undertake an evaluation of the pilot to ascertain the feasibility of continuing or expanding this program on an ongoing basis.
The Improvement Plan has been successful in improving performance by Sector directorates and agencies in managing health and safety risks, providing support to injured workers, and supporting rehabilitation and return to work programs for individuals. As in previous years, sustained effort will be required to continue the necessary improvements in the Sector’s workers’ compensation performance. This will remain a significant area of focus for the Commissioner in 2014‐15, as it will for all directorates and agencies.
ValuesandSignatureBehavioursDuring the 2013‐14 reporting period there has been a continued focus on embedding positive workplace culture and behaviours into everyday practice across the Service. This involves empowering employees to have ongoing conversations about performance and appropriate behaviours.
The ACT Public Service Performance Framework (Performance Framework) launched by the Head of Service on 10 July 2013, further instils the Values and Signature Behaviours in work practices, by asking all employees ‘what values or behaviours will be particularly relevant to their roles’ and ‘in what ways can improvements be made to how they work’. This is the first time that the Service has had a single common approach to performance management across agencies, with the Values and Signature Behaviours as the cornerstone. Performance Management now focuses as much on how work is done with others as much as what is achieved.
RespectEquityandDiversityFrameworkPSMG within the WCGD commenced a review of the RED Framework during the 2013‐14 financial year. The review of the RED Framework (the review) is being undertaken in the following three stages:

ACT Public Service - State of the Service Report10
C o m m i s s i o n e r f o r P u b l i c A d m i n i s t r a t i o n
Stage One
Stage One undertook a Governance and Environmental review to elicit the Service’s views on how the RED Framework sits in the contemporary integrity environment.
The Report on the Governance and Environmental Review of the RED Framework was finalised in April 2014, and reported that:
The RED Framework has been adopted
The RED Framework has successfully embedded the principles of Respect, Equity and Diversity into workplaces across the Service. It has served its purpose as a foundation to support an ongoing dialogue about workplace behaviour.
The RED Framework should be maintained
The Service has committed numerous resources to implement the RED Framework, and the commitment remains ongoing. The RED Framework remains relevant in the contemporary integrity environment, and continues to add value.
The RED Framework requires updating
Although the RED Framework should be maintained, it should be updated to amalgamate contemporary integrity documents, align language to support the now implemented One Service model and make relevant updates to Commonwealth and local legislation references. Significant consideration needs to be given to the forward direction of the ACT Public Service Employment Strategy for Aboriginal and Torres Strait Islander People and the ACT Public Service Employment Strategy for People with Disability.
Whole‐of‐Service monitoring and reporting can be improved
Whole‐of‐Service direction and monitoring should occur providing central oversight and drive for key RED Framework initiatives. Streamlining of directorate‐level reporting would benefit for the purposes of oversight and benchmarking.
Stage Two
Stage Two involves consulting with internal and external stakeholders through discussion papers to canvas the ‘lived’ experience of the RED Framework and options for its future maturation. Initially, submissions closed in May 2014, however the consultation period has been extended into the 2014‐15 financial year in order to gather more qualitative data to develop a comprehensive analysis and Final Report on the future of the RED Framework.
Stage Three Stage Three will incorporate feedback from both Stage One and Stage Two into a Final Report and provide recommendations for the future of the RED Framework. The Final Report will be provided to the Commissioner for consideration.

11
C o m m i s s i o n e r f o r P u b l i c A d m i n i s t r a t i o n
WorkforceProfileThe ACT Public Service Workforce Profile (Workforce Profile) is published by the Commissioner each financial year and provides a comprehensive, qualitative picture of the Service. The Workforce Profile captures aggregate workforce statistics and identifies trends that impact the Service.
AllStaffSurveyOn 28 April 2014, the Commissioner and the Head of Service jointly launched the inaugural ACT Public Sector All Staff Survey (the People Matter Survey). The People Matter Survey was delivered via the internet and via hard copies for front line and operational service delivery staff and closed 28 May 2014. The People Matter Survey delivers on a key commitment made by the Commissioner in the 2013 State of the Service Report.
The People Matter Survey has been delivered in collaboration with the Victorian Public Sector Commission and Australian Survey Research, and coordinated by staff within the now CMTEDD.
The People Matter Survey provides the Commissioner, the Head of Service and Directors‐General with the opportunity to develop an evidenced based understanding of the lived experience of employees across the Sector. In particular, the demonstration and application of the ACT Public Service core Values and Signature Behaviours in their immediate workplaces.
The results of the People Matter Survey provide data on the effectiveness of reform initiatives, including the creation of the Code of Conduct and Performance Framework. The results enable benchmarking across directorates/agencies and comparative analysis of results with the Victorian Public Sector (VPS), which has undertaken a comparable survey, and inform the ongoing implementation of localised directorate/agency specific staff surveys.
The ACT Public Service Strategic Board is currently considering the results of the People Matter Survey to inform the development of future workforce management strategies and/or targeted intervention initiatives for specific work areas.
In the main, the results are positive. In most cases they are commensurate with the results achieved in the VPS. In some cases, especially in the area of organisational change management, ACT Public Sector organisations appear to be doing much better than the VPS.
Awareness of the Code of Conduct, Values, Signature Behaviours, and the Performance Framework is strong. Given the central and critical nature of these policies and processes, an aspiration to achieve 100 per cent awareness is not unreasonable.
The existence of constructive informal performance feedback appears strong and widespread. However, the experience of formal performance feedback is much less prevalent.
ACT Public Service - State of the Service Report12
C o m m i s s i o n e r f o r P u b l i c A d m i n i s t r a t i o n
AgencySurveyThe 2013‐14 Agency Survey provides the Commissioner with a range of information in relation to broad management trends emerging across the Sector. Being the third consecutive year that the Agency Survey has run allows the Commissioner longitudinal tracking and the identification of trends across the Sector. The Agency Survey covers areas such as values, ethics and culture, workplace equity and diversity, workforce planning, attraction and retention, and human resource management.
CareTakerReviewThe CareTaker Guidelines were checked for relevance and reissued prior to the 2013 Federal Election and the ACT Aboriginal and Torres Strait Islander Elected Body Election.
PIDGuidelinesandwhole‐of‐governmentPIDtrackingsystemFollowing its publication in June 2013, the Commissioner reviewed the Public Interest Disclosure Guidelines 2013 (the Guidelines) in line with the commitment to review the document following 6 months of operation. The Guidelines serve as a foundation for the management and handling of public interest disclosures providing a clear and streamlined framework in which disclosures can be made appropriately, investigated fairly and responded to robustly in line with the PID Act.
In keeping with the commitment to ensuring that the Guidelines remain both accurate and accessible, feedback on the Guidelines was sought from all Heads of Entities, the People and Performance Council and Senior Executives Responsible for Business Integrity and Risk. The revised Guidelines include minor and technical changes and procedural updates such as revisions to procedures by each entity, protections for disclosers, critical timeframes and the addition of information regarding the PID Tracking System. The revised Guidelines were substantially completed during the 2013‐14 reporting period and were notified on the legislation register in July 2014.
In addition, during the reporting period a whole‐of‐government PID Tracking System was developed in collaboration with Canberra Connect. The PID Tracking System was developed to ensure that all individuals who make a disclosure under the PID Act are appropriately supported and their disclosure is properly, and carefully managed in line with the requirements of the PID Act. The PID Tracking System was made available to all public sector entities on 12 June 2014.
The PID Tracking System assists in ensuring the consistent, effective, management and storage of public interest disclosures across the sector. It provides a consistent mechanism for the management of public interest disclosures across the sector, and grants the Commissioner with oversight of all public interest disclosures. The PID Tracking System allows the head of each entity to view, and if necessary manage, public interest disclosures within their respective entity, ensuring there is accountability and transparency in process.
The PID Tracking System, together with the revised Guidelines, provide an enhanced structure by which employee concerns regarding serious wrongdoing within the Sector can be expressed appropriately and investigated fairly and properly. The development of the PID Tracking System is a step towards a streamlined approach to complaints handling across the Sector.
13
C o m m i s s i o n e r f o r P u b l i c A d m i n i s t r a t i o n
Complaints
CanberraInstituteofTechnologyThe first stage of the Commissioner’s review of allegations of bullying and harassment and other misconduct at the Canberra Institute of Technology (CIT) was completed during the 2012‐13 reporting period. The second stage of the investigation continued and was completed in the 2013‐14 reporting period. The Commissioner published his report entitled Colleagues Not Cases – Managing People and Resolving Workplace Issues in September 2013, and all matters were finalised by April 2014.
The most important single systemic conclusion to be drawn from the investigation was that there was no evidence to suggest a culture of entrenched and systemic workplace bullying across CIT. There were nevertheless a number of areas within CIT where the workplace culture has historically not been as good as it could have been, and the management of workplace issues has been demonstrably deficient.
The Commissioner made nine recommendations following the review. All recommendations have either been completed, or are in the process of being implemented through the People and Performance Council.
Throughout the review the Commissioner had no decision making powers on misconduct matters under relevant CIT enterprise agreements. Decisions have been properly made by delegates of the CIT Chief Executive, based on an investigation report independently conducted by experienced investigators attached to the Commissioners’ Office.
While the review has not been able to satisfy all complainants, the Commissioner remains of the view that had CIT had their current processes and frameworks in place prior, and crucially had those processes played out fairly and properly, experiences may have been different.
CIT remained under‐represented in complaints to the Commissioner during the 2013‐14 reporting period (in relation to total staff numbers), and has no active complaints from CIT staff under consideration. CIT mandates bullying awareness training for all staff. The Commissioner endorsed the CIT Code of Practice on 3 April 2014.
The challenge for CIT has become one of sustaining implementation effort and achievement, rather than completing more development work. There are already encouraging signs of structural, cultural, and behavioural change, and the commitment to ongoing monitoring is recognised and supported.
GeneralCommissionerComplaintsDuring the 2013‐14 reporting period the Commissioner received 38 complaints from employees across the ACT Public Sector in relation to the conduct of their colleagues, as well as employment related processes to which they were subject. The Commissioner did not see a significant change in numbers from previous years but noted that it is evident that we continue to see the effects of the introduction of the Code of Conduct, the RED Framework, and the Values and Signature Behaviours as to the improvement demonstrated throughout directorates in the overall management of complaints. Employees are integrating these frameworks/policies into their everyday work, through conversations starting around what

ACT Public Service - State of the Service Report14
C o m m i s s i o n e r f o r P u b l i c A d m i n i s t r a t i o n
the frameworks look like in the workplace, and ultimately that employees are calling inappropriate behaviour when they see it. The Commissioner assisted in the resolution of 30 matters and 8 remained ongoing as at 1 July 2014. Since, then a further four matters have been resolved in the 2014‐15 reporting period. The Commissioner received:
a total of seven complaints in relation to the Health Directorate, of which all are closed.
Four complaints in relation to the Community Services Directorate, of which three are closed and one remains ongoing.
Four complaints in relation to Commerce and Works Directorate of which all are closed.
One complaint in relation to Economic Development Directorate which is closed. One complaint in relation to the Environment and Sustainable Development
Directorate which is closed. Three complaints in relation to Territory and Municipal Services Directorate of which
two are closed, and one remains ongoing (ongoing matter closed in August 2014). Six complaints in relation to Justice and Community Safety Directorate, of which two
are closed and four remain ongoing (three of the ongoing matters closed in July/August 2014).
Two complaints relating to the Chief Minister and Treasury Directorate one of which is closed, and one that remains ongoing.
One complaint in relation to the Education and Training Directorate which is closed. One complaint in relation to the Capital Metro Agency which is closed. One complaint in relation to Work Safe ACT which remains ongoing. One complaint in relation to the Auditor‐General’s Office which is closed. One complaint regarding the Independent Competition and Regulatory Commission
which is closed. One complaint in relation to the Gambling and Racing Commission which is closed. One complaint regarding the Long Service Leave Authority which is closed. One complaint relating to Canberra Institute of Technology which is closed. One complaint in relation to the Land Development Agency which is closed. One external complaint was received and is closed.
There was an identified difference as to the subject matter of complaints being received during the 2013‐14 reporting period. A significant proportion of complaints received related to discipline, rather than bullying and harassment which was the identified trend in 2012‐13. Noting that the numbers of bullying and harassment claims have decreased portrays a view that management within Directorates is improving and provides us with knowledge that cultural shifts are occurring within the Sector.
ReviewofthePublicSectorManagementActThe PSM Act and Standards have not generally been maintained to complement the changing agreements, with the tendency being to use the Standards to plug gaps in legal authority without discarding outdated concepts. The resulting complex employment

15
C o m m i s s i o n e r f o r P u b l i c A d m i n i s t r a t i o n
framework has created inconsistent practices across the Service and led to confusion about the application of the PSM Act, as well as a high administrative burden in managing staff. Therefore, in October 2013, the Chief Minister requested a comprehensive review of the PSM Act to establish a modern, flexible, consistent and streamlined employment framework for the Public Sector. The review continues to be developed working alongside the Parliamentary Counsel’s Office.
The current ACT Public Service employment framework comprises enterprise agreements made under Fair Work Act 2009 (Cwlth) as the primary source of entitlements for non‐executive staff. These agreements prevail over Territory legislation. The role of the PSM Act and Standards therefore is being recast to remove repetitive clauses not established through the enterprise agreements, provide the main source of entitlements for executives, as well as additional rights, protections and entitlements for non‐executive staff.
The development of the Bill represents a significant step towards streamlining and modernising the ACT Public Service employment framework. In recent times a number of other Australian jurisdictions have modernised the legislative basis for their public services, and the Bill follows in these footsteps. The Bill has been drafted to repeal and replace the current PSM Act to cover all Sector entities except Territory Owned Corporations. The Bill also formally establishes the Service and contains heads of power for the employment of ACT public servants, by vesting all employment powers at the Head of Service level and applying the Values and Signature Behaviours to the whole of the Public Sector.
The major features of the Bill are:
high level employment heads of power with detail left to regulations and policy;
new public sector principles that set expectations of a high‐performing, efficient and accountable public sector;
inclusion of the Values and Signature Behaviours (Respect, Integrity, Innovation, Collaboration and best practice) which will explicitly apply to the whole public sector, including statutory officeholders and agency heads;
creation of the Office of PSS Commissioner (which will be a statutory appointment made by the Chief Minister) with functions relating to upholding public service values;
establishment of a Senior Executive Service in the ACTPS;
removal of the anachronistic concept of ‘office’ to facilitate staff mobility across directorates; and
the key concept of merit is refocused to concentrate on outcomes rather than simply an expression of process.
ConsequentialamendmentstothePublicSectorManagementAct1994There were two sets of consequential amendments to the PSM Act during the 2013‐14 reporting period. The first consequential amendment to the PSM Act was contained in the Auditor General Act 1996 (the AG Act), which came into effect on 20 February 2014. The AG Act amended references contained in the PSM Act ensuring the definition of ‘auditor‐general’s office’ is updated and reflected accordingly as per the AG Act.

ACT Public Service - State of the Service Report16
C o m m i s s i o n e r f o r P u b l i c A d m i n i s t r a t i o n
The second consequential amendment to the PSM Act, contained in the Legislative Assembly (Office of the Legislative Assembly) Act 2012 (‘the OLA Act’), came into effect on 1 July 2014. These amendments formally recognise the Auditor‐General, Ombudsman and the three Electoral Commission members as Officers of the Assembly. As part of these amendments, consequential amendments to the PSM Act were made to ensure that the same requirements for the Office of the Legislative Assembly are in place for the Officers of the Assembly. These requirements include creating the Officers of the Assembly as autonomous instrumentalities and providing a process for the Commissioner to conduct an inspection of, or make an inquiry or investigation into the operations of Officers of the Assembly with the written approval of the Speaker. Once that approval is given, the Commissioner is not subject to the direction of the executive or the Speaker. This process parallels the management review process.
AmendmentstothePublicSectorManagementStandards2006The Commissioner is empowered under section 251 of the PSM Act, with the approval of the Chief Minister, to make and amend Standards for the purpose of the PSM Act. During the reporting period two sets of amendments to the Standards were implemented.
DI2013‐187 (Effective 6 July 2013)
The Commissioner developed new Standards in relation to the engagement and performance management of executives under the PSM Act. These amendments addressed obstacles in relation to the recruitment of executives, as well as a desire to streamline the appointment processes. This work also reflected a deliberate intention, in consultation with the Head of Service, to extend the Values and Signature Behaviours to the Executive and embed expectations relating to conduct and performance in the performance management framework.
The new standard provides for a degree of flexibility to respond to issues surrounding the recruitment of executive employees by creating a power for the Head of Service to fix remuneration above the level set by the Standards and the Remuneration Tribunal in limited circumstances.
It also imports to the Standards conditions of employment that have previously been included in standard form executive employee contracts, either directly, by reference or implication. The aim of these changes is to simplify the employment framework that applies to executive employees by placing the majority of their conditions of employment in one instrument. It also established a new performance management regime for executive employees, mirroring that announced by the Head of Service for non‐executive employees. The provisions create requirements for a more rigorous and contemporary performance arrangement, with particulars to be determined by policy. The provisions also specify procedures and consequences relating to misconduct and underperformance.
DI2014‐66 (Effective 23 May 2014)
This set of amendments makes alterations to the Standards across three separate matters:
Identified Positions; Appointment; and Working with Vulnerable People (Background Checking).

17
C o m m i s s i o n e r f o r P u b l i c A d m i n i s t r a t i o n
Identified Positions
Section 29 of the Standards was amended, changing terminology previously used to identify a position restricted to Aboriginal or Torres Strait Islander persons from an ‘Identified Position’ to a ‘Designated Position’. This amendment ensures terminology used regarding eligibility for positions that are restricted to Aboriginal or Torres Strait Islander persons is current and consistent with terminology used by the Commonwealth Government and to limit any potential confusion about the definition of designated positions. The terminology will also be used for positions that are restricted to People with Disability.
Streamlined Appointment
Clause 53 of the Standards was also amended to preserve certain terms and conditions of employment from enterprise agreements which employees employed under the PSM Act may be appointed. These terms have been removed from enterprise agreements to maintain continuity. Placement in the Standards provides the ability, in future, to align these terms with changes to employment arrangements arising from the review of the PSM Act.
Working with Vulnerable People (Background Checking)
A new part, Part 4.9 has been inserted into the Standards. Part 4.9 provides the Head of Service with the necessary powers to exercise as an employer, and in a manner consistent with the requirements of the Fair Work Act 2009 (Cwlth). This enables the Head of Service to effectively manage employees who have had their Working with Vulnerable People registration suspended, restricted and/or lost registration. This includes providing the Head of Service with the power to retire an employee from the Service.

ACT Public Service - State of the Service Report18
C o m m i s s i o n e r f o r P u b l i c A d m i n i s t r a t i o n
B3.CommunityEngagementandSupportPSMG commenced a review of the RED Framework during the 2013‐14 financial year.
Discussion papers were distributed to key community stakeholders in the areas of Aboriginal and Torres Strait Islander affairs, and Disability affairs to canvas views of the ‘lived’ experience of the RED Framework, and options for its future maturation. The consultation also sought views particularly on the ACT Public Service Employment Strategy for Aboriginal and Torres Strait Islander People and the ACT Public Service Employment Strategy for People with Disability.

19
C o m m i s s i o n e r f o r P u b l i c A d m i n i s t r a t i o n
C.GovernanceandAccountabilityReportingC1.InternalAccountability
JointCouncilThe Commissioner chairs the ACT Public Service Joint Council established under the PSM Act. Joint Council is the peak union and management consultative committee for the Service and provides a forum for the consideration and exchange of information on matters of strategic interest to ACT Government employees and staff organisations.
Matters of strategic interest to the Service are not defined under the rules of the Joint Council, but instead are considered to be any significant issue that has, or might have, a multi‐directorate impact upon the employment of ACT Government employees. These matters include:
significant whole‐of‐government industrial relations issues;
significant whole‐of‐government human resource issues; and
significant administrative and communication issues.
Important matters discussed at Joint Council within the reporting period include:
employment arrangements for staff covered by the Working with Vulnerable People (Background Checking) legislation;
the Review of the PSM Act;
the ACT Public Service Workers’ Compensation and Work Safety Improvement Plan;
the introduction of the Healthy Weight Action Plan and concern over high sugar content vending machines;
the development of support documentation and training for managers and staff concerning the Performance Framework;
an application to the Fair Work Commission for an ACT Public Service Modernised Enterprise Award;
the Government’s commitment to supply child care facilities for staff who will work in new Government buildings with 500+ staff;
the Report of the Construction Safety Inquiry;
the introduction of the People Matter Survey;
streamlining of the Redeployment and Redundancy Framework;
the future establishment of a Behaviours guideline and Monitoring Group; and
consultation requirements relating to a transition to the National Disability Insurance Scheme (NDIS).

ACT Public Service - State of the Service Report20
C o m m i s s i o n e r f o r P u b l i c A d m i n i s t r a t i o n
WorkSafetyCouncilThe Work Safety Council is appointed by the Minister for Workplace Safety and Industrial Relations under the WHS Act. The Council is responsible for advising the Minister on matters relating to work safety, bullying and other psychosocial issues, and workers’ compensation. During the 2013 ‐14 reporting period, the Council has discussed a wide range of legislative and policy matters. This has included advice on amendments to Territory’s workers’ compensation legislation and the Fair Work Act 2009 (Cwlth) and proposed reform of the Holidays Act 1958.
The Council has also provided advice on nationally harmonised work, health and safety codes of practice, including a code of practice on workplace bullying. Similarly, the Council provided input to the adoption of harmonised workers’ compensation initiatives arising from national collaboration led by Safe Work Australia.
The Commissioner is appointed to the Council as a representative of employers, and in that capacity represents the interests of the Service on the Council.
StrategicBoardThe Commissioner is a member of the Strategic Board, which provides direction on whole‐of‐government issues, including in relation to the management and development of the ACT Public Sector workforce.

21
C o m m i s s i o n e r f o r P u b l i c A d m i n i s t r a t i o n
C4.LegislativeAssemblyInquiriesandReports
Committee Report Title Date Tabled
Standing Committee on Health, Ageing, Social and Community Services
Inquiry into ACT Public Service Aboriginal and Torres Strait Islander Employment Report Number 2
8 April 2014
The purpose of the Standing Committee on Health, Ageing, Social and Community Service (the Committee) Inquiry into ACT Public Service Aboriginal and Torres Strait Islander Employment was to review the ACT Public Service Employment Strategy for Aboriginal and Torres Strait Islander People at its midpoint, assess the effectiveness of actions in other jurisdictions and provide recommendations to the ACT Government about how outcomes can be improved.
The Committee tabled its Inquiry into ACT Public Service Aboriginal and Torres Strait Islander Employment Report Number 2 (the Report) in April 2014, which contained a total of 31 recommendations under nine main themes:
Employment Strategy Implementation (recommendations 1 – 2);
Recruitment (recommendations 3 – 9);
Retention (recommendations 10 ‐ 12);
Cross‐Cultural Training (recommendations 13 – 15);
Supporting the ACT Public Service Indigenous Staff Network (recommendations 16 – 20);
Recognition and Celebration (recommendations 21 – 22);
Training and Mentoring (recommendations 23 – 26);
Accountability and Reporting (recommendations 27 – 30); and
Indigenous Leadership Program (recommendation 31).
The Governments Response to the Report agreed to 14 recommendations, agreed in‐principle to 16 recommendations and noted one recommendation coming out of the Report. Further, the Government Response will address 20 recommendations contained in the Report in the context of the review of the ACTPS Respect, Equity and Diversity Framework.

ACT Public Service - State of the Service Report22
C o m m i s s i o n e r f o r P u b l i c A d m i n i s t r a t i o n
Office Report Title Date Tabled
Public Accounts Committee Report 5 Appropriation Bill 2013‐2014 (No 2)
6 May 2014
The Public Accounts Committee, in its Report 5 Appropriation Bill 2013‐2014 (No2), recommended that:
ACT Government directorates and agencies should ensure the investigation of bullying complaints, whatever the method of notification, in a timely manner; and
the ACT Government ensure, until such time as the conflict that exists between the obligations in relation to addressing bullying complaints contained within the two regulatory instruments currently in force is addressed, that the minimum standard for notification of bullying complaints should apply.
The recently negotiated ACT Public Service enterprise agreements include procedures for the investigation of complaints of misconduct. The Public Sector Workplace Relations Team are developing a Complaints Handling in the ACT Public Service manual to provide guidance on the revised procedures. In addition to work being undertaken in the implementation of new ACT Public Service enterprise agreements, the Commissioner and the Work Safety Commissioner are preparing advice on appropriate standards of investigation to satisfy legislative and procedural requirements.

23
C o m m i s s i o n e r f o r P u b l i c A d m i n i s t r a t i o n
D.LegislationBasedReporting
D1.PublicInterestDisclosure
As a statutory office holder with responsibilities across the Sector, the Commissioner is an authority for the purposes of the PID Act.
As mentioned in Section B2, the Public Interest Disclosure Guidelines 2014 are the procedures maintained by the Commissioner to receive and handle disclosures.
Details of Public Interest Disclosures received by the Commissioner during the 2013‐14 reporting period follow:
There were three disclosures received where the discloser alleged ‘disclosable conduct’ as described in section 8 (1) of the PID Act. Of the three disclosures; two were alleged maladministration and the other was alleged misconduct.
Investigations have been completed for two of three disclosures, with the third disclosure yet to be investigated.
The average time taken to complete the two investigations equated to three weeks.
One disclosure was referred to the Commissioner by another entity. The remaining two disclosures were made directly to the Office of Commissioner for Public Administration.
Two matters were referred by the Commissioner, in consultation with the Head of Service to Community and Services Directorate and Justice and Community Safety Directorate for independent PID assessment respectively.
No disclosures were determined that no further action was warranted by virtue of section 20 of the PID Act.
No disclosures have been substantiated and as such there has been no remedial action taken as a direct result of a PID allegation.
D2.FreedomofInformation
Section 7 Statement
Reporting of information under Section 7 of the Freedom of Information Act 1989 (‘FOI Act’) is reported in the CMTD Annual Report which is available on the Directorate’s website (www.cmd.act.gov.au).
Section 8 Statement
An index of documents that are used in making a decision or recommendation under an enactment or scheme is available from the CMTD FOI Coordinator or the Directorate's website (http://www.cmd.act.gov.au/functions/foi). This statement is current as at 30 June 2014.

ACT Public Service - State of the Service Report24
C o m m i s s i o n e r f o r P u b l i c A d m i n i s t r a t i o n
Section 79 Statement
During the 2013‐14 reporting period, the Commissioner received a total of five new requests and carried over one request from 2012‐13. Of the total six FOI requests:
five had decisions completed during the year; and
one remained ongoing as at 30 June 2013.
Overview of FOI Requests 2013‐14
Number of
Requests
Processing times Withdraw
n 0‐30 days
31 – 45 days
46 – 60 days
61 – 90 days 90+ days Not yet
finalised
61 ‐ 2 ‐ 1 2 12 ‐
1. Includes one carried over from 2012‐13 2. Includes a consultation period.
Outcomes of FOI Requests 2013‐14
Number of Requests
Full Release
Partial Release
Full Exemption
Technical Refusal
(No Documents
Exist) Withdrawn
Request carried over into the next year
6 ‐ 2 1 2 ‐ 1
The Commissioner received one internal review request during 2013‐14. The request was completed during the reporting period, with the internal review decision that the original claims were upheld.
D3.HumanRightsAct
The Commissioner had regard to the Human Rights Act 2004 (HR Act) in the exercise of statutory functions. As the Commissioner does not employ staff directly, the Office was not placed to provide education or training to staff on human rights principles. Neither did the Office distribute any internal information to staff on the legislative scrutiny process. The promotion of Human Rights is, however, implicit in the work of the Commissioner as a fundamental guiding principle.
The Commissioner did not prepare any Cabinet submissions during the reporting period and therefore was not required to ensure human rights compliance in this regard.

25
C o m m i s s i o n e r f o r P u b l i c A d m i n i s t r a t i o n
E.HumanResourceManagementReportingE2.LearningandDevelopment
ACTPublicSectorDevelopmentProgramsA number of whole of government professional development programs were offered across the Sector during the reporting period. In addition to strengthening the capabilities of participating staff, whole of government programs also offer the opportunity to build collaboration and strong networks across the Sector.
The Executive Leadership Development Program is designed to assist executives in forming a strategic mindset towards their roles and to identify and develop key capabilities required at the executive level. It was held in July 2013 and had 13 participants.
The Future Leaders Development Program is designed to prepare managers for the challenges of operating effectively at the senior manager level through the enhancement of leadership skills and building capability and capacity across the Sector. There were 38 participants for the course that was delivered in July.

C o m m i s s i o n e r f o r P u b l i c A d m i n i s t r a t i o n
Appendix1–ComplianceIndex
Due to the functions and/or structure of the Commissioner’s Office, the Commissioner does not report against the following sections of the Annual Report Directions:
B. Performance Reporting
B.4
C. Governance and Accountability Report
C.2 – C.3
C.5
D. Legislation Based Reporting
D.4 – D.8
E. Human Resources Management Reporting
E.1, E.3 – E.5
F. Financial Management Reporting
F.1 – F.6
ACT Public Service - State of the Service Report26

Workforce Profile
27

ACT Public Service - State of the Service Report28
C o m m i s s i o n e r f o r P u b l i c A d m i n i s t r a t i o n
TheACTPublicSector/ServiceWorkforce2013‐14The Workforce Profile provides a holistic overview of the ACT Public Sector and ACT Public Service workforce. It provides workforce statistics based on information from the ACT Public Service payroll system, Chris 21, as at the final pay of June 2014 (‘June 2014’) and indicators that apply to the period over the 2013‐14 financial year.
During this time the ACT Public Sector consisted of ten directorates in the ACT Public Service that reported to the Head of Service (the ACT Public Service), as well as staff employed under the Public Sector Management Act 1994 (PSM Act) in other ACT Public Sector Agencies. The ten directorates within the ACT Public Service account for approximately 89 per cent of the ACT Public Sector.
Shared Services, a division of the former Commerce and Works Directorate, administers all but one per cent of staff payroll across ACT Public Service directorates and provides the information for this report. For this reason, the majority of the report provides information on the directorates and agencies that are administered through Shared Services. Accordingly, it is important to note the independent status of some of these agencies, however due to administrative efficiencies they are grouped together.
The majority of the Workforce Profile provides a historical summary of indicators based on the ACT Public Service structure, including high‐level time series information over the past five years. This allows for time‐series comparison and incorporates retrospective updates that help to remove time‐lag in human resources data processing.
Historical figures may differ to figures from earlier publications, however discrepancies will primarily be due to definitional change, including the structural movements within the ACT Public Service, and to retrospective updates that reflect the time‐lag in the processing of some human resource data. Similarly, some of the data definitions and treatment of data in directorate annual reports can differ.
The Workforce Profile includes indicators related to employee numbers, salaries, commencements and separations, age and length of service, leave usage and diversity. Workforce indicators are based on paid staff and exclude employees on leave without pay, board members, contractors and employees on secondment to other jurisdictions. The data reported in this chapter (including the appendix) excludes contractors and staff of Territory Owned Corporations. These are point in time indicators and do not adjust for seasonal fluctuation, such as demand for casual teachers and back pay. Directorates and employee cohorts with small numbers are susceptible to fluctuation.
Please note that additional data is provided in appendices, including a detailed breakdown of each directorate’s full time equivalent (FTE), time to hire statistics and further information on the recruitment and higher duties actions of the ACT Public Service.
NOTE: As of 7 July 2014 the ACT Public Sector administrative arrangements changed, resulting in a restructure of directorates / agencies. As such, the list of directorates / agencies reported for the 2013‐14 workforce profile will be different for the 2014‐15 reporting year.

29
C o m m i s s i o n e r f o r P u b l i c A d m i n i s t r a t i o n
2.1WorkforceProfile2013‐14All ACT Public Service data and graphs do not include the following ACT Public Sector Agencies: Canberra Institute of Technology, Calvary Health Care (Public), Cultural Facilities Corporation, Auditor‐General’s Office and the Office of the Legislative Assembly.
Table 1 provides an overview of the structure of the ACT Public Sector. For the purposes of reporting;
Long Service Leave Authority and Independent Competition and Regulatory Commission are reported on separately to Chief Minister and Treasury Directorate (in most instances);
Shared Services is included in the reporting of the Commerce and Works Directorate;
Cultural Facilities Corporation is reported separately to Community Services Directorate;
Exhibition Park Corporation, Land Development Agency and Gambling and Racing Commission are included in the reporting of Economic Development Directorate;
ACTION is included in the reporting of Territory and Municipal Services Directorate;
Director of Public Prosecutions is included in the reporting of Justice and Community Safety Directorate; and
Auditor‐General’s Office, Calvary Health Care (Public), Canberra Institute of Technology, Cultural Facilities Corporation and Office of Legislative Assembly are reported on as a Public Sector Agency and accordingly are only reported on in Section 2.2.
NOTE*: Data has been rounded to 1 decimal place and as such, percentages may not add up to exactly 100 per cent on certain tables/graphs.
NOTE**: The calculation of a workforce average is based on the total available data for ACT Public Service directorates only. The average is a weighted means of groups that have varying numbers of employees and it is not a simple average of the figures for groups shown.

ACT Public Service - State of the Service Report30
C o m m i s s i o n e r f o r P u b l i c A d m i n i s t r a t i o n
Table 1: ACT Public Sector – ACT Public Service and other ACT Public Sector Agencies
ACT Public Service Agencies
ACT
Pub
lic Service
ACT
Pub
lic Sector
Capital Metro Agency
Chief Minister and Treasury Directorate
Long Service Leave Authority
Independent Competition and Regulatory Commission
Commerce and Works Directorate
Shared Services
Community Services Directorate
Cultural Facilities Corporation
Economic Development Directorate
Exhibition Park Corporation
Land Development Agency
Gambling and Racing Commission
Education and Training Directorate
Environment and Sustainable Development Directorate
Health Directorate
Justice and Community Safety Directorate
Territory and Municipal Services Directorate
ACTION
ACT Public Sector Agencies
Auditor‐General's Office
Director of Public Prosecutions
Calvary Health Care (Public)
Canberra Institute of Technology
Office of the Legislative Assembly

31
C o m m i s s i o n e r f o r P u b l i c A d m i n i s t r a t i o n
2.2ACTPublicSector2.21SummaryofACTPublicSector.
The ACT Public Sector consists of ten directorates as well as staff employed under the PSM Act. At June 2014, the ACT Public Sector employed 23,137 employees (based on headcount) representing 10.7 per cent of the Australian Capital Territory’s labour force1. Of these 23,137 employees, 20,551 people (88.8 per cent) were employed in the ACT Public Service and 2,586 people (11.2 per cent) were employed by an ACT Public Sector Agency. Table 2 shows the distribution of the ACT Public Sector. Table 2: Distribution of the ACT Public Sector (June 2014) Calvary
Health Care
(Public)
Cultural Facilities
Corporation
Office of the
Legislative Assembly
Canberra Institute of Technology
Auditor‐General's Office
ACT Public Service
Total
FTE total 1031.7 83.4 47.6 742.1 37.7 18,280.9 20,223.4
FTE ‐ permanent
821.3 31.0 39.6 484.4 28.7 14,683.4 16,088.4
FTE ‐ temporary
158.1 22.1 5.0 129.6 9.0 2875.1 3198.8
FTE ‐ casual 52.3 30.3 3.0 128.1 n/a 722.5 936.2
Headcount total
1389 126 59 975 38 20,551 23,137
Headcount ‐ permanent
987 37 43 521 29 15,901 17,518
Headcount ‐ temporary
175 25 5 152 9 3196 3562
Headcount ‐ casual
227 64 11 302 n/a 1454 2058
Age (average)
41.9 41.5 50.4 46.9 37.4 42.5 43.4
Length of service (average, years)
5.8 5.1 6.3 10 5.7 8.6 6.9
Separation rate (average permanent headcount)
11% 11% 13% 5.9% 15.6% 6.2% 10.4%
1. Australian Bureau of Statistics, Labour Force Australia 6202.0, Australia 2014.

ACT Public Service - State of the Service Report32
C o m m i s s i o n e r f o r P u b l i c A d m i n i s t r a t i o n
Diversity (FTE, headcount):
Aboriginal and Torres Strait Islanders
n/a n/a n/a 11.9(FTE) 17(HC)
n/a 235.1 (FTE)
253 (HC)
247 (FTE) 270 (HC)
People with disability
n/a n/a (FTE) n/a (HC)
n/a 15.9 (FTE) 22 (HC)
2.0(FTE) 2(HC)
368.7 (FTE)
415 (HC)
387.6 (FTE)
440 (HC)
Culturally & linguistically diverse
n/a 5 (FTE) 5 (HC)
n/a 123.6(FTE) 160 (HC)
17.0(FTE) 17(HC)
3140.4 (FTE) 3453 (HC)
3286 (FTE)
3635 (HC)
Female FTE 809.1 44.4 29.1 442.6 18.8 11468.6 12811.8 Female Headcount
1099 71 34 613 19 13307 15143
N/A = reporting on this data may inadvertently identify individuals or individual cases.
2.22OverviewoftheACTPublicSectorAt June 2014, the ACT Public Sector was represented by a FTE workforce of 20,223.4 (up from 19,798.22 at June 2013), and headcount of 23,137 (up from 22,6673 at June 2013). The overall ACT Public Sector has had an increase of 2.1 per cent in the workforce. This increase is larger than that of the total increase of the Australian labour workforce of 0.9 per cent4.
The headcount for permanent officers at June 2014 was 17,518 or 75.7 per cent of all employees. The headcount for permanent officers has increased by 0.4 per cent when compared to the headcount at June 2013 (17, 077 or 75.3 per cent5).
As a proportion of the ACT Public Sector, the health and education portfolios continue to represent the majority of the workforce with a combined total of 63.7 per cent (based on FTE).
At June 2014, Aboriginal and Torres Strait Islander employees were represented by a headcount of 270 (up from 258 at June 2013), or 1.2 per cent of all employees. Employees who identified
2 The 2013 ACT Public Service State of the Service Report reported the 2012‐13 FTE workforce count for the ACT Public Sector as 19,793.3. This number has been amended to reflect the correct data as 19,798.2.
3 The 2013 ACT Public Service State of the Service Report reported the 2012‐13 headcount for the ACT Public Sector as 22,671. This number has been amended to reflect the correct data as 22,667.
4 Australian Bureau of Statistics, Labour Force Australia 6202.0.
5 The 2013 ACT Public Service State of the Service Report reported the 2012‐13 permanent headcount as 18,187 or 80.3%. This number has been amended to reflect the correct data as 17,077 or 75.3%. The 2013 ACT Public Service State of the Service Report reported the 2012‐13 total headcount for temporary and casual workforce as 4,474. This data has been amended to reflect the correct data as 5,590.

33
C o m m i s s i o n e r f o r P u b l i c A d m i n i s t r a t i o n
as People with Disability were represented by a headcount of 438 (up from 408 as June 2013) or 1.9 per cent of all employees
Table 3: Snapshot of the ACT Public Sector (June 2013 ‐ June 2014)
June 2014 June 2013
FTE total 20,223.4 19,798.26 FTE ‐ permanent 16,088.4 15,760.7 FTE ‐ temporary 3,198.8 3,089.0 FTE ‐ casual 936.2 948.4 Headcount total 23,137 22,6677 Headcount ‐ permanent 17,518 17,077 Headcount ‐ temporary 3,562 3,4648 Headcount ‐ casual 2,058 2,126 Age (average) 43.4 43.2 Length of service (average, years)
6.9 6.8
Separation rate (average permanent headcount)
10.4% 12.0%
Diversity (FTE), (HC): Aboriginal and Torres Strait Islanders
247 (FTE) 270 (HC)
231.1(FTE) 258(HC)
People with disability 387.6 (FTE) 440 (HC)
361.5 (FTE) 408 (HC)
Culturally & linguistically diverse
3,286 (FTE) 3,635 (HC)
3,081.2 (FTE) 3,399 (HC)
Female FTE 12,811.8 12,543.6 Female Headcount 15,143 14,8529
6 The 2013 ACT Public Service State of the Service Report reported the 2012‐13 FTE workforce count for the ACT Public Sector as 19,793.3. This number has been amended to reflect the correct data as 19,798.2.
7 The 2013 ACT Public Service State of the Service Report reported the 2012‐13 headcount for the ACT Public Sector as 22,671. This number has been amended to reflect the correct data as 22,667.
8 In the 2013 ACT Public Service State of the Service Report, the Permanent headcount was reported on incorrectly as 18,187 or 80.3%. It should have been 17,077 or 75.3%. The total headcount for temporary and casual workforce was reported incorrectly as 4,474. The correct headcount is 5590.
9 The 2013 ACT Public Service State of the Service Report reported the 2012‐13 the total headcount for females as 14,849. This number has been amended to reflect the correct data as 14,852.

ACT Public Service - State of the Service Report34
C o m m i s s i o n e r f o r P u b l i c A d m i n i s t r a t i o n
2.3ACTPublicServiceThe ACT Public Service consists of ten directorates that report to the Head of Service (See Table 1), and together represent approximately 89 per cent of the ACT Public Sector. At June 2014, FTE was 18,280.9 (up from 17,848.5 at June 2013) and headcount was 20,551 (up from 20,017 at June 2013). The ACT Public Service workforce has had an increase of 2.7 per cent. This increase is larger than that of the total increase of the Australian labour workforce of 0.9 per cent.10 The following tables provide a comprehensive overview of the ACT Public Service Workforce.
2.31 Snapshot of ACT Public Service
The following sections explore key demographic indicators for the ACT Public Service workforce in more detail.
Table 4: Snapshot of the ACT Public Service workforce – June 2014
Total employees (headcount) 20,551 Executives (headcount) 21311
Total employees (FTE) 18,280.9Length of service (average, excluding casuals)
8.6 years
Employees by Agency (based on headcount) Gender Pay Gap 1.7% Chief Minister and Treasury 279 Separation Rate 6.2% Long Service Leave Authority 11 Separation rate by age Independant Competition and Regulatory Commission 10 Generation Y 7.1% Capital Metro Agency 18 Generation X 4.1% Commerce and Works 1122 Baby Boomers 8.3% Community Services 1331 Pre‐Baby Boomers 25.0% Economic Development 229 Personal Leave (days) Exhibition Park in Canberra 12 Chief Minister and Treasury 10.3 Gambling and Racing Commission 34 Long Service Leave Authority 12.3
Land Development Agency 104Independant Competition and Regulatory Commission 6.2
Education and Training 6170 Capital Metro Agency 15.7 Environment and Sustainable Development 449 Commerce and Works 11.9 Justice and Community Safety 1934 Community Services 12.1 Health 6797 Economic Development 8.1 Territory and Municipal Services 2051 Exhibition Park in Canberra 5.4
10 Australian Bureau of Statistics, Labour Force Australia 6202.0.
11 The headcount of 213 executives includes 178 executives and 35 employees who own a nominal position within the ACT Public Service but are on a short‐term contract for purposes such as backfilling.

35
C o m m i s s i o n e r f o r P u b l i c A d m i n i s t r a t i o n
Employment type Gambling and Racing Commission 11.8 Permanent 77.4% Land Development Agency 9.4 Temporary 15.6% Education and Training 9.4
Casual 7.1%Environment and Sustainable Development 12.6
Full time / part time Justice and Community Safety 12.8 Full time 70.1% Health 11.1 part time 22.9% Territory and Municipal Services 13.2
Casual 7.1%ACTPS Average Personal Leave Usage 11.5
Annual pay rate (full time employees, average per annum) Diversity
Generation Y $72,511Aboriginal and Torres Strait Islanders 1.2%
Generation X $86,088 People with Disability 2.0%
Baby Boomers $87,451Culturally and Linguistically Diverse 16.8%
Pre‐Baby Boomers $86,005 Gender
Annual pay rate (excluding casual staff) Male 35.2% <$39,000 0.4% Female 64.8% $40,000‐$59,000 19.9% Age $60,000‐$79,000 35.0% Generation Y 29.2% $80,000‐$99,000 25.0% Generation X 37.5% $100,000‐$119,00 10.5% Baby Boomers 32.5% >$120,000 9.2% Pre‐Baby Boomers 0.8%
*This excludes casual staff and staff employed by ACT Public Sector agencies.

ACT Public Service - State of the Service Report36
C o m m i s s i o n e r f o r P u b l i c A d m i n i s t r a t i o n
2.32AgeprofileThe age profile of ACT Public Service employees for the 2013‐14 period is fairly evenly spread over the 20 – 69 age groups. Of the 20,551 ACT Public Service employees, 17.8 per cent were 29 years old or younger, 50.2 per cent were between the ages of 30 and 49 years old and 32.0 per cent were over the age of 50 years old.
Graph 5: Age profile of the ACT Public Service workforce (June 2014)
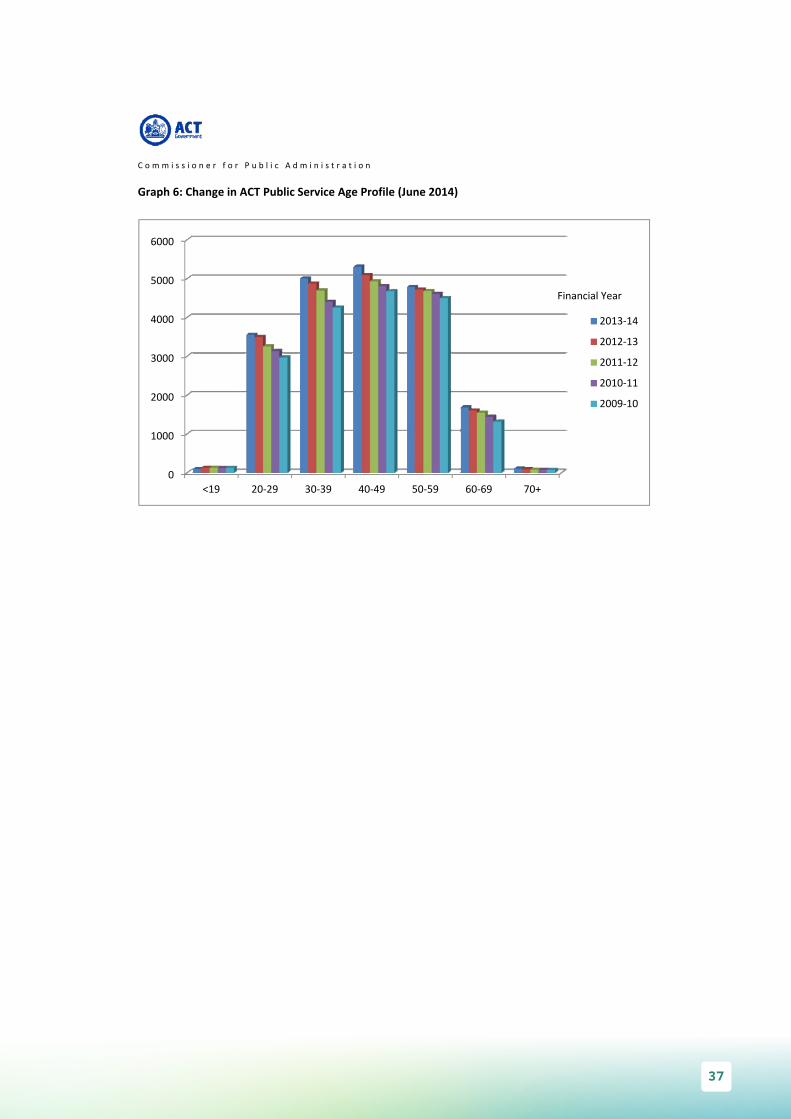
Graph 6 illustrates the change in the age of the ACT Public Service workforce over a five year period. The graph shows that over the last five years there have been slight changes in the proportion of each age group within the ACT Public Service. The biggest growth over the five year period is that of the 70+ age group with a growth rate of 41.3 per cent. It can be seen that overall, the ACT Public Service workforce is ageing, with the age group <19 experiencing the only decrease (19.8 per cent decrease over five year period). Consistent with the five year trend, the 70+ age group has experienced the largest growth (14.0 per cent) during the period. It is important to note that this age group makes up only 0.5 per cent of the total ACT Public Service workforce.
0
1000
2000
3000
4000
5000
6000
<19 20‐29 30‐39 40‐49 50‐59 60‐69 70+
101
3558
50065309
4789
1682
106
Num
ber o
f employees (he
adcoun
t)
Age Group
37
C o m m i s s i o n e r f o r P u b l i c A d m i n i s t r a t i o n
Graph 6: Change in ACT Public Service Age Profile (June 2014)
0
1000
2000
3000
4000
5000
6000
<19 20‐29 30‐39 40‐49 50‐59 60‐69 70+
2013‐14
2012‐13
2011‐12
2010‐11
2009‐10
Financial Year

ACT Public Service - State of the Service Report38
C o m m i s s i o n e r f o r P u b l i c A d m i n i s t r a t i o n
2.33GenderprofileThe ACT Public Service workforce is comprised of 13,307 female employees, equivalent to 64.8 per cent of the workforce (based on total headcount). This is approximately 20.0 per cent more females than the ACT labour force (47.7 per cent).12 In comparison, male employees total 7,244, or 35.2 per cent of the ACT Public Service workforce. As shown in Graph 7 there are more females than males in all age groups across the ACT Public Service. Of all age groups, the highest proportion of females is in the 20‐29 group at 68.8 per cent. The lowest proportion of females is in the 70+ age group at 55.7 per cent. Graph 7: Gender Profile by Age Group (June 2014)
NOTE: Data inclusive of casual staff.
Females within the ACT Public Service are generally paid slightly less than their male counterparts with a gender pay gap of 1.7 per cent. As can be seen in Graph 8, there are fewer women in the highest paid roles (with salaries over $120,000). There are notably more females in the $60,000‐$99,000 salary groups. This is to be expected when taking into consideration the higher proportion of females in the workforce overall, in particular women working in teaching and nursing roles.
12 Australian Bureau of Statistics, Labour Force Australia 6202.0
0
500
1000
1500
2000
2500
3000
3500
<19 20‐29 30‐39 40‐49 50‐59 60‐69 70+
62
2449
3237
3422
3069
1009
5939
1109
1769
1887
1720
673
47
Num
ber o
f employees (he
adcoun
t)
Age Group
Female
Male

39
C o m m i s s i o n e r f o r P u b l i c A d m i n i s t r a t i o n
Graph 8: Gender Profile by salary range (June 2014)
Note: This excludes the casual workforce.
0
500
1000
1500
2000
2500
3000
3500
4000
4500
39
2381
4274
3437
1283864
32
1423
2415
1341
725883N
umbe
r of E
mployees
Salary Range
Female
Male

ACT Public Service - State of the Service Report40
C o m m i s s i o n e r f o r P u b l i c A d m i n i s t r a t i o n
2.34PartTimeemploymentEmployees who work part time make up approximately one fifth of the ACT Public Service workforce. At June 2014, 4,696 employees (or 22.9 per cent of the ACT Public Service workforce) worked part time, the equivalent of approximately 3,249.6 full time employees.
At 22.9 per cent, the percentage of part time employees in the ACT Public Service is lower than both the percentage of part time employees in both the ACT labour force13 (25.3 per cent) and the Australian labour force14 (30.2 per cent).
Graph 9: Headcount by employment mode (June 2014)
The majority of ACT Public Service part time employees are female (84.9 per cent). This is slightly higher than the percentage of female part time employees in the Australian labour force at 1 July 2014 (69.9 per cent15).
It can be seen in both the ACT Public Service, and the Australian labour force, that the percentage of females working part‐time is significantly higher than the percentage of males working part‐time. Of all female employees in the ACT Public Service, 30.0 per cent work part time, compared to 9.8 per cent of all male employees. In the Australian labour force16, 46.0 per cent of all females work part time, compared to 16.8 per cent of all males.
13 Australian Bureau of Statistics, Labour Force Australia 6202.0
14 Australian Bureau of Statistics, Labour Force Australia 6202.0
15 Australian Bureau of Statistics, Labour Force Australia 6202.0
16 Australian Bureau of Statistics, Labour Force Australia 6202.0
Permanent full‐time
Permanent part‐time
Temporary full‐time
Temporary part‐time
Casual
7.1%
58.1% 19.3%%
12.0%
3.6%

41
C o m m i s s i o n e r f o r P u b l i c A d m i n i s t r a t i o n
Table 10: Part Time employment by diversity – June 2014
ACT Public Service
Females Culturally and
Linguistically Diverse
People with
Disability
Aboriginal and Torres
Strait Islanders
Permanent Part time
3965 3400 602 87 26
Temporary Part time
731 589 96 10 15
Total Part time 4696 3989 698 97 41
Most part time employees are employed on an ongoing basis, with permanent part time employees making up 84.4 per cent of all part time employees.
At June 2014, Cultural and Linguistically Diverse employees made up 14.9 per cent of the total part time employees. People with Disability and Aboriginal and Torres Strait Islanders made up 2.1 per cent and 0.9 per cent respectively.
The average salary for a part time employees at June 2014 was $74,328. On average, female employees working part time were paid marginally more (one per cent) than their male counterparts. The average female part time salary was $74,442, and average male part time salary was $73,686.

ACT Public Service - State of the Service Report42
C o m m i s s i o n e r f o r P u b l i c A d m i n i s t r a t i o n
2.35CulturalandLinguisticDiversityTable 11: Cultural and Linguistic Diversity Employees 2010‐2014
June 2010 June 2011 June 2012 June 2013 June 2014
Headcount 2,363 2,495 2,663 3,218 3,453
Percentage of total workforce 13.2% 13.4% 13.8% 16.1% 16.8%
At June 2014, employees who identified as Culturally and Linguistically Diverse totalled 3,453 (headcount) or 16.8 per cent of the total ACT Public Service workforce. Of the 3,453 Culturally and Linguistically Diverse employees:
generation X comprise the largest age group (1,504 employees) and pre‐baby boomerswere the smallest age group (25 employees);
the separation rate of Culturally and Linguistically Diverse employees was approximatelytwo thirds of the separation rate of the whole ACT Public Service (4.4 per centcompared to 6.2 per cent);
the Long Service Leave Authority and Health Directorate had the highest representationof employees identifying as Culturally and Linguistically Diverse (36.4 per cent and 24.2per cent respectively); and
the average salary for Culturally and Linguistically Diverse employees was less than theaverage ACT Public Service salary ($77,456 compared to $80,137).

43
C o m m i s s i o n e r f o r P u b l i c A d m i n i s t r a t i o n
Table 12: Culturally and Linguistically Diversity snapshot – June 2014
Total employees (headcount) 3,453 Age
Total employees (FTE) 3,140.4 Generation Y 931 Generation X 1504 Baby Boomers 993 Pre‐Baby 25
Culturally and Linguistically Diversity by Directorate(%)
Chief Minster and Treasury 14.3%
Long Service Leave Authority 36.4 % Employment type
Independent Competition and Regulatory Commission 0.0%
Permanent 2,520Temporary or casual 933
Capital Metro 11.1%
Commerce and Works 20.2% Full time / part time employment
Community Services 15.9% Full time 2,519Part time 698 Casual 236 Economic Development 7.0%
Exhibition Park Corporation 0.0% Average salary $77,456
Median salary $71,031 Land Development Agency 12.5%
Gambling and Racing Commission 0.0% Separation rate 4.4%
Education and Training 10.1%
Environment and Sustainable Development 14.3%
Health 24.2%Justice and Community Safety 8.8%Territory and Municipal Services 21.5%
ACT Public Service Total 16.8%Note: The following data is for Directorates only and excludes Canberra Institute of Technology, Auditor General’s Office, Cultural Facilities Corporation and Calvary Health Care (Public).

ACT Public Service - State of the Service Report44
C o m m i s s i o n e r f o r P u b l i c A d m i n i s t r a t i o n
2.36PeoplewithDisabilityEmployees who identify as a Person with Disability made up 2 per cent of the total ACT Public Service workforce at June 2014 (415 headcount). The ACT Public Service Employment Strategy for People with Disability aims to more than double the 2010 headcount of 32717 employees who identify as a Person with Disability to 655 in 2015. Currently, the Respect, Equity and Diversity Framework (of which the employment strategy is an element) is being reviewed to identify areas for improvement and innovation.
Table 13: People with Disability employees 2010‐2014
June 2010 June 2011 June 2012 June 2013 June 2014
Headcount 306 351 343 384 415
Percentage of total workforce 1.7% 1.9% 1.8% 1.9% 2.0%
At June 2014, employees who identified as People with Disability totalled 415 (headcount), or 2 per cent of the total ACT Public Service workforce. Of the 415 employees who identify as a Person with Disability:
generation X comprise the largest age group (155 employees) and pre‐baby boomerswere the smallest age group (10 employees);
the separation rate of People with Disability is slightly higher than the separation rate ofthe whole ACT Public Service (7.4 per cent compared to 6.2 per cent);
the Independent Competition and Regulatory Commission and Chief Minister andTreasury Directorate had the highest representation of employees identifying as Peoplewith Disability (20.0 per cent and 5.0 per cent respectively); and
the average salary for People with Disability was less than the average ACT PublicService salary ($76,621 compared to $80,137).
17 Please note that the headcount used in the Employment Strategy for People with a Disability was inclusive Canberra Institute of Technology and ACT Auditor‐General’s Office.

45
C o m m i s s i o n e r f o r P u b l i c A d m i n i s t r a t i o n
Table 14: People with Disability Public Service snapshot – June 2014
Total employees (headcount) 415 Age
Total employees (FTE) 368.7 Generation Y 109Generation X 155Baby Boomers 141Pre‐Baby Boomers 10
People with Disability by Directorate (%)
Chief Minster and Treasury 5.0%
Long Service Leave Authority 0.0% Employment type
Independent Competition and Regulatory Commission 20.0%
Permanent 339Temporary or casual 76
Capital Metro 0.0%
Commerce and Works 2.9% Full time / part time employment
Community Services 3.2% Full time 298 Part time 97 Casual 20 Economic Development 3.1%
Exhibition Park Corporation 0.0% Average salary $76,621
Median salary $71,031 Land Development Agency 3.8%
Gambling and Racing Commission 0.0% Separation rate 7.4%
Education and Training 1.4%
Environment and Sustainable Development 2.9%
Health 2.1%Justice and Community Safety 1.2%Territory and Municipal Services 2.3%
ACT Public Service Total 2.0%
Note: The following data is for Directorates only and excludes Canberra Institute of Technology, Auditor General’s Office, Cultural Facilities Corporation and Calvary Health Care (Public).

ACT Public Service - State of the Service Report46
C o m m i s s i o n e r f o r P u b l i c A d m i n i s t r a t i o n
2.37AboriginalandTorresStraitIslandersAboriginal and Torres Strait Islander employees made up 1.2 per cent of the total ACT Public Service workforce at June 2014 (253 headcount). The ACT Public Service Employment Strategy for Aboriginal and Torres Strait Islander People aims to more than double the 2010 headcount of 17618 Aboriginal and Torres Strait Islander employees to 407 in 2015. Currently, the Respect, Equity and Diversity Framework (of which the employment strategy is an element) is being reviewed to identify areas for improvement and innovation.
Table 15: Aboriginal and Torres Strait Islander employees 2010‐2014
June 2010 June 2011 June 2012 June 2013 June 2014
Headcount 153 193 202 238 253
Percentage of total workforce 0.9% 1.0% 1.0% 1.2% 1.2%
Of the 253 Aboriginal and Torres Strait Islander employees:
generation Y comprise the largest age group (112 employees);
the separation rate of Aboriginal and Torres Strait Islander employees was higher than the separation rate for the whole ACT Public Service (9.1 per cent compared to 6.2 per cent);
the Community Services Directorate, Gambling and Racing Commission and Land Development Agency had the highest representation of employees identifying as Aboriginal and Torres Strait Islander (2.9 per cent respectively); and
the average salary for Aboriginal and Torres Strait Islander employees was less than the average ACT Public Service salary ($74,113 compared to $80,137).
18 Please note that the headcount used in the Employment Strategy for Aboriginal and Torres Strait Islander People was inclusive of Canberra Institute of Technology and ACT Auditor‐General’s Office.

47
C o m m i s s i o n e r f o r P u b l i c A d m i n i s t r a t i o n
Table 16: Aboriginal and Torres Strait Islander Public Service snapshot – 2014
Total employees (headcount) 253 Age
Total employees (FTE) 235.1 Generation Y 112Generation X 75 Baby Boomers 65 Pre‐Baby Boomers n/a
Aboriginal and Torres Strait Islanders by Directorate(%)
Chief Minster and Treasury 0.7%
Long Service Leave Authority 0.0% Employment typeIndependent Competition and Regulatory Commission 0.0%
Permanent 190Temporary or casual 63
Capital Metro 0.0%Commerce and Works 1.0% Full time / part time employment
Community Services 2.9% Full time 197 Part time 41 Casual 15 Economic Development 0.4%
Exhibition Park Corporation 0.0% Average salary $74,113
Median salary $65,221 Land Development Agency 2.9%
Gambling and Racing Commission 2.9% Separation rate 9.1%
Education and Training 1.0%
Environment and Sustainable Development 1.3%
Health 1.0%Justice and Community Safety 1.4%Territory and Municipal Services 1.4%ACT Public Service Total 1.2%Note: The following data is for Directorates only and excludes Canberra Institute of Technology, Auditor General’s Office, Cultural Facilities Corporation and Calvary Health Care (Public).
N/A = reporting on this data may inadvertently identify individuals or individual cases.

ACT Public Service - State of the Service Report48
C o m m i s s i o n e r f o r P u b l i c A d m i n i s t r a t i o n
2.38EmploymentGrowthEmployment in the ACT Public Service grew over the 2013‐14 period. The number of employees (headcount) grew by 2.7 per cent (534 employees), and FTE employment grew by 2.4 per cent (432.4 FTE). This growth in employment was significantly larger than the 0.919 per cent growth in the Australian labour force over the same period.
As Table 17 shows:
employment growth was largest in the Independent Competition and Regulatory Commission (25 per cent);
employment growth was seen in all directorates, with the exception of Chief Minister and Treasury Directorate (‐4.5 per cent), Long Service Leave Authority (‐8.3 per cent), Exhibition Park Corporation (‐20 per cent) and Environment and Sustainable Development Directorate (‐6.1 per cent); and
the largest contraction in employment was seen in the Exhibition Park Corporation (‐20 per cent), however this is due to their low employment numbers in comparison to the larger directorates.
*As Capital Metro Agency was only established in 2013 there is no data available to compare at June 2014.
19 Australian Bureau of Statistics, Labour Force Australia 6202.0

C o m m i s s i o n e r f o r P u b l i c A d m i n i s t r a t i o n
Table 17: ACT Public Service employment growth by Directorate – 2013‐2014
Directorate Headcount FTE
June 2013
June 2014
Change (%)
June 2013
June 2014
Change (%)
Chief Minster and Treasury Directorate o Long Service Leave Authority o Independent Competition
and Regulatory Commission
292
12
8
279
11
10
‐4.5%
‐8.3%
25%
279.1
12.0
8.0
268.9
11.0
8.6
‐3.7
‐8.3
7.5%
Capital Metro Agency* 0 18 ‐ 0 18.0 ‐
Commerce and Works Directorate 1077 1122 4.2% 1048.1 1098.4 4.8%
Community Services Directorate 1320 1331 0.8% 1219.0 1230.6 1.0%
Economic Development Directorate o Exhibition Park Corporation o Land Development Agency o Gambling and Racing
Commission
217
15
94
29
229
12
104
34
5.5%
‐20%
10.6%
17.2%
208.3
13.9
89.2
27.6
217.0
10.9
99.6
30.6
4.2%
‐21.6%
11.7%
10.9%
Education and Training Directorate
5997 6170 2.9% 5027.1 5136.6 2.2%
Environment and Sustainable Development Directorate
478 449 ‐6.1% 452.3 423.2 ‐6.4%
Health Directorate 6540 6797 3.9% 5749.1 5979.9 4.0%
Justice and Community Safety Directorate
1900 1934 1.8% 1820.6 1844.7 1.3%
Territory and Municipal Services Directorate
2038 2051 0.6% 1894.3 1903.0 0.5%
ACT Public Service Total 20017 20551 2.7% 17848.5 18280.9 2.4%
49

2014 People Matter Survey
ACT Public Service - State of the Service Report50

51
2014 People Matter Survey
About the ACT People Matter Survey
This report provides an overview of the results of the 2014 ACT Public Sector (ACTPS) People Matter Survey (the Survey). It was prepared by the Victorian Public Sector Commission (VPSC) and provides comparisons with the Victorian Public Sector (VPS).
The findings provide insights about the extent to which the ACTPS core values and signature behaviours are being demonstrated and applied within workplaces across the Sector. The results provide data on the effectiveness of specific reform initiatives. These include the creation of the ACTPS Code of Conduct and new performance framework. The outcomes provide a measure of public sector workers’ sense of workplace wellbeing, job satisfaction and engagement.
Survey participation and response
The Survey covered all agencies of ACT Government, the ACT Public Service and other statutory agencies; 6,299 employees participated with a response rate of 29 per cent1. This compares well with the 2014 VPS response rate of 32 per cent, supplying a representative sample across the sector.
The following table of the demographic breakdown demonstrates the extent to which the Survey results can be considered representative of the whole workforce. The ACTPS survey respondent group is generally representative of the whole ACT Government workforce. This is clearly so in terms of gender. The age profile is also broadly consistent.
The Survey respondent group has a slightly higher proportion of permanent employees, on $85,000 plus salaries, and people born in Australia, than the whole ACT Sector workforce. Conversely it has slightly fewer fixed term and mid‐salary employees, and people born overseas, than the whole Sector workforce.
The most notable difference between the profile of the Survey respondents and the workforce as a whole is in the area of full‐time and part‐time employment. The respondent group has 14 per cent more full‐time employees, and 14 per cent less part‐time employees, than the Sector workforce as a whole.
1 The total response rate is based on agencies with a response rate of at least 10 percent.
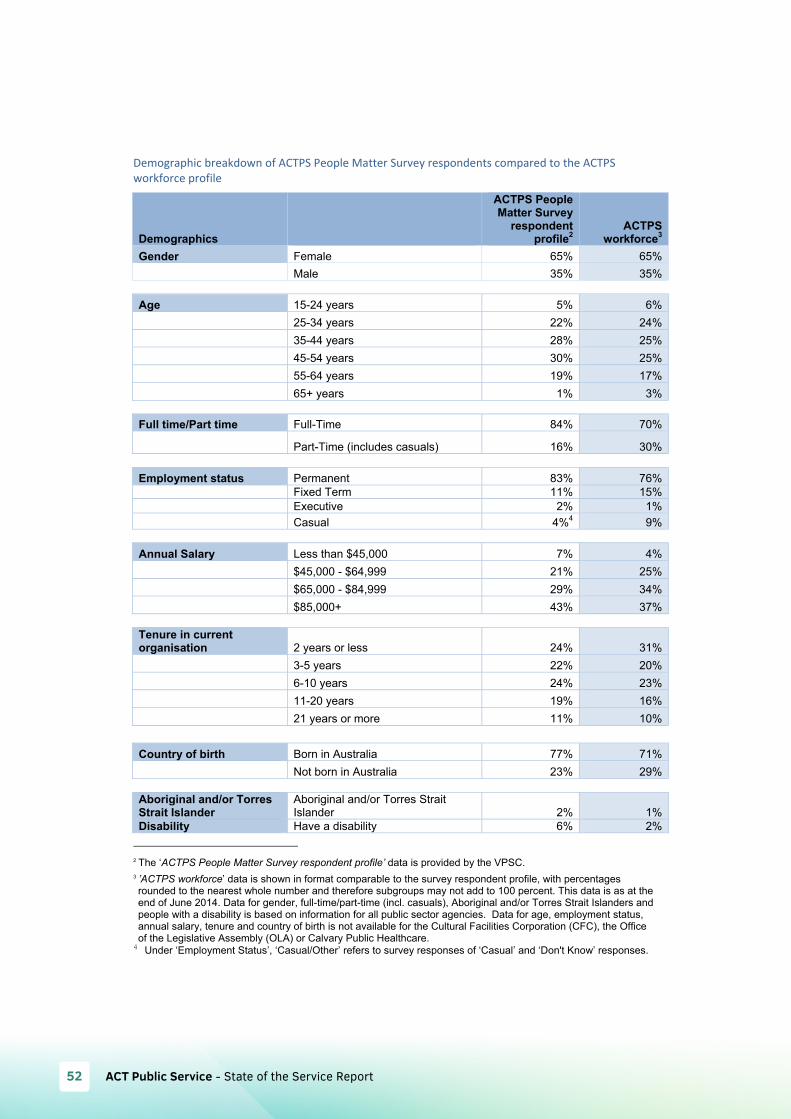
ACT Public Service - State of the Service Report52
Demographic breakdown of ACTPS People Matter Survey respondents compared to the ACTPS workforce profile
Demographics
ACTPS People Matter Survey
respondent profile2
ACTPS workforce3
Gender Female 65% 65%Male 35% 35%
Age 15-24 years 5% 6%25-34 years 22% 24%35-44 years 28% 25%45-54 years 30% 25%55-64 years 19% 17%65+ years 1% 3%
Full time/Part time Full-Time 84% 70%
Part-Time (includes casuals) 16% 30%
Employment status Permanent 83% 76%Fixed Term 11% 15%Executive 2% 1%Casual 4%4 9%
Annual Salary Less than $45,000 7% 4%$45,000 - $64,999 21% 25%$65,000 - $84,999 29% 34%$85,000+ 43% 37%
Tenure in current organisation 2 years or less 24% 31%
3-5 years 22% 20%6-10 years 24% 23%11-20 years 19% 16%21 years or more 11% 10%
Country of birth Born in Australia 77% 71%Not born in Australia 23% 29%
Aboriginal and/or Torres Strait Islander
Aboriginal and/or Torres Strait Islander 2% 1%
Disability Have a disability 6% 2%
2 The ‘ACTPS People Matter Survey respondent profile’ data is provided by the VPSC. 3 ’ACTPS workforce’ data is shown in format comparable to the survey respondent profile, with percentages rounded to the nearest whole number and therefore subgroups may not add to 100 percent. This data is as at the end of June 2014. Data for gender, full-time/part-time (incl. casuals), Aboriginal and/or Torres Strait Islanders and people with a disability is based on information for all public sector agencies. Data for age, employment status, annual salary, tenure and country of birth is not available for the Cultural Facilities Corporation (CFC), the Office of the Legislative Assembly (OLA) or Calvary Public Healthcare.
4 Under ‘Employment Status’, ‘Casual/Other’ refers to survey responses of ‘Casual’ and ‘Don't Know’ responses.

53
Key 2014 People Matter Survey findings
Awareness of the ACTPS Employee Values and Signature Behaviours
The Survey asked respondents about the extent to which they are aware of the ACTPS Employee Values and Signature Behaviours, the Code of Conduct, and the Performance Framework. The results of the survey show that there is on average an 83% awareness of these three policies.
There is good awareness of all three components. However, given their central importance, there may be a need for further work to promote them across the Sector so that there are even higher rates of recognition. There is certainly a need to ensure that the current levels of awareness are maintained, especially for new employees. On average the VPS had a higher awareness of these issues at 95%.
Application of the Values
Awareness of codes and statements of values is one thing. The extent to which actual workplace behaviours and practices align with the codes and statements is of greater significance. The Survey provides some light on the application of the ACTPS employee values.
The ACTPS Employee Values of Respect, Integrity, Collaboration and Innovation are enshrined in the ACTPS Code of Conduct.
Respect
Respect in the ACTPS means treating others with the sensitivity, courtesy and understanding we would wish for ourselves, and recognising that everyone has something to offer. It means thinking “would I be happy if this was happening to me,” and rests on a foundation of fundamental decency in our dealings with colleagues and clients alike.
Integrity
Integrity in the ACTPS means being apolitical, honest, dependable, and accountable in our dealings with ministers, the Parliament, the public and each other. It means recognising achievement, not shirking uncomfortable conversations and implies a consistency in our dealings with others.
Collaboration
Collaboration in the ACTPS means actively sharing information and resources, working together towards shared goals and asking “who else do I need to talk to, to get this right”. It means actively seeking opportunities for breaking down unhealthy silos and relies on genuine engagement with colleagues in the ACTPS and with the broader community.
Innovation
Innovation in the ACTPS means asking “but why?”, actively seeking out new and better ways of doing what we do (as well as better things to do), and not settling for how it has always been. It means empowering colleagues at all levels to raise new ideas and necessitates sensible and thoughtful engagement with risk.

ACT Public Service - State of the Service Report54
The Survey tested employees’ recognition of the ACTPS to be able to demonstrate and apply in practice each of the first three values. The findings show that on average 89% of respondents agreed. The ACTPS and the VPS results are remarkably similar in each case.
The Survey did not explicitly test the extent to which the value of ‘innovation’ is demonstrated and applied within ACTPS workplaces. However, the Survey did ask questions about how well change is handled within the organisation. The results show that 73% of ACTPS (compared with 67% of VPS) employees agreed that change was managed well.
Employee engagement
Engagement is the extent to which employees are committed to the organisation. Engagement scores provide an insight into the extent to which staff are likely to make a concerted effort to help the organisation achieve its best. High scores suggest staff who will ‘go the extra mile’ for the organisation and who will promote and defend the organisation’s good reputation.
The ACTPS results are strong, suggesting generally positive engagement by employees. In each area measured, the ACTPS results are commensurate with those achieved in VPS. Specifically, on the Engagement Index, the ACTPS rated equally with VPS, registering 69 out of 100. On Employment Commitment, 73% of respondents believed they were committed to the organisation, compared with 75% in Victoria. Overall job satisfaction was at 74% for both organisations and workplace wellbeing 85% for the ACTPS and 84% for the VPS.
Other values and employment principles
Questions were asked on other values, such as responsiveness, accountability, leadership, merit, fairness, reasonable treatment, equal employment opportunity and avenues of redress compared with those of the VPS. Again, the ACTPS results indicate strong performance in each of these key areas, and results commensurate with those of the VPS.
The following table presents the aggregated results for each of the value and employment principle areas identified on a scale of 1 to 10.
Awareness of Other Values and Principles
1 2 3 4 5 6 7 8 9 10
ACTPS
VPS
Feedback
Feedback – especially informal feedback, provided on a regular basis and in a relaxed manner – has been shown to have a significant impact on employee job satisfaction, engagementand performance.
Questions in the Survey asked respondents about three important aspects of their experience of feedback: whether they have received feedback about their work performance
Lower End Higher End

55
at all; how this feedback has been received (through formal and/or informal means); and the content of this feedback in terms of focusing on what is working well and what could be done differently.
‘Effective feedback’ is defined as having received either informal feedback only, or both formal and informal feedback.
‘Effective talking performance’ is defined as an employee having received advice only about what they were doing well, or what they were doing well and what they could do to improve performance.
The overall ACTPS results suggest that feedback is evident to a strong degree, with almost three‐quarters of respondents indicating they receive effective feedback.
However it could be argued that everyone should be receiving regular and constructive informal feedback about their work. This is especially the case, given the demonstrated link between regular informal feedback and positive performance in a range of other aspects of organisational culture. Therefore, steps should be taken to give all employees the opportunity to receive effective feedback.
The following table presents Survey results about feedback on a scale of 1 to 10.
Performance and Feedback
1 2 3 4 5 6 7 8 9 10
ACTPS
VPS
While these results, given on a scale of 1 to 10, paint a positive picture of widespread informal feedback, there is a difference between the responses to the question ‘I have received formal feedback on individual performance’ between the two jurisdictions. On average, 63 per cent of VPS survey respondents indicate that they have received formal feedback. By contrast, on average, 55 per cent of ACTPS respondents indicate they have received formal feedback.
This indicates there is more to be done on embedding formal performance into the ACTPS. The Performance Framework was promulgated in August 2013 with a focus on values and behaviours and the results show there needs to be a greater emphasis on ensuring a strong performance culture is part of the way the public sector goes about its business.
Perceptions of bullying
The Survey asked respondents to indicate if they have witnessed or experienced bullying the past 12 months.
The responses to the Survey questions about bullying provide an indicator about disrespectful behaviour and incivility in the organisation; behaviours that can have significant and lasting negative impacts on individual and organisational performance.
Lower End Higher End

ACT Public Service - State of the Service Report56
There is a slightly lower percentage of ACTPS respondents compared to the VPS saying that they witnessed bullying and a slightly higher percentage saying they experienced it, mapped on a scale of 1 to 10. Perceptions of Bullying Index – Experienced
1 2 3 4 5 6 7 8 9 10
ACTPS
VPS
Perceptions of Bullying Index – Witnessed
1 2 3 4 5 6 7 8 9 10
ACTPS
VPS
The survey results show that bullying remains an issue across the ACTPS, with levels of either experienced or witnessed bullying similar to the VPS.
The review of the Respect, Equity and Diversity Framework (RED) during 2014 has shown that a more informal approach to being able to report any bullying is important and should remain. RED contact officers are effective at taking informal reports, indeed the numbers notified to Human Resource areas by them increased between 2013 and 2014 while the total number of informal reports decreased between those years. The total number of formal complaints also decreased.
Perceptions of work area and management
Most of the Survey questions focus on organisational strengths relating to ‘my workgroup’(90%) ‘my organisation’ (86%)’, ‘immediate supervisor’(88%) or ‘senior managers’(70%) – (results in brackets). This compares almost identically with the VPS results.
Conclusion In the main, the ACTPS results are good. In most cases they are commensurate with the results achieved in the VPS. In some cases, especially in the area of organisational change management, ACTPS organisations appear to be doing much better than their VPS counterparts.
But the Survey has also highlighted some areas requiring focus. Awareness of the Code of Conduct, Values, Signature Behaviours, and Performance Framework is strong. However, given the central and critical nature of these policies and processes, the results could be even higher.
Lower End Higher End
Lower End Higher End

57
The existence of constructive informal performance feedback appears strong and widespread. However there are around a quarter of ACTPS employees not currently receiving constructive informal feedback on a regular basis. Again, there is some more work to do in this area.
Just over half of the respondents reported having received formal feedback. This indicates there is more to be done on embedding formal performance into the ACTPS. The Performance Framework was promulgated in August 2013 with a focus on values and behaviours and the results show there needs to be a greater emphasis on ensuring a strong performance culture is part of the way the public sector goes about its business.
It is important to emphasise, however, that any work on increasing the occurrence of formal performance feedback should not be achieved at the expense of regular informal feedback. Formal feedback processes must complement and support the informal.
No levels of bullying are acceptable, whether experience or witnessed, and the results show that while the introduction of the RED Framework in 2010 was effective, it should remain and discussions around values and behaviours ‐ in particular how people are treated in the workplace ‐ need to be part of everyday business, through informal and formal feedback and RED contact officers.
As with any survey, the People Matter Survey results are simply the start, not the end, of a process. The data has provided a strong baseline, has pointed out some opportunities for improvement, and highlighted many areas of strength which must be maintained. In this way, the Survey has sketched the organisational culture landscape of the ACTPS. This is a landscape that all ACTPS employees must work to strengthen and protect.
Moving Forward
In response to the Survey results at a whole of government level, we will be working over the next few months to encourage collaboration and agility through:
encouraging mobility across the ACTPS at all levels; developing and delivering whole of government strategic learning and development
opportunities; encouraging mentoring and potential secondments; using the new Public Sector Act in 2015 to encourage greater flexibility especially for
executives; refreshing the Respect, Equity and Diversity (RED) Framework and developing greater
opportunities for Aboriginal and Torres Strait Islander employment and for thosewith disabilities;
working to further embed the Performance Management Framework; and developing tools for managers to undertake preliminary assessments of staffing
issues to resolve them more quickly.

2014 Agency Survey
ACT Public Service - State of the Service Report58

59
C o m m i s s i o n e r f o r P u b l i c A d m i n i s t r a t i o n
INTRODUCTION AND METHODOLOGY
BACKGROUND AND OBJECTIVES The Australian Capital Territory (ACT) Government contracted Insightrix Research Pty. Ltd. (Insightrix) to conduct a yearly study of Directorates and Agencies in July 2014. This is the third year Insightrix has conducted the survey. Prior to 2012 this information had been gathered using a variety of communication methods. The change to a yearly survey serves to streamline the process and maximise efficiency.
The objectives of this study are to:
Identify learning and development activities provided by Agencies, Examine human resource strategies employed by agencies (i.e. attraction and retention,
diversity, disciplinary actions, workplace harassment, etc.), Understand the tools and measures used by agencies to implement the Respect, Equity and
Diversity (RED) Framework, Analyse risk and fraud strategies used by Agencies, Track and compare results year to year.
METHODOLOGY The data was collected from 03 to 24 July, 2014. A document was sent to a contact at each Agency detailing the information required. Information was then gathered by the contact from within the Agency and input into an online survey format. All 15 Agencies completed the survey and are listed below.
Agencies surveyed 2013/14
Auditor-General’s Office Calvary Healthcare Canberra Institute of Technology Capital Metro Agency* Chief Minister and Treasury Commerce and Works Community Services Director of Public Prosecutions Economic Development Education and Training Environment and Sustainable Development Health Justice and Community Safety Office of Legislative Assembly Territory and Municipal Services
*First time included in this survey

ACT Public Service - State of the Service Report60
C o m m i s s i o n e r f o r P u b l i c A d m i n i s t r a t i o n
Development of Survey Instrument
To achieve the research objectives, Insightrix worked with the ACT Project Manager on the survey design, wording of the questions and flow. The questionnaire was designed to measure the objectives noted above. In order to allow tracking, edits to the original questionnaire were minor. The questionnaire was programmed into an online platform to enable respondents to participate at their convenience.
Survey Analysis and Reporting
Insightrix produced this report, which is a top-line overview of results collected and includes frequencies for each question.
REPORTING NOTES
Questions that have multiple response options will result in percentages that could add up tomore than 100%. In the case of open-ended questions, respondents often provide more thanone reason for their response and in these cases, percentages will also add up to more than100%.
Data has been rounded to zero decimal places and as such, percentages may not add up toexactly 100% on certain graphs.
Comparisons are made within this report between 2013/14 results and those collectedpreviously for 2011/12 when 15 Agencies completed the survey and 2012/13 when 14Agencies completed the survey.

61
C o m m i s s i o n e r f o r P u b l i c A d m i n i s t r a t i o n
STUDY RESULTS
VALUES AND BEHAVIOURS Delivery Methods for Learning and Development
To start the survey, Agencies were asked about the various learning and development activities and delivery methods provided to staff during 2013/14. Awareness-raising as part of induction/orientation is the most common delivery method reported followed by information on intranet/website.
1. Has your Agency provided staff with learning and development activities during 2013/14 on either the ACTPS values (inclusive of those set out in the PSMA) and/or Agency specific values? Base: All respondents, n=15.
ACTPS Values and/or Section 9 Agency Specific Values
Executive Staff Non-Executive
Staff
Executive Staff
Non-Executive
Staff Awareness-raising as part of induction/orientation
9 13 9 11
Information on intranet/website (other than on-line training)
9 10 9 10
Use of promotional material (e.g. bookmarks, brochures, posters) other than that used as part of induction/orientation
9 9 9 9
Formal sessions on how the Values and Section 9 should operate in practice
8 10 6 7
On-line training 5 6 4 4 Other 4 4 4 4 No training was provided 2 1 3 2

ACT Public Service - State of the Service Report62
C o m m i s s i o n e r f o r P u b l i c A d m i n i s t r a t i o n
Delivery Methods for Learning and Development – Tracking
ACTPS Values and/or Section 9
Executive Staff
Non-Executive Staff 2011/12 2012/13 2013/14 2011/12 2012/13 2013/14Awareness-raising as part of induction/orientation
10 11 9 13 12 13
Information on intranet/website (other than on-line training)
11 9 9 11 9 10
Use of promotional material (e.g. bookmarks, brochures, posters) other than that used as part of induction/orientation
7 5 9 7 5 9
Formal sessions on how the Values and Section 9 should operate in practice
7 7 8 10 7 10
On-line training 6 3 5 6 3 6 Other 1 3 4 2 3 4 No training was provided 3 2 2 1 1 1 Total Participating Agencies 15 14 15 15 14 15
Agency Specific Values
Executive Staff
Non-Executive Staff 2011/12 2012/13 2013/14 2011/12 2012/13 2013/14Awareness-raising as part of induction/orientation
10 10 9 13 10 11
Information on intranet/website (other than on-line training)
12 9 9 12 9 10
Use of promotional material (e.g. bookmarks, brochures, posters) other than that used as part of induction/orientation
8 4 9 8 4 9
Formal sessions on how the Values and Section 9 should operate in practice
7 5 6 9 6 7
On-line training 1 2 4 2 2 4 Other 5 3 4 5 3 4 No training was provided 2 3 3 0 3 2 Total Participating Agencies 15 14 15 15 14 15

63
C o m m i s s i o n e r f o r P u b l i c A d m i n i s t r a t i o n
ATTRACTION AND RETENTION Formal Performance Management/Development Framework
2. Does your Agency have a formal performance management/development framework? Base: All respondents, n=15.
Performance Management System Elements
Most commonly, staff participation in formal and informal feedback sessions, and individual performance management plans are used by Agencies.
4. Are any of the following elements included in your Agency’s performance management/development framework? Base: All respondents, n=15.
14
15
15
15
15
1Staff participation in the performance
management/development system is monitored
Individual performance/development plans linked to Agency and/or service wide values
Individual performance management/development plans linked to the
agency business plan
Staff participation in formal feedback sessions
Staff participation in informal feedback sessions
Included Not included
All respondents indicate that their Agencies have a formal performance management/development framework. 100%

ACT Public Service - State of the Service Report64
C o m m i s s i o n e r f o r P u b l i c A d m i n i s t r a t i o n
Performance Management System Elements - Tracking
Included Not included
2011/12 2012/13 2013/14 2011/12 2012/13 2013/14
Staff participation in informal feedback sessions
15 14 15 0 0 0
Staff participation in formal feedback sessions
15 14 15 0 0 0
Individual performance management/development plans linked to the agency business plan
14 14 15 1 0 0
Individual performance/development plans linked to Agency and/or service wide values
12 13 15 3 1 0
Staff participation in the performance management/development system is monitored
12 13 14 3 1 1
Total Participating Agencies 15 14 15 15 14 15
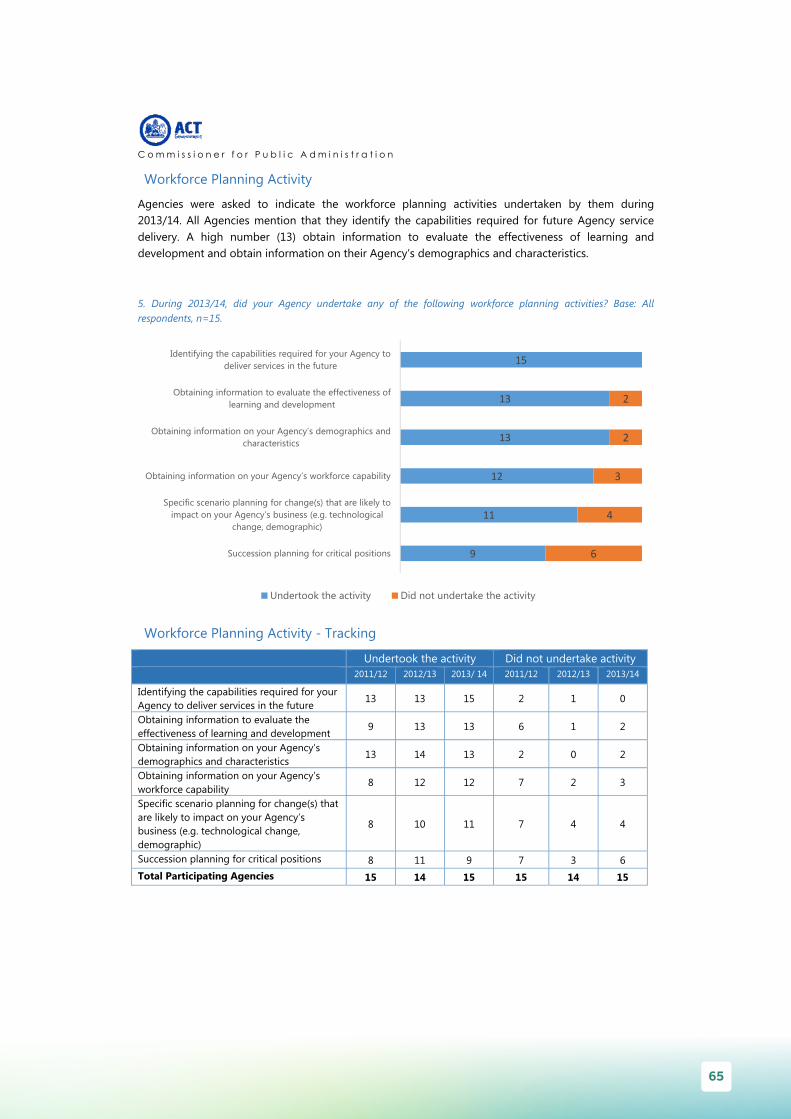
65
C o m m i s s i o n e r f o r P u b l i c A d m i n i s t r a t i o n
Workforce Planning Activity
Agencies were asked to indicate the workforce planning activities undertaken by them during 2013/14. All Agencies mention that they identify the capabilities required for future Agency service delivery. A high number (13) obtain information to evaluate the effectiveness of learning and development and obtain information on their Agency’s demographics and characteristics.
5. During 2013/14, did your Agency undertake any of the following workforce planning activities? Base: All respondents, n=15.
Workforce Planning Activity - Tracking
Undertook the activity Did not undertake activity 2011/12 2012/13 2013/ 14 2011/12 2012/13 2013/14
Identifying the capabilities required for your Agency to deliver services in the future
13 13 15 2 1 0
Obtaining information to evaluate the effectiveness of learning and development
9 13 13 6 1 2
Obtaining information on your Agency’s demographics and characteristics
13 14 13 2 0 2
Obtaining information on your Agency’s workforce capability
8 12 12 7 2 3
Specific scenario planning for change(s) that are likely to impact on your Agency’s business (e.g. technological change, demographic)
8 10 11 7 4 4
Succession planning for critical positions 8 11 9 7 3 6 Total Participating Agencies 15 14 15 15 14 15
9
11
12
13
13
15
6
4
3
2
2
Succession planning for critical positions
Specific scenario planning for change(s) that are likely to impact on your Agency’s business (e.g. technological
change, demographic)
Obtaining information on your Agency’s workforce capability
Obtaining information on your Agency’s demographics and characteristics
Obtaining information to evaluate the effectiveness of learning and development
Identifying the capabilities required for your Agency to deliver services in the future
Undertook the activity Did not undertake the activity

ACT Public Service - State of the Service Report66
C o m m i s s i o n e r f o r P u b l i c A d m i n i s t r a t i o n
Workforce Planning Challenges
Some of the major challenges indicated by Agencies include the loss of Aboriginal and Torres Strait Islander employees and difficulty in reporting and analysing Agency workforce due to limited workforce data or data quality. These were considered a challenge, either minor or major, by eleven and ten Agencies, respectively. They were considered major challenges by less than a quarter of the Agencies reporting.
6. Of the challenges listed below, please choose one of the three options that best describes the challenge faced by your Agency in 2013/14. Base: All respondents, n=15.
4
4
1
1
5
1
4
10
8
11
11
10
6
4
6
8
7
5
1
3
4
4
4
9
10
3
6
6
7
8
1
1
1
3
3
Loss of employees recruited as part of a formal graduate program
Loss of employees with a disability
Difficulty in recruiting sufficiently strong leadership skills at the Executive levels
Higher than acceptable employee turnover
Difficulty in attracting and retaining entry level positions
Ensuring that employees’ skills and/or knowledge meet your Agency’s requirements
Loss of mature-aged employees
Difficulty recruiting graduates with required skills as part of a formal graduate program
Difficulty in recruiting sufficiently strong leadership skills and/or potential at the senior manager level (SOGA, SOGB,SOGC)
Difficulty recruiting people (other than for a formal graduate program) with required skills
Difficulty in reporting and analysing your Agency’s workforce due to limited workforce data or data quality
Loss of Aboriginal and Torres Strait Islander employees
Not applicable Did not face this challengeThis was a minor challenge This was a major challenge

67
C o m m i s s i o n e r f o r P u b l i c A d m i n i s t r a t i o n
Workforce Planning Challenges – Difference 2012/13 to 2013/14
Minor Challenge Major Challenge
2012/13 2013/14 Difference 2012/13 2013/14 Difference
Loss of Aboriginal and Torres Strait Islander employees
7 8 1 2 3 1
Difficulty in reporting and analysing your Agency’s workforce due to limited workforce data or data quality
7 7 0 2 3 1
Difficulty recruiting people (other than for a formal graduate program) with required skills
6 6 0 4 1 -3
Difficulty in recruiting sufficiently strong leadership skills and/or potential at the senior manager level (SOGA, SOGB,SOGC)
8 6 -2 1 1 0
Difficulty recruiting graduates with required skills as part of a formal graduate program
2 3 1 1 1 0
Loss of mature-aged employees 8 10 2 4 0 -4 Ensuring that employees’ skills and/or knowledge meet your Agency’s requirements
9 9 0 2 0 -2
Difficulty in attracting and retaining entry level positions
5 4 -1 1 0 -1
Higher than acceptable employee turnover
3 4 1 2 0 -2
Difficulty in recruiting sufficiently strong leadership skills at the Executive levels
6 4 -2 0 0 0
Loss of employees with a disability
4 3 -1 0 0 0
Loss of employees recruited as part of a formal graduate program
4 1 -3 0 0 0

ACT Public Service - State of the Service Report68
C o m m i s s i o n e r f o r P u b l i c A d m i n i s t r a t i o n
High Performers Identification Strategy
The most commonly used strategies to identify high performing individuals include participation in development opportunities (14) and manager/supervisor identification (14). Performance management/development system (12) and Agency head identification (12) are also frequently used.
8. What were the primary strategies used to identify high performing individuals? Base: All respondents, n=15.
High Performers Identification Strategy - Tracking
Used this strategy Did not use the strategy 2011/12 2012/13 2013/ 14 2011/12 2012/13 2013/14
Participation in development opportunities 13 14 14 2 0 1 Manager/Supervisor identification 12 14 14 3 0 1 Performance management/development system
11 12 12 4 2 3
Agency Head identification 9 12 12 6 2 3 Leadership development programs 12 10 10 3 4 5 Staff recognition awards 10 9 9 5 5 6 Pilot mentoring program 4 4 5 11 10 10 Career development assessment centres 1 1 2 14 13 13 Total Participating Agencies 15 14 15 15 14 15
2
5
9
10
12
12
14
14
13
10
6
5
3
3
1
1
Career development assessment centres
Pilot mentoring program
Staff recognition awards
Leadership development programs
Agency Head identification
Performance management/development system
Manager/Supervisor identification
Participation in development opportunities
Used this strategy Did not use this strategy
Other Strategies:
Succession Management Planning
(Commerce and Works)
Auditor-General writes to staff thanking them for work well done
(Auditor-General)

69
C o m m i s s i o n e r f o r P u b l i c A d m i n i s t r a t i o n
Most Utilised Benefits
Special employment arrangements, flexible work hours and commencement above base salary are the top three benefits utilised by Agencies during 2013/14 to specifically attract and retain people with critical skills.
9. Which of the following were the top three benefits most utilised by your Agency during 2013/2014 to specifically attract and retain people with critical skills? Base: All respondents, 2012/13; n=14, 2013/14; n=15.
2012/13 2013/14 # of
Agencies % of
Agencies # of
Agencies % of
Agencies Special Employment Arrangements (SEAs)
11 79% 12 80%
Flexible work hours 8 57% 10 67% Commencement above base salary 6 43% 7 47% Development opportunities (e.g. study awards, fellowships, secondments)
3 21% 4 27%
Work placements/rotations 0 0% 2 13% Provision of studies assistance 4 29% 2 13% Graduate programs 3 21% 2 13% Health and wellbeing programs 2 14% 1 7% HR support case managers for trainees and apprentices
1 7% 1 7%
Support for Transition to Retirement 1 7% 0 0% Other 3 21% 4 27% Total Participating Agencies 14 100% 15 100%

ACT Public Service - State of the Service Report70
C o m m i s s i o n e r f o r P u b l i c A d m i n i s t r a t i o n
Targeted Initiatives to Retain Specific Groups
The following graph illustrates the breakdown of initiatives (targeted and not targeted) for each of the specific groups. The most targeted initiatives were for professional employees (10) and Aboriginal and Torres Strait Islanders (8).
10. In 2013/14, did your Agency employ any specific and targeted initiatives to attract and/or retain any of the following groups? Base: All respondents, n=15.
1
1
2
3
4
4
6
6
7
8
10
15
15
14
14
13
12
11
11
9
9
8
7
5
Men
No specific initiatives
Mature employees (over the age of 45)
Part-time employees
Women
Para-Professional Employees
Young employees (under the age of 35)
Trades Employees
People from culturally and linguistically diverse backgrounds
People with disability
Entry level employees
Aboriginal and Torres Strait Islanders (ATSI)
Professional Employees
Targeted Not targeted

71
C o m m i s s i o n e r f o r P u b l i c A d m i n i s t r a t i o n
Targeted Initiatives to Retain Specific Groups - Tracking
Targeted Not targeted 2011/12 2012/13 2013/14 2011/12 2012/13 2013/14
Professional Employees 11 11 10 4 3 5
Aboriginal and Torres Strait Islanders (ATSI) 10 11 8 5 3 7 Entry level employees 9 9 7 6 5 8
People with disability 6 8 6 9 6 9 People from culturally and linguistically diverse backgrounds 3 5 6 12 9 9
Trades Employees 3 5 4 12 9 11 Young employees (under the age of 35) 6 4 4 9 10 11
Para‐Professional Employees 6 2 3 9 12 12 Women 3 2 2 12 12 13 Part‐time employees 1 2 1 14 12 14
Mature employees (over the age of 45) 2 2 1 13 12 14 No specific initiatives 0 0 0 0 0 15 Men 1 1 0 14 13 15 Total Participating Agencies 15 14 15 15 14 15
Breach Investigations
13. Please provide details on the number of investigations into suspected breaches of s9 of the PSMA during 2013/14? Base: All respondents, n=15.
Time Taken to Complete Investigations
Agencies were further asked about the time taken to complete the investigations. Most commonly, respondents mention that the investigations take anywhere between 2 months and 1 year.
14. Please provide the approximate timeframes the finalised in 2013/14 breach investigations took to complete? Base: Respondents who mentioned that there was a breach of s9 of PSMA during 2011/12; n=11, 2012/13; n=10, 2013/14; n=10.
2011/12 2012/13 2013/14 <2 weeks 1 1 5 2 weeks to <1 month 17 13 4 1 month to <2 months 18 19 12 2 months to <4 months 27 22 28 4 months to <1 year 28 58 46 1 year + 2 7 13 Total Number of Investigations 93 120 108
Number of suspected breach investigations finalised during 2013/14 (All Agencies combined)
108

ACT Public Service - State of the Service Report72
C o m m i s s i o n e r f o r P u b l i c A d m i n i s t r a t i o n
Number of Alleged Breaches of s9 of PSMA
15. Of the investigations finalised during 2013/14, please indicate the total number of employees alleged to have breached each subsection of s9 of the PSMA? (Please note that an individual investigation can be counted against more than one breach of s9 of the PSMA). Base: Respondents who mentioned that there was a breach of s9 of PSMA during 2011/12; n=11, 2012/13; n=10, 2013/14; n=10.
2011/12 2012/13 2013/14 Treat members of the public and other public employees with courtesy and sensitivity to their rights, duties and aspirations
41 52 43
Exercise reasonable care and skill 24 59 27 Comply with the Act, the management standards and all other Territory laws
21 36 24
Act with probity 21 26 21 Comply with any lawful and reasonable direction given by a person having authority to give this direction
25 32 20
Not harass a member of the public or another public employee, whether sexually or otherwise
16 35 12
Not make improper use of the property of the Territory 9 18 11 Not take, or seek to take, improper advantage of his or her position in order to obtain a benefit for the employee or any other person
11 7 6
Act impartially 0 4 4 Not take, or seek to take, improper advantage, for the benefit of the employee or any other person, of any information acquired, or any document to which the employee has access, as a consequence of his or her employment
4 3 2
Not disclose, without lawful authority –(i) any information acquired by him or her as a consequence of his or her employment; or (ii) any information acquired by him or her from any document to which he or she has access as a consequence of his or her employment
2 4 2
Report to an appropriate authority – (i) any corrupt or fraudulent conduct in the public sector that comes to his or her attention; or (ii) any possible maladministration in the public sector that he or she has reason to suspect
1 0 2
In dealing with members of the public, make all reasonable efforts to assist them to understand their entitlements under the laws of the Territory and to understand any requirements which they are obliged to satisfy under those laws
0 1 1
If the employee has an interest, pecuniary or otherwise, that could conflict, or appear to conflict, with the proper performance of his or her duties –(i) disclose the interest to his or her supervisor; and (ii) take reasonable action to avoid the conflict as soon as possible after the relevant facts come to the employee’s notice
1 4 1
Not make a comment that he or she is not authorised to make where the comment may be expected to be taken as an official comment
0 0 1
Not unlawfully coerce a member of the public or another public employee
0 1 0
Avoid waste and extravagance in the use of the property of the Territory
2 4 0
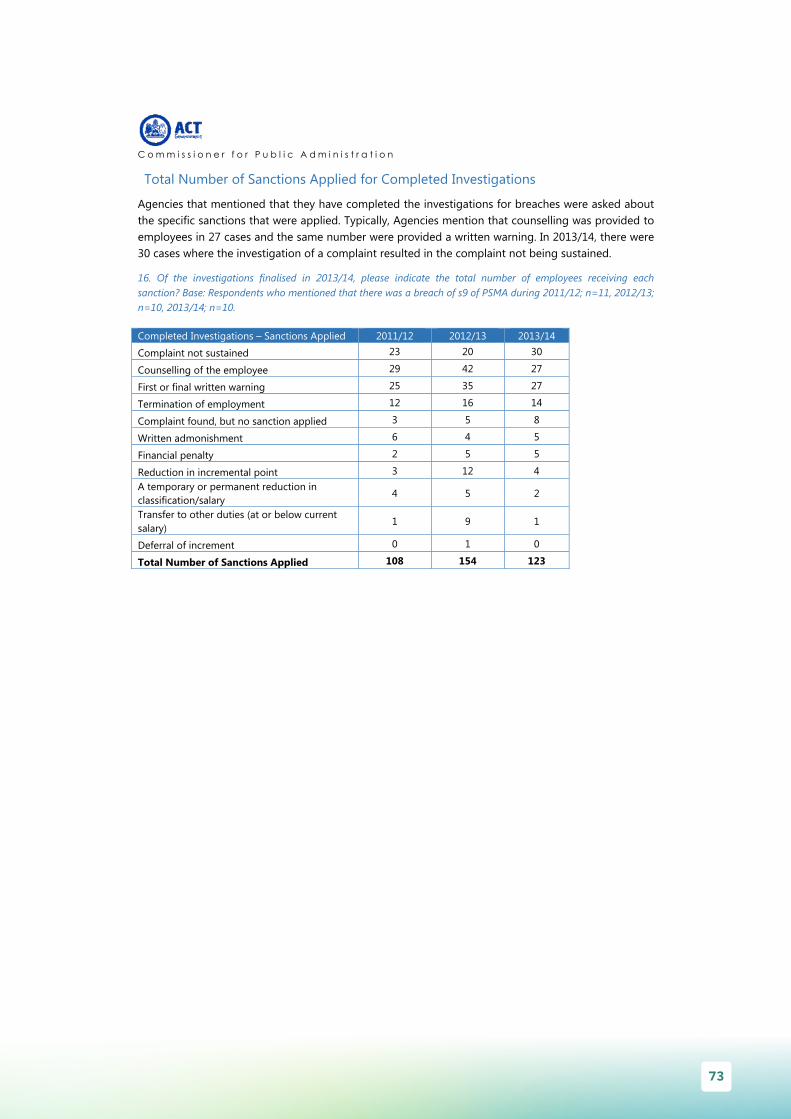
73
C o m m i s s i o n e r f o r P u b l i c A d m i n i s t r a t i o n
Total Number of Sanctions Applied for Completed Investigations
Agencies that mentioned that they have completed the investigations for breaches were asked about the specific sanctions that were applied. Typically, Agencies mention that counselling was provided to employees in 27 cases and the same number were provided a written warning. In 2013/14, there were 30 cases where the investigation of a complaint resulted in the complaint not being sustained.
16. Of the investigations finalised in 2013/14, please indicate the total number of employees receiving each sanction? Base: Respondents who mentioned that there was a breach of s9 of PSMA during 2011/12; n=11, 2012/13; n=10, 2013/14; n=10.
Completed Investigations – Sanctions Applied 2011/12 2012/13 2013/14
Complaint not sustained 23 20 30
Counselling of the employee 29 42 27
First or final written warning 25 35 27
Termination of employment 12 16 14
Complaint found, but no sanction applied 3 5 8
Written admonishment 6 4 5
Financial penalty 2 5 5
Reduction in incremental point 3 12 4 A temporary or permanent reduction in classification/salary
4 5 2
Transfer to other duties (at or below current salary)
1 9 1
Deferral of increment 0 1 0
Total Number of Sanctions Applied 108 154 123

ACT Public Service - State of the Service Report74
C o m m i s s i o n e r f o r P u b l i c A d m i n i s t r a t i o n
Measure to Ensure Consistency
Agencies which mentioned there were breaches were further asked to indicate the measures used to maintain consistency during the process of their investigations. All ten Agencies reported seeking guidance and support from HR/Employee Relations for the people conducting investigations. Use of Shared Services Centre was reported by nine out of ten Agencies as were the measures of detailed procedures being available to people conducting investigations and using an external panel to conduct investigations.
17. Did your Agency have any of the following measures in place during 2013/14 to ensure the processes to investigate suspected breaches of s9 of the PSMA were consistent across the Agency? Base: Respondents who mentioned that there was a breach of s9 of PSMA during 2013/14, n=10.
5
5
5
6
8
9
9
9
10
5
5
5
4
2
1
1
1
Central unit conducts all investigations
Internal panel trained to conduct investigations
Investigations referred to Commissioner for Public Administration
Service/Client Charters
Investigations referred to Senior Executives Responsible for Business Integrity Risk (SERBIR)
External panel trained to conduct investigations
Detailed procedures available to people conducting investigations
Use of Shared Services Centre
HR/Employee Relations provides guidance and support to people conducting investigations
Had measures in place Did not have measures in place

75
C o m m i s s i o n e r f o r P u b l i c A d m i n i s t r a t i o n
Measure to Ensure Consistency – Tracking
Base: Agencies who mentioned there was a breach, 2011/12; n=11, 2012/13; n=10, 2013/14; n=10.
Had measures in place Did not have measures in place
2011/12 2012/13 2013/14 2011/12 2012/13 2013/14
HR/Employee Relations provides guidance and support to people conducting investigations
11 8 10 0 2 0
Use of Shared Services Centre 8 9 9 3 1 1 Detailed procedures available to people conducting investigations
8 7 9 3 3 1
External panel trained to conduct investigations
9 8 9 2 2 1
Investigations referred to Senior Executives Responsible for Business Integrity Risk (SERBIR)
9 7 8 2 3 2
Service/Client Charters 4 5 6 7 5 4 Investigations referred to Commissioner for Public Administration
2 3 5 9 7 5
Internal panel trained to conduct investigations
6 5 5 5 5 5
Central unit conducts all investigations 7 7 5 4 3 5

ACT Public Service - State of the Service Report76
C o m m i s s i o n e r f o r P u b l i c A d m i n i s t r a t i o n
Measures to Ensure Sanctions are Imposed
All Agencies reported that they consult the central HR and/or legal area when deciding a sanction. The delegation for applying a sanction is strictly limited by all Agencies and guidelines were provided outlining considerations to be taken into account when deciding sanctions.
18. Did your Agency have any of the following measures in place during 2013/14 to ensure that sanctions imposed as a result of any determined breaches of s9 of the PSMA were applied appropriately and consistently across the Agency? Base: Respondents who mentioned that there was a breach of s9 of PSMA during 2013/14, n=10.
Measures to Ensure Sanctions are Imposed – Tracking
Base: Agencies who mentioned there was a breach, 2011/12; n=11, 2012/13; n=10, 2013/14; n=10.
Had measures in place Did not have measures in place
2011/12 2012/13 2013/14 2011/12 2012/13 2013/14
Central HR and/or legal area consulted when deciding sanction
10 9 10 1 1 0
Guidelines provided include considerations to be taken into account when deciding sanction
6 8 10 5 2 0
Delegation for applying sanction is strictly limited
10 9 10 1 1 0
Database of sanctions maintained and referred to as part of process for deciding sanction
6 6 7 5 4 3
Sanctions recommended by central unit within the agency responsible for all investigations
6 5 7 5 5 3
Sanction recommended by Shared Services 6 5 4 5 5 6
4
7
7
10
10
10
6
3
3
Sanction recommended by Shared Services
Sanctions recommended by central unit within the agency responsible for all investigations
Database of sanctions maintained and referred to as part of process for deciding sanction
Delegation for applying sanction is strictly limited
Guidelines provided include considerations to be taken into account when deciding sanction
Central HR and/or legal area consulted when deciding sanction
Had measures in place Did not have measures in place

77
C o m m i s s i o n e r f o r P u b l i c A d m i n i s t r a t i o n
Preventing Bullying and Harassment
19. Does your Agency have a formal reporting system for bullying and harassment? Base: All respondents, n=15.
Systems for Employees to Report Bullying and Harassment All Agencies report to having a number of systems in place for employees to report bullying or harassment.
20. Does your Agency use any of the following systems for employees to report bullying and harassment? Select all that apply. Base: All respondents, 2011/12; n=15, 2012/13; n=14, 2013/14; n=15.
2011/12 2012/13 2013/14
Count Percent Count Percent Count Percent
Identified contact person(s) for reporting matters
15 100% 14 100% 15 100%
Procedures and policies in place to ensure appropriate confidentiality
15 100% 14 100% 15 100%
Specialised training for contact staff 14 93% 14 100% 15 100% Awareness-raising with staff about bullying and harassment procedures and policies
15 100% 14 100% 15 100%
Option of additional support from an external provider (e.g. EAP)
15 100% 14 100% 15 100%
Accessible and effective reporting system(s) 14 93% 13 93% 14 93% Use of promotional material (e.g. posters, brochures)
13 87% 12 86% 13 87%
External investigator 12 80% 11 79% 9 60% Other 5 33% 2 14% 2 13% Total Participating Agencies 15 100% 14 100% 15 100%
All Agencies report that they have a formal reporting system for bullying and harassment.
100%

ACT Public Service - State of the Service Report78
C o m m i s s i o n e r f o r P u b l i c A d m i n i s t r a t i o n
Employee Assistance Provider
21. Does your Agency have an Employee Assistance Provider? Base: All respondents, n=15.
Provider # of mentions Optum 8
Converge International 2
Davidson Trahaire Corpsych 2
New Access (Beyond Blue) 1
DTC 1
PPC 1
Tams contracted service 1
Bullying and Harassment Reports
22. Regarding formal reports of bullying and harassment within your agency during 2013/14 please complete the following.
*Please Note: Formal Reports include a report that is formally lodged and can include verbal referrals, incidents, complaints and any other matter that warrants further investigation.
14
26
58
101
61
58
96
Number of the above formal investigations where bullying and harassment was found to have occurred
Number of formal investigations currently underway/ being investigated
Number of reports of bullying and harassment that resulted in formal investigation
Total number of formal reports* of bullying and harassment
Recorded informal reports notified to HR by a RED Contact Officer
Recorded informal reports notified directly to HR (not by a RED Contact Officer)
Total recorded informal reports
All 15 Agencies have an Employee Assistance Provider (EAP). 100%

79
C o m m i s s i o n e r f o r P u b l i c A d m i n i s t r a t i o n
Bullying and Harassment Reports - Comparison
*THESEQUESTIONSWERENOTINCLUDEDINTHE2012AGENCYSURVEY**PLEASE NOTE: FORMAL REPORTS INCLUDE A REPORT THAT IS FORMALLY LODGED AND CAN INCLUDE VERBALREFERRALS,INCIDENTS,COMPLAINTSANDANYOTHERMATTERTHATWARRANTSFURTHERINVESTIGATION

ACT Public Service - State of the Service Report80
C o m m i s s i o n e r f o r P u b l i c A d m i n i s t r a t i o n
MANAGING UNDERPERFORMANCE Underperformance Investigations
23. Please provide details of the number of underperformance investigations finalised during 2013/14. Base: All respondents, n=15.
24. Of those underperformance actions finalised, please indicate how often the following outcomes occurred:
Base: Respondents who provided the details of the number of investigations finalised in 2011/12, n=5, 2012/13, n=6, 2013/14; n=5.
2011/12 2012/13 2013/14Satisfactory performance standard attained n/a 9 7 Underperformance action not finalised due to unavailability (eg. resignation, long term leave, etc)
4 16 4
Reduction in classification n/a n/a 2 Development program instituted 12 6 n/a Assignment to other duties 2 n/a n/a Termination of employment 2 5 n/a No action taken n/a 3 n/a Total number of investigations finalised 21 41 16
n/a = reporting on this data may inadvertently identify individuals or individual cases.
Number of investigations finalised during 2013/14 16

81
C o m m i s s i o n e r f o r P u b l i c A d m i n i s t r a t i o n
Procedures for Managing Underperformance
A total of nine Agencies indicate that they do not have any procedures for managing underperformance in 2013/14.
25. Does your Agency have in place procedures for managing underperformance that supplement the ACTPS Enterprise Agreements?
26. Are your Agency managers adequately trained in managing underperforming staff?
27. Did your Agency engage the services of a provider from the ACTPS Administrative Review and Investigation Panel during the 2013/14 reporting period?
Base: All respondents, 2011/12; n=15, 2012/13; n=14, 2013/14; n=15.
Yes No 2011/12 2012/13 2013/14 2011/12 2012/13 2013/14
Procedures for managing underperformance
5 6 6 10 8 9
Agency managers are adequately trained in managing underperforming staff
6 9 11 9 5 4
Engaged the services of a provider from the ACTPS Administrative Review and Investigation Panel
5 9 8 10 5 7
Total Participating Agencies 15 14 15 15 14 15
ACTPS Administrative Review and Investigation Panel Engagement
28. Please indicate the number of times your Agency engaged the services of a provider from the ACTPS Administrative Review and Investigations Panel. Base: Respondents who mentioned that they have an Administrative review and investigation panel, 2011/12; n=5, 2012/13; n=9, 2013/14; n=8.
Matters commenced but not finalised
Matters finalised
ACTPS Administrative Panel Engagement
2011/12 2012/13 2013/14 2011/12 2012/13 2013/14
Other administrative review or investigation including complaints/grievances or public Interest Disclosure
0 2 9 0 0 13
Misconduct/Discipline (under ACTPS Enterprise Agreements)
9 20 8 5 22 6
Appeals (under ACTPS Enterprise Agreements)
1 5 5 3 10 4
Internal Reviews (under ACTPS Enterprise Agreements)
1 1 1 1 1 0
Fraud investigations (under the ACTPS Integrity Policy)
0 0 0 0 1 0

ACT Public Service - State of the Service Report82
C o m m i s s i o n e r f o r P u b l i c A d m i n i s t r a t i o n
RESPECT, EQUITY AND DIVERSITY FRAMEWORK RED Framework Measure
29. How many of the following are there within your agency? Base: All respondents, n=15.
RED Framework Measure 2011/12 2012/13 2013/14 Staff who have received RED training during 2013/2014
4471 3214 2440
Managers/Supervisors who have received RED training
2132 993 535
RED Contact Officers 359 359 328 RED Contact Officers who have received RED training
272 299 170
Executive Sponsor(s) 14 15 19 Current Executive Sponsor(s) who have received RED training
12 13 17
Changes to Executive Sponsor(s) N/A 4 4
Strategy
30. Which of the following did your Agency promote? Please select all that apply. Base: All respondents, 2011/12; n=15, 2012/13; n=14, 2013/14; n=15.
2011/12 2012/13 2013/14
Count Percent Count Percent Count Percent
Open Door Policy 15 100% 14 100% 14 93% Respect at Work Policy 15 100% 13 93% 13 87% Preventing Work Bullying Guidelines 14 93% 14 100% 13 87% Total Participating Agencies 15 100% 14 100% 15 100%

83
C o m m i s s i o n e r f o r P u b l i c A d m i n i s t r a t i o n
Tools to Promote RED Framework
A total of 15 Agencies include information on bullying and harassment in their induction program and 13 Agencies utilise RED Resources.
31. Which of the following tools has your Agency used to promote the RED framework? Please select all that apply. Base: All respondents, n=15.
Tools to Promote RED Framework - Tracking 2011/12 2012/13 2013/14
Inclusion of information on bullying and harassment in induction program 12 13 15 RED Resources (Framework folders & brochures) 14 12 13 Inclusion of information on bullying and harassment in staff surveys (exit and climate surveys)
10 8 10
Regular team meeting discussions regarding RED 9 9 10 RED overview sessions (separate to RED training sessions) 8 8 10 Staff survey includes questions on bullying and harassment 4 6 9 A RED network that meets quarterly or more frequently 7 9 7 Other 6 6 3 Total Participating Agencies 15 14 15
3
7
9
10
10
10
13
15
Other
A RED network that meets quarterly or more frequently
Staff survey includes questions on bullying and harassment
RED overview sessions (separate to RED training sessions)
Regular team meeting discussions regarding RED
Inclusion of information on bullying and harassment in staff surveys (exit and climate surveys)
RED Resources (Framework folders & brochures)
Inclusion of information on bullying and harassment in induction program

ACT Public Service - State of the Service Report84
C o m m i s s i o n e r f o r P u b l i c A d m i n i s t r a t i o n
Access to RED Folder and Other Resources
32. Do all managers and teams have access to a RED folder and other resources? Base: All respondents, 2011/12; n=15, 2012/13; n=14, 2013/14; n=15.
2011/12 2012/13 2013/14 Have access to RED folder 13 13 14
Do not have access to RED folder 1 1 1
Unsure 1 0 0
Total Participating Agencies 15 14 15
Method of Providing Staff Access to RED Resources
33. How has your Agency provided all staff access to your RED Contact Officer details? Please select all that apply. Base: All respondents, 2011/12; n=15, 2012/13; n=14, 2013/14; n=15.
2011/12 2012/13 2013/14
Count Percent Count Percent Count Percent
Intranet 13 87% 11 79% 13 87% Common areas/noticeboards 9 60% 9 64% 11 73% Staff directory 7 47% 8 57% 7 47% Website 5 33% 5 36% 5 33% Other 8 53% 6 43% 5 33% Agency switchboard 2 13% 1 7% 1 7% None 15 100% 14 100% 1 7%

85
C o m m i s s i o n e r f o r P u b l i c A d m i n i s t r a t i o n
Diversity Census Process
When asked if Agencies conduct a Diversity Census or ‘Update your Details’ process to encourage the disclosure of diversity, four agencies reported that they did conduct an Agency specific ‘Update your Details’ process, three agencies conducted another process and ten conducted none at all.
35. Did your Agency conduct a Diversity Census or ‘Update your Details’ process to encourage the disclosure of diversity? Please select all that apply. Base: All respondents, n=15. (Multiple selections possible).
Review of Recruitment Process, HR Process and Forms
36. Has your Agency reviewed your recruitment process, HR processes and forms to ensure: Please select all that apply Base: All respondents, 2011/12; n=15, 2012/13; n=14, 2013/14; n=15.
2011/12 2012/13 2013/14
Count Percent Count Percent Count Percent
Roles and responsibilities are clearly defined in job descriptions
14 93% 12 86% 13 87%
They are written in plain English 12 80% 11 79% 12 80% Reasonable adjustments are made for people with disability for interview arrangements
10 67% 11 79% 11 73%
Reasonable adjustments are made for successful applicants
9 60% 10 71% 10 67%
Training for panel members on the inclusion of the needs of diverse applicants
6 40% 5 36% 6 40%
No, my agency has not reviewed the recruitment process, HR processes and forms
0 0% 1 7% 2 13%
Total Participating Agencies 15 100% 14 100% 15 100%
Agency Specific 'Update
Your Details' Process,
n=4
Other, n=3
None,n=10
Those who said ‘Other’:
Head of service message on Workplace Diversity and update your details. In March 2014, ACT Health facilitated an agency specific ‘update on your diversity details’ census for one month period. Inclusion of requirement in induction process.

ACT Public Service - State of the Service Report86
C o m m i s s i o n e r f o r P u b l i c A d m i n i s t r a t i o n
PEOPLE WITH A DISABILITY Actions to Assist People with Disability
37. Did your Agency perform any of the following actions to promote the employment of People with Disability? Base: All respondents, n=15.
2
4
4
8
9
12
14
13
11
11
7
6
3
1
Ensure jobs are advertised in both mainstream and disability publications and/or to specialist Disability
employment services
Promote and recognise International Day of People with Disability
Assist able‐bodied employees across the ACTPS to build ‘disability confidence’ as co‐workers, managers and hirers of People with Disability and provide practical ideas and
tools to make a difference on the ground
Review any operational polices and procedures to ensure that they support inclusive work practices for People with
Disability
Provide a workplace orientation and induction strategy that includes supporting People with Disability in the
workplace
Promote flexible working conditions and reasonable adjustments available to ACTPS employees
Deliver mental health awareness training for managers, staff and employees
Performed the action Did not perform the action

87
C o m m i s s i o n e r f o r P u b l i c A d m i n i s t r a t i o n
Actions to Assist People with Disability - Tracking
Performed the action Did not perform the action
2011/12 2012/13 2013/14 2011/12 2012/13 2013/14
Deliver mental health awareness training for managers, staff and employees
6 10 14 9 4 1
Promote flexible working conditions and reasonable adjustments available to ACTPS employees
13 14 12 2 0 3
Provide a workplace orientation and induction strategy that includes supporting People with Disability in the workplace
7 11 9 8 3 6
Review any operational policies and procedures to ensure that they support inclusive work practices for People with Disability
10 8 8 5 6 7
Assist able-bodied employees across the ACTPS to build ‘disability confidence’ as co-workers, managers and hirers of People with Disability and provide practical ideas and tools to make a difference on the ground
7 3 4 8 11 11
Promote and recognise International Day of People with Disability
7 6 4 8 8 11
Ensure jobs are advertised in both mainstream and disability publications and/or to specialist Disability employment services
3 1 2 12 13 13
Total Participating Agencies 15 14 15 15 14 15

ACT Public Service - State of the Service Report88
C o m m i s s i o n e r f o r P u b l i c A d m i n i s t r a t i o n
Recruitment Strategies for People with Disability
38. Did your Agency use the any of the following strategies to attract People with Disability to the ACT Public Service? If yes, how many? Base: All respondents, n=15.
Recruitment Strategies for People with Disability - Tracking
Used the Strategy Did not use the strategy
2011/12 2012/13 2013/14 2011/12 2012/13 2013/14
School based apprenticeships for People with Disability
0 0 0 15 14 15
Willing and Able Mentoring program 0 0 0 15 14 15 Disability Cadetship 0 0 0 15 14 15 Positions in the Whole of Government Graduate Program for People with a Disability
1 1 0 14 13 15
Disability Traineeship 6 2 2 9 12 13 Identified positions for People with Disability
5 5 3 10 9 12
Promote the ACTPS as an employer of choice for People with a Disability
2 5 5 13 9 10
Work experience for People with Disability 3 3 5 12 11 10 Total Participating Agencies 15 14 15 15 14 15
5
5
3
2
10
10
12
13
15
15
15
15
Work experience for People with Disability
Promote the ACTPS as an employer of choice for People with a Disability
Identified positions for People with Disability
Disability Traineeship
Positions in the Whole of Government Graduate Program for People with a Disability
Disability Cadetship
Willing and Able Mentoring program
School based apprenticeships for People with Disability
Used the strategy Did not use the strategy

89
C o m m i s s i o n e r f o r P u b l i c A d m i n i s t r a t i o n
Retention Strategies for People with Disability
39. Does your Agency use any of the following strategies to retain People with Disability in the ACT Public Service? Base: All respondents, n=15.
Retention Strategies for People with Disability - Tracking
Performed the action Did not perform the action
2011/12 2012/13 2013/14 2011/12 2012/13 2013/14
Agency-based Disability employee networks 5 2 1 10 12 14
Agency-based Reasonable Adjustment Policy
3 5 4 12 9 11
Agency-based Reasonable Adjustment Policy
3 5 4 12 9 11
Total Participating Agencies 15 14 15 15 14 15
Reasonable Adjustment 40. Are the managers/supervisors within your Agency aware of the requirements to make reasonable adjustment(s) following disclosure of a disability status? Base: All respondents, 2011/12; n=15, 2012/13; n=14, 2013/14; n=15. 2011/12 2012/13 2013/14 Aware of requirements 9 7 8
Somewhat aware of requirements 6 7 6
Not aware of requirements 0 0 1
Total Participating Agencies 15 14 15
5
4
1
10
11
14
Disability Awareness Training available to all staff
Agency-based Reasonable Adjustment Policy
Agency-based Disability employee networks
Used the strategy Did not use the strategy

ACT Public Service - State of the Service Report90
C o m m i s s i o n e r f o r P u b l i c A d m i n i s t r a t i o n
Applications to Employment Assistance Fund (EAF)
41. Were any applications for reasonable adjustment and/or financial assistance made to the Employment Assistance Fund (EAF) by your Agency in 2013/14 (via the Job Access Fund)? Base: All respondents, n=15.
Accessibility Audits (Timeline)
Three agencies reported having conducted an accessibility audit in accordance with the ACTPS Employment Strategy for People with disability. One of these agencies indicated that an accessibility audit had been conducted in 2013/14.
42. During the period did your Agency conduct an ‘accessibility audit(s)’ (in accordance with the ACTPS Employment Strategy for People with disability) to assess the level of accessibility to your premises for people with disability? Base: All respondents 2013/14, n=15.
Not aware of past audit,
(n=12)
Conducted an Accessibility Audit, (n=3)
No agencies made applications for reasonable adjustment to Employment Assistance Fund. 0

91
C o m m i s s i o n e r f o r P u b l i c A d m i n i s t r a t i o n
Disability Employment Network
43. Did your Agency work with a Disability Employment Network to place people identifying with a disability in employment within your Agency? Base: All respondents, n=15.
44. Which Disability Employment Service Providers did your Agency use? Base: All respondents, n=15.
Service Providers # of mentions Advance Personnel 2
LEAD Employment 1
Australian Training Company 1
Koomarri 1 Woden Community Service Community Supported Respite Program
1
Community Programs Association Inc. 1
Did not work with Disability Employment
Network,n=12
Worked with a Disability
Employment Network,
n=3
Agencies that worked with Disability
Employment Network indicate that a total of 24 people were placed as follows: One GSO3, One trainee apprentice
and 22 without specifying a
classification.

ACT Public Service - State of the Service Report92
C o m m i s s i o n e r f o r P u b l i c A d m i n i s t r a t i o n
Strategies to attract Aboriginal and Torres Strait Islander People
45. Did your Agency use the any of the following strategies to attract Aboriginal and Torres Strait Islander people to the ACT Public Service? If yes, how many? Base: All respondents, n=15.
Strategies to attract Aboriginal and Torres Strait Islander People - Tracking
Used the strategy Did not use the strategy
2011/12 2012/13 2013/14 2011/12 2012/13 2013/14
Identified Positions for Aboriginal and Torres Strait Islander people
9 7 7 6 7 8
Work Experience for Aboriginal and Torres Strait Islander People
4 2 4 11 12 11
Aboriginal and Torres Strait Islander Traineeship
7 7 4 8 7 11
Positions for Aboriginal and Torres Strait Islanders in the Whole of Government Graduate Program
3 5 3 12 9 12
Aboriginal and Torres Strait Islander Cadetship
0 1 1 15 13 14
Total Participating Agencies 15 14 15 15 14 15
1
3
4
4
7
14
12
11
11
8
Aboriginal and Torres Strait Islander Cadetship
Positions for Aboriginal and Torres Strait Islanders in the Whole of Government Graduate Program
Aboriginal and Torres Strait Islander Traineeship
Work Experience for Aboriginal and Torres Strait Islander People
Identified Positions for Aboriginal and Torres Strait Islander people
Used the strategy Did not use the strategy

93
C o m m i s s i o n e r f o r P u b l i c A d m i n i s t r a t i o n
Strategies to retain Aboriginal and Torres Strait Islander People
46. Does your Agency use any of the following strategies to retain Aboriginal and Torres Strait Islander people in the ACT Public Service? Base: All respondents, n=15.
Strategies to retain Aboriginal and Torres Strait Islander People - Tracking
Used the strategy Did not use the strategy
2011/12 2012/13 2013/14 2011/12 2012/13 2013/14
Aboriginal and Torres Strait Islander cultural awareness programs available to all staff
9 12 12 6 2 3
One day paid leave during NAIDOC week 14 13 12 1 1 3
Special leave provisions 14 12 11 1 2 4
Culturally-specific training programs 9 10 7 6 4 8 Promote the ACTPS as an employer of choice for Aboriginal and Torres Strait Islander people
6 8 6 9 6 9
Advertise employment opportunities through a variety of media sources including Aboriginal and Torres Strait Islander publications/media
6 8 6 9 6 9
Agency based Aboriginal and Torres Strait Islander employee networks
5 7 4 10 7 11
Aboriginal and Torres Strait Islander Study Awards
2 2 2 13 12 13
Total Participating Agencies 15 14 15 15 14 15
13
11
9
9
8
4
3
3
2
4
6
6
7
11
12
12
Aboriginal and Torres Strait Islander Study Awards
Agency based Aboriginal and Torres Strait Islander employee networks
Advertise employment opportunities through a variety of media sources including Aboriginal and Torres Strait Islander publications/media
Promote the ACTPS as an employer of choice for Aboriginal and Torres Strait Islander people
Culturally-specific training programs
Special leave provisions (e.g. ceremonial leave)
One day paid leave during NAIDOC week
Aboriginal and Torres Strait Islander cultural awareness programs available to all staff
Did not use the strategy Used the strategy

ACT Public Service - State of the Service Report94
C o m m i s s i o n e r f o r P u b l i c A d m i n i s t r a t i o n
Further Strategies for Aboriginal and Torres Strait Islander Employees
47. Does your Agency have any of the following in place for Aboriginal and Torres Strait Islander employees? Base: All respondents, n=15.
Further Strategies for Aboriginal and Torres Strait Islander Employees - Tracking
Have in place Do not have in place
2011/12 2012/13 2013/14 2011/12 2012/13 2013/14
Learning and Development programs 10 9 9 5 5 6 Career pathway plans 6 7 8 9 7 7 Access to trained mentors for new and existing employees
5 8 7 10 6 8
A buddy system for new employees 6 7 6 9 7 9 Work shadowing opportunities 6 5 2 9 9 13 Rotations and exchanges 1 5 2 14 9 13 Total Participating Agencies 15 14 15 15 14 15
2
2
6
7
8
9
13
13
9
8
7
6
Rotations and exchanges
Work shadowing opportunities
A buddy system for new employees
Access to trained mentors for new and existing employees
Career pathway plans
Learning and Development programs
Have in place Do not have in place

95
C o m m i s s i o n e r f o r P u b l i c A d m i n i s t r a t i o n
Number of Aboriginal and Torres Strait Islander Liaison Officers
48. How many Aboriginal and Torres Strait Islander Liaison Officers were recruited in 2013/14? Base: All respondents, n=15. 49. Did you arrange for an Aboriginal Community member to be on the interview panel? Base: Respondents who recruited Aboriginal and Torres Strait Islander Liaison Officers, n=5.
Aboriginal and Torres Strait Islander Recruitment Package
50. When your Agency is recruiting to Agency Liaison Officer roles, does your Agency develop a specific Aboriginal and Torres Strait Islander recruitment package that ensures that roles and responsibilities are clearly defined and position descriptions relevant? Base: All respondents, n=15.
Aboriginal and Torres Strait Islander Recruitment Package - Tracking
2011/12 2012/13 2013/14 Have not recruited in the past year 7 10 10 Develop a specific Aboriginal and Torres Strait Islander recruitment package
3 2 5
Did not develop a specific Aboriginal and Torres Strait Islander recruitment package
5 2 0
Total Participating Agencies 15 14 15
0
5
10
Did not develop a specific Aboriginal and Torres Strait Islander recruitment package
Develop a specific Aboriginal and Torres Strait Islander recruitment package
Have not recruited in the past year
Number of Aboriginal and Torres Strait Islander Liaison Officers (across five Agencies). Four Agencies reported that they arranged for an Aboriginal Community member to be on the interview panel.
13

ACT Public Service - State of the Service Report96
C o m m i s s i o n e r f o r P u b l i c A d m i n i s t r a t i o n
The Agencies were further asked if they ensure that a proportion of positions on management development programs are allocated to Aboriginal and Torres Strait Islander employees. A majority of Agencies (12) indicate that they do not do so, while three agencies reported that a proportion of positions on management development programs are allocated to Aboriginal and Torres Strait Islander employees.
51. Does your agency ensure a proportion of positions available on management development programs are allocated to Aboriginal and Torres Strait Islander employees, even if not all criteria for acceptance to a program are met? Base: All respondents, 2011/12; n=15, 2012/13; n=14, 2013/14; n=15.
2011/12 2012/13 2013/14
Count Percent Count Percent Count Percent
Positions are allocated 2 13% 1 7% 3 20% No positions are allocated 13 87% 13 93% 12 80% Total Participating Agencies 15 100% 14 100% 15 100%
FRAUD AND RISK Formal Risk Assessment of Agency
53. Has a formal risk assessment of your Agency been undertaken in accordance with the Risk Management Standard and the ACTPS Integrity Policy (section 6.1)? Base: All respondents, 2011/12; n=15, 2012/13; n=14, 2013/14; n=15.
2011/12 2012/13 2013/14
Count Percent Count Percent Count Percent
Undertook formal risk assessment 14 93% 14 100% 15 100% Did not undertake formal risk assessment 1 7% 0 0% 0 0% Total Participating Agencies 15 100% 14 100% 15 100%
Plans to Review the Risk Assessment
54. Are there plans to review the risk assessment process within your Agency for this upcoming financial year? Base: All respondents, 2011/12; n=15, 2012/13; n=14, 2013/14; n=15.
2011/12 2012/13 2013/14
Count Percent Count Percent Count Percent
Have plans to review the risk assessment process
12 80% 12 86% 12 80%
Do not have plans to review the risk assessment process
3 20% 2 14% 3 20%
Total Participating Agencies 15 100% 14 100% 15 100%

97
C o m m i s s i o n e r f o r P u b l i c A d m i n i s t r a t i o n
Fraud and Corruption Prevention Plan
56. Does your Agency have a current Fraud and Corruption Prevention Plan? Base: All respondents, n=15.
Plans to Review the Fraud and Corruption Plan 57. Are there plans to review the Fraud and Corruption Plan within your Agency for the next financial year? Base: All respondents, 2011/12; n=15, 2012/13; n=14, 2013/14; n=15.
2011/12 2012/13 2013/14
Count Percent Count Percent Count Percent
Plans to review 12 80% 11 79% 12 80% No plans to review 3 20% 3 21% 3 20% Total Participating Agencies 15 100% 14 100% 15 100%
Risk Category
58. Please use a scale of one to five to describe the following integrity risks within your Agency. Base: All respondents, n=15.
2
6
1
3
3
1
6
7
5
5
7
6
6
1
8
5
3
3
1
1
1
2
2
5
Fraud & Integrity
Fraud (clients)
IT Systems
Asset Management
Finance
Procurement & Contract Management
Low Risk 1 2 Medium Risk 3 4 Extreme Risk 5
All Agencies report that they have a current Fraud and Corruption Prevention Plan. 100%

ACT Public Service - State of the Service Report98
C o m m i s s i o n e r f o r P u b l i c A d m i n i s t r a t i o n
Risk Category - Tracking
Low risk 1 or 2 Medium risk 3 4 or Extreme risk 5
2011/12 2012/13 2013/14 2011/12 2012/13 2013/14 2011/12 2012/13 2013/14
Procurement & Contract Management
7 4 7 6 7 3 2 3 5
Finance 11 9 10 2 2 3 2 3 2
Asset Management 13 6 8 1 7 5 1 1 2
IT Systems 7 5 6 6 7 8 2 2 1
Fraud (clients) 13 10 13 1 2 1 1 2 1
Fraud & Integrity 10 6 8 3 7 6 2 1 1
Occurrence of Risk Incidents
Overall, asset management is the most common risk category in 2013/14, with Agencies reporting a total of 19 incidents of this type.
59. How many incidents occurred in the following risk categories within your Agency, in the period? Base: All respondents, 2011/12; n=15, 2012/13; n=14, 2013/14; n=15.
Number of Incidents Risk Category 2011/12 2012/13 2013/14 Asset Management 6 1 19 Fraud & Integrity 16 26 12 IT systems 5 4 3 Procurement & Contract Management 1 2 2 Information/Record Management 2 0 2 Finance 4 5 2 Fraud (client) 1 0 1
Estimated Cost of Investigations
60. What was the estimated total cost of investigations during the financial year (2013/14)? Base: Respondents who reported the occurrence of risk incidents, n=8.
$582,302
$50,000
$15,000
When asked about the total cost of investigations during the financial year (2013/14), five Agencies reported zero cost during the financial year. Three Agencies reported dollar amounts that are presented in the adjoining table.

C o m m i s s i o n e r f o r P u b l i c A d m i n i s t r a t i o n
Awareness of Fraud or Corruption Trends
63. Are you aware of any fraud or corruption trends within your agency or ACTPS? Base: All respondents, n=15.
Zero Agencies are aware of fraud or corruption trends within the Agency or ACTPS. 0%
99

Appendix 2 – Definitions
ACT Public Service - State of the Service Report100

101
C o m m i s s i o n e r f o r P u b l i c A d m i n i s t r a t i o n
Appendix 2 – Definitions
Definition of Appointment
Definition Appointment from External This is any commencement with the ACT Public Service
where the person has commenced directly as a permanent officer.
Total Appointment from Temporary Contract
This is the total of temporary contract staff who were appointed as permanent officers.
Total Promotion from Higher Duties Allowance (HDA)
This is the total number of promotions immediately following a period of HDA.
Total Permanent Transfer/Promotion
This is the total number of permanent transfers and promotions (not following higher duties).
ACT Public Service The ACT Public Service comprises ten Directorates (refer to Table 1 for details) that report to the Head of Service as constituted by the Administrative Arrangements 2014 (No 1).
ACT Public Sector The ACT Public Sector encompasses the employees of the ten Directorates that report to the Head of Service, as well as staff employed under the Public Sector Management (PSM) Act 1994 in other ACT Government agencies.
Appointments Appointments refer to the recruitment of people as permanent officers. Recruits can be people external to the organisation, or people already working internal to the organisation as temporary or casual employees.
Employees Employees include permanent officers, temporary and casual employees.
Employees – casual Casual employees are those engaged on an ad hoc hourly or daily basis with no ongoing tenure of employment. This category of employment can also be referred to as non‐ongoing and usually consists of an employment arrangement which is not considered systematic, continuous or permanent.
Employees – full‐time Full‐time employees can be either permanent or temporary who work full‐time hours in accordance with their provisions.
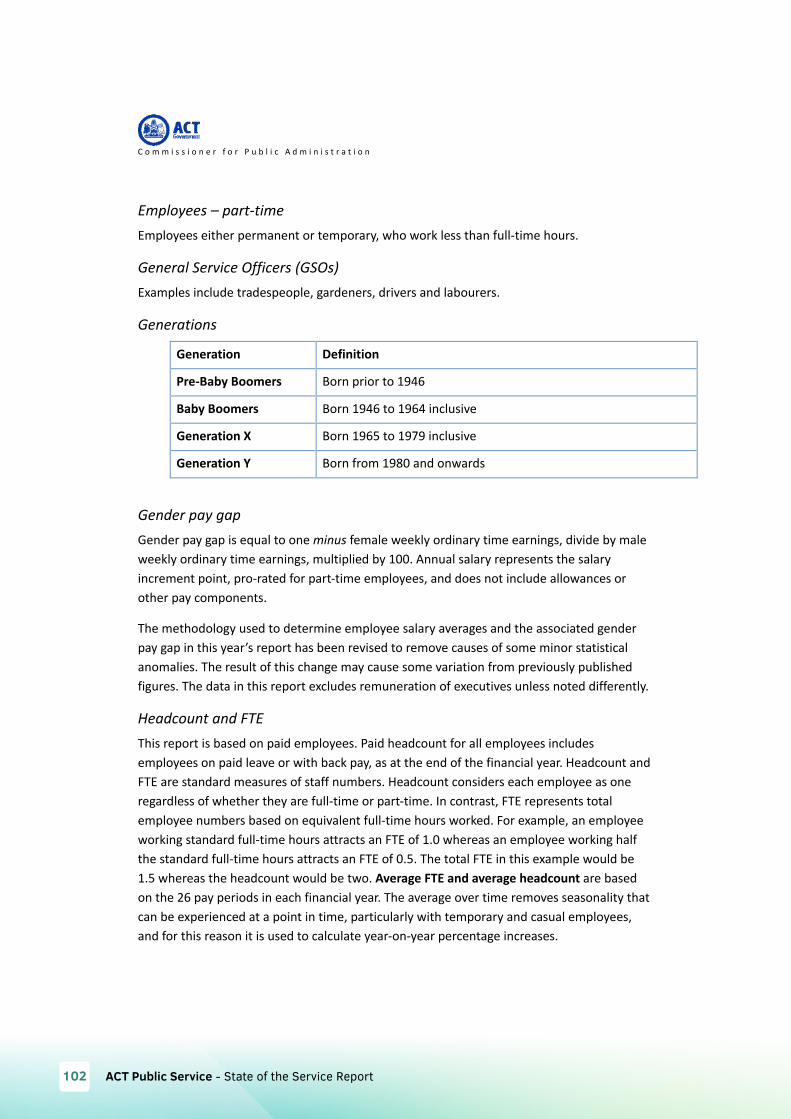
ACT Public Service - State of the Service Report102
C o m m i s s i o n e r f o r P u b l i c A d m i n i s t r a t i o n
Employees – part‐time Employees either permanent or temporary, who work less than full‐time hours.
General Service Officers (GSOs) Examples include tradespeople, gardeners, drivers and labourers.
Generations
Generation Definition
Pre‐Baby Boomers Born prior to 1946
Baby Boomers Born 1946 to 1964 inclusive
Generation X Born 1965 to 1979 inclusive
Generation Y Born from 1980 and onwards
Gender pay gap Gender pay gap is equal to one minus female weekly ordinary time earnings, divide by male weekly ordinary time earnings, multiplied by 100. Annual salary represents the salary increment point, pro‐rated for part‐time employees, and does not include allowances or other pay components.
The methodology used to determine employee salary averages and the associated gender pay gap in this year’s report has been revised to remove causes of some minor statistical anomalies. The result of this change may cause some variation from previously published figures. The data in this report excludes remuneration of executives unless noted differently.
Headcount and FTE This report is based on paid employees. Paid headcount for all employees includes employees on paid leave or with back pay, as at the end of the financial year. Headcount and FTE are standard measures of staff numbers. Headcount considers each employee as one regardless of whether they are full‐time or part‐time. In contrast, FTE represents total employee numbers based on equivalent full‐time hours worked. For example, an employee working standard full‐time hours attracts an FTE of 1.0 whereas an employee working half the standard full‐time hours attracts an FTE of 0.5. The total FTE in this example would be 1.5 whereas the headcount would be two. Average FTE and average headcount are based on the 26 pay periods in each financial year. The average over time removes seasonality that can be experienced at a point in time, particularly with temporary and casual employees, and for this reason it is used to calculate year‐on‐year percentage increases.

103
C o m m i s s i o n e r f o r P u b l i c A d m i n i s t r a t i o n
Leave Staff can access annual leave and personal leave entitlements. Annual leave is often referred to as recreational leave. Personal leave can be taken in instances of personal illness or injury, for bereavement, or when caring for a dependent due to illness or injury. Leave can experience a time‐lag in processing.
Entitlements can be found in the relevant section of enterprise and collective agreements, see the website for details: http://www.sharedservices.act.gov.au/docs/agreements/
Median The median of a set of data values is the middle value of the data set when it has been arranged in ascending order. It is the point at which 50 percent of the data set has a greater value and 50 percent of the data has a smaller value.
Officer ‐ permanent Permanent officers can be full‐time or part‐time, who have been appointed to an office or as an unattached officer under the Public Sector Management Act 1994.
Separation rate The separation rate is determined by dividing the total number of permanent separations by the average permanent headcount, over the financial year, for the ACTPS, and excludes transfers between Directorates. Previous years have been based on average headcount of all staff, including casuals and temporary employees, which deflates the result. The new calculation is consistent with other jurisdictions including the Australian Public Service.
Territory‐owned Corporations (TOCS) Government enterprises (known as Territory‐owned Corporations) under the Territory‐owned Corporations Act 1990 (TOCS), are separate entities to the ACTPS and other ACT public sector agencies and are not included in this report. As at June 2012, TOCS are ACTEW Corporation Limited and ACTTAB Limited.
Workforce average Note that the calculation of a workforce average is based on the total available data for ACTPS Directorates only. The ACTPS average is a weighted mean of groups that have varying numbers of employees and it is not a simple average of the figures for groups shown.

Appendix 3 – Workforce Profile Information
ACT Public Service - State of the Service Report104

105
C o m m i s s i o n e r f o r P u b l i c A d m i n i s t r a t i o n
Appendix 3 – Workforce Profile Information
Table 1: ACT Public Service employee numbers (2009‐10 to 2013‐14)
2009‐10 2010‐11 2011‐12 2012‐13 2013‐14
Full‐Time Equivalent (FTE)
FTE (end FY) 15857.7 16509.6 17196.1 17848.5 18280.9
Proportion of ACT population1 4.4% 4.5% 4.6% 4.7% 4.8%
Headcount
Headcount (end FY) 17917 18599 19331 20017 20551
Proportion of ACT population2 5.0% 5.1% 5.2% 5.3% 5.3%
Executives (end FY)
FTE 175.4 183.6 186.0 196.7 211.5
Proportion of workforce 1.1% 1.1% 1.1% 1.1% 1.2%
Headcount 178 185 187 197 213
Proportion of workforce 1.0% 1.0% 1.0% 1.0% 1.0%
Employment modes (proportions of workforce, based on headcount, end FY)
Permanent 79.3% 78.2% 77.9% 77.6% 77.4%
Temporary 12.9% 14.5% 15.3% 15.3% 15.6%
Casual 7.7% 7.3% 6.8% 7.1% 7.1%
Full‐time 70.3% 70.2% 70.4% 70.5% 70.1%
Part‐time 22.0% 22.5% 22.8% 22.4% 22.9%
1 Australian Bureau of Statistics, Australian Demographic Statistics: Estimated Resident Population, States and Territories 3101.0, Australia, 2014
2 Ibid

ACT Public Service - State of the Service Report106
C o m m i s s i o n e r f o r P u b l i c A d m i n i s t r a t i o n
Table 2: ACT Public Service workforce characteristics (2009‐10 to 2013‐14)
2009‐10 2010‐11 2011‐12 2012‐13 2013‐14
Remuneration (base salaries)
Full‐time (average) $71,730 $73,832 $77,191 $80,023 $82,059
Increase year‐on‐year 2.2% 2.9% 4.5% 3.7% 2.5%
Full‐time (median) $65,886 $67,470 $69,153 $71,578 $74,082
Part‐time $64,152 $65,893 $69,055 $71,970 $74,328
Part‐time load (average) 0.70 0.69 0.69 0.69 0.69
Gender pay gap 2.4% 2.2% 3.2% 2.9% 1.7%
Commencements and separations (permanent staff)
External appointments as a proportion of total appointments
39.9% 41.0% 40.9% 34.7% 27.2%
Separation rate3 7.1% 9.2% 8.3% 6.8% 6.2%
Age and length of service (average in years, end FY)
Age (includes casuals) 42.7 42.7 42.6 42.4 42.5
Length of service (excludes casuals)
8.5 8.4 8.4 8.4 8.6
Generations (proportions of workforce, based on headcount, end FY
Generation Y 18.5% 21.2% 24.0% 26.9% 29.2%
Generation X 36.4% 36.4% 37.0% 37.4% 37.5%
Baby boomers 42.8% 40.5% 37.6% 34.6% 32.5%
Pre‐baby boomers 2.3% 1.9% 1.4% 1.1% 0.8%
3 Separation rates for 2009‐10, 2010‐11 and 2011‐12 were incorrectly reported on in the 2012‐13 State of the Service report.

107
C o m m i s s i o n e r f o r P u b l i c A d m i n i s t r a t i o n
Leave usage4
Annual leave (average in days) 18.8 18.8 18.4 19.3 19.5
Personal leave (average in days) 11.4 11.4 11.1 11.9 11.5
Personal leave absence rate 4.7% 4.8% 4.7% 4.7% 4.5%
Table 3: ACT Public Service FTE and headcount by classification group (June 2012, 2013 and 2014)
Classification Group FTE Headcount
Jun‐12 Jun‐13 Jun‐14 Jun‐12 Jun‐13 Jun‐14Administrative Officers 4130.3 4280.4 4357.5 4737 4895 4983Ambulance Officers 189.4 203.8 200.7 201 216 215Bus Operators 575.9 597.3 586.3 648 674 658Correctional Officers 159.5 163.0 172.4 169 173 183Dentist/Dental Officers 10.9 13.5 14.7 14 17 18Disability Officers 237.6 251.4 249.8 262 283 283Executives 186.0 196.7 211.5 187 197 213Fire Brigade Officers 334.4 347.5 345.5 336 349 348General Service Officers and Equivalent
977.3 1027.8 1058.6 1060 1103 1137
Health Assistants 42.8 56.1 72.5 47 64 85Health Professional Officers 1126.9 1182.7 1211.6 1286 1333 1380Information Technology Officers 147.5 163.5 170.2 151 166 173Judicial Officers 10.7 10.0 13.0 12 15 15Legal Officers 75.7 89.5 86.3 83 95 91Legal Support 13.9 15.8 14.6 15 16 15Linen Production and Maintenance
63.9 57.2 53.2 67 60 56
Medial Officers 666.3 742.5 782.4 739 814 857Nursing and Midwifery 2154.8 2218.7 2338.9 2579 2626 2766Professional Officers 113.8 114.4 129.1 124 132 147Prosecutors 34.9 37.6 36.0 41 38 38Rangers 39.2 35.6 40.8 41 38 43School Leaders 717.7 740.3 751.5 734 753 770Senior Officers 1953.7 2042.2 2084.8 2022 2113 2163Statutory Office Holders 11.0 12.8 11.0 12 14 12
4 2013‐14 data may have minor deficiencies due to retrospective submission and processing. Earlier years have been retrospectively updated to address processing time lag.

ACT Public Service - State of the Service Report108
C o m m i s s i o n e r f o r P u b l i c A d m i n i s t r a t i o n
Teachers 2865.3 2893.0 2919.4 3367 3433 3480Technical Officers 272.6 276.2 284.9 310 319 328Trainees and Apprentices 42.6 40.0 37.1 43 40 45Transport Officers (incl. Trainer/assessors)
41.4 39.1 46.7 44 41 49
Total 17196.1 17848.5 18280.9 19331 20017 20551*Note: this data excludes Senior Officers, Professional Offices and Administrative Officers in Auditor‐General’s Office and Canberra Institute of Technology.
Table 4: FTE by Directorate (June 2013 and 2014)
Directorate Jun‐14 Jun‐13 Percentage Change (%) June 2013‐2014
Chief Minister and Treasury 268.9 279.1 ‐3.6% Long Service Leave Authority 11.0 12.0 ‐8.3% Independent Competition and Regulatory Commission
8.6 8.0 7.5%
Capital Metro Agency 18.0 0.0 0.0%Commerce and Works 1098.4 1048.1 4.8%Community Services 1230.6 1219.0 1.0%Economic Development 217.0 208.3 4.2% Exhibition Park Corporation 10.9 13.9 ‐21.7% Gambling and Racing Commission 30.6 27.6 10.9% Land Development Agency 99.6 89.2 11.7%Education and Training 5136.6 5027.1 2.2%Environment and Sustainable Development 423.2 452.3 ‐6.4%Health 5979.9 5749.1 4.0%Justice and Community Safety 1844.7 1820.6 1.3%Territory and Municipal Services 1903.0 1894.3 0.5%Total 18280.9 17848.5 2.4%

109
C o m m i s s i o n e r f o r P u b l i c A d m i n i s t r a t i o n
Table 5: Headcount by Directorate and employment mode (June 2014)
Directorates Permanent Temporary Casual Total
Chief Minister and Treasury 219 59 1 279 Long Service Leave Authority 10 1 0 11 Independent Competition and Regulatory Commission
6 4 0 10
Capital Metro Agency 12 6 0 18Commerce and Works 901 219 2 1122Community Services 1085 181 65 1331Economic Development 190 28 11 229 Exhibition Part Corporation 9 2 1 12 Gambling and Racing Commission 28 6 0 34 Land Development Agency 93 11 0 104Education and Training 4485 830 855 6170Environment and Sustainable Development
391 55 3 449
Health 5076 1331 390 6797Justice and Community Safety 1658 240 36 1934Territory and Municipal Services 1738 223 90 2051Total 15901 3196 1454 20551
Table 6: Headcount and FTE by Directorate and Business Unit 2013‐14
Reporting Directorate Division Headcount FTE
Chief Minister and Treasury Directorate
CULTURE AND COMMUNICATIONS
18 14.0
DEFAULT INSURANCE FUND 2 2.0FINANCE AND BUDGET 38 38.0GOVERNANCE DIVISION 90 86.9NULL 27 26.6OFF THE CHIEF EXECUTIVE 3 3.0POLICY 43 41.3ECONOMICS AND FINANCIAL GR
40 39.1
EXPENDITURE REVIEW 12 12.0INFRA FINANCE AND ADVISORY
2 2.0
OFFICE UNDER TREASURER 4 4.0Chief Minister and Treasury Directorate Total 279 268.9Capital Metro Agency 18 18.0Long Service Leave Authority 11 11.0 Independent Competition and 10 8.6

ACT Public Service - State of the Service Report110
C o m m i s s i o n e r f o r P u b l i c A d m i n i s t r a t i o n
Regulatory Commission Commerce and Works Directorate ACT INSURANCE AUTHORITY 15 13.8
BUSINESS SERVICES 66 65.2EXECUTIVE 20 20.0REVENUE MANAGEMENT 83 81.1SHARED SERVICES 938 918.2
Commerce and Works Directorate Total 1122 1098.4Community Services Directorate CHILD, YTH AND FAMILY SUPP 432 403.2
DISABILITY ACT 374 336.7HOUSING AND COMM SERV 234 227.9OFFICE OF CHIEF EXEC 6 6.0POLICY AND ORG SERVICES 171 161.1THERAPY ACT 114 95.8
Community Services Directorate Total 1331 1230.6Economic Development Directorate NULL 2 2.0
OFF THE DIRECTOR GENERAL 23 23.0BUS TOURISM EVENTS SPORT 152 141.4LAND DEVELOPMENT AND CORP
52 50.7
Economic Development Directorate Total 229 217.0EPIC (Economic Development Directorate)
12 10.9
Gambling and Racing Commission 34 30.6Land Development Agency (EDD) 104 99.6Education and Training Directorate CHIEF EXECUTIVE 2 2.0
DEPUTY CHIEF EXECUTIVE 3 3.0EXEC DIR CORP SERVICES 1 1.0EXEC DIR SCHOOL IMPROVEM 1 0.9LEARN TEACH AND STUDENT ENG
81 66.6
NULL 831 362.3OFFICE FOR SCHOOLS 4805 4283.2STRATEGY AND COORDINATION
2 0.1
TEACHER QUALITY INSTITUT 12 11.2TERTIARY EDUC AND PERFORM
14 12.3
EDUCATION STRATEGY 179 162.6GOVERNANCE AND ASSURANCE
41 40.5
ORGANISATIONAL INTEGRITY 149 143.6TER EDUC AND CHILCARE REG 49 47.2
Education and Training Directorate Total 6170 5136.6

111
C o m m i s s i o n e r f o r P u b l i c A d m i n i s t r a t i o n
Environment and Sustainable Development Directorate
CITY PLANNING 42 39.4
NULL 38 37.4OFF THE DIRECTOR GENERAL 11 10.9PLANNING DELIVERY 77 70.0POLICY 84 77.4REGULATION AND SERVICES 197 188.2
Environment and Sustainable Development Directorate Total 449 423.2Health Directorate CANB HOSP AND HEALTH
SERV 5713 4985.2
DIRECTOR GENERAL REPORTS 281 258.6POPULATION HEALTH 1 1.0SPECIAL PURPOSE ACC TCH 20 13.4STRATEGY AND CORPORATE 777 718.0SERVICE AND CAPITAL PLAN 5 3.8
Health Directorate Total 6797 5979.9Justice and Community Safety Directorate
ACT GOV SOLICITOR 92 86.9
CIRCLE SENTENCING COURT 1 1.0CORPORATE 62 61.0CORRECTIVE SERVICES 343 320.3DIR PUBLIC PROSECUTIONS 74 69.9ELECTORAL COMMISSION 12 10.5EMERGENCY SERVICES 668 648.0HUMAN RIGHTS COMMISSION 24 22.0LAW COURTS AND TRIBUNALS 165 153.4OFFICE OF CHIEF EXEC 7 6.9OFFICE REGULATORY SERVIC 215 208.1PARLI COUNSEL'S OFFICE 26 23.4PUBLIC ADVOCATE OF ACT 13 11.3PUBLIC TRUSTEE FOR ACT 43 39.7SECURITY EMERGENCY MGT 10 9.1STRATEGIC FINANCE 12 11.6TRANSPORT AND INFRASTRUCT
107 107.0
VICTIM SUPPORT ACT 18 15.0LEGISLATION POL AND PROG 42 39.4
Justice and Community Safety Directorate Total 1934 1844.7

ACT Public Service - State of the Service Report112
C o m m i s s i o n e r f o r P u b l i c A d m i n i s t r a t i o n
Territory and Municipal Services Directorate
BUSINESS ENTERPRISES DIV 204 197.2
DIRECTORATE SERVICES DIV 213 202.4NULL 3 2.8OFF THE DIRECTOR GENERAL 4 3.8PARKS AND CITY SERV DIV 591 557.3ROADS AND PUBLIC TRANSPORT
1036 939.5
Territory and Municipal Services Directorate Total 2051 1903.0 Table 7: Part time employee salaries by length of service and gender (June 2014)
Length of service
Female Male Aggregate Salary (average)
Part ‐ time load (average)
Salary (average)
Part ‐ time load (average)
Salary (average)
Part ‐ time load (average)
Less than 5 years $68,804 0.68 $68,667 0.68 $68,775 0.685 to 9 years $73,256 0.70 $77,213 0.72 $73,729 0.7110 to 19 years $82,086 0.68 $83,869 0.68 $82,256 0.6820 years or more $80,855 0.70 $79,361 0.73 $80,667 0.71Salary (average) $74,442 0.69 $73,686 0.69 $74,328 0.69
Table 8: Gender pay gap in the ACT Public Service, ACT and Australia (June 2014)
Workforce Gender pay gap ACT Public Service 1.7% ACT Labour Force5 9.0% Australian Labour Force6 18.2%
5 Australian Bureau of Statistics, Average Weekly Earnings Australian Capital Territory 6302.0, Australia, 2014 6 Australian Bureau of Statistics, Average Weekly Earnings Australia 6302.0, Australia, 2014

113
C o m m i s s i o n e r f o r P u b l i c A d m i n i s t r a t i o n
Table 9: Gender pay gap by classification group (June 2014)
Classification group Remuneration Proportion female
Gender pay gap
Female earnings (average, per $ male earnings) Average Median
Administrative Officers $65,248 $64,105 75.8% 5.3% $0.95 Ambulance Officers $77,281 $79,990 34.0% 3.1% $0.97 Bus Operators $66,007 $66,286 9.3% ‐0.1% $1.00 Correctional Officers $63,670 $63,245 19.7% 0.1% $1.00 Dentist/Dental Officers $116,647 $121,853 72.2% ‐3.2% $1.03 Disability Officers $49,086 $44,915 50.5% ‐2.6% $1.03 Executives $187,531 $168,138 43.1% ‐3.4% $1.03 Fire Brigade Officers $72,692 $69,563 2.0% 2.7% $0.97 General Service Officers and Equivalent
$49,469 $44,739 21.9% 11.0% $0.89
Health Assistants $51,552 $51,175 87.1% ‐4.8% $1.05 Health Professional Officers $83,987 $83,648 79.6% 2.6% $0.97 Information Technology Officers
$72,655 $74,160 14.5% ‐3.4% $1.03
Legal Officers $109,295 $113,833 63.7% 6.2% $0.94 Legal Support $58,456 $60,056 86.7% 3.1% $0.97 Linen Production and Maintenance
$49,065 $39,770 57.1% 17.3% $0.83
Medical Officers $118,705 $109,118 46.8% 11.7% $0.88 Nursing and Midwifery $76,632 $76,606 88.9% ‐3.6% $1.04 Professional Officers $79,457 $76,625 66.3% 2.8% $0.97 Prosecutors $98,775 $89,302 63.2% 22.8% $0.77 Rangers $60,349 $61,484 25.6% ‐4.3% $1.04 School Leaders $114,702 $106,438 72.5% 2.9% $0.97 Senior Officers $110,124 $100,902 52.2% 1.2% $0.99 Statutory Office Holders $239,647 $270,213 46.2% ‐0.1% $1.00 Teachers $82,618 $92,216 77.4% 1.1% $0.99 Technical Officers $63,847 $62,384 52.2% 16.1% $0.84 Trainees and Apprentices $36,958 $38,009 22.2% ‐14.0% $1.14 Transport Officers $84,090 $85,918 8.2% 0.4% $1.00 ACT Public Service averages $80,137 $76,606 64.8% 1.7% $0.98 *Note: this data excludes Senior Officers, Professional Offices and Administrative Officers in Auditor‐General’s Office and Canberra Institute of Technology.

ACT Public Service - State of the Service Report114
C o m m i s s i o n e r f o r P u b l i c A d m i n i s t r a t i o n
Table 10: Annual leave usage by classification group and gender (2013‐2014)
Classification group Annual leave usage (average, days per person)
Female Male Aggregate Administrative Officers 16.8 16.5 16.7Ambulance Officers 34.7 38.8 37.4Bus Operators 18.0 17.2 17.3Correctional Officers 33.5 29.9 30.6Dentists/Dental Officers 12.3 14.8 12.9Disability Officers 19.4 19.9 19.6Executives 22.0 19.5 20.5Fire and Rescue Officers(Fire Brigade Officers) 33.0 36.7 36.6General Service Officers and Equivalent 17.9 18.3 18.2Health Assistants 14.5 12.7 14.3Health Professional Officers 17.0 18.0 17.2Information Technology Officers 16.9 17.3 17.2Judicial Officers 6.9 7.5 7.2Legal Officers 18.7 17.9 18.4Legal Support 14.0 4.3 12.1Linen Production and Maintenance Officers 19.5 18.7 19.1Medical Officers 16.4 15.6 16.0Nursing and Midwifery 21.9 21.0 21.8Professional Officers 15.6 17.8 16.3Prosecutors 22.7 23.2 22.9Rangers 28.2 21.8 23.3School Leaders 18.9 18.9 18.9Senior Officers 20.2 19.1 19.7Statutory Office Holders 23.0 19.2 20.9Teachers 16.8 18.0 17.1Technical Officers 15.6 20.8 18.2Trainees and Apprentices 11.4 13.3 13.0Transport Officers (incl. Trainer/assessors) 16.9 17.0 16.9ACT Public Service annual leave usage 18.4 19.6 19.5*Note: this data excludes Senior Officers, Professional Offices and Administrative Officers in Auditor‐General’s Office and Canberra Institute of Technology.

115
C o m m i s s i o n e r f o r P u b l i c A d m i n i s t r a t i o n
Table 11: Age and length of service by classification group and gender (June 2014)
Classification Group Female Male Age (average)
Female Male Length of Service (average)
Administrative Officers 42.1 39.2 41.4 7.4 6.8 7.3Ambulance Officers 37.6 41.1 39.9 8.2 9.1 8.8Bus Operators 46.1 48.9 48.7 7.8 10.2 10.0Correctional Officers 43.0 44.2 43.9 7.5 7.1 7.2Dentists/Dental Officers 38.6 41.4 39.4 8.9 5.2 7.9Disability Officers 46.2 45.2 45.7 9.4 8.9 9.1Executives 49.7 50.3 50.0 12.4 11.8 12.1Fire Brigade Officers 39.6 44.2 44.1 11.9 16.5 16.4General Service Officers and Equivalent
45.5 45.5 45.5 10.1 9.2 9.4
Health Assistant 37.2 27.7 36.0 5.9 1.6 5.4Health Professional Officers 39.5 40.4 39.7 7.1 6.8 7.0Information Technology Officers 37.8 36.0 36.2 6.4 5.9 6.0Judicial Officers 57.3 59.9 58.7 9.9 11.7 10.9Legal Officers 35.8 41.6 37.9 6.0 8.1 6.7Legal Support 30.3 24.5 29.5 2.7 1.7 2.6Linen Production and Maintenance
50.8 47.1 49.2 13.3 12.5 13.0
Medical Officers 36.0 39.5 37.9 3.4 4.7 4.1Nursing and Midwifery 42.6 39.8 42.3 8.4 5.8 8.1Professional Officers 42.4 40.0 41.6 6.1 6.1 6.1Prosecutors 31.0 39.2 34.1 3.8 6.3 4.7Rangers 36.5 42.8 41.2 6.5 9.8 8.9School Leaders 46.2 44.5 45.7 15.7 15.7 15.7Senior Officers 44.6 46.9 45.7 10.1 10.4 10.3Statutory Office Holders 58.0 56.7 57.3 7.5 18.9 13.7Teacher 41.5 41.9 41.6 8.9 8.7 8.8Technical Officers 42.9 45.7 44.3 8.7 10.8 9.7Trainees and Apprentices 30.4 24.7 25.9 0.9 1.4 1.3Transport Officers 45.8 52.3 51.7 14.0 16.9 16.6ACT Public Service Averages 42.1 43.2 42.5 8.4 9.0 8.6**Note: Average length of service excludes casuals.

ACT Public Service - State of the Service Report116
C o m m i s s i o n e r f o r P u b l i c A d m i n i s t r a t i o n
Table 12: Diversity by Directorate (June 2014)
Directorate Females Culturally and linguistically Diverse
People with Disability
Aboriginal and Torres Strait Islanders
Chief Minister and Treasury 60.2% 14.3% 5.0% 0.7% Long Service Leave Authority 72.7% 36.4% 0.0% 0.0% Independent Competition and Regulatory Commission
30.0% 0.0% 20.0% 0.0%
Capital Metro Agency 55.6% 11.1% 0.0% 0.0%Commerce and Works Directorate 46.3% 20.2% 2.9% 1.0%Community Services 67.2% 15.9% 3.2% 2.9%Economic Development 52.4% 7.0% 3.1% 0.4% Exhibition Park Corporation 33.3% 0.0% 0.0% 0.0% Gambling and Racing Commission
52.9% 0.0% 0.0% 2.9%
Land Development Agency 50.0% 12.5% 3.8% 2.9%Education and Training 77.5% 10.1% 1.4% 1.0%Environment and Sustainable Development
53.2% 14.3% 2.9% 1.3%
Health 75.6% 24.2% 2.1% 1.0%Justice and Community Safety 42.6% 8.8% 1.2% 1.4%Territory and Municipal Services 25.7% 21.5% 2.3% 1.4%ACT Public Service Total 64.8% 16.8% 2.0% 1.2%

117
Com
mis
sio
ner
for
Public A
dm
inis
trati
on
Table 13
: Headcou
nt by classification grou
p an
d Directorate (Jun
e 20
14)
Classification grou
pCM
TD
CWD
CSD
EDD
ETD
ESDD
HDJACSD
TAMS
CMA
EPIC
G&R
ICRC
LDA
LSLA
TO
TAL
Administrative Officers
116
484
469
881569
187
943
688
363
76
203
337
4983
Ambu
lance Officers
‐ ‐
‐‐
‐‐
‐215
‐‐
‐‐
‐‐
‐ 215
Bus O
perators
‐ ‐
‐‐
‐‐
‐‐
658
‐‐
‐‐
‐‐
658
Correctio
nal O
fficers
‐ ‐
‐‐
‐‐
‐183
‐‐
‐‐
‐‐
‐ 183
Dental
‐ ‐
‐‐
‐‐
18‐
‐‐
‐‐
‐‐
‐ 18
Disability Officers
‐ ‐
282
‐1
‐‐
‐ ‐
‐‐
‐‐
‐‐
283
Executives
29
1925
1415
1022
44
216
11
14
1 213
Fire Brig
ade Officers
‐ ‐
‐‐
‐‐
‐348
‐‐
‐‐
‐‐
348
Equivalent
‐ ‐
38
125
18474
20
487
‐2
‐‐
‐‐
1137
Govt Advisors
‐ ‐
‐‐
‐‐
‐‐
‐‐
‐‐
‐‐
‐ 0
Health Assistant
‐ ‐
‐‐
‐‐
85‐
‐‐
‐‐
‐‐
‐ 85
Health Professiona
l Officers
‐ ‐
319
‐4
‐1045
12
‐‐
‐‐
‐‐
‐ 1380
Inform
ation Techno
logy
Officers
‐ 141
‐‐
291
2‐
‐‐
‐‐
‐‐
‐ 173
Judicial Officer
‐ ‐
‐‐
‐‐
‐15
‐
‐‐
‐‐
‐‐
15
Legal O
fficer
‐ ‐
1‐
‐1
188
‐
‐‐
‐‐
‐‐
91
Legal Sup
port
‐ ‐
‐‐
‐‐
‐15
‐
‐‐
‐‐
‐‐
15
Line
n Prod
uctio
n an
d Mainten
ance
‐ ‐
‐‐
‐‐
‐‐
56‐
‐‐
‐‐
‐ 56
Med
ical Officer
‐ ‐
‐‐
‐‐
857
‐ ‐
‐‐
‐‐
‐‐
857
Nursing
and
Midwife
ry‐
‐‐
‐‐
‐2766
‐ ‐
‐‐
‐‐
‐‐
2766
Profession
al Officers
‐ 20
‐6
3419
166
46‐
‐‐
‐‐
‐ 147
Prosecutors
‐ ‐
‐‐
‐‐
‐38
‐
‐‐
‐‐
‐‐
38
Rangers
‐ ‐
‐4
‐‐
‐‐
39‐
‐‐
‐‐
‐ 43
Scho
ol Leade
rs
‐ ‐
‐770
‐‐
‐ ‐
‐‐
‐‐
‐‐
770
Senior Officers
134
450
224
102
144
188
381
229
214
53
136
673
2163
Statutory Office Holde
rs‐
‐‐
‐1
11
‐‐
‐‐
‐‐
‐ 12
Teache
rs
‐ ‐
‐‐
3479
‐1
‐ ‐
‐‐
‐‐
‐‐
3480
Technical O
fficers
‐ ‐
87
‐24
182
11
96‐
‐‐
‐‐
‐ 328
Traine
es and
App
rentices
‐ 8
‐‐
‐‐
411
22
‐‐
‐‐
‐‐
45
Tran
sport O
fficers
‐ ‐
‐‐
‐‐
‐‐
49‐
‐‐
‐‐
‐ 49
Totals
279
1122
1331
229
6170
449
6797
1934
2051
1812
3410
104
11
20551

ACT Public Service - State of the Service Report118
C o m m i s s i o n e r f o r P u b l i c A d m i n i s t r a t i o n
Table 14: FTE by Directorate and employment mode (June 2014)
Directorate Permanent Temporary Casual Total Chief Minister and Treasury 212.1 56.1 0.7 268.9 Long Service Leave Authority 10.0 1.0 0.0 11.0 Independent Competition and Regulatory Commission
5.0 3.6 0.0 8.6
Capital Metro Agency 12.0 6.0 0.0 18.0Commerce and Works 885.3 212.4 0.7 1098.4Community Services 1016.6 166.6 47.5 1230.6Economic Development 186.5 26.2 4.3 217.0 Exhibition Park Corporation 8.8 2.0 0.1 10.9 Gambling and Racing Commission 25.8 4.8 0.0 30.6 Land Development Agency 88.8 10.8 0.0 99.6Education and Training 4080.5 681.4 374.6 5136.6Environment and Sustainable Development
371.0 50.8 1.4 423.2
Health 4546.2 1222.3 211.4 5979.9Justice and Community Safety 1613.9 220.7 10.2 1844.7Territory and Municipal Services 1620.9 210.4 71.7 1903.0Total 14683.3 2875.1 722.5 18280.9

119
C o m m i s s i o n e r f o r P u b l i c A d m i n i s t r a t i o n
Table 15: Definition of Generation
Table 16: Full Time employee salaries by generation and gender (2014) (Full time employees, average per annum)
Generation Definition Generation Y Born from 1980 and onwards Generation X Born 1965 to 1979 inclusive Baby Boomers Born 1946 to 1964 inclusive Pre‐Baby Boomers Born Prior to 1946
Generation Female Male Average Remuneration
Generation Y $73,215 $71,196 $72,511 Generation X $86,735 $85,359 $86,088 Baby Boomers $88,221 $86,476 $87,451 Pre‐Baby Boomers $84,414 $86,897 $86,005

ACT Public Service - State of the Service Report120
C o m m i s s i o n e r f o r P u b l i c A d m i n i s t r a t i o n
Table 17: Full Time employee salaries by length of services and gender (June 2014) (Full time employee, average per annum)
Table 18: Part‐time employee salaries by generation and gender (June 2014) (average per annum)
Table 19: Separation rate by generation (2013‐14)
Length of Service Female Male Average Less than 5 years $73,922 $75,711 $74,644 5 to 9 years $85,103 $83,457 $83,395 10 to 19 years $90,720 $88,437 $89,791 20 years or more $94,851 $88,787 $91,835
Generation Female Male Average salary
Average part time
loadAverage salary
Average part time
load
Average salary
Average part time
loadGeneration Y $ 70,853 0.67 $ 59,470 0.69 $ 68,986 0.67Generation X $ 77,156 0.69 $ 76,582 0.70 $ 77,086 0.69Baby Boomers $ 72,416 0.72 $ 79,068 0.69 $ 73,602 0.71Pre‐Baby Boomers $ 79,443 0.60 $ 70,191 0.59 $ 76,225 0.59Aggregate $ 74,442 0.69 $ 73,686 0.69 $ 74,328 0.69
Generation Female Male Aggregate Generation Y 7.0% 6.9% 7.1%Generation X 3.9% 4.1% 4.1%Baby Boomers 8.4% 7.3% 8.3%Pre‐Baby Boomers 20.6% 23.1% 25.0%Separation rate 6.3% 5.3% 6.2%

121
C o m m i s s i o n e r f o r P u b l i c A d m i n i s t r a t i o n
Table 20: Separation rate by Directorate (2013‐2014)
Table 21: Separation Rates by Classification Group
Directorate Separation rate Chief Minister and Treasury 9.6% Long Service Leave Authority 22.4% Independent Competition and Regulatory Commission 33.8%
Capital Metro Agency 0.0%Commerce and Works Directorate 4.2%Community Services 8.7%Economic Development 8.8% Exhibition Park in Canberra 19.1% Gambling and Racing Commission 11.5% Land Development Agency 5.5%Education and Training 5.8%Environment and Sustainable Development 6.6%
Health 6.7%Justice and Community Safety 4.8%Territory and Municipal Services 5.5%ACT Public Service Separation rate 6.2%
Classification group Separation rate Average Permanent officer headcount
Administrative Officers 6.1% 3702Ambulance Officers 2.8% 212Bus Operators 4.9% 611Correctional Officers 3.1% 159Dentists/Dental Officers 8.1% 12Disability Officers 6.0% 217Fire Brigade Officers 2.0% 350General Service Officers and Equivalent 5.1% 856Health Assistant 6.3% 48Health Professional Officers 9.8% 1114Information Technology Officers 3.7% 135Judicial Officers 0.0% 12Legal Officers 7.8% 77Legal Support 10.6% 9Linen Production and Maintenance 8.7% 58Medical Officers 4.2% 263Nursing and Midwifery 7.1% 2268Professional Officers 9.0% 111

ACT Public Service - State of the Service Report122
C o m m i s s i o n e r f o r P u b l i c A d m i n i s t r a t i o n
Table 22: Headcount of Generation and Gender (June 2014)
Prosecutors 16.4% 31Rangers 2.9% 35School Leaders 5.1% 739Senior Officers 6.2% 1929Statutory Office Holders 0.0% 3Teacher 6.2% 2479Technical Officers 5.2% 252Trainees and Apprentices 9.7% 10Transport Officers 4.6% 44ACT Public Service Separation Rate and Average Headcount
6.2% 15734
Generation Female Male Total Generation Y 4,084 1,918 6,002 Generation X 4,927 2,781 7,708 Baby Boomers 4,201 2,468 6,669 Pre‐Baby Boomers 95 77 172 Total 13,307 7,244 20,551

123
C o m m i s s i o n e r f o r P u b l i c A d m i n i s t r a t i o n
Table 23: Age and Length of service by directorate and gender (June 2014)
Directorate Female Male Age (Average)
Female Male Length of Service (Average)
Chief Minister and Treasury 40.4 42.9 41.4 7.2 8.2 7.6 Long Service Leave Authority 45.4 50.7 46.8 7.3 12.1 8.6 Independent Competition and Regulatory Commission
42.7 42.4 42.5 4.0 4.0 4.0
Capital Metro Agency 33.9 42.9 37.9 3.2 6.9 4.8Commerce and Works 40.3 41.2 40.8 8.7 8.1 8.4Community Services 42.0 43.6 42.5 7.7 8.1 7.8Economic Development 39.3 43.3 41.2 7.9 8.6 8.2 Exhibition Park in Canberra 46.0 52.5 50.3 1.6 1.9 1.8 Gambling and Racing Commission 37.9 49.1 43.1 4.8 11.1 7.7 Land Development Agency 39.2 45.2 42.2 7.4 9.7 8.5Education and Training 43.5 42.7 43.3 9.5 9.7 9.6Environment and Sustainable Development
40.3 44.4 42.2 8.3 9.4 8.8
Health 41.5 40.7 41.3 7.8 6.5 7.4Justice and Community Safety 40.0 43.7 42.1 7.5 10.8 9.3Territory and Municipal Services 44.3 46.6 46.0 8.6 10.3 9.9ACT Public Service Averages 42.1 43.2 42.5 8.4 9.0 8.6

ACT Public Service - State of the Service Report124
C o m m i s s i o n e r f o r P u b l i c A d m i n i s t r a t i o n
Table 24: Annual Leave usage by Directorate and Gender (FTE days)
*Note: Independent Competition and Regulatory Commission appeared under the Chief Minister and Treasury Directorate structure until April 2013. Results only reflect the period from April to June 2013.
**Note: Capital Metro Agency appeared under the Economic Development Directorate structure up until March 2014.
Directorate Female Male Aggregate (average days per person)
*processing lag time Chief Minister and Treasury 20.2 17.8 19.2 Long Service Leave Authority 16.2 26.5 19.4 Independent Competition and Regulatory Commission
13.0 13.7 13.5
Capital Metro Agency 13.2 8.2 9.7Commerce and Works 18.2 17.7 17.9Community Services 19.3 18.7 19.1Economic Development 20.1 17.3 18.8 Exhibition Park in Canberra 26.6 17.2 21.7 Gambling and Racing Commission 16.8 23.6 20.4 Land Development Agency 18.0 17.4 17.7Education and Training 16.5 17.1 16.6Environment and Sustainable Development 18.8 21.5 20.0Health 19.4 18.1 19.1Justice and Community Safety 20.4 27.8 24.7Territory and Municipal Services 18.9 18.1 18.3ACT Public Service annual leave usage 18.4 19.6 19.5

125
C o m m i s s i o n e r f o r P u b l i c A d m i n i s t r a t i o n
Table 25: Personal Leave Usage and absence rate by classification group (2013‐2014)
Classification group Personal Leave usage (average, days per person)
Female Male Total days Total Absence Rate
Administrative Officers 11.9 11.3 11.8 4.8% Ambulance Officers 13.3 15.7 14.8 6.0% Bus Operators 19.0 13.6 14.1 5.7% Correctional Officers 12.7 12.5 12.6 4.8% Dentists/Dental Officers 9.1 5.9 8.3 4.0% Disability Officers 15.3 13.3 14.3 5.5% Executives 9.2 11.5 10.5 4.1% Fire Brigade Officers 25.6 14.6 14.8 5.7% General Service Officers and Equivalent
11.9 12.8 12.6 5.1%
Health Assistants 15.1 12.1 14.8 6.2% Health Professional Officers 9.5 10.7 9.8 4.2% Information Technology Officers 11.4 10.4 10.6 4.1% Judicial Officers 24.3 7.7 15.3 5.9% Legal Officers 8.1 7.3 7.8 3.2% Legal Support 8.1 9.9 8.4 3.3% Linen Production and Maintenance Officers
23.5 17.6 21.0 8.4%
Medical Officers 4.9 3.7 4.2 1.7% Nursing and Midwifery 13.0 13.7 13.1 5.8% Professional Officers 9.0 8.3 8.8 3.8% Prosecutors 7.4 6.5 7.0 2.8% Rangers 21.3 8.8 11.8 4.7% School Leaders 12.0 10.7 11.7 4.6% Senior Officers 11.8 9.1 10.5 4.1% Statutory Office Holders 6.8 4.5 5.5 2.3% Teachers 9.2 8.6 9.1 3.7% Technical Officers 11.1 11.2 11.2 4.7% Trainees and Apprentices 11.2 7.0 7.7 3.1% Transport Officers 11.9 15.2 14.9 5.8% ACT Public Service Average Personal Leave Usage
11.2 10.9 11.5 4.5%
*Note: this data excludes Senior Officers, Professional Offices and Administrative Officers in Auditor‐General’s Office and Canberra Institute of Technology.

ACT Public Service - State of the Service Report126
C o m m i s s i o n e r f o r P u b l i c A d m i n i s t r a t i o n
Table 26: Personal Leave usage and absence rate by Directorate (2013‐2014)
Directorate Female (Days)
Male (Days)
Total Days Total Absence rate
Chief Minister and Treasury 11.7 8.2 10.3 3.6% Long Service Leave Authority 10.7 15.8 12.3 4.8% Independent Competition and Regulatory Commission
12.0 3.7 6.2 2.5%
Capital Metro Agency 25.4 7.0 15.7 6.5% Commerce and Works Directorate 13.9 10.1 11.9 4.2% Community Services 12.6 10.8 12.1 4.9% Economic Development 9.3 6.8 8.1 3.2% Exhibition Park in Canberra 7.9 3.1 5.4 2.2% Gambling and Racing Commission 16.6 7.6 11.8 4.8% Land Development Agency 11.1 7.7 9.4 3.8% Education and Training 9.4 9.2 9.4 3.9% Environment and Sustainable Development
13.7 11.3 12.6 5.1%
Health 11.6 9.6 11.1 4.7% Justice and Community Safety 12.4 13.1 12.8 5.1% Territory and Municipal Services 14.0 12.9 13.2 5.3% ACT Public Service Average Personal Leave Usage
11.2 10.9 11.5 4.5%

127
C o m m i s s i o n e r f o r P u b l i c A d m i n i s t r a t i o n
Table 27: Diversity by classification group (June 2014)
Classification group Females Culturally and Linguistically Diverse
People with Disability
Aboriginal and Torres Strait
IslandersAdministrative Officers 75.6% 14.4% 2.7% 2.1% Ambulance Officers 34.0% 2.3% 0.5% 0.9% Bus Operators 9.3% 40.1% 0.2% 0.9% Correctional Officers 19.7% 8.7% 1.1% 0.0% Dentists/Dental Officers 72.2% 50.0% 0.0% 5.6% Disability Officers 50.5% 19.4% 3.2% 0.7% Executives 43.2% 6.6% 2.3% 0.9% Fire Brigade Officers 2.0% 1.4% 0.3% 1.1% General Service Officers and Equivalent
21.4% 22.0% 3.5% 1.7%
Health Assistant 87.1% 23.5% 3.5% 1.2% Health Professional Officers 79.6% 16.8% 2.0% 1.2% Information Technology Officer
14.5% 18.5% 1.2% 1.7%
Judicial Officers 46.7% 0.0% 0.0% 0.0% Legal Officers 63.7% 12.1% 0.0% 0.0% Legal Support 86.7% 26.7% 0.0% 0.0% Linen Production and Maintenance
57.1% 5.4% 1.8% 0.0%
Medical Officer 46.8% 31.2% 1.2% 0.1% Nursing and Midwifery 88.9% 26.6% 1.9% 0.7% Professional Officers 67.3% 19.0% 2.0% 0.7% Prosecutors 63.2% 10.5% 0.0% 2.6% Rangers 25.6% 4.7% 2.3% 0.0% School Leaders 72.5% 8.2% 1.8% 0.9% Senior Officers 51.9% 13.6% 2.5% 1.3% Statutory Office Holders 41.7% 0.0% 0.0% 0.0% Teacher 77.4% 9.7% 1.3% 0.8% Technical Officers 53.7% 20.7% 2.4% 0.3% Trainees and Apprentices 22.2% 2.2% 8.9% 8.9% Transport Officers 8.2% 32.7% 0.0% 2.0% ACT Public Service Total 64.8% 16.8% 2.0% 1.2% *Note: This data excludes Professional Officers, Senior Officers and Administrative Officers from Auditor General's and Canberra Institute of Technology.
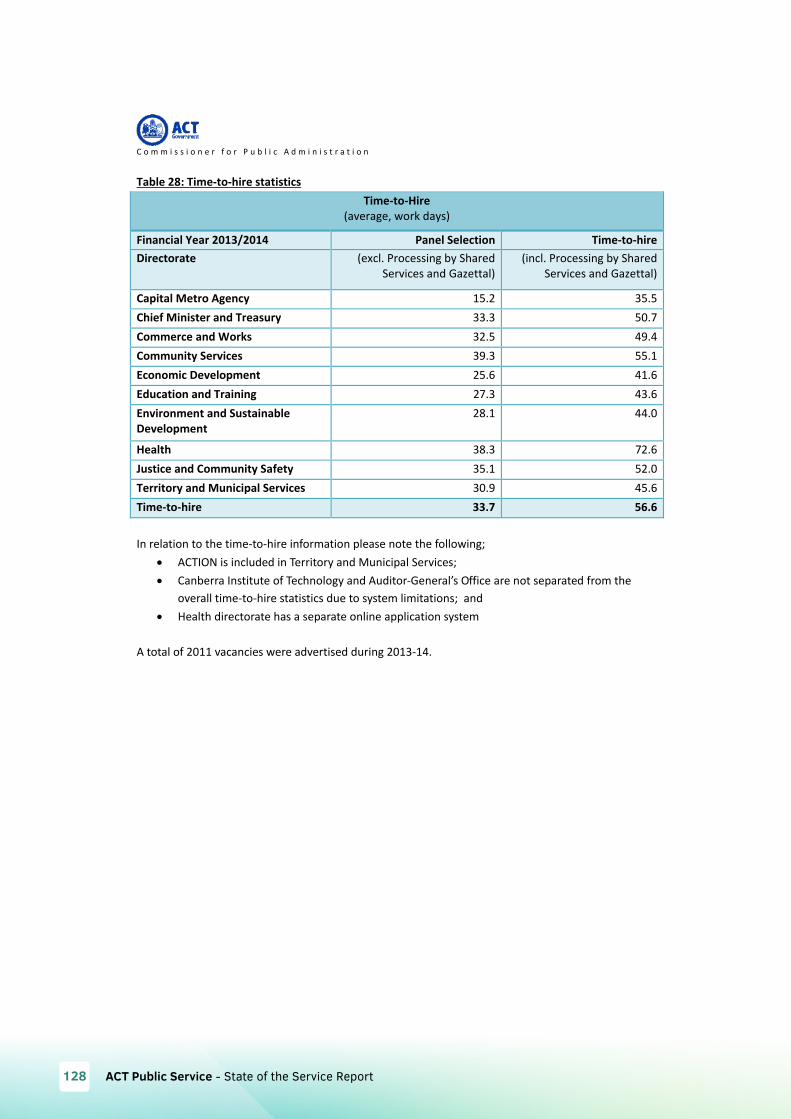
ACT Public Service - State of the Service Report128
C o m m i s s i o n e r f o r P u b l i c A d m i n i s t r a t i o n
Table 28: Time‐to‐hire statistics
Time‐to‐Hire (average, work days)
Financial Year 2013/2014 Panel Selection Time‐to‐hire Directorate (excl. Processing by Shared
Services and Gazettal)(incl. Processing by Shared
Services and Gazettal)
Capital Metro Agency 15.2 35.5Chief Minister and Treasury 33.3 50.7Commerce and Works 32.5 49.4Community Services 39.3 55.1Economic Development 25.6 41.6Education and Training 27.3 43.6Environment and Sustainable Development
28.1 44.0
Health 38.3 72.6Justice and Community Safety 35.1 52.0Territory and Municipal Services 30.9 45.6Time‐to‐hire 33.7 56.6 In relation to the time‐to‐hire information please note the following;
ACTION is included in Territory and Municipal Services; Canberra Institute of Technology and Auditor‐General’s Office are not separated from the
overall time‐to‐hire statistics due to system limitations; and Health directorate has a separate online application system
A total of 2011 vacancies were advertised during 2013‐14.

129
C o m m i s s i o n e r f o r P u b l i c A d m i n i s t r a t i o n
Table 29: Recruitment across the ACT Public Service ‐ Recruitment Action by Financial year
2009‐10 2010‐11 2011‐12 2012‐13 2013‐14 Appt from External
617 713 741 609 480
Total Appt from Temporary Contract
956 1001 1041 1055 1020
Total Promotion from HDA
754 876 845 725 597
Total permanent Transfer/Promotion
1093 1133 1200 1068 1045
Total 3420 3723 3827 3457 3142 *Note: This data is inclusive of Canberra Institute of Technology and Auditor‐General’s Office.
Definition Appointment from External This is any commencement with the ACT Public Service where
the person has commenced directly as a permanent officer. Total Appointment from Temporary Contract
This is the total of temporary contract staff who were appointed as permanent officers.
Total Promotion from Higher Duties Allowance (HDA)
This is the total number of promotions immediately following a period of HDA.
Total Permanent Transfer/Promotion
This is the total number of permanent transfers and promotions (not following higher duties).
*Note: This data has been provided, as committed in the 2012‐13 State of the Service Report.
Table 30: Higher Duties Status and Percent of Workforce by Length (2013‐14 financial year)
Category Less than 3
months 3 to 6 months 6 to 12
months Greater than 12 months
Total
Number of Staff
669 349 307 375 1700
% of Workforce 3.2% 1.7% 1.5% 1.8% 8.1% *Note: This data has been provided, as committed in the 2012‐13 State of the Service Report.
** Note: This data is inclusive of Canberra Institute of Technology and Auditor‐General’s Office.
***Note: Reporting Period: June – 2014.

ACT Public Service - State of the Service Report130
C o m m i s s i o n e r f o r P u b l i c A d m i n i s t r a t i o n
Higher Duties, Percentage of Workforce by Directorate
*Note: Reporting Period: June – 2014

131
C o m m i s s i o n e r f o r P u b l i c A d m i n i s t r a t i o n
Figure 31: Headcount by superannuation scheme (June 2014)7
Notes from Figure 31:
CSSDB – Commonwealth Superannuation Scheme – Defined Benefit
PSSDB – Public Sector Superannuation – Defined Benefit
PSSAP – Public Sector Superannuation – Accumulation Plan
Fund of Choice
7 For information on superannuation schemes, see australia.gov.au. Superannuation data excludes ACTION staff paid through the Aurion payroll system.

ACT Public Service - State of the Service Report132