act national curriculum survey 2009 · act national curriculum survey ... each year we serve...
TRANSCRIPT

ACT National
Curriculum Survey®
2009


ACT National Curriculum Survey®
2009

ACT is an independent, not-for-profit organization that providesassessment, research, information, and program managementservices in the broad areas of education and workforce development.Each year we serve millions of people in high schools, colleges,professional organizations, businesses, and government agencies,nationally and internationally. Though designed to meet a wide array of needs, all ACT programs and services have one guiding purpose—helping people achieve education and workplace success.
© 2009 by ACT, Inc. All rights reserved. The ACT® is a registered trademark of ACT, Inc., in the U.S.A. and other countries. ACT National Curriculum Survey®, EXPLORE®, and PLAN® are registered trademarks of ACT, Inc. College Readiness Standards™
is a trademark of ACT, Inc.
13523

Contents1 Overview . . . . . . . . . . . . . . . . . . . . . . . . . . . . . . . . . . . . . . . . . . . . . . . . 1
2 English/Writing . . . . . . . . . . . . . . . . . . . . . . . . . . . . . . . . . . . . . . . . . . . 8
3 Mathematics . . . . . . . . . . . . . . . . . . . . . . . . . . . . . . . . . . . . . . . . . . . . 14
4 Reading . . . . . . . . . . . . . . . . . . . . . . . . . . . . . . . . . . . . . . . . . . . . . . . 22
5 Science . . . . . . . . . . . . . . . . . . . . . . . . . . . . . . . . . . . . . . . . . . . . . . . . 29
6 Conclusions . . . . . . . . . . . . . . . . . . . . . . . . . . . . . . . . . . . . . . . . . . . . 34
References . . . . . . . . . . . . . . . . . . . . . . . . . . . . . . . . . . . . . . . . . . . . . . . 36
Appendices . . . . . . . . . . . . . . . . . . . . . . . . . . . . . . . . . . . . . . . . . . . . . 37
A: Survey Samples, Types, and Response Rates . . . . . . . . . . . . . . . . 38
B: General Impressions . . . . . . . . . . . . . . . . . . . . . . . . . . . . . . . . . . . . 40
C: Statistical Details for Topics and Skills . . . . . . . . . . . . . . . . . . . . . . . 46
D: Test Specifications for the EPAS® English/Writing, Mathematics, Reading, and Science Tests . . . . . . . . . . . . . . . . . . . 64
E: 21st Century Skills . . . . . . . . . . . . . . . . . . . . . . . . . . . . . . . . . . . . . . 75
F: Content Topics “Taught” Percentages . . . . . . . . . . . . . . . . . . . . . . . 76
G: Strand Rankings for ACT’s College Readiness StandardsTM . . . . . 97
H: Statistical Details for Remedial Topics and Skills . . . . . . . . . . . . . . 99
I: ACT Writing Test Rubric . . . . . . . . . . . . . . . . . . . . . . . . . . . . . . . . . 106


1
1Overview
What Is the ACT National Curriculum Survey®?
The ACT National Curriculum Survey is a one-of-a-kind nationwidesurvey of educational practices and expectations conducted by ACT every 3 to 5 years. ACT surveys thousands of middle school/junior high school, secondary, and postsecondary* teachers inEnglish/writing, reading (including English language arts and socialstudies teachers), mathematics, and science for the purpose ofdetermining what skills and knowledge are currently being taught,and which are considered important for success at each grade levelfor college readiness.
ACT uses the survey results to guide the testdevelopment of ACT’s EXPLORE® (8th and 9thgrade), PLAN® (10th grade), and ACT® (11th and12th grade) tests, which are the key componentsof ACT’s Educational Planning and AssessmentSystem (EPAS®) and the longitudinal assessmentsof ACT’s College Readiness System. ACTconducts the ACT National Curriculum Survey toensure its curriculum-based assessments aremeasuring the current knowledge and skills thatinstructors of entry-level college courses identify asimportant for success in each content area.
Closing the gap between postsecondary expectations and highschool practice has become a priority among national and statepolicymakers. With the passage of the American Recovery andReinvestment Act of 2009 (ARRA), the Council of Chief State SchoolOfficers (CCSSO) and the National Governors Association’s NGACenter for Best Practices joined to coordinate the Common CoreState Standards Initiative, a state-led effort to develop and adopt acommon set of state standards. These standards will be aligned withcollege and work expectations, include rigorous content and skills,and be internationally benchmarked (CCSSO, 2009). The evidenceand research base for these standards will be drawn from the work ofnational educational leaders, including ACT.
Preliminary results of the Common Core State Standards Initiative are consistent with what ACT has long advocated (and longdemonstrated in its own College Readiness StandardsTM): fewer
What is “college readiness”? In thisreport, the phrase is used to refer to thelevel of preparation a student needs tobe ready to enroll and succeed withoutremediation in an entry-level, credit-bearing course at a two-year or four-yearinstitution, trade school, or technicalschool.
* Throughout this report, the term postsecondary instructors refers only to instructors of
credit-bearing college courses; it does not include instructors of remedial college courses.
When the latter are referenced in the report, they are termed “remedial teachers.”

2
but deeper high school standards focusing on what is essential forcollege success. In states that adopt the Common Core StateStandards, this will be a big change in direction: not only will curriculaand instruction become more directed toward college and careerreadiness, but the assessments they choose also need to measurecollege and career readiness. ACT, through the ACT NationalCurriculum Survey and other research, will monitor these effortsclosely and use these results to help inform and ensure that ourassessments meet the needs of college and career readiness.
Because the ACT National Curriculum Survey collects a wealth ofinformation about what entering college students should know and beable to do to be ready for credit-bearing college-level coursework,the results are being shared more broadly, recognizing that thesedata can help educational stakeholders make more informededucational decisions about college readiness standards andalignment of those standards with assessment and curriculum.
This first section is an overview that describes the 2009 survey andhighlights key findings. This section is followed by the findings foreach of four subject areas: English/writing, mathematics, reading, andscience. The last section offers conclusions based on the results.
Survey Participants Included Middle SchoolTeachers Through Postsecondary Instructors, and Remedial Teachers.
For the 2009 ACT National Curriculum Survey, surveys were sent to anationally representative sample of middle school/junior high school,high school, and college teachers who teach courses inEnglish/writing, reading (including English language arts and social
studies), mathematics, and science(including biology, chemistry,physics, and Earth/space science)in public and private institutions allacross the United States. Collegeremedial teachers in English/writing,mathematics, and reading were alsosurveyed. These remedial teacherswere included because they shouldbe uniquely qualified to identify the
critical skills and knowledge that high school graduates are typicallymissing and the set of knowledge and skills that, when emphasized,result in student readiness for success in postsecondary entry-levelcourses. The response rates by content area ranged from 9% to20%, with an overall response rate of 14%. Appendix A providescomplete details of the survey respondent information.
Table 1.1
ACT National Curriculum Surveys Sent in 2009
Grade levelSurveys
sentSurveys returned
Return%
Middle school/junior high 12,250 1,335 11High school teachers 18,750 2,761 15Postsecondary 17,279 2,831 16Remedial 6,783 ,753 11Total 55,062 7,680 14

3
All educators surveyed were asked to perform two primary tasks.First, the educators were asked to rate discrete content knowledgeand skills with respect to how important each is to student success inthe content area. (Specifically, secondary and remedial teachers wereasked to rate the importance of each in a given class they teach;postsecondary instructors were asked to rate the importance of eachas a prerequisite to success in a given class they teach.) Theseresults allow for comparison of secondary school teachers’ views ofthe importance of course outcomes to postsecondary instructors’expectations of what is needed for success in their courses.
Second, the educators were asked to rank groups of content andskills, known as strands, with respect to their relative importance tostudent readiness for college.
In addition, all educators except for postsecondary instructors wereasked to indicate whether they teach that particular knowledge/skillas a standard part of their course, whether they teach it as a review,or whether they do not teach it at all. Educators were also asked toprovide information about a variety of topics, including the number ofyears they have taught the course about which they responded, adescription of their teacher certification, what texts and readingmaterials they use in their courses, the amount of instructional timethey spend on reading strategies, their perceptions of overlap ofcollege and workplace readiness demands, their perceptions ofreduction of academic expectations for students who are not collegebound, and their perceptions of student readiness in reading and incollege-level work in their discipline. The educators also were askedfor information about their state’s assessments, graduationrequirements, and standards. (For a detailed list of responses, seeAppendix B).
Summary of Results
1. ACT’s Educational Planning and Assessment System(EPAS) Tests Measure the Content and Skills EducatorsIdentify as Important for College Readiness.
ACT conducts the National Curriculum Survey as part of its validationprocess every 3 to 5 years to make sure that ACT’s EPAS test specifications are up to date and reflect the knowledge and skillscurrently needed for college readiness. The results of the ACTNational Curriculum Survey affirm that the knowledge and skillscurrently being taught in United States classrooms and that areimportant for readiness and success in college are being adequatelyrepresented in ACT’s EXPLORE, PLAN, and ACT tests. The knowledgeand skills being measured by the tests and the relative emphasisaccorded to each are consistent with those rated as important andnecessary by secondary and postsecondary instructors.

4
Teachers rated the importance of skills and knowledge using a 5-point scale (0 = not important, 1 = low importance, and 4 = highimportance). Survey results support the claim that the knowledge andskills measured by EPAS are considered important by postsecondaryinstructors: all science skills measured were rated above 2.5; allEnglish/writing, mathematics, and reading skills were rated above 3.0.ACT uses importance rating results to guide decisions about theknowledge and skills to be measured on EPAS tests and in whatproportions. When secondary teachers’ and postsecondaryinstructors’ ratings disagree, greater consideration is afforded to thepostsecondary instructors’ ratings to make sure that EPAS testsmeasure knowledge and skills critical to college readiness. If aparticular skill or knowledge currently on the EPAS tests is rated asunimportant, or if an untested skill or knowledge is rated in themoderately important range or beyond, the ACT National CurriculumSurvey results provide the validity evidence to make a correspondingchange in our test specifications. Importance rating results are usedto help guide evaluation of the overall emphases the knowledge andskills receive in each test. Appendix C gives statistical details abouteach knowledge and skill question asked. Appendix D providesdetails about EPAS test development, including EPAS test specifi-cations. Sections 2 through 5 in this document include additionaldiscussion about the validity evidence provided by ACT NationalCurriculum Survey 2009 results with respect to each content area ofthe EPAS tests.
Given the current interest in what are sometimes referred to as “21st century student outcomes”—a combination of specific skills,content knowledge, and expertise that some people believe students need to master in order to succeed in work and life in the 21st century—a special collection of items specifically asking aboutthe importance of such skills was included on all of the surveys. Ofthose skills included, the ones rated most highly by postsecondaryinstructors across the content areas included reading, English andlanguage arts, writing, communication skills, mathematics, science,and critical thinking and problem-solving skills. Appendix E providesdetails about all 26 skills in the collection and their relative ratings.

2. There Are Misalignments BetweenPostsecondary Instructors’Expectations and High SchoolTeachers’ Evaluations of StudentReadiness.
Surveys asked postsecondary instructorsand secondary teachers about how welltheir state standards and state graduationrequirements identify and define whatstudents need to know and to be able todo to be college ready in their contentarea. These educators were also askedhow ready students are for college-levelwork in their content area. The resultsindicate that postsecondary and highschool respondents have dramaticallydifferent perspectives.
■ As Figure 1.1 shows, 71% of highschool teachers reported that theirstate standards defined well or verywell what students need to know to be college ready. Comparatively, only28% of postsecondary instructorsresponded in that way.
■ As shown in Figure 1.2, 71% of highschool teachers felt that their state’sgraduation requirements preparestudents for college well or very wellcompared to 20% of postsecondaryinstructors. Fifty-five percent ofpostsecondary instructors respondedpoorly or very poorly.
■ Figure 1.3 shows that 91% of highschool teachers reported that theirstudents are prepared for college-levelwork in their content area. In contrast,only 26% of postsecondary instructorsreported that their students arriveprepared. (Note: 2009 ACT datacorroborate postsecondary instructors’report of students’ readiness. The ACTProfile Report for the graduating class of2009 shows that only 23% of 2009 highschool graduates who took the ACT testare ready for college-level work inEnglish, writing, reading, mathematics,and science [ACT, 2009a].)
100
90
80
70
60
50
40
30
20
10
0
Perc
ent of re
sp
ond
ents
High School PostsecondaryTeachers Instructors
28
71
Figure 1.1: What Percentage of EducatorsReported That Their State Standards PrepareStudents Well or Very Well for College?
100
90
80
70
60
50
40
30
20
10
0
Perc
ent of re
sp
ond
ents
High School PostsecondaryTeachers Instructors
20
71
Figure 1.2: What Percentage of EducatorsReported That Their State’s GraduationRequirements Prepare Students Well or VeryWell for College?
100
90
80
70
60
50
40
30
20
10
0
Perc
ent of re
sp
ond
ents
High School PostsecondaryTeachers Instructors
26
91
Figure 1.3: What Percentage of EducatorsReported That Their Students Are Prepared forCollege-Level Work in Their Content Area?
5

6
■ Postsecondary instructors and high schoolteachers were also asked how manystudents are prepared to meet expectations for the required level ofreading comprehension in their discipline.Again, the differences in perception arequite significant, as shown in Figure 1.4.
Across content areas, approximately two thirdsof high school teachers reported that more thanhalf of their students are ready to read atappropriate levels for college in the contentarea. Postsecondary instructors, however,clearly disagree, with only about one thirdreporting that most students are ready.
3. What Postsecondary Instructors Expect Entering CollegeStudents to Know Is More Targeted and Specific ThanWhat High School Teachers View as Important.
Postsecondary instructors gave fewer skills the top rating of “highimportance” than did middle school or high school teachers (seeFigure 1.5). Postsecondary instructors also viewed more content andskills as being of low importance. This pattern was consistent acrosscontent areas, though it was most prevalent in science.
This finding that postsecondaryinstructors target fewer skills asbeing of high importance isconsistent with recent policystatements and findings raisingconcerns that some states requiretoo many standards to be taughtand measured, rather thanfocusing on the most importantstate standards for students toattain. The long lists of contenttopics and skills defy teachers’efforts to teach them in detail within the confines of a singleschool year (Finn, Petrilli, & Julian, 2006). It may be that the
extensive demands of state standards force high school teachers totreat all content topics as important, sacrificing depth to breadth.Because the postsecondary survey results indicate that a morerigorous treatment of fundamental content knowledge and skills
55
50
45
40
35
30
25
20
15
10
5
0
0 1 2 3 4
Importance Ratings of Skills (0 = not important, to 4 = high importance)
High School Teachers
Postsecondary Instructors
Pe
rce
nt
of
resp
on
de
nts
Middle School Teachers
11 12118
12
7
14
19
13
26
41
31
43
2626
Figure 1.5: Distribution of Importance Ratings
100
90
80
70
60
50
40
30
20
10
0
English/ Mathematics Reading ScienceWriting
High School Teachers
Postsecondary Instructors
Perc
ent of re
sp
ond
ents
76
2626
61
31
63
25
62
39
Figure 1.4: Percent of High School TeachersVersus Postsecondary Instructors WhoBelieve More Than Half of Their StudentsAre Ready to Do College-Level Reading

7
needed for credit-bearing college courses would better preparestudents for postsecondary school and work, states would likelybenefit from examining their state standards and, where necessary,reducing them to focus only on the knowledge and skills thatresearch shows are essential to college and career readiness andpostsecondary success. States can also look to the results of theCommon Core State Standards Initiative for help focusing theirstandards.
4. High School Teachers and College Instructors Agree ThatCollege Readiness Skills Overlap With Workforce Skills.
Evidence strongly supports the contention that the skills andknowledge needed for college readiness are the same as thoseneeded to enter the workforce in a job paying a living wage (ACT,2006). In the 2009 survey, postsecondary instructors and high schoolteachers across content areas were asked to what degree theknowledge and skills for college and career readiness overlap.Seventy-one percent of responding high school teachers and 78% ofresponding postsecondary instructors replied either “a great deal” or“completely.” Only 1% of responding high school teachers orpostsecondary instructors replied “not at all.”
5. High School Teachers Report That Secondary Instructors Reduce Expectations for Students Who Are Not College Bound.
The following question was posed on high school teachers’ surveysacross the content areas: “To what degree do you believe secondaryinstructors reduce academic expectations for students they perceiveare not college bound?” The results show that 42% of high schoolteachers replied either “a great deal” or “completely.” Only 6%reported that there is no reduction of expectation. This result impliesthat high school students who indicate that they are not going on tocollege may not be held to the same standards as their college-goingpeers. Even more troubling is that this implication, if true, suggeststhat high school teachers may be reducing academic expectationsfor some students despite their strong belief (reported in the previousfinding) that the skills needed for entry into the workforce are just asdemanding as those needed for college.
Content Areas
The following sections discuss in detail the survey findings in thecontent areas of English/writing, mathematics, reading, and science,respectively.

8
2 English/Writing
The English/Writing ACT National CurriculumSurvey
The English/Writing ACT National Curriculum Survey was sent to morethan 10,000 educators in English and writing. The courses theytaught are shown in Table 2.1. (See Appendix A, Tables A.1 and A.2for further details.)
All respondents were asked toperform two primary tasks. First,the educators were asked to ratediscrete content knowledge andskills with respect to how importanteach is to student success inEnglish and writing. (Specifically,secondary and remedial teacherswere asked to rate the importanceof each in a given class theyteach; postsecondary instructorswere asked to rate the importance
of each as a prerequisite to success in a given class they teach.)These results allow for comparison of secondary school teachers’views of the importance of particular knowledge/skills in achievingdesirable course outcomes to postsecondary instructors’expectations of what is needed as a prerequisite for success in theircourse.
Second, educators were asked to rank groups of content and skills,known as strands, with respect to their relative priority in contributingto student success in English and writing.
In addition, all educators except for postsecondary instructors wereasked to indicate whether each skill or content is taught in theircourse. If it is not taught, the teacher was asked to indicate whetherthis was because the skill or content is taught prior to the currentgrade/course or for some other reason. (Further information aboutwhat knowledge and skills are being taught in middle school/juniorhigh school and high school can be found in Appendix F.) Educators
Table 2.1
Courses Taught by Participants in the English/Writing ACT National Curriculum Survey
Grade level Courses
Middle school/junior high school English/Language Arts
High school Writing/Composition
Postsecondary Entry-level courses CompositionFreshman EnglishSurvey of American Literature
Remedial Developmental Writing

9
were also asked to provide information about a variety of topics,including the number of years they have taught the course aboutwhich they responded, a description of their teacher certification,what texts and reading materials they use in their course, the amountof instructional time they spend on reading strategies, theirperceptions of overlap of college and workplace readiness demands,their perceptions of reduction of academic expectations for studentswho are not college bound, and their perceptions of studentreadiness in reading and in college-level work in their discipline. The educators also were asked for information about their state’sassessments, graduation requirements, and standards in English andwriting. (For a detailed list of responses, see Appendix B.)
Results of Importance Ratings
Specific content and skills known to be in the English and writingdomain were identified and described as individual survey items.Related content and skills items were grouped and organized into thecategories referred to here as strands. Each content and skill item, aswell as the strand as a whole, was rated by respondents using a 5-point importance scale where 0 = not important, 1 = low importance,and 4 = high importance. Individualsurvey item means are available inAppendix C. The focus of thediscussion in this section, however, ison broader conceptual issues, andthose are most accurately reflected bythe strand-level means. The strandmeans are reported in Table 2.2 formiddle school/junior high school (MS),high school (HS), postsecondary (PS),and remedial writing (REM) educators.
These strands closely represent content and skills areas in the EPASEnglish Tests. The relatively high values of these strand meansindicate that educators across the grade levels consider the contentand skills covered on the EPAS English Tests to be important.
Table 2.2
English/Writing Mean Importance Ratings by Strand (0 = Not Important; 1 = Low Importance;
4 = High Importance)
Strand MS HS PS REM
Topic and Idea Development 3.70 3.76 3.50 3.79
Organization, Unity, and Coherence 3.69 3.65 3.44 3.72
Word Choice in Terms of Style, Tone,Clarity, and Economy
3.35 3.39 3.10 3.30
Sentence Structure and Formation 3.35 3.34 3.31 3.56
Conventions of Usage 3.30 3.09 3.32 3.40
Conventions of Punctuation 3.35 3.21 3.21 3.42

10
Results of Rank Ordering Strands
In order to determine relativeimportance, the English/writing surveyasked participants to rank order thesix English/writing strands from mostimportant (1st) through least important(6th). (For a detailed list of rankings,see Appendix G.) Results of rankingsare provided in Table 2.3, again byeducator level.
These results reveal that all groupsrank the Topic and Idea Development
and the Organization, Unity, and Coherence strands as mostimportant, followed by Sentence Structure and Formation.Postsecondary and remedial writing instructors assign slightly greater importance to usage and punctuation strands than dosecondary teachers.
Table 2.4 shows how often respondents placed each of thesix strands at the top position when asked to rank them from 1 to 6.This display shows how often each strand is considered the mostimportant, which gives information that examining mean rankingsalone does not give. For example, if a large percentage of peopleconsider a strand extremely important, but an equally largepercentage disagree, averaging the rankings will place the strandsomewhere in the middle. Examining what proportion of people placea strand in the top position, however, reveals what proportionconsider the strand of great importance without the intensity ofdisagreement affecting the data.
These results show that educatorsacross grades rank Topic and IdeaDevelopment and Organization, Unity, and Coherence as the mostimportant strands. Comparativelymore postsecondary instructors and remedial writing teachers thansecondary teachers ranked Sentence Structure and Formation or Conventions of Usage as mostimportant, and though in neithergroup did either strand dislodge
Topic and Idea Development as the choice of a majority of itsmembers, Sentence Structure and Formation did get the second-most first-place votes among remedial writing teachers.
Table 2.3
English/Writing Strand Rankings(1 = Most Important; 6 = Least Important)
Strand MS HS PS REM
Topic and Idea Development 1 1 1 1
Organization, Unity, and Coherence 2 2 2 2
Word Choice in Terms of Style, Tone,Clarity, and Economy
4 4 5 6
Sentence Structure and Formation 3 3 3 3
Conventions of Usage 5 5 4 4
Conventions of Punctuation 6 6 6 5
Table 2.4
English/Writing Strand Ranked “1”(Percentages)
Strand MS HS PS REM
Topic and Idea Development 59 63 55 57
Organization, Unity, and Coherence 23 24 18 14
Word Choice in Terms of Style, Tone,Clarity, and Economy
4 3 2 1
Sentence Structure and Formation 6 5 13 21
Conventions of Usage 4 2 8 6
Conventions of Punctuation 4 3 5 1

Areas of Agreement and Disagreement BetweenHigh School Teachers and PostsecondaryInstructors
There is agreement across grade levels in the ranking of the top threestrands: Topic and Idea Development; followed by Organization,Unity, and Coherence; and then by Sentence Structure andFormation. Survey results also reveal informative differences betweenthe secondary and postsecondary judgments of what is mostimportant for success in English and writing.
More postsecondary instructors (and remedial teachers) rank usageand sentence structure strands as most important than do highschool teachers. The mean strand ratings show that high schoolteachers value the top two strands more highly than they do any ofthe rest of the strands, with a mean difference of 0.26 betweensecond- and third-highest-rated strands. By comparison, there is only a 0.09 mean difference between postsecondary instructors’ratings of their second-highest-rated strand (Organization, Unity, and Coherence) and their third-highest-rated strand (SentenceStructure and Formation), which is only 0.01 higher than their fourth-rated-highest strand (Conventions of Usage). To some degree,then, it appears that high school teachers place a greater importanceon what might broadly be called “content” issues (Topic and IdeaDevelopment; Organization, Unity, and Coherence), while postsecondary instructors see what might broadly be called“correctness” issues (Sentence Structure and Formation andConventions of Usage) as being more closely equal in importancewith the “content” strands.
This inference is further supported through additional analyses of thesurvey data. Seven of the 12 largest differences between high schoolteachers’ and postsecondary instructors’ ratings are found in theConventions of Usage strand, with postsecondary instructors ratingthese seven approximately 40 to 70 spots higher than did high schoolinstructors. Of these, “ensure straightforward subject-verbagreement,” the 6th-highest-rated postsecondary skill, was rated only46th by high school teachers.
11

12
High School Instructional Time Spent on TopicsVersus Postsecondary Rating of Those Topics’Importance
Examination of responses to individual survey questions revealsdiscrepancies in terms of secondary instructional time spent on topicsversus postsecondary rating of those topics’ importance. Of all theskills rated by postsecondary instructors and high school teachers,the one with the largest difference in perceived importance was thatof “writing to analyze literature,” ranked 18th in importance by highschool teachers, but only 87th by postsecondary instructors. Inaddition, this individual skill was the one reported as being the mostcommonly taught individual skill by high school teachers (endorsedby 85% of high school instructors as “taught in the course as part ofstandard course content”). Clearly there appears to be a difference ofopinion about the criticality of writing to analyze literature.
High school response data indicate that some skillsare not taught as part of standard course content.Analysis showed that the majority of these skills(60%, or 11 of 18) concerned usage andpunctuation. While these responses do notnecessarily mean that most students are not being
taught these skills at all (since they may well be taught in priorgrades), the skills appear to be receiving little if any instructional timein high schools. However, these skills are considered important forsuccess at the postsecondary level; postsecondary instructors give14 of the 18 a mean rating of greater than 3 on an importance scale of0 to 4. The mean ratings of the other 4 skills ranged from 2.73 to 2.99.
Remedial Writing Teachers’ Importance Ratingsand Rankings More Closely Agree WithPostsecondary Instructors’ Ratings and Rankings.
A sample of teachers who teach remedial courses in writing at thepostsecondary level participated in the 2009 English/writing survey.These teachers should be in a good position to identify the criticalskills and knowledge that incoming students are typically missing, theacquisition of which results in student readiness for success inpostsecondary writing.
Remedial teachers’ responses more closely resemble postsecondaryinstructors’ responses than high school teachers’ responses. (SeeAppendix H for detailed results of remedial teachers’ responses.)These two postsecondary groups appear to be more concerned withstressing the importance of attending to “correctness” issuesinvolving usage and sentence structure, along with topic and ideadevelopment, than are high school respondents.
The majority of “Not taught as standardcourse content” survey items are from theConventions of Usage and Conventions ofPunctuation strands.

13
Discussion of Survey Results and EPAS English Tests
The EPAS English Tests measure studentachievement and college and career readiness inpunctuation, grammar and usage, sentencestructure, writing strategy, organization, and style.Specific descriptions of the knowledge and skillscurrently measured by EPAS English Tests are listed in Appendix D.Importance ratings for specific content and skills provide empiricalevidence that the knowledge and skills that EPAS English Testsmeasure are considered important for postsecondary success;similarly, content and skills rated by the majority of educators as notimportant are not present on EPAS English Tests or the ACT WritingTest (see Table C.1 in Appendix C for a complete listing ofEnglish/writing content and skills and their ratings). ACT staff willcontinue to use these survey results to continue to develop and refinethe EPAS English Tests.
Discussion of Survey Results and the ACT Writing Test Specifications
Because postsecondary institutions have varying needs with respectto assessing students’ writing for admissions and/or courseplacement purposes, ACT offers the ACT Writing Test as an optionalstandardized measure that postsecondary institutions may require,recommend, or not use. Making this test optional allows students todecide whether to take it in light of the requirements of the institutionsthey are considering attending; this ensures that students are notrequired to pay for and take a test that they do not need.
The ACT Writing Test is a 30-minute essay test. Students are givenone writing prompt that defines an issue and describes two points ofview on that issue. The student produces a direct writing sample thatresponds to the prompt; students may support one of the profferedpositions or develop one of their own. The ACT Writing Test measuresa student’s ability to express judgments, maintain a focus, develop aposition on a topic, organize ideas in a logical way, and use languageclearly and effectively according to the rules of standard writtenEnglish. (For the scoring rubric, see Appendix I.) These skills, alongwith writing to convey information and writing to argue or persuadereaders (both central to the assessment) are all highly endorsed bypostsecondary instructors as prerequisites for success in writing.(See Table C.1 in Appendix C for a listing of writing content and skillsand their importance ratings under the heading “Evaluation ofWriting.”) ACT staff will continue to use these survey results tocontinue to develop and refine the ACT Writing Test.
ACT National Curriculum Survey resultssupport ACT’s EPAS English Tests andACT Writing Test as assessments ofcontent and skills that are crucial forcollege readiness.

3 Mathematics
The Mathematics ACT National Curriculum Survey
The Mathematics ACT National Curriculum Survey was sent to morethan 13,000 mathematics educators. The courses they taught areshown in Table 3.1. (See Appendix A, Tables A.3 and A.4 for furtherdetails.)
All respondents were asked to performtwo primary tasks. First, the educatorswere asked to rate discrete contentknowledge and skills with respect to howimportant each is to student success inmathematics. (Specifically, secondaryand remedial teachers were asked torate the importance of each in a givenclass they teach; postsecondaryinstructors were asked to rate theimportance of each as a prerequisite tosuccess in a given class they teach.)These results allow for comparison ofsecondary school teachers’ views of theimportance of particular knowledge/skillsin achieving desirable course outcomes
to postsecondary instructors’ expectations of what is needed as aprerequisite for success in their course.
Second, educators were asked to rank groups of content and skills,known as strands, with respect to their relative priority in contributingto student success in mathematics.
In addition, all educators except for postsecondary instructors wereasked to indicate whether each skill or content is taught in theircourse. If it is not taught, the teacher was asked to indicate whetherthis was because the skill or content is taught prior to the currentgrade/course or for some other reason. (Further information aboutwhat knowledge and skills are being taught in middle school/juniorhigh school and high school can be found in Appendix F.) Educatorswere also asked to provide information about a variety of topics,including the number of years they have taught the course theyresponded about, a description of their teacher certification, whattexts and reading materials they use in their course, the use of
14
Table 3.1
Courses Taught by Participants in the Mathematics ACT National Curriculum Survey
Grade level Courses
Middle school/junior high school
Mathematics, Pre-Algebra, Algebra,Geometry
High school Mathematics, Algebra, Geometry,Trigonometry, Pre-Calculus, Calculus,Probability and/or Statistics
Postsecondary Entry-level coursesCollege/Finite/Discrete MathProbability/StatisticsAlgebraGeometry/PrecalculusCalculus
Remedial Developmental Math/Remedial Math

15
calculators on tests, the amount of instructional time they spend onreading strategies, their perceptions of overlap of college andworkplace readiness demands, their perceptions of reduction ofacademic expectations for students who are not college bound, andtheir perceptions of student readiness in reading and in college-levelwork in their discipline. The educators also were asked for informationabout their state’s assessments, graduation requirements, andstandards in mathematics. (For a detailed list of responses, seeAppendix B.)
Results of Importance Ratings
Specific knowledge and skills known to be in the mathematicsdomain were identified and described as individual survey items.Related skills and knowledge items were grouped and organized intothe categories referred to here as strands. Each knowledge and skillitem, as well as the strand as a whole,was rated by respondents using a 5-point importance scale where 0 = not important, 1 = low importance,and 4 = high importance. Individualsurvey item means are available inAppendix C. The focus of thediscussion in this section, however, ison broader conceptual issues, andthose are most accurately reflected bythe strand-level means. The strandmeans are reported in Table 3.2 formiddle school/junior high school (MS),high school (HS), postsecondary (PS),and remedial math (REM) educators.
These strands include the specific knowledge and skills that aremeasured by the EPAS Mathematics Tests. Some values appear tobe relatively low (below 2.00), but the ratings—and the inclusion ofthese strands in the EPAS Mathematics Tests—can be accounted forby three main factors. First, some of the low-rated strands representcontent and skills that are age inappropriate for some groups andconsequently are not tested by all levels of EPAS. For example,content and skills from the Functions strand are rated 1.85 by middleschool/junior high school teachers; therefore, these concepts are nottested on the EXPLORE test and only minimally on the PLAN test.Conversely, concepts in the Measurement strand, rated lowest as agroup by postsecondary instructors, are tested more heavily onEXPLORE than on PLAN or the ACT.
Table 3.2
Mathematics Mean Importance Ratings by Strand(0 = Not Important; 1 = Low Importance;
4 = High Importance)
Strand MS HS PS REM
Basic Operations and Applications 3.50 2.98 2.79 3.69
Probability, Statistics, and DataAnalysis
2.97 1.70 1.44 1.84
Numbers: Concepts and Properties 3.32 2.88 2.96 3.25
Expressions, Equations, andInequalities
3.43 3.12 3.02 3.14
Graphical Representations 3.16 3.23 2.99 2.85
Properties of Plane Figures 2.49 2.09 1.78 1.75
Measurement 3.08 2.24 2.00 2.36
Functions 1.85 2.67 2.43 1.74

Second, the strand ratings are affected by the overall makeup of thesample, including the numbers of teachers and the courses that theyteach. For example, a higher proportion of algebra instructorsresponded to the survey than did geometry instructors. Consequently,the Graphical Representations and Properties of Plane Figuresstrand, particularly important to geometry, has a low mean rating inthe table yet is highly rated by geometry teachers (see Appendix G).The Probability, Statistics, and Data Analysis strand received relativelylow ratings across grade levels and courses except for instructorswho teach probability and statistics.
Third, the survey asks how important each content and skill is interms of a specific course taught by respondents; therefore, meanratings are more appropriately interpreted at the course level. For thatreason, the ratings for Mathematics appear by course in Appendix C.
In conclusion, careful analyses of mean ratings, particularly whenconsidered through a course lens, indicate that secondary teachersand postsecondary instructors consider the content and skillscovered on their students’ grade-appropriate EPAS Mathematics Testto be important.
Results of Rank Ordering Strands
In order to determine relative importance, the Mathematics surveyasked participants to rank order the eight Mathematics strands frommost important (1st) through least important (8th). (For a detailed list
of rankings, see Appendix G.) Resultsof rankings are provided in Table 3.3,again by educator level.
The degree of agreement in rankingsvaries. Postsecondary instructors’ andremedial mathematics teachers’importance ratings are most closely inline with each other. The group mostdifferent from the others in terms ofrelative importance ratings is highschool teachers. Some of thesedifferences can be explained by thedifferent courses represented by highschool respondents. For example, highschool teachers’ higher ranking of the
Graphical Representations and the Properties of Plane Figures strandscan be explained at least in part by the greater proportion of geometryteachers in the high school sample. Other high school teacher
16
Table 3.3
Mathematics Strand Rankings (1 = Most Important; 8 = Least Important)
for All Mathematics Instructors
Strand MS HS PS REM
Basic Operations and Applications 2 5 1 1
Probability, Statistics, and DataAnalysis
6 8 8 8
Numbers: Concepts and Properties 3 4 3 2
Expressions, Equations, andInequalities
1 1 2 3
Graphical Representations 4 2 4 4
Properties of Plane Figures 7 6 7 7
Measurement 5 7 6 5
Functions 8 3 5 6

rankings seem to be reflective of high school teachers’ tendency torank advanced topics (e.g., Functions) as more important than masteryof fundamentals (e.g., the Basic Operations and Applications strand).
Table 3.4 shows how oftenrespondents placed each of theeight strands at the top positionwhen asked to rank them from 1to 8. This display shows howoften each strand is consideredthe most important, which givesinformation that examining meanrankings alone does not give.For example, if a largepercentage of people consider astrand extremely important, butan equally large percentagedisagree, averaging the rankingswill place the strand somewherein the middle. Examining whatproportion of people place astrand in the top position, however, reveals what proportion considerthe strand of great importance without the intensity of disagreementaffecting the data.
Because of the specificity of math courses and the content and skillsthat are taught in those courses, the following section will deal specifically with the most commonly taken postsecondarymathematics course, namely College Algebra, and its prerequisitecourses taught at the high school and middle school levels.
This table shows that postsecondary algebra instructors rate theimportance of the fundamental content and skills in the BasicOperations and Applications strand more highly than do high schoolalgebra teachers. A plurality of high school teachers ranked theExpressions, Equations, and Inequalities strand as most important. Of greatest interest here is the relatively high percentage of algebrateachers (26%) who ranked the Functions strand as “1”; in contrast,only 8% of postsecondary algebra instructors ranked that strand asmost important as a prerequisite for success in College Algebra. Thispattern continues across other mathematics topics as well, with highschool teachers ranking strands that contain more advanced contenttopics and skills more highly than do postsecondary instructors ofsimilar courses. Conversely, postsecondary instructors rank thestrands containing fundamental knowledge and skills as “1” moreoften than do their high school counterparts.
17
Table 3.4
Mathematics Strand Ranked “1”(Percentages for MS and Algebra Teachers Only)
Strand MS
HS(Algebra-related courses
only)
PS(College Algebra
only)
Basic Operations and Applications 37 22 56
Probability, Statistics, and DataAnalysis
2 1 0
Numbers: Concepts and Properties 16 6 13
Expressions, Equations, andInequalities
38 39 20
Graphical Representations 3 4 3
Properties of Plane Figures <1 <1 <1
Measurement 3 <1 0
Functions 1 26 8

18
Disagreement Between High School andPostsecondary Instructors About What Is MostImportant in Mathematics
Across the mathematics courses, high school teachers tended to ratemore advanced math topics more highly than did their postsecondarycounterparts. To investigate this trend more rigorously, additionalanalyses were conducted.
Specifically, survey items were grouped by ACT content expertsaccording to whether they describe skills and knowledge at, above,or below what ACT student performance data indicate is the levelessential for college and career readiness, referred to hereafter as“benchmark level.” (See ACT, 2005, What Are ACT’s CollegeReadiness Benchmarks? for further discussion and explanation of thisgrouping system and how it was derived.)
Both high school teachers and postsecondary instructors ratedknowledge and skills at the benchmark level higher in importancethan they rated the more advanced content and skills classified asabove the benchmark level. However, postsecondary instructors’ratings for these two different groupings differed by an average of0.50, whereas high school teachers’ differed only by an average of0.19. This suggests that high school teachers see many contenttopics and skills both at and above the benchmark level as similarlyimportant, while college instructors focus more closely on thebenchmark-level skills.
Even within courses, differences of importance persist in accordancewith this pattern. Within the area of algebra, the rank-ordered list ofcontent and skills that College Algebra teachers say are the mostimportant as prerequisites for their course was compared to the rank-ordered list of what high school Algebra II teachers identify as mostimportant. Of the top 10 skills rated of most importance by CollegeAlgebra teachers, 8 were ranked 26 or more spots lower by highschool teachers (the actual range being from 26 to 81 places lower).See Tables 3.5 and 3.6 for the top 11 (due to ties for 9th place)postsecondary skills and the associated high school ratings followedby the top 10 rated high school content and topics and theassociated postsecondary ratings.

19
Table 3.6
Rank-Ordered List of Mathematical Topics by High School Teacher Importance
Postsecondaryrank
High Schoolrank Content and skills
28 1 Solve quadratic equations
54 2 Evaluate quadratic functions based on function notation
9 3 Apply rules of exponents
20 4 Factor quadratics
45 5 Understand the concept of function
19 6 Add, subtract, and multiply polynomials
46 7 Evaluate linear functions based on function notation
12 8 Use mathematical symbols correctly
65 9 Find solutions to systems of linear equations
59 10 Find domain, range, and inverses of functions
Table 3.5
Rank-Ordered List of Mathematical Topics by Postsecondary Instructor Importance
Postsecondaryrank
High Schoolrank Content and skills
1 27 Perform addition, subtraction, multiplication, and division on signed rational numbers
2 39 Solve routine first-degree equations
3 45 Add and subtract simple algebraic expressions
4 61 Locate points in the coordinate plane
5 47 Solve routine two- or three-step arithmetic problems
5 52 Evaluate algebraic expressions by substituting integers for unknown quantities
5 19 Solve linear equations and inequalities in one variable
8 65 Exhibit knowledge of elementary number concepts (e.g., rounding, decimal ordering, pattern identification, absolute value, primes, andgreatest common factor)
9 16 Recall basic facts, definitions, formulas, and algebraic procedures asneeded to solve a problem
9 3 Apply rules of exponents
9 90 Comprehend the concept of length on the number line
Results reveal that the College Algebra instructors more highly valuefundamental understanding of mathematical concepts as prerequisitesfor success for their courses. High school Algebra II teachers rated moreadvanced topics as most important.
20
Remedial Math Teachers’ Responses Agree WithPostsecondary Instructors’: Fundamentals Are MoreImportant Than Advanced Math Content Topics.
A sample of teachers who teach remedial courses in mathematics atthe postsecondary level participated in the 2009 Mathematics survey.These teachers should be in a good position to identify the criticalskills and knowledge that incoming students are typically missing, theacquisition of which results in student readiness for success inpostsecondary mathematics.
Results reveal that remedial mathematics teachers’ ratings werecloser to postsecondary mathematics instructors’ ratings than to highschool mathematics teachers’ ratings. (See Appendix H for detailedresults of remedial teachers’ responses.) Remedial teachers andpostsecondary instructors considered rigorous understanding offundamental mathematics more important than exposure to moreesoteric mathematics content topics for success in their courses.
It should be pointed out here, though, that remedial mathematicsteachers may very well be preparing their students to take either acredit-bearing mathematics course (such as College Algebra), orperhaps another remedial course that might be needed before thestudent would be prepared to enter a credit-bearing course.Therefore, the remedial mathematics teachers’ ratings and rankingsshould be interpreted with great care.
Discussion of Survey Results and EPASMathematics Test Specifications
The EPAS Mathematics Tests measure student achievement andcollege readiness in Basic Operations and Applications; Probability,Statistics, and Data Analysis; Numbers: Concepts and Properties;Expressions, Equations, and Inequalities; Graphical Representations;Properties of Plane Figures; Measurement; and (for the ACT only)Functions. (For EPAS Mathematics Test specifications, seeAppendix D.)
ACT National Curriculum Survey results providesolid validity evidence that EPAS MathematicsTests measure important skills and knowledge atthe appropriate levels that are necessary forsuccess. Importance ratings for specific contentand skills provide empirical evidence that the
content and skills that EPAS Mathematics Tests measure areconsidered important for postsecondary success; similarly, contentand skills rated by the majority of educators as not important are notpresent on EPAS Mathematics Tests (see Tables C.2a to C.2c inAppendix C for a complete listing of mathematics content and skillsand their ratings).
ACT National Curriculum Survey resultssupport ACT’s Mathematics Tests asassessments of important content andskills that are crucial for college readiness.

21
The Probability and Statistics strand received the lowest importanceratings from aggregate groups of high school teachers and postsecondary instructors. ACT will continue to cover Probability and Statistics on EPAS Mathematics exams because postsecondaryinstructors teaching probability and statistics courses rate thesecontent topics and skills as important, and analysis across math andscience courses affirms that postsecondary instructors consider thisgroup of knowledge and skills to be important for success in postsecondary mathematics. However, the majority of the EPASMathematics Tests is devoted to measuring other mathematicalknowledge and skills.
ACT staff will continue to use these survey results to continue todevelop and refine the EPAS Mathematics Tests.
Discussion of Survey Results and ACT Calculator Policy
ACT’s calculator policy is well supported by the survey results fromhigh school and postsecondary instructors (see Table B.11 inAppendix B). The vast majority of high school teachers, postsecondary instructors, and remedial mathematics teachers report that calculators are allowed to be used on their exams. EPASMathematics Tests are developed so that a student does not need touse a calculator on the exam in order to finish in the allotted time.However, approved calculators are allowed on EPAS MathematicsTests and are recommended for use on the ACT.
Survey results for middle school/junior high school teachers indicatedthat 38% of the teachers allowed calculators on their tests, 33% didnot allow calculators to be used on tests, and 30% reported allowingcalculators only for parts of tests (see Table B.11 in Appendix B). Inlight of these findings, ACT will maintain the current policy of allowingcalculators on all parts of the EXPLORE Mathematics Test becausecalculators are typically allowed on middle school/junior high schoolmathematics tests. However, if future Mathematics ACT NationalCurriculum Survey results show that calculators typically areprohibited from use on exams, the ACT calculator policy will bereconsidered at that time.

22
4Reading
The Reading ACT National Curriculum Survey
The Reading ACT National Curriculum Survey was sent to more than11,000 language arts and social studies educators. The courses theytaught are shown in Table 4.1. (See Appendix A, Tables A.5 and A.6for further details.)
All respondents were asked to performtwo primary tasks. First, the educatorswere asked to rate discrete contentknowledge and skills with respect to howimportant each is to student success inreading. (Specifically, secondary andremedial teachers were asked to rate theimportance of each in a given class theyteach; postsecondary instructors wereasked to rate the importance of each asa prerequisite to success in a given classthey teach.) These results allow forcomparison of secondary schoolteachers’ views of the importance of
particular content and skills in achieving desirable course outcomesto postsecondary instructors’ expectations of what is needed as aprerequisite for success in their course.
Second, educators were asked to rank groups of content and skills,known as strands, with respect to their relative priority in contributingto importance for student success in reading.
In addition, all educators except for postsecondary instructors wereasked to indicate whether each skill or content is taught in theircourse. If it is not taught, the teacher was to indicate whether this wasbecause the skill or content is taught prior to the currentgrade/course, or for some other reason. (Further information aboutwhat knowledge and skills are being taught in middle school/juniorhigh school and high school can be found in Appendix F.) Educatorswere also asked to provide information about a variety of topics,
Table 4.1
Courses Taught by Participants in theReading ACT National Curriculum Survey
Grade level Courses
Middle school/junior high school
Language Arts
High school Language ArtsHistory/Civics
Postsecondary Entry-level coursesCompositionFreshman EnglishSurvey of American Literature
Remedial Developmental Reading

23
including the number of years they have taught the course aboutwhich they responded, a description of their teacher certification,what texts and reading materials they use in their course, the amountof instructional time they spend on reading strategies, theirperceptions of overlap of college and workplace readiness demands,their perceptions of reduction of academic expectations for studentswho are not college bound, and their perceptions of studentreadiness in reading and in college-level work in their discipline. The educators also were asked for information about their state’sassessments, graduation requirements, and standards in reading.(For a detailed list of responses, see Appendix B.)
Results of Importance Ratings
Specific content and skills known to be in the reading domain wereidentified and described as individual survey items. Related skills andcontent items were grouped and organized into the categoriesreferred to here as strands. Each content and skill item, as well as thestrand as a whole, was rated by respondents using a 5-pointimportance scale where 0 = not important, 1 = low importance, and 4 = high importance. Individual surveyitem means are available in AppendixC. The focus of the discussion in thissection, however, is on broaderconceptual issues, and those are mostaccurately reflected by the strand-level means. The strand mean ratingsare reported in Table 4.2 for middleschool/junior high school (MS), highschool (HS), postsecondary (PS), andremedial writing (REM) educators.
These strands include the specific content and skills measured bythe EPAS Reading Tests. Therefore, these results show that surveyparticipants rate the knowledge and skills covered on the EPASReading Tests as important.
Table 4.2
Reading Mean Importance Ratings by Strand (0 = Not Important; 1 = Low Importance;
4 = High Importance)
Strand MS HS PS REM
Main Ideas and Author’s Approach 3.82 3.64 3.72 3.90Generalizations and Conclusions 3.58 3.50 3.37 3.80Supporting Details 3.70 3.46 3.44 3.63Relationships 3.60 3.44 3.32 3.82Meanings of Words 3.76 3.57 3.41 3.71
24
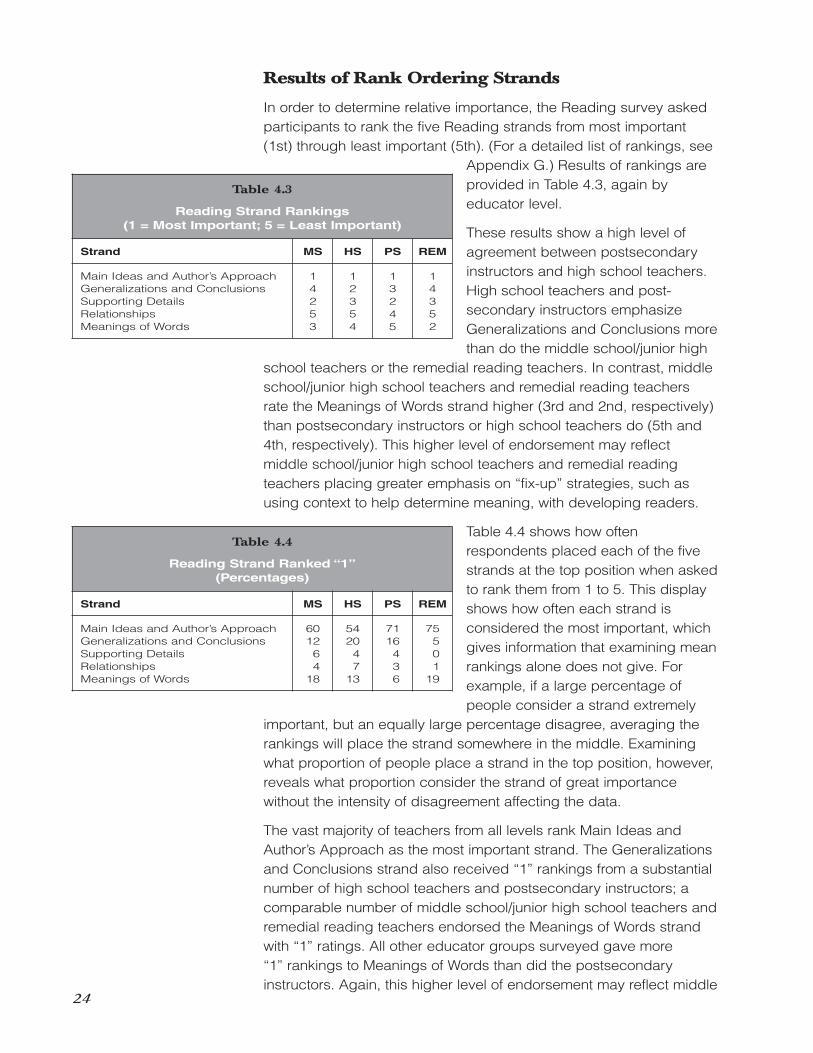
Results of Rank Ordering Strands
In order to determine relative importance, the Reading survey askedparticipants to rank the five Reading strands from most important(1st) through least important (5th). (For a detailed list of rankings, see
Appendix G.) Results of rankings areprovided in Table 4.3, again byeducator level.
These results show a high level ofagreement between postsecondaryinstructors and high school teachers.High school teachers and post-secondary instructors emphasizeGeneralizations and Conclusions morethan do the middle school/junior high
school teachers or the remedial reading teachers. In contrast, middleschool/junior high school teachers and remedial reading teachersrate the Meanings of Words strand higher (3rd and 2nd, respectively)than postsecondary instructors or high school teachers do (5th and4th, respectively). This higher level of endorsement may reflectmiddle school/junior high school teachers and remedial readingteachers placing greater emphasis on “fix-up” strategies, such asusing context to help determine meaning, with developing readers.
Table 4.4 shows how oftenrespondents placed each of the fivestrands at the top position when askedto rank them from 1 to 5. This displayshows how often each strand isconsidered the most important, whichgives information that examining meanrankings alone does not give. Forexample, if a large percentage ofpeople consider a strand extremely
important, but an equally large percentage disagree, averaging therankings will place the strand somewhere in the middle. Examiningwhat proportion of people place a strand in the top position, however,reveals what proportion consider the strand of great importancewithout the intensity of disagreement affecting the data.
The vast majority of teachers from all levels rank Main Ideas andAuthor’s Approach as the most important strand. The Generalizationsand Conclusions strand also received “1” rankings from a substantialnumber of high school teachers and postsecondary instructors; acomparable number of middle school/junior high school teachers andremedial reading teachers endorsed the Meanings of Words strandwith “1” ratings. All other educator groups surveyed gave more “1” rankings to Meanings of Words than did the postsecondaryinstructors. Again, this higher level of endorsement may reflect middle
Table 4.3
Reading Strand Rankings (1 = Most Important; 5 = Least Important)
Strand MS HS PS REM
Main Ideas and Author’s Approach 1 1 1 1Generalizations and Conclusions 4 2 3 4Supporting Details 2 3 2 3Relationships 5 5 4 5Meanings of Words 3 4 5 2
Table 4.4
Reading Strand Ranked “1”(Percentages)
Strand MS HS PS REM
Main Ideas and Author’s Approach 60 54 71 75Generalizations and Conclusions 12 20 16 5Supporting Details 6 4 4 0Relationships 4 7 3 1Meanings of Words 18 13 6 19

25
school/junior high school teachers and remedial reading teachersplacing greater emphasis on “fix-up” strategies with developingreaders, such as using context to help determine meaning.
Remedial Reading Teachers’ Responses Align WithOthers and Give Particular Stress to DeterminingMeaning From Context.
A sample of teachers who teach remedial courses in reading at thepostsecondary level participated in the 2009 Reading Survey. (SeeAppendix H for detailed results of remedial teachers’ responses.)These teachers should be in a good position to identify the criticalcontent and skills that incoming students are typically missing, theacquisition of which results in student readiness for success inpostsecondary reading.
Remedial reading teachers’ results reveal agreement with high schoolteachers and postsecondary instructors with respect to ranking theMain Ideas and Author’s Approach strand as most important.Remedial reading teachers’ responses differed from high schoolteachers’ and postsecondary instructors’ responses by ranking thecontent and skills in the Meanings of Words as being of relativelyhigher importance.
High School Teachers and PostsecondaryInstructors Agree About Importance, DisagreeAbout Student Reading Readiness.
High school teachers’ and postsecondary instructors’ importanceratings as well as ranking results show a high level of agreementabout content and skills that are important for reading achievement.However, a startling disagreement exists in these two groups’perceptions about whether incoming first-year students meetexpectations for reading comprehension in the disciplines.
High school teachers across all of the content areas (includingEnglish/writing, mathematics, reading, and science) were asked,“When they leave your course, how many students meet the requiredlevel of reading comprehension for students beginning entry-levelcollege courses in your discipline?” Across content areas, about two thirds of high school teachers reported that more than half of their students were ready to read college-level material in theircontent area. (See Appendix B for data.)
Postsecondary instructors across content areas were asked, “Howmany students entering your course meet your expectations for thereading comprehension of incoming students in your discipline?”Across content areas, approximately one third of postsecondaryinstructors responded that most students arrive ready to read in theircontent area. (See Appendix B for data.)

26
Evidence Indicates Students Are Not Reading atLevels Sufficient for College and Career Readinessin Content Areas.
There are many indicators that students are not reaching adequatelevels of reading achievement.
■ As previously stated, postsecondary instructors across contentareas report that the majority of students entering their courses doNOT meet expectations for reading comprehension of incomingstudents in the discipline (see Appendix B).
■ Only slightly more than half (53%) of the members of the 2009high school graduating class were ready for college-level andworkplace training–level reading (ACT, 2009a). The figures areworse for African American/black students (29%) and Hispanicstudents (35%).
■ In 2008–09, only 63% of eighth-grade students who tookEXPLORE scored at a level that indicates they are on track forcollege and workplace readiness in reading (ACT, 2009b).
Yet evidence clearly supports that reading achievement is critical forstudent success.
■ Low literacy levels often prevent students from mastering othersubjects (Alliance for Excellent Education, 2002).
■ Poor readers struggle to learn in text-heavy courses and arefrequently blocked from taking academically more challengingcourses (Au, 2000).
■ More than 7,000 students drop out of high school every schoolday (Alliance for Excellent Education, 2009), and one of the mostcommonly cited reasons for the dropout rate is that students donot have the literacy skills to keep up with the curriculum (Kamil,2003; Snow & Biancarosa, 2003).
■ The level of academic achievement that students attain by eighthgrade has a larger impact on their college and career readinessby the time they graduate from high school than anything thathappens academically in high school (ACT, 2008). Students whodo not meet reading-readiness indicators showing that they areon track for success by eighth grade do not benefit from highschool instruction as much as students who do reach thoseindicators.

27
Little Instructional Time Is Devoted to ReadingStrategies in Mathematics and Science Courses,Especially at the Postsecondary Level.
Reading achievement is a critical component for college and careerreadiness across content areas. The ACT National Curriculum Surveyasked all respondents to report on how much time they spendteaching their students strategies on how to read the materials in theircourses. High school English/writing, language arts, and socialstudies teachers most commonly reported spending “a moderateamount” of time. Both mathematics and science high school teachersmost commonly reported that only “a little” time was devoted toreading in their content areas (see Table B.13 in Appendix B for all responses). Meanwhile, at the postsecondary level, 78% ofmathematics instructors and 80% of science instructors reportedspending no time, or only a little time, on teaching strategies forhow to read materials for the course on which they reported (see Table B.13 in Appendix B for postsecondary responses).If students are not ready to read content area materials at the college- and career-readiness level by the end of high school, theyclearly should not count on receiving instruction about strategies intheir postsecondary courses. This finding further emphasizes theimportance of staying accurately informed about students’ readingabilities across the content areas so that appropriate interventionsand support can be provided to students in a timely manner.
Discussion of Survey Results and EPAS ReadingTest Specifications
The EPAS Reading Tests measure student achievement and collegereadiness in referring to and reasoning from reading passages drawnfrom four content areas: Prose Fiction, Humanities, Social Sciences,and (for the ACT only) Natural Science. (For the EPAS Reading Testspecifications, see Appendix D.) These content areas are equallyrepresented in the EPAS Reading Tests since theyinclude the content area reading that studentstypically encounter in their coursework. EPASReading Tests include passages of varying levelsof complexity so that inferences can be madeabout students’ abilities to comprehend differentcomplexities of text.
ACT National Curriculum Survey resultssupport ACT’s Reading Tests asassessments of important and variedreading skills that are crucial for collegereadiness.

28
ACT National Curriculum Survey results provide solid validityevidence that the EPAS Reading Tests measure important skills andknowledge necessary for success and at the appropriate levels.Importance ratings for specific content and skills (see Table C.3 inAppendix C for a complete listing of reading content and skills andtheir ratings) provide empirical evidence that the referring andreasoning skills that EPAS Reading Tests measure are consideredimportant for postsecondary success. Similarly, content and skillsrated by the majority of educators as not important are not includedon EPAS Reading Tests.
ACT staff will continue to use these survey results when making testdevelopment decisions about the specific knowledge and skillsincluded on the EPAS Reading Tests.

29
5 Science
The Science ACT National Curriculum Survey
The Science ACT National Curriculum Survey was sent to more than19,000 science educators. The courses they taught are shown inTable 5.1. (See Appendix A, Tables A.7 and A.8 for further details.)
All respondents were asked to perform two primary tasks. First, theeducators were asked to rate discrete content knowledge and skillswith respect to how important each is to student success in science.(Specifically, secondary and remedial teachers were asked to rate theimportance of each in a given class they teach; postsecondaryinstructors were asked to rate theimportance of each as a prerequisite tosuccess in a given class they teach).These results allow for comparison ofsecondary school teachers’ views of theimportance of particular knowledge/skills in achieving desirable course outcomes to postsecondary instructors’ expectationsof what is needed as a prerequisite forsuccess in their course. ACT sent biology,chemistry, physics, and Earth/spacescience surveys to biology, chemistry,physics, and Earth/space scienceteachers, respectively, so that educatorswere only giving feedback about coursesthat were within their own specialty.
Second, educators were asked to rankgroups of content and skills, known asstrands, with respect to their relative priorityin contributing to student success inscience.
In addition, all educators except for postsecondary instructors wereasked to indicate whether each skill or content is taught in theircourse. If it is not taught, the teacher was asked to indicate whetherthis was because the skill or content is taught prior to the currentgrade/course or for some other reason. Further information aboutwhat knowledge and skills are being taught in middle school/juniorhigh school and high school can be found in Appendix F. Educatorswere also asked to provide information about a variety of topics,
Table 5.1
Courses Taught by Participants in the Science ACT National Curriculum Survey
Grade level and science content area Courses
Middle school/junior high school
Science, Physical Science
High school Biology Biology
High school Chemistry Chemistry
High school Earth Science Earth Science
High school Physics Physics
Postsecondary Biology Introduction to Biology/Life Science
Postsecondary Chemistry Introduction to Chemistry/General Chemistry/etc.
Postsecondary Earth/Space Science
Geology/Earth Sciences/etc.
Postsecondary Physics Introduction to Astronomy,Introduction to Physics/
General Physics/etc.
30
including the number of years they have taught the course aboutwhich they responded, a description of their teacher certification,what texts and reading materials they use in their course, the amount of instructional time they spend on reading strategies, theirperceptions of overlap of college and workplace readiness demands,their perceptions of reduction of academic expectations for studentswho are not college bound, and their perceptions of studentreadiness in reading and in college-level work in their discipline. The educators also were asked for information about their state’sassessments, graduation requirements, and standards in science.(For a detailed list of responses, see Appendix B.)
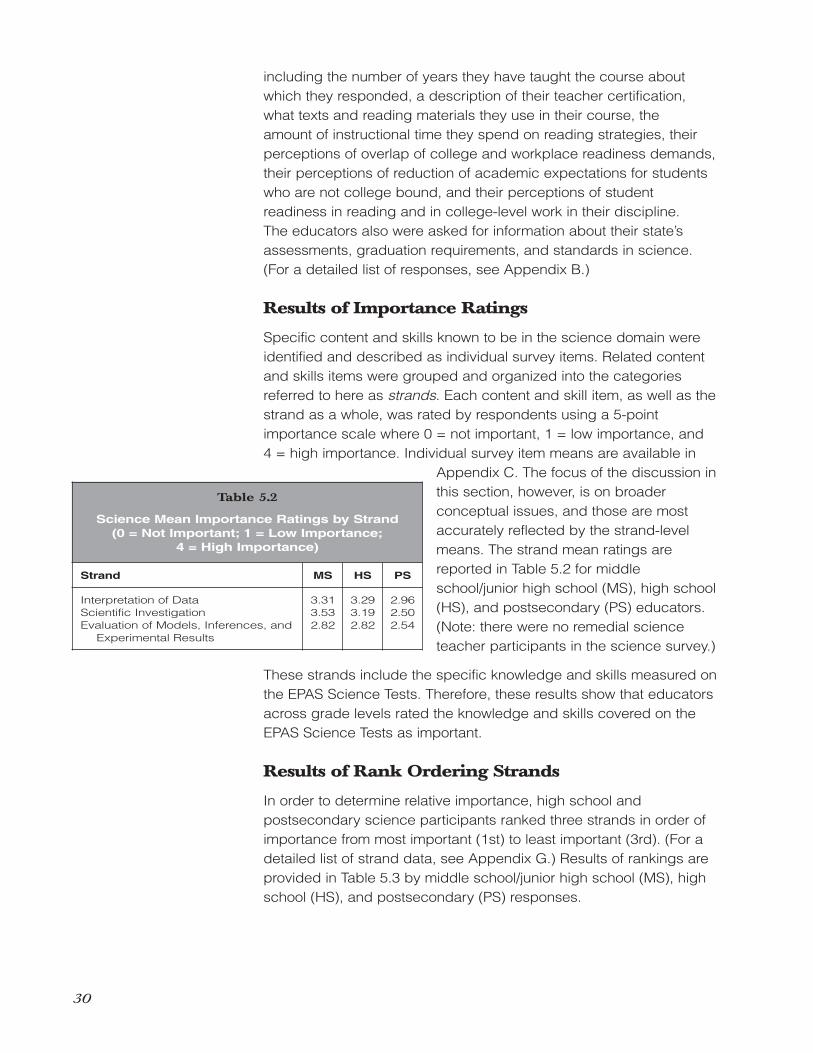
Results of Importance Ratings
Specific content and skills known to be in the science domain wereidentified and described as individual survey items. Related contentand skills items were grouped and organized into the categoriesreferred to here as strands. Each content and skill item, as well as thestrand as a whole, was rated by respondents using a 5-pointimportance scale where 0 = not important, 1 = low importance, and 4 = high importance. Individual survey item means are available in
Appendix C. The focus of the discussion inthis section, however, is on broaderconceptual issues, and those are mostaccurately reflected by the strand-levelmeans. The strand mean ratings arereported in Table 5.2 for middleschool/junior high school (MS), high school(HS), and postsecondary (PS) educators.(Note: there were no remedial scienceteacher participants in the science survey.)
These strands include the specific knowledge and skills measured onthe EPAS Science Tests. Therefore, these results show that educatorsacross grade levels rated the knowledge and skills covered on theEPAS Science Tests as important.
Results of Rank Ordering Strands
In order to determine relative importance, high school and postsecondary science participants ranked three strands in order ofimportance from most important (1st) to least important (3rd). (For adetailed list of strand data, see Appendix G.) Results of rankings areprovided in Table 5.3 by middle school/junior high school (MS), highschool (HS), and postsecondary (PS) responses.
Table 5.2
Science Mean Importance Ratings by Strand(0 = Not Important; 1 = Low Importance;
4 = High Importance)
Strand MS HS PS
Interpretation of Data 3.31 3.29 2.96Scientific Investigation 3.53 3.19 2.50Evaluation of Models, Inferences, and
Experimental Results2.82 2.82 2.54

31
Middle school teachers’ strongendorsement of the Science Investigationstrand aligns well with typical sciencecurricular progression. At the middleschool/junior high school level, teachersare working primarily with developingstudent understanding of how to posescientific questions and how to conductscientific investigations properly.Alternatively, high school teachers and postsecondary instructorsranked the Interpretation of Data strand as most important, whichagain aligns well with the laboratory experiences typically occurringat those levels, where less emphasis is placed on learning how to setup an investigation and more emphasis is placed on data collectionand interpretation.
Table 5.4 shows how often respondents placed each of the threestrands at the top position when asked to rank them from 1 to 3.This display shows how often each strand is considered the mostimportant, which gives information that examining mean rankingsalone does not give. For example, if a large percentage of peopleconsider a strand extremely important, butan equally large percentage disagree,averaging the rankings will place thestrand somewhere in the middle.Examining what proportion of people placea strand in the top position, however,reveals what proportion consider the strandof great importance without the intensity ofdisagreement affecting the data.
With only three strands, these results are of limited help in identifying points of alignment or difference among secondary and postsecondary educators. The Scientific Investigation strand clearlyreceived the most “1” rankings from middle school/junior high schoolteachers. As previously stated, this makes sense given the nature ofscience curriculum at that level. Postsecondary instructors mosthighly endorse the Interpretation of Data strand, whereas high schoolteachers appear to be split between Interpretation of Data andScience Investigation in a way that postsecondary instructors are not.
Table 5.3
Science Strand Rankings (1 = Most Important; 3 = Least Important)
Strand MS HS PS
Interpretation of Data 2 1 1Scientific Investigation 1 2 2Evaluation of Models, Inferences, and
Experimental Results3 3 3
Table 5.4
Science Strand Ranked “1”(Percentages)
Strand MS HS PS
Interpretation of Data 18 41 54Scientific Investigation 72 45 25Evaluation of Models, Inferences, and
Experimental Results10 14 20

32
Postsecondary Instructors and MiddleSchool/Junior High School Teachers ConsistentlyRate Science Content Much Lower in ImportanceThan Do Their High School Counterparts.
Close analysis of importance ratings shows an interesting patternamong middle school/junior high school teachers, high schoolteachers, and postsecondary science instructors. Of the top
21 survey items (there was a tie for 20th place)rated most highly by postsecondary scienceinstructors, 10 were process skills, 10 werefundamental science content topics, and only 1was an “advanced” science topic (understandingand applying the mole concept). For middleschool/junior high school teachers, 19 of the top-rated survey items were process skills, and 1 was a fundamental science content topic. For
high school instructors, all 20 of the skills were content topics, severalof them advanced. In fact, of the top 50 highest-rated survey itemsfor high school teachers, only 2 were process skills.
The results for middle school/junior high school teachers’ responsesmake sense in light of the fact that science curricula at that level tendto focus on teaching fundamental science content while engagingstudents in introductory science inquiry experiences. Through thisemphasis on science inquiry processes and skills, science studentsdevelop a more coherent understanding of how to collect and usedata to support and refute inferences and also learn how science isdifferent from other disciplines.
Postsecondary science instructors’ rating of process skills as moreimportant than advanced science content topics, and high schoolteachers’ rating in the opposite way, are responses consistent withpast ACT National Curriculum Survey results. These results indicate a substantive difference between high school science teachers’perceptions of what is most important and postsecondary scienceinstructors’ estimates of what content and skills incoming studentsalready must have to succeed in science at the college/universitylevel.
No Remedial Courses Identified for Science
We were not able to identify remedial science courses that studentstypically took to prepare them for postsecondary work, so no remedialcourse teachers’ responses are available for comparison.
Both middle school/junior high schoolteachers and postsecondary scienceinstructors rate process/inquiry skills asmore important than advanced sciencecontent topics; high school teachers ratethem in exactly the opposite order.
33
Discussion of Survey Results and EPAS Science TestSpecifications
The EPAS Science Tests measure student achievement and collegereadiness in the skills needed for the natural sciences, including interpretation of data; scientific investigation; and evaluation ofmodels, inferences, and experimental results. Somequestions are posed about fundamental sciencecontent in life science (EXPLORE only), physicalscience (EXPLORE only), Earth/space science, and(PLAN and the ACT only) biology, chemistry, andphysics. Some fundamental science content ismeasured on the EPAS Science Tests, but scienceinquiry and process skills receive the greatest emphasis. Knowledgeand process skills such as how to accurately interpret data, how tomake appropriate experimental design decisions, how to reach theappropriate conclusions when presented with results of experiments,and how to appropriately evaluate given models and scientificexplanations, all cast in real-life contexts of the different sciencecontent areas, are extensively covered by EPAS Science Tests.
ACT National Curriculum Survey results provide solid validityevidence that EPAS Science Tests measure important skills andknowledge at the appropriate levels that are necessary for success.Specific descriptions of the knowledge and skills currently measuredby EPAS Science Tests are listed in Appendix D. Importance ratingsprovide empirical evidence that the content and skills that EPASScience Tests measure are important for postsecondary success;similarly, content and skills rated by the majority of educators as notimportant are not included on EPAS Science Tests. (See Table C.4 inAppendix C for a complete listing of science content and skills andtheir ratings.)
ACT staff will continue to use these survey resultswhen making test development decisions aboutthe specific content and skills included on theEPAS Science Tests.
EPAS Science Tests emphasize applicationof science processes and inquiry skills andfundamental science knowledge in avariety of real-world science contexts.
ACT National Curriculum Survey resultssupport ACT’s Science Tests asassessments of important science processand inquiry skills that are crucial for collegereadiness.

34
6Conclusions
One major finding of the 2009 ACT National Curriculum Survey is thatACT’s EPAS tests appropriately reflect college readiness expectationsacross the areas of English/writing, mathematics, reading, andscience. More educators were sampled in 2009 than ever before, andthis rich data set will continue to be used to inform and guide ACT’stest development decisions.
The 2009 survey also yields interesting findings with respect topostsecondary instructors’ and high school teachers’ perceptionsabout college and workplace readiness. Survey results of postsecondary instructors and high school teachers across contentareas reveal that a great deal of overlap exists in these educators’perception of the skills and knowledge needed for college readinessand those needed to enter the workforce in a job paying a livingwage. Survey results from high school teachers also suggest,however, that secondary teachers lower expectations for studentswho are not college bound. This result is unfortunate, because itimplies that students heading for the workforce and for college maybe receiving different types and levels of instruction. Workforce-bound students may not be receiving instruction to the samestandards as their college-going peers, even though the skills theyneed to master to be successful when they leave high school arefundamentally the same.
Another major finding is that postsecondary instructors indicate thatneither their state’s standards nor their state’s graduationrequirements align well with what students need to know and to beable to do to be college ready in their content area. By way ofcontrast, most high school teachers indicate that their instructiontends to cover these same state standards. States should seekempirical evidence that their standards and assessments areencouraging high school teachers to focus on teaching theknowledge and skills in each content area that are most critical forstudent readiness for postsecondary work in each content area.

35
The 2009 survey results delineate differences between high schoolteachers’ and postsecondary instructors’ perceptions of students’readiness for college and careers. High school teachers rate theirstudents’ readiness much higher then do their postsecondarycounterparts with respect to preparedness for college-level work as well as with respect to how many students reach reading comprehension expectations. Given the high number of studentsenrolling in remedial courses, these differences in perception deservegreater scrutiny. More direct communication between postsecondaryinstructors and high school teachers within each discipline aboutexpectations is also warranted.
The survey also reveals differences between high school andpostsecondary educators’ importance ratings within content areas. In English/writing, postsecondary instructors rate proper usage andpunctuation higher in importance than do high school teachers;conversely, high school teachers highly endorse some topics (e.g., writing to analyze literature) that postsecondary instructors donot rate highly in importance as prerequisite for success. Inmathematics, high school teachers tend to rate advanced topics(e.g., functions) with greater importance than do their postsecondarycounterparts; postsecondary mathematics instructors, by contrast,tend to endorse mastery of fundamental mathematic topics as beingof higher importance for incoming students. High school teachers inEnglish language arts and social studies report that their studentsleave their courses ready to do college-level reading in their contentarea; postsecondary instructors, on the other hand, report that moststudents arrive not ready. Finally, in science we see high schoolteachers highly endorsing advanced science topics (e.g., understanding and applying the mole concept) while not rating science process skills highly; postsecondary scienceinstructors tend to respond in the exact opposite way.
ACT conducts the ACT National Curriculum Survey to monitor currenteducational practices, and to ascertain postsecondary expectationsin order to build instruments that measure what content and skillseducators have identified as important. ACT will actively use thesurvey results throughout EPAS test development. ACT offers theseresearch results to the wider public so that they may also help informeducational stakeholders and policy decisions.

36
ReferencesACT. (2005). What are ACT’s College Readiness Benchmarks? Iowa
City, IA: Author.
ACT. (2006). Ready for college and ready for work, same or different?Iowa City, IA: Author.
ACT. (2008). The forgotten middle: Ensuring that all students are on target for college and career readiness before high school.Iowa City, IA: Author.
ACT. (2009a). ACT profile report—national: Graduating class 2009.Iowa City, IA: Author.
ACT. (2009b). EXPLORE profile report—national: Grade 8 2008–09.Iowa City, IA: Author.
Alliance for Excellent Education. (2002). Every child a graduate.Washington, DC: Author.
Alliance for Excellent Education. (2009). The high cost of high schooldropouts: What the nation pays for inadequate schools. RetrievedSeptember 16, 2009, from http://www.all4ed.org/files/HighCost.pdf
Au, K. H. (2000). A multicultural perspective on policies for improvingliteracy achievement: Equity and excellence. In M. L. Kamil, P. B. Mosenthal, P. D. Pearson, & R. Barr (Eds.), Handbook ofreading research (Vol. 3, pp. 835–851). Mahwah, NJ: Erlbaum.
Council of Chief State School Officers. (2009). Common Core StateStandards Initiative. Retrieved September 16, 2009, fromhttp://www.ccsso.org/federal_programs/13286.cfm
Finn, C. E., Petrilli, M. J., & Julian, M. (2006). The state of statestandards 2006. Washington, DC: The Thomas B. FordhamFoundation.
Kamil, M. L. (2003). Adolescents and literacy: Reading for the 21st century. Washington, DC: Alliance for Excellent Education.
Partnership for 21st Century Skills. (2008). Framework for 21st century learning. In 21st century outcomes. RetrievedNovember 1, 2008, from http://www.21stcenturyskills.org/index.php?option=com_content&task=view&id=254&Itemid=120
Snow, C. E., & Biancarosa, G. (2003). Adolescent literacy and theachievement gap: What do we know and where do we go fromhere? New York: Carnegie Corporation of New York.

37
AppendicesA: Survey Samples, Types, and Response Rates . . . . . . . . . . . . . . . . 38
B: General Impressions . . . . . . . . . . . . . . . . . . . . . . . . . . . . . . . . . . . . 40
C: Statistical Details for Topics and Skills . . . . . . . . . . . . . . . . . . . . . . . 46
D: Test Specifications for the EPAS English/Writing,Mathematics, Reading, and Science Tests . . . . . . . . . . . . . . . . . . . 64
E: 21st Century Skills . . . . . . . . . . . . . . . . . . . . . . . . . . . . . . . . . . . . . . 75
F: Content Topics “Taught” Percentages . . . . . . . . . . . . . . . . . . . . . . . 76
G: Strand Rankings for ACT’s College Readiness Standards . . . . . . 97
H: Statistical Details for Remedial Topics and Skills . . . . . . . . . . . . . . 99
I: ACT Writing Test Rubric . . . . . . . . . . . . . . . . . . . . . . . . . . . . . . . . . 106

38
English/Writing Sample Breakdownfor the 2009 ACT NationalCurriculum Survey
Tables A.1 and A.2 give the breakdown ofEnglish/writing participants in the 2009 ACT NationalCurriculum Survey. Table A.1 gives the number ofsurvey instruments sent out to writing instructors, andTable A.2 gives the response rate.
Mathematics Sample Breakdown for the 2009 ACT National CurriculumSurvey
Tables A.3 and A.4 give the breakdown of mathparticipants in the 2009 ACT National CurriculumSurvey. Table A.3 gives the number of surveyinstruments sent out to math instructors, and Table A.4gives the response rate.
APPENDIX A: Survey Samples,Types, and Response Rates
Table A.4
Mathematics Survey Response Rate
Survey typeNumbermailed
Numberreturned
Responserate
Middle school/junior high school
4,000 0,386 10%
High school 4,500 0,618 14%Postsecondary 3,000 0,598 20%Remedial 2,033 0,223 11%Total 13,533 1,825 13%
Table A.3
Mathematics Surveys Sent
Sample CoursesSample
size
Middle school/junior high school
Mathematics, Pre-Algebra, Algebra, Geometry
4,000
High school Mathematics, Algebra, Geometry, Trigonometry, Precalculus, Calculus, Probability and/or Statistics
4,500
Postsecondary Entry-level courses 3,000College/Finite/
Discrete MathProbability/StatisticsAlgebraGeometry/PrecalculusCalculus
Remedial Developmental Math/Remedial Math
2,033Table A.2
English/Writing Survey Response Rate
Survey typeNumbermailed
Numberreturned
Responserate
Middle school/junior high school
3,000 0,315 11%
High school 2,350 0,351 15%Postsecondary 2,850 0,385 14%Remedial 2,500 0,225 9%Total 10,700 1,276 12%
Table A.1
English/Writing Surveys Sent
Sample CoursesSample
size
Middle school/junior high school
English/Language Arts 3,000
High school Writing/Composition 2,350
Postsecondary Entry-level coursesComposition 2,850Freshman English 0,Survey of American
Literature0,
Remedial Developmental Writing 2,500

39
Reading Sample Breakdown for the 2009 ACT National CurriculumSurvey
Tables A.5 and A.6 give the breakdown of readingparticipants in the 2009 ACT National CurriculumSurvey. Table A.5 gives the number of surveyinstruments sent out to reading instructors, andTable A.6 gives the response rate.
Science Sample Breakdown for the 2009 ACT National CurriculumSurvey
Tables A.7 and A.8 give the breakdown of scienceparticipants in the 2009 ACT National CurriculumSurvey. Table A.7 gives the number of surveyinstruments sent out to science instructors, and Table A.8 gives the response rate.
Table A.6
Reading Survey Response Rate
Survey typeNumbermailed
Numberreturned
Responserate
Middle school/junior high school
2,750 0,342 12%
High school 3,400 0,426 13%Postsecondary 3,337 0,429 13%Remedial 2,250 0,305 14%Total 11,737 1,502 13%
Table A.5
Reading Surveys Sent
Sample CoursesSample
size
Middle school/junior high school
Language Arts 2,750
High school Language Arts 2,000History/Civics 1,400
Postsecondary Entry-level courses 3,337CompositionFreshman EnglishSurvey of American
Literature
Remedial Developmental Reading 2,250
Table A.8
Science Survey Response Rate
Survey typeNumbermailed
Numberreturned
Responserate
Middle school/junior high school
2,500 0,292 12%
High school 8,500 1,366 16%Postsecondary 8,092 1,419 18%Total 19,092 3,077 16%
Table A.7
Science Surveys Sent
Sample CoursesSample
size
Middle school/junior high school
Science, Physical Science 2,500
High school Biology
Biology 2,200
High schoolChemistry
Chemistry 1,650
High school Earth Science
Earth Science 2,900
High school Physics
Physics 1,750
Postsecondary Biology
Introduction to Biology/Life Science
2,200
Postsecondary Chemistry
Introduction to Chemistry/General Chemistry/etc.
1,900
Postsecondary Earth/Space Science
Geology/Earth Sciences/etc.
1,842
Postsecondary Physics
Entry-level coursesIntroduction to
AstronomyIntroduction to Physics/
General Physics/etc.
2,150
APPENDIX A: Survey Samples,Types, and Response Rates

Items About Transitions From One Grade Level to the Next
Table B.2
How well do you think your state graduation requirements prepare high school students for college?
Response Writing % Mathematics % Reading % Science %
High School TeachersVery poorly 2 2 2 2Poorly 17 18 21 23Well 57 55 54 54Very well 18 19 17 14Don’t know 4 4 5 5Not applicable 2 2 1 1
Postsecondary InstructorsVery poorly 10 9 10 10Poorly 49 41 46 45Well 16 24 16 18Very well 2 1 2 0Don’t know 23 23 26 25Not applicable 1 1 0 1
Table B.1
How well do you think your high school state assessment measures college readiness expectations?
Response Writing % Mathematics % Reading % Science %
High School TeachersVery poorly 8 7 6 7Poorly 34 26 34 30Well 32 34 36 32Very well 9 12 9 7Don’t know 12 16 12 17Not applicable 5 5 3 7
Postsecondary InstructorsVery poorly 9 8 10 9Poorly 39 28 35 29Well 12 16 12 14Very well 2 2 2 0Don’t know 38 44 40 46Not applicable 1 2 1 1
40
Appendix B: General Impressions

Items About Transitions From One Grade Level to the Next
Table B.4
To what degree do you believe the skills and knowledge needed for college readiness overlap those needed to enter the workforce
in a job paying a living wage?
Response Writing % Mathematics % Reading % Science %
High School TeachersNot at all 1 1 1 1Slightly 18 33 18 25A great deal 66 58 66 60Completely 13 6 14 10Don’t know 3 2 2 4
Postsecondary InstructorsNot at all 1 0 1 1Slightly 14 22 15 16A great deal 65 65 68 69Completely 16 7 15 11Don’t know 3 7 2 3
Table B.3
How well do you think your state content standards identify and define what students need to know and to be able to do
to be college ready in your content area?
Response Writing % Mathematics % Reading % Science %
High School TeachersVery poorly 3 2 3 3Poorly 16 16 18 23Well 57 55 52 53Very well 17 21 21 15Don’t know 5 5 5 4Not applicable 2 2 1 1
Postsecondary InstructorsVery poorly 8 6 8 7Poorly 37 25 36 32Well 18 31 18 23Very well 6 6 4 4Don’t know 30 31 34 35Not applicable 1 1 1 0
41
Appendix B: General Impressions

Items About Student Ability
Table B.7
After leaving your course, how well prepared are your students for high school-level work in your content area?
Response Writing % Mathematics % Reading % Science %
Middle School TeachersVery poorly 0 0 0 0Poorly 3 7 3 3Well 67 59 62 70Very well 31 35 35 26
Table B.6
When they leave your course, how many students meet the required level of reading comprehension for students beginning entry-level
college courses in your discipline?
Response Writing % Mathematics % Reading % Science %
High School TeachersNone, or very few 1 3 2 4Less than half 7 15 11 13About half 16 21 24 21More than half 31 34 33 32All, or nearly all 45 27 30 30
Table B.5
How many students entering your course meet your expectations for the reading comprehension of incoming students in your discipline?
Response Writing % Mathematics % Reading % Science %
Postsecondary InstructorsNone, or very few 6 8 5 3Less than half 30 33 31 25About half 38 28 39 34More than half 21 20 21 29All, or nearly all 5 12 4 9
42
Appendix B: General Impressions

Items About Student Ability
Table B.9
How well prepared are incoming students for college-level work in your content area?
Response Writing % Mathematics % Reading % Science %
Postsecondary InstructorsVery poorly 9 13 9 13Poorly 68 61 63 61Well 23 26 26 25Very well 1 0 2 1
Table B.8
After leaving your course, how well prepared are your students for college-level work in your content area?
Response Writing % Mathematics % Reading % Science %
High School TeachersVery poorly 0 1 0 0Poorly 6 10 9 8Well 54 60 63 66Very well 40 29 28 26
43
Appendix B: General Impressions

Items About Teachers and Classrooms
Table B.13
How much time do you spend teaching your students strategies on how to read the materials in your course?
Response Writing % Mathematics % Reading % Science %
High School TeachersNone 1 8 2 13A little 30 57 31 58A moderate amount 46 30 47 25A lot 22 4 20 4
Postsecondary InstructorsNone 2 26 4 23A little 41 52 39 57A moderate amount 43 18 41 17A lot 15 3 16 2
Table B.12
Which of the following best describes your teacher certification?
Response Writing % Mathematics % Reading % Science %
High School TeachersAlternative 6 3 3 5Traditional pre-service 4 5 3 4State 56 50 56 51Designated a highly qualified
teacher by the state50 56 54 53
Uncertified 1 1 1 2Other 5 3 6 5
Table B.11
Which ONE of the following best describes the use of calculators on exams in your course?
Response Middle School % High School % Postsecondary %
Mathematics TeachersUsually allowed for all parts of exams 38 74 70Allowed in some parts of exams, not in others 30 23 15Rarely allowed for any part of exams 33 4 16
Table B.10
What kinds of materials do you require your students to read in your course?
Response Writing % Mathematics % Reading % Science %
High School TeachersTextbook 90 97 92 94Books 95 3 78 13Journal articles 63 3 56 34Primary source materials 72 17 77 25Charts and graphs 37 55 61 80Internet material 87 25 85 70
Postsecondary InstructorsTextbook 84 98 85 97Books 50 2 59 8Journal articles 69 4 55 20Primary source materials 57 5 68 16Charts and graphs 16 31 22 57Internet material 70 22 62 55
44
Appendix B: General Impressions

Items About Teachers and Classrooms
Table B.16
To what extent does your instruction match your state’s content standards for your course?
Response Writing % Mathematics % Reading % Science %
High School TeachersNo match 2 1 1 0A minimal amount 1 1 2 2A moderate amount 29 30 26 34Complete coverage 33 44 40 34Coverage and goes beyond 35 25 31 30
Table B.15b
To what degree do you believe secondary instructors reduce academic expectations for students they perceive are not college bound?
Response Writing % Mathematics % Reading % Science %
High School TeachersNot at all 6 7 7 6Slightly 42 46 40 42A great deal 36 39 42 41Completely 2 1 2 1Don’t know 14 7 9 10
Table B.15a
To what degree do you believe middle school/junior high instructors reduceacademic expectations for students they perceive are not college bound?
Response Writing % Mathematics % Reading % Science %
Middle School TeachersNot at all 28 24 25 28Slightly 39 44 37 36A great deal 18 19 24 22Completely 1 1 1 0Don’t know 15 13 12 14
Table B.14
Lab activity
Response %
High School Biology TeachersMicroscopy 94Culturing of microorganisms 41Sterile technique 31Use of dichotomous keys 74Gel electrophoresis 29Restriction digest of DNA 15Bacterial transformation 74Genetic crosses 29Dissection 15
45
Appendix B: General Impressions

Table C.1
Statistical Details for English/Writing Topics and Skills
MSMean
MS+/–
HSMean
HS +/–
PSMean
PS +/– Topics and Skills
Composition Process and Purpose3.27 0.09 3.29 0.08 3.16 0.09 Determine purpose and audience3.57 0.08 3.25 0.10 3.00 0.10 Use prewriting, brainstorming, or other techniques of invention3.32 0.09 2.96 0.11 2.59 0.11 Use mapping, clustering, outlining, or other organizational tools2.87 0.12 3.36 0.09 2.96 0.10 Gather and synthesize resources2.70 0.13 3.32 0.10 3.05 0.10 Evaluate source materials critically3.63 0.07 3.53 0.07 3.07 0.09 Develop a cohesive first draft3.70 0.06 3.64 0.07 3.47 0.08 Revise for content3.66 0.07 3.59 0.07 3.44 0.07 Edit and proofread for usage and mechanics2.93 0.13 3.59 0.09 3.12 0.10 Cite sources accurately3.50 0.09 3.76 0.06 3.62 0.07 Avoid plagiarism3.25 0.10 3.23 0.10 2.71 0.10 Develop one’s own voice as a writer1.89 0.15 1.62 0.15 1.07 0.11 Make use of and adapt elements of the writing process to create media productions3.19 0.11 3.23 0.10 3.23 0.09 Write to explore ideas3.34 0.09 2.85 0.12 2.16 0.12 Write to express one’s feelings3.25 0.10 2.41 0.14 1.74 0.13 Write to tell a story through fiction or nonfiction3.25 0.12 3.55 0.09 2.25 0.14 Write to analyze literature2.26 0.14 2.36 0.14 2.17 0.12 Write to analyze media3.50 0.08 3.55 0.07 3.36 0.08 Write to convey information3.48 0.10 3.56 0.08 3.35 0.09 Write to argue or persuade readers2.80 0.14 2.17 0.15 2.06 0.12 Write to describe a process or how to do something1.92 0.17 1.61 0.16 1.37 0.12 Write to produce work-related texts2.79 0.14 3.24 0.12 2.62 0.13 Write to present research3.69 0.07 3.77 0.05 3.44 0.08 COMPOSITION PROCESS AND PURPOSE as an overall set of skills
Topic and Idea Development3.61 0.09 3.83 0.05 3.61 0.07 Present a thesis that establishes focus on the topic3.76 0.06 3.79 0.05 3.65 0.06 Maintain a focus on the general topic throughout a piece of writing3.46 0.09 3.65 0.07 3.43 0.08 Narrow the focus to a specific issue within the general topic3.24 0.10 3.38 0.09 3.13 0.08 Provide appropriate context or background information for readers3.78 0.05 3.81 0.05 3.59 0.07 Develop ideas by using some specific reasons, details, and examples3.44 0.11 3.59 0.08 3.23 0.09 Take and maintain a position on an issue3.17 0.12 3.63 0.08 3.19 0.10 Support claims with multiple and appropriate sources of evidence2.54 0.15 3.07 0.12 2.93 0.11 Differentiate between assertions and evidence2.70 0.14 3.07 0.11 2.82 0.10 Fairly and accurately represent different points of view on an issue2.48 0.15 3.02 0.12 2.77 0.11 Anticipate and respond to counterarguments to a position taken on an issue2.94 0.13 3.10 0.12 3.04 0.09 Show some movement between general and specific ideas and examples2.75 0.13 2.96 0.12 2.68 0.10 Identify the basic purpose or role of a phrase or sentence within a piece of writing3.26 0.10 3.37 0.09 3.02 0.09 Determine the appropriateness of wording for audience and purpose3.32 0.10 3.20 0.10 3.08 0.09 Delete a clause or sentence because it is obviously irrelevant to a piece of writing3.30 0.09 3.23 0.10 3.13 0.09 Delete material that disturbs the development or flow of a piece of writing3.39 0.10 3.48 0.09 3.26 0.09 Determine whether a piece of writing has accomplished its intended purpose3.70 0.06 3.76 0.06 3.50 0.08 TOPIC AND IDEA DEVELOPMENT as an overall set of skills
Organization, Unity, and Coherence3.74 0.06 3.71 0.06 3.58 0.07 Provide an adequate organization with a logical grouping of ideas3.79 0.05 3.75 0.06 3.50 0.07 Use discernible introductions and conclusions3.57 0.07 3.54 0.07 3.30 0.08 Use appropriate transition words and phrases within a sentence or to connect sentences within a paragraph3.53 0.08 3.54 0.07 3.30 0.08 Use effective transition sentences to connect paragraphs3.15 0.11 . . . . Use conjunctive adverbs to show time relationships (e.g., then, this time)2.98 0.13 3.02 0.11 2.89 0.09 Use conjunctive adverbs or phrases to express straightforward logical relationships3.05 0.12 2.96 0.12 2.89 0.09 Select the most logical place to add a sentence in a paragraph3.18 0.11 3.15 0.11 3.08 0.09 Determine the most logical place to add information to a piece of writing3.69 0.06 3.65 0.06 3.44 0.08 ORGANIZATION, UNITY, AND COHERENCE as an overall set of skills
Word Choice in Terms of Style,Tone, Clarity, and Economy2.85 0.13 2.79 0.12 2.79 0.09 Revise expressions that deviate from the style of a piece of writing3.48 0.08 . . . . Revise sentences to correct awkward and confusing arrangements of sentence elements3.01 0.11 3.10 0.11 2.90 0.09 Maintain consistency of tone3.50 0.08 3.46 0.08 3.22 0.08 Choose words and images that are specific, precise, and clear in terms of their context3.57 0.07 3.54 0.07 3.31 0.07 Use appropriate vocabulary3.18 0.09 3.22 0.10 3.12 0.08 Delete obviously synonymous and wordy material in a sentence3.43 0.08 3.37 0.09 2.92 0.09 Use varied words and images3.31 0.09 . . . . Revise vague nouns and pronouns3.31 0.10 3.36 0.09 3.32 0.08 Avoid vague pronouns (i.e., pronouns without a clear antecedent)2.94 0.11 2.92 0.11 2.90 0.09 Determine the clearest and most logical conjunction to link clauses2.56 0.15 3.03 0.12 3.00 0.09 Use rhetorically effective subordination, coordination, and parallelism3.35 0.08 3.39 0.08 3.10 0.08 WORD CHOICE IN TERMS OF STYLE,TONE, CLARITY, AND ECONOMY as an overall set of skills
Note:MS = Middle school/junior high school teachersHS = High school teachersPS = Postsecondary instructors (no remedial teachers)+/– = The value given under +/– is the confidence interval (CI) for the mean, at a confidence level of 95%. For example, for a mean of 3.27 with a CI of 0.09, there is a
95% probability that the actual mean for the population is within the range 3.27 plus or minus 0.09.. = This item was not asked at this grade level.
46
APPENDIX C: Statistical Details for Topics and Skills

47
Table C.1
Statistical Details for English/Writing Topics and Skills (continued)
MSMean
MS+/–
HSMean
HS +/–
PSMean
PS +/– Topics and Skills
Sentence Structure and Formation2.48 0.15 3.05 0.12 3.15 0.08 Avoid faulty subordination, coordination, and parallelism3.52 0.08 3.51 0.09 3.57 0.07 Use punctuation and conjunctions to avoid awkward sentence fragments and fused sentences (i.e., comma splices,
run-on sentences)3.42 0.09 . . . . Use punctuation and conjunctions to join clauses2.78 0.13 3.09 0.11 3.07 0.09 Avoid dangling and misplaced modifiers3.25 0.11 3.24 0.10 3.32 0.08 Decide on appropriate verb tense and voice by considering the meaning of an entire sentence3.11 0.12 . . . . Revise shifts in verb tense between simple clauses in a sentence or between simple adjoining sentences3.20 0.11 3.27 0.10 3.30 0.08 Decide on appropriate verb tense and voice in terms of a paragraph or a piece of writing3.00 0.12 3.18 0.11 3.24 0.08 Avoid inappropriate shifts of mood, number, or person2.85 0.13 2.97 0.12 3.09 0.09 Identify missing or incorrect relative pronouns3.35 0.10 3.35 0.10 3.13 0.09 Use some varied kinds of sentence structures to vary pace and to support meaning3.35 0.09 3.34 0.09 3.31 0.08 SENTENCE STRUCTURE AND FORMATION as an overall set of skills
Conventions of Usage2.90 0.12 2.68 0.13 3.22 0.09 Form simple and compound tenses of regular and irregular verbs2.86 0.13 . . . . Form past and past participle of irregular and commonly used verbs2.88 0.13 . . . . Form comparative and superlative adjectives2.82 0.13 2.60 0.13 3.03 0.09 Form modifiers2.82 0.13 2.55 0.13 2.99 0.10 Choose between using an adverb and using an adjective in a particular situation3.39 0.10 3.20 0.11 3.58 0.07 Ensure straightforward subject-verb agreement3.29 0.10 3.17 0.11 3.46 0.08 Ensure straightforward pronoun-antecedent agreement2.91 0.13 3.00 0.12 3.14 0.09 Ensure subject-verb and pronoun-antecedent agreement in unusual or tricky situations
(e.g., subject-verb order is inverted; subject is an indefinite pronoun)3.28 0.10 3.04 0.12 3.41 0.08 Use the proper form of possessive pronouns3.21 0.11 3.01 0.12 3.37 0.09 Use the appropriate case of a pronoun2.78 0.14 2.70 0.14 3.28 0.08 Use the idioms of standard written English2.86 0.12 2.62 0.13 3.15 0.09 Determine which preposition to use in simple contexts2.51 0.15 2.57 0.13 2.94 0.09 Determine the appropriate preposition to use in situations involving sophisticated language or ideas3.19 0.11 3.00 0.11 3.31 0.09 Use the appropriate word in frequently confused pairs of words (e.g., past and passed)3.30 0.10 3.09 0.11 3.32 0.08 CONVENTIONS OF USAGE as an overall set of skills
Conventions of Punctuation3.06 0.12 3.01 0.11 3.09 0.09 Delete commas that disturb sentence flow (e.g., between modifier and modified element)3.40 0.10 3.22 0.10 3.44 0.08 Provide appropriate punctuation in straightforward situations (e.g., items in a series)3.25 0.11 3.15 0.11 3.28 0.08 Punctuate between clauses of compound sentences when the conjunction is omitted3.05 0.13 3.06 0.11 3.15 0.09 Punctuate before a conjunctive adverb joining clauses of a compound sentence2.94 0.13 3.04 0.11 3.04 0.09 Punctuate parenthetical elements with commas, parentheses, and dashes3.01 0.13 3.06 0.10 3.09 0.09 Punctuate essential/nonessential elements, subordinate clauses, and restrictive/nonrestrictive appositives3.31 0.11 3.11 0.10 3.37 0.08 Punctuate possessive nouns and pronouns3.42 0.10 3.06 0.11 2.87 0.12 Punctuate dialogue3.10 0.12 3.19 0.10 3.15 0.09 Use a semicolon to indicate a close relationship between two independent clauses2.81 0.14 2.96 0.11 2.80 0.10 Use semicolons when items in a series have internal punctuation (e.g., when items have their own commas)3.05 0.13 3.01 0.11 2.97 0.10 Use a colon to introduce a series of phrases (e.g., a list of examples)2.60 0.15 2.83 0.12 2.73 0.11 Use a colon to introduce one or more sentences3.35 0.10 3.21 0.10 3.21 0.08 CONVENTIONS OF PUNCTUATION as an overall set of skills
Evaluation of Writing3.53 0.08 3.57 0.06 3.52 0.07 Writing appropriately for purpose and audience3.71 0.06 3.79 0.05 3.78 0.05 Writing unified and coherent text3.57 0.07 3.67 0.06 3.68 0.06 Developing ideas using appropriate organizational strategy3.68 0.06 3.83 0.04 3.77 0.05 Developing ideas using relevant examples and details3.83 0.05 3.72 0.05 3.53 0.07 Using a clear beginning, middle, and ending3.11 0.09 3.15 0.08 2.76 0.10 Using voice3.23 0.08 3.30 0.07 3.11 0.07 Using precise word choice2.94 0.09 3.20 0.08 3.05 0.08 Using appropriate tone3.30 0.08 3.37 0.07 2.97 0.09 Using sentence variety3.51 0.08 3.56 0.06 3.47 0.07 Using correct grammar, usage, and mechanics3.74 0.06 3.80 0.04 3.67 0.06 EVALUATION OF WRITING as an overall topic
Note:MS = Middle school/junior high school teachersHS = High school teachersPS = Postsecondary instructors (no remedial teachers)+/– = The value given under +/– is the confidence interval (CI) for the mean, at a confidence level of 95%. For example, for a mean of 3.27 with a CI of 0.09, there is a
95% probability that the actual mean for the population is within the range 3.27 plus or minus 0.09.. = This item was not asked at this grade level.
2
APPENDIX C: Statistical Details for Topics and Skills

Table C.2a
Statistical Details for Mathematics Topics and Skills by CourseMiddle School Responses Only
7thMean
7th +/–
8thMean
8th +/–
P-AlgMean
P-Alg +/–
AlgMean
Alg +/– Topics and Skills
Process Skills2.69 0.12 2.53 0.12 2.67 0.14 2.97 0.13 Choose an appropriate method for calculating (e.g., mental, paper and pencil, calculator, or estimation)2.98 0.10 2.74 0.10 2.66 0.12 2.86 0.12 Estimate a reasonable result without using a calculator2.60 0.11 2.29 0.12 2.18 0.14 1.97 0.14 Demonstrate concepts using manipulatives2.95 0.10 2.76 0.11 2.67 0.12 2.63 0.13 Demonstrate concepts using pictorial representations3.61 0.06 3.53 0.07 3.58 0.07 3.59 0.07 Solve problems posed in real-world settings and interpret the solutions2.79 0.11 2.74 0.11 2.92 0.11 2.89 0.13 Recognize when essential information is missing3.50 0.07 3.55 0.06 3.69 0.06 3.80 0.06 Plan and carry out a strategy for solving multistep problems2.73 0.11 3.10 0.09 3.19 0.10 3.31 0.11 Recognize generalizations of mathematical ideas3.38 0.08 3.53 0.06 3.29 0.09 3.45 0.09 Recognize and use patterns to solve problems3.30 0.09 3.35 0.08 3.37 0.09 3.40 0.10 Apply mathematical ideas to new contexts2.74 0.12 3.01 0.11 2.87 0.13 2.98 0.13 Formulate new patterns or structures2.71 0.13 2.73 0.11 3.10 0.12 3.00 0.13 Solve several problems representing different aspects/components of one larger problem or scenario1.94 0.14 2.15 0.14 2.09 0.16 2.33 0.14 Understand roles of definitions, proof, and counterexamples3.40 0.09 3.41 0.08 3.49 0.08 3.62 0.08 Recall basic facts, definitions, formulas, and algebraic procedures as needed to solve a problem1.53 0.15 2.18 0.15 2.03 0.18 2.72 0.15 Recall theorems and more complex formulas when needed to solve a problem1.66 0.15 1.95 0.16 1.99 0.19 2.38 0.19 Apply theorems to solve a problem0.55 0.10 0.82 0.12 0.69 0.11 1.13 0.17 Construct and/or critique proofs, either informal or formal2.77 0.13 2.44 0.14 2.59 0.18 2.62 0.18 Perform basic operations with a calculator1.10 0.14 1.15 0.14 1.22 0.15 2.18 0.19 Use the statistical capabilities of a calculator1.03 0.14 1.51 0.15 1.12 0.16 2.69 0.19 Use the graphical capabilities of a calculator0.97 0.14 1.29 0.14 1.29 0.18 2.16 0.20 Use the symbolic algebra capabilities of a calculator0.81 0.12 0.86 0.12 0.91 0.14 0.98 0.14 Use spreadsheets0.99 0.15 0.80 0.12 0.95 0.14 0.73 0.12 Use dynamic geometry2.93 0.12 2.97 0.11 3.04 0.11 3.08 0.13 Solve routine problems quickly2.11 0.13 2.23 0.14 2.28 0.15 2.68 0.16 Solve novel problems quickly3.77 0.04 3.54 0.07 3.61 0.08 3.60 0.09 Use mathematical symbols correctly2.58 0.11 2.39 0.14 2.65 0.14 2.62 0.16 Understand new material from reading a textbook2.55 0.12 2.52 0.13 2.74 0.14 2.81 0.13 Work in a self-directed group3.28 0.10 3.21 0.09 3.26 0.10 3.31 0.10 PROCESS SKILLS as an overall topic
Basic Operations and Applications3.70 0.06 3.74 0.05 3.67 0.08 3.42 0.10 Perform addition, subtraction, multiplication, and division on signed rational numbers3.35 0.09 3.33 0.08 3.26 0.12 3.21 0.14 Perform one-step computations with whole numbers and decimals3.81 0.04 3.65 0.07 3.72 0.07 3.44 0.10 Solve problems using ratios and proportions3.61 0.07 3.53 0.09 3.48 0.11 3.16 0.12 Solve problems involving percents (e.g., simple interest, tax, and markdowns)2.98 0.12 2.72 0.11 2.97 0.12 2.52 0.14 Convert units of measure3.38 0.10 3.26 0.10 3.30 0.11 3.02 0.14 Solve routine one-step arithmetic problems3.35 0.09 3.40 0.10 3.47 0.10 3.33 0.12 Solve routine two- or three-step arithmetic problems2.77 0.12 3.11 0.11 3.30 0.12 3.34 0.09 Solve nonroutine two- or three-step arithmetic problems2.88 0.12 2.92 0.12 3.12 0.10 2.85 0.12 Solve multistep arithmetic problems that involve planning or converting units of measure3.25 0.10 3.15 0.11 3.35 0.10 3.22 0.09 Solve word problems containing several rates, proportions, or percentages3.48 0.09 3.47 0.09 3.60 0.08 3.41 0.09 BASIC OPERATIONS AND APPLICATIONS as an overall topic
Numbers: Concepts and Properties2.88 0.13 2.41 0.15 2.49 0.15 2.23 0.17 Identify a digit's place3.33 0.09 2.99 0.11 3.01 0.12 2.59 0.15 Exhibit knowledge of elementary number concepts (e.g., rounding, decimal ordering, pattern
identification, absolute value, primes, and greatest common factor) 3.38 0.08 2.91 0.11 3.03 0.12 2.55 0.15 Order fractions3.02 0.11 2.91 0.12 2.87 0.13 2.51 0.15 Recognize one-digit factors of a number3.18 0.10 2.81 0.11 2.89 0.13 2.71 0.14 Find and use the least common multiple3.43 0.08 3.24 0.09 3.23 0.10 2.81 0.13 Recognize equivalent fractions and fractions in lowest terms3.18 0.09 3.48 0.07 3.23 0.09 3.19 0.10 Perform computations with squares and square roots of numbers1.75 0.17 2.18 0.15 2.24 0.17 2.74 0.15 Perform computations with cubes and cube roots of numbers2.83 0.14 3.16 0.12 3.11 0.13 3.52 0.09 Apply rules of exponents0.58 0.12 0.89 0.13 0.85 0.15 1.86 0.18 Perform matrix addition and multiplication2.75 0.13 2.64 0.14 2.48 0.15 2.51 0.15 Exhibit knowledge of series and sequences (e.g., arithmetic and geometric)0.98 0.14 1.29 0.15 1.21 0.16 2.37 0.18 Find union and intersection of sets2.79 0.13 3.14 0.11 2.97 0.13 3.16 0.12 Apply properties of rational and irrational numbers
. . . . . . . . Exhibit knowledge of complex numbers
. . . . . . . . Apply properties of complex numbers3.13 0.10 3.01 0.10 3.07 0.11 3.11 0.12 Apply number properties involving multiples and factors2.57 0.14 3.04 0.10 2.99 0.11 2.83 0.13 Use scientific notation
. . . . . . . . Determine when an expression is undefined
. . . . . . . . Exhibit knowledge of logarithms and geometric sequences3.49 0.07 3.24 0.08 3.32 0.07 3.10 0.10 NUMBERS: CONCEPTS AND PROPERTIES as an overall topic
Note:Only those courses with a sufficient number of respondents are included.7th = 7th-grade mathematics 8th = 8th-grade mathematicsP-Alg = Pre-AlgebraAlg = Algebra+/– = The value given under +/– is the confidence interval (CI) for the mean, at a confidence level of 95%. For example, for a mean of 3.27 with a CI of 0.09, there is a
95% probability that the actual mean for the population is within the range 3.27 plus or minus 0.09.. = This item was not asked at this grade level.
48
APPENDIX C: Statistical Details for Topics and Skills

49
Table C.2a
Statistical Details for Mathematics Topics and Skills by CourseMiddle School Responses Only (continued)
7thMean
7th +/–
8thMean
8th +/–
P-AlgMean
P-Alg +/–
AlgMean
Alg +/– Topics and Skills
Expressions, Equations, and Inequalities3.51 0.08 3.63 0.06 3.76 0.05 3.57 0.10 Evaluate algebraic expressions by substituting integers for unknown quantities3.43 0.08 3.45 0.09 3.49 0.09 3.47 0.11 Exhibit knowledge of basic expressions3.39 0.11 3.55 0.09 3.79 0.05 3.73 0.07 Add and subtract simple algebraic expressions2.95 0.14 3.47 0.09 3.71 0.07 3.75 0.06 Combine like terms3.24 0.13 3.59 0.08 3.76 0.06 3.63 0.07 Solve routine first-degree equations2.87 0.15 3.61 0.08 3.52 0.12 3.76 0.07 Solve linear equations and inequalities in one variable3.63 0.06 3.62 0.07 3.75 0.07 3.59 0.09 Substitute whole numbers for unknown quantities3.35 0.10 3.49 0.09 3.49 0.10 3.62 0.08 Perform word-to-symbol translations3.35 0.09 3.42 0.09 3.58 0.09 3.68 0.06 Write expressions, equations, or inequalities for common settings3.58 0.08 3.66 0.06 3.78 0.06 3.62 0.08 Solve one-step equations having integer or decimal values0.60 0.12 1.90 0.18 1.91 0.20 3.67 0.10 Multiply two binomials1.73 0.17 2.03 0.17 2.51 0.19 3.60 0.10 Solve absolute value equations and inequalities0.65 0.13 1.94 0.18 2.07 0.20 3.69 0.10 Add, subtract, and multiply polynomials0.24 0.07 1.29 0.17 0.73 0.16 3.66 0.10 Factor quadratics0.27 0.08 1.15 0.17 0.64 0.14 3.66 0.10 Solve quadratic equations0.51 0.12 1.39 0.17 1.28 0.19 3.35 0.13 Apply properties of exponential functions
. . . . . . . . Solve quadratic inequalities
. . . . . . . . Use the discriminant
. . . . . . . . Determine solutions of polynomial and rational equations
. . . . . . . . Implement remainder and factor theorems for polynomials
. . . . . . . . Apply properties of logarithmic and exponential functions0.87 0.14 2.14 0.18 1.86 0.20 3.69 0.09 Find solutions to systems of linear equations0.31 0.08 0.77 0.13 0.58 0.15 2.66 0.19 Solve problems using equations of parabolas and circles
. . . . . . . . Solve problems using equations of parabolas, circles, ellipses, and hyperbolas
. . . . . . . . Solve problems using parametric equations0.62 0.13 1.38 0.17 1.00 0.18 3.33 0.12 Transform functions algebraically
. . . . . . . . Find the limit of an expression3.07 0.12 3.57 0.07 3.55 0.09 3.82 0.05 EXPRESSIONS, EQUATIONS, AND INEQUALITIES as an overall topic
Graphical Representations3.11 0.11 2.85 0.13 2.92 0.14 3.03 0.13 Comprehend the concept of length on the number line3.41 0.08 3.26 0.10 3.42 0.09 3.24 0.12 Locate points on the number line and in the first quadrant
. . . . . . . . Locate points on the number line3.67 0.06 3.43 0.08 3.56 0.08 3.52 0.09 Locate points in the coordinate plane2.08 0.16 3.29 0.12 3.08 0.15 3.75 0.06 Exhibit knowledge of slope1.73 0.16 3.24 0.13 3.00 0.16 3.83 0.05 Find the slope of a line2.48 0.16 3.09 0.13 3.36 0.11 3.73 0.06 Identify graphs on a number line2.11 0.17 3.12 0.14 2.94 0.17 3.75 0.06 Match linear graphs with their equations2.31 0.18 2.59 0.16 2.46 0.19 3.56 0.09 Use properties of parallel and perpendicular lines0.97 0.15 2.05 0.17 2.14 0.21 3.69 0.07 Solve systems of equations and inequalities graphically0.43 0.10 0.92 0.15 0.58 0.14 2.53 0.19 Recognize special characteristics of parabolas and circles
. . . . . . . . Recognize special characteristics of parabolas, circles, ellipses, and hyperbolas2.55 0.16 2.99 0.13 2.53 0.19 3.57 0.08 Interpret and use information from graphs in the coordinate plane1.55 0.17 2.46 0.17 1.96 0.18 3.44 0.08 Identify characteristics of graphs based on a set of conditions or on a general equation
. . . . . . . . Understand the properties of graphs of rational functions (e.g., asymptotes)1.02 0.14 1.42 0.17 1.70 0.19 2.76 0.18 Find midpoints1.57 0.17 1.79 0.18 1.86 0.19 2.97 0.17 Use the distance formula
. . . . . . . . Work with discontinuous graphs and piecewise-defined functions2.77 0.12 3.24 0.10 3.09 0.13 3.69 0.06 GRAPHICAL REPRESENTATIONS as an overall topic
Properties of Plane Figures2.74 0.16 2.68 0.15 2.94 0.15 2.05 0.17 Find the measure of an angle using properties of parallel lines2.87 0.14 2.71 0.14 2.94 0.15 2.22 0.16 Exhibit some knowledge of angles associated with parallel lines3.22 0.11 3.08 0.12 3.23 0.11 2.27 0.16 Exhibit knowledge of basic angle properties and special sums of angle measures
(e.g., 90°, 180°, and 360°)2.29 0.17 3.62 0.07 3.12 0.16 3.09 0.14 Use the Pythagorean theorem2.85 0.14 2.46 0.14 2.63 0.17 1.93 0.18 Apply properties of lines, segments, and rays2.73 0.15 2.24 0.16 2.46 0.17 1.77 0.18 Apply properties of special quadrilaterals2.46 0.17 2.32 0.16 2.22 0.17 1.80 0.18 Apply properties of 30°-60°-90°, isosceles, similar, and congruent triangles1.12 0.16 1.13 0.16 1.11 0.17 1.41 0.18 Use relationships among angles, arcs, and distances in a circle0.54 0.12 0.63 0.12 0.56 0.13 1.38 0.17 Use logical relationships to answer problems (e.g., converse, contrapositive, and if-then)0.59 0.13 0.83 0.14 1.00 0.17 1.38 0.17 Prove results by mathematical induction2.69 0.12 2.66 0.12 2.51 0.16 1.95 0.16 PROPERTIES OF PLANE FIGURES as an overall topic
Note:Only those courses with a sufficient number of respondents are included.7th = 7th-grade mathematics 8th = 8th-grade mathematicsP-Alg = Pre-AlgebraAlg = Algebra+/– = The value given under +/– is the confidence interval (CI) for the mean, at a confidence level of 95%. For example, for a mean of 3.27 with a CI of 0.09, there is a
95% probability that the actual mean for the population is within the range 3.27 plus or minus 0.09.. = This item was not asked at this grade level.
APPENDIX C: Statistical Details for Topics and Skills

Table C.2a
Statistical Details for Mathematics Topics and Skills by CourseMiddle School Responses Only (continued)
7thMean
7th +/–
8thMean
8th +/–
P-AlgMean
P-Alg +/–
AlgMean
Alg +/– Topics and Skills
Measurement3.52 0.07 3.29 0.10 3.34 0.11 2.61 0.15 Compute the area and perimeter of triangles and rectangles2.52 0.15 2.28 0.16 2.24 0.17 1.88 0.18 Estimate or calculate of length of a line segment based on other lengths given on a geometric figure2.76 0.14 2.82 0.14 2.96 0.14 2.44 0.16 Compute the perimeter of composite geometric figures with unknown side lengths
. . . . . . . . Compute the area and perimeter of polygons3.44 0.09 3.11 0.11 3.39 0.11 2.24 0.17 Compute the area and circumference of circles after identifying necessary information3.38 0.10 3.10 0.12 3.20 0.13 2.39 0.15 Compute the area and perimeter of polygons with known side lengths2.82 0.14 2.93 0.13 3.20 0.13 2.10 0.17 Compute volume and surface area (e.g., cylinders, prisms, cones, and pyramids)2.02 0.17 2.50 0.15 2.71 0.16 2.13 0.18 Compute the area and volume of composite geometric figures3.37 0.10 3.14 0.12 3.27 0.14 2.38 0.16 Use geometric formulas3.24 0.11 2.76 0.12 2.83 0.14 1.98 0.17 Understand how to read measurement tools (e.g., rulers and protractors)2.90 0.13 2.79 0.13 2.69 0.15 2.20 0.17 Use scale factors to determine the magnitude of a size change3.49 0.07 3.11 0.10 3.22 0.10 2.27 0.14 MEASUREMENT as an overall topic
Probability, Statistics, and Data Analysis3.67 0.06 3.27 0.10 3.31 0.09 2.95 0.13 Read and interpret graphs, charts, and other data representations3.11 0.12 3.12 0.11 2.91 0.13 2.69 0.15 Manipulate data from tables and graphs3.45 0.08 3.14 0.11 3.15 0.11 2.81 0.14 Perform computations on data from tables and graphs3.38 0.09 2.91 0.13 3.07 0.11 2.57 0.14 Represent data (e.g., circle graphs, scatterplots, and frequency distributions)0.75 0.12 1.19 0.16 1.05 0.17 1.58 0.17 Exhibit knowledge of correlation, variance, and standard deviation of data3.60 0.07 2.97 0.13 3.31 0.09 2.48 0.14 Find the median and mode3.29 0.11 3.00 0.14 3.22 0.11 2.54 0.14 Determine the probability of a simple event2.15 0.16 2.33 0.16 2.52 0.17 2.03 0.16 Use the relationship between the probability of an event and the probability of its complement2.09 0.16 2.46 0.16 2.46 0.16 2.08 0.17 Determine the probability of mutually exclusive, dependent, and independent events2.29 0.15 2.40 0.15 2.46 0.17 2.08 0.15 Exhibit knowledge of counting techniques
. . . . . . . . Exhibit knowledge of combinations, permutations, and the binomial theorem3.62 0.06 3.10 0.12 3.35 0.10 2.39 0.13 Calculate the average of a list of numbers2.63 0.14 2.59 0.15 2.85 0.14 2.34 0.14 Calculate a missing data value, given the average and all the missing data values but one3.43 0.09 2.84 0.13 3.17 0.11 2.40 0.13 Calculate the average, given the number of data values and the sum of the data values2.34 0.16 2.24 0.16 2.41 0.16 2.07 0.16 Calculate the average, given the frequency counts of all the data values0.76 0.13 1.02 0.15 1.15 0.16 1.66 0.18 Calculate or use a weighted average3.29 0.08 2.99 0.12 3.04 0.09 2.47 0.13 PROBABILITY, STATISTICS, AND DATA ANALYSIS as an overall topic
Functions2.37 0.17 2.65 0.14 2.42 0.17 3.25 0.14 Understand the concept of function1.42 0.16 1.97 0.16 1.91 0.19 3.05 0.16 Use function notation1.38 0.17 2.10 0.17 2.18 0.17 3.20 0.14 Find the domain and range of functions
. . . . . . . . Find domain, range, and inverses of functions1.87 0.17 2.64 0.16 2.28 0.19 3.47 0.12 Evaluate linear functions based on function notation0.27 0.07 1.36 0.17 0.72 0.16 3.21 0.16 Evaluate quadratic functions based on function notation0.24 0.07 0.78 0.14 0.56 0.14 2.67 0.19 Evaluate polynomial functions based on function notation0.20 0.06 0.49 0.12 0.37 0.11 1.81 0.20 Evaluate composite functions based on function notation0.33 0.08 0.75 0.13 0.93 0.17 1.28 0.19 Apply basic trigonometric ratios to solve right-triangle problems0.20 0.05 0.60 0.12 0.66 0.15 1.24 0.19 Use trigonometric concepts and basic identities to solve problems
. . . . . . . . Use the law of sines and law of cosines
. . . . . . . . Apply properties of trigonometric functions and their graphs, including amplitude, period, and phase shift
. . . . . . . . Use radian measure0.15 0.04 0.31 0.09 0.17 0.06 0.81 0.16 Exhibit knowledge of vectors in a plane1.12 0.14 1.83 0.14 1.65 0.17 2.98 0.14 FUNCTIONS as an overall topic
Note:Only those courses with a sufficient number of respondents are included.7th = 7th-grade mathematics 8th = 8th-grade mathematicsP-Alg = Pre-AlgebraAlg = Algebra+/– = The value given under +/– is the confidence interval (CI) for the mean, at a confidence level of 95%. For example, for a mean of 3.27 with a CI of 0.09, there is a
95% probability that the actual mean for the population is within the range 3.27 plus or minus 0.09.. = This item was not asked at this grade level.
50
APPENDIX C: Statistical Details for Topics and Skills

51
Table C.2b
Statistical Details for Mathematics Topics and Skills by CourseHigh School Responses Only
Alg 1Mean
Alg 1 +/–
Alg 2Mean
Alg 2 +/–
GeoMean
Geo +/–
P-CalMean
P-Cal +/– Topics and Skills
Process Skills2.68 0.12 2.61 0.09 2.43 0.10 2.69 0.13 Choose an appropriate method for calculating (e.g., mental, paper and pencil, calculator, or estimation)2.59 0.11 2.38 0.08 2.58 0.09 2.68 0.11 Estimate a reasonable result without using a calculator1.62 0.12 1.17 0.09 2.35 0.10 1.33 0.13 Demonstrate concepts using manipulatives2.47 0.10 2.47 0.08 3.47 0.07 2.96 0.12 Demonstrate concepts using pictorial representations3.50 0.07 3.33 0.06 3.32 0.06 3.64 0.07 Solve problems posed in real-world settings and interpret the solutions2.77 0.10 2.57 0.08 3.00 0.07 2.75 0.13 Recognize when essential information is missing3.66 0.05 3.57 0.05 3.49 0.06 3.66 0.07 Plan and carry out a strategy for solving multistep problems3.00 0.09 3.11 0.07 3.11 0.07 3.27 0.10 Recognize generalizations of mathematical ideas3.23 0.08 3.18 0.06 3.37 0.06 3.21 0.10 Recognize and use patterns to solve problems3.16 0.10 3.29 0.06 3.34 0.06 3.39 0.10 Apply mathematical ideas to new contexts2.60 0.12 2.62 0.08 2.94 0.09 2.73 0.13 Formulate new patterns or structures2.95 0.10 2.94 0.08 3.01 0.08 3.25 0.10 Solve several problems representing different aspects/components of one larger problem or scenario1.97 0.14 2.20 0.09 3.58 0.06 2.75 0.11 Understand roles of definitions, proof, and counterexamples3.62 0.06 3.46 0.06 3.59 0.05 3.48 0.09 Recall basic facts, definitions, formulas, and algebraic procedures as needed to solve a problem2.11 0.16 2.92 0.07 3.59 0.06 3.24 0.09 Recall theorems and more complex formulas when needed to solve a problem1.92 0.16 2.56 0.09 3.78 0.04 3.36 0.09 Apply theorems to solve a problem0.66 0.11 1.04 0.08 3.06 0.09 1.94 0.14 Construct and/or critique proofs, either informal or formal2.95 0.12 2.96 0.09 2.68 0.10 2.88 0.13 Perform basic operations with a calculator1.31 0.15 2.36 0.11 1.07 0.10 2.15 0.15 Use the statistical capabilities of a calculator2.14 0.17 3.37 0.07 1.44 0.11 3.61 0.08 Use the graphical capabilities of a calculator1.69 0.16 1.91 0.12 1.32 0.12 2.04 0.16 Use the symbolic algebra capabilities of a calculator0.59 0.09 0.53 0.07 0.61 0.08 0.85 0.12 Use spreadsheets0.52 0.11 0.66 0.08 1.79 0.14 1.25 0.15 Use dynamic geometry2.90 0.10 3.01 0.07 2.84 0.09 2.89 0.10 Solve routine problems quickly2.21 0.13 2.32 0.09 2.39 0.10 2.54 0.11 Solve novel problems quickly3.60 0.06 3.60 0.05 3.61 0.05 3.45 0.09 Use mathematical symbols correctly2.59 0.10 2.50 0.08 2.65 0.09 2.63 0.12 Understand new material from reading a textbook2.58 0.11 2.33 0.09 2.46 0.10 2.52 0.13 Work in a self-directed group3.13 0.09 3.12 0.06 3.10 0.08 3.20 0.10 PROCESS SKILLS as an overall topic
Basic Operations and Applications3.59 0.07 3.33 0.07 2.83 0.10 3.05 0.13 Perform addition, subtraction, multiplication, and division on signed rational numbers
. . . . . . . . Perform one-step computations with whole numbers and decimals3.56 0.06 3.08 0.07 3.56 0.05 2.96 0.12 Solve problems using ratios and proportions3.29 0.09 2.66 0.08 1.83 0.11 2.44 0.15 Solve problems involving percents (e.g., simple interest, tax, and markdowns)2.54 0.14 2.13 0.09 2.51 0.10 2.68 0.13 Convert units of measure3.32 0.10 2.84 0.09 2.78 0.09 2.43 0.14 Solve routine one-step arithmetic problems3.51 0.07 3.13 0.08 3.03 0.08 2.83 0.13 Solve routine two- or three-step arithmetic problems3.32 0.09 3.07 0.08 2.88 0.08 3.00 0.12 Solve nonroutine two- or three-step arithmetic problems2.84 0.12 2.52 0.10 2.72 0.09 2.78 0.12 Solve multistep arithmetic problems that involve planning or converting units of measure3.30 0.09 2.63 0.09 2.59 0.10 2.67 0.13 Solve word problems containing several rates, proportions, or percentages3.48 0.07 3.04 0.08 2.92 0.08 2.77 0.12 BASIC OPERATIONS AND APPLICATIONS as an overall topic
Numbers: Concepts and Properties. . . . . . . . Identify a digit's place
3.19 0.09 2.88 0.09 2.48 0.10 2.54 0.14 Exhibit knowledge of elementary number concepts (e.g., rounding, decimal ordering, pattern identification, absolute value, primes, and greatest common factor)
2.62 0.11 2.15 0.10 1.80 0.11 1.92 0.15 Order fractions. . . . . . . . Recognize one-digit factors of a number
2.71 0.11 2.61 0.09 1.74 0.11 2.25 0.14 Find and use the least common multiple. . . . . . . . Recognize equivalent fractions and fractions in lowest terms
3.20 0.08 3.38 0.06 3.30 0.06 2.96 0.11 Perform computations with squares and square roots of numbers1.94 0.14 3.24 0.06 1.97 0.12 2.96 0.11 Perform computations with cubes and cube roots of numbers3.44 0.08 3.73 0.04 2.00 0.10 3.45 0.08 Apply rules of exponents1.21 0.14 2.43 0.11 0.73 0.10 2.43 0.15 Perform matrix addition and multiplication1.74 0.14 2.50 0.10 1.49 0.12 2.87 0.13 Exhibit knowledge of series and sequences (e.g., arithmetic and geometric)1.41 0.13 1.86 0.10 1.47 0.11 2.07 0.15 Find union and intersection of sets2.66 0.12 3.29 0.06 2.08 0.11 3.08 0.10 Apply properties of rational and irrational numbers0.82 0.14 3.32 0.07 0.59 0.09 3.29 0.11 Exhibit knowledge of complex numbers0.84 0.14 3.30 0.07 0.57 0.09 3.32 0.10 Apply properties of complex numbers2.88 0.12 3.15 0.07 1.93 0.11 2.93 0.12 Apply number properties involving multiples and factors2.60 0.12 2.19 0.09 1.33 0.11 2.04 0.15 Use scientific notation2.66 0.12 3.21 0.07 1.74 0.11 3.25 0.10 Determine when an expression is undefined0.49 0.10 2.97 0.09 0.93 0.11 3.52 0.07 Exhibit knowledge of logarithms and geometric sequences3.04 0.09 3.45 0.05 2.09 0.09 3.19 0.09 NUMBERS: CONCEPTS AND PROPERTIES as an overall topic
Note:Only those courses with a sufficient number of respondents are included.Alg 1 = Algebra 1Alg 2 = Algebra 2Geo = GeometryP-Cal = Pre-Calculus+/– = The value given under +/– is the confidence interval (CI) for the mean, at a confidence level of 95%. For example, for a mean of 3.27 with a CI of 0.09, there is a
95% probability that the actual mean for the population is within the range 3.27 plus or minus 0.09.. = This item was not asked at this grade level.
APPENDIX C: Statistical Details for Topics and Skills

Table C.2b
Statistical Details for Mathematics Topics and Skills by CourseHigh School Responses Only (continued)
Alg 1Mean
Alg 1 +/–
Alg 2Mean
Alg 2 +/–
GeoMean
Geo +/–
P-CalMean
P-Cal +/– Topics and Skills
Expressions, Equations, and Inequalities3.63 0.06 3.05 0.08 2.70 0.10 2.51 0.13 Evaluate algebraic expressions by substituting integers for unknown quantities
. . . . . . . . Exhibit knowledge of basic expressions3.79 0.04 3.15 0.07 2.79 0.09 2.61 0.14 Add and subtract simple algebraic expressions
. . . . . . . . Combine like terms3.75 0.05 3.23 0.07 3.02 0.08 2.73 0.13 Solve routine first-degree equations3.81 0.04 3.39 0.06 2.86 0.09 2.85 0.13 Solve linear equations and inequalities in one variable
. . . . . . . . Substitute whole numbers for unknown quantities3.68 0.06 3.28 0.07 2.98 0.10 3.01 0.11 Perform word-to-symbol translations3.69 0.06 3.30 0.06 2.59 0.11 3.02 0.12 Write expressions, equations, or inequalities for common settings
. . . . . . . . Solve one-step equations having integer or decimal values3.47 0.09 3.53 0.05 1.97 0.10 3.12 0.10 Multiply two binomials2.96 0.12 3.26 0.07 1.25 0.11 2.86 0.12 Solve absolute value equations and inequalities3.50 0.09 3.64 0.04 1.82 0.11 3.20 0.10 Add, subtract, and multiply polynomials3.14 0.14 3.72 0.04 1.76 0.11 3.35 0.09 Factor quadratics3.02 0.14 3.84 0.03 1.87 0.12 3.49 0.08 Solve quadratic equations
. . . . . . . . Apply properties of exponential functions1.53 0.17 2.97 0.10 0.78 0.10 3.07 0.12 Solve quadratic inequalities1.69 0.16 2.98 0.08 0.60 0.09 2.79 0.12 Use the discriminant2.04 0.17 3.56 0.06 1.04 0.11 3.51 0.09 Determine solutions of polynomial and rational equations0.73 0.13 2.75 0.10 0.46 0.08 3.31 0.11 Implement remainder and factor theorems for polynomials0.72 0.12 3.17 0.09 0.48 0.09 3.73 0.05 Apply properties of logarithmic and exponential functions3.45 0.09 3.59 0.05 1.80 0.12 3.27 0.11 Find solutions to systems of linear equations
. . . . . . . . Solve problems using equations of parabolas and circles0.81 0.13 2.60 0.11 1.24 0.12 3.29 0.11 Solve problems using equations of parabolas, circles, ellipses, and hyperbolas0.39 0.09 1.09 0.11 0.45 0.08 2.38 0.17 Solve problems using parametric equations1.83 0.17 2.98 0.09 1.21 0.12 3.48 0.08 Transform functions algebraically0.39 0.10 1.05 0.11 0.44 0.08 2.63 0.16 Find the limit of an expression3.51 0.08 3.68 0.04 2.12 0.10 3.45 0.08 EXPRESSIONS, EQUATIONS, AND INEQUALITIES as an overall topic
Graphical Representations2.87 0.13 2.33 0.10 3.02 0.09 2.12 0.16 Comprehend the concept of length on the number line
. . . . . . . . Locate points on the number line and in the first quadrant3.12 0.11 2.46 0.10 2.72 0.11 2.19 0.16 Locate points on the number line3.56 0.07 2.94 0.08 3.26 0.07 2.77 0.13 Locate points in the coordinate plane3.76 0.06 3.37 0.06 3.32 0.08 3.04 0.10 Exhibit knowledge of slope3.82 0.05 3.38 0.06 3.29 0.07 3.02 0.11 Find the slope of a line3.44 0.08 2.89 0.09 2.40 0.12 2.39 0.15 Identify graphs on a number line3.73 0.06 3.25 0.07 2.36 0.12 2.74 0.13 Match linear graphs with their equations3.17 0.12 3.21 0.07 3.71 0.05 2.83 0.12 Use properties of parallel and perpendicular lines3.28 0.10 3.38 0.06 1.67 0.12 2.94 0.12 Solve systems of equations and inequalities graphically
. . . . . . . . Recognize special characteristics of parabolas and circles0.90 0.13 2.67 0.11 1.33 0.13 3.29 0.11 Recognize special characteristics of parabolas, circles, ellipses, and hyperbolas3.34 0.09 3.35 0.06 2.50 0.11 3.37 0.10 Interpret and use information from graphs in the coordinate plane2.73 0.14 3.34 0.06 1.86 0.13 3.43 0.09 Identify characteristics of graphs based on a set of conditions or on a general equation0.76 0.14 3.01 0.09 0.76 0.10 3.67 0.07 Understand the properties of graphs of rational functions (e.g., asymptotes)2.33 0.16 2.61 0.09 3.51 0.06 2.59 0.12 Find midpoints2.52 0.15 2.79 0.09 3.56 0.06 2.82 0.12 Use the distance formula0.59 0.12 2.33 0.11 0.59 0.09 3.19 0.10 Work with discontinuous graphs and piecewise-defined functions3.48 0.07 3.42 0.05 2.96 0.08 3.29 0.09 GRAPHICAL REPRESENTATIONS as an overall topic
Properties of Plane Figures0.59 0.13 1.12 0.10 3.95 0.02 1.85 0.16 Find the measure of an angle using properties of parallel lines
. . . . . . . . Exhibit some knowledge of angles associated with parallel lines1.06 0.14 1.56 0.10 3.95 0.02 2.67 0.13 Exhibit knowledge of basic angle properties and special sums of angle measures
(e.g., 90°, 180°, and 360°)2.56 0.14 2.49 0.10 3.99 0.01 3.24 0.10 Use the Pythagorean theorem0.76 0.13 1.24 0.09 3.95 0.02 1.71 0.14 Apply properties of lines, segments, and rays0.71 0.13 1.20 0.09 3.94 0.02 1.81 0.15 Apply properties of special quadrilaterals0.71 0.13 1.78 0.11 3.96 0.02 3.31 0.10 Apply properties of 30°-60°-90°, isosceles, similar, and congruent triangles0.41 0.11 1.22 0.10 3.82 0.04 2.71 0.15 Use relationships among angles, arcs, and distances in a circle0.44 0.10 0.88 0.09 3.52 0.08 1.42 0.15 Use logical relationships to answer problems (e.g., converse, contrapositive, and if-then)0.49 0.11 0.80 0.09 2.80 0.13 1.60 0.16 Prove results by mathematical induction0.82 0.12 1.38 0.09 3.93 0.02 2.44 0.13 PROPERTIES OF PLANE FIGURES as an overall topic
Note:Only those courses with a sufficient number of respondents are included.Alg 1 = Algebra 1Alg 2 = Algebra 2Geo = GeometryP-Cal = Pre-Calculus+/– = The value given under +/– is the confidence interval (CI) for the mean, at a confidence level of 95%. For example, for a mean of 3.27 with a CI of 0.09, there is a
95% probability that the actual mean for the population is within the range 3.27 plus or minus 0.09.. = This item was not asked at this grade level.
52
APPENDIX C: Statistical Details for Topics and Skills

53
Table C.2b
Statistical Details for Mathematics Topics and Skills by CourseHigh School Responses Only (continued)
Alg 1Mean
Alg 1 +/–
Alg 2Mean
Alg 2 +/–
GeoMean
Geo +/–
P-CalMean
P-Cal +/– Topics and Skills
Measurement2.33 0.13 1.81 0.09 3.81 0.04 2.08 0.14 Compute the area and perimeter of triangles and rectangles
. . . . . . . . Estimate or calculate of length of a line segment based on other lengths given on a geometric figure1.85 0.15 1.35 0.10 3.61 0.07 1.75 0.14 Compute the perimeter of composite geometric figures with unknown side lengths
. . . . . . . . Compute the area and perimeter of polygons1.68 0.15 1.64 0.10 3.83 0.04 2.11 0.13 Compute the area and circumference of circles after identifying necessary information1.79 0.15 1.47 0.10 3.81 0.04 1.83 0.14 Compute the area and perimeter of polygons with known side lengths1.47 0.15 1.46 0.10 3.74 0.05 1.94 0.16 Compute volume and surface area (e.g., cylinders, prisms, cones, and pyramids)1.28 0.15 1.28 0.10 3.56 0.08 1.65 0.15 Compute the area and volume of composite geometric figures1.74 0.16 1.82 0.09 3.89 0.03 2.23 0.14 Use geometric formulas1.60 0.15 1.29 0.10 3.50 0.07 1.70 0.15 Understand how to read measurement tools (e.g., rulers and protractors)1.65 0.16 1.43 0.10 3.52 0.07 1.71 0.14 Use scale factors to determine the magnitude of a size change1.79 0.14 1.54 0.09 3.80 0.04 1.89 0.13 MEASUREMENT as an overall topic
Probability, Statistics, and Data Analysis3.08 0.11 2.54 0.09 1.52 0.11 2.33 0.17 Read and interpret graphs, charts, and other data representations2.56 0.14 2.33 0.09 1.10 0.11 2.19 0.16 Manipulate data from tables and graphs2.89 0.12 2.46 0.09 1.28 0.10 2.27 0.17 Perform computations on data from tables and graphs2.45 0.14 2.10 0.10 0.97 0.10 1.79 0.17 Represent data (e.g., circle graphs, scatterplots, and frequency distributions)0.98 0.15 1.66 0.11 0.43 0.07 1.57 0.17 Exhibit knowledge of correlation, variance, and standard deviation of data2.67 0.13 1.98 0.10 0.90 0.10 1.53 0.15 Find the median and mode2.58 0.14 2.04 0.11 1.34 0.11 1.80 0.15 Determine the probability of a simple event
. . . . . . . . Use the relationship between the probability of an event and the probability of its complement1.69 0.16 1.87 0.11 0.79 0.10 1.77 0.16 Determine the probability of mutually exclusive, dependent, and independent events1.58 0.15 1.83 0.11 0.74 0.10 1.88 0.17 Exhibit knowledge of counting techniques1.06 0.15 1.91 0.11 0.51 0.08 2.25 0.17 Exhibit knowledge of combinations, permutations, and the binomial theorem2.67 0.13 2.09 0.10 1.28 0.11 1.70 0.16 Calculate the average of a list of numbers2.23 0.15 1.80 0.10 0.81 0.09 1.34 0.15 Calculate a missing data value, given the average and all the missing data values but one
. . . . . . . . Calculate the average, given the number of data values and the sum of the data values1.65 0.16 1.58 0.10 0.62 0.09 1.29 0.15 Calculate the average, given the frequency counts of all the data values1.28 0.16 1.25 0.10 0.54 0.08 1.20 0.15 Calculate or use a weighted average2.25 0.14 2.01 0.10 0.87 0.09 1.78 0.16 PROBABILITY, STATISTICS, AND DATA ANALYSIS as an overall topic
Functions3.30 0.10 3.67 0.05 1.22 0.11 3.70 0.07 Understand the concept of function
. . . . . . . . Use function notation
. . . . . . . . Find the domain and range of functions2.78 0.13 3.58 0.05 0.81 0.10 3.80 0.05 Find domain, range, and inverses of functions3.30 0.12 3.63 0.05 1.38 0.13 3.55 0.09 Evaluate linear functions based on function notation2.45 0.17 3.74 0.04 1.04 0.12 3.68 0.07 Evaluate quadratic functions based on function notation1.52 0.17 3.56 0.06 0.65 0.10 3.72 0.06 Evaluate polynomial functions based on function notation0.62 0.12 3.22 0.08 0.42 0.07 3.66 0.07 Evaluate composite functions based on function notation0.88 0.14 2.08 0.12 3.61 0.07 3.79 0.07 Apply basic trigonometric ratios to solve right-triangle problems0.61 0.12 1.86 0.13 2.91 0.13 3.79 0.06 Use trigonometric concepts and basic identities to solve problems0.42 0.10 1.70 0.13 1.89 0.14 3.73 0.07 Use the law of sines and law of cosines0.26 0.08 1.24 0.12 0.49 0.08 3.78 0.07 Apply properties of trigonometric functions and their graphs, including amplitude, period, and phase shift0.24 0.08 1.46 0.12 0.52 0.09 3.76 0.06 Use radian measure0.17 0.06 0.66 0.09 1.24 0.12 3.00 0.16 Exhibit knowledge of vectors in a plane2.07 0.15 3.27 0.08 1.48 0.11 3.80 0.06 FUNCTIONS as an overall topic
Note:Only those courses with a sufficient number of respondents are included.Alg 1 = Algebra 1Alg 2 = Algebra 2Geo = GeometryP-Cal = Pre-Calculus+/– = The value given under +/– is the confidence interval (CI) for the mean, at a confidence level of 95%. For example, for a mean of 3.27 with a CI of 0.09, there is a
95% probability that the actual mean for the population is within the range 3.27 plus or minus 0.09.. = This item was not asked at this grade level.
APPENDIX C: Statistical Details for Topics and Skills

Table C.2c
Statistical Details for Mathematics Topics and Skills by CoursePostsecondary Responses Only
ProbMean
Prob+/–
AlgMean
Alg +/–
P-CalMean
P-Cal +/–
CalcMean
Calc +/– Topics and Skills
Process Skills3.06 0.12 2.92 0.09 2.97 0.13 2.91 0.09 Choose an appropriate method for calculating (e.g., mental, paper and pencil, calculator, or estimation)2.81 0.11 2.87 0.07 2.85 0.11 2.84 0.07 Estimate a reasonable result without using a calculator1.54 0.16 1.34 0.10 1.51 0.16 1.48 0.10 Demonstrate concepts using manipulatives2.71 0.14 2.28 0.09 2.50 0.13 2.76 0.08 Demonstrate concepts using pictorial representations3.41 0.11 3.10 0.07 3.08 0.10 3.23 0.06 Solve problems posed in real-world settings and interpret the solutions3.13 0.10 2.73 0.08 3.00 0.11 2.89 0.08 Recognize when essential information is missing3.40 0.09 3.34 0.06 3.40 0.09 3.54 0.05 Plan and carry out a strategy for solving multistep problems2.75 0.11 2.84 0.08 3.07 0.10 3.02 0.07 Recognize generalizations of mathematical ideas2.78 0.12 2.99 0.07 3.23 0.09 3.07 0.07 Recognize and use patterns to solve problems3.15 0.10 3.01 0.06 3.19 0.09 3.11 0.06 Apply mathematical ideas to new contexts2.17 0.13 2.24 0.08 2.38 0.11 2.38 0.08 Formulate new patterns or structures2.65 0.13 2.51 0.08 2.78 0.12 2.67 0.07 Solve several problems representing different aspects/components of one larger problem or scenario2.38 0.14 2.11 0.09 2.56 0.12 2.91 0.08 Understand roles of definitions, proof, and counterexamples3.13 0.12 3.56 0.05 3.56 0.09 3.62 0.04 Recall basic facts, definitions, formulas, and algebraic procedures as needed to solve a problem2.03 0.14 2.36 0.08 2.56 0.12 3.07 0.06 Recall theorems and more complex formulas when needed to solve a problem2.29 0.15 2.41 0.09 2.88 0.12 3.15 0.07 Apply theorems to solve a problem0.97 0.12 1.04 0.08 1.41 0.13 1.79 0.08 Construct and/or critique proofs, either informal or formal3.74 0.07 3.29 0.08 3.30 0.13 2.67 0.10 Perform basic operations with a calculator2.63 0.17 1.12 0.09 1.12 0.13 0.70 0.07 Use the statistical capabilities of a calculator2.00 0.17 2.23 0.11 2.62 0.15 2.29 0.12 Use the graphical capabilities of a calculator1.01 0.16 1.26 0.11 1.23 0.14 0.96 0.09 Use the symbolic algebra capabilities of a calculator1.56 0.16 0.72 0.08 0.71 0.11 0.59 0.07 Use spreadsheets0.38 0.08 0.60 0.07 0.82 0.12 0.71 0.08 Use dynamic geometry2.71 0.15 3.10 0.07 3.13 0.10 3.05 0.08 Solve routine problems quickly1.71 0.14 1.91 0.08 1.99 0.13 1.94 0.07 Solve novel problems quickly3.26 0.10 3.54 0.06 3.47 0.09 3.62 0.04 Use mathematical symbols correctly2.86 0.11 2.47 0.07 2.59 0.10 2.66 0.07 Understand new material from reading a textbook2.17 0.16 2.08 0.10 2.04 0.14 1.92 0.09 Work in a self-directed group3.07 0.07 2.99 0.06 3.15 0.08 3.09 0.06 PROCESS SKILLS as an overall topic
Basic Operations and Applications3.33 0.14 3.89 0.03 3.92 0.04 3.86 0.03 Perform addition, subtraction, multiplication, and division on signed rational numbers
. . . . . . . . Perform one-step computations with whole numbers and decimals3.15 0.13 3.36 0.06 3.41 0.10 3.36 0.07 Solve problems using ratios and proportions3.27 0.12 3.28 0.07 2.95 0.13 2.67 0.10 Solve problems involving percents (e.g., simple interest, tax, and markdowns)1.90 0.16 2.68 0.09 2.70 0.12 2.63 0.09 Convert units of measure
. . . . . . . . Solve routine one-step arithmetic problems3.18 0.13 3.61 0.05 3.62 0.08 3.63 0.06 Solve routine two- or three-step arithmetic problems
. . . . . . . . Solve nonroutine two- or three-step arithmetic problems2.44 0.15 3.03 0.07 3.15 0.09 3.38 0.06 Solve multistep arithmetic problems that involve planning or converting units of measure1.89 0.15 2.45 0.09 2.66 0.10 2.71 0.09 Solve word problems containing several rates, proportions, or percentages2.82 0.15 2.76 0.08 2.68 0.12 2.94 0.08 BASIC OPERATIONS AND APPLICATIONS as an overall topic
Numbers: Concepts and Properties. . . . . . . . Identify a digit's place
3.14 0.13 3.59 0.06 3.45 0.09 3.29 0.07 Exhibit knowledge of elementary number concepts (e.g., rounding, decimal ordering, pattern identification, absolute value, primes, and greatest common factor)
2.22 0.17 3.12 0.08 3.11 0.12 3.04 0.08 Order fractions. . . . . . . . Recognize one-digit factors of a number
1.38 0.16 3.34 0.07 2.99 0.12 2.62 0.10 Find and use the least common multiple. . . . . . . . Recognize equivalent fractions and fractions in lowest terms
2.88 0.15 3.47 0.06 3.44 0.09 3.50 0.07 Perform computations with squares and square roots of numbers1.08 0.14 3.00 0.08 2.88 0.11 3.24 0.08 Perform computations with cubes and cube roots of numbers2.03 0.17 3.56 0.06 3.70 0.06 3.84 0.04 Apply rules of exponents0.50 0.10 1.09 0.10 0.95 0.12 1.15 0.10 Perform matrix addition and multiplication0.76 0.13 1.06 0.09 1.14 0.13 1.87 0.10 Exhibit knowledge of series and sequences (e.g., arithmetic and geometric)2.29 0.17 1.70 0.10 1.59 0.14 1.67 0.10 Find union and intersection of sets1.28 0.15 2.81 0.09 2.79 0.15 2.73 0.10 Apply properties of rational and irrational numbers0.42 0.10 1.94 0.10 1.82 0.16 1.53 0.11 Exhibit knowledge of complex numbers0.38 0.10 1.87 0.10 1.68 0.16 1.32 0.10 Apply properties of complex numbers1.36 0.15 3.16 0.07 2.82 0.12 2.82 0.09 Apply number properties involving multiples and factors2.03 0.17 2.37 0.10 2.16 0.15 1.92 0.10 Use scientific notation1.72 0.16 3.20 0.07 3.47 0.09 3.47 0.06 Determine when an expression is undefined0.76 0.14 1.70 0.10 2.04 0.17 2.99 0.08 Exhibit knowledge of logarithms and geometric sequences2.03 0.13 3.16 0.06 3.13 0.10 3.21 0.06 NUMBERS: CONCEPTS AND PROPERTIES as an overall topic
Note:Only those courses with a sufficient number of respondents are included.Prob = Probability and Statistics Alg = AlgebraP-Cal = Pre-CalculusCalc = Calculus+/– = The value given under +/– is the confidence interval (CI) for the mean, at a confidence level of 95%. For example, for a mean of 3.27 with a CI of 0.09, there is a
95% probability that the actual mean for the population is within the range 3.27 plus or minus 0.09.. = This item was not asked at this grade level.
54
APPENDIX C: Statistical Details for Topics and Skills

55
Table C.2c
Statistical Details for Mathematics Topics and Skills by CoursePostsecondary Responses Only (continued)
ProbMean
Prob+/–
AlgMean
Alg +/–
P-CalMean
P-Cal +/–
CalcMean
Calc +/– Topics and Skills
Expressions, Equations, and Inequalities3.15 0.14 3.61 0.06 3.62 0.10 3.68 0.06 Evaluate algebraic expressions by substituting integers for unknown quantities
. . . . . . . . Exhibit knowledge of basic expressions2.68 0.17 3.72 0.04 3.85 0.05 3.84 0.04 Add and subtract simple algebraic expressions
. . . . . . . . Combine like terms2.89 0.17 3.75 0.05 3.89 0.04 3.84 0.04 Solve routine first-degree equations2.41 0.18 3.61 0.06 3.78 0.06 3.77 0.05 Solve linear equations and inequalities in one variable
. . . . . . . . Substitute whole numbers for unknown quantities3.10 0.14 3.41 0.06 3.44 0.09 3.65 0.05 Perform word-to-symbol translations2.66 0.17 3.40 0.06 3.42 0.09 3.64 0.05 Write expressions, equations, or inequalities for common settings
. . . . . . . . Solve one-step equations having integer or decimal values1.22 0.15 3.53 0.06 3.49 0.11 3.76 0.05 Multiply two binomials1.27 0.16 2.60 0.09 2.58 0.13 3.22 0.07 Solve absolute value equations and inequalities1.00 0.15 3.39 0.08 3.60 0.09 3.73 0.05 Add, subtract, and multiply polynomials0.73 0.12 3.37 0.08 3.64 0.09 3.67 0.05 Factor quadratics0.86 0.14 3.16 0.09 3.65 0.08 3.73 0.05 Solve quadratic equations
. . . . . . . . Apply properties of exponential functions0.60 0.11 2.13 0.10 2.38 0.13 2.89 0.09 Solve quadratic inequalities0.50 0.10 1.86 0.10 2.10 0.14 2.41 0.10 Use the discriminant0.78 0.13 2.20 0.10 2.74 0.14 3.36 0.07 Determine solutions of polynomial and rational equations0.51 0.11 1.53 0.10 1.79 0.14 2.24 0.09 Implement remainder and factor theorems for polynomials0.85 0.14 1.80 0.11 2.22 0.17 3.48 0.07 Apply properties of logarithmic and exponential functions0.73 0.13 2.40 0.11 2.34 0.17 2.71 0.09 Find solutions to systems of linear equations
. . . . . . . . Solve problems using equations of parabolas and circles0.42 0.09 1.40 0.10 1.48 0.13 2.55 0.09 Solve problems using equations of parabolas, circles, ellipses, and hyperbolas0.48 0.10 0.85 0.09 0.84 0.12 1.85 0.11 Solve problems using parametric equations1.04 0.14 1.91 0.11 2.16 0.15 3.16 0.08 Transform functions algebraically0.64 0.12 0.71 0.08 0.82 0.13 2.53 0.11 Find the limit of an expression1.75 0.13 3.12 0.08 3.27 0.09 3.71 0.04 EXPRESSIONS, EQUATIONS, AND INEQUALITIES as an overall topic
Graphical Representations2.92 0.16 3.56 0.06 3.56 0.09 3.55 0.07 Comprehend the concept of length on the number line
. . . . . . . . Locate points on the number line and in the first quadrant
. . . . . . . . Locate points on the number line2.97 0.15 3.69 0.05 3.84 0.06 3.81 0.04 Locate points in the coordinate plane3.04 0.15 3.49 0.07 3.66 0.07 3.89 0.03 Exhibit knowledge of slope2.74 0.17 3.45 0.07 3.66 0.07 3.85 0.04 Find the slope of a line2.32 0.19 3.21 0.08 3.44 0.10 3.37 0.08 Identify graphs on a number line2.22 0.19 3.09 0.08 3.29 0.10 3.54 0.07 Match linear graphs with their equations1.15 0.16 2.83 0.09 2.92 0.12 3.16 0.08 Use properties of parallel and perpendicular lines0.79 0.13 2.18 0.10 2.25 0.16 2.51 0.10 Solve systems of equations and inequalities graphically
. . . . . . . . Recognize special characteristics of parabolas and circles0.47 0.09 1.41 0.10 1.48 0.14 2.45 0.09 Recognize special characteristics of parabolas, circles, ellipses, and hyperbolas2.74 0.16 2.80 0.10 3.08 0.11 3.56 0.06 Interpret and use information from graphs in the coordinate plane1.81 0.18 2.22 0.10 2.69 0.14 3.21 0.07 Identify characteristics of graphs based on a set of conditions or on a general equation0.93 0.15 1.70 0.10 2.34 0.16 3.25 0.07 Understand the properties of graphs of rational functions (e.g., asymptotes)1.62 0.18 2.27 0.10 2.47 0.15 2.55 0.10 Find midpoints1.10 0.16 2.45 0.10 2.60 0.15 3.05 0.08 Use the distance formula1.04 0.16 1.65 0.10 2.18 0.15 3.13 0.08 Work with discontinuous graphs and piecewise-defined functions2.45 0.14 2.99 0.08 3.23 0.09 3.60 0.05 GRAPHICAL REPRESENTATIONS as an overall topic
Properties of Plane Figures0.40 0.09 1.25 0.11 1.68 0.16 1.88 0.11 Find the measure of an angle using properties of parallel lines
. . . . . . . . Exhibit some knowledge of angles associated with parallel lines0.61 0.12 1.78 0.11 2.78 0.15 2.88 0.10 Exhibit knowledge of basic angle properties and special sums of angle measures
(e.g., 90°, 180°, and 360°)0.78 0.14 3.02 0.09 3.52 0.10 3.65 0.05 Use the Pythagorean theorem0.68 0.12 1.47 0.10 2.05 0.15 2.33 0.10 Apply properties of lines, segments, and rays0.43 0.10 1.24 0.10 1.44 0.15 1.74 0.10 Apply properties of special quadrilaterals0.49 0.11 1.33 0.11 2.51 0.16 2.93 0.09 Apply properties of 30°-60°-90°, isosceles, similar, and congruent triangles0.50 0.10 1.06 0.10 2.08 0.16 2.28 0.10 Use relationships among angles, arcs, and distances in a circle1.06 0.16 1.01 0.09 1.42 0.14 2.26 0.11 Use logical relationships to answer problems (e.g., converse, contrapositive, and if-then)0.53 0.11 0.67 0.08 0.88 0.12 1.31 0.10 Prove results by mathematical induction0.64 0.11 1.49 0.09 2.32 0.13 2.59 0.08 PROPERTIES OF PLANE FIGURES as an overall topic
Note:Only those courses with a sufficient number of respondents are included.Prob = Probability and Statistics Alg = AlgebraP-Cal = Pre-CalculusCalc = Calculus+/– = The value given under +/– is the confidence interval (CI) for the mean, at a confidence level of 95%. For example, for a mean of 3.27 with a CI of 0.09, there is a
95% probability that the actual mean for the population is within the range 3.27 plus or minus 0.09.. = This item was not asked at this grade level.
APPENDIX C: Statistical Details for Topics and Skills

Table C.2c
Statistical Details for Mathematics Topics and Skills by CoursePostsecondary Responses Only (continued)
ProbMean
Prob+/–
AlgMean
Alg +/–
P-CalMean
P-Cal +/–
CalcMean
Calc +/– Topics and Skills
Measurement0.97 0.14 2.94 0.10 2.77 0.15 3.35 0.08 Compute the area and perimeter of triangles and rectangles
. . . . . . . . Estimate or calculate of length of a line segment based on other lengths given on a geometric figure0.49 0.11 2.06 0.11 1.93 0.15 2.36 0.10 Compute the perimeter of composite geometric figures with unknown side lengths0.54 0.12 1.88 0.11 1.73 0.15 2.36 0.10 Compute the area and perimeter of polygons0.56 0.12 2.39 0.11 2.67 0.14 3.35 0.07 Compute the area and circumference of circles after identifying necessary information
. . . . . . . . Compute the area and perimeter of polygons with known side lengths0.49 0.11 1.70 0.10 1.84 0.15 2.78 0.08 Compute volume and surface area (e.g., cylinders, prisms, cones, and pyramids)0.49 0.11 1.53 0.10 1.42 0.13 2.19 0.10 Compute the area and volume of composite geometric figures0.64 0.12 2.38 0.10 2.47 0.14 3.12 0.08 Use geometric formulas0.89 0.16 1.70 0.12 1.77 0.16 1.63 0.11 Understand how to read measurement tools (e.g., rulers and protractors)0.76 0.14 1.51 0.11 1.47 0.15 1.62 0.10 Use scale factors to determine the magnitude of a size change0.64 0.12 2.03 0.10 2.18 0.12 2.75 0.08 MEASUREMENT as an overall topic
Probability, Statistics, and Data Analysis3.51 0.11 2.53 0.11 2.43 0.17 2.35 0.11 Read and interpret graphs, charts, and other data representations3.45 0.14 1.61 0.15 2.00 0.21 1.77 0.14 Manipulate data from tables and graphs
. . . . . . . . Perform computations on data from tables and graphs3.11 0.15 1.34 0.11 1.29 0.16 0.85 0.08 Represent data (e.g., circle graphs, scatterplots, and frequency distributions)2.74 0.18 0.73 0.09 0.67 0.11 0.53 0.07 Exhibit knowledge of correlation, variance, and standard deviation of data3.03 0.16 1.17 0.11 1.00 0.15 0.68 0.08 Find the median and mode2.78 0.18 0.83 0.09 0.74 0.12 0.62 0.08 Determine the probability of a simple event
. . . . . . . . Use the relationship between the probability of an event and the probability of its complement2.53 0.18 0.71 0.08 0.61 0.11 0.51 0.07 Determine the probability of mutually exclusive, dependent, and independent events2.40 0.18 0.93 0.09 0.86 0.13 0.88 0.08 Exhibit knowledge of counting techniques2.14 0.19 0.84 0.09 0.81 0.12 0.98 0.09 Exhibit knowledge of combinations, permutations, and the binomial theorem3.32 0.14 2.29 0.13 2.00 0.18 1.75 0.12 Calculate the average of a list of numbers2.19 0.18 1.64 0.12 1.32 0.16 0.88 0.10 Calculate a missing data value, given the average and all the missing data values but one
. . . . . . . . Calculate the average, given the number of data values and the sum of the data values2.55 0.18 1.01 0.10 1.03 0.14 0.78 0.09 Calculate the average, given the frequency counts of all the data values2.23 0.18 1.03 0.10 1.11 0.15 0.80 0.08 Calculate or use a weighted average2.93 0.16 1.25 0.10 1.15 0.13 0.95 0.09 PROBABILITY, STATISTICS, AND DATA ANALYSIS as an overall topic
Functions2.25 0.17 2.89 0.10 3.24 0.13 3.90 0.02 Understand the concept of function
. . . . . . . . Use function notation
. . . . . . . . Find the domain and range of functions1.21 0.15 2.47 0.11 2.78 0.14 3.67 0.05 Find domain, range, and inverses of functions2.24 0.17 2.87 0.11 3.26 0.13 3.90 0.03 Evaluate linear functions based on function notation0.96 0.14 2.72 0.11 3.24 0.13 3.90 0.03 Evaluate quadratic functions based on function notation0.73 0.13 2.41 0.11 2.92 0.14 3.85 0.03 Evaluate polynomial functions based on function notation0.72 0.12 2.02 0.11 2.53 0.16 3.76 0.04 Evaluate composite functions based on function notation0.46 0.11 0.82 0.09 2.15 0.18 3.43 0.07 Apply basic trigonometric ratios to solve right-triangle problems0.44 0.10 0.75 0.09 2.04 0.18 3.42 0.07 Use trigonometric concepts and basic identities to solve problems0.39 0.10 0.61 0.08 1.64 0.18 2.36 0.10 Use the law of sines and law of cosines0.41 0.10 0.60 0.08 1.63 0.17 2.76 0.09 Apply properties of trigonometric functions and their graphs, including amplitude, period, and
phase shift0.41 0.09 0.61 0.08 1.97 0.18 3.60 0.07 Use radian measure0.42 0.10 0.56 0.08 1.03 0.14 1.69 0.11 Exhibit knowledge of vectors in a plane1.11 0.12 2.16 0.10 2.78 0.13 3.79 0.03 FUNCTIONS as an overall topic
Note:Only those courses with a sufficient number of respondents are included.Prob = Probability and Statistics Alg = AlgebraP-Cal = Pre-CalculusCalc = Calculus+/– = The value given under +/– is the confidence interval (CI) for the mean, at a confidence level of 95%. For example, for a mean of 3.27 with a CI of 0.09, there is a
95% probability that the actual mean for the population is within the range 3.27 plus or minus 0.09.. = This item was not asked at this grade level.
56
APPENDIX C: Statistical Details for Topics and Skills

57
Table C.3
Statistical Details for Reading Topics and Skills
MSMean
MS +/–
HSMean
HS +/–
PSMean
PS +/– Topics and Skills
Content. . 2.17 0.14 1.26 0.13 Read/view and demonstrate understanding of poetry
2.24 0.13 2.28 0.15 1.15 0.12 Read/view and demonstrate understanding of drama3.75 0.07 2.88 0.14 1.97 0.14 Read/view and demonstrate understanding of novels and short stories2.38 0.15 1.37 0.15 1.89 0.14 Read/view and demonstrate understanding of nonfiction trade books3.09 0.12 3.17 0.11 3.16 0.11 Read/view and demonstrate understanding of textbooks2.35 0.15 2.58 0.14 2.35 0.13 Read/view and demonstrate understanding of research studies2.34 0.13 2.82 0.12 2.76 0.12 Read/view and demonstrate understanding of primary sources2.56 0.12 2.54 0.12 2.51 0.13 Read/view and demonstrate understanding of news and feature articles, editorials/opinion pieces1.84 0.14 1.43 0.13 1.36 0.13 Read/view and demonstrate understanding of advertisements1.45 0.13 1.90 0.12 1.74 0.12 Read/view and demonstrate understanding of film and television2.12 0.14 2.27 0.13 1.85 0.12 Read/view and demonstrate understanding of multimedia presentations2.26 0.14 1.75 0.14 1.41 0.12 Read/view and demonstrate understanding of functional text2.40 0.13 2.23 0.14 1.62 0.13 Read/view and demonstrate understanding of graphs, charts, and diagrams1.86 0.15 1.51 0.14 1.40 0.13 Read/view and demonstrate understanding of work-related texts3.56 0.08 3.48 0.07 3.32 0.08 CONTENT as an overall set of skills
Main Ideas and Author's Approach3.77 0.06 3.46 0.08 3.78 0.05 Infer the main idea or purpose of a straightforward paragraph3.67 0.07 . . . . Recognize a clear intent of an author or narrator3.66 0.08 3.51 0.07 3.59 0.06 Determine the main idea or purpose of a complex paragraph3.73 0.07 3.45 0.08 . . Identify the main idea or purpose of a straightforward paragraph3.81 0.06 3.67 0.06 3.72 0.06 Determine the main idea, purpose, or theme of a text3.64 0.07 3.55 0.08 3.43 0.07 Understand the overall approach taken by an author or narrator (e.g., point of view, kinds of evidence used)3.71 0.07 3.54 0.07 3.60 0.06 Summarize basic events and ideas in a text3.82 0.05 3.64 0.06 3.72 0.05 MAIN IDEAS AND AUTHOR'S APPROACH as an overall set of skills
Supporting Details3.62 0.07 3.48 0.07 3.60 0.06 Locate important details stated in a text3.33 0.10 . . . . Locate basic facts (e.g., names, dates, events) that are clearly stated in a text3.49 0.08 3.26 0.08 2.94 0.08 Locate and interpret minor or subtly stated details in a text3.34 0.10 3.17 0.10 . . Locate simple details at the sentence and paragraph level in a text3.63 0.07 3.42 0.08 3.47 0.07 Make simple inferences about how details are used to support points made in a text (e.g., support for a claim)3.56 0.08 3.40 0.09 3.31 0.07 Discern which details from different sections of a text support important points3.40 0.10 3.18 0.10 3.06 0.08 Understand subtle or complex roles that details can play in a text3.70 0.06 3.46 0.07 3.44 0.06 SUPPORTING DETAILS as an overall set of skills
Relationships3.29 0.10 3.05 0.11 3.29 0.09 Order simple sequences of events in a text3.34 0.09 . . . . Determine when (e.g., first, last, before, after) or if an event occurred in a text3.33 0.09 3.10 0.10 2.90 0.09 Order subtle or complex sequences of events in a text3.44 0.09 . . . . Recognize clear cause-effect relationships described within a single sentence3.60 0.07 3.45 0.08 3.52 0.07 Identify clear relationships between people, ideas, and so on in a text3.49 0.09 3.40 0.08 3.07 0.08 Infer subtle or complex relationships between people, ideas, and so on in a text3.59 0.08 3.51 0.08 3.50 0.07 Identify clear cause-effect relationships in a text3.43 0.09 3.35 0.09 3.03 0.08 Infer subtle or complex cause-effect relationships in a text3.60 0.07 3.44 0.07 3.32 0.07 RELATIONSHIPS as an overall set of skills
Meaning of Words3.72 0.06 3.45 0.08 3.49 0.07 Use context to determine the appropriate meaning of words and phrases3.47 0.09 . . . . Understand the implication of a familiar word or phrase and of simple descriptive language3.62 0.07 3.28 0.10 3.25 0.08 Distinguish between literal and figurative meanings of words and phrases in a text3.60 0.07 3.49 0.07 3.49 0.07 Paraphrase concepts and ideas in a text3.70 0.07 3.16 0.12 2.45 0.11 Understand literary devices in a text3.76 0.05 3.57 0.07 3.41 0.06 MEANINGS OF WORDS as an overall set of skills
Generalizations and Conclusions3.61 0.07 3.49 0.07 3.54 0.06 Draw generalizations and conclusions about people, ideas, and so on in a text3.51 0.08 . . . . Draw simple generalizations and conclusions about the main characters in a text3.74 0.06 3.53 0.07 3.52 0.07 Draw generalizations and conclusions using details that support the main points of a text3.62 0.08 3.26 0.10 2.72 0.10 Predict outcomes based on a text3.58 0.08 3.40 0.09 3.44 0.08 Distinguish between fact, opinion, and reasoned judgment within a text3.00 0.12 3.08 0.11 3.07 0.09 Identify stereotypes in a text2.70 0.15 3.00 0.12 2.93 0.09 Identify logical fallacies in a text3.28 0.11 3.26 0.10 3.04 0.09 Identify persuasive techniques in a text3.13 0.13 3.26 0.10 3.25 0.09 Evaluate the range and quality of evidence used to support an argument in a text3.33 0.11 3.24 0.10 3.21 0.09 Make connections between two or more texts3.58 0.07 3.50 0.07 3.37 0.07 GENERALIZATIONS AND CONCLUSIONS as an overall set of skills
Note:MS = Middle school/junior high school teachersHS = High school teachersPS = Postsecondary instructors (no remedial teachers)+/– = The value given under +/– is the confidence interval (CI) for the mean, at a confidence level of 95%. For example, for a mean of 3.27 with a CI of 0.09, there is a
95% probability that the actual mean for the population is within the range 3.27 plus or minus 0.09.. = This item was not asked at this grade level.
APPENDIX C: Statistical Details for Topics and SkillsAPPENDIX C: Statistical Details for Topics and Skills
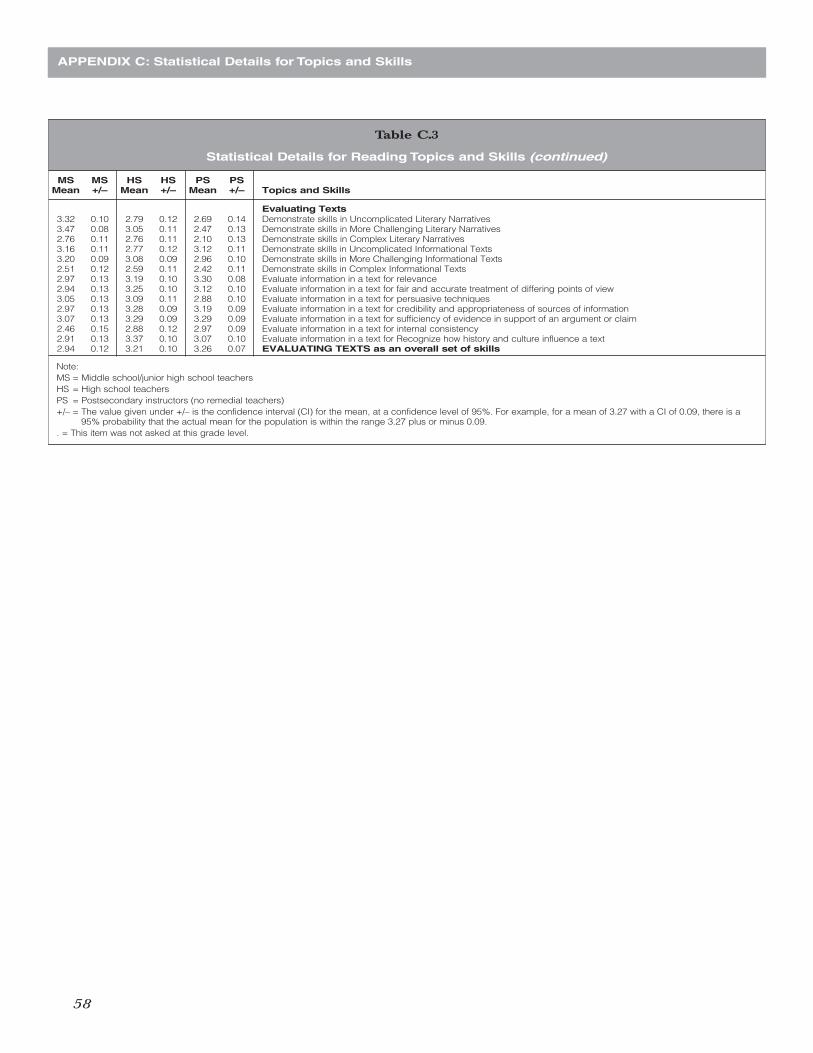
Table C.3
Statistical Details for Reading Topics and Skills (continued)
MSMean
MS +/–
HSMean
HS +/–
PSMean
PS+/– Topics and Skills
Evaluating Texts3.32 0.10 2.79 0.12 2.69 0.14 Demonstrate skills in Uncomplicated Literary Narratives3.47 0.08 3.05 0.11 2.47 0.13 Demonstrate skills in More Challenging Literary Narratives2.76 0.11 2.76 0.11 2.10 0.13 Demonstrate skills in Complex Literary Narratives3.16 0.11 2.77 0.12 3.12 0.11 Demonstrate skills in Uncomplicated Informational Texts3.20 0.09 3.08 0.09 2.96 0.10 Demonstrate skills in More Challenging Informational Texts2.51 0.12 2.59 0.11 2.42 0.11 Demonstrate skills in Complex Informational Texts2.97 0.13 3.19 0.10 3.30 0.08 Evaluate information in a text for relevance2.94 0.13 3.25 0.10 3.12 0.10 Evaluate information in a text for fair and accurate treatment of differing points of view3.05 0.13 3.09 0.11 2.88 0.10 Evaluate information in a text for persuasive techniques2.97 0.13 3.28 0.09 3.19 0.09 Evaluate information in a text for credibility and appropriateness of sources of information3.07 0.13 3.29 0.09 3.29 0.09 Evaluate information in a text for sufficiency of evidence in support of an argument or claim2.46 0.15 2.88 0.12 2.97 0.09 Evaluate information in a text for internal consistency2.91 0.13 3.37 0.10 3.07 0.10 Evaluate information in a text for Recognize how history and culture influence a text2.94 0.12 3.21 0.10 3.26 0.07 EVALUATING TEXTS as an overall set of skills
Note:MS = Middle school/junior high school teachersHS = High school teachersPS = Postsecondary instructors (no remedial teachers)+/– = The value given under +/– is the confidence interval (CI) for the mean, at a confidence level of 95%. For example, for a mean of 3.27 with a CI of 0.09, there is a
95% probability that the actual mean for the population is within the range 3.27 plus or minus 0.09.. = This item was not asked at this grade level.
58
APPENDIX C: Statistical Details for Topics and SkillsAPPENDIX C: Statistical Details for Topics and Skills

59
Table C.4
Statistical Details for Science Topics and Skills
MSMean
MS+/–
HSMean
HS +/–
PSMean
PS +/– Topics and Skills
Interpretation of Data3.32 0.09 . . . . Identify basic features of a table, graph, or diagram (e.g., headings, units of measurement, axis labels)2.37 0.15 2.37 0.07 2.20 0.06 Compare or combine data from one or more data presentations (e.g., categorize data from a table using a scale from
another table)2.99 0.12 3.08 0.05 3.01 0.05 Determine how the value of one variable changes as another variable changes in a data presentation2.83 0.13 3.06 0.06 2.95 0.06 Identify and/or use a mathematical relationship between data3.07 0.11 3.11 0.05 3.08 0.05 Analyze given information when presented with new information2.46 0.15 2.64 0.06 2.51 0.06 Interpolate between data points in a table or graph2.42 0.15 2.65 0.06 2.46 0.06 Extrapolate from data points in a table or graph3.78 0.06 3.61 0.04 3.32 0.04 Understand basic scientific terminology3.48 0.09 3.37 0.04 2.95 0.05 Translate information into a table, graph, or diagram2.45 0.15 2.40 0.07 1.82 0.06 Apply statistical concepts and methods of data analysis to the results of an experiment3.31 0.10 3.29 0.05 2.96 0.05 INTERPRETATION OF DATA as an overall topic
Scientific Investigation3.50 0.09 2.98 0.06 . . Identify a control in an experiment3.43 0.09 3.06 0.06 2.65 0.06 Understand basic processes and designs of simple experiments (single control, 2–3 variables)2.41 0.17 2.22 0.07 2.03 0.06 Understand the methods and tools used in an experiment featuring multiple controls and multiple variables
. . . . 1.53 0.05 Understand complex experimental designs3.41 0.10 3.02 0.06 . . Understand simple experimental design (single control, 2–3 variables)1.83 0.17 1.87 0.07 . . Understand complex experimental design (multiple controls and multiple variables)2.82 0.14 2.72 0.06 2.29 0.06 Predict the results of an additional trial in an experiment2.75 0.15 2.60 0.07 2.07 0.06 Determine the experimental conditions that would produce specified results3.63 0.08 3.15 0.06 2.62 0.06 Determine the hypothesis for an experiment
. . . . 2.17 0.09 Identify an alternate method for testing a hypothesis2.98 0.13 2.91 0.06 2.44 0.06 Understand precision and accuracy issues2.85 0.13 2.66 0.06 . . Identify similarities and differences between experiments2.71 0.14 2.65 0.06 2.21 0.06 Evaluate the similarities and differences, or the strengths and weaknesses, of experiments2.83 0.12 2.65 0.06 2.11 0.06 Predict how modifying the design of an experiment will affect results3.41 0.10 2.93 0.07 2.05 0.06 Design and conduct an experiment2.45 0.15 2.41 0.07 1.94 0.06 Identify an experiment that could be performed to enhance experimental results3.53 0.09 3.19 0.05 2.50 0.05 SCIENTIFIC INVESTIGATION as an overall topic
Evaluation of Models3.28 0.11 3.02 0.06 2.69 0.06 Identify a hypothesis, prediction, or conclusion that is supported by data presentations or models
(i.e., scientific explanations)3.27 0.11 3.01 0.06 2.85 0.06 Determine whether information (e.g., a data presentation or model) supports or contradicts a hypothesis, prediction, or
conclusion, and why2.48 0.14 2.43 0.06 2.27 0.06 Identify strengths and weaknesses in one or more models2.53 0.14 2.45 0.06 2.32 0.06 Identify similarities and differences between models2.26 0.14 2.34 0.07 2.39 0.06 Determine whether a model is supported or weakened by new information2.38 0.15 2.49 0.06 2.49 0.06 Identify key issues or assumptions in a model2.46 0.14 2.51 0.06 2.41 0.06 Use new information to make a prediction based on a model2.95 0.14 2.94 0.07 2.54 0.07 Communicate the results of an experiment through writing a properly organized report2.82 0.12 2.82 0.06 2.54 0.05 EVALUATION OF MODELS, INFERENCES, AND EXPERIMENTAL RESULTS as an overall topic
Miscellaneous Science Topics1.32 0.17 1.55 0.08 1.76 0.06 Familiarity with the term “experimental treatment”2.67 0.17 2.68 0.07 2.24 0.06 Familiarity with the term “experimental variable”3.15 0.13 3.03 0.06 2.55 0.06 Familiarity with the term “independent variable”3.14 0.13 3.03 0.06 2.55 0.06 Familiarity with the term “dependent variable”2.00 0.16 2.87 0.06 2.98 0.06 Familiarity with the term “directly proportional”1.87 0.16 2.84 0.06 2.93 0.06 Familiarity with the term “inversely proportional”3.56 0.09 3.52 0.04 3.34 0.05 Use metric units of measurement1.85 0.17 1.63 0.08 1.94 0.07 Use English units of measurement2.54 0.15 3.00 0.06 2.95 0.06 Convert a number expressed in one unit of measurement to a number expressed in another unit of measurement1.23 0.16 2.58 0.08 2.39 0.07 Perform dimensional analysis2.70 0.15 3.18 0.05 3.15 0.05 Read and interpret data plotted on a linear scale1.12 0.16 1.54 0.08 2.04 0.06 Read and interpret data plotted on a log scale
Note:MS = Middle school/junior high school teachersHS = High school teachersPS = Postsecondary instructors (no remedial teachers)+/– = The value given under +/– is the confidence interval (CI) for the mean, at a confidence level of 95%. For example, for a mean of 3.27 with a CI of 0.09, there is a
95% probability that the actual mean for the population is within the range 3.27 plus or minus 0.09.. = This item was not asked at this grade level.
APPENDIX C: Statistical Details for Topics and SkillsAPPENDIX C: Statistical Details for Topics and Skills

Table C.4
Statistical Details for Science Topics and Skills (continued)
MSMean
MS +/–
HSMean
HS +/–
PSMean
PS +/– Topics and Skills
General Biology Topics2.39 0.21 . . . . State the criteria for life and understand and be able to use organizational systems in biology (e.g., in taxonomy,
in ecology)1.96 0.20 . . . . Recognize the role of carbohydrates, lipids, proteins, and nucleic acids in a cell
. . 3.56 0.08 2.76 0.11 Explain the criteria for life and understand and be able to use organizational systems in biology (e.g., in taxonomy, in ecology)
. . 3.43 0.09 2.45 0.12 Recognize structure and state functions of carbohydrates, lipids, proteins, and nucleic acids
. . 2.86 0.12 2.60 0.12 Describe pH, acidic, and basic2.16 0.19 . . . . Use the pH scale2.55 0.19 2.89 0.11 2.60 0.12 Describe a chemical reaction and recognize the parts of a chemical equation1.78 0.19 3.45 0.08 2.64 0.12 Explain what enzymes are and how they function1.24 0.19 3.49 0.09 2.41 0.12 Describe the structure and function of ATP2.65 0.20 3.63 0.07 2.52 0.12 Describe photosynthesis and cellular respiration and state where in the cell these processes occur
. . 2.10 0.14 2.14 0.12 Relate the laws of thermodynamics to organisms and their environment2.30 0.21 3.63 0.08 2.71 0.12 Describe diffusion and osmosis2.50 0.21 3.80 0.05 2.79 0.12 Describe the structure and function of cell organelles and the plasma membrane2.16 0.21 3.66 0.07 2.45 0.12 Explain the phases of the cell cycle and how the cell cycle is regulated2.21 0.21 3.71 0.07 2.69 0.13 Describe the difference between mitotic and meiotic division1.92 0.20 3.68 0.07 2.52 0.13 Describe the processes of DNA replication, transcription, and translation
. . 3.81 0.05 2.68 0.12 Describe the structure and function of DNA, chromosomes, and the genetic code
. . 3.56 0.08 2.37 0.13 Describe the structure and function of RNA (e.g., mRNA, rRNA, tRNA)2.59 0.20 3.55 0.08 2.48 0.12 Describe what a gene is, how genes are expressed, and how gene expression can be regulated2.59 0.21 3.70 0.07 2.64 0.12 Use the principles of Mendelian genetics to predict the outcome of a genetic cross
. . 3.61 0.07 2.54 0.12 Explain how meiosis results in the formation of gametes and relate the process of meiosis to the principles of Mendelian genetics
2.64 0.21 3.55 0.08 2.70 0.12 State the difference between sexual and asexual reproduction2.27 0.20 3.42 0.10 2.77 0.12 Describe the process of evolution and state the evidence for evolution
. . 3.41 0.10 2.50 0.13 State the biological definition of fitness, describe the importance of mutation in evolution, and explain how natural selection drives evolution
2.07 0.20 3.28 0.10 2.36 0.13 Define species and describe the process of speciation1.14 0.19 2.61 0.13 2.03 0.13 Interpret a phylogenetic tree
. . 1.60 0.15 1.64 0.13 Use the Hardy-Weinberg equation2.32 0.21 3.25 0.12 2.69 0.13 Describe the major groups of organisms (e.g., bacteria, protists, fungi, plants, animals) and why they are important to
Earth’s ecosystems1.86 0.21 3.08 0.12 1.91 0.12 Describe what viruses are and how they replicate1.92 0.21 2.73 0.15 2.13 0.13 Compare vertebrates and invertebrates and list key features of fish, amphibians, reptiles, birds, and mammals2.32 0.21 2.98 0.13 1.92 0.12 Describe the development of an animal from a single cell and the structure and function of the major organ systems1.93 0.21 2.79 0.13 1.87 0.13 Compare the different types of biomes2.13 0.21 3.25 0.12 2.10 0.13 Describe the biotic and abiotic factors in an ecosystem and the flow of energy and chemicals through an ecosystem2.41 0.21 3.41 0.10 2.41 0.13 Define producers, consumers, and decomposers2.10 0.20 3.27 0.11 2.36 0.14 Define biodiversity
. . 3.76 0.06 2.86 0.11 GENERAL BIOLOGY TOPICS as an overall topic
General Chemistry Topics3.38 0.12 3.53 0.08 3.35 0.09 Explain the difference between mass, weight, density, and volume3.12 0.16 3.60 0.08 3.08 0.11 Describe the physical properties and molecular models of solids, liquids, and gases3.01 0.17 3.42 0.09 3.07 0.11 Understand what occurs when a substance melts, freezes, boils, sublimes, or condenses
. . 3.44 0.09 3.12 0.11 Know the Celsius and Kelvin temperature scales and how they are related
. . 2.86 0.14 2.18 0.12 Understand the features of a generic heating curve
. . 3.40 0.11 2.47 0.13 Understand and apply Charles’s law and Boyle’s law
. . 2.74 0.15 2.05 0.13 Solve problems involving Graham’s law and Dalton’s law
. . 3.44 0.11 2.55 0.14 Know and apply the ideal gas law and the kinetic theory to explain the behavior of gases
. . 3.16 0.11 2.27 0.13 Describe how different factors affect the solubility of gases, liquids, and solids
. . 3.31 0.11 2.64 0.14 Solve problems involving molality and molarity1.44 0.20 3.39 0.10 2.56 0.14 Understand why substances can be polar or nonpolar and how polarity relates to solubility
. . 3.77 0.06 3.32 0.11 Explain the differences between an element, an atom, a molecule, and a compound2.80 0.18 3.89 0.04 3.35 0.11 Correctly use basic chemical symbols and formulas
. . 3.87 0.05 3.14 0.13 Understand and apply the mole concept2.99 0.19 3.79 0.05 3.23 0.11 Know the basic parts of an atom, the subatomic particles contained in each part, and the charge on each type of particle
. . 3.77 0.05 3.02 0.13 Explain the differences between atomic mass, molar mass, mass number, and atomic number
. . 3.49 0.08 2.73 0.13 Know that the nuclei of two different isotopes of an element will contain the same number of protons but a different number of neutrons
Note:MS = Middle school/junior high school teachersHS = High school teachersPS = Postsecondary instructors (no remedial teachers)+/– = The value given under +/– is the confidence interval (CI) for the mean, at a confidence level of 95%. For example, for a mean of 3.27 with a CI of 0.09, there is a
95% probability that the actual mean for the population is within the range 3.27 plus or minus 0.09.. = This item was not asked at this grade level.
60
APPENDIX C: Statistical Details for Topics and Skills

61
Table C.4
Statistical Details for Science Topics and Skills (continued)
MSMean
MS+/–
HSMean
HS +/–
PSMean
PS +/– Topics and Skills
General Chemistry Topics (continued). . 3.62 0.07 2.58 0.13 Describe the periodic trends and the properties of the elements in the most common groups of the periodic table. . 3.48 0.09 2.53 0.14 Generate electron configurations for different elements and their ions. . 3.76 0.05 2.77 0.14 Explain the difference between an ionic bond and a covalent bond. . 3.76 0.06 2.55 0.14 Use oxidation or valence numbers to predict chemical formulas of compounds. . 3.52 0.09 2.61 0.13 Represent the bonding in ionic compounds and covalent compounds using electron-dot structures. . 3.91 0.03 3.18 0.12 Balance a basic chemical equation. . 3.79 0.07 2.95 0.13 Solve stoichiometric problems involving chemical reactions. . 2.40 0.15 2.00 0.13 Interpret a potential energy diagram and describe the role of a catalyst in a chemical reaction. . 2.90 0.13 2.25 0.14 Compare different intermolecular forces that exist between atoms and molecules. . 2.33 0.16 2.25 0.15 Use change in Hf to determine whether a chemical reaction was endothermic or exothermic. . 2.26 0.17 2.18 0.15 Apply Le Chatelier’s principle to predict how different factors will affect the equilibrium of a reversible reaction. . 1.68 0.16 1.69 0.14 Predict the composition of a solid/solution mixture using Ksp. . 2.65 0.15 2.00 0.14 Compare and apply the three major acid-base theories. . 2.90 0.14 2.34 0.14 Know the formulas and relative strengths of the most common acids and bases. . 1.87 0.16 1.89 0.15 Use Ka values to determine the composition of an aqueous solution of an acid or base. . 3.43 0.11 2.86 0.14 Determine whether a substance having a certain pH is acidic, basic, or neutral. . 2.03 0.17 1.97 0.15 Calculate the pH of a solution using given concentrations and Ka or pKa values. . 1.92 0.16 1.97 0.15 Explain why a buffer solution maintains a stable pH. . 2.24 0.17 2.35 0.15 Identify which species are oxidized and which are reduced in a redox reaction. . 1.95 0.17 1.90 0.14 Balance redox equations using oxidation numbers. . 1.43 0.16 1.64 0.14 Explain the parts of a basic electrochemical cell and calculate voltages for the cell. . 2.12 0.17 1.69 0.14 Use structural formulas to represent organic compounds. . 1.94 0.17 1.40 0.13 Use basic organic nomenclature to convert between the names and formulas of organic compounds. . 2.50 0.16 1.99 0.14 Describe the basic geometry of carbon single, double, and triple bonds. . 3.69 0.07 2.76 0.13 GENERAL CHEMISTRY TOPICS as an overall topic
General Earth Science Topics. . 3.07 0.13 2.87 0.12 Find location and estimate distance on a map. . 3.26 0.13 2.42 0.15 Describe the properties that define a mineral. . 3.45 0.11 2.51 0.15 Compare the compositions and origins of sedimentary, igneous, and metamorphic rocks
2.37 0.22 3.26 0.12 2.28 0.14 Compare erosion and weathering. . 3.23 0.12 2.30 0.15 Identify the major agents of erosion and distinguish the two types of weathering. . 2.94 0.14 2.10 0.14 Understand how weathering is related to soil formation. . 3.10 0.12 2.35 0.14 Understand how and where sediment is deposited. . 3.27 0.12 1.81 0.14 Identify the layers of Earth’s atmosphere
2.06 0.22 3.29 0.11 1.99 0.15 Compare weather and climate. . 3.08 0.13 1.56 0.14 Understand how relative humidity and dew point relate to cloud formation and precipitation. . 2.99 0.14 1.46 0.14 Describe the characteristics and causes of thunderstorms. . 2.97 0.14 1.39 0.14 Describe the characteristics and causes of tornadoes. . 2.97 0.13 1.56 0.14 Describe the characteristics and causes of hurricanes. . 2.36 0.15 1.74 0.13 Compare the chemistry of ocean water and fresh water. . 2.94 0.13 1.97 0.14 Understand the cause of tides. . 3.01 0.13 1.94 0.14 Understand how large-scale ocean currents contribute to climate
2.69 0.20 3.44 0.10 2.68 0.14 Understand how water moves through the water cycle. . 3.15 0.12 2.49 0.14 Identify the primary sources of fresh water (lakes, streams, groundwater, glaciers). . 2.88 0.14 2.35 0.15 Describe the relationship between the water table and groundwater
2.23 0.23 3.58 0.09 2.62 0.16 Describe the three major types of tectonic plate boundaries2.50 0.22 3.59 0.09 2.47 0.15 Understand the causes of plate movement
. . 3.65 0.08 2.65 0.16 Understand how plate movement relates to earthquakes, volcanoes, and mountain building
. . 2.97 0.12 2.26 0.14 Describe how radioactive materials are use to determine age
. . 3.06 0.12 2.26 0.14 Understand how fossils are formed and what fossils tell us about the ages of rock layers
. . 3.13 0.12 2.18 0.14 Identify renewable and nonrenewable resources2.57 0.20 3.03 0.13 1.94 0.14 Describe types of renewable/alternative energy
. . 2.82 0.14 1.77 0.14 Understand multiple ways to conserve and recycle resources
. . 2.81 0.14 1.76 0.14 Identify types of air, soil, and water pollution2.53 0.19 3.20 0.12 2.24 0.14 Understand the causes and effects of global warming2.50 0.20 3.26 0.11 1.91 0.14 Understand the importance of the ozone layer1.49 1.28 2.28 1.52 . . Describe the motions of Earth and the Moon and their implications for lunar phases, tides, and timekeeping
Note:MS = Middle school/junior high school teachersHS = High school teachersPS = Postsecondary instructors (no remedial teachers)+/– = The value given under +/– is the confidence interval (CI) for the mean, at a confidence level of 95%. For example, for a mean of 3.27 with a CI of 0.09, there is a
95% probability that the actual mean for the population is within the range 3.27 plus or minus 0.09.. = This item was not asked at this grade level.
APPENDIX C: Statistical Details for Topics and Skills

Table C.4
Statistical Details for Science Topics and Skills (continued)
MSMean
MS +/–
HSMean
HS +/–
PSMean
PS +/– Topics and Skills
General Earth Science Topics (continued). . 2.13 0.12 1.30 0.13 Describe the properties of the various solar system bodies (the Sun, planets, moons, asteroids, comets, meteoroids). . 1.93 0.12 1.00 0.12 Describe and compare various theories of solar system formation. . 1.92 0.12 1.00 0.13 Describe the process of star formation and evolution. . 1.74 0.12 0.91 0.12 Describe the various types of galaxies, and their formation and evolution. . 2.05 0.12 1.01 0.12 Describe the large-scale structure of the universe, discuss the big bang theory, and describe
the possible outcomes for the evolution of the universe. . 3.66 0.07 2.62 0.13 GENERAL EARTH SCIENCE TOPICS as an overall topic
General Physics and Astronomy Topics. . 3.89 0.04 2.82 0.13 Calculate the displacement, speed, velocity, and acceleration of an object in one and two dimensions. . 3.72 0.06 2.67 0.13 Sketch position/time graphs and velocity/time graphs for objects undergoing simple types of motion. . 3.92 0.03 2.67 0.15 Apply Newton’s three laws of motion to solve simple mechanics problems. . 3.79 0.06 2.53 0.15 Define momentum and describe momentum conservation. . 3.85 0.04 2.67 0.15 Define kinetic energy and potential energy. . 3.72 0.07 2.54 0.15 Define mechanical energy and describe simple scenarios in which mechanical energy is conserved or is not conserved. . 3.47 0.10 2.11 0.14 Write the formula describing Newton’s law of gravitation. . 3.78 0.06 2.51 0.15 Solve problems involving free fall and motions on an inclined plane. . 3.68 0.08 2.47 0.15 Solve simple problems involving projectile motion, uniform circular motion, and circular orbits. . 3.21 0.12 2.28 0.14 Describe simple harmonic motion and give examples of systems in which simple harmonic motion is observed. . 3.77 0.06 2.49 0.15 Define work, state the work-energy theorem, and calculate the work done in simple physical situations. . 2.74 0.16 2.20 0.15 Relate torque to rotational motion. . 2.27 0.16 2.33 0.14 Distinguish among the Fahrenheit, Celsius, and Kelvin temperature scales and convert a temperature in any one of
these scales to a temperature in either of the other two scales. . 2.15 0.17 2.02 0.15 Define the specific heat of a substance. . 2.24 0.17 1.96 0.14 Describe the heat transfer processes of convection, conduction, and radiation. . 1.82 0.17 1.95 0.15 Write the equation of state for an ideal gas and use the equation to solve problems involving transformations in
ideal gases. . 3.35 0.12 2.29 0.16 Given wavelength and frequency of light or sound, calculate wave speed. . 3.15 0.13 2.10 0.15 Describe the electromagnetic spectrum in terms of energy, radiation type (gamma ray, X-ray, etc.), wavelength,
and frequency. . 3.13 0.14 2.16 0.16 Given the angle of incidence of light on a plane mirror, predict angle of reflection. . 2.92 0.16 2.01 0.16 Using Snell’s law, determine angle of refraction of light. . 2.82 0.16 1.90 0.15 For object imaged by mirror or thin lens, use ray tracing to determine position, size, and orientation of image. . 2.67 0.16 2.04 0.16 Sketch electric field lines emanating from point charge. . 2.98 0.15 2.11 0.16 Using Coulomb’s law, determine the electric force between 2 point charges. . 3.16 0.15 2.23 0.16 Using Ohm’s law, determine the voltage drop across a resistor. . 3.05 0.14 2.30 0.16 Explain the difference between an electrical conductor and an electrical insulator. . 2.70 0.15 2.05 0.16 Explain the difference between an AC circuit and a DC circuit. . 2.95 0.16 2.08 0.16 Calculate the power generated by an electrical current passing through a resistor. . 2.66 0.16 1.85 0.15 Explain how an electrical generator uses motion and magnetism to produce an electrical current. . 2.56 0.16 2.01 0.15 Draw lines of magnetic force emanating from a bar magnet. . 2.55 0.15 1.70 0.14 Describe qualitatively situations in which light behaves like a wave and situations in which light behaves like a particle. . 3.22 0.12 2.35 0.15 GENERAL PHYSICS AND ASTRONOMY TOPICS as an overall topic
General Physical Science Topics (Middle School Only)3.16 0.15 . . . . Understand and apply the formula for density3.09 0.15 . . . . Understand the Celsius scale and the significance of 0°C and 100°C in the scale.2.16 0.19 . . . . Know that a liquid having a lower viscosity flows more easily than does a substance having a higher viscosity2.36 0.20 . . . . Explain why a chemical or physical process is endothermic or exothermic2.40 0.19 . . . . Explain the difference between a homogeneous mixture and a heterogeneous mixture2.27 0.20 . . . . Identify the solute(s) and solvent when describing a solution2.12 0.20 . . . . Understand that the concentration of a solution is amount of solute dissolved in a certain amount of solvent or solution1.82 0.20 . . . . Know that an aqueous solution is a solution in which H2O is the solvent3.12 0.17 . . . . Understand the distinctions between an element, an atom, a molecule, and a compound1.95 0.20 . . . . Know that organic compounds contain carbon and that hydrocarbons contain only carbon and hydrogen
Note:MS = Middle school/junior high school teachersHS = High school teachersPS = Postsecondary instructors (no remedial teachers)+/– = The value given under +/– is the confidence interval (CI) for the mean, at a confidence level of 95%. For example, for a mean of 3.27 with a CI of 0.09, there is a
95% probability that the actual mean for the population is within the range 3.27 plus or minus 0.09.. = This item was not asked at this grade level.
62
APPENDIX C: Statistical Details for Topics and Skills

63
Table C.4
Statistical Details for Science Topics and Skills (continued)
MSMean
MS +/–
HSMean
HS +/–
PSMean
PS +/– Topics and Skills
General Physical Science Topics (Middle School Only) (continued)2.42 0.20 . . . . Identify basic features of a chemical equation (reactants, products, reaction arrow, coefficients)2.05 0.21 . . . . Balance a simple chemical equation1.76 0.20 . . . . Describe the role of a catalyst in a chemical reaction2.16 0.21 . . . . Determine whether a solution is acidic, basic, or neutral when given its pH2.29 0.21 . . . . Define displacement, speed, velocity, and acceleration, and, for an object moving in a straight line at a constant speed,
plot a graph from a table of the displacement of the object versus time, and find the object’s speed from the graph2.52 0.21 . . . . State and describe Newton’s three laws of motion, and give examples of physical situations that illustrate each law2.24 0.21 . . . . Describe qualitatively Newton’s law of gravitation, describe the acceleration due to gravity at Earth’s surface for objects
having different masses, and define weight2.46 0.20 . . . . Define and distinguish between kinetic energy and potential energy, define mechanical energy, and describe situations
in which mechanical energy is not conserved1.94 0.21 . . . . Define wavelength, frequency, amplitude, and wave speed1.62 0.20 . . . . Describe the Doppler effect and give examples of its occurrences and applications1.79 0.22 . . . . List the names associated with the various types of electromagnetic radiation, and arrange them in order of increasing
wavelength2.15 0.20 . . . . Describe the interaction between opposite charges and between like charges1.54 0.22 . . . . Define electrical current, voltage, and resistance1.81 0.21 . . . . Describe the interactions between the poles of two magnets
General Earth/Space Science Topics (Middle School Only)1.94 0.21 . . . . Know how latitude and longitude are used to designate location1.99 0.22 . . . . Describe the properties of a mineral and understand how minerals relate to rocks2.27 0.23 . . . . Compare how sedimentary, igneous, and metamorphic rocks are formed2.06 0.21 . . . . Know the layers of Earth’s atmosphere1.72 0.21 . . . . Know how relative humidity and dew point relate to cloud formation1.86 0.22 . . . . Describe the characteristics and causes of thunderstorms, tornadoes, and hurricanes2.39 0.23 . . . . Know the causes of earthquakes and volcanoes2.35 0.21 . . . . Know how fossils are formed and what they tell us about the ages of rock layers2.65 0.19 . . . . Identify renewable and nonrenewable resources and ways to conserve and recycle resources2.58 0.19 . . . . Identify types of air, land, and water pollution and ways to improve air and water quality2.15 0.22 . . . . Compare planets, moons, asteroids, comets, and meteors2.30 0.22 . . . . Describe the motions of the Sun, Earth, Moon system1.73 0.22 . . . . Compare the composition, color, and life cycles of different classes of stars1.75 0.22 . . . . Describe the different types of galaxies
Note:MS = Middle school/junior high school teachersHS = High school teachersPS = Postsecondary instructors (no remedial teachers)+/– = The value given under +/– is the confidence interval (CI) for the mean, at a confidence level of 95%. For example, for a mean of 3.27 with a CI of 0.09, there is a
95% probability that the actual mean for the population is within the range 3.27 plus or minus 0.09.. = This item was not asked at this grade level.
APPENDIX C: Statistical Details for Topics and Skills

64
APPENDIX D: Test Specifications for the EPAS English/Writing, Mathematics, Reading, and Science Tests
English Test Specifications
Table D.1 summarizes the specifications for theEXPLORE, PLAN, and ACT English Tests by showing thenumber (and proportion) of test questions in each test.
Several features of this coordinated set of English testingprograms can be seen in this summary of test specifications.First, as the tests assess higher levels along the content con-tinua, the emphasis of the assessment shifts fromusage/mechanics skills like punctuation to more complex,global skills related to strategy, organization, and style. Also,as the target grade level of the testing program increases, sodo the number of questions, the number of passages, and
the length of the passages. These shifts reflect the expectedchange in level of sophistication of the examinee population.
The multiple-choice test questions derive from a domainof specific language components that educators agree areimportant to clear communication. The language compo-nents are not tested in isolation, but rather within the contextof a passage; their listing here is not meant to be a prescrip-tion for language arts education, but merely a means ofdescribing the kinds of writing abilities indirectly measuredby the tests.
Table D.1English Test Specifications
Testing program
Content area EXPLORE PLAN ACT
Punctuation 6 (.15) 7 (.14) 10 (.13)
Grammar and Usage 8 (.20) 9 (.18) 12 (.16)
Sentence Structure 11 (.28) 14 (.28) 18 (.24)
Strategy 5 (.12) 6 (.12) 12 (.16)
Organization 5 (.12) 7 (.14) 11 (.15)
Style 5 (.12) 7 (.14) 12 (.16)
Total 40 50 75
Passages 4 4 5
Passage Length 300 words 300 words 325 words

65
APPENDIX D: Test Specifications for the EPAS English/Writing, Mathematics, Reading, and Science Tests
English Language Continuum Content Descriptions
Punctuation. The items in this category test the exami-nee’s understanding of the conventions of internal and end-of-sentence punctuation, with emphasis on the capabilities ofpunctuation to remove ambiguity and clarify meaning.
Punctuating breaks in thoughtEnd of a sentence (period, exclamation point,
question mark)Between clauses of compound sentences when
conjunction is omitted or when clauses containcommas
Before a conjunctive adverb joining clauses of acompound sentence
Parenthetical elements (comma, dash, parentheses)
Punctuating relationships and sequencesAvoiding ambiguityIndicating possessivesIndicating items or simple phrases in a seriesIndicating restrictive/essential or
nonrestrictive/nonessential elements (e.g.,participial phrases, subordinate clauses,appositives)
Avoiding unnecessary punctuationBetween subject and predicateBetween verb and objectBetween adjective and noun (modifier and modified
element)Between noun and prepositionBetween preposition and objectBetween two coordinate elements or correlativesWithin series already linked by conjunctionsBetween intensive and antecedent
Grammar and Usage. The items in this category test theexaminee’s understanding of agreement between subjectand verb, between pronoun and antecedent, and betweenmodifiers and the words modified; formation of verb tenses;pronoun case; formation of comparative and superlativeadjectives and adverbs; and idiomatic usage.
Assuring grammatical agreementPredicate with subjects of varying complexity
(including compound subjects, collective nouns,sentences beginning with there or where)
Pronoun with antecedent (only when the relationshipis clear)
Adjectives and adverbs with their correspondingnouns and verbs
Forming verbsTenses of regular and irregular verbsCompound tenses
Using pronounsUsing the proper form of the possessives and
distinguishing them from adverbs (there) andcontractions (it’s and who’s)
Using the appropriate case of a pronoun
Forming modifiersForming comparatives and superlatives of adjectives
and adverbsUsing the appropriate comparative or superlative form
depending on the context
Observing usage conventionsUsing the idioms of standard written English
Sentence Structure. The items in this category test theexaminee’s understanding of relationships between andamong clauses, management and placement of modifiers,and shifts in construction.
Relating clausesAvoiding faulty subordination, coordination, and
parallelismAvoiding run-on and fused sentencesAvoiding comma splicesAvoiding sentence fragments (except those required
in dialogue or otherwise defensible as rhetoricallyappropriate in their context)
Using modifiersConstructing sentences so that antecedents are clear
and unambiguous (avoiding squinters anddanglers)
Placing modifiers so that they modify the appropriateelement
Avoiding unnecessary or inappropriate shifts inconstruction
Person or number of pronounVoice of verbTense of verbMood of verb
Strategy. The items in this category test the examinee’sunderstanding of the appropriateness of expression in rela-tion to audience and purpose; judgment in adding, revising,or deleting supporting material (e.g., the strengthening ofcompositions with appropriate supporting material); andjudgment of the relevancy of statements in context. Theseitems focus on the processes of writing: the choices madeand strategies employed by a writer in the act of composingor revising.
Making decisions about the appropriateness ofexpression for audience and purpose
Making decisions about adding, revising, or deletingsupporting material
Judging relevancyOmitting irrelevant material (or retaining relevant
material)

66
Organization. The items in this category test the exami-nee’s understanding of the organization of ideas and judg-ment in choosing effective opening, transitional, and closingsentences.
Establishing logical orderChoosing the appropriate conjunctive adverb or
transitional expressionPlacing sentences in a logical locationOrdering sentences in a logical sequence (orderly
movement within paragraphs)Ordering a series of phrases in a logical wayBeginning a paragraph in the appropriate placeOrdering paragraphs in a logical sequence
Making decisions about cohesion devices: openings,transitions, and closings
Selecting an effective statement relative to the essayas a whole
Selecting an effective statement relative to a specificparagraph or paragraphs
Style. The items in this category test the examinee’s under-standing of rhetorically effective management of sentenceelements, clarity of pronoun references, economy in writing,and precision and appropriateness of words and images.
Managing sentence elements effectivelyRhetorically effective and logical subordination,
coordination, and parallelismAvoiding ambiguity of pronoun reference (only when
the relationship is problematic)
Editing and revising effectivelyAvoiding clearly excessive or inappropriate wordinessAvoiding redundancy
Choosing words to fit meaning and functionMaintaining the level of style and toneChoosing words and images that are specific, precise,
and clear in terms of their context and connotation;recognizing and avoiding mixed metaphors andawkward or nonsensical expressions
No single test form is expected to assess the student’sunderstanding of all of these areas. Rather, the content ofthe test is sampled from the domain described above and ismeasured in the context of the passages. Also, the tests donot assess memorized rules of grammar. The emphasis is onthe application of sound writing practices to the revising andediting of prose that is typical of that encountered in schooland in life in general.
Writing Test Specifications
The ACT Writing Test was introduced nationally as anoptional component to the ACT in February 2005. It is anachievement test designed to measure students’ writing proficiency and to complement the information currently provided by the ACT English Test. Students have 30 minutesto write on a single writing prompt. The prompt provides arhetorical situation—an issue or a problem with two alterna-tive positions or solutions. The examinees are asked todevelop and support, through their writing, one of those positions or solutions or to propose a third alternative. Thefeatures embedded in the 6-point holistic scoring rubric arebased on a set of descriptors of what students should beable to do in order to succeed in first-year college writingcourses. (See Figure D.1.) Each essay is scored by tworeaders. The sum of the readers’ scores is reported as theessay’s score, on the score range 2–12.
Figure D.1ACT Writing Test Descriptors (What Students Should Be Able to Do)
1. Show the ability to make and articulate judgments by• taking a position on an issue or problem.• demonstrating the ability to grasp the complexity of issues or problems by considering implications or
complications.
2. Sustain a position by focusing on the topic throughout the writing.
3. Develop a position by• presenting support or evidence using specific details.• using logical reasoning that shows the writer’s ability to distinguish between assertions and evidence
and to make inferences based on support or evidence.
4. Organize and present ideas in a logical way by• logically grouping and sequencing ideas.• using transitional devices to identify logical connections and tie ideas together.
5. Communicate clearly by using language effectively and by observing the conventions of standard writtenEnglish.
APPENDIX D: Test Specifications for the EPAS English/Writing, Mathematics, Reading, and Science Tests

67
APPENDIX D: Test Specifications for the EPAS English/Writing, Mathematics, Reading, and Science Tests
Mathematics Test Specifications
The content areas for the EXPLORE, PLAN, and ACTMathematics Tests are summarized in Table D.2. Included inthis table is the number (and proportion) of questions in eachcontent area. As can be seen from the table, there is a clearprogression in the content coverage of the tests from the8th- to the 10th- to the 12th-grade-level programs.
Several points need to be made about the labeling of thecontent areas, especially at the 8th-grade level. At Grade 8,consistent with the National Council of Teachers ofMathematics (NCTM) Standards, “Basic Statistical/Probability Concepts” does not refer to the content of a for-mal statistics course, but to the ability to process data.Similarly, 8th-grade “Pre-Geometry” deals with use of figures
and diagrams to solve mathematical problems. At levelshigher than Grade 8, content definitions are consistent withstandard course titles in high school.
The cognitive levels assessed by the Mathematics Testsare summarized in Table D.3. The numbers (and propor-tions) of questions at each cognitive level are reported in thistable. Although at first sight the increase in the proportion of“Knowledge and Skills” questions, and the decline in the pro-portion of “Understanding Concepts/Integrating ConceptualUnderstanding” questions, with increasing grade level mayseem surprising, it must be remembered that at the highergrade levels the content areas are more challenging.
Table D.2Mathematics Test Specifications
Testing program
Content area EXPLORE PLAN ACT
Basic Statistical/Probability Concepts 4 (.13) * *
Pre-Algebra 10 (.33) 14 (.35) 14 (.23)
Elementary Algebra 9 (.30) 8 (.20) 10 (.17)
Pre-Geometry 7 (.23)
Plane Geometry 11 (.27) 14 (.23)
Coordinate Geometry 7 (.18) 9 (.15)
Intermediate Algebra 9 (.15)
Trigonometry 4 (.07)
Total 30 40 60
*On PLAN and the ACT, questions involving statistics/probability are included in the Pre-Algebra category.
Table D.3Cognitive Specifications for the Mathematics Tests
Testing program
Cognitive level EXPLORE PLAN ACT
Knowledge and Skills 8 (.267) 14 (.350) 30 (.500)
Direct Application 8 (.267) 12 (.300) 17 (.283)
Understanding Concepts/Integrating 14 (.467) 14 (.350) 13 (.217)Conceptual Understanding
Total 30 40 60

68
APPENDIX D: Test Specifications for the EPAS English/Writing, Mathematics, Reading, and Science Tests
Mathematics Test forms are produced by sampling fromthe domains, rather than by testing every specific skill onevery form. Students are advised to prepare for these testsby obtaining a thorough grounding in the full content domainrather than by trying to guess the specific content that willappear on a test form. Each form is a unique sample from thebroad content domain; no particular topic in the content areasis guaranteed to appear on a given test form.
Mathematics Continuum Content andCognitive Level Descriptions
Cognitive Levels
Knowledge and skills. Questions at this level require thestudent to use one or more facts, definitions, formulas, orprocedures to solve problems that are presented in purelymathematical terms.
Direct application. Questions at this level require thestudent to use one or more facts, definitions, formulas, orprocedures to solve straightforward problems set in real-world situations.
Understanding concepts. Questions at this level testthe student’s depth of understanding of major concepts byrequiring reasoning from a concept to reach an inference ora conclusion.
Integrating conceptual understanding. Questions atthis level test the student’s ability to achieve an integratedunderstanding of two or more major concepts so as to solvenonroutine problems.
Content Areas
Basic Statistical/Probability Concepts. Questions inthis content area (which is treated explicitly in EXPLORE,and implicitly as part of the Pre-Algebra content area in PLANand the ACT) involve elementary counting and rudimentaryprobability; data collection, representation, and interpretation;reading and relating graphs, charts, and other representa-tions of data; and other appropriate topics. All of these topicsare addressed at a level preceding formal statistics.Questions in this content area cover the following topics:
Counting and counting techniquesThe concept of probabilityMean, median, and modeData collection and representationReading and interpreting graphs, charts, and other
representations of data
Pre-Algebra. Questions in this content area are based(as appropriate for the grade levels across EXPLORE,PLAN, and the ACT) on basic operations using whole num-bers, decimals, fractions, and integers; place value; squareroots and approximations; the concept of exponents; scien-tific notation; factors; ratio, proportion, and percent; linearequations in one variable; absolute value and ordering num-bers by value; elementary counting techniques and simpleprobability; data collection, representation, and interpreta-tion; and understanding simple descriptive statistics.Questions in pre-algebra cover the following topics:
Addition, subtraction, multiplication, and division ofwhole numbers, decimals, fractions, and integers
Positive integer exponentsPrime factorizationComparison of fractionsRatio and proportionConversion of fractions to decimals, and conversion of
decimals to fractionsAbsolute valueSolution of linear equations in one variable (This is an
Elementary Algebra topic for EXPLORE.)PercentScientific notationSquare roots and irrational numbersOperations with real numbers (field axioms)Order properties for real numbersCommon factors and common multiples
Elementary Algebra. Questions in this content area arebased (as appropriate for the grade levels acrossEXPLORE, PLAN, and the ACT) on properties of exponentsand square roots, evaluation of algebraic expressionsthrough substitution, using variables to express functionalrelationships, understanding algebraic operations, and thesolution of quadratic equations by factoring. Questions inelementary algebra cover the following topics:
Evaluation of algebraic expressions by substitutionSimplification of algebraic expressionsAddition, subtraction, and multiplication of polynomialsFactorization of polynomialsSolution of quadratic equations by factoringFormula manipulation and field properties of algebraic
expressions

69
APPENDIX D: Test Specifications for the EPAS English/Writing, Mathematics, Reading, and Science Tests
Pre-Geometry. Questions in this category (which appliesto EXPLORE only) involve the use of scales and measure-ment systems, plane and solid geometric figures and asso-ciated relationships and concepts, the concept of angles andtheir measures, parallelism, relationships of triangles, prop-erties of a circle, the Pythagorean theorem, and other appro-priate topics. All of these topics are addressed at a levelpreceding formal geometry. Questions in pre-geometrycover the following topics:
Using measurement systemsUsing rulers and other scalesConcepts and relationships for plane and solid geometric
figuresCalculation of perimeter, area, and volume with formulas
for selected geometric figuresThe concept of angle and angle measureParallelismProperties of trianglesProperties of circlesPythagorean theorem
Plane Geometry. Questions in this content area arebased (as appropriate for the grade levels across PLAN andthe ACT) on the properties and relations of plane figures,including angles and relations among perpendicular and parallel lines; properties of circles, triangles, rectangles, parallelograms, and trapezoids; transformations; the con-cept of proof and proof techniques; volume; and applicationsof geometry to three dimensions. Items in plane geometrycover the following topics:
Identification of plane geometric figuresBasic properties of a circle: radius, diameter, and circum-
ferenceMeasurement and construction of right, acute, and obtuse
anglesParallel lines and transversalsCongruent and similar trianglesAreas of circles, triangles, rectangles, parallelograms,
trapezoids, and, with formulas, other figuresPythagorean theoremLines, segments, and raysPerpendicular linesProperties of trianglesRatio of sides in 45°-45°-90° triangles and 30°-60°-90°
trianglesCircumference and arc length
Coordinate Geometry. Questions in this content areaare based (as appropriate for the grade levels across PLANand the ACT) on graphing and the relations between equa-tions and graphs, including points, lines, polynomials, cir-
cles, and other curves; graphing inequalities; slope; paralleland perpendicular lines; distance; midpoints; and conics.Questions in coordinate geometry cover the following topics:
Graphing on the number lineIdentification and location of points in the coordinate
planeDetermination of graphs of functions and relations in the
plane by plotting pointsGraphs of linear equations in two variablesSlope of a lineDistance formula for points in the plane
Intermediate Algebra. Questions in this content area(which applies to the ACT only) are based on an under-standing of the quadratic formula, rational and radicalexpressions, absolute value equations and inequalities,sequences and patterns, systems of equations, quadraticinequalities, functions, modeling, matrices, roots of polyno-mials, and complex numbers. Questions in intermediatealgebra cover the following topics:
Solution of linear inequalities in one variableOperations with integer exponentsOperations with rational expressionsSlope-intercept form of a linear equationOperations with radical expressionsQuadratic formulaGraphs of parabolas, circles, ellipses, and hyperbolasZeros of polynomialsRational exponentsEquations of circlesSolution of systems of two linear equations in two variablesSimple absolute value equations and inequalitiesGraphical solutions to systems of equations and/or
inequalitiesEquations of parallel and perpendicular lines
Trigonometry. Questions in this content area (whichapplies to the ACT only) are based on understandingtrigonometric relations in right triangles; values and proper-ties of trigonometric functions; graphing trigonometric func-tions; modeling using trigonometric functions; use oftrigonometric identities; and solving trigonometric equations.Questions in trigonometry cover the following topics:
Right triangle trigonometryTrigonometric functionsGraphs of trigonometric functions, including amplitude,
period, and phase shiftTrigonometric identitiesAddition formulas for sine and cosineSimple trigonometric equations

70
APPENDIX D: Test Specifications for the EPAS English/Writing, Mathematics, Reading, and Science Tests
Reading Test Specifications
The text content areas, number of passages, passage lengths,and number (and proportion) of items for the EXPLORE, PLAN,and ACT Reading Tests are summarized in Table D.4.
Table D.4Reading Test Specifications
Testing program
Content area EXPLORE PLAN ACT
Prose Fiction 10 (.33) 8 (.32) 10 (.25)
Humanities 10 (.33) 9 (.36) 10 (.25)
Social Sciences 10 (.33) 8 (.32) 10 (.25)
Natural Sciences 10 (.25)
Total 30 25 40
Passages 3 3 4
Passage Length 500 words 500 words 750 words

71
APPENDIX D: Test Specifications for the EPAS English/Writing, Mathematics, Reading, and Science Tests
Reading Continuum Content andCognitive Level Descriptions
Cognitive Levels
Questions in the Reading Tests are classified in the gen-eral categories of Referring and Reasoning.
Referring. The questions in this category ask about mate-rial explicitly stated in a passage. These questions aredesigned to measure literal reading comprehension. A ques-tion is classified in the Referring category if the informationrequired to answer it is directly given in the passage text. Insuch questions, there are usually relationships between thelanguage of the passage and that of the question, and theanswer to the question is typically evident in a single sen-tence, or two adjacent sentences, in the passage. SomeReferring questions paraphrase the language of the passage.
Main ideasRecognizing the main idea of a passageRecognizing the main idea of a paragraph or para-
graphs
Significant detailsRecognizing the information in a written passage that
answers the questions who, what, where, when,why, and how
RelationshipsRecognizing sequencesRecognizing cause-effect relationshipsRecognizing comparative relationships (comparisons
and contrasts)
Reasoning. The questions in this category ask aboutmeaning implicit in a passage and require cogent reasoningabout a passage. These questions are designed to measure“meaning making” by logical inference, analysis, and synthe-sis. A question is classified in the Reasoning category if itrequires inferring or applying a logical process to elicit ananswer from the passage, or if it demands that the examineecombine many statements in the passage or interpret entiresections of the text.
Inferences from the textInferring the main idea or purpose of a passageInferring the main idea or purpose of a paragraph or
paragraphsShowing how details are related to the main idea (e.g.,
how they support the main idea)Inferring sequencesInferring cause-effect relationships
Critical understanding of the textDrawing conclusions from information givenMaking comparisons and contrasts using stated infor-
mation
Making appropriate generalizationsRecognizing logical fallacies, rhetorical flaws, or
limitations in textsRecognizing stereotypesUnderstanding point of viewDistinguishing between fact and opinion
VocabularyDetermining specific meanings of words or short
phrases within the context of a passage
Content Areas
The content of the Reading Tests ranges widely amongtopics under the content areas named in Table D.4. As is trueof the other content domains, the stimulus material for theReading Tests becomes more challenging with the increasein the grade level being assessed; as Table D.4 shows, at the8th-/9th- and 10th-grade levels, three content areas are usedto assess reading skill (prose fiction, humanities, and socialsciences). At the 11th-/12th-grade level, natural sciences textmaterial is added.
Prose fiction. The questions in this area are based onintact short stories or passages from short stories or novels.
Humanities. The questions in this area are based onpassages from memoirs, personal essays, and essays onarchitecture, art, dance, ethics, film, language, literary criti-cism, music, philosophy, radio, television, or theater.Passages describe or analyze works of art, ideas, or values.
Social sciences. The questions in this area are based onpassages in anthropology, archaeology, biography, busi-ness, economics, education, geography, history, political sci-ence, psychology, or sociology. Passages typically presentinformation gathered by research into written records or sur-vey sampling rather than data gained by scientific experi-mentation.
Natural sciences. The questions in this area are basedon passages in anatomy, astronomy, biology, botany, chem-istry, ecology, geology, medicine, meteorology, microbiology,natural history, physiology, physics, technology, or zoology.Passages present a science topic with a lucid explanation ofits significance.
Question Ordering
Reading Test questions are arranged according to a pro-tocol that places more general questions ahead of more spe-cific questions and that places questions about portions ofthe passage in the order in which those portions appear inthe passage. ACT adopted this protocol, with the approval ofreading consultants from outside ACT and after careful con-sideration of the measurement issues involved, to provideexaminees with as natural and logical a sequence of itemsas possible.

72
APPENDIX D: Test Specifications for the EPAS English/Writing, Mathematics, Reading, and Science Tests
Science Test Specifications
The EPAS Science Tests measure the student’s interpre-tation, analysis, evaluation, reasoning, and problem-solvingskills required in the natural sciences. A test for a given pro-gram is made up of five to seven test units, each of whichconsists of some scientific information (the stimulus) and aset of multiple-choice test items. Knowledge acquired ingrade-level-appropriate science courses is needed toanswer some of the questions. The tests emphasize scien-tific reasoning skills over recall of science content, skill inmathematics, or reading ability. The use of calculators is not
permitted on the Science Tests. Table D.5 summarizes thetest specifications for the EXPLORE, PLAN, and ACTScience Tests. Under the “Format” heading are the numbers(and proportions) of test questions associated with each ofthe three types of presentations used in the three tests.Under the “Cognitive Level” heading are the distributions ofquestions assessing the three cognitive levels. Finally, underthe “Subject Matter” heading are the distributions of testquestions by content domain being assessed. The termsused in the tables are defined in the next section.
Table D.5Science Test Specifications
Testing program
Format EXPLORE PLAN ACT
Data Representation 12 (.43) 10 (.33) 15 (.38)
Research Summaries 10 (.36) 14 (.47) 18 (.45)
Conflicting Viewpoints 6 (.21) 6 (.20) 7 (.17)
Total 28 30 40
Cognitive level
Understanding 12 (.43) 9 (.30) 7 (.18)
Analysis 10 (.36) 13 (.43) 20 (.50)
Generalization 6 (.21) 8 (.27) 13 (.32)
Total 28 30 40
Subject matter
Life Science 3
Physical Science 2
Earth/Space Science 1 1–2* 1–2*
Biology 1–2* 1–2*
Chemistry 1–2* 1–2*
Physics 1–2* 1–2*
Total 6 5 7
*At least one topic is required in this content area, and some test forms may have two topics. No more than two topics in a particular content area are allowed.

73
APPENDIX D: Test Specifications for the EPAS English/Writing, Mathematics, Reading, and Science Tests
The following section provides detailed descriptions ofthe materials used in the EPAS Science Tests. Thesedescriptions are presented in the order in which the informa-tion was summarized in Table D.5: first the formats for thestimulus material, then the definitions of the cognitive levelsbeing assessed, and finally lists of the content included inthe fields of science covered at each test level.
Science Continuum Stimulus Material, Cognitive Level,and Content Area Descriptions
Stimulus Material
Each stimulus used in the Science Tests as the basis forthe test questions follows one of three formats. These for-mats are very specific in their intent and style, each beingused to tap a specific subset of scientific reasoning skills.
Data representation format. The data representationformat is intended to test the examinee’s ability to under-stand, evaluate, and interpret information presented in agraphic or tabular format. The information may consist of anytype of data that can be presented with minimal explanation.Examples include the results of simple experiments, obser-vations, summarized data, figures, or flowcharts.
Research summaries format. The research summariesformat is intended to evaluate an examinee’s abilities tocomprehend, evaluate, analyze, and interpret the design ofexperiments. In particular, the skills to be assessed usingthis format include the following:
The understanding of the premise of the experiment(observation, confirmation, or hypothesis testing)
The relationship of the design to the premiseThe understanding of control groupsVariations in experimental designsWeaknesses of the experiment due to assumptions or
limitations embedded in the design
Almost anything that relates to how scientists view exper-iments is a valid topic in this type of format. However, sincethe data representation format covers the aspects of inter-pretation of data, the tabular or graphic presentation of theexperiments alone is not a major point of consideration. Thesimulated research studies are of sufficient complexity toallow significant comparisons of results. Often, a number oflinked, related experiments are presented that build on eachother and provide an extended simulation of severalresearch studies.
Conflicting viewpoints format. The conflicting view-points format is intended to test the examinee’s ability toevaluate two or more alternative theories, hypotheses, orviewpoints on a specific, observable phenomenon. This phe-nomenon may be a simple observation or a more complexprocess. The alternative viewpoints disagree in some clear
fashion that is plausible, but they need not necessarily bebased on a contemporary scientific controversy. The mainrestriction is that they be logical and complete. The alterna-tive viewpoints are based on realistic assumptions and havelogical conclusions.
Cognitive Levels
The questions in the Science Tests are classified accord-ing to three primary cognitive levels: understanding, analy-sis, and generalization. Within each of the three majorcognitive classifications there are a number of subclassifica-tions. These are presented to clarify the types of test ques-tions that are within the major categories, but they are notmeant to provide an exhaustive list. Some of the subclassi-fications do not apply to some of the stimulus formats. Forexample, a classification referring to experimental design isnot appropriate for a data representation format. The stimu-lus formats that support questions with each subclassifica-tion are coded at the end of each description using DR fordata representation, RS for research summaries, and CV forconflicting viewpoints.
Understanding. Understanding questions test students’ability to comprehend the information presented and, to alimited extent, their understanding of how it fits into thegeneral scheme of the particular stimulus format. Examplesof this ability include comprehending how the information in a bar graph is organized, understanding the controlgroup’s function in an experiment, and identifying unstatedassumptions and the concept that serves as the basis for aparticular theory. A question in the understanding classifica-tion does not merely ask the student to understand what iswritten, but to understand how that information is related toother parts of the material provided in the stimulus. Anunderstanding question specifically deals with only a smallpart of the material in the stimulus, such as a single datapoint, graph axis, hypothesis, or experimental step.
Understanding—The ability to:Explain, describe, identify, or compare the basicfeatures of, and concepts related to, the providedinformation. (DR, RS, CV)Explain, describe, identify, or compare the componentsof the experimental design or process. (RS)Explain, describe, identify or compare the basicfeatures or data points in graphs, charts, or tables.(DR)Explain, describe, or identify basic scientific conceptsor assumptions underlying the provided information.(DR, RS, CV)Select the appropriate translation of the providedinformation into a graph, figure, or diagram. (DR, RS,CV)

74
APPENDIX D: Test Specifications for the EPAS English/Writing, Mathematics, Reading, and Science Tests
Analysis. Analysis questions should go beyond the levelof understanding questions in testing the student’s ability torelate a number of components of the presented material toeach other on a higher, more abstract level. Examples of thisquestion type include relating hypotheses to experimentaldesign or data, and evaluating how a viewpoint is related toanother viewpoint or to an observable phenomenon.Essentially, the student is required to exhibit the ability to seehow each piece of information in the presentation fits in withthe rest of the stimulus and what importance each piece hasin reference to the topic. Often, an analysis question willprompt a student to carefully pick apart the details presentedand piece them back together to get an overall view of thepresented topic. An analysis question typically deals with amajor portion of the presented information, such as agraphed relationship, one or more experiments, or one ormore viewpoints. An analysis question does not extendbeyond the scope of the presented material.
Analysis—The ability to:Critically examine the relationships between theinformation provided and the conclusions drawn orthe hypotheses developed. (DR, RS, CV)Determine whether information or results support orare consistent with a point of view, hypothesis, orconclusion. (DR, RS, CV)Determine whether a hypothesis or conclusionsupports or is consistent with a point of view, theresults of a single experiment, or the informationpresented in a single graph or table. (DR, RS, CV)Evaluate experimental procedures, viewpoints, ortheories for their strengths, weaknesses, similarities,or differences. (RS, CV)Specify alternative ways of testing the point of view orhypothesis, or specify alternative ways of producingthe same results. (RS, CV)
Generalization. Generalization questions test the stu-dent’s ability to see how the stimulus material relates to therest of the world. A generalization question may ask for ageneral model of a scientific concept that is embedded in thepresented data (for example, deduce a gas law from a set ofdata), how the results of an experiment could be used toassist someone in resolving a problem in the real world, orhow a theory could be modified to account for some new,unforeseen data or phenomena. While generalization ques-tions may not always be the most difficult for a student, theyare intended to demand that the student assimilate all of thematerial presented and extend discovered concepts to newsituations.
Generalization—The ability to:Generalize from given information to gain newinformation, generate a model, or make predictions.(DR, RS, CV)Extend concepts, procedures, or hypotheses to newsituations to gain new information. (RS, CV)Generalize beyond the given information to a broadercontext, or generate a model consistent with theprovided information. (DR, RS, CV)Predict outcomes on the basis of the providedinformation. (DR, RS, CV)
Content Areas
The content areas used to assess Science skills parallelthe content courses commonly taught at Grades 7–12, andat the entry level at colleges and universities. Each testactivity uses stimulus materials from one of these areas.Materials are produced specifically for the Science Tests.They are required to match the level of complexity of thoseused in the classroom. Often, students are confronted with anew situation to engage their reasoning skills.
The topics included in each content area are summarizedbelow.
Life Science. The stimulus materials and questions inthis content area cover such topics as biology, botany, ecol-ogy, health, human behavior, and zoology.
Physical Science. The stimulus materials and questionsin this content area cover such topics as simple chemical for-mulas and equations and other basic chemistry, weights andmeasures, and basic principles of physics.
Earth/Space Science. The stimulus materials and ques-tions in this content area cover such topics as geology,meteorology, astronomy, environmental science, andoceanography.
Biology. The stimulus materials and questions in thiscontent area cover such topics as cell biology, botany, zool-ogy, microbiology, ecology, genetics, and evolution.
Chemistry. The stimulus materials and questions in thiscontent area cover such topics as atomic theory, inorganicchemical reactions, chemical bonding, reaction rates, solu-tions, equilibriums, gas laws, electrochemistry, and proper-ties and states of matter.
Physics. The stimulus materials and questions in thiscontent area cover such topics as mechanics, energy, ther-modynamics, electromagnetism, fluids, solids, and lightwaves.
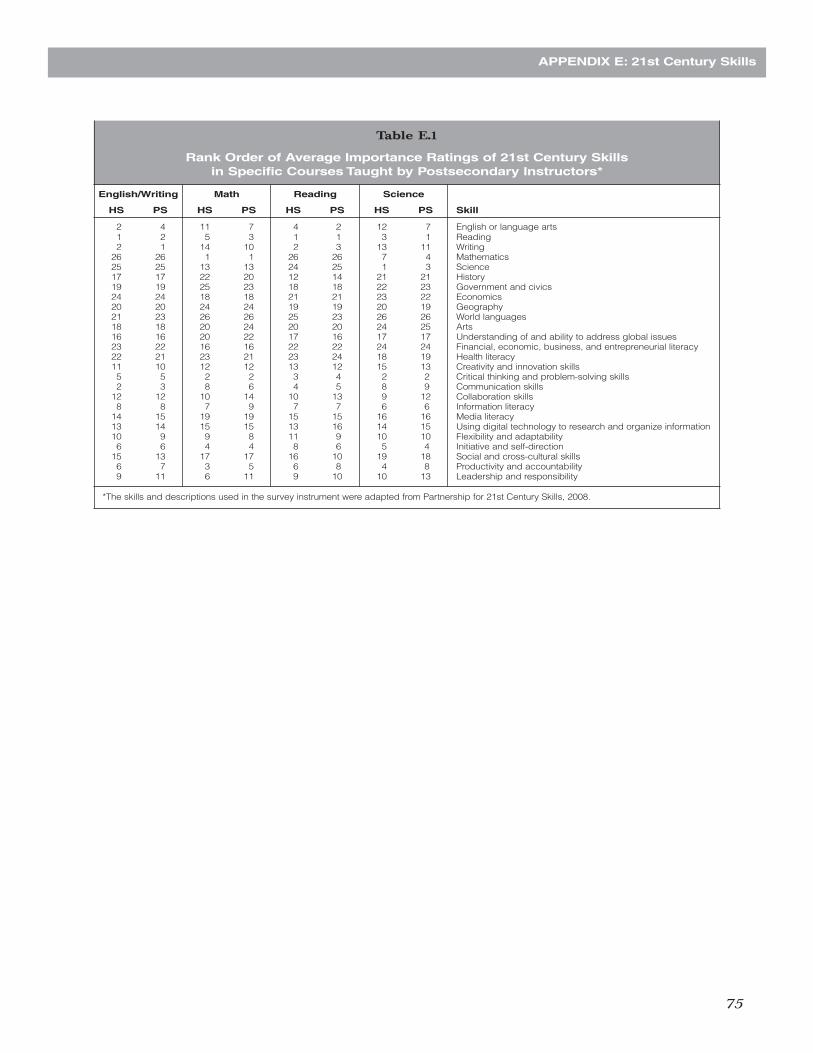
75
APPENDIX E: 21st Century Skills
Table E.1
Rank Order of Average Importance Ratings of 21st Century Skills in Specific Courses Taught by Postsecondary Instructors*
English/Writing Math Reading Science
HS PS HS PS HS PS HS PS Skill
2 4 11 7 4 2 12 7 English or language arts1 2 5 3 1 1 3 1 Reading2 1 14 10 2 3 13 11 Writing
26 26 1 1 26 26 7 4 Mathematics25 25 13 13 24 25 1 3 Science17 17 22 20 12 14 21 21 History19 19 25 23 18 18 22 23 Government and civics24 24 18 18 21 21 23 22 Economics20 20 24 24 19 19 20 19 Geography21 23 26 26 25 23 26 26 World languages18 18 20 24 20 20 24 25 Arts 16 16 20 22 17 16 17 17 Understanding of and ability to address global issues23 22 16 16 22 22 24 24 Financial, economic, business, and entrepreneurial literacy22 21 23 21 23 24 18 19 Health literacy 11 10 12 12 13 12 15 13 Creativity and innovation skills5 5 2 2 3 4 2 2 Critical thinking and problem-solving skills2 3 8 6 4 5 8 9 Communication skills
12 12 10 14 10 13 9 12 Collaboration skills8 8 7 9 7 7 6 6 Information literacy
14 15 19 19 15 15 16 16 Media literacy 13 14 15 15 13 16 14 15 Using digital technology to research and organize information10 9 9 8 11 9 10 10 Flexibility and adaptability6 6 4 4 8 6 5 4 Initiative and self-direction
15 13 17 17 16 10 19 18 Social and cross-cultural skills 6 7 3 5 6 8 4 8 Productivity and accountability9 11 6 11 9 10 10 13 Leadership and responsibility
*The skills and descriptions used in the survey instrument were adapted from Partnership for 21st Century Skills, 2008.

Table F.1
How Course Content Topics Are TaughtWriting
MS % HS % REM %
1 2 3 1 2 3 1 2 3 Topics and Skills
Composition Process and Purpose1 25 74 1 33 67 5 11 84 Determine purpose and audience 0 27 72 2 45 54 2 13 85 Use prewriting, brainstorming, or other techniques of invention 1 31 67 8 48 43 3 19 78 Use mapping, clustering, outlining, or other organizational tools
11 26 63 4 18 78 34 14 52 Gather and synthesize resources 16 29 56 5 18 77 34 18 48 Evaluate source materials critically 0 22 78 2 27 71 4 6 90 Develop a cohesive first draft 0 22 78 1 24 75 4 4 92 Revise for content 0 23 77 1 32 67 1 10 89 Edit and proofread for usage and mechanics
14 21 65 4 13 83 39 15 45 Cite sources accurately 3 24 73 4 22 74 11 12 77 Avoid plagiarism 6 17 77 5 25 70 22 21 58 Develop one's own voice as a writer
48 19 33 54 16 30 88 6 6 Make use of and adapt elements of the writing process to create media productions 5 29 66 4 34 62 7 14 79 Write to explore ideas 2 30 68 9 42 49 20 24 56 Write to express one's feelings 5 26 68 26 33 41 31 20 49 Write to tell a story through fiction or nonfiction
10 17 73 3 12 85 59 13 28 Write to analyze literature 36 28 36 29 30 41 57 21 22 Write to analyze media 2 22 76 2 24 74 5 5 91 Write to convey information 6 14 81 2 16 82 11 10 80 Write to argue or persuade readers
19 30 51 32 33 35 22 17 61 Write to describe a process or how to do something 52 20 28 57 21 22 77 12 11 Write to produce work-related texts 19 20 62 8 17 74 59 11 30 Write to present research 0 11 88 0 14 86 5 1 94 COMPOSITION PROCESS AND PURPOSE as an overall set of skills
Topic and Idea Development6 11 84 2 18 80 2 3 95 Present a thesis that establishes focus on the topic 0 17 83 1 21 78 1 4 95 Maintain a focus on the general topic throughout a piece of writing 4 21 75 2 21 77 3 7 90 Narrow the focus to a specific issue within the general topic 4 31 64 2 36 61 5 15 80 Provide appropriate context or background information for readers 1 14 86 0 18 82 2 2 96 Develop ideas by using some specific reasons, details, and examples 6 14 80 3 19 78 11 8 81 Take and maintain a position on an issue 9 18 72 3 15 82 27 11 62 Support claims with multiple and appropriate sources of evidence
31 28 41 13 31 56 31 23 46 Differentiate between assertions and evidence 22 28 50 11 35 54 29 24 47 Fairly and accurately represent different points of view on an issue 32 21 47 14 32 54 36 17 47 Anticipate and respond to counterarguments to a position taken on an issue 14 26 60 10 33 57 10 15 75 Show some movement between general and specific ideas and examples 18 30 52 12 37 51 16 23 61 Identify the basic purpose or role of a phrase or sentence within a piece of writing 3 25 72 2 27 70 4 18 78 Determine the appropriateness of wording for audience and purpose 4 33 63 6 38 55 5 14 82 Delete a clause or sentence because it is obviously irrelevant to a piece of writing 4 33 62 6 39 55 5 14 80 Delete material that disturbs the development or flow of a piece of writing 6 20 74 3 23 74 7 10 84 Determine whether a piece of writing has accomplished its intended purpose 0 13 86 0 15 85 1 4 94 TOPIC AND IDEA DEVELOPMENT as an overall set of skills
Organization, Unity, and Coherence1 21 78 2 28 70 2 5 94 Provide an adequate organization with a logical grouping of ideas 1 17 83 2 27 71 2 7 91 Use discernible introductions and conclusions 1 24 75 1 35 64 3 9 88 Use appropriate transition words and phrases within a sentence or to connect sentences within a paragraph 2 24 74 1 37 62 6 10 84 Use effective transition sentences to connect paragraphs 8 32 59 . . . . . . Use conjunctive adverbs to show time relationships (e.g., then, this time)
17 33 51 12 43 46 14 21 65 Use conjunctive adverbs or phrases to express straightforward logical relationships 12 39 49 14 45 41 12 20 67 Select the most logical place to add a sentence in a paragraph 8 35 57 9 41 50 9 18 73 Determine the most logical place to add information to a piece of writing 1 18 81 1 28 72 2 6 91 ORGANIZATION, UNITY, AND COHERENCE as an overall set of skills
Note:MS = Middle school teachersHS = High school teachersREM = Remedial teachers1 = Not taught in course2 = Taught in the course but mainly as Review3 = Taught in course as part of the Standard Course Content. = This item was not asked at this grade level.
76
APPENDIX F: Content Topics “Taught” Percentages

Table F.1
How Course Content Topics Are TaughtWriting (continued)
MS % HS % REM %
1 2 3 1 2 3 1 2 3 Topics and Skills
Word Choice in Terms of Style,Tone, Clarity, and Economy18 36 47 16 45 38 24 28 48 Revise expressions that deviate from the style of a piece of writing 2 32 66 . . . . . . Revise sentences to correct awkward and confusing arrangements of sentence elements
13 30 57 10 37 53 18 28 54 Maintain consistency of tone 1 24 75 2 30 67 7 17 77 Choose words and images that are specific, precise, and clear in terms of their context 1 26 73 2 30 68 4 19 77 Use appropriate vocabulary 5 35 60 5 42 52 10 21 69 Delete obviously synonymous and wordy material in a sentence 3 25 72 3 33 64 12 28 60 Use varied words and images 3 35 62 . . . . . . Revise vague nouns and pronouns 4 30 66 4 39 57 5 18 77 Avoid vague pronouns (i.e., pronouns without a clear antecedent)
13 38 49 10 49 41 10 26 65 Determine the clearest and most logical conjunction to link clauses 34 23 44 14 32 54 10 22 69 Use rhetorically effective subordination, coordination, and parallelism 2 32 66 2 33 65 5 23 72 WORD CHOICE IN TERMS OF STYLE,TONE, CLARITY, AND ECONOMY as an overall
set of skills
Sentence Structure and Formation34 24 42 12 39 50 6 19 76 Avoid faulty subordination, coordination, and parallelism 2 24 74 4 43 54 1 13 86 Use punctuation and conjunctions to avoid awkward sentence fragments and fused sentences
(i.e., comma splices, run-on sentences) 3 26 71 . . . . . . Use punctuation and conjunctions to join clauses
18 32 49 9 47 44 12 22 65 Avoid dangling and misplaced modifiers 7 31 62 7 46 47 6 17 77 Decide on appropriate verb tense and voice by considering the meaning of an entire sentence
10 31 59 . . . . . . Revise shifts in verb tense between simple clauses in a sentence or between simple adjoining sentences 6 29 64 7 45 49 6 17 77 Decide on appropriate verb tense and voice in terms of a paragraph or a piece of writing
13 30 57 8 46 46 6 21 73 Avoid inappropriate shifts of mood, number, or person 19 37 44 14 51 35 9 25 66 Identify missing or incorrect relative pronouns 6 25 69 4 40 57 9 22 69 Use some varied kinds of sentence structures to vary pace and to support meaning 4 26 70 3 47 50 3 17 79 SENTENCE STRUCTURE AND FORMATION as an overall set of skills
Conventions of Usage16 38 46 31 47 22 13 29 58 Form simple and compound tenses of regular and irregular verbs 18 38 44 . . . . . . Form past and past participle of irregular and commonly used verbs 15 43 42 . . . . . . Form comparative and superlative adjectives 17 40 43 29 49 22 19 34 47 Form modifiers 17 37 46 34 44 22 19 37 43 Choose between using an adverb and using an adjective in a particular situation 3 35 62 13 48 40 3 23 75 Ensure straightforward subject-verb agreement 5 37 58 12 46 42 5 23 72 Ensure straightforward pronoun-antecedent agreement
16 27 57 17 43 40 12 25 63 Ensure subject-verb and pronoun-antecedent agreement in unusual or tricky situations (e.g., subject-verb orderis inverted; subject is an indefinite pronoun)
4 38 58 17 51 32 8 25 67 Use the proper form of possessive pronouns 7 38 55 19 49 32 9 25 66 Use the appropriate case of a pronoun
16 36 48 23 49 28 20 31 49 Use the idioms of standard written English 13 46 41 30 49 21 19 31 50 Determine which preposition to use in simple contexts 28 38 34 31 47 23 33 31 36 Determine the appropriate preposition to use in situations involving sophisticated language or ideas 5 45 49 15 56 30 8 29 63 Use the appropriate word in frequently confused pairs of words (e.g., past and passed) 4 35 61 11 54 35 5 25 70 CONVENTIONS OF USAGE as an overall set of skills
Conventions of Punctuation11 35 54 14 51 36 9 30 62 Delete commas that disturb sentence flow (e.g., between modifier and modified element) 3 39 58 11 52 37 3 25 72 Provide appropriate punctuation in straightforward situations (e.g., items in a series) 7 29 65 11 50 39 4 23 73 Punctuate between clauses of compound sentences when the conjunction is omitted
13 28 59 15 48 37 9 23 68 Punctuate before a conjunctive adverb joining clauses of a compound sentence 14 28 58 12 48 40 12 30 58 Punctuate parenthetical elements with commas, parentheses, and dashes 15 23 62 12 50 38 8 25 67 Punctuate essential/nonessential elements, subordinate clauses, and restrictive/nonrestrictive appositives 5 36 58 13 52 35 7 29 64 Punctuate possessive nouns and pronouns 2 31 67 14 45 42 17 35 48 Punctuate dialogue
10 26 64 9 43 48 5 21 74 Use a semicolon to indicate a close relationship between two independent clauses 22 24 54 14 45 41 20 27 53 Use semicolons when items in a series have internal punctuation (e.g., when items have their own commas) 11 29 60 12 48 40 16 28 56 Use a colon to introduce a series of phrases (e.g., a list of examples) 29 26 46 18 46 36 27 27 45 Use a colon to introduce one or more sentences 3 32 65 8 51 41 5 25 70 CONVENTIONS OF PUNCTUATION as an overall set of skills
Note:MS = Middle school teachersHS = High school teachersREM = Remedial teachers1 = Not taught in course2 = Taught in the course but mainly as Review3 = Taught in course as part of the Standard Course Content. = This item was not asked at this grade level.
77
APPENDIX F: Content Topics “Taught” Percentages

Table F.2
How Course Content Topics Are TaughtMathematics
MS % HS % REM %
1 2 3 1 2 3 1 2 3 Topics and Skills
Process Skills12 47 41 16 46 39 21 30 49 Choose an appropriate method for calculating (e.g., mental, paper and pencil, calculator, or estimation) 6 53 41 15 54 31 16 35 49 Estimate a reasonable result without using a calculator
18 37 44 44 27 29 60 22 18 Demonstrate concepts using manipulatives 5 32 62 8 29 63 15 29 56 Demonstrate concepts using pictorial representations 1 8 92 1 9 90 3 6 91 Solve problems posed in real-world settings and interpret the solutions
10 40 50 12 34 53 27 27 45 Recognize when essential information is missing 1 9 90 1 12 87 2 6 91 Plan and carry out a strategy for solving multistep problems 5 33 61 4 25 70 7 17 75 Recognize generalizations of mathematical ideas 1 15 84 3 22 76 6 16 77 Recognize and use patterns to solve problems 3 14 83 3 13 83 7 16 77 Apply mathematical ideas to new contexts
12 19 69 14 23 64 42 21 37 Formulate new patterns or structures 13 16 71 8 17 76 27 17 56 Solve several problems representing different aspects/components of one larger problem or scenario 30 18 52 16 25 59 41 19 40 Understand roles of definitions, proof, and counterexamples 1 27 72 3 34 63 2 17 80 Recall basic facts, definitions, formulas, and algebraic procedures as needed to solve a problem
38 19 43 11 23 66 42 19 39 Recall theorems and more complex formulas when needed to solve a problem 43 13 44 16 18 66 43 14 43 Apply theorems to solve a problem 80 11 9 48 17 35 84 11 6 Construct and/or critique proofs, either informal or formal 18 46 36 21 41 38 27 31 42 Perform basic operations with a calculator 65 12 23 47 16 37 84 7 9 Use the statistical capabilities of a calculator 58 7 35 26 12 62 70 11 19 Use the graphical capabilities of a calculator 58 13 28 49 18 33 75 12 14 Use the symbolic algebra capabilities of a calculator 76 13 11 86 8 5 93 6 2 Use spreadsheets 77 11 12 74 12 14 86 8 6 Use dynamic geometry 6 42 52 10 44 46 10 24 66 Solve routine problems quickly
24 33 44 20 38 42 39 26 35 Solve novel problems quickly 1 22 78 2 19 79 1 7 92 Use mathematical symbols correctly
16 26 58 14 30 55 20 22 58 Understand new material from reading a textbook 18 25 57 20 31 49 45 17 38 Work in a self-directed group 6 22 72 7 28 66 16 16 68 PROCESS SKILLS as an overall topic
Basic Operations and Applications3 32 65 29 43 28 8 24 69 Perform addition, subtraction, multiplication, and division on signed rational numbers
10 50 40 . . . . . . Perform one-step computations with whole numbers and decimals 2 20 78 15 34 51 5 15 79 Solve problems using ratios and proportions 4 24 72 32 39 29 5 19 76 Solve problems involving percents (e.g., simple interest, tax, and markdowns)
10 37 53 28 44 29 26 27 46 Convert units of measure 9 48 43 38 39 24 12 27 61 Solve routine one-step arithmetic problems 5 31 64 25 40 35 5 23 72 Solve routine two- or three-step arithmetic problems
11 27 63 20 35 45 14 25 61 Solve nonroutine two- or three-step arithmetic problems 10 26 64 25 37 39 28 23 48 Solve multistep arithmetic problems that involve planning or converting units of measure 7 15 78 19 35 46 16 12 72 Solve word problems containing several rates, proportions, or percentages 4 30 67 19 47 34 5 14 81 BASIC OPERATIONS AND APPLICATIONS as an overall topic
Numbers: Concepts and Properties30 55 15 . . . . . . Identify a digit's place 13 59 27 32 50 18 10 30 60 Exhibit knowledge of elementary number concepts (e.g., rounding, decimal ordering, pattern identification,
absolute value, primes, and greatest common factor) 10 46 44 50 38 13 17 26 57 Order fractions 18 57 25 . . . . . . Recognize one-digit factors of a number 12 51 37 35 45 20 5 24 71 Find and use the least common multiple 8 56 36 . . . . . . Recognize equivalent fractions and fractions in lowest terms 3 15 82 9 32 59 6 14 80 Perform computations with squares and square roots of numbers
32 12 56 25 28 48 28 14 58 Perform computations with cubes and cube roots of numbers 9 9 81 12 33 55 8 8 84 Apply rules of exponents
72 11 16 52 9 39 84 6 11 Perform matrix addition and multiplication 16 18 66 35 14 51 77 10 14 Exhibit knowledge of series and sequences (e.g., arithmetic and geometric) 56 16 28 47 27 27 64 11 24 Find union and intersection of sets 9 13 78 17 30 53 27 16 57 Apply properties of rational and irrational numbers . . . 46 8 45 61 5 35 Exhibit knowledge of complex numbers . . . 48 7 45 66 4 30 Apply properties of complex numbers 5 30 65 20 39 41 11 17 72 Apply number properties involving multiples and factors 8 21 71 34 41 25 27 16 56 Use scientific notation . . . 19 23 59 12 7 81 Determine when an expression is undefined . . . 41 11 48 79 5 16 Exhibit knowledge of logarithms and geometric sequences 2 25 73 14 32 54 5 16 78 NUMBERS: CONCEPTS AND PROPERTIES as an overall topic
Note:MS = Middle school teachersHS = High school teachersREM = Remedial teachers1 = Not taught in course2 = Taught in the course but mainly as Review3 = Taught in course as part of the Standard Course Content. = This item was not asked at this grade level.
78
APPENDIX F: Content Topics “Taught” Percentages

Table F.2
How Course Content Topics Are TaughtMathematics (continued)
MS % HS % REM %
1 2 3 1 2 3 1 2 3 Topics and Skills
Expressions, Equations, and Inequalities2 12 86 19 43 39 7 12 81 Evaluate algebraic expressions by substituting integers for unknown quantities 2 32 66 . . . . . . Exhibit knowledge of basic expressions 4 12 84 20 46 34 9 10 81 Add and subtract simple algebraic expressions 6 12 82 . . . . . . Combine like terms 6 13 81 20 46 34 7 11 82 Solve routine first-degree equations 9 6 85 17 44 39 11 9 80 Solve linear equations and inequalities in one variable 2 18 80 . . . . . . Substitute whole numbers for unknown quantities 4 14 82 14 36 50 6 10 84 Perform word-to-symbol translations 2 8 91 13 38 49 11 9 80 Write expressions, equations, or inequalities for common settings 2 16 82 . . . . . . Solve one-step equations having integer or decimal values
50 3 47 18 40 42 24 7 69 Multiply two binomials 30 8 62 25 28 47 40 4 56 Solve absolute value equations and inequalities 47 4 49 19 34 46 23 7 70 Add, subtract, and multiply polynomials 66 2 32 20 32 48 33 6 61 Factor quadratics 66 3 32 18 31 52 33 2 65 Solve quadratic equations 57 3 40 . . . . . . Apply properties of exponential functions . . . 44 16 40 69 4 28 Solve quadratic inequalities . . . 43 15 43 67 3 29 Use the discriminant . . . 29 17 53 43 3 55 Determine solutions of polynomial and rational equations . . . 51 9 41 79 5 16 Implement remainder and factor theorems for polynomials . . . 44 8 48 80 4 17 Apply properties of logarithmic and exponential functions
43 3 54 17 30 53 43 2 55 Find solutions to systems of linear equations 74 3 23 . . . . . . Solve problems using equations of parabolas and circles . . . 44 11 45 79 4 17 Solve problems using equations of parabolas, circles, ellipses, and hyperbolas . . . 75 4 21 91 3 6 Solve problems using parametric equations
59 4 37 33 16 52 77 3 20 Transform functions algebraically . . . 72 2 25 92 2 7 Find the limit of an expression 5 5 89 10 30 60 18 9 73 EXPRESSIONS, EQUATIONS, AND INEQUALITIES as an overall topic
Graphical Representations10 47 43 34 38 28 18 24 58 Comprehend the concept of length on the number line 5 47 48 . . . . . . Locate points on the number line and in the first quadrant . . . 38 39 23 13 22 64 Locate points on the number line 2 36 62 23 45 31 22 13 65 Locate points in the coordinate plane
17 6 77 11 43 46 26 8 67 Exhibit knowledge of slope 22 5 73 11 41 48 27 5 67 Find the slope of a line 13 11 76 26 38 36 26 12 62 Identify graphs on a number line 20 5 74 21 37 42 30 7 63 Match linear graphs with their equations 24 8 68 12 28 60 31 7 62 Use properties of parallel and perpendicular lines 40 4 56 21 28 51 46 5 50 Solve systems of equations and inequalities graphically 72 5 23 . . . . . . Recognize special characteristics of parabolas and circles . . . 43 12 45 81 5 15 Recognize special characteristics of parabolas, circles, ellipses, and hyperbolas
18 8 74 9 23 68 34 10 56 Interpret and use information from graphs in the coordinate plane 34 7 58 17 19 64 49 9 42 Identify characteristics of graphs based on a set of conditions or on a general equation . . . 43 8 49 81 5 14 Understand the properties of graphs of rational functions (e.g., asymptotes)
52 7 40 19 32 49 61 9 30 Find midpoints 43 7 50 16 32 52 56 8 36 Use the distance formula . . . 48 8 44 78 6 16 Work with discontinuous graphs and piecewise-defined functions 8 10 82 6 30 64 22 12 67 GRAPHICAL REPRESENTATIONS as an overall topic
Properties of Plane Figures25 18 57 54 17 29 69 9 22 Find the measure of an angle using properties of parallel lines 21 21 58 . . . . . . Exhibit some knowledge of angles associated with parallel lines 13 23 64 39 26 34 39 22 38 Exhibit knowledge of basic angle properties and special sums of angle measures (e.g., 90°, 180°, and 360°) 18 8 73 17 35 47 29 13 58 Use the Pythagorean theorem 25 27 48 51 20 29 68 13 19 Apply properties of lines, segments, and rays 30 19 51 50 20 30 69 13 18 Apply properties of special quadrilaterals 34 14 52 37 23 40 64 13 23 Apply properties of 30°-60°-90°, isosceles, similar, and congruent triangles 69 8 23 47 17 36 85 6 10 Use relationships among angles, arcs, and distances in a circle 81 7 12 59 12 29 90 3 7 Use logical relationships to answer problems (e.g., converse, contrapositive, and if-then) 76 9 15 61 12 28 90 4 6 Prove results by mathematical induction 23 21 56 41 27 32 59 22 18 PROPERTIES OF PLANE FIGURES as an overall topic
Note:MS = Middle school teachersHS = High school teachersREM = Remedial teachers1 = Not taught in course2 = Taught in the course but mainly as Review3 = Taught in course as part of the Standard Course Content. = This item was not asked at this grade level.
79
APPENDIX F: Content Topics “Taught” Percentages

Table F.2
How Course Content Topics Are TaughtMathematics (continued)
MS % HS % REM %
1 2 3 1 2 3 1 2 3 Topics and Skills
Measurement6 36 59 27 38 35 14 24 62 Compute the area and perimeter of triangles and rectangles
32 23 45 . . . . . . Estimate or calculate of length of a line segment based on other lengths given on a geometric figure 19 23 58 41 25 34 44 15 41 Compute the perimeter of composite geometric figures with unknown side lengths 11 24 65 34 32 35 34 19 47 Compute the area and circumference of circles after identifying necessary information 11 25 65 39 26 35 39 18 44 Compute the area and perimeter of polygons with known side lengths 20 14 66 40 25 35 57 14 29 Compute volume and surface area (e.g., cylinders, prisms, cones, and pyramids) 33 14 53 46 22 32 63 9 28 Compute the area and volume of composite geometric figures 11 17 72 27 37 36 37 20 44 Use geometric formulas 14 41 46 49 27 25 68 16 16 Understand how to read measurement tools (e.g., rulers and protractors) 19 17 64 42 22 35 75 10 14 Use scale factors to determine the magnitude of a size change 7 23 70 33 33 33 34 29 37 MEASUREMENT as an overall topic
Probability, Statistics, and Data Analysis3 29 68 24 34 42 26 20 54 Read and interpret graphs, charts, and other data representations
10 22 68 34 28 38 54 13 34 Manipulate data from tables and graphs 6 24 70 28 31 41 35 17 48 Perform computations on data from tables and graphs 7 23 71 45 22 33 67 8 24 Represent data (e.g., circle graphs, scatterplots, and frequency distributions)
68 9 23 69 7 24 93 2 5 Exhibit knowledge of correlation, variance, and standard deviation of data 6 41 53 46 30 25 51 14 35 Find the median and mode
10 26 64 42 22 36 82 5 13 Determine the probability of a simple event 34 15 51 . . . . . . Use the relationship between the probability of an event and the probability of its complement 31 13 56 56 12 32 91 3 6 Determine the probability of mutually exclusive, dependent, and independent events 26 19 55 56 16 28 85 2 13 Exhibit knowledge of counting techniques . . . 61 7 31 93 1 6 Exhibit knowledge of combinations, permutations, and the binomial theorem 7 45 48 39 38 24 27 21 53 Calculate the average of a list of numbers
21 20 59 52 25 23 57 10 33 Calculate a missing data value, given the average and all the missing data values but one 11 35 54 . . . . . . Calculate the average, given the number of data values and the sum of the data values 32 20 48 61 19 20 80 6 14 Calculate the average, given the frequency counts of all the data values 73 9 18 71 14 15 76 5 19 Calculate or use a weighted average 6 26 68 45 25 30 60 20 20 PROBABILITY, STATISTICS, AND DATA ANALYSIS as an overall topic
Functions23 5 73 19 21 60 45 5 50 Understand the concept of function 40 6 53 . . . . . . Use function notation 40 5 55 . . . . . . Find the domain and range of functions . . . 25 14 61 51 4 44 Find domain, range, and inverses of functions
30 4 67 19 25 55 45 3 52 Evaluate linear functions based on function notation66 2 32 26 18 56 53 4 43 Evaluate quadratic functions based on function notation75 3 22 35 13 52 63 4 34 Evaluate polynomial functions based on function notation86 2 12 43 11 47 80 3 17 Evaluate composite functions based on function notation78 2 19 31 16 53 86 4 10 Apply basic trigonometric ratios to solve right-triangle problems 84 2 13 39 10 50 92 2 6 Use trigonometric concepts and basic identities to solve problems . . . 52 9 39 94 1 5 Use the law of sines and law of cosines . . . 66 8 26 94 2 4 Apply properties of trigonometric functions and their graphs, including amplitude, period, and phase shift . . . 63 8 29 93 2 5 Use radian measure
96 1 3 69 7 25 94 2 4 Exhibit knowledge of vectors in a plane 44 12 44 24 18 57 61 9 30 FUNCTIONS as an overall topic
Note:MS = Middle school teachersHS = High school teachersREM = Remedial teachers1 = Not taught in course2 = Taught in the course but mainly as Review3 = Taught in course as part of the Standard Course Content. = This item was not asked at this grade level.
80
APPENDIX F: Content Topics “Taught” Percentages

Table F.3a
How Course Content Topics Are TaughtMiddle School Mathematics
(N = 101) (N = 97) (N = 72) (N = 65)7th-grade math 8th-grade math Pre-Algebra Algebra
1 2 3 1 2 3 1 2 3 1 2 3 Topics and Skills
Process Skills11 42 47 14 50 36 13 53 34 11 57 32 Choose an appropriate method for calculating (e.g., mental, paper and pencil,
calculator, or estimation) 4 42 54 3 54 43 9 61 30 8 69 23 Estimate a reasonable result without using a calculator
14 29 57 13 44 43 24 33 43 27 44 30 Demonstrate concepts using manipulatives 2 32 66 5 29 65 4 33 63 8 42 50 Demonstrate concepts using pictorial representations 0 9 91 1 7 92 1 6 93 0 8 92 Solve problems posed in real-world settings and interpret the solutions 7 41 51 14 40 46 10 43 47 6 43 51 Recognize when essential information is missing 1 16 83 0 11 89 1 6 93 0 6 94 Plan and carry out a strategy for solving multistep problems 7 45 48 5 31 64 6 29 65 2 27 71 Recognize generalizations of mathematical ideas 0 15 85 1 15 84 1 13 86 0 19 81 Recognize and use patterns to solve problems 5 15 80 2 18 80 1 10 89 2 16 83 Apply mathematical ideas to new contexts
10 15 75 12 24 64 13 16 71 8 24 68 Formulate new patterns or structures 14 13 73 15 26 60 10 13 76 8 17 75 Solve several problems representing different aspects/components of one larger
problem or scenario 33 19 47 35 14 52 33 26 41 14 23 63 Understand roles of definitions, proof, and counterexamples 2 26 72 2 25 73 0 36 64 0 27 73 Recall basic facts, definitions, formulas, and algebraic procedures as needed to solve a
problem 53 18 29 35 16 49 36 14 49 21 32 48 Recall theorems and more complex formulas when needed to solve a problem 49 15 36 43 9 48 41 7 52 32 29 40 Apply theorems to solve a problem 88 6 6 80 13 7 85 11 4 74 16 10 Construct and/or critique proofs, either informal or formal 10 49 41 21 47 32 16 47 37 30 42 28 Perform basic operations with a calculator 71 10 19 71 11 19 70 10 20 40 19 41 Use the statistical capabilities of a calculator 71 8 21 60 4 36 71 7 21 25 13 63 Use the graphical capabilities of a calculator 69 14 17 66 12 22 64 16 20 38 14 48 Use the symbolic algebra capabilities of a calculator 80 7 13 81 11 8 72 18 10 66 20 14 Use spreadsheets 74 12 14 81 8 11 70 17 13 86 13 2 Use dynamic geometry 9 42 49 4 49 47 3 40 57 8 47 45 Solve routine problems quickly
25 34 41 26 34 40 23 32 45 18 42 40 Solve novel problems quickly 0 20 80 1 20 79 1 26 73 0 31 69 Use mathematical symbols correctly
11 34 55 21 21 57 19 24 57 16 32 52 Understand new material from reading a textbook 15 26 59 23 25 52 20 17 62 8 38 54 Work in a self-directed group 4 18 77 10 20 70 4 22 73 10 30 60 PROCESS SKILLS as an overall topic
Basic Operations and Applications0 16 84 1 37 62 0 33 67 9 55 35 Perform addition, subtraction, multiplication, and division on signed rational numbers 1 53 46 9 59 33 7 55 38 25 51 25 Perform one-step computations with whole numbers and decimals 1 6 92 4 20 76 0 14 86 2 51 48 Solve problems using ratios and proportions 2 12 86 3 20 76 3 17 80 3 58 38 Solve problems involving percents (e.g., simple interest, tax, and markdowns)
10 30 60 9 41 51 4 39 57 12 58 29 Convert units of measure 4 51 45 5 50 45 12 48 41 18 52 29 Solve routine one-step arithmetic problems 3 24 73 4 29 67 6 35 59 11 40 49 Solve routine two- or three-step arithmetic problems
15 28 57 10 16 74 12 20 68 5 42 53 Solve nonroutine two- or three-step arithmetic problems 13 15 72 9 24 67 4 22 74 9 51 40 Solve multistep arithmetic problems that involve planning or converting units of measure 9 2 89 11 11 78 1 16 83 3 40 57 Solve word problems containing several rates, proportions, or percentages 1 20 79 4 29 67 0 30 70 11 48 41 BASIC OPERATIONS AND APPLICATIONS as an overall topic
Note:N = Number of respondentsMissing classes did not have a high enough N-count to include.1 = Not taught in course2 = Taught in the course but mainly as Review3 = Taught in course as part of the Standard Course Content
81
APPENDIX F: Content Topics “Taught” Percentages

Table F.3a
How Course Content Topics Are TaughtMiddle School Mathematics (continued)
(N = 101) (N = 97) (N = 72) (N = 65)7th-grade math 8th-grade math Pre-Algebra Algebra
1 2 3 1 2 3 1 2 3 1 2 3 Topics and Skills
Numbers: Concepts and Properties16 73 11 32 56 12 25 65 10 59 30 11 Identify a digit's place 5 62 32 11 68 22 7 68 25 31 53 16 Exhibit knowledge of elementary number concepts (e.g., rounding, decimal ordering,
pattern identification, absolute value, primes, and greatest common factor) 1 43 56 9 45 46 6 48 46 28 61 11 Order fractions 8 70 23 14 65 22 15 59 26 39 50 11 Recognize one-digit factors of a number 4 58 38 15 53 32 9 49 42 19 61 20 Find and use the least common multiple 1 56 43 8 57 35 3 62 35 20 64 16 Recognize equivalent fractions and fractions in lowest terms 7 4 89 0 12 88 1 13 86 0 39 61 Perform computations with squares and square roots of numbers
48 5 47 36 8 57 32 14 54 14 25 61 Perform computations with cubes and cube roots of numbers 18 9 73 9 8 84 6 12 83 0 13 88 Apply rules of exponents 81 14 5 78 13 9 84 10 6 45 9 45 Perform matrix addition and multiplication 13 12 75 16 15 69 19 19 62 19 28 53 Exhibit knowledge of series and sequences (e.g., arithmetic and geometric) 68 13 19 63 11 27 63 16 21 29 22 49 Find union and intersection of sets 15 10 75 7 13 80 6 14 80 3 19 78 Apply properties of rational and irrational numbers . . . . . . . . . . . . Exhibit knowledge of complex numbers . . . . . . . . . . . . Apply properties of complex numbers 3 26 71 3 39 57 3 29 68 6 36 58 Apply number properties involving multiples and factors
20 12 68 2 17 81 1 13 86 3 44 53 Use scientific notation . . . . . . . . . . . . Determine when an expression is undefined . . . . . . . . . . . . Exhibit knowledge of logarithms and geometric sequences 0 16 84 3 28 68 0 22 78 3 43 54 NUMBERS: CONCEPTS AND PROPERTIES as an overall topic
Expressions, Equations, and Inequalities2 5 93 0 14 86 0 10 90 2 21 78 Evaluate algebraic expressions by substituting integers for unknown quantities 2 30 68 2 26 72 0 40 60 5 44 51 Exhibit knowledge of basic expressions
11 4 85 4 14 82 0 10 90 2 22 76 Add and subtract simple algebraic expressions 17 9 74 3 9 88 0 7 93 0 22 78 Combine like terms 14 5 81 3 13 84 1 10 88 0 25 75 Solve routine first-degree equations 17 2 81 1 7 91 4 9 87 0 8 92 Solve linear equations and inequalities in one variable 0 13 87 1 21 78 1 16 83 3 29 68 Substitute whole numbers for unknown quantities 6 10 84 2 18 80 3 14 83 0 21 79 Perform word-to-symbol translations 3 3 94 1 8 91 0 7 93 0 11 89 Write expressions, equations, or inequalities for common settings 3 3 94 2 18 80 0 11 89 2 32 67 Solve one-step equations having integer or decimal values
84 5 11 51 1 48 50 4 46 3 3 94 Multiply two binomials 47 5 48 36 8 56 30 7 63 3 11 86 Solve absolute value equations and inequalities 82 3 15 44 4 52 43 7 49 5 2 94 Add, subtract, and multiply polynomials 98 1 1 64 2 34 86 1 13 5 3 92 Factor quadratics 96 1 3 66 1 33 86 4 10 5 5 90 Solve quadratic equations 91 1 8 58 4 38 61 1 38 11 6 82 Apply properties of exponential functions . . . . . . . . . . . . Solve quadratic inequalities . . . . . . . . . . . . Use the discriminant . . . . . . . . . . . . Determine solutions of polynomial and rational equations . . . . . . . . . . . . Implement remainder and factor theorems for polynomials . . . . . . . . . . . . Apply properties of logarithmic and exponential functions
77 3 20 32 3 65 49 1 49 3 3 94 Find solutions to systems of linear equations 93 3 4 81 3 16 87 0 13 30 6 63 Solve problems using equations of parabolas and circles . . . . . . . . . . . . Solve problems using equations of parabolas, circles, ellipses, and hyperbolas . . . . . . . . . . . . Solve problems using parametric equations
85 3 12 61 5 34 76 3 21 6 8 86 Transform functions algebraically . . . . . . . . . . . . Find the limit of an expression
11 11 78 1 1 98 0 6 94 0 2 98 EXPRESSIONS, EQUATIONS, AND INEQUALITIES as an overall topic
Note:N = Number of respondentsMissing classes did not have a high enough N-count to include.1 = Not taught in course2 = Taught in the course but mainly as Review3 = Taught in course as part of the Standard Course Content. = This item was not asked at this grade level.
82
APPENDIX F: Content Topics “Taught” Percentages

Table F.3a
How Course Content Topics Are TaughtMiddle School Mathematics (continued)
(N = 101) (N = 97) (N = 72) (N = 65)7th-grade math 8th-grade math Pre-Algebra Algebra
1 2 3 1 2 3 1 2 3 1 2 3 Topics and Skills
Graphical Representations5 45 49 13 52 36 9 53 39 14 54 32 Comprehend the concept of length on the number line 1 46 53 3 49 48 0 53 47 13 49 38 Locate points on the number line and in the first quadrant . . . . . . . . . . . . Locate points on the number line 1 18 81 1 48 51 0 37 63 5 46 49 Locate points in the coordinate plane
37 9 55 6 4 89 11 4 84 0 10 90 Exhibit knowledge of slope 52 5 43 8 3 88 14 3 83 0 8 92 Find the slope of a line 24 7 68 12 12 77 7 13 80 2 17 81 Identify graphs on a number line 37 7 55 14 5 81 17 4 79 0 5 95 Match linear graphs with their equations 35 9 56 23 9 67 36 1 63 2 6 92 Use properties of parallel and perpendicular lines 74 2 24 34 2 64 43 6 51 2 5 94 Solve systems of equations and inequalities graphically 91 5 4 76 5 19 89 1 10 30 6 63 Recognize special characteristics of parabolas and circles . . . . . . . . . . . . Recognize special characteristics of parabolas, circles, ellipses, and hyperbolas
28 5 67 9 13 79 33 6 61 0 6 94 Interpret and use information from graphs in the coordinate plane 54 6 39 32 5 63 40 10 50 0 5 95 Identify characteristics of graphs based on a set of conditions or on a general equation . . . . . . . . . . . . Understand the properties of graphs of rational functions (e.g., asymptotes)
69 8 22 60 4 36 50 6 44 27 8 65 Find midpoints 56 5 39 53 4 43 43 9 48 21 8 71 Use the distance formula . . . . . . . . . . . . Work with discontinuous graphs and piecewise-defined functions
14 15 72 6 4 89 6 11 83 0 3 97 GRAPHICAL REPRESENTATIONS as an overall topic
Properties of Plane Figures26 11 64 20 15 65 16 12 72 36 41 23 Find the measure of an angle using properties of parallel lines 20 15 65 20 15 65 14 16 70 29 41 30 Exhibit some knowledge of angles associated with parallel lines 11 15 74 9 20 71 3 23 74 25 47 28 Exhibit knowledge of basic angle properties and special sums of angle measures
(e.g., 90°, 180°, and 360°) 38 5 57 2 4 94 16 4 80 5 23 72 Use the Pythagorean theorem 20 21 59 24 30 46 19 29 52 41 33 25 Apply properties of lines, segments, and rays 20 14 66 28 20 52 23 17 60 45 31 23 Apply properties of special quadrilaterals 33 7 60 32 14 54 30 16 54 44 27 30 Apply properties of 30°-60°-90°, isosceles, similar, and congruent triangles 66 6 27 69 6 25 75 7 17 69 17 14 Use relationships among angles, arcs, and distances in a circle 89 2 8 84 6 10 87 3 10 66 14 20 Use logical relationships to answer problems (e.g., converse, contrapositive, and if-then) 87 4 9 77 11 12 77 10 13 66 11 23 Prove results by mathematical induction 19 12 69 16 18 66 19 23 58 35 40 25 PROPERTIES OF PLANE FIGURES as an overall topic
Measurement1 32 67 6 35 59 4 34 61 11 50 39 Compute the area and perimeter of triangles and rectangles
25 16 59 30 26 45 29 21 50 39 41 20 Estimate or calculate of length of a line segment based on other lengths given on a geometric figure
18 16 66 18 22 60 14 17 69 17 45 38 Compute the perimeter of composite geometric figures with unknown side lengths 3 15 82 9 24 67 6 19 76 25 49 25 Compute the area and circumference of circles after identifying necessary information 6 16 78 10 27 64 7 19 74 16 48 36 Compute the area and perimeter of polygons with known side lengths
21 5 74 16 6 78 10 6 84 32 38 30 Compute volume and surface area (e.g., cylinders, prisms, cones, and pyramids) 43 8 48 27 10 64 20 9 71 37 32 32 Compute the area and volume of composite geometric figures 3 11 86 9 11 81 11 7 81 22 44 33 Use geometric formulas 4 32 64 10 48 43 10 47 43 38 48 14 Understand how to read measurement tools (e.g., rulers and protractors)
11 2 87 13 18 69 20 21 59 31 31 38 Use scale factors to determine the magnitude of a size change 0 8 92 7 21 72 5 13 83 16 58 26 MEASUREMENT as an overall topic
Note:N = Number of respondentsMissing classes did not have a high enough N-count to include.1 = Not taught in course2 = Taught in the course but mainly as Review3 = Taught in course as part of the Standard Course Content. = This item was not asked at this grade level.
83
APPENDIX F: Content Topics “Taught” Percentages

Table F.3a
How Course Content Topics Are TaughtMiddle School Mathematics (continued)
(N = 101) (N = 97) (N = 72) (N = 65)7th-grade math 8th-grade math Pre-Algebra Algebra
1 2 3 1 2 3 1 2 3 1 2 3 Topics and Skills
Probability, Statistics, and Data Analysis0 18 82 2 34 63 3 41 56 6 36 58 Read and interpret graphs, charts, and other data representations
11 6 83 4 28 67 10 26 64 10 40 51 Manipulate data from tables and graphs 3 13 84 5 28 67 4 30 66 8 38 55 Perform computations on data from tables and graphs 2 13 85 10 21 70 4 27 69 9 41 50 Represent data (e.g., circle graphs, scatterplots, and frequency distributions)
82 4 14 64 8 28 74 9 17 51 19 30 Exhibit knowledge of correlation, variance, and standard deviation of data 0 34 66 8 46 46 0 44 56 14 53 33 Find the median and mode 7 11 82 11 24 66 3 26 71 16 53 31 Determine the probability of a simple event
41 6 53 28 12 60 26 11 63 37 37 27 Use the relationship between the probability of an event and the probability of its complement
37 7 56 24 8 69 23 9 69 32 33 35 Determine the probability of mutually exclusive, dependent, and independent events 26 16 58 24 17 59 26 9 66 29 33 38 Exhibit knowledge of counting techniques . . . . . . . . . . . . Exhibit knowledge of combinations, permutations, and the binomial theorem 0 44 56 9 45 46 1 44 54 16 62 22 Calculate the average of a list of numbers
23 7 69 22 22 57 14 16 70 19 44 37 Calculate a missing data value, given the average and all the missing data values but one
4 29 67 15 38 47 6 30 64 16 56 29 Calculate the average, given the number of data values and the sum of the data values 36 10 54 32 19 48 29 16 56 30 40 30 Calculate the average, given the frequency counts of all the data values 83 5 12 78 3 18 67 13 20 60 17 22 Calculate or use a weighted average 1 11 88 10 19 71 0 29 71 11 52 37 PROBABILITY, STATISTICS, AND DATA ANALYSIS as an overall topic
Functions30 5 65 16 4 80 26 3 71 5 5 91 Understand the concept of function 59 7 33 36 6 57 43 4 53 9 6 84 Use function notation 65 1 34 39 1 60 31 7 61 6 11 83 Find the domain and range of functions . . . . . . . . . . . . Find domain, range, and inverses of functions
46 2 52 20 4 75 33 4 63 5 5 91 Evaluate linear functions based on function notation95 1 4 59 2 39 85 3 13 16 2 83 Evaluate quadratic functions based on function notation97 2 1 80 1 18 85 7 8 33 3 64 Evaluate polynomial functions based on function notation99 0 1 91 1 8 93 4 3 59 3 38 Evaluate composite functions based on function notation 89 3 7 80 2 18 70 1 28 70 2 29 Apply basic trigonometric ratios to solve right-triangle problems 96 2 2 84 1 15 82 3 15 75 2 24 Use trigonometric concepts and basic identities to solve problems . . . . . . . . . . . . Use the law of sines and law of cosines . . . . . . . . . . . . Apply properties of trigonometric functions and their graphs, including amplitude,
period, and phase shift . . . . . . . . . . . . Use radian measure
99 1 0 97 0 3 99 0 1 89 2 10 Exhibit knowledge of vectors in a plane 62 5 33 43 14 43 47 15 38 10 15 75 FUNCTIONS as an overall topic
Note:N = Number of respondentsMissing classes did not have a high enough N-count to include.1 = Not taught in course2 = Taught in the course but mainly as Review3 = Taught in course as part of the Standard Course Content. = This item was not asked at this grade level.
84
APPENDIX F: Content Topics “Taught” Percentages

Table F.3b
How Course Content Topics Are TaughtHigh School Mathematics
(N = 110) (N = 187) (N = 144) (N = 88) (N = 52)Algebra 1 Algebra 2 Geometry Pre-Calculus Calculus
1 2 3 1 2 3 1 2 3 1 2 3 1 2 3 Topics and Skills
Process Skills11 51 38 20 44 36 17 47 36 17 47 36 8 41 51 Choose an appropriate method for calculating (e.g., mental, paper and
pencil, calculator, or estimation) 10 56 34 17 58 25 13 58 29 20 53 28 17 40 42 Estimate a reasonable result without using a calculator 35 31 35 59 24 16 18 31 51 63 19 19 52 25 23 Demonstrate concepts using manipulatives 7 41 52 11 38 50 5 13 83 6 28 66 6 25 69 Demonstrate concepts using pictorial representations 1 7 92 0 11 89 2 14 84 0 3 97 0 4 96 Solve problems posed in real-world settings and interpret the solutions
15 35 50 16 35 49 3 35 62 20 36 45 15 33 52 Recognize when essential information is missing 0 6 94 2 10 88 1 17 82 1 14 85 0 12 88 Plan and carry out a strategy for solving multistep problems 5 28 68 5 20 75 3 28 68 7 23 70 0 37 63 Recognize generalizations of mathematical ideas 1 16 83 1 23 76 1 20 79 3 25 71 8 19 73 Recognize and use patterns to solve problems 7 12 81 4 14 82 1 13 85 2 13 85 0 10 90 Apply mathematical ideas to new contexts
19 21 61 13 24 63 8 23 69 20 21 59 10 19 71 Formulate new patterns or structures 10 14 75 9 16 76 9 21 71 6 14 80 6 13 81 Solve several problems representing different aspects/components of
one larger problem or scenario 34 17 50 23 37 40 0 4 97 11 36 53 2 33 65 Understand roles of definitions, proof, and counterexamples 1 19 81 1 33 66 3 28 69 6 53 41 4 48 48 Recall basic facts, definitions, formulas, and algebraic procedures as
needed to solve a problem 37 13 50 7 29 64 1 6 93 3 40 56 0 35 65 Recall theorems and more complex formulas when needed to solve a
problem 45 11 44 18 30 51 1 1 99 1 26 72 2 10 88 Apply theorems to solve a problem 83 7 10 68 19 13 6 6 88 40 23 37 31 40 29 Construct and/or critique proofs, either informal or formal 11 38 51 16 38 46 22 50 28 34 39 26 35 37 29 Perform basic operations with a calculator 63 6 31 28 10 62 72 17 10 33 23 44 44 40 15 Use the statistical capabilities of a calculator 40 6 55 9 5 86 58 22 20 6 18 76 0 17 83 Use the graphical capabilities of a calculator 51 9 40 47 11 42 60 26 14 44 25 31 27 23 50 Use the symbolic algebra capabilities of a calculator 86 6 7 88 8 5 92 6 1 86 11 2 81 13 6 Use spreadsheets 89 8 4 85 10 5 48 15 37 71 20 9 61 16 24 Use dynamic geometry 3 37 60 7 39 54 9 52 39 16 49 34 17 56 27 Solve routine problems quickly
22 28 50 21 36 43 22 39 40 17 43 40 15 50 35 Solve novel problems quickly 0 16 84 1 20 79 1 15 85 9 22 69 0 23 77 Use mathematical symbols correctly
16 23 61 16 33 52 13 31 56 20 36 45 6 29 65 Understand new material from reading a textbook 19 22 60 23 32 45 20 37 43 23 30 47 13 37 50 Work in a self-directed group 8 17 75 5 34 61 10 23 67 5 30 65 6 27 67 PROCESS SKILLS as an overall topic
Basic Operations and Applications3 39 58 17 49 34 30 53 17 49 42 9 77 19 4 Perform addition, subtraction, multiplication, and division on signed
rational numbers . . . . . . . . . . . . . . . Perform one-step computations with whole numbers and decimals 0 20 80 9 46 45 1 20 79 35 50 15 62 29 10 Solve problems using ratios and proportions 4 19 77 18 53 29 48 44 8 43 43 14 81 15 4 Solve problems involving percents (e.g., simple interest, tax, and
markdowns) 22 29 49 32 47 21 11 59 30 27 46 27 58 35 8 Convert units of measure 9 32 58 29 48 23 31 53 15 69 26 6 83 15 2 Solve routine one-step arithmetic problems 6 24 70 14 45 41 21 54 25 47 40 14 67 27 6 Solve routine two- or three-step arithmetic problems 5 20 75 11 32 58 20 49 31 31 42 27 54 35 12 Solve nonroutine two- or three-step arithmetic problems
18 22 60 22 39 40 16 48 36 33 34 33 46 44 10 Solve multistep arithmetic problems that involve planning or convertingunits of measure
7 12 81 15 39 46 20 42 38 26 45 29 40 37 23 Solve word problems containing several rates, proportions, or percentages
3 26 71 10 51 39 15 63 22 38 47 15 62 33 6 BASIC OPERATIONS AND APPLICATIONS as an overalltopic
Note:N = Number of respondentsMissing classes did not have a high enough N-count to include.1 = Not taught in course2 = Taught in the course but mainly as Review3 = Taught in course as part of the Standard Course Content. = This item was not asked at this grade level.
85
APPENDIX F: Content Topics “Taught” Percentages

Table F.3b
How Course Content Topics Are TaughtHigh School Mathematics (continued)
(N = 110) (N = 187) (N = 144) (N = 88) (N = 52)Algebra 1 Algebra 2 Geometry Pre-Calculus Calculus
1 2 3 1 2 3 1 2 3 1 2 3 1 2 3 Topics and Skills
Numbers: Concepts and Properties. . . . . . . . . . . . . . . Identify a digit's place 8 58 34 22 55 23 31 59 10 55 39 6 77 15 8 Exhibit knowledge of elementary number concepts (e.g., rounding,
decimal ordering, pattern identification, absolute value, primes, andgreatest common factor)
14 51 35 45 44 11 53 42 6 71 26 2 87 10 4 Order fractions . . . . . . . . . . . . . . . Recognize one-digit factors of a number
13 47 40 15 58 27 52 40 8 46 47 7 79 15 6 Find and use the least common multiple . . . . . . . . . . . . . . . Recognize equivalent fractions and fractions in lowest terms 1 7 92 2 30 69 3 31 66 14 61 25 54 38 8 Perform computations with squares and square roots of numbers
33 14 53 2 17 81 40 28 33 13 57 30 52 38 10 Perform computations with cubes and cube roots of numbers 4 2 94 0 14 86 29 59 12 2 54 44 29 52 19 Apply rules of exponents
55 4 41 24 5 71 85 5 10 33 24 43 79 13 8 Perform matrix addition and multiplication 40 11 49 23 7 70 49 21 31 14 12 74 50 27 23 Exhibit knowledge of series and sequences (e.g., arithmetic and
geometric) 50 18 32 38 27 35 51 26 22 38 40 22 67 29 4 Find union and intersection of sets 10 11 78 2 13 85 28 47 26 8 51 41 44 46 10 Apply properties of rational and irrational numbers 78 3 19 4 1 95 89 7 4 7 21 72 65 23 12 Exhibit knowledge of complex numbers 81 2 17 5 1 93 91 6 3 8 16 76 63 25 12 Apply properties of complex numbers 8 25 67 4 33 64 34 49 17 13 56 31 50 42 8 Apply number properties involving multiples and factors 9 22 69 24 52 25 53 41 6 40 46 0 63 31 6 Use scientific notation
13 7 80 2 13 85 45 38 17 6 25 69 25 35 40 Determine when an expression is undefined 92 1 7 11 2 86 76 14 10 0 3 97 12 50 38 Exhibit knowledge of logarithms and geometric sequences 6 13 81 2 8 90 28 60 12 3 42 55 41 51 8 NUMBERS: CONCEPTS AND PROPERTIES as an overall
topic
Expressions, Equations, and Inequalities0 9 91 8 46 45 14 65 21 37 48 15 58 35 8 Evaluate algebraic expressions by substituting integers for unknown
quantities . . . . . . . . . . . . . . . Exhibit knowledge of basic expressions 0 10 90 5 54 40 16 68 15 45 47 8 65 31 4 Add and subtract simple algebraic expressions . . . . . . . . . . . . . . . Combine like terms 0 9 91 7 59 34 12 68 20 48 45 7 63 33 4 Solve routine first-degree equations 0 5 95 3 50 47 14 68 18 37 52 11 56 40 4 Solve linear equations and inequalities in one variable . . . . . . . . . . . . . . . Substitute whole numbers for unknown quantities 1 8 91 5 42 53 13 44 43 30 44 26 37 37 27 Perform word-to-symbol translations 0 7 93 2 38 60 17 52 31 21 51 29 40 42 17 Write expressions, equations, or inequalities for common settings . . . . . . . . . . . . . . . Solve one-step equations having integer or decimal values 7 2 92 0 36 64 30 60 10 23 62 15 46 48 6 Multiply two binomials
15 5 80 4 16 80 58 35 7 10 56 33 33 54 13 Solve absolute value equations and inequalities 7 1 93 1 21 77 35 57 8 21 59 21 44 50 6 Add, subtract, and multiply polynomials
16 1 83 1 15 84 37 54 8 10 60 30 40 54 6 Factor quadratics 18 3 79 0 9 91 36 52 11 3 60 37 31 60 10 Solve quadratic equations . . . . . . . . . . . . . . . Apply properties of exponential functions
62 2 36 16 4 79 82 15 4 10 39 51 38 52 10 Solve quadratic inequalities 49 3 48 8 6 87 88 9 3 13 46 41 59 35 6 Use the discriminant 42 4 54 4 2 94 63 31 6 1 21 78 27 60 13 Determine solutions of polynomial and rational equations 84 1 15 18 2 80 93 5 2 6 10 84 33 58 10 Implement remainder and factor theorems for polynomials 83 1 16 11 1 88 93 4 3 0 7 93 15 48 37 Apply properties of logarithmic and exponential functions 5 1 94 2 16 83 33 53 14 9 47 44 35 56 10 Find solutions to systems of linear equations . . . . . . . . . . . . . . . Solve problems using equations of parabolas and circles
77 1 22 25 3 71 62 17 21 7 9 84 25 52 23 Solve problems using equations of parabolas, circles, ellipses, and hyperbolas
94 1 5 77 3 20 94 2 4 37 0 63 27 25 48 Solve problems using parametric equations 50 5 45 13 5 82 62 26 13 2 15 83 25 52 23 Transform functions algebraically 94 1 5 76 2 23 96 1 2 33 2 64 2 8 90 Find the limit of an expression 5 3 92 1 6 94 26 66 9 2 32 66 13 67 19 EXPRESSIONS, EQUATIONS, AND INEQUALITIES as an
overall topic
Note:N = Number of respondentsMissing classes did not have a high enough N-count to include.1 = Not taught in course2 = Taught in the course but mainly as Review3 = Taught in course as part of the Standard Course Content. = This item was not asked at this grade level.
86
APPENDIX F: Content Topics “Taught” Percentages

Table F.3b
How Course Content Topics Are TaughtHigh School Mathematics (continued)
(N = 110) (N = 187) (N = 144) (N = 88) (N = 52)Algebra 1 Algebra 2 Geometry Pre-Calculus Calculus
1 2 3 1 2 3 1 2 3 1 2 3 1 2 3 Topics and Skills
Graphical Representations11 39 50 35 49 16 6 39 55 71 23 6 77 21 2 Comprehend the concept of length on the number line . . . . . . . . . . . . . . . Locate points on the number line and in the first quadrant 8 37 55 32 51 17 19 50 31 81 17 1 85 13 2 Locate points on the number line 2 31 67 19 58 23 3 53 44 57 38 5 77 19 4 Locate points in the coordinate plane 1 3 96 4 59 38 1 44 55 35 57 8 33 47 20 Exhibit knowledge of slope 1 2 97 4 55 40 3 41 56 28 63 9 35 37 27 Find the slope of a line 2 18 80 15 48 38 26 42 33 42 47 11 63 33 4 Identify graphs on a number line 1 4 95 9 44 47 25 45 30 38 49 13 54 38 8 Match linear graphs with their equations 8 4 88 3 38 59 0 7 93 19 64 17 35 52 13 Use properties of parallel and perpendicular lines 6 3 92 2 19 79 40 42 18 13 51 36 48 42 10 Solve systems of equations and inequalities graphically . . . . . . . . . . . . . . . Recognize special characteristics of parabolas and circles
75 3 23 24 3 73 63 13 24 7 13 80 31 58 12 Recognize special characteristics of parabolas, circles, ellipses, andhyperbolas
5 3 92 3 15 81 17 37 46 5 22 73 15 52 33 Interpret and use information from graphs in the coordinate plane 19 5 76 2 9 90 42 34 24 1 22 77 12 44 44 Identify characteristics of graphs based on a set of conditions or on a
general equation 82 3 15 14 2 84 84 11 6 1 7 92 10 31 60 Understand the properties of graphs of rational functions
(e.g., asymptotes) 31 3 66 13 47 40 1 9 90 17 63 20 44 52 4 Find midpoints 29 2 69 11 46 43 1 8 91 12 69 20 31 60 10 Use the distance formula 86 2 12 24 5 71 91 6 3 3 10 86 4 29 67 Work with discontinuous graphs and piecewise-defined functions 2 0 98 1 21 79 10 42 48 2 46 52 19 52 29 GRAPHICAL REPRESENTATIONS as an overall topic
Properties of Plane Figures84 8 8 68 23 9 0 1 99 49 47 5 85 13 2 Find the measure of an angle using properties of parallel lines . . . . . . . . . . . . . . . Exhibit some knowledge of angles associated with parallel lines
67 18 15 49 37 14 0 1 99 23 60 16 63 31 6 Exhibit knowledge of basic angle properties and special sums of anglemeasures (e.g., 90°, 180°, and 360°)
20 16 64 19 52 29 0 3 97 12 71 17 38 56 6 Use the Pythagorean theorem 77 12 10 63 29 8 0 0 100 56 41 3 75 24 2 Apply properties of lines, segments, and rays 79 8 13 62 29 9 1 1 99 51 44 5 67 31 2 Apply properties of special quadrilaterals 80 7 13 49 31 20 0 0 100 8 53 38 37 52 12 Apply properties of 30°-60°-90°, isosceles, similar, and congruent
triangles 91 2 8 67 21 13 1 1 98 15 42 43 52 37 12 Use relationships among angles, arcs, and distances in a circle 87 2 11 80 12 8 3 2 95 64 30 6 65 29 6 Use logical relationships to answer problems (e.g., converse,
contrapositive, and if-then) 86 1 13 79 15 6 18 6 76 52 19 29 63 21 15 Prove results by mathematical induction 73 14 12 56 34 10 0 0 100 22 62 16 47 51 2 PROPERTIES OF PLANE FIGURES as an overall topic
Measurement17 42 42 37 52 11 0 13 87 40 47 14 52 40 8 Compute the area and perimeter of triangles and rectangles . . . . . . . . . . . . . . . Estimate or calculate of length of a line segment based on other lengths
given on a geometric figure 39 24 38 55 34 12 3 10 87 56 34 10 62 31 8 Compute the perimeter of composite geometric figures with unknown
side lengths 40 30 30 43 43 13 0 8 92 43 44 13 44 48 8 Compute the area and circumference of circles after identifying
necessary information 37 33 30 53 35 12 0 4 96 55 30 15 58 37 6 Compute the area and perimeter of polygons with known side lengths 55 21 25 49 39 13 0 4 96 57 34 9 35 40 25 Compute volume and surface area (e.g., cylinders, prisms, cones, and
pyramids) 61 18 21 57 32 11 4 4 92 63 29 8 40 44 15 Compute the area and volume of composite geometric figures 42 26 31 33 53 14 0 0 100 27 65 8 29 60 12 Use geometric formulas 46 35 19 62 32 7 1 23 75 68 29 2 90 8 2 Understand how to read measurement tools (e.g., rulers and protractors) 48 14 38 54 33 13 3 6 92 56 34 10 62 33 6 Use scale factors to determine the magnitude of a size change 35 35 31 44 45 11 0 4 96 46 50 4 44 52 4 MEASUREMENT as an overall topic
Note:N = Number of respondentsMissing classes did not have a high enough N-count to include.1 = Not taught in course2 = Taught in the course but mainly as Review3 = Taught in course as part of the Standard Course Content. = This item was not asked at this grade level.
87
APPENDIX F: Content Topics “Taught” Percentages
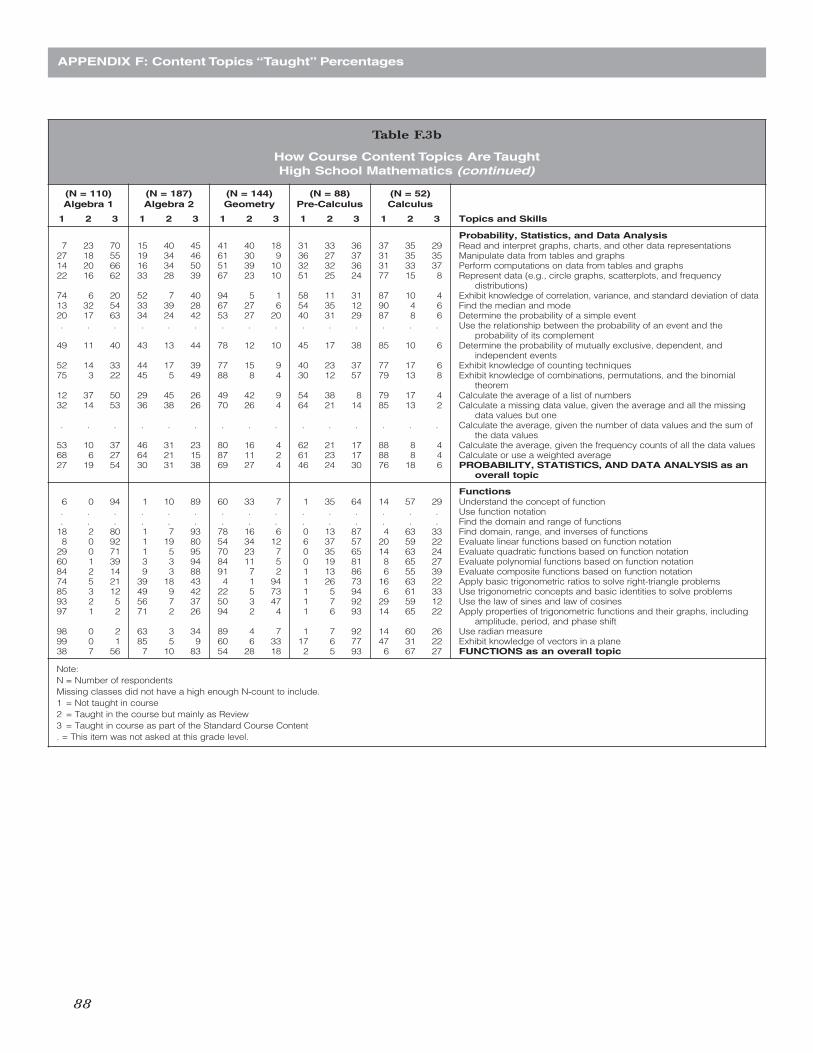
Table F.3b
How Course Content Topics Are TaughtHigh School Mathematics (continued)
(N = 110) (N = 187) (N = 144) (N = 88) (N = 52)Algebra 1 Algebra 2 Geometry Pre-Calculus Calculus
1 2 3 1 2 3 1 2 3 1 2 3 1 2 3 Topics and Skills
Probability, Statistics, and Data Analysis7 23 70 15 40 45 41 40 18 31 33 36 37 35 29 Read and interpret graphs, charts, and other data representations
27 18 55 19 34 46 61 30 9 36 27 37 31 35 35 Manipulate data from tables and graphs 14 20 66 16 34 50 51 39 10 32 32 36 31 33 37 Perform computations on data from tables and graphs 22 16 62 33 28 39 67 23 10 51 25 24 77 15 8 Represent data (e.g., circle graphs, scatterplots, and frequency
distributions) 74 6 20 52 7 40 94 5 1 58 11 31 87 10 4 Exhibit knowledge of correlation, variance, and standard deviation of data 13 32 54 33 39 28 67 27 6 54 35 12 90 4 6 Find the median and mode 20 17 63 34 24 42 53 27 20 40 31 29 87 8 6 Determine the probability of a simple event . . . . . . . . . . . . . . . Use the relationship between the probability of an event and the
probability of its complement 49 11 40 43 13 44 78 12 10 45 17 38 85 10 6 Determine the probability of mutually exclusive, dependent, and
independent events 52 14 33 44 17 39 77 15 9 40 23 37 77 17 6 Exhibit knowledge of counting techniques 75 3 22 45 5 49 88 8 4 30 12 57 79 13 8 Exhibit knowledge of combinations, permutations, and the binomial
theorem 12 37 50 29 45 26 49 42 9 54 38 8 79 17 4 Calculate the average of a list of numbers 32 14 53 36 38 26 70 26 4 64 21 14 85 13 2 Calculate a missing data value, given the average and all the missing
data values but one . . . . . . . . . . . . . . . Calculate the average, given the number of data values and the sum of
the data values 53 10 37 46 31 23 80 16 4 62 21 17 88 8 4 Calculate the average, given the frequency counts of all the data values 68 6 27 64 21 15 87 11 2 61 23 17 88 8 4 Calculate or use a weighted average 27 19 54 30 31 38 69 27 4 46 24 30 76 18 6 PROBABILITY, STATISTICS, AND DATA ANALYSIS as an
overall topic
Functions6 0 94 1 10 89 60 33 7 1 35 64 14 57 29 Understand the concept of function . . . . . . . . . . . . . . . Use function notation . . . . . . . . . . . . . . . Find the domain and range of functions
18 2 80 1 7 93 78 16 6 0 13 87 4 63 33 Find domain, range, and inverses of functions 8 0 92 1 19 80 54 34 12 6 37 57 20 59 22 Evaluate linear functions based on function notation
29 0 71 1 5 95 70 23 7 0 35 65 14 63 24 Evaluate quadratic functions based on function notation60 1 39 3 3 94 84 11 5 0 19 81 8 65 27 Evaluate polynomial functions based on function notation84 2 14 9 3 88 91 7 2 1 13 86 6 55 39 Evaluate composite functions based on function notation74 5 21 39 18 43 4 1 94 1 26 73 16 63 22 Apply basic trigonometric ratios to solve right-triangle problems 85 3 12 49 9 42 22 5 73 1 5 94 6 61 33 Use trigonometric concepts and basic identities to solve problems 93 2 5 56 7 37 50 3 47 1 7 92 29 59 12 Use the law of sines and law of cosines 97 1 2 71 2 26 94 2 4 1 6 93 14 65 22 Apply properties of trigonometric functions and their graphs, including
amplitude, period, and phase shift 98 0 2 63 3 34 89 4 7 1 7 92 14 60 26 Use radian measure 99 0 1 85 5 9 60 6 33 17 6 77 47 31 22 Exhibit knowledge of vectors in a plane 38 7 56 7 10 83 54 28 18 2 5 93 6 67 27 FUNCTIONS as an overall topic
Note:N = Number of respondentsMissing classes did not have a high enough N-count to include.1 = Not taught in course2 = Taught in the course but mainly as Review3 = Taught in course as part of the Standard Course Content. = This item was not asked at this grade level.
88
APPENDIX F: Content Topics “Taught” Percentages

Table F.4a
How Course Content Topics Are TaughtMiddle School Reading
MS %
1 2 3 Topics and Skills
Content12 16 71 Read/view and demonstrate understanding of poetry 22 23 55 Read/view and demonstrate understanding of drama 2 3 95 Read/view and demonstrate understanding of novels and short stories
34 25 41 Read/view and demonstrate understanding of nonfiction trade books 9 21 71 Read/view and demonstrate understanding of textbooks
30 21 49 Read/view and demonstrate understanding of research studies 20 34 46 Read/view and demonstrate understanding of primary sources 16 33 52 Read/view and demonstrate understanding of news and feature articles, editorials/opinion pieces 37 31 32 Read/view and demonstrate understanding of advertisements 51 29 20 Read/view and demonstrate understanding of film and television 31 30 40 Read/view and demonstrate understanding of multimedia presentations 26 35 39 Read/view and demonstrate understanding of functional text 16 46 38 Read/view and demonstrate understanding of graphs, charts, and diagrams 43 31 27 Read/view and demonstrate understanding of work-related texts 1 13 86 CONTENT as an overall set of skills
Main Ideas and Author's Approach0 9 91 Infer the main idea or purpose of a straightforward paragraph 2 10 88 Recognize a clear intent of an author or narrator 2 9 90 Determine the main idea or purpose of a complex paragraph 0 13 87 Identify the main idea or purpose of a straightforward paragraph 1 8 92 Determine the main idea, purpose, or theme of a text 2 10 87 Understand the overall approach taken by an author or narrator (e.g., point of view,
kinds of evidence used) 0 16 84 Summarize basic events and ideas in a text 0 7 93 MAIN IDEAS AND AUTHOR'S APPROACH as an overall set of skills
Supporting Details1 19 80 Locate important details stated in a text 2 38 59 Locate basic facts (e.g., names, dates, events) that are clearly stated in a text 2 20 78 Locate and interpret minor or subtly stated details in a text 2 38 59 Locate simple details at the sentence and paragraph level in a text 2 12 87 Make simple inferences about how details are used to support points made in a text
(e.g., support for a claim) 3 16 81 Discern which details from different sections of a text support important points 7 16 77 Understand subtle or complex roles that details can play in a text 1 12 87 SUPPORTING DETAILS as an overall set of skills
Relationships5 41 54 Order simple sequences of events in a text 5 37 58 Determine when (e.g., first, last, before, after) or if an event occurred in a text 5 28 66 Order subtle or complex sequences of events in a text 3 29 68 Recognize clear cause-effect relationships described within a single sentence 1 19 80 Identify clear relationships between people, ideas, and so on in a text 4 14 82 Infer subtle or complex relationships between people, ideas, and so on in a text 2 23 75 Identify clear cause-effect relationships in a text 4 20 76 Infer subtle or complex cause-effect relationships in a text 1 18 80 RELATIONSHIPS as an overall set of skills
Meanings of Words1 18 81 Use context to determine the appropriate meaning of words and phrases 4 29 67 Understand the implication of a familiar word or phrase and of simple descriptive language 2 16 83 Distinguish between literal and figurative meanings of words and phrases in a text 1 20 79 Paraphrase concepts and ideas in a text 2 10 89 Understand literary devices in a text 0 9 91 MEANINGS OF WORDS as an overall set of skills
Generalizations and Conclusions1 21 78 Draw generalizations and conclusions about people, ideas, and so on in a text 1 28 71 Draw simple generalizations and conclusions about the main characters in a text 0 13 86 Draw generalizations and conclusions using details that support the main points of a text 1 18 82 Predict outcomes based on a text 2 22 76 Distinguish between fact, opinion, and reasoned judgment within a text
16 25 59 Identify stereotypes in a text 31 20 49 Identify logical fallacies in a text 10 20 70 Identify persuasive techniques in a text 17 17 65 Evaluate the range and quality of evidence used to support an argument in a text 8 17 75 Make connections between two or more texts 0 16 84 GENERALIZATIONS AND CONCLUSIONS as an overall set of skills
Note:1 = Not taught in course2 = Taught in the course but mainly as Review3 = Taught in course as part of the Standard Course Content
89
APPENDIX F: Content Topics “Taught” Percentages

Table F.4a
How Course Content Topics Are TaughtMiddle School Reading (continued)
MS %
1 2 3 Topics and Skills
Evaluating Texts12 31 57 Evaluate information in a text for relevance 14 27 59 Evaluate information in a text for fair and accurate treatment of differing points of view 14 22 64 Evaluate information in a text for persuasive techniques 13 27 60 Evaluate information in a text for credibility and appropriateness of sources of information 11 21 68 Evaluate information in a text for sufficiency of evidence in support of an argument or claim 32 30 38 Evaluate information in a text for internal consistency 16 27 56 Recognize how history and culture influence a text 12 31 57 EVALUATING TEXTS as an overall set of skills
Note:1 = Not taught in course2 = Taught in the course but mainly as Review3 = Taught in course as part of the Standard Course Content
90
APPENDIX F: Content Topics “Taught” Percentages

Table F.4b
How Course Content Topics Are TaughtHigh School Reading
Language ArtsCourses
Social StudiesCourses
1 2 3 1 2 3 Topics and Skills
Content7 17 76 71 17 13 Read/view and demonstrate understanding of poetry
12 7 81 75 16 9 Read/view and demonstrate understanding of drama2 5 94 63 21 16 Read/view and demonstrate understanding of novels and short stories
62 14 24 68 24 9 Read/view and demonstrate understanding of nonfiction trade books13 21 66 1 7 92 Read/view and demonstrate understanding of textbooks25 21 55 21 37 42 Read/view and demonstrate understanding of research studies17 27 56 2 19 79 Read/view and demonstrate understanding of primary sources23 33 44 8 32 60 Read/view and demonstrate understanding of news and feature articles, editorials/opinion pieces57 24 19 39 37 24 Read/view and demonstrate understanding of advertisements45 32 24 12 48 40 Read/view and demonstrate understanding of film and television31 34 35 8 40 51 Read/view and demonstrate understanding of multimedia presentations53 25 23 23 36 40 Read/view and demonstrate understanding of functional text42 35 23 2 28 70 Read/view and demonstrate understanding of graphs, charts, and diagrams61 22 17 46 29 25 Read/view and demonstrate understanding of work-related texts3 16 82 2 19 79 CONTENT as an overall set of skills
Main Ideas and Author's Approach1 28 71 6 34 61 Infer the main idea or purpose of a straightforward paragraph2 19 79 6 37 57 Determine the main idea or purpose of a complex paragraph1 31 68 6 38 55 Identify the main idea or purpose of a straightforward paragraph0 10 90 7 23 70 Determine the main idea, purpose, or theme of a text0 10 89 13 33 54 Understand the overall approach taken by an author or narrator (e.g., point of view, kinds of evidence
used)2 24 74 1 25 74 Summarize basic events and ideas in a text0 10 90 3 36 61 MAIN IDEAS AND AUTHOR'S APPROACH as an overall set of skills
Supporting Details0 28 72 6 27 67 Locate important details stated in a text1 22 77 10 51 39 Locate and interpret minor or subtly stated details in a text6 40 54 17 39 45 Locate simple details at the sentence and paragraph level in a text2 22 76 7 38 55 Make simple inferences about how details are used to support points made in a text (e.g., support for
a claim)2 20 78 10 38 52 Discern which details from different sections of a text support important points4 18 78 19 40 41 Understand subtle or complex roles that details can play in a text0 17 83 4 40 56 SUPPORTING DETAILS as an overall set of skills
Relationships12 43 45 12 33 55 Order simple sequences of events in a text5 37 58 15 38 48 Order subtle or complex sequences of events in a text2 27 72 3 25 72 Identify clear relationships between people, ideas, and so on in a text1 19 80 4 36 60 Infer subtle or complex relationships between people, ideas, and so on in a text2 27 71 1 18 80 Identify clear cause-effect relationships in a text3 21 77 7 34 59 Infer subtle or complex cause-effect relationships in a text0 21 79 2 28 69 RELATIONSHIPS as an overall set of skills
Meaning of Words4 28 68 8 35 57 Use context to determine the appropriate meaning of words and phrases2 21 77 20 45 36 Distinguish between literal and figurative meanings of words and phrases in a text1 25 74 4 36 60 Paraphrase concepts and ideas in a text2 12 86 40 36 24 Understand literary devices in a text1 14 85 4 38 58 MEANINGS OF WORDS as an overall set of skills
Generalizations and Conclusions2 31 67 1 26 73 Draw generalizations and conclusions about people, ideas, and so on in a text1 23 76 3 28 69 Draw generalizations and conclusions using details that support the main points of a text4 31 65 9 38 54 Predict outcomes based on a text6 27 67 5 21 74 Distinguish between fact, opinion, and reasoned judgment within a text8 34 58 13 35 51 Identify stereotypes in a text
14 23 62 21 33 46 Identify logical fallacies in a text6 22 72 13 34 53 Identify persuasive techniques in a text8 20 72 12 34 54 Evaluate the range and quality of evidence used to support an argument in a text3 16 81 23 30 48 Make connections between two or more texts1 20 80 3 30 67 GENERALIZATIONS AND CONCLUSIONS as an overall set of skills
Note:1 = Not taught in course2 = Taught in the course but mainly as Review3 = Taught in course as part of the Standard Course Content
91
APPENDIX F: Content Topics “Taught” Percentages

Table F.4b
How Course Content Topics Are TaughtHigh School Reading (continued)
Language ArtsCourses
Social StudiesCourses
1 2 3 1 2 3 Topics and Skills
Evaluating Texts10 31 59 7 31 62 Evaluate information in a text for relevance9 30 61 6 21 73 Evaluate information in a text for fair and accurate treatment of differing points of view8 25 66 13 39 48 Evaluate information in a text for persuasive techniques3 32 64 7 26 67 Evaluate information in a text for credibility and appropriateness of sources of information4 24 73 8 28 64 Evaluate information in a text for sufficiency of evidence in support of an argument or claim
13 35 52 22 43 35 Evaluate information in a text for internal consistency6 23 71 5 16 79 Recognize how history and culture influence a text5 24 71 9 31 60 EVALUATING TEXTS as an overall set of skills
Note:1 = Not taught in course2 = Taught in the course but mainly as Review3 = Taught in course as part of the Standard Course Content
92
APPENDIX F: Content Topics “Taught” Percentages

Table F.5
How Course Content Topics Are TaughtScience
MS % HS %
1 2 3 1 2 3 Topics and Skills
Interpretation of Data2 37 61 . . . Identify basic features of a table, graph, or diagram (e.g., headings, units of measurement, axis labels)
25 32 43 20 34 46 Compare or combine data from one or more data presentations (e.g., categorize data from a table using a scale from another table) 8 30 63 6 25 69 Determine how the value of one variable changes as another variable changes in a data presentation
13 32 54 7 24 70 Identify and/or use a mathematical relationship between data 5 32 63 5 21 74 Analyze given information when presented with new information
21 36 43 12 36 51 Interpolate between data points in a table or graph 22 35 43 12 37 51 Extrapolate from data points in a table or graph 0 9 91 1 14 85 Understand basic scientific terminology 2 24 75 2 26 72 Translate information into a table, graph, or diagram
26 25 49 27 23 49 Apply statistical concepts and methods of data analysis to the results of an experiment 4 23 73 2 20 78 INTERPRETATION OF DATA as an overall topic
Scientific Investigation1 26 73 8 36 56 Identify a control in an experiment 1 25 74 7 33 60 Understand basic processes and designs of simple experiments (single control, 2–3 variables)
35 24 41 32 31 37 Understand the methods and tools used in an experiment featuring multiple controls and multiple variables 1 24 75 7 33 60 Understand simple experimental design (single control, 2–3 variables)
53 19 28 44 27 29 Understand complex experimental design (multiple controls and multiple variables) 13 26 61 13 32 55 Predict the results of an additional trial in an experiment 17 26 57 18 30 51 Determine the experimental conditions that would produce specified results 2 20 78 7 30 64 Determine the hypothesis for an experiment
13 29 58 11 27 63 Understand precision and accuracy issues 14 29 58 14 37 49 Identify similarities and differences between experiments 18 28 54 16 33 51 Evaluate the similarities and differences, or the strengths and weaknesses, of experiments 9 25 66 16 32 52 Predict how modifying the design of an experiment will affect results 5 14 80 15 22 63 Design and conduct an experiment
28 29 43 27 30 43 Identify an experiment that could be performed to enhance experimental results 2 15 83 4 25 71 SCIENTIFIC INVESTIGATION as an overall topic
Evaluation of Models, Inferences, and Experimental Results6 17 77 7 29 64 Identify a hypothesis, prediction, or conclusion that is supported by data presentations or models (i.e., scientific explanations) 6 18 76 7 30 63 Determine whether information (e.g., a data presentation or model) supports or contradicts a hypothesis, prediction, or conclusion,
and why 23 32 45 21 37 42 Identify strengths and weaknesses in one or more models 20 32 49 19 37 44 Identify similarities and differences between models 32 32 37 25 33 42 Determine whether a model is supported or weakened by new information 27 30 43 19 33 48 Identify key issues or assumptions in a model 24 29 47 19 32 49 Use new information to make a prediction based on a model 18 20 63 13 24 63 Communicate the results of an experiment through writing a properly organized report 11 27 62 9 33 58 EVALUATION OF MODELS, INFERENCES, AND EXPERIMENTAL RESULTS as an overall topic
Miscellaneous Science Topics69 15 16 57 25 19 Familiarity with the term “experimental treatment” 21 23 56 16 35 49 Familiarity with the term “experimental variable” 8 21 71 8 34 58 Familiarity with the term “independent variable” 8 21 71 7 35 58 Familiarity with the term “dependent variable”
38 25 37 13 33 54 Familiarity with the term “directly proportional” 43 23 33 14 33 53 Familiarity with the term “inversely proportional” 1 18 81 3 25 73 Use metric units of measurement
40 34 26 47 34 20 Use English units of measurement 24 28 48 11 29 60 Convert a number expressed in one unit of measurement to a number expressed in another unit of measurement 67 14 18 29 20 51 Perform dimensional analysis 15 31 54 5 30 65 Read and interpret data plotted on a linear scale 70 13 16 58 19 23 Read and interpret data plotted on a log scale
General Biology Topics35 11 54 . . . State the criteria for life and understand and be able to use organizational systems in biology (e.g., in taxonomy, in ecology) 47 11 42 . . . Recognize the role of carbohydrates, lipids, proteins, and nucleic acids in a cell . . . 1 7 92 Explain the criteria for life and understand and be able to use organizational systems in biology (e.g., in taxonomy, in ecology) . . . 1 7 92 Recognize structure and state functions of carbohydrates, lipids, proteins, and nucleic acids . . . 8 28 64 Describe pH, acidic, and basic
34 21 45 . . . Use the pH scale 24 15 61 7 31 62 Describe a chemical reaction and recognize the parts of a chemical equation 47 16 37 3 7 90 Explain what enzymes are and how they function 70 9 22 3 7 90 Describe the structure and function of ATP 26 17 56 1 5 94 Describe photosynthesis and cellular respiration and state where in the cell these processes occur . . . 36 28 36 Relate the laws of thermodynamics to organisms and their environment
35 15 50 1 5 94 Describe diffusion and osmosis
Note:MS = Middle school teachersHS = High school teachers1 = Not taught in course2 = Taught in the course but mainly as Review3 = Taught in course as part of the Standard Course Content. = This item was not asked at this grade level.
93
APPENDIX F: Content Topics “Taught” Percentages

Table F.5
How Course Content Topics Are TaughtScience (continued)
MS % HS %
1 2 3 1 2 3 Topics and Skills
General Biology Topics (continued)36 12 52 1 5 94 Describe the structure and function of cell organelles and the plasma membrane 42 13 45 2 4 94 Explain the phases of the cell cycle and how the cell cycle is regulated 40 11 49 1 3 96 Describe the difference between mitotic and meiotic division 49 10 41 1 3 95 Describe the processes of DNA replication, transcription, and translation
1 4 96 Describe the structure and function of DNA, chromosomes, and the genetic code 2 4 93 Describe the structure and function of RNA (e.g., mRNA, rRNA, tRNA)
30 10 60 2 6 93 Describe what a gene is, how genes are expressed, and how gene expression can be regulated 35 7 58 2 3 95 Use the principles of Mendelian genetics to predict the outcome of a genetic cross . . . 1 3 96 Explain how meiosis results in the formation of gametes and relate the process of meiosis to the principles of Mendelian genetics
31 12 57 2 8 90 State the difference between sexual and asexual reproduction 36 16 48 7 8 85 Describe the process of evolution and state the evidence for evolution . . . 5 8 88 State the biological definition of fitness, describe the importance of mutation in evolution, and explain how natural selection
drives evolution 38 21 42 5 9 86 Define species and describe the process of speciation 74 8 18 16 18 66 Interpret a phylogenetic tree . . . 55 13 32 Use the Hardy-Weinberg equation
37 18 46 8 8 84 Describe the major groups of organisms (e.g., bacteria, protists, fungi, plants, animals) and why they are important to Earth'secosystems
51 14 36 11 9 80 Describe what viruses are and how they replicate 49 16 36 24 14 61 Compare vertebrates and invertebrates and list key features of fish, amphibians, reptiles, birds, and mammals 37 15 48 16 12 73 Describe the development of an animal from a single cell and the structure and function of the major organ systems 49 16 36 17 17 66 Compare the different types of biomes 41 15 44 9 10 81 Describe the biotic and abiotic factors in an ecosystem and the flow of energy and chemicals through an ecosystem 34 17 48 5 9 86 Define producers, consumers, and decomposers 39 20 41 6 11 83 Define biodiversity . . . 1 4 95 GENERAL BIOLOGY TOPICS as an overall topic
General Chemistry Topics. . . 2 14 84 Know the Celsius and Kelvin temperature scales and how they are related . . . 18 13 69 Understand the features of a generic heating curve . . . 10 5 85 Understand and apply Charles's law and Boyle's law . . . 23 9 68 Solve problems involving Graham's law and Dalton's law . . . 9 4 87 Know and apply the ideal gas law and the kinetic theory to explain the behavior of gases . . . 10 8 82 Describe how different factors affect the solubility of gases, liquids, and solids . . . 10 4 86 Solve problems involving molality and molarity
62 12 26 6 6 88 Understand why substances can be polar or nonpolar and how polarity relates to solubility . . . 1 13 87 Explain the differences between an element, an atom, a molecule, and a compound
20 14 66 0 8 92 Correctly use basic chemical symbols and formulas . . . 1 5 94 Understand and apply the mole concept
21 10 69 1 17 83 Know the basic parts of an atom, the subatomic particles contained in each part, and the charge on each type of particle . . . 1 9 90 Explain the differences between atomic mass, molar mass, mass number, and atomic number . . . 1 9 91 Know that the nuclei of two different isotopes of an element will contain the same number of protons but a different number of neutrons . . . 1 5 94 Describe the periodic trends and the properties of the elements in the most common groups of the periodic table . . . 4 5 91 Generate electron configurations for different elements and their ions . . . 1 7 92 Explain the difference between an ionic bond and a covalent bond . . . 2 4 93 Use oxidation or valence numbers to predict chemical formulas of compounds . . . 4 5 90 Represent the bonding in ionic compounds and covalent compounds using electron-dot structures . . . 1 8 91 Balance a basic chemical equation . . . 3 4 93 Solve stoichiometric problems involving chemical reactions . . . 32 8 60 Interpret a potential energy diagram and describe the role of a catalyst in a chemical reaction . . . 13 9 78 Compare different intermolecular forces that exist between atoms and molecules . . . 36 7 57 Use change in Hf to determine whether a chemical reaction was endothermic or exothermic . . . 41 4 55 Apply Le Chatelier's principle to predict how different factors will affect the equilibrium of a reversible reaction . . . 58 6 35 Predict the composition of a solid/solution mixture using Ksp . . . 23 8 68 Compare and apply the three major acid-base theories . . . 14 6 79 Know the formulas and relative strengths of the most common acids and bases . . . 50 7 43 Use Ka values to determine the composition of an aqueous solution of an acid or base . . . 6 10 84 Determine whether a substance having a certain pH is acidic, basic, or neutral . . . 46 5 48 Calculate the pH of a solution using given concentrations and Ka or pKa values . . . 42 11 47 Explain why a buffer solution maintains a stable pH . . . 42 5 53 Identify which species are oxidized and which are reduced in a redox reaction . . . 53 5 43 Balance redox equations using oxidation numbers . . . 70 5 26 Explain the parts of a basic electrochemical cell and calculate voltages for the cell . . . 39 8 53 Use structural formulas to represent organic compounds . . . 47 7 46 Use basic organic nomenclature to convert between the names and formulas of organic compounds . . . 27 7 66 Describe the basic geometry of carbon single, double, and triple bonds . . . 2 3 95 GENERAL CHEMISTRY TOPICS as an overall topic
Note:MS = Middle school teachersHS = High school teachers1 = Not taught in course2 = Taught in the course but mainly as Review3 = Taught in course as part of the Standard Course Content. = This item was not asked at this grade level.
94
APPENDIX F: Content Topics “Taught” Percentages

Table F.5
How Course Content Topics Are TaughtScience (continued)
MS % HS %
1 2 3 1 2 3 Topics and Skills
General Earth Science Topics. . . 12 17 71 Find location and estimate distance on a map . . . 8 8 84 Describe the properties that define a mineral . . . 6 6 89 Compare the compositions and origins of sedimentary, igneous, and metamorphic rocks
35 13 52 7 12 81 Compare erosion and weathering . . . 8 10 82 Identify the major agents of erosion and distinguish the two types of weathering . . . 11 13 76 Understand how weathering is related to soil formation . . . 7 10 83 Understand how and where sediment is deposited . . . 7 7 86 Identify the layers of Earth's atmosphere
43 18 39 7 7 86 Compare weather and climate . . . 14 10 76 Understand how relative humidity and dew point relate to cloud formation and precipitation . . . 13 13 74 Describe the characteristics and causes of thunderstorms . . . 14 12 74 Describe the characteristics and causes of tornadoes . . . 12 14 75 Describe the characteristics and causes of hurricanes . . . 28 18 54 Compare the chemistry of ocean water and fresh water . . . 14 11 74 Understand the cause of tides . . . 13 15 72 Understand how large-scale ocean currents contribute to climate
24 27 49 4 18 78 Understand how water moves through the water cycle . . . 7 19 73 Identify the primary sources of fresh water (lakes, streams, groundwater, glaciers) . . . 16 15 69 Describe the relationship between the water table and groundwater
40 9 50 2 7 90 Describe the three major types of tectonic plate boundaries 32 13 56 3 7 90 Understand the causes of plate movement . . . 2 8 90 Understand how plate movement relates to earthquakes, volcanoes, and mountain building . . . 9 19 72 Describe how radioactive materials are use to determine age . . . 9 17 74 Understand how fossils are formed and what fossils tell us about the ages of rock layers . . . 10 22 68 Identify renewable and nonrenewable resources
31 20 50 12 21 67 Describe types of renewable/alternative energy . . . 16 27 57 Understand multiple ways to conserve and recycle resources . . . 17 25 58 Identify types of air, soil, and water pollution
25 30 45 9 17 74 Understand the causes and effects of global warming 28 25 47 7 11 81 Understand the importance of the ozone layer . . . 33 15 52 Describe the motions of Earth and the Moon and their implications for lunar phases, tides, and timekeeping . . . 39 14 47 Describe the properties of the various solar system bodies (the Sun, planets, moons, asteroids, comets, meteoroids) . . . 46 12 43 Describe and compare various theories of solar system formation . . . 47 10 43 Describe the process of star formation and evolution . . . 52 10 38 Describe the various types of galaxies, and their formation and evolution . . . 41 11 47 Describe the large-scale structure of the universe, discuss the big bang theory, and describe the possible outcomes for the
evolution of the universe . . . 1 5 94 GENERAL EARTH SCIENCE TOPICS as an overall topic
General Physics and Astronomy Topics. . . 0 3 97 Calculate the displacement, speed, velocity, and acceleration of an object in one and two dimensions . . . 1 3 96 Sketch position/time graphs and velocity/time graphs for objects undergoing simple types of motion . . . 0 3 97 Apply Newton's three laws of motion to solve simple mechanics problems . . . 2 3 95 Define momentum and describe momentum conservation . . . 0 5 95 Define kinetic energy and potential energy . . . 1 5 94 Define mechanical energy and describe simple scenarios in which mechanical energy is conserved or is not conserved . . . 4 5 91 Write the formula describing Newton's law of gravitation . . . 1 2 97 Solve problems involving free fall and motions on an inclined plane . . . 2 2 96 Solve simple problems involving projectile motion, uniform circular motion, and circular orbits . . . 11 8 81 Describe simple harmonic motion and give examples of systems in which simple harmonic motion is observed . . . 1 3 96 Define work, state the work-energy theorem, and calculate the work done in simple physical situations . . . 25 6 69 Relate torque to rotational motion . . . 27 26 47 Distinguish among the Fahrenheit, Celsius, and Kelvin temperature scales and convert a temperature in any one of these scales
to a temperature in either of the other two scales . . . 40 14 46 Define the specific heat of a substance . . . 37 19 45 Describe the heat transfer processes of convection, conduction, and radiation . . . 53 16 31 Write the equation of state for an ideal gas and use the equation to solve problems involving transformations in ideal gases . . . 9 7 84 Given wavelength and frequency of light or sound, calculate wave speed . . . 11 12 77 Describe the electromagnetic spectrum in terms of energy, radiation type (gamma ray, X-ray, etc.), wavelength, and frequency . . . 17 5 79 Given the angle of incidence of light on a plane mirror, predict angle of reflection . . . 23 4 73 Using Snell's law, determine angle of refraction of light . . . 25 4 71 For object imaged by mirror or thin lens, use ray tracing to determine position, size, and orientation of image . . . 26 7 67 Sketch electric field lines emanating from point charge . . . 22 3 75 Using Coulomb's law, determine the electric force between 2 point charges . . . 18 2 80 Using Ohm's law, determine the voltage drop across a resistor . . . 15 11 74 Explain the difference between an electrical conductor and an electrical insulator
Note:MS = Middle school teachersHS = High school teachers1 = Not taught in course2 = Taught in the course but mainly as Review3 = Taught in course as part of the Standard Course Content. = This item was not asked at this grade level.
95
APPENDIX F: Content Topics “Taught” Percentages

Table F.5
How Course Content Topics Are TaughtScience (continued)
MS % HS %
1 2 3 1 2 3 Topics and Skills
General Physics and Astronomy Topics (continued). . . 22 10 67 Explain the difference between an AC circuit and a DC circuit . . . 22 4 75 Calculate the power generated by an electrical current passing through a resistor . . . 27 10 63 Explain how an electrical generator uses motion and magnetism to produce an electrical current . . . 28 11 61 Draw lines of magnetic force emanating from a bar magnet . . . 24 11 64 Describe qualitatively situations in which light behaves like a wave and situations in which light behaves like a particle . . . 8 9 83 GENERAL PHYSICS AND ASTRONOMY TOPICS as an overall topic
General Physical Science Topics5 19 76 1 22 78 Explain the difference between mass, weight, density, and volume
11 16 73 . . . Understand and apply the formula for density 9 28 63 . . . Understand the Celsius scale and the significance of 0°C and 100°C in the scale.
14 19 67 1 13 86 Describe the physical properties and molecular models of solids, liquids, and gases 16 22 62 3 12 85 Understand what occurs when a substance melts, freezes, boils, sublimes, or condenses 36 16 48 . . . Know that a liquid having a lower viscosity flows more easily than does a substance having a higher viscosity 35 13 52 . . . Explain why a chemical or physical process is endothermic or exothermic 31 15 54 . . . Explain the difference between a homogeneous mixture and a heterogeneous mixture 35 13 52 . . . Identify the solute(s) and solvent when describing a solution 39 18 43 . . . Understand that the concentration of a solution is amount of solute dissolved in a certain amount of solvent or solution 51 16 33 . . . Know that an aqueous solution is a solution in which H2O is the solvent 16 10 73 . . . Understand the distinctions between an element, an atom, a molecule, and a compound 43 15 43 . . . Know that organic compounds contain carbon and that hydrocarbons contain only carbon and hydrogen 33 13 54 . . . Identify basic features of a chemical equation (reactants, products, reaction arrow, coefficients) 45 9 46 . . . Balance a simple chemical equation 51 14 35 . . . Describe the role of a catalyst in a chemical reaction 41 13 46 . . . Determine whether a solution is acidic, basic, or neutral when given its pH 40 9 51 . . . Define displacement, speed, velocity, and acceleration, and, for an object moving in a straight line at a constant speed, plot a
graph from a table of the displacement of the object versus time, and find the object's speed from the graph 32 10 58 . . . State and describe Newton's three laws of motion, and give examples of physical situations that illustrate each law 39 10 51 . . . Describe qualitatively Newton's law of gravitation, describe the acceleration due to gravity at Earth's surface for objects having
different masses, and define weight 34 13 54 . . . Define and distinguish between kinetic energy and potential energy, define mechanical energy, and describe situations in which
mechanical energy is not conserved 47 9 44 . . . Define wavelength, frequency, amplitude, and wave speed 53 13 35 . . . Describe the Doppler effect and give examples of its occurrences and applications 48 13 39 . . . List the names associated with the various types of electromagnetic radiation, and arrange them in order of increasing wavelength 33 21 46 . . . Describe the interaction between opposite charges and between like charges 60 10 30 . . . Define electrical current, voltage, and resistance
General Earth/Space Science Topics 47 22 31 . . . Describe the interactions between the poles of two magnets 43 28 29 . . . Know how latitude and longitude are used to designate location 45 14 41 . . . Describe the properties of a mineral and understand how minerals relate to rocks 41 13 46 . . . Compare how sedimentary, igneous, and metamorphic rocks are formed 41 17 42 . . . Know the layers of Earth's atmosphere 55 13 32 . . . Know how relative humidity and dew point relate to cloud formation 52 13 36 . . . Describe the characteristics and causes of thunderstorms, tornadoes, and hurricanes 36 11 53 . . . Know the causes of earthquakes and volcanoes 35 16 50 . . . Know how fossils are formed and what they tell us about the ages of rock layers 27 20 54 . . . Identify renewable and nonrenewable resources and ways to conserve and recycle resources 25 25 50 . . . Identify types of air, land, and water pollution and ways to improve air and water quality 44 14 42 . . . Compare planets, moons, asteroids, comets, and meteors 38 16 47 . . . Describe the motions of the Sun, Earth, Moon system 55 10 35 . . . Compare the composition, color, and life cycles of different classes of stars 54 8 37 . . . Describe the different types of galaxies
Note:MS = Middle school teachersHS = High school teachers1 = Not taught in course2 = Taught in the course but mainly as Review3 = Taught in course as part of the Standard Course Content. = This item was not asked at this grade level.
96
APPENDIX F: Content Topics “Taught” Percentages

Strand Rankings for ACT’s College Readiness StandardsTM
StrandMS
Mean SD Rank
% atTop
RankHS
Mean SD Rank
% atTop
RankPS
Mean SD Rank
% atTop
RankREMMean SD Rank
% atTop
Rank
English/WritingRank Ordering of Six Writing Categories
(1 = most important, 6 = least)Topic and Idea Development 1.83 1.26 1 59 1.65 1.13 1 63 2.18 1.66 1 55 1.99 1.47 1 57Organization, Unity, and Coherence 2.38 1.26 2 23 2.22 1.15 2 24 2.61 1.36 2 18 2.53 1.25 2 14Word Choice in Terms of Style, Tone, Clarity, and Economy 4.10 1.44 4 4 3.76 1.25 4 3 4.40 1.27 5 2 4.79 1.24 6 1Sentence Structure and Formation 3.59 1.25 3 6 3.53 1.12 3 5 3.12 1.21 3 13 2.79 1.15 3 21Conventions of Usage 4.40 1.37 5 4 4.85 1.11 5 2 4.08 1.53 4 8 4.34 1.41 4 6Conventions of Punctuation 4.71 1.46 6 4 5.00 1.31 6 3 4.61 1.56 6 5 4.56 1.37 5 1
Math, Middle School and DevelopmentalRank Ordering of Eight Math Categories
(1 = most important, 8 = least)Basic Operations and Applications 2.96 2.12 2 37 — — — — — — — — 1.53 1.21 1 74Numbers, Concepts, and Properties 3.07 1.70 3 16 — — — — — — — — 2.53 1.27 2 9Expressions, Equations, and Inequalities 2.66 1.74 1 38 — — — — — — — — 3.00 1.26 3 13Graphical Representations 4.29 1.78 4 3 — — — — — — — — 4.41 1.26 4 1Properties of Plane Figures 6.09 1.59 7 1 — — — — — — — — 6.14 1.28 7 0Measurement 5.04 1.76 5 3 — — — — — — — — 5.40 1.49 5 1Probability, Statistics, and Data Analysis 5.45 1.78 6 2 — — — — — — — — 6.91 1.31 8 1Functions 6.45 2.09 8 1 — — — — — — — — 6.08 1.86 6 2
Math, High School by courseRank Ordering of Eight Math Categories Alg 1 Alg 2 Geo P-Calc
(1 = most important, 8 = least) Mean Mean Mean MeanBasic Operations and Applications 2.86 1.85 2 37 4.18 1.84 5 14 4.19 1.61 4 7 5.55 1.98 5 4Numbers, Concepts, and Properties 3.35 1.59 3 6 3.55 1.39 4 6 4.93 1.48 6 1 4.12 1.53 4 4Expressions, Equations, and Inequalities 1.99 1.25 1 51 2.33 1.45 1 33 4.91 1.34 5 1 2.96 1.13 2 5Graphical Representations 3.46 1.39 4 2 3.41 1.40 3 6 3.92 1.45 3 1 3.13 1.28 3 1Properties of Plane Figures 7.20 1.05 8 0 6.93 1.23 8 1 1.44 1.04 1 76 5.87 1.31 6 0Measurement 6.35 1.34 7 0 6.62 1.33 7 1 2.46 1.38 2 13 6.86 1.17 8 0Probability, Statistics, and Data Analysis 5.92 1.46 6 1 6.08 1.66 6 1 7.49 0.86 8 0 6.19 1.76 7 0Functions 4.86 1.85 5 3 2.90 2.07 2 38 6.66 1.34 7 0 1.31 0.97 1 87
Math, Postsecondary by courseRank Ordering of Eight Math Categories Prob Alg P-Calc Calc
(1 = most important, 8 = least) Mean Mean Mean MeanBasic Operations and Applications 2.06 1.17 1 35 2.01 1.48 1 56 2.35 1.59 1 43 3.38 1.70 3 15Numbers, Concepts, and Properties 3.40 1.22 3 5 2.78 1.34 3 13 3.26 1.65 3 10 4.12 1.44 5 4Expressions, Equations, and Inequalities 4.62 1.58 5 3 2.68 1.22 2 20 2.74 1.35 2 22 2.48 1.28 2 24Graphical Representations 3.51 1.61 4 8 3.94 1.33 4 3 3.88 1.32 4 1 3.78 1.39 4 2Properties of Plane Figures 7.15 1.24 8 0 6.41 1.23 7 1 5.75 1.39 6 1 5.92 1.01 6 0Measurement 6.29 1.30 7 0 6.00 1.28 6 0 6.44 1.06 7 0 6.39 1.12 7 0Probability, Statistics, and Data Analysis 3.02 2.37 2 48 7.39 1.00 8 0 7.66 1.05 8 1 7.87 0.50 8 0Functions 5.95 1.67 6 2 4.80 1.90 5 8 3.91 2.00 5 21 2.06 1.47 1 55
Reading, Language Arts courses onlyRank Ordering of Five Reading Categories MS HS PS REM
(1 = most important, 5 = least) Mean Mean Mean MeanMain Ideas and Author's Approach 1.76 1.12 1 60 1.84 1.26 1 60 1.47 0.92 1 73 1.33 0.70 1 75Supporting Details 3.05 1.18 2 6 2.97 1.08 2 5 2.88 1.05 2 4 2.93 0.94 3 0Relationships 3.80 1.15 5 4 3.68 1.19 5 5 3.82 1.06 5 2 4.01 0.88 5 1Meaning of Words 3.08 1.41 3 18 3.30 1.35 4 13 3.71 1.23 4 7 2.92 1.39 2 19Generalizations and Conclusions 3.32 1.34 4 12 3.22 1.46 3 17 3.12 1.38 3 14 3.81 1.21 4 5
Reading, Social Studies courses onlyRank Ordering of Five Reading Categories
(1 = most important, 5 = least)Main Ideas and Author's Approach — — — — 2.27 1.45 1 44 1.62 1.10 1 67 — — — —Supporting Details — — — — 3.39 1.14 5 4 3.30 1.08 3 4 — — — —Relationships — — — — 3.19 1.32 3 12 3.32 1.07 4 3 — — — —Meaning of Words — — — — 3.37 1.39 4 14 4.03 1.25 5 5 — — — —Generalizations and Conclusions — — — — 2.78 1.44 2 26 2.73 1.32 2 21 — — — —
Note:MS = Middle school/junior high school teachersHS = High school teachersPS = Postsecondary instructors (no remedial)SD = Standard deviation. A measure of the range of values in a set of numbers. The more spread apart the data, the higher the standard deviation. REM = Remedial teachers
Alg = College AlgebraAlg1 = Algebra 1Alg2 = Algebra 2Calc = CalculusGeo = GeometryP-Calc = Pre-CalculusProb = Probability and/or Statistics
97
APPENDIX G: Strand Rankings for ACT’s College Readiness Standards

Strand Rankings for ACT’s College Readiness Standards (continued)
StrandMS
Mean SD Rank
% atTop
RankHS
Mean SD Rank
% atTop
RankPS
Mean SD Rank
% atTop
RankREMMean SD Rank
% atTop
Rank
All Sciences CombinedRank Ordering of All Science Categories Combined
(1 = most important, 3 = least)Interpretation of Data 1.97 0.57 2 18 1.73 0.68 1 41 1.58 0.70 1 54 — — — —Scientific Investigation 1.37 0.64 1 72 1.76 0.78 2 45 2.13 0.79 2 25 — — — —Evaluation of Models, Inferences, and Experimental Results 2.66 0.65 3 10 2.51 0.73 3 14 2.29 0.78 3 20 — — — —
BiologyRank Ordering of Three Biology Categories
(1 = most important, 3 = least)Interpretation of Data — — — — 1.89 0.63 2 26 1.68 0.70 1 46 — — — —Scientific Investigation — — — — 1.41 0.64 1 67 1.77 0.76 2 43 — — — —Evaluation of Models, Inferences, and Experimental Results — — — — 2.70 0.59 3 7 2.55 0.68 3 11 — — — —
ChemistryRank Ordering of Three Chemistry Categories
(1 = most important, 3 = least)Interpretation of Data — — — — 1.74 0.70 1 41 1.44 0.63 1 63 — — — —Scientific Investigation — — — — 1.82 0.79 2 42 2.28 0.76 t2 19 — — — —Evaluation of Models, Inferences, and Experimental Results — — — — 2.44 0.77 3 17 2.28 0.74 t2 18 — — — —
Earth ScienceRank Ordering of Three Earth Science Categories
(1 = most important, 3 = least)Interpretation of Data — — — — 1.71 0.69 1 43 1.61 0.72 1 53 — — — —Scientific Investigation — — — — 1.96 0.82 2 36 2.28 0.76 3 19 — — — —Evaluation of Models, Inferences, and Experimental Results — — — — 2.34 0.80 3 21 2.11 0.82 2 28 — — — —
PhysicsRank Ordering of Three Physics Categories
(1 = most important, 3 = least)Interpretation of Data — — — — 1.56 0.67 1 54 1.59 0.74 1 57 — — — —Scientific Investigation — — — — 1.89 0.73 2 33 2.20 0.74 2 19 — — — —Evaluation of Models, Inferences, and Experimental Results — — — — 2.56 0.70 3 12 2.21 0.79 3 23 — — — —
Note:MS = Middle school/junior high school teachersHS = High school teachersPS = Postsecondary instructors (no remedial)SD = Standard deviation. A measure of the range of values in a set of numbers. The more spread apart the data, the higher the standard deviation. REM = Remedial teachersA “t” before a number in the rank column indicates a tie.
98
APPENDIX G: Strand Rankings for ACT’s College Readiness Standards

Table H.1
Statistical Details for Remedial English/Writing Topics and Skills
REMMean
REM +/– Topics and Skills
Composition Process and Purpose3.38 0.12 Determine purpose and audience3.47 0.11 Use prewriting, brainstorming, or other techniques of invention3.21 0.12 Use mapping, clustering, outlining, or other organizational tools2.83 0.16 Gather and synthesize resources2.80 0.17 Evaluate source materials critically3.56 0.11 Develop a cohesive first draft3.79 0.08 Revise for content3.74 0.08 Edit and proofread for usage and mechanics2.75 0.18 Cite sources accurately3.50 0.13 Avoid plagiarism2.72 0.16 Develop one’s own voice as a writer0.93 0.14 Make use of and adapt elements of the writing process to create media productions3.36 0.12 Write to explore ideas2.47 0.17 Write to express one’s feelings2.31 0.18 Write to tell a story through fiction or nonfiction2.19 0.19 Write to analyze literature2.02 0.18 Write to analyze media3.64 0.09 Write to convey information3.42 0.13 Write to argue or persuade readers2.82 0.16 Write to describe a process or how to do something1.40 0.17 Write to produce work-related texts2.26 0.21 Write to present research3.74 0.09 COMPOSITION PROCESS AND PURPOSE as an overall set of skills
Topic and Idea Development3.84 0.07 Present a thesis that establishes focus on the topic3.87 0.06 Maintain a focus on the general topic throughout a piece of writing3.67 0.08 Narrow the focus to a specific issue within the general topic3.40 0.12 Provide appropriate context or background information for readers3.81 0.07 Develop ideas by using some specific reasons, details, and examples3.51 0.11 Take and maintain a position on an issue3.05 0.17 Support claims with multiple and appropriate sources of evidence2.87 0.16 Differentiate between assertions and evidence2.91 0.16 Fairly and accurately represent different points of view on an issue2.79 0.16 Anticipate and respond to counterarguments to a position taken on an issue3.41 0.11 Show some movement between general and specific ideas and examples3.02 0.15 Identify the basic purpose or role of a phrase or sentence within a piece of writing3.33 0.11 Determine the appropriateness of wording for audience and purpose3.44 0.11 Delete a clause or sentence because it is obviously irrelevant to a piece of writing3.43 0.11 Delete material that disturbs the development or flow of a piece of writing3.42 0.12 Determine whether a piece of writing has accomplished its intended purpose3.79 0.07 TOPIC AND IDEA DEVELOPMENT as an overall set of skills
Organization, Unity, and Coherence3.83 0.06 Provide an adequate organization with a logical grouping of ideas3.74 0.09 Use discernible introductions and conclusions3.60 0.10 Use appropriate transition words and phrases within a sentence or to connect sentences within a paragraph3.49 0.11 Use effective transition sentences to connect paragraphs
. . Use conjunctive adverbs to show time relationships (e.g., then, this time)3.14 0.14 Use conjunctive adverbs or phrases to express straightforward logical relationships3.09 0.13 Select the most logical place to add a sentence in a paragraph3.23 0.12 Determine the most logical place to add information to a piece of writing3.72 0.08 ORGANIZATION, UNITY, AND COHERENCE as an overall set of skills
Word Choice in Terms of Style,Tone, Clarity, and Economy2.78 0.14 Revise expressions that deviate from the style of a piece of writing
. . Revise sentences to correct awkward and confusing arrangements of sentence elements2.91 0.13 Maintain consistency of tone3.41 0.10 Choose words and images that are specific, precise, and clear in terms of their context3.41 0.10 Use appropriate vocabulary3.26 0.12 Delete obviously synonymous and wordy material in a sentence3.10 0.12 Use varied words and images
. . Revise vague nouns and pronouns3.44 0.11 Avoid vague pronouns (i.e., pronouns without a clear antecedent)3.18 0.13 Determine the clearest and most logical conjunction to link clauses3.23 0.12 Use rhetorically effective subordination, coordination, and parallelism3.30 0.10 WORD CHOICE IN TERMS OF STYLE,TONE, CLARITY, AND ECONOMY as an overall set of skills
Note:REM = Remedial teachers+/– = The value given under +/– is the confidence interval (CI) for the mean, at a confidence level of 95%. For example, for a mean of 3.27 with a CI
of 0.09, there is a 95% probability that the actual mean for the population is within the range 3.27 plus or minus 0.09.. = This item was not asked at this grade level.
99
APPENDIX H: Statistical Details for Remedial Topics and Skills

Table H.1
Statistical Details for Remedial English/Writing Topics and Skills (continued)
REMMean
REM +/– Topics and Skills
Sentence Structure and Formation3.39 0.11 Avoid faulty subordination, coordination, and parallelism3.69 0.08 Use punctuation and conjunctions to avoid awkward sentence fragments and fused sentences
. . Use punctuation and conjunctions to join clauses3.22 0.12 Avoid dangling and misplaced modifiers3.52 0.10 Decide on appropriate verb tense and voice by considering the meaning of an entire sentence
. . Revise shifts in verb tense between simple clauses in a sentence or between simple adjoining sentences3.54 0.10 Decide on appropriate verb tense and voice in terms of a paragraph or a piece of writing3.37 0.11 Avoid inappropriate shifts of mood, number, or person3.23 0.12 Identify missing or incorrect relative pronouns3.27 0.12 Use some varied kinds of sentence structures to vary pace and to support meaning3.56 0.10 SENTENCE STRUCTURE AND FORMATION as an overall set of skills
Conventions of Usage3.33 0.12 Form simple and compound tenses of regular and irregular verbs
. . Form past and past participle of irregular and commonly used verbs
. . Form comparative and superlative adjectives3.04 0.13 Form modifiers3.06 0.14 Choose between using an adverb and using an adjective in a particular situation3.63 0.09 Ensure straightforward subject-verb agreement3.50 0.10 Ensure straightforward pronoun-antecedent agreement3.22 0.13 Ensure subject-verb and pronoun-antecedent agreement in unusual or tricky situations 3.36 0.12 Use the proper form of possessive pronouns3.39 0.11 Use the appropriate case of a pronoun3.14 0.13 Use the idioms of standard written English3.12 0.14 Determine which preposition to use in simple contexts2.80 0.15 Determine the appropriate preposition to use in situations involving sophisticated language or ideas3.36 0.12 Use the appropriate word in frequently confused pairs of words (e.g., past and passed)3.40 0.11 CONVENTIONS OF USAGE as an overall set of skills
Conventions of Punctuation3.28 0.12 Delete commas that disturb sentence flow (e.g., between modifier and modified element)3.49 0.10 Provide appropriate punctuation in straightforward situations (e.g., items in a series)3.39 0.11 Punctuate between clauses of compound sentences when the conjunction is omitted3.35 0.11 Punctuate before a conjunctive adverb joining clauses of a compound sentence3.16 0.13 Punctuate parenthetical elements with commas, parentheses, and dashes3.29 0.12 Punctuate essential/nonessential elements, subordinate clauses, and restrictive/nonrestrictive appositives3.38 0.11 Punctuate possessive nouns and pronouns2.86 0.16 Punctuate dialogue3.28 0.12 Use a semicolon to indicate a close relationship between two independent clauses2.96 0.15 Use semicolons when items in a series have internal punctuation (e.g., when items have their own commas)2.95 0.14 Use a colon to introduce a series of phrases (e.g., a list of examples)2.78 0.16 Use a colon to introduce one or more sentences3.42 0.11 CONVENTIONS OF PUNCTUATION as an overall set of skills
Evaluation of Writing3.35 0.11 Writing appropriately for purpose and audience3.85 0.06 Writing unified and coherent text3.63 0.09 Developing ideas using appropriate organizational strategy3.77 0.07 Developing ideas using relevant examples and details3.71 0.08 Using a clear beginning, middle, and ending2.61 0.12 Using voice2.84 0.10 Using precise word choice2.74 0.11 Using appropriate tone2.97 0.13 Using sentence variety3.60 0.10 Using correct grammar, usage, and mechanics3.77 0.07 EVALUATION OF WRITING as an overall topic
Note:REM = Remedial teachers+/– = The value given under +/– is the confidence interval (CI) for the mean, at a confidence level of 95%. For example, for a mean of 3.27 with a CI
of 0.09, there is a 95% probability that the actual mean for the population is within the range 3.27 plus or minus 0.09.. = This item was not asked at this grade level.
100
APPENDIX H: Statistical Details for Remedial Topics and Skills

Table H.2
Statistical Details for Remedial Mathematics Topics and Skills
REMMean
REM +/– Topics and Skills
Process Skills2.99 0.15 Choose an appropriate method for calculating (e.g., mental, paper and pencil, calculator, or estimation)2.97 0.13 Estimate a reasonable result without using a calculator1.50 0.17 Demonstrate concepts using manipulatives2.58 0.15 Demonstrate concepts using pictorial representations3.48 0.11 Solve problems posed in real-world settings and interpret the solutions2.80 0.14 Recognize when essential information is missing3.62 0.09 Plan and carry out a strategy for solving multistep problems3.17 0.13 Recognize generalizations of mathematical ideas3.29 0.12 Recognize and use patterns to solve problems3.20 0.13 Apply mathematical ideas to new contexts2.29 0.15 Formulate new patterns or structures2.75 0.16 Solve several problems representing different aspects/components of one larger problem or scenario2.33 0.17 Understand roles of definitions, proof, and counterexamples3.52 0.10 Recall basic facts, definitions, formulas, and algebraic procedures as needed to solve a problem2.36 0.18 Recall theorems and more complex formulas when needed to solve a problem2.22 0.18 Apply theorems to solve a problem1.10 0.16 Construct and/or critique proofs, either informal or formal2.76 0.18 Perform basic operations with a calculator1.29 0.18 Use the statistical capabilities of a calculator1.65 0.21 Use the graphical capabilities of a calculator1.37 0.19 Use the symbolic algebra capabilities of a calculator0.82 0.15 Use spreadsheets0.88 0.15 Use dynamic geometry2.93 0.15 Solve routine problems quickly1.98 0.17 Solve novel problems quickly3.65 0.09 Use mathematical symbols correctly2.86 0.13 Understand new material from reading a textbook2.21 0.18 Work in a self-directed group3.14 0.14 PROCESS SKILLS as an overall topic
Basic Operations and Applications3.78 0.08 Perform addition, subtraction, multiplication, and division on signed rational numbers
. . Perform one-step computations with whole numbers and decimals3.51 0.11 Solve problems using ratios and proportions3.46 0.11 Solve problems involving percents (e.g., simple interest, tax, and markdowns)2.81 0.17 Convert units of measure3.65 0.10 Solve routine one-step arithmetic problems3.69 0.08 Solve routine two- or three-step arithmetic problems3.15 0.13 Solve nonroutine two- or three-step arithmetic problems2.78 0.16 Solve multistep arithmetic problems that involve planning or converting units of measure3.09 0.14 Solve word problems containing several rates, proportions, or percentages3.69 0.08 BASIC OPERATIONS AND APPLICATIONS as an overall topic
Numbers: Concepts and Properties. . Identify a digit’s place
3.63 0.10 Exhibit knowledge of elementary number concepts 3.26 0.14 Order fractions
. . Recognize one-digit factors of a number3.47 0.11 Find and use the least common multiple
. . Recognize equivalent fractions and fractions in lowest terms3.38 0.12 Perform computations with squares and square roots of numbers2.69 0.17 Perform computations with cubes and cube roots of numbers3.47 0.12 Apply rules of exponents1.14 0.19 Perform matrix addition and multiplication1.30 0.19 Exhibit knowledge of series and sequences (e.g., arithmetic and geometric)1.83 0.19 Find union and intersection of sets2.73 0.18 Apply properties of rational and irrational numbers1.75 0.21 Exhibit knowledge of complex numbers1.66 0.21 Apply properties of complex numbers3.11 0.15 Apply number properties involving multiples and factors2.47 0.18 Use scientific notation3.18 0.14 Determine when an expression is undefined1.35 0.20 Exhibit knowledge of logarithms and geometric sequences3.25 0.12 NUMBERS: CONCEPTS AND PROPERTIES as an overall topic
Note:REM = Remedial teachers+/– = The value given under +/– is the confidence interval (CI) for the mean, at a confidence level of 95%. For example, for a mean of 3.27 with a CI
of 0.09, there is a 95% probability that the actual mean for the population is within the range 3.27 plus or minus 0.09.. = This item was not asked at this grade level.
101
APPENDIX H: Statistical Details for Remedial Topics and Skills

Table H.2
Statistical Details for Remedial Mathematics Topics and Skills (continued)
REMMean
REM +/– Topics and Skills
Expressions, Equations, and Inequalities3.46 0.13 Evaluate algebraic expressions by substituting integers for unknown quantities
. . Exhibit knowledge of basic expressions3.55 0.12 Add and subtract simple algebraic expressions
. . Combine like terms3.68 0.10 Solve routine first-degree equations3.50 0.13 Solve linear equations and inequalities in one variable
. . Substitute whole numbers for unknown quantities3.51 0.12 Perform word-to-symbol translations3.31 0.13 Write expressions, equations, or inequalities for common settings
. . Solve one-step equations having integer or decimal values3.21 0.17 Multiply two binomials2.62 0.19 Solve absolute value equations and inequalities3.25 0.16 Add, subtract, and multiply polynomials3.00 0.19 Factor quadratics2.92 0.20 Solve quadratic equations
. . Apply properties of exponential functions1.92 0.21 Solve quadratic inequalities1.58 0.20 Use the discriminant2.42 0.21 Determine solutions of polynomial and rational equations1.45 0.20 Implement remainder and factor theorems for polynomials1.41 0.20 Apply properties of logarithmic and exponential functions2.49 0.21 Find solutions to systems of linear equations
. . Solve problems using equations of parabolas and circles1.38 0.20 Solve problems using equations of parabolas, circles, ellipses, and hyperbolas0.97 0.18 Solve problems using parametric equations1.45 0.21 Transform functions algebraically0.98 0.19 Find the limit of an expression3.14 0.15 EXPRESSIONS, EQUATIONS, AND INEQUALITIES as an overall topic
Graphical Representations3.26 0.15 Comprehend the concept of length on the number line
. . Locate points on the number line and in the first quadrant3.52 0.13 Locate points on the number line3.31 0.17 Locate points in the coordinate plane3.08 0.19 Exhibit knowledge of slope3.00 0.20 Find the slope of a line2.96 0.18 Identify graphs on a number line2.87 0.19 Match linear graphs with their equations2.70 0.19 Use properties of parallel and perpendicular lines2.36 0.20 Solve systems of equations and inequalities graphically
. . Recognize special characteristics of parabolas and circles1.38 0.20 Recognize special characteristics of parabolas, circles, ellipses, and hyperbolas2.63 0.20 Interpret and use information from graphs in the coordinate plane2.16 0.20 Identify characteristics of graphs based on a set of conditions or on a general equation1.36 0.20 Understand the properties of graphs of rational functions (e.g., asymptotes)1.88 0.21 Find midpoints2.05 0.21 Use the distance formula1.36 0.19 Work with discontinuous graphs and piecewise-defined functions2.85 0.17 GRAPHICAL REPRESENTATIONS as an overall topic
Properties of Plane Figures1.69 0.21 Find the measure of an angle using properties of parallel lines
. . Exhibit some knowledge of angles associated with parallel lines2.22 0.20 Exhibit knowledge of basic angle properties and special sums of angle measures (e.g., 90°, 180°, and 360°)2.75 0.19 Use the Pythagorean theorem1.70 0.20 Apply properties of lines, segments, and rays1.59 0.20 Apply properties of special quadrilaterals1.79 0.20 Apply properties of 30°-60°-90°, isosceles, similar, and congruent triangles1.26 0.18 Use relationships among angles, arcs, and distances in a circle1.13 0.18 Use logical relationships to answer problems (e.g., converse, contrapositive, and if-then)0.96 0.17 Prove results by mathematical induction1.75 0.19 PROPERTIES OF PLANE FIGURES as an overall topic
Note:REM = Remedial teachers+/– = The value given under +/– is the confidence interval (CI) for the mean, at a confidence level of 95%. For example, for a mean of 3.27 with a CI
of 0.09, there is a 95% probability that the actual mean for the population is within the range 3.27 plus or minus 0.09.. = This item was not asked at this grade level.
102
APPENDIX H: Statistical Details for Remedial Topics and Skills

Table H.2
Statistical Details for Remedial Mathematics Topics and Skills (continued)
REMMean
REM +/– Topics and Skills
Measurement3.13 0.16 Compute the area and perimeter of triangles and rectangles
. . Estimate or calculate of length of a line segment based on other lengths given on a geometric figure2.36 0.20 Compute the perimeter of composite geometric figures with unknown side lengths
. . Compute the area and perimeter of polygons2.67 0.20 Compute the area and circumference of circles after identifying necessary information2.45 0.21 Compute the area and perimeter of polygons with known side lengths2.05 0.20 Compute volume and surface area (e.g., cylinders, prisms, cones, and pyramids)1.83 0.21 Compute the area and volume of composite geometric figures2.58 0.20 Use geometric formulas2.04 0.22 Understand how to read measurement tools (e.g., rulers and protractors)1.59 0.20 Use scale factors to determine the magnitude of a size change2.36 0.18 MEASUREMENT as an overall topic
Probability, Statistics, and Data Analysis2.83 0.18 Read and interpret graphs, charts, and other data representations2.16 0.21 Manipulate data from tables and graphs2.57 0.19 Perform computations on data from tables and graphs1.89 0.21 Represent data (e.g., circle graphs, scatterplots, and frequency distributions)1.05 0.18 Exhibit knowledge of correlation, variance, and standard deviation of data2.15 0.21 Find the median and mode1.54 0.20 Determine the probability of a simple event
. . Use the relationship between the probability of an event and the probability of its complement1.17 0.18 Determine the probability of mutually exclusive, dependent, and independent events1.38 0.19 Exhibit knowledge of counting techniques1.03 0.17 Exhibit knowledge of combinations, permutations, and the binomial theorem2.82 0.20 Calculate the average of a list of numbers2.01 0.20 Calculate a missing data value, given the average and all the missing data values but one
. . Calculate the average, given the number of data values and the sum of the data values1.57 0.20 Calculate the average, given the frequency counts of all the data values1.51 0.20 Calculate or use a weighted average1.84 0.18 PROBABILITY, STATISTICS, AND DATA ANALYSIS as an overall topic
Functions2.48 0.21 Understand the concept of function
. . Use function notation
. . Find the domain and range of functions2.17 0.21 Find domain, range, and inverses of functions2.47 0.22 Evaluate linear functions based on function notation2.16 0.22 Evaluate quadratic functions based on function notation1.86 0.22 Evaluate polynomial functions based on function notation1.44 0.20 Evaluate composite functions based on function notation1.26 0.20 Apply basic trigonometric ratios to solve right-triangle problems1.05 0.18 Use trigonometric concepts and basic identities to solve problems0.96 0.17 Use the law of sines and law of cosines0.91 0.17 Apply properties of trigonometric functions and their graphs, including amplitude, period, and phase shift0.92 0.18 Use radian measure0.80 0.17 Exhibit knowledge of vectors in a plane1.74 0.21 FUNCTIONS as an overall topic
Note:REM = Remedial teachers+/– = The value given under +/– is the confidence interval (CI) for the mean, at a confidence level of 95%. For example, for a mean of 3.27 with a CI
of 0.09, there is a 95% probability that the actual mean for the population is within the range 3.27 plus or minus 0.09.. = This item was not asked at this grade level.
103
APPENDIX H: Statistical Details for Remedial Topics and Skills

Table H.3
Statistical Details for Remedial Reading Topics and Skills
REMMean
REM +/– Topics and Skills
Content1.33 0.13 Read/view and demonstrate understanding of poetry1.28 0.13 Read/view and demonstrate understanding of drama2.67 0.13 Read/view and demonstrate understanding of novels and short stories2.22 0.17 Read/view and demonstrate understanding of nonfiction trade books3.77 0.07 Read/view and demonstrate understanding of textbooks2.38 0.15 Read/view and demonstrate understanding of research studies2.29 0.14 Read/view and demonstrate understanding of primary sources2.95 0.12 Read/view and demonstrate understanding of news and feature articles, editorials/opinion pieces1.67 0.14 Read/view and demonstrate understanding of advertisements1.36 0.13 Read/view and demonstrate understanding of film and television2.12 0.15 Read/view and demonstrate understanding of multimedia presentations2.17 0.14 Read/view and demonstrate understanding of functional text2.99 0.13 Read/view and demonstrate understanding of graphs, charts, and diagrams2.46 0.16 Read/view and demonstrate understanding of work-related texts3.68 0.08 CONTENT as an overall set of skills
Main Ideas and Author’s Approach3.90 0.04 Infer the main idea or purpose of a straightforward paragraph
. . Recognize a clear intent of an author or narrator3.87 0.05 Determine the main idea or purpose of a complex paragraph3.93 0.03 Identify the main idea or purpose of a straightforward paragraph3.84 0.06 Determine the main idea, purpose, or theme of a text3.70 0.07 Understand the overall approach taken by an author or narrator (e.g., point of view, kinds of evidence used)3.81 0.06 Summarize basic events and ideas in a text3.90 0.05 MAIN IDEAS AND AUTHOR’S APPROACH as an overall set of skills
Supporting Details3.84 0.05 Locate important details stated in a text
. . Locate basic facts (e.g., names, dates, events) that are clearly stated in a text3.59 0.08 Locate and interpret minor or subtly stated details in a text3.78 0.06 Locate simple details at the sentence and paragraph level in a text3.74 0.06 Make simple inferences about how details are used to support points made in a text (e.g., support for a claim)3.63 0.08 Discern which details from different sections of a text support important points3.41 0.10 Understand subtle or complex roles that details can play in a text3.82 0.06 SUPPORTING DETAILS as an overall set of skills
Relationships3.60 0.09 Order simple sequences of events in a text
. . Determine when (e.g., first, last, before, after) or if an event occurred in a text3.44 0.09 Order subtle or complex sequences of events in a text
. . Recognize clear cause-effect relationships described within a single sentence3.64 0.08 Identify clear relationships between people, ideas, and so on in a text3.51 0.08 Infer subtle or complex relationships between people, ideas, and so on in a text3.77 0.06 Identify clear cause-effect relationships in a text3.48 0.08 Infer subtle or complex cause-effect relationships in a text3.71 0.06 RELATIONSHIPS as an overall set of skills
Meanings of Words3.82 0.06 Use context to determine the appropriate meaning of words and phrases
. . Understand the implication of a familiar word or phrase and of simple descriptive language3.48 0.09 Distinguish between literal and figurative meanings of words and phrases in a text3.63 0.08 Paraphrase concepts and ideas in a text3.05 0.13 Understand literary devices in a text3.80 0.06 MEANINGS OF WORDS as an overall set of skills
Note:REM = Remedial teachers+/– = The value given under +/– is the confidence interval (CI) for the mean, at a confidence level of 95%. For example, for a mean of 3.27 with a CI
of 0.09, there is a 95% probability that the actual mean for the population is within the range 3.27 plus or minus 0.09.. = This item was not asked at this grade level.
104
APPENDIX H: Statistical Details for Remedial Topics and Skills

Table H.3
Statistical Details for Remedial Reading Topics and Skills (continued)
REMMean
REM +/– Topics and Skills
Generalizations and Conclusions3.68 0.07 Draw generalizations and conclusions about people, ideas, and so on in a text
. . Draw simple generalizations and conclusions about the main characters in a text3.75 0.06 Draw generalizations and conclusions using details that support the main points of a text3.48 0.10 Predict outcomes based on a text3.71 0.07 Distinguish between fact, opinion, and reasoned judgment within a text3.03 0.13 Identify stereotypes in a text3.08 0.12 Identify logical fallacies in a text3.25 0.11 Identify persuasive techniques in a text3.33 0.11 Evaluate the range and quality of evidence used to support an argument in a text3.10 0.12 Make connections between two or more texts3.63 0.08 GENERALIZATIONS AND CONCLUSIONS as an overall set of skills
Evaluating Texts3.36 0.11 Demonstrate skills in uncomplicated literary narratives3.04 0.11 Demonstrate skills in more challenging literary narratives2.34 0.12 Demonstrate skills in complex literary narratives3.56 0.10 Demonstrate skills in uncomplicated informational texts3.35 0.10 Demonstrate skills in more challenging informational texts2.58 0.12 Demonstrate skills in complex informational texts3.07 0.12 Evaluate information in a text for relevance3.12 0.11 Evaluate information in a text for fair and accurate treatment of differing points of view3.06 0.12 Evaluate information in a text for persuasive techniques3.20 0.11 Evaluate information in a text for credibility and appropriateness of sources of information3.23 0.11 Evaluate information in a text for sufficiency of evidence in support of an argument or claim2.59 0.13 Evaluate information in a text for internal consistency2.64 0.13 Recognize how history and culture influence a text3.00 0.12 EVALUATING TEXTS as an overall set of skills
Note:REM = Remedial teachers+/– = The value given under +/– is the confidence interval (CI) for the mean, at a confidence level of 95%. For example, for a mean of 3.27 with a CI
of 0.09, there is a 95% probability that the actual mean for the population is within the range 3.27 plus or minus 0.09.. = This item was not asked at this grade level.
105
APPENDIX H: Statistical Details for Remedial Topics and Skills

106
APPENDIX I: ACT Writing Test Rubric
Score = 6Essays within this score range demonstrate effective skillin responding to the task.
The essay shows a clear understanding of the task. Theessay takes a position on the issue and may offer a critical con-text for discussion. The essay addresses complexity by exam-ining different perspectives on the issue, or by evaluating theimplications and/or complications of the issue, or by fullyresponding to counterarguments to the writer’s position.Development of ideas is ample, specific, and logical. Mostideas are fully elaborated. A clear focus on the specific issue inthe prompt is maintained. The organization of the essay isclear: the organization may be somewhat predictable or it maygrow from the writer’s purpose. Ideas are logically sequenced.Most transitions reflect the writer’s logic and are usually inte-grated into the essay. The introduction and conclusion areeffective, clear, and well developed. The essay shows a goodcommand of language. Sentences are varied and word choiceis varied and precise. There are few, if any, errors to distract thereader.
Score = 5 Essays within this score range demonstrate competentskill in responding to the task.
The essay shows a clear understanding of the task. Theessay takes a position on the issue and may offer a broad con-text for discussion. The essay shows recognition of complexityby partially evaluating the implications and/or complications ofthe issue, or by responding to counterarguments to the writer’sposition. Development of ideas is specific and logical. Mostideas are elaborated, with clear movement between generalstatements and specific reasons, examples, and details. Focuson the specific issue in the prompt is maintained. The organi-zation of the essay is clear, although it may be predictable.Ideas are logically sequenced, although simple and obvioustransitions may be used. The introduction and conclusion areclear and generally well developed. Language is competent.Sentences are somewhat varied and word choice is some-times varied and precise. There may be a few errors, but theyare rarely distracting.
Score = 4 Essays within this score range demonstrate adequate skillin responding to the task.
The essay shows an understanding of the task. The essaytakes a position on the issue and may offer some context fordiscussion. The essay may show some recognition of com-plexity by providing some response to counterarguments to thewriter’s position. Development of ideas is adequate, with somemovement between general statements and specific reasons,examples, and details. Focus on the specific issue in theprompt is maintained throughout most of the essay. The organ-ization of the essay is apparent but predictable. Some evi-dence of logical sequencing of ideas is apparent, althoughmost transitions are simple and obvious. The introduction andconclusion are clear and somewhat developed. Language isadequate, with some sentence variety and appropriate wordchoice. There may be some distracting errors, but they do notimpede understanding.
Score = 3Essays within this score range demonstrate some devel-oping skill in responding to the task.
The essay shows some understanding of the task. Theessay takes a position on the issue but does not offer a contextfor discussion. The essay may acknowledge a counterargu-ment to the writer’s position, but its development is brief orunclear. Development of ideas is limited and may be repeti-tious, with little, if any, movement between general statementsand specific reasons, examples, and details. Focus on the gen-eral topic is maintained, but focus on the specific issue in theprompt may not be maintained. The organization of the essayis simple. Ideas are logically grouped within parts of the essay,but there is little or no evidence of logical sequencing of ideas.Transitions, if used, are simple and obvious. An introductionand conclusion are clearly discernible but underdeveloped.Language shows a basic control. Sentences show a little vari-ety and word choice is appropriate. Errors may be distractingand may occasionally impede understanding.
Score = 2Essays within this score range demonstrate inconsistentor weak skill in responding to the task.
The essay shows a weak understanding of the task. Theessay may not take a position on the issue, or the essay maytake a position but fail to convey reasons to support that posi-tion, or the essay may take a position but fail to maintain astance. There is little or no recognition of a counterargument tothe writer’s position. The essay is thinly developed. If examplesare given, they are general and may not be clearly relevant.The essay may include extensive repetition of the writer’sideas or of ideas in the prompt. Focus on the general topic ismaintained, but focus on the specific issue in the prompt maynot be maintained. There is some indication of an organiza-tional structure, and some logical grouping of ideas within partsof the essay is apparent. Transitions, if used, are simple andobvious, and they may be inappropriate or misleading. Anintroduction and conclusion are discernible but minimal.Sentence structure and word choice are usually simple. Errorsmay be frequently distracting and may sometimes impedeunderstanding.
Score = 1 Essays within this score range show little or no skill inresponding to the task.
The essay shows little or no understanding of the task. Ifthe essay takes a position, it fails to convey reasons to supportthat position. The essay is minimally developed. The essaymay include excessive repetition of the writer’s ideas or ofideas in the prompt. Focus on the general topic is usually main-tained, but focus on the specific issue in the prompt may not bemaintained. There is little or no evidence of an organizationalstructure or of the logical grouping of ideas. Transitions arerarely used. If present, an introduction and conclusion are min-imal. Sentence structure and word choice are simple. Errorsmay be frequently distracting and may significantly impedeunderstanding.
No ScoreBlank, Off-Topic, Illegible, Not in English, or Void
SIX-POINT HOLISTIC SCORING RUBRIC FOR THE ACT WRITING TEST
Papers at each level exhibit all or most of the characteristics described at each score point.


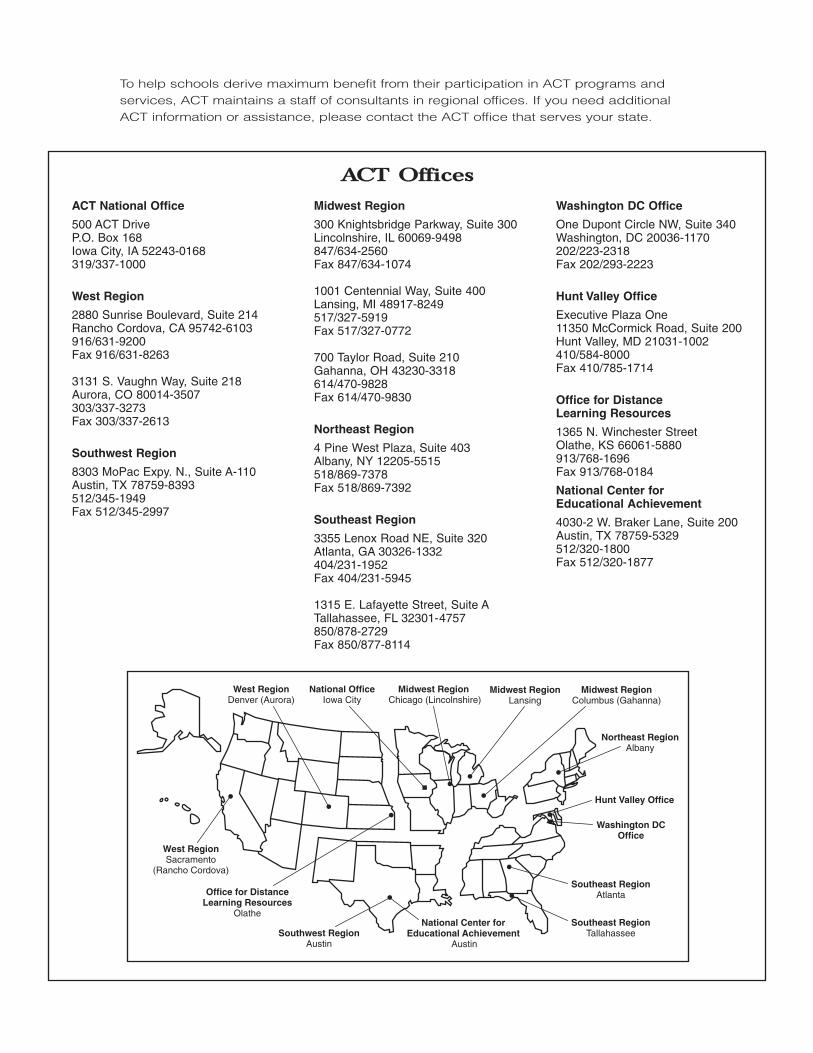
To help schools derive maximum benefit from their participation in ACT programs andservices, ACT maintains a staff of consultants in regional offices. If you need additionalACT information or assistance, please contact the ACT office that serves your state.
ACT Offices
ACT National Office
500 ACT DriveP.O. Box 168Iowa City, IA 52243-0168319/337-1000
West Region
2880 Sunrise Boulevard, Suite 214Rancho Cordova, CA 95742-6103916/631-9200Fax 916/631-8263
3131 S. Vaughn Way, Suite 218Aurora, CO 80014-3507303/337-3273Fax 303/337-2613
Southwest Region
8303 MoPac Expy. N., Suite A-110Austin, TX 78759-8393512/345-1949Fax 512/345-2997
Midwest Region
300 Knightsbridge Parkway, Suite 300Lincolnshire, IL 60069-9498847/634-2560Fax 847/634-1074
1001 Centennial Way, Suite 400Lansing, MI 48917-8249517/327-5919Fax 517/327-0772
700 Taylor Road, Suite 210Gahanna, OH 43230-3318614/470-9828Fax 614/470-9830
Northeast Region
4 Pine West Plaza, Suite 403Albany, NY 12205-5515518/869-7378Fax 518/869-7392
Southeast Region
3355 Lenox Road NE, Suite 320Atlanta, GA 30326-1332404/231-1952Fax 404/231-5945
1315 E. Lafayette Street, Suite ATallahassee, FL 32301-4757850/878-2729Fax 850/877-8114
Washington DC Office
One Dupont Circle NW, Suite 340Washington, DC 20036-1170202/223-2318Fax 202/293-2223
Hunt Valley Office
Executive Plaza One11350 McCormick Road, Suite 200 Hunt Valley, MD 21031-1002410/584-8000Fax 410/785-1714
Office for Distance Learning Resources
1365 N. Winchester StreetOlathe, KS 66061-5880913/768-1696Fax 913/768-0184
National Center forEducational Achievement
4030-2 W. Braker Lane, Suite 200Austin, TX 78759-5329512/320-1800Fax 512/320-1877
Midwest Region Chicago (Lincolnshire)
West RegionSacramento
(Rancho Cordova)
West RegionDenver (Aurora)
Northeast RegionAlbany
National OfficeIowa City
Southeast RegionAtlanta
Southwest RegionAustin
Southeast RegionTallahassee
Hunt Valley Office
Washington DCOffice
Office for DistanceLearning Resources
Olathe
Midwest RegionColumbus (Gahanna)
Midwest RegionLansing
National Center forEducational Achievement
Austin

*040256100*