act budget 2019-20. budget statement c: act health ...€¦ · web viewpurpose. the act health...
TRANSCRIPT

ContentsACT HEALTH DIRECTORATE......................................................................................................1
Purpose................................................................................................................................ 1
2019-20 Priorities.................................................................................................................1
Estimated Employment Level...............................................................................................2
Strategic Objectives and Indicators......................................................................................3
Output Classes....................................................................................................................10
Accountability Indicators....................................................................................................13
Changes to Appropriation..................................................................................................16
Summary of 2019-20 Infrastructure Program....................................................................20
Financial Statements..........................................................................................................21
CANBERRA HEALTH SERVICES................................................................................................33
Purpose.............................................................................................................................. 33
2019-20 Priorities...............................................................................................................33
Estimated Employment Level.............................................................................................34
Strategic Objectives and Indicators....................................................................................35
Output Classes....................................................................................................................39
Accountability Indicators....................................................................................................43
Changes to Appropriation..................................................................................................47
Summary of 2019-20 Infrastructure Program....................................................................51
Financial Statements..........................................................................................................53
ACT LOCAL HOSPITAL NETWORK............................................................................................64
Purpose.............................................................................................................................. 64
2019-20 Priorities...............................................................................................................64
Estimated Employment Level.............................................................................................64
Strategic Objectives and Indicators....................................................................................65
Output Classes....................................................................................................................68
2019-20 Budget Statements i

Accountability Indicators....................................................................................................69
Changes to Appropriation..................................................................................................70
Financial Statements..........................................................................................................72
2019-20 Budget Statements ii

ACT HEALTH DIRECTORATE
PurposeThe ACT Health Directorate is the steward of the health system in the ACT and partners with the community, government and other jurisdictions to provide better health outcomes for all in the ACT and surrounding regions. We provide a policy and population health capability based on a foundation of world-leading health and medical research. We develop strategies and set directions to ensure services meet community needs and expectations, delivering improved health outcomes. We are working to ensure our public health system is innovative, effective and sustainable now and into the future.
The ACT Health Directorate will deliver on these objectives by:
promoting good health and well-being;
supporting and applying preventative health measures;
improving access to appropriate healthcare;
ensuring quality health outcomes and stewardship of the health system;
delivering whole of government health strategy and policy, including infrastructure assets and system performance; and
supporting community sector organisations to provide various health services.
The ACT Health Directorate aims to support our people and strengthen teams by helping staff to reach their potential, promoting a learning culture and providing high-level leadership.
2019-20 Priorities
In 2019-20 there will be a continued focus on building and improving health infrastructure in the ACT, including through the progression of major projects for the Centenary Hospital for Women and Children, the Surgical Procedures Interventional Radiology and Emergency Centre (SPIRE) and the Inner North Walk in Centre. There will also be a focus on modernising core information technology systems and progressing work to expand Clare Holland House.
More resources will be directed towards essential medical and health research. There will also be additional funding for vaccinations for young people, Aboriginal and Torres Strait Islander health services and palliative care.
The ACT Health Directorate will continue to provide an integrated approach to mental health services through an expansion of services for people with mental illness as well as further support for mental health carers.
2019-20 Budget Statements 1 ACT Health Directorate

Improving the health and wellbeing of the community and preventing chronic disease will be an ongoing focus. We will work with community and academic and non-government partners to support all Canberrans to live healthier, more active lives.
The ACT Health Directorate along with Canberra Health Services and Calvary Public Hospital will work together in 2019-20 to implement all recommendations of the final report of the Independent Review into the Workplace Culture within ACT Public Health Services.
Estimated Employment Level
Table 1: Estimated Employment Level
2017-18Actual
Outcome1
2018-19Budget1
2018-19Estimated Outcome
2019-20Budget
Staffing (FTE) - 557 557 603
Note:1. This Directorate was created during 2018-19, on 1 October 2018 through an Administrative Arrangement Order. The 2018-19 Budget
has been notionally adjusted for comparative purposes.
2019-20 Budget Statements 2 ACT Health Directorate

Strategic Objectives and Indicators
Strategic Objective 1
Reducing the Waiting List for Elective Surgery
Reducing the number of people waiting longer than clinically recommended timeframes for elective surgery.
Table 2: The number of patients waiting longer than clinically recommended timeframes for elective surgery1
Strategic Indicator 2018-19 2018-19 2019-20Target Est. Outcome Target
The number of patients waiting longer than clinically recommended timeframes for elective surgery
n/a n/a 430
Note:1. This Strategic Objective was previously reported in the former Health Directorate in 2018-19. The 2018-19 Target and estimated
outcome is reported on page 35.
Strategic Objective 2
Performing more Elective Surgery
Increasing the number of elective surgery procedures performed.
Table 3: Number of elective surgeries performed1
Strategic Indicator 2018-19 2018-19 2019-20Target Est. Outcome Target
Number of elective surgeries performed n/a n/a 14,250
Note:1. This is a new Strategic Objective for 2019-20.
2019-20 Budget Statements 3 ACT Health Directorate

Strategic Objective 3
Improving Timeliness of Emergency Department Treatment
Percentage of Emergency Department presentations whose length of stay in the Emergency Department is four hours or less.
This provides an indication of the effectiveness of the public hospital system in meeting the need for Emergency Department services.
Table 4: The Percentage of Emergency Department presentations whose length of stay in the Emergency Department is four hours or less1
Strategic Indicator 2018–19 2018–19 2019–20Target Est. Outcome Target
Percentage of Emergency Department presentations whose length of stay in the Emergency Department is four hours or less2
n/a n/a 90%
Notes:1. This Strategic Objective was reported in the ACT Local Hospital Network in 2018-19. The 2018-19 Target and estimated outcome is
reported on page 66.2. Includes those admitted, transferred, referred for treatment elsewhere or sent home.
Strategic Objective 4
Improving the Mental Wellbeing of Canberrans
Percentage of ACT adults who self-report their mental health status as good, very good or excellent.
This indicator reflects people’s feelings and views about their mental health. Mental health is impacted by a range of factors, including access to appropriate preventive, early intervention, primary care, community and acute services.
Table 5: Percentage of ACT adults who self-report their mental health status as good, very good or excellent1
Strategic Indicator 2018–19 2018–19 2019–20Target Est. Outcome Target
Percentage of ACT adults who self-report their mental health as good, very good or excellent
n/a n/a >90%
Sources: ACT General Health Survey
Note:1. This is a new Strategic Objective in 2019-20. This Strategic Objective is measured biennially.
2019-20 Budget Statements 4 ACT Health Directorate

Strategic Objective 5
Improving the Health Status of Canberrans
Percentage of ACT adults who self-report their health status as good, very good or excellent.
This indicator reflects people’s feelings and views about their physical health status. Physical health status at a population level is impacted by a range of factors, including access to appropriate preventive health, health protection, primary care and hospital services.
Table 6: Percentage of ACT adults who self-report their health status as good, very good or excellent1
Strategic Indicator 2018-19 2018-19 2019-20Target Est. Outcome Target
Percentage of ACT adults who self-report their health status as good, very good or excellent
n/a n/a >90%
Sources: ACT General Health Survey
Note:1. This is a new Strategic Objective in 2019-20. This Strategic Objective is measured biennially.
Strategic Objective 6
Reducing the Risk of Fractured Femurs in ACT Residents Aged over 75 years
This indicator provides an indication of the success of public and community health initiatives to prevent hip fractures. In 2017-18, the ACT rate of admissions in persons aged 75 years and over with a fractured neck of femur was 6.0 per 1,000 persons in the ACT population. This is not significantly different to the long term target and follows a generally decreasing trend over a 10 year period.
Table 7: Reduction in the rate of broken hips (fractured neck of femur)
Strategic Indicator 2017–18 ACT Rate
Long TermTarget
Rate per 1,000 people 6.0 5.3
Source: ACT Admitted Patient Care data (Public Hospital data only)
2019-20 Budget Statements 5 ACT Health Directorate

Strategic Objective 7
Management of Chronic Disease: Maintenance of the Highest Life Expectancy at Birth
Life expectancy at birth provides an indication of the general health of the population and reflects on a range of issues other than the provision of health services such as economic and environmental factors. The ACT continues to enjoy the highest life expectancy of any jurisdiction in Australia and the Government aims to maintain this result.
Table 8: Life expectancy at birth in the ACT and Australia, by sex, 2014-20161
Strategic Indicator ACT(Years)
National (Years)
2019-20Target
Females 85.2 84.6 n/aMales 81.3 80.4 n/a
Source: Australian Bureau of Statistics (ABS) 2017. Cat. no.33302.0.55.001, ABS, Canberra.
Note:1. This Strategic Objective is being discontinued in 2019-20 as the data reported is publicly available and reported through the
Australian Bureau of Statistics (ABS) National Health Survey.
Strategic Objective 8
Lower Prevalence of Circulatory Disease than the National Average
The prevalence of cardiovascular disease is an important indicator of general population health as it is a major cause of mortality and morbidity.
While people of all ages can present with a chronic disease, the ageing of the population and longer life spans mean that chronic diseases will place major demands on the health system for workforce and financial resources.
Table 9: Proportion of the ACT population with heart or vascular disease, including stroke1
Strategic Indicator ACT Rate
National Rate
2019-20Target
Proportion of the population diagnosed with heart, or vascular disease, including stroke
3.9% 4.7% n/a
Source: Australian Bureau of Statistics 2015 National Health Survey: First Results, 2014–15. Cat no. 4364.0.55.001. ABS, Canberra.
Note: 1. This Strategic Objective is being discontinued in 2019-20 as the data reported is publicly available and reported through the
Australian Bureau of Statistics (ABS) National Health Survey.
2019-20 Budget Statements 6 ACT Health Directorate

Strategic Objective 9
Lower Prevalence of Overweight and Obese People
This indicator provides a marker of the success of healthy weight initiatives. Being overweight or obese is the most significant risk factor leading to Type 2 diabetes.
Table 10: Proportion of the ACT population that are overweight and obese1
Strategic Indicator Rate 2019–20 Target
ACT National
63.5%62.8%
n/an/a
Source: Australian Bureau of Statistics 2015 National Health Survey: First Results, 2014–15. Cat no. 4364.0.55.001. ABS, Canberra.
Note: 1. This Strategic Objective is being discontinued in 2019-20 as the data reported is publicly available and reported through the
Australian Bureau of Statistics (ABS) National Health Survey and in the ACT Chief Health Officer’s Report.
Strategic Objective 10
Addressing Gaps in Aboriginal and Torres Strait Islander Immunisation Status
The immunisation rate provides an indication of the success of programs and services to minimise the incidence of vaccine preventable diseases. The Aboriginal and Torres Strait Islander population is at higher risk of vaccine preventable diseases and associated complications. Although immunisation coverage rates for Aboriginal and Torres Strait Islander people fluctuate quarterly, annualised data indicates numbers are similar to the non-indigenous population.
Table 11: Immunisation rates—ACT Aboriginal and Torres Strait Islander population1
Strategic Indicator 2018–19 2018–19 2019–20Target Est. Outcome Target
Immunisation rates for vaccines in the national schedule for the ACT Indigenous population:12 to 15 months ≥95% 95% n/a24 to 27 months ≥95% 89% n/a60 to 63 months ≥95% 95% n/aAll ≥95% 93% n/a
Note: 1. This Strategic Objective has been moved to Accountability Indicators (see 1.2.d). The 2019-20 Targets are reported on page 14.
2019-20 Budget Statements 7 ACT Health Directorate

Strategic Objective 11
Higher Participation Rate in the Cervical Screening Program than the National Average
The two year participation rate provides an indication of the effectiveness of early intervention health messages. The ACT aims to exceed the national average for this indicator.
Table 12: Two year participation rate in the Cervical Screening Program1
Strategic Indicator ACT Rate
National Rate
2019-20Target
Two year participation rate 56.2% 56.9% n/a
Source: Cervical Screening in Australia 2014-15 (Published: Australian Institute of Health and Welfare, 2017).
Note: 1. This Strategic Objective is being discontinued in 2019-20 as the data reported is publicly available and reported through the
Australian Institute of Health and Welfare.
Strategic Objective 12
Achieve Lower than the Australian Average in the Decayed, Missing or Filled Teeth (DMFT) Index
This gives an indication of the effectiveness of dental prevention, early intervention and treatment services in the ACT. The aim for the ACT is to better the national average on the DMFT.
Table 13: The mean number of teeth with dental decay, missing or filled teeth at ages 6 and 121
Strategic Indicator ACT Rate
National Rate
2019-20Target
DMFT Index at 6 years 0.90 1.30 n/aDMFT Index at 12 years 0.30 0.90 n/a
Source: Oral Health of Australian Children – The National Child Oral Health Study 2012-14, (Published: University of Adelaide Press, 2016).
Note: 1. This Strategic Objective is being discontinued in 2019-20 as the data reported is publicly available and reported through the
Australian Institute of Health and Welfare.
2019-20 Budget Statements 8 ACT Health Directorate

Strategic Objective 13
Reduction in the Youth Smoking Rate
Results from the 2014 Australian Secondary School Alcohol and Drug (ASSAD) Survey show that 5.2 per cent of students in the ACT were current smokers in that year. This demonstrates a continued decline in current smoking from 15.3 per cent in 2002, 6.7 per cent in 2008 and 5.8 per cent in 2011.
The national rate for current smoking in youths in 2014 was 5.1 per cent.
Table 14: Percentage of persons aged 12 to 17 years who smoke regularly1
Strategic Indicator 2014 ACT 2014 National 2019-20Rate Rate Target
Percentage of persons aged 12 to 17 who are current smokers
5.2% 5.1% n/a
Sources: Australian Secondary Students’ Alcohol and Drug (ASSAD) Survey deidentified unit record files 2014, ACT Health: Australian secondary school students’ use of tobacco, alcohol, and over-the-counter and illicit substances in 2014 report, Centre for Behavioural Research in Cancer, Cancer Council Victoria, October 2016.
Note: 1. This Strategic Objective is being discontinued in 2019-20 as this data is publicly available and reported through the National Drug
Strategy and in the ACT Chief Health Officer’s Report.
2019-20 Budget Statements 9 ACT Health Directorate

Output ClassesThe ACT Health Directorate will undertake Territory wide planning of public health services, promote physically and mentally healthy communities and support continuous improvement of the public health system.
On 1 October 2018, the ACT Health Directorate was created following the Administrative Arrangement Order transferring from the former Health Directorate.
Output Class 1: Public Health Services
Table 15: Output Class 1: Public Health Services
2018-19 2019-20 Estimated Outcome Budget2
$'000 $'000Total Cost1 241,017 274,930Controlled Recurrent Payments 218,632 229,341
Notes:1. Total cost includes depreciation and amortisation of $15.714 million in 2018-19 and $24.503 million in 2019-20.2. The increase in the 2019-20 budget from the 2018-19 estimated outcome is mainly due to the timing of the Administrative
Arrangement Order. The 2018-19 estimated outcome only includes nine months of operation for the new ACT Health Directorate. In addition, the 2019-20 Budget includes new initiatives.
Output 1.1: Improved Hospital Services
The ACT Health Directorate will focus on: planning and delivering an ACT wide health service model; managing, developing, implementing and providing advice on health services
planning processes across the system; developing strategic policy and stewardship of the health system, including working
with the Commonwealth on key health improvement initiatives; managing demand for and supply of health services across the territory; improving the health and wellbeing of the ACT population by promoting healthy
behaviours and lifestyles and through ongoing monitoring and evaluation of health programs and policy;
preventing, and providing a timely response to, potential public health incidents; leading the health workforce and clinical training strategy including building strong
partnerships with key academic institutions and training providers; and commissioning and managing contracts for the provision of health services, including
partnerships with community sector organisations, peak bodies and advocacy groups.
2019-20 Budget Statements 10 ACT Health Directorate

Table 16: Output 1.1: Improved Hospital Services1
2018-19 2019-20Estimated Outcome Budget
$'000 $'000Total Cost 51,933 59,240Controlled Recurrent Payments 45,913 48,162
Note:1. This is a new output following the Administrative Arrangements Order, creating the ACT Health Directorate from the former Health
Directorate (now Canberra Health Services) on 1 October 2018.
Output 1.2: Healthy Communities
Canberrans enjoy one of the highest standards of health and wellbeing and have the highest life expectancy in Australia. However, our ageing population and increased prevalence of chronic conditions make it ever more challenging to keep our community healthy.
The ACT Health Directorate seeks to improve the health of the ACT population through evidence-based promotion of healthy lifestyles and interventions to address the range of risk and protective factors that determine the health of our community. This includes the delivery of activities that influence the social and environmental conditions that impact on population and individual health, comprising monitoring of recreational and drinking water quality, food safety, communicable diseases control and general environmental health.
Table 17: Output 1.2: Healthy Communities1
2018-19 2019-20Estimated Outcome Budget
$'000 $'000Total Cost 66,305 75,635Controlled Recurrent Payments 61,217 64,216
Note:1. This is a new output following the Administrative Arrangements Order, creating the ACT Health Directorate from the former Health
Directorate (now Canberra Health Services) on 1 October 2018. This output replaces Output 1.3 from the former Health Directorate in 2018-19.
Output 1.3: Mentally Healthy Communities
The ACT Health Directorate delivers an integrated cross-sector system that supports people with mental health concerns or illness, to access appropriate treatment and care in a timely and least restrictive manner. The Directorate collaborates with stakeholders on service system planning and policy, to ensure funding is targeted to provide safe, quality programs and services that offer seamless transition through stepped care and interventions as needed. A comprehensive response includes:
leadership through The Office for Mental Health and Wellbeing to the whole of government approach to sustainable, effective and coordinated sector innovation;
promotion of mental health and social wellbeing for all Canberrans;
2019-20 Budget Statements 11 ACT Health Directorate

raising awareness of mental health, suicide and mental illness across the community to reduce stigma and discrimination as well as on a personal level, encouraging people to seek help as needed;
prevention of suicide and suicide attempts wherever possible; early intervention to increase resilience and reduce the impact of mental health
issues; accessible and responsive primary, secondary and tertiary mental health services to
meet the needs of people with mental health issues including severe mental illness; and
evaluation and research to support ongoing development and improvement of the programs and services available.
Table 18: Output 1.3: Mentally Healthy Communities1
2018-19 2019-20Estimated Outcome Budget
$'000 $'000Total Cost 48,309 55,107Controlled Recurrent Payments 43,726 45,868
Note:1. This is a new output following the Administrative Arrangements Order, creating the ACT Health Directorate from the former Health
Directorate (now Canberra Health Services) on 1 October 2018.
Output 1.4: Continuous Improvement of the ACT Public Health System
The ACT Health Directorate provides strategic leadership and direction for the health system through development and administration of policies and legislation. This includes:
collaborating with stakeholders to develop territory-wide plans for health services, workforce and major capital investment;
driving service improvement and innovation through a collaborative policy cycle; providing responsive policy advice to government reflecting the changing nature of
the health sector; support delivery of high quality health services by building and maintaining
intergovernmental partnerships; and conducting research programs that translate research evidence into improved
healthcare.
Table 19: Output 1.4: Continuous Improvement of the ACT Public Health System1
2018-19 2019-20Estimated Outcome Budget
$'000 $'000Total Cost 74,470 84,948Controlled Recurrent Payments 67,776 71,095
Note:1. This is a new output following the Administrative Arrangements Order, creating the ACT Health Directorate from the former Health
Directorate (now Canberra Health Services) on 1 October 2018.
2019-20 Budget Statements 12 ACT Health Directorate

Accountability Indicators
Output Class 1: ACT Health Directorate
Output 1.1: Improved Hospital Services
Table 20: Accountability Indicators Output 1.1
2018–19Targets
2018–19Estimated Outcome
2019–20Targets
a. Percentage of all Emergency Department presentations treated within clinically appropriate timeframes1
n/a n/a 70%
b. Percentage of Category 1 elective surgery patients admitted for surgery within clinically recommended timeframes2,3
n/a n/a 100%
c. Percentage of Category 2 elective surgery patients admitted for surgery within clinically recommended timeframes2,4
n/a n/a 80%
d. Percentage of Category 3 elective surgery patients admitted for surgery within clinically recommended timeframes2,5
n/a n/a 93%
e. Calvary service (out of scope)6 1,434 1,228 n/af. Proportion of people who undergo a surgical operation
requiring an unplanned return to the operating theatre within a single episode of care due to complications of their primary condition7
Canberra Hospital n/a n/a <1.0%Calvary Public Hospital n/a n/a <0.5%
g. Proportion of people separated from ACT public hospitals who are re-admitted to hospital within 28 days of their separation due to complications of their condition (where re-admission was unforeseen at the time of separation)8
Canberra Hospital n/a n/a <2.0%Calvary Public Hospital n/a n/a <1.0%
Notes:1. This is a new Accountability Indicator in 2019-20 and was previously reported in the Local Hospital Network as Strategic Objective
number 2.1 in the 2018-19 Budget Statements.2. These are new Accountability Indicators in 2019-20, they were previously reported in the Local Hospital Network Strategic Objective
number 1 in the 2018-19 Budget Statements. The 2018-19 Targets and estimated outcomes are reported on page 65.3. Admission within 30 days is desirable for Category 1 (urgent) elective surgery patients.4. Admission within 90 days is desirable for Category 2 (semi-urgent) elective surgery patients.5. Admission within 365 days is desirable for Category 3 (non-urgent) elective surgery patients. 6. This indicator was formerly reported in the old Health Directorate in output 1.1.f and is being discontinued in 2019-20. This
Accountability Indicator is measured in NWAU (National Weighted Activity Units).7. This is a new Accountability Indicator in 2019-20, formerly Local Hospital Network Strategic Objective number 3.1 in the 2018-19
Budget Statements. The 2018-19 Targets and estimated outcomes are reported on page 67.8. This is a new Accountability Indicator in 2019-20, formerly Local Hospital Network Strategic Objective number 3.2 in the 2018-19
Budget Statements. Hospital targets are based on similar rates for peer hospitals – based on the Australian Council of Healthcare Standards (ACHS). The 2018-19 Targets and estimated outcomes are reported on page 67.
2019-20 Budget Statements 13 ACT Health Directorate

Output 1.2: Healthy Communities
Table 21: Accountability Indicators Output 1.2
2018–19Targets
2018–19Estimated Outcome
2019–20Targets
a. Samples analysed1,2 11,500 13,300 12,500b. Total number of inspections and proactive
site visits of food business12,500 2,436 2,500
c. Immunisation coverage for the primary immunisation schedule measured at 1 year of age, in accordance with the Australian Immunisation Register
95% 95% 95%
d. Immunisation rates for vaccines in the national schedule for the ACT Aboriginal and Torres Strait Islander population:3
i. 12 to 15 months n/a n/a ≥95% ii. 24 to 27 months n/a n/a ≥95% iii. 60 to 63 months n/a n/a ≥95% iv. All n/a n/a ≥95%
e. Number of businesses signed up to provide and promote healthier food choices as part of the Healthier Choices Canberra initiative4
n/a n/a 60
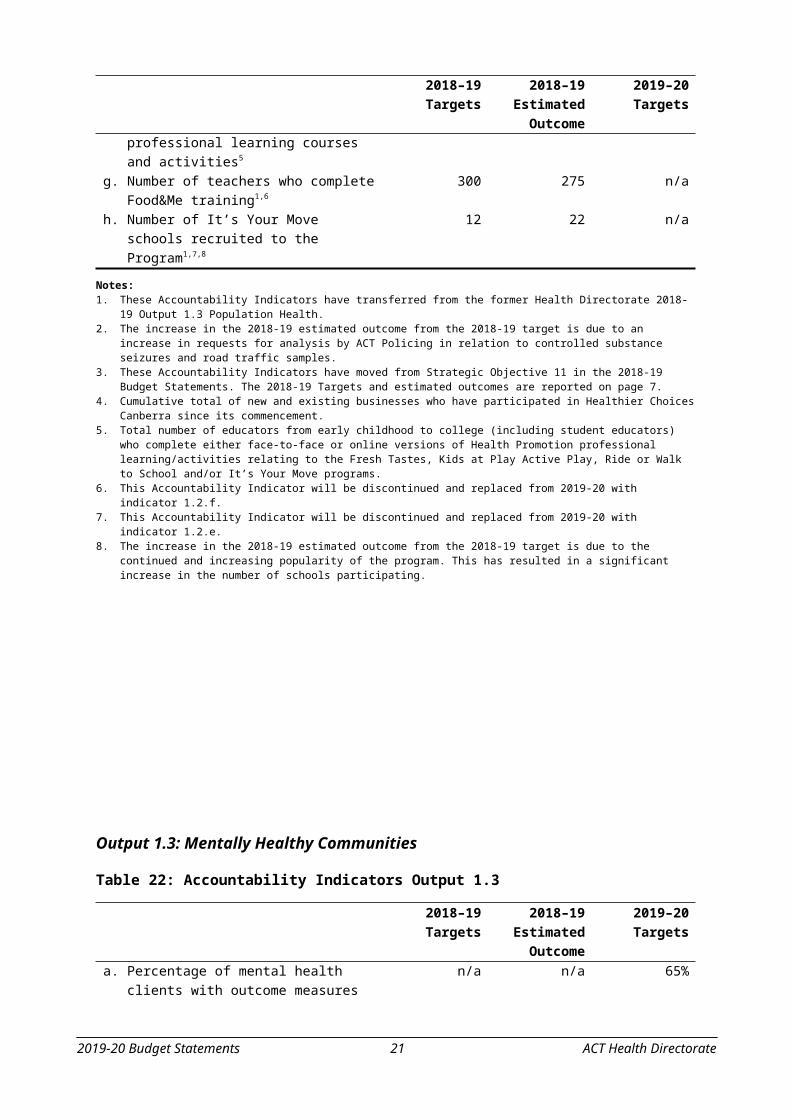
f. Number of educators that complete health promotion professional learning courses and activities5
n/a n/a 250
g. Number of teachers who complete Food&Me training1,6
300 275 n/a
h. Number of It’s Your Move schools recruited to the Program1,7,8
12 22 n/a
Notes:1. These Accountability Indicators have transferred from the former Health Directorate 2018-19 Output 1.3 Population Health.2. The increase in the 2018-19 estimated outcome from the 2018-19 target is due to an increase in requests for analysis by ACT Policing
in relation to controlled substance seizures and road traffic samples.3. These Accountability Indicators have moved from Strategic Objective 11 in the 2018-19 Budget Statements. The 2018-19 Targets and
estimated outcomes are reported on page 7.4. Cumulative total of new and existing businesses who have participated in Healthier Choices Canberra since its commencement.5. Total number of educators from early childhood to college (including student educators) who complete either face-to-face or online
versions of Health Promotion professional learning/activities relating to the Fresh Tastes, Kids at Play Active Play, Ride or Walk to School and/or It’s Your Move programs.
6. This Accountability Indicator will be discontinued and replaced from 2019-20 with indicator 1.2.f.7. This Accountability Indicator will be discontinued and replaced from 2019-20 with indicator 1.2.e.8. The increase in the 2018-19 estimated outcome from the 2018-19 target is due to the continued and increasing popularity of the
program. This has resulted in a significant increase in the number of schools participating.
2019-20 Budget Statements 14 ACT Health Directorate

Output 1.3: Mentally Healthy Communities
Table 22: Accountability Indicators Output 1.3
2018–19Targets
2018–19Estimated Outcome
2019–20Targets
a. Percentage of mental health clients with outcome measures completed1
n/a n/a 65%
b. Annual progress report on the implementation of the Office for Mental Health and Wellbeing Workplan 2019-2021 published2
n/a n/a 1
Notes:1. This Accountability Indicator was previously reported in the 2018-19 Budget Statements under the ACT Local Hospital Network 1.1.g.
The 2018-19 Target and estimated outcome is reported on page 69.2. This is a new Accountability Indicator in 2019-20.
Output 1.4: Continuous Improvement of the ACT Public Health System
Table 23: Accountability Indicators Output 1.4
2018–19Targets
2018–19Estimated Outcome
2019–20Targets
a. Biannual Report of progress in implementing the recommendations arising from the Independent Review into the Workplace Culture of ACT Public Health Services tabled in the Legislative Assembly1
n/a n/a 2
b. ACT Public Health Services Quarterly Performance Report1
n/a n/a 4
Note:1. These are new Accountability Indicators in 2019-20.
2019-20 Budget Statements 15 ACT Health Directorate

Changes to Appropriation
Table 24: Changes to appropriation – Controlled Recurrent Payments
2018-19 Estimated Outcome
$'000
2019-20 Budget
$'000
2020-21 Estimate
$'000
2021-22 Estimate
$'000
2022-23 Estimate
$'000
2018-19 Budget - - - - -
FMA Section 16B Rollovers from 2017-18Breastscreen 70-74 Year Extension NPA 70 - - - -Delivering the SPIRE Centre at Canberra Hospital 939 - - - -Elective Surgery 616 - - - -Encouraging More Clinical Trials NPA 50 - - - -Essential Vaccines Program NPA 2,088 - - - -Health Manager Upgrade 123 - - - -Health Protection Service Capital Procurement Program
250 - - - -
Healthy Canberra Grants 635 - - - -Northside Hospital Scoping Study 604 - - - -PP&E Contractual Commitments 4,950 - - - -Safer Families 298 - - - -University of Canberra Operational Readiness 1,434 - - - -Workforce Strategy 944 - - - -
2018-19 Budget Review Commencing operations of the Drug and Alcohol Court - 790 1,361 - -Flu vaccinations for children 513 524 538 551 565Independent Review into the workplace culture within ACT Public Health Services
2,565 - - - -
Supporting government transparency 96 195 - - -
2019-20 Budget Policy DecisionsACT Health Core IT Systems to align with the Digital Health Strategy
- 2,860 4,625 7,975 10,825
Delivering better mental health care for people in crisis - 147 - - -Co-design and planning: Aboriginal and Torres Strait Islander Alcohol and Drug Residential Rehabilitation Facility
- 300 - - -
Implementing the Independent Review into the Workplace Culture within ACT Public Health Services
-1,500 4,000 4,000 4,000 -
Delivering better care for Canberrans with complex needs through general practice
- 500 1,000 1,000 -
Delivering the ACT Drug Strategy Action Plan - 500 308 315 323Delivering the ACT Strategic Priorities for Aboriginal and Torres Strait Islander Health 2019-2028
- 180 310 310 315
Delivering the SPIRE Centre at Canberra Hospital - - 200 400 500Expanding Clare Holland House to strengthen palliative care
- - - 60 120
Expanding public healthcare services for eating disorders
- 179 442 683 913
2019-20 Budget Statements 16 ACT Health Directorate

Table 24: Changes to appropriation – Controlled Recurrent Payments (continued)
2018-19 Estimated Outcome
$'000
2019-20 Budget
$'000
2020-21 Estimate
$'000
2021-22 Estimate
$'000
2022-23 Estimate
$'000
Implementing real time prescription monitoring - - -30 -30 -30Implementing the Nurses and Midwives: Towards a Safer Culture - The First Step strategy
- 560 588 144 -
Implementing the recommendations of the Royal Commission into Institutional Responses to Child Sexual Abuse
- 321 377 285 289
Investing in medical and health research - 1,000 1,000 1,000 -Microsoft User Licensing Expansion - 1,894 1,942 1,990 2,040Protecting teens with meningococcal ACWY vaccinations
- 170 174 179 182
Strengthening capacity for mental health carers - 226 231 - -Supporting better healthcare for lesbian, gay, bisexual, transgender, intersex and queer Canberrans
- 87 - - -
Training ACT Government frontline workers to respond to family violence
- 6 9 - -
Transfer - New Initiative ICT expenses - 572 679 717 738
2019-20 Budget Technical AdjustmentsEfficiency Target -513 -524 -538 -551 -565Revised Superannuation Parameters - 1,121 1,121 1,121 1,121Rollover - ACT Pathology Laboratory Information System Replacement
-1,017 1,017 - - -
Rollover - Digital Solutions Capital ICT Program -1,066 1,066 - - -Rollover - Early Planning to expand Alcohol and Drug Services
-154 154 - - -
Rollover - Essential Vaccines -1,000 1,000 - - -Rollover - Healthy Canberra Grants -423 212 211 - -Rollover - Safer Families: Support and referral through specialist drug and alcohol treatment services
-598 598 - - -
Saving - Comcare Premium - -3,664 -3,664 -3,664 -3,664Transfer - Healthy and Active Living from Chief Minister, Treasury and Economic Development Directorate
- 920 238 244 251
Transfer - National Disability Insurance Scheme to Community Services Directorate
- -18,272 -18,728 -19,197 -19,677
Transfer - Separation of Canberra Health Services and ACT Health Directorate
208,728 240,840 249,453 250,591 255,721
Transfer - Shared Services to Chief Minister, Treasury and Economic Development Directorate
- -10,138 -10,391 -10,652 -10,918
2019-20 Budget 218,632 229,341 235,456 237,471 239,049
2019-20 Budget Statements 17 ACT Health Directorate

Table 25: Changes to appropriation – Expenses on Behalf of the Territory
2018-19 Estimated Outcome
$'000
2019-20 Budget
$'000
2020-21 Estimate
$'000
2021-22 Estimate
$'000
2022-23 Estimate
$'000
FMA Section 16B Rollovers from 2017-18Calvary Public Hospital – Operating theatre upgrade 386 - - - -Calvary Public Hospital – Upgrade of medical imaging equipment
146 - - - -
2019-20 Budget Review Replacement of aluminium composite panels at Calvary Public Hospital
1,159 350 - - -
2019-20 Budget Policy DecisionsCentenary Hospital for Women and Children - 3,000 - - -More surgical theatres at Calvary Public Hospital - 640 14 - -More urology services at Calvary Public Hospital - 2,500 - - -
2019-20 Budget Technical AdjustmentsTransfer - Better Infrastructure Fund to ACT Health Directorate
553 887 909 932 957
Transfer - Upgrade and Maintain ACT Health Assets Stage 2
590 2,370 - - -
Transfer - Winnunga Nimmityjah Aboriginal Health Service
1,165 2,435 7,700 - -
2019-20 Budget 3,999 12,182 8,623 932 957
2019-20 Budget Statements 18 ACT Health Directorate
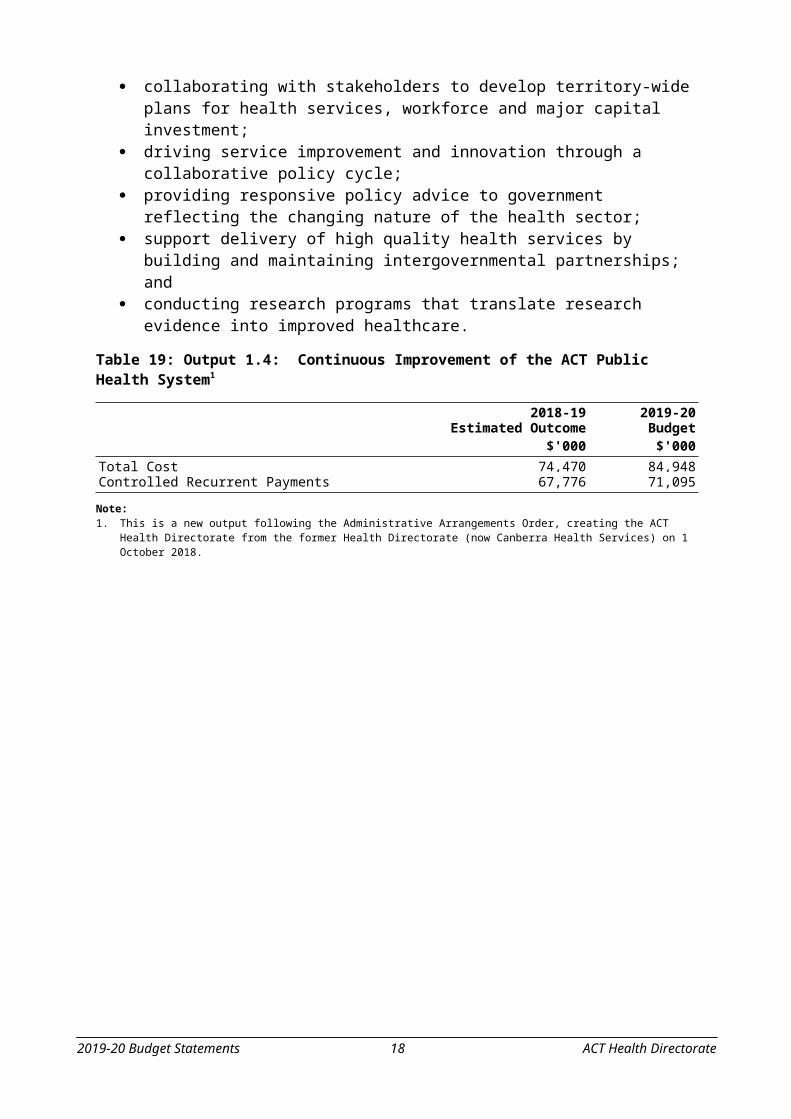
Table 26: Changes to appropriation – Capital Injections, Controlled
2018-19 Estimated Outcome
$'000
2019-20 Budget
$'000
2020-21 Estimate
$'000
2021-22 Estimate
$'000
2022-23 Estimate
$'000
FMA Section 16B Rollovers from 2017-18An E-Healthy Future 933 - - - -Improved the Drugs and Poisons Information System (DAPIS)
185 - - - -
2018-19 Budget ReviewCentenary Hospital for Women and Children 4,000 - - - -
2019-20 Budget Policy DecisionsACT Health Core IT Systems to align with the Digital Health Strategy
- 3,920 24,574 25,504 16,380
Expanding the Centenary Hospital for Women and Children
- - 30,000 10,550 -
Expanding Clare Holland House to strengthen palliative care
- - 2,000 2,000 -
Delivering the SPIRE Centre at Canberra Hospital - 53,700 - - -Implementing real time prescription monitoring - 788 1,326 - -
2019-20 Budget Technical AdjustmentsEnterprise Bargaining Agreement (EBA) pay increase 721 - - - -Revised Funding Profile:
- ACT Health ICT Upgrades -2,414 2,414 - - -- An E-Healthy Future 2,139 -2,139 - - -- Delivering the SPIRE Centre at Canberra Hospital -6,500 6,500 - - -- Expanding the Centenary Hospital for Women and Children
-5,500 5,500 - - -
Transfer - Separation of Canberra Health Services and Health Directorate
29,431 12,685 887 - -
2019-20 Budget 22,995 83,368 58,787 38,054 16,380
2019-20 Budget Statements 19 ACT Health Directorate

Summary of 2019-20 Infrastructure Program
Table 27: 2019-20 ACT Health Directorate Infrastructure ProgramProject 2019-20
$'0002020-21
$'0002021-22
$'0002022-23
$'000Four Year
Investment$'000
PhysicalCompletion
Date
Work In ProgressACT Health ICT upgrades 5,305 - - - 5,305 Jun-20ACT Pathology Laboratory information system replacement
5,829 887 - - 6,716 Jun-21
An E-Healthy Future 1,071 - - - 1,071 Jun-20Delivering the SPIRE Centre at Canberra Hospital
6,500 - - - 6,500 Jun-24
Expanding the Centenary Hospital for Women and Children
5,500 - - - 5,500 Jun-22
Protecting Canberrans from infectious diseases
398 - - - 398 Jun-21
Total Work In Progress 24,603 887 - - 25,490
Capital Upgrade ProgramsBetter Infrastructure Fund - Health 357 - - - 357 Sep-20Better Infrastructure Fund – Calvary Public Hospital
887 909 932 957 3,685 Sep-20
Total Capital Upgrade Programs 1,244 909 932 957 4,042
New WorksACT Health Core IT Systems to align with the Digital Health Strategy1
3,920 24,574 25,504 16,380 70,378 Jun-27
Delivering the SPIRE Centre at Canberra Hospital
53,700 - - - 53,700 Jun-24
Expanding Clare Holland House to strengthen palliative care
2,000 2,000 2,000 - 6,000 Dec-20
Expanding the Centenary Hospital for Women and Children
- 30,000 10,550 - 40,550 Jun-22
Implementing real time prescription monitoring
788 1,326 - - 2,114 Jun-22
Total New Capital 60,408 57,900 38,054 16,380 172,742
Capital GrantsACT Health critical assets upgrades 2,370 - - - 2,370 Jun-20Expanding the Centenary Hospital for Women and Children
3,000 - - - 3,000 Jun-22
More surgical theatres at Calvary Public Hospital
640 14 - - 654 Sep-20
More urology services at Calvary Public Hospital
2,500 - - - 2,500 Jun-20
New facility for Winnunga Nimmityjah Aboriginal Health Service
2,435 7,700 - - 10,135 Jun-21
Replacement of aluminium composite panels at Calvary Public Hospital
350 - - - 350 Oct-19
Total Capital Grants 11,295 7,714 - - 19,009
Total Infrastructure Program 97,550 67,410 38,986 17,337 221,283
2019-20 Budget Statements 20 ACT Health Directorate

Note:1. This program is funded over 8 years at a total of $106.384 million.
2019-20 Budget Statements 21 ACT Health Directorate
Financial Statements
Table 28: ACT Health Directorate: Operating Statement
2018-19 Budget
$'000
2018-19 Estimated Outcome
$'000
2019-20 Budget
$'000
Var%
2020-21 Estimate
$'000
2021-22 Estimate
$'000
2022-23 Estimate
$'000
Income
Revenue- Controlled Recurrent
Payments218,632 229,341 5 235,456 237,471 239,049
- User Charges 5,597 9,001 61 9,432 9,887 10,134- Resources Received Free
of Charge- 10,176 # 10,430 10,691 10,958
- Other Revenue 4,450 5,364 21 3,960 4,059 4,161
- Total Revenue 228,679 253,882 11 259,278 262,108 264,302
Gains
- Total Gains - - - - - -
- Total Income 228,679 253,882 11 259,278 262,108 264,302
Expenses - Employee Expenses 58,117 74,719 29 72,889 74,104 74,095- Superannuation Expenses 6,703 12,420 85 14,703 14,840 14,912- Supplies and Services 75,136 97,377 30 104,330 104,465 106,994- Depreciation and
Amortisation15,714 24,503 56 25,787 31,125 36,346
- Grants and Purchased Services
83,897 63,975 -24 64,555 65,902 65,501
- Interest Expenses - 2 # 2 2 2- Other Expenses 1,450 1,934 33 1,982 2,031 2,082
- Total Expenses 241,017 274,930 14 284,248 292,469 299,932
- Operating Result -12,338 -21,048 -71 -24,970 -30,361 -35,630
- Total Comprehensive Income
-12,338 -21,048 -71 -24,970 -30,361 -35,630
2019-20 Budget Statements 22 ACT Health Directorate

Table 29: ACT Health Directorate: Balance Sheet
Budgetat
30/6/19 $'000
2018-19 Estimated Outcome
$'000
Budgetat
30/6/20 $'000
Var%
Estimateat
30/6/21 $'000
Estimateat
30/6/22 $'000
Estimateat
30/6/23 $'000
Current Assets- Cash and Cash Equivalents 4,429 3,736 -16 3,538 3,332 3,122- Receivables 3,191 3,270 2 3,352 3,436 3,522- Other Assets 919 954 4 989 1,024 1,059
- Total Current Assets 8,539 7,960 -7 7,879 7,792 7,703
Non Current Assets- Property, Plant and
Equipment83,890 80,086 -5 77,929 82,272 77,495
- Intangible Assets 117,082 140,614 20 156,548 158,311 145,849- Capital Works in Progress 37,820 82,750 119 104,700 61,200 61,200- Other Assets 9,241 9,241 - 9,241 9,241 9,241
- Total Non Current Assets 248,033 312,691 26 348,418 311,024 293,785
- TOTAL ASSETS 256,572 320,651 25 356,297 318,816 301,488
Current Liabilities- Payables 4,691 4,809 3 4,928 5,051 5,179- Finance Leases - 55 # 110 165 220- Employee Benefits 20,825 22,890 10 25,033 27,233 29,489
- Total Current Liabilities 25,516 27,754 9 30,071 32,449 34,888
Non Current Liabilities- Finance Leases - 19 # 38 57 76- Employee Benefits 1,246 1,276 2 1,307 1,339 1,372- Other Provisions 102 102 - 102 102 102- Other Liabilities 13,925 13,397 -4 12,859 12,306 11,737
- Total Non Current Liabilities
15,273 14,794 -3 14,306 13,804 13,287
- TOTAL LIABILITIES 40,789 42,548 4 44,377 46,253 48,175
- NET ASSETS 215,783 278,103 29 311,920 272,563 253,313
- Accumulated Funds 215,783 278,103 29 311,920 272,563 253,313
- TOTAL FUNDS EMPLOYED 215,783 278,103 29 311,920 272,563 253,313
2019-20 Budget Statements 23 ACT Health Directorate

Table 30: ACT Health Directorate: Statement of Changes in Equity
Budgetat
30/6/19 $'000
2018-19 Estimated Outcome
$'000
Budgetat
30/6/20 $'000
Var%
Estimateat
30/6/21 $'000
Estimateat
30/6/22 $'000
Estimateat
30/6/23 $'000
Opening Equity- Opening Accumulated Funds - 215,783 # 278,103 264,870 272,563
- Balance at the Start of the Reporting Period
- 215,783 # 278,103 264,870 272,563
Comprehensive Income- Operating Result - Including
Economic Flows-12,338 -21,048 -71 -24,970 -30,361 -35,630
- Total Comprehensive Income -12,338 -21,048 -71 -24,970 -30,361 -35,630
- Total Movement in Reserves - - - - - -
Transactions Involving Owners Affecting Accumulated Funds- Capital Injections 22,995 83,368 263 58,787 38,054 16,380- Inc/Dec in Net Assets due to
Admin Restructure205,126 - -100 - - -
- Total Transactions Involving Owners Affecting Accumulated Funds
228,121 83,368 -63 58,787 38,054 16,380
Closing Equity- Closing Accumulated Funds 215,783 278,103 29 311,920 272,563 253,313
- Balance at the end of the Reporting Period
215,783 278,103 29 311,920 272,563 253,313
2019-20 Budget Statements 24 ACT Health Directorate

Table 31: ACT Health Directorate: Cash Flow Statement
2018-19 Budget
$'000
2018-19 Estimated Outcome
$'000
2019-20 Budget
$'000
Var %
2020-21 Estimate
$'000
2021-22 Estimate
$'000
2022-23 Estimate
$'000
CASH FLOWS FROM OPERATING ACTIVITIESReceipts
- Controlled Recurrent Payments
218,632 229,341 5 235,456 237,471 239,049
- User Charges 5,597 9,001 61 9,432 9,887 10,134- Other 4,450 5,367 21 3,964 4,062 4,165- Operating Receipts 228,679 243,709 7 248,852 251,420 253,348
Payments- Employee 57,069 73,054 28 71,255 72,424 72,372- Superannuation 6,703 12,420 85 14,703 14,840 14,912- Supplies and Services 75,136 87,298 16 93,900 93,774 96,036- Grants and Purchased
Services83,897 63,975 -24 64,555 65,902 65,501
- Interest Expenses - 2 # 2 2 2- Other 1,450 1,934 33 1,982 2,031 2,082- Operating Payments 224,255 238,683 6 246,397 248,973 250,905
- NET CASH INFLOW/(OUTFLOW) FROM OPERATING ACTIVITIES
4,424 5,026 14 2,455 2,447 2,443
CASH FLOWS FROM INVESTING ACTIVITIESReceipts
- Proceeds from Sale/Maturity of Investments
143 - -100 - - -
- Investing Receipts 143 - -100 - - -
Payments- Purchase of Property,
Plant and Equipment24,552 89,032 263 61,385 40,652 18,978
- Investing Payments 24,552 89,032 263 61,385 40,652 18,978
- NET CASH INFLOW/(OUTFLOW) FROM INVESTING ACTIVITIES
-24,409 -89,032 -265 -61,385 -40,652 -18,978
2019-20 Budget Statements 25 ACT Health Directorate

Table 31: ACT Health Directorate: Cash Flow Statement (continued)
2018-19 Estimated Outcome
$'000
2019-20 Budget
$'000
Var %
2020-21 Estimate
$'000
2021-22 Estimate
$'000
2022-23 Estimate
$'000
CASH FLOWS FROM FINANCING ACTIVITIESReceiptsCapital Injections 22,995 83,368 263 58,787 38,054 16,380Receipts of Transferred Cash Balances
1,419 - -100 - - -
Financing Receipts 24,414 83,368 241 58,787 38,054 16,380
PaymentsRepayment of Finance Lease Liabilities
- 55 # 55 55 55
Financing Payments - 55 # 55 55 55
NET CASH INFLOW/(OUTFLOW) FROM FINANCING ACTIVITIES
24,414 83,313 241 58,732 37,999 16,325
NET INCREASE/(DECREASE) IN CASH AND CASH EQUIVALENTS
4,429 -693 -116 -198 -206 -210
CASH AT THE BEGINNING OF REPORTING PERIOD
- 4,429 # 3,736 3,538 3,332
CASH AT THE END OF REPORTING PERIOD
4,429 3,736 -16 3,538 3,332 3,122
2019-20 Budget Statements 26 ACT Health Directorate

Notes to the Controlled Budget Statements
On 1 October 2018 the former Health Directorate was separated into two Directorates, the ACT Health Directorate and Canberra Health Services. For the purposes of these statements, the 2018-19 estimated outcome reflects nine months of operation of the new ACT Health Directorate.
Therefore, in most instances, the variances between the 2018-19 estimated outcome and the 2019-20 Budget relate to the part year operation in 2018-19 and the full year 2019-20 Budget.
Significant variations that do not relate to the separation of the former Health Directorate are as follows:
Operating Statement
user charges: the increase of $3.404 million in the 2019-20 Budget from the 2018-19 estimated outcome is mainly due to third party funding attached to the Clare Holland House expansion.
resources received free of charge: the increase of $10.176 million in the 2019-20 Budget from the 2018-19 estimated outcome is due to the recognition of services provided free of charge by Shared Services for the provision of human resources, finance and procurement services.
superannuation expenses: the increase of $5.717 million in the 2019-20 Budget from the 2018-19 estimated outcome is due to wage rises, an increase in the superannuation contribution rates and new initiatives.
depreciation and amortisation: the increase of $8.789 million in the 2019-20 Budget from the 2018-19 estimated outcome is due to the centralisation of information technology and communication functions within the ACT Health Directorate and the ‘ACT Health ICT Upgrades program’.
grants and purchased services: the decrease of $19.922 million in the 2019-20 Budget from the 2018-19 estimated outcome is mainly due to the transfer of National Disability Insurance Scheme payments to the Community Services Directorate and the removal of one-off payments to Canberra Health Services in 2018-19.
Balance Sheet
property, plant and equipment: the decrease of $3.804 million in the 2019-20 Budget from the 2018-19 estimated outcome mainly relates to the depreciation of assets.
intangible assets: the increase of $23.532 million in the 2019-20 Budget from the 2018-19 estimated outcome is mainly due to the completion of information technology projects including ‘An E-Healthy Future’, ‘ACT Health ICT Upgrades’ and ‘ACT Core IT Systems’.
2019-20 Budget Statements 27 ACT Health Directorate

capital works in progress: the increase of $44.930 million in the 2019-20 Budget from the 2018-19 estimated outcome is mainly due to the ‘SPIRE Centre at Canberra Hospital’.
current employee benefits: the increase of $2.065 million in the 2019-20 Budget from the 2018-19 estimated outcome is mainly due to wage rises and new initiatives.
Statement of Changes in Equity
capital injections: the increase of $60.373 million in the 2019-20 Budget from the 2018-19 estimated outcome is mainly due a larger capital works program including the ‘SPIRE Centre at Canberra Hospital’, ‘Expansion of the Centenary Hospital for Women and Children’ and ‘ACT Health Core IT Systems’.
Cash Flow Statement
Variations in the Statement are explained in the notes above.
2019-20 Budget Statements 28 ACT Health Directorate

Financial Statements - Territorial
Table 32: ACT Health Directorate: Statement of Income and Expenses on behalf of the Territory
2018-19 Budget
$'000
2018-19 Estimated Outcome
$'000
2019-20 Budget
$'000
Var%
2020-21 Estimate
$'000
2021-22 Estimate
$'000
2022-23 Estimate
$'000
Revenue- Payment for Expenses on
Behalf of the Territory3,999 12,182 205 8,623 932 957
- Taxes, Fees and Fines 1,021 1,474 44 1,532 1,578 1,617
- Total Revenue 5,020 13,656 172 10,155 2,510 2,574
- Total Income 5,020 13,656 172 10,155 2,510 2,574
Expenses - Grants and Purchased
Services3,866 12,182 215 8,623 932 957
- Transfer Expenses 1,021 1,474 44 1,532 1,578 1,617
- Total Expenses 4,887 13,656 179 10,155 2,510 2,574
- Operating Result 133 - -100 - - -
- Total Comprehensive Income
133 - -100 - - -
2019-20 Budget Statements 29 ACT Health Directorate

Table 33: ACT Health Directorate: Statement of Assets and Liabilities on behalf of the Territory
Budgetat
30/6/19 $'000
2018-19 Estimated Outcome
$'000
Budgetat
30/6/20 $'000
Var%
Estimateat
30/6/21 $'000
Estimateat
30/6/22 $'000
Estimateat
30/6/23 $'000
Current Assets- Cash and Cash Equivalents 1,089 1,089 - 1,089 1,089 1,089- Receivables 1,578 1,578 - 1,578 1,578 1,578
- Total Current Assets 2,667 2,667 - 2,667 2,667 2,667
Non Current Assets
- Total Non Current Assets - - - - - -
- TOTAL ASSETS 2,667 2,667 - 2,667 2,667 2,667
Current Liabilities- Payables 300 300 - 300 300 300
- Total Current Liabilities 300 300 - 300 300 300
Non Current Liabilities
- Total Non Current Liabilities
- - - - - -
- TOTAL LIABILITIES 300 300 - 300 300 300
- NET ASSETS 2,367 2,367 - 2,367 2,367 2,367
REPRESENTED BY FUNDS EMPLOYED
- Accumulated Funds 2,367 2,367 - 2,367 2,367 2,367
- TOTAL FUNDS EMPLOYED 2,367 2,367 - 2,367 2,367 2,367
2019-20 Budget Statements 30 ACT Health Directorate

Table 34: ACT Health Directorate: Statement of Changes in Equity on behalf of the Territory
Budgetat
30/6/19 $'000
2018-19 Estimated Outcome
$'000
Budgetat
30/6/20 $'000
Var%
Estimateat
30/6/21 $'000
Estimateat
30/6/22 $'000
Estimateat
30/6/23 $'000
Opening Equity- Opening Accumulated - 2 367 # 2 367 2 367 2 367
- Balance at the Start of the Reporting Period
- 2 367 # 2 367 2 367 2 367
- Operating Result - Including Economic Flows
133 - -100 - - -
- Total Movement in Reserves
- - - - - -
Closing Equity- Closing Accumulated
Funds2 367 2 367 - 2 367 2 367 2 367
- Balance at the end of the Reporting Period
2 367 2 367 - 2 367 2 367 2 367
2019-20 Budget Statements 31 ACT Health Directorate

Table 35: ACT Health Directorate: Cash Flow Statement on behalf of the Territory
2018-19 2018-19 2019-20 Var 2020-21 2021-22 2022-23Budget Estimated
OutcomeBudget % Estimate Estimate Estimate
$'000 $'000 $'000 $'000 $'000 $'000CASH FLOWS FROM OPERATING ACTIVITIESReceipts
- Payment for Expenses on Behalf of the Territory
3,999 12,182 205 8,623 932 957
- Taxes, Fees and Fines 1,021 1,474 44 1,532 1,578 1,617- Other 401 1,218 204 862 93 95- Operating Receipts 5,421 14,874 174 11,017 2,603 2,669
Payments- Grants and Purchased Services 3,866 12,182 215 8,623 932 957- Transfer of Territory Receipts to
the ACT Government1,021 1,474 44 1,532 1,578 1,617
- Other 401 1,218 204 862 93 95- Operating Payments 5,288 14,874 181 11,017 2,603 2,669
- NET INCREASE/(DECREASE) IN CASH AND CASH EQUIVALENTS
1,089 - -100 - - -
- CASH AT THE BEGINNING OF REPORTING PERIOD
- 1,089 # 1,089 1,089 1,089
- CASH AT THE END OF REPORTING PERIOD
1,089 1,089 - 1,089 1,089 1,089
2019-20 Budget Statements 32 ACT Health Directorate

Notes to the Territorial Budget Statements
On 1 October 2018, the former Health Directorate was separated into two Directorates, the ACT Health Directorate and Canberra Health Services. The Territorial Financial Statement figures shown here represent 9 months activity in 2018-19 only. The 2018-19 original budget is shown against the Canberra Health Services Territorial Financial Statements.
Significant variations are as follows:
Statement of Income and Expenses on behalf of the Territory
payment for expenses on behalf of the territory and grants and purchased services: the increase of $8.183 million in the 2019-20 Budget from the 2018-19 estimated outcome is due to a larger capital grants program including expansion of Calvary Public Hospital Urology, Winnunga Nimmityjah Aboriginal Health Service and the Centenary Hospital for Women and Children.
taxes, fees and fines and transfer expenses: the increase of $0.453 million in the 2019-20 Budget from the 2018-19 estimated outcome is due to a full twelve months of operating in 2019-20 and indexation.
Cash Flow Statement
Variations in the Statement are explained in the notes above.
2019-20 Budget Statements 33 ACT Health Directorate

CANBERRA HEALTH SERVICES
PurposeCanberra Health Services partners with the community and consumers for better health outcomes by:
delivering timely, patient and family centred care;
strengthening partnerships;
promoting good health and well-being;
improving access to appropriate healthcare; and
having robust safety and quality systems.
We aim for sustainability and improved efficiency in the use of resources by designing sustainable services to deliver outcomes efficiently and embedding a culture of research and innovation.
Canberra Health Services continues to strengthen clinical governance of its processes and strives to be accountable to both the government and the community.
Canberra Health Services aims to support our people and strengthen teams by helping staff to reach their potential, promoting a learning culture and providing high-level leadership.
2019-20 PrioritiesIn line with the ACT Government announcement in March 2018, the former Health Directorate separated into two distinct organisations as of 1 October 2018, with Canberra Health Services now responsible for the delivery of clinical services and the ACT Health Directorate responsible for strategic policy and planning.
Both Canberra Health Services and the ACT Health Directorate will continue with reform activities to achieve the commitment of the health of our growing community, a commitment to quality, innovation, engagement, accountability and a focus on strategic policy and planning stewardship of the health system.
In 2019-20, there will be a continued focus on core services within the ACT health system enhancing the efficiency in Emergency Surgery, Emergency Department services and Elective Surgery to meet the growing demand for critical care services.
Both Canberra Health Services and the ACT Health Directorate will continue to work to improve efficiencies across the system and focus on providing care in the right place at the right time through initiatives such as Hospital in the Home, which will be expanded in 2019-20.
2019-20 Budget Statements 34 Canberra Health Services

Canberra Health Services will continue to focus on improving the efficiency and effectiveness of ACT mental health services, in particular relating to accommodation to support people with mental health issues to recover and live in our community.
Estimated Employment Level
Table 1: Estimated Employment Level
2017-18Actual
Outcome
2018-19Budget1
2018-19Estimated Outcome
2019-20Budget
Staffing (FTE) 6,660 6,139 6,390 6,529
Note: 1. The 2018-19 Budget has been notionally adjusted for comparative purposes to reflect the Administrative
Arrangements Order to establish the ACT Health Directorate on 1 October 2018.
2019-20 Budget Statements 35 Canberra Health Services

Strategic Objectives and Indicators
Strategic Objective 1
Reducing the Waiting List for Elective Surgery
Reducing the number of people waiting longer than clinically recommended timeframes for elective surgery.
Table 2: The number of patients waiting longer than clinically recommended timeframes for elective surgery1
Strategic Indicator 2018-19 2018-19 2019-20Target Est. Outcome Target
The number of patients waiting longer than clinically recommended timeframes for elective surgery
430 571 n/a
Note:1. This Strategic Objective has been discontinued as a 2019-20 Canberra Health Service indicator. The 2019-20 target for the whole
Territory, including Calvary Public Hospital, will be reported in 2019-20 in the ACT Health Directorate, Strategic Objective 1 as shown on page 3. The 2018-19 target and estimated outcome as reported also include Calvary Public Hospital patients.
Strategic Objective 2
Reducing the Usage of Seclusion in Mental Health Episodes
This measures the effectiveness of public mental health services in the ACT over time in providing services that minimise the need for seclusion.
Table 3: Strategic Indicator 2.1: The proportion of mental health clients who are subject to a seclusion episode while being an admitted patient in an ACT public mental health inpatient unit
Strategic Indicator 2018–19 2018–19 2019–20Target Est. Outcome1 Target2
The proportion of mental health clients who are subject to a seclusion episode while being an admitted patient in an ACT public mental health inpatient unit
<5% 16% n/a
Notes:1. The estimated outcome for this measure in 2018-19 is exceeding the target of less than 5 per cent due to sustained periods of high
demand with an increase in volatile patients requiring seclusion. Due to the opening of Dhulwa, which is specifically used to treat complex patients, increases in seclusion can be expected.
2. This Strategic Objective is being discontinued in 2019-20 and replaced with the ‘rate’ of seclusion events per 1,000 bed days, which is the national standard and counting methodology for this indicator (refer 2.2 below).
2019-20 Budget Statements 36 Canberra Health Services

Table 4: Strategic Indicator 2.2: The rate of mental health clients who are subject to a seclusion event while being an admitted patient in an ACT public mental health inpatient unit per 1,000 bed days
Strategic Indicator 2018–19 2018–19 2019–20Target Est. Outcome Target1
The rate of mental health clients who are subject to a seclusion event while being an admitted patient in an ACT public mental health inpatient unit per 1,000 bed days
n/a n/a <7 per 1,000 bed days
Note:1. For 2019-20, Canberra Health Services have adopted the national standard and counting methodology for this indicator which is
reported as a rate per 1,000 bed days.
Strategic Objective 3
Maintaining Reduced Rates of Patient Return to an ACT Public Acute Psychiatric Inpatient Unit
This indicator reflects the quality of care provided to acute mental health patients.
Table 5: The proportion of clients who return to hospital within 28 days of discharge from an ACT public acute psychiatric unit following an acute episode of care
Strategic Indicator 2018–19 2018–19 2019–20Target Est. Outcome1 Target2
Proportion of clients who return to hospital within 28 days of discharge from an ACT acute psychiatric mental health inpatient unit
<10% n/a <17%
Notes:1. Due to considerations of recommendations made under the ACT Auditor General’s Report: Mental Health Services – Transition from
Acute Care 2016, the estimated outcome was not available at the time of publishing. However, a methodology will be adopted for reporting in 2019-20.
2. The methodology for this measure in 2019-20 has changed to reflect the national counting methodology which now incorporates all Mental Health inpatient readmissions as opposed to the previous measure of unplanned readmissions only and therefore the target for 2019-20 has been adjusted to reflect this. The Strategic Objective measures Canberra Health Services performance only.
Strategic Objective 4
Maximising the Quality of Hospital Services
This indicator highlights the effectiveness and quality of care provided to patients within Canberra Health Services from a patient’s perspective.
Table 6: Overall how would you rate the care you received in hospital1
Strategic Indicator 2018–19 2018–19 2019–20Target Est. Outcome Target
Patient Experience Survey – score of positive patient experience responses
n/a n/a >80
Note:1. This is a new Strategic Objective in 2019-20.
2019-20 Budget Statements 37 Canberra Health Services

Strategic Objective 5
The number of people admitted to hospitals per 10,000 occupied bed days who acquire a Staphylococcus Aureus Bacteraemia infection (SAB infection) during their stay. This provides an indication of the safety of hospital based services.
Table 7: The number of people admitted to hospitals per 10,000 occupied bed days who acquire a Staphylococcus Aureus Bacteraemia infection (SAB infection) during their stay1,2
Strategic Indicator 2018–19 2018–19 2019–20Target3 Est. Outcome3 Target
Number of admitted patients who acquire a SAB infection per 10,000 bed days
n/a n/a <2.0 per 10,000
Notes:1. Hospital targets are based on similar rates for peer hospitals – based on the Australian Council of Healthcare Standards (ACHS).2. This is a new Strategic Objective for Canberra Health Services and was previously reported in the Local Hospital Network in 2018-19,
Strategic Objective 3.3 as a Territory wide measure. The 2019-20 target is for Canberra Health Services performance only.3. The 2018-19 Target and estimated outcome is reported on page 67.
Strategic Objective 6
The estimated hand hygiene rate for a hospital is a measure of how often (as a percentage) hand hygiene is correctly performed.
It is calculated by dividing the number of observed hand hygiene 'moments' where proper hand hygiene was practiced in a specified audit period, by the total number of observed hand hygiene 'moments' in the same audit period.
Table 8: Estimated Hand Hygiene Rate1,2
Strategic Indicator 2018–19 2018–19 2019–20Target3 Est. Outcome3 Target
Canberra Hospital n/a n/a 80%
Notes:1. Hospital targets are based on similar rates for peer hospitals – based on the Australian Council of Healthcare Standards (ACHS).2. This is a new Strategic Objective for Canberra Health Services and was previously reported in the Local Hospital Network in 2018-19,
Strategic Objective 3.4. The 2019-20 target is for Canberra Health Services performance only.3. The 2018-19 Target and estimated outcome is reported on page 67.
Strategic Objective 7
Reaching the Optimum Occupancy Rate for all Overnight Hospital Beds
This provides an indication of the efficient use of resources available for hospital services.
Table 9: The mean percentage of overnight hospital beds in use
Strategic Indicator 2018–19 2018–19 2019–20Target Est. Outcome Target
Mean percentage of overnight hospital beds in use 90% 86% 90%
2019-20 Budget Statements 38 Canberra Health Services

Strategic Objective 8
No Waiting for Access to Emergency Dental Health Services
Table 10: The percentage of assessed emergency clients seen within 24 hours1
Strategic Indicator 2018-19 2018-19 2019-20Target Est. Outcome Target
Percentage of assessed emergency clients seen within 24 hours
100% 100% n/a
Note:1. This Strategic Objective is being discontinued in 2019-20.
Strategic Objective 9
Improving Timeliness of Access to Radiotherapy Services
Table 11: The percentage of cancer patients who commence radiotherapy treatment within standard timeframes1
Strategic Indicator 2018–19 2018–19 2019–20Target Est. Outcome2 Target
Category:Emergency — treatment starts within 48 hours 100% 100% n/aPalliative — treatment starts within 2 weeks 90% 70% n/aRadical — treatment starts within 4 weeks 90% 50% n/a
Notes:1. In 2019-20 this Strategic Objective is being discontinued and will be reported as Accountability Indicators at 1.3.f to h. The 2019-20
Targets are reported on page 45.2. The performance in radiotherapy wait times is impacted by the increasingly complex treatment techniques and related treatment
delivery times. This consequently decreases access to radiotherapy services. An increase in palliative cases and long course treatments requiring additional fractions has had an impact on the waiting times for radical patients. The Directorate is currently replacing a linear accelerator as one machine has been unavailable for the past 6 months. There have been more cases seen in clinics this year compared with last year which also impacting the ability to meet demand for this service.
Strategic Objective 10
Improving the Breast Screen Participation Rate for Women aged 50 to 74 years
Table 12: The proportion of women in the target age group (50 to 74 years) who had a breast screen in the 24 months prior to each counting period1
Strategic Indicator 2018–19 2018–19 2019–20Target Est. Outcome Target
Proportion of women aged 50 to 74 who had a breast screen
60% 56% n/a
Note:1. In 2019-20 this Strategic Objective is being discontinued and will be reported as an Accountability Indicator at 1.3.a. The 2019-20
Target is reported on page 45.
2019-20 Budget Statements 39 Canberra Health Services

Output Classes
Canberra Health Services aims to deliver the best possible healthcare and health related services in Australia. It will do this through its public hospitals and related health services through: Acute Services; Mental Health, Justice Health and Alcohol and Drug Services; Women, Youth and Children; Cancer Services; and Rehabilitation, Aged and Community Care.
Output Class 1: Health and Community Care
Table 13: Output Class 1: Health and Community Care
2018-19 2019-20Estimated Outcome Budget
$'000 $'000Total Cost1,2 1,263,106 1,224,706Controlled Recurrent Payments3 101,926 -
Notes:1. Total cost includes depreciation and amortisation of $36.511 million in 2018-19 and $32.375 million in 2019-20.2. The decrease in Total Cost for 2019-20 Budget from the 2018-19 estimated outcome is due mainly to the Administrative
Arrangements Order, reflecting that the 2018-19 estimated outcome includes three months operation of the former Health Directorate.
3. Canberra Health Services receives funding through the Local Hospital Network and not from Controlled Recurrent Payments.
Output 1.1: Acute Services
Canberra Health Services provides a comprehensive range of acute care, including:
tertiary inpatient, outpatient and ambulatory services to the ACT and surrounding NSW;
emergency department, intensive care unit and retrieval services;
a range of medical speciality services including cardiology, respiratory, gastroenterology, neurology, endocrinology, rheumatology and renal services;
elective and emergency surgery services in general surgery; and
services for women, youth and children in obstetrics, gynaecology, gynaecology surgery, paediatrics and paediatric surgery.
The key strategic priority for acute services is to deliver timely access to effective and safe hospital care services while responding to the growing demand of services.
This means focusing on:
strategies to improve access to services, including for the emergency department and elective surgery; and
continuing to increase the efficiency of acute care services.
2019-20 Budget Statements 40 Canberra Health Services

Table 14: Output 1.1: Acute Services
2018-19 2019-20Estimated Outcome Budget
$'000 $'000Total Cost 788,464 801,193Controlled Recurrent Payments1 38,216 -
Note:1. Canberra Health Services receives funding through the Local Hospital Network and not from Controlled Recurrent Payments.
Output 1.2: Mental Health, Justice Health and Alcohol and Drug Services
Canberra Health Services provides a range of Mental Health, Justice Health and Alcohol and Drug Services through the public and community sectors in hospitals, community health centres and other community settings, adult and youth correctional facilities and people’s homes across the Territory. These services work to provide integrated and responsive care to a range of services including hospital-based specialist services, therapeutic rehabilitation, counselling, supported accommodation services and other community-based services.
The key priorities for Mental Health, Justice Health and Alcohol and Drug Services are ensuring that people’s health needs are met in a timely fashion and that care is integrated across hospital, community and residential support services.
This means focusing on:
ensuring timely access to emergency mental health care;
ensuring that public and community mental health services in the ACT provide people with appropriate assessment, treatment and care that result in improved mental health outcomes;
providing community and hospital-based alcohol and drug services;
providing health assessments and care for people detained in corrective facilities; and
engagement and liaison with community sector services, primary care and other government agencies providing support and shared care arrangements.
Table 15: Output 1.2: Mental Health, Justice Health and Alcohol and Drug Services
2018-19 2019-20Estimated Outcome Budget
$'000 $'000Total Cost1 194,108 165,685Controlled Recurrent Payments2 20,763 -
Notes:1. The decrease in Total Cost for 2019-20 Budget from the 2018-19 estimated outcome is due mainly to the Administrative
Arrangements Order, reflecting that the 2018-19 estimated outcome includes three months operation of the former Health Directorate.
2. Canberra Health Services receives funding through the Local Hospital Network and not from Controlled Recurrent Payments.
2019-20 Budget Statements 41 Canberra Health Services

Output 1.3: Cancer Services
Canberra Health Services provides a comprehensive range of screening, assessment, diagnostic, treatment and palliative care services. Services are provided in inpatient, outpatient and community settings.
The key priorities for cancer care services are early detection and timely access to diagnostic and treatment services. These include ensuring that population screening rates for breast cancer meet targets, waiting time for access to essential services such as radiotherapy are consistent with agreed benchmarks and there is timely access to chemotherapy and haematological treatments.
Table 16: Output 1.3: Cancer Services1
2018-19 2019-20Estimated Outcome Budget
$'000 $'000Total Cost2 85,394 77,970Controlled Recurrent Payments3 3,570 -
Notes:1. This Output Class was previously Output 1.4 in the 2018-19 Budget Statements. Due to the Administrative Arrangements Order, this
output has been renumbered.2. The decrease in Total Cost for 2019-20 Budget from the 2018-19 estimated outcome is due mainly to the Administrative
Arrangements Order, reflecting that the 2018-19 estimated outcome includes three months operation of the former Health Directorate.
3. Canberra Health Services receives funding through the Local Hospital Network and not from Controlled Recurrent Payments.
Output 1.4: Subacute and Community Services
The provision of timely and effective, coordinated and comprehensive services which optimise the functionality and quality of life of adult patients. Following illness, injury or surgery, subacute services enable individuals to safely transition to community living. Community based services sees care delivered safely and closely to where people live.
The key priorities for Subacute and Community Services are:
ensuring consistent and timely access to appropriate care and services, based on clinical need. This includes the efficient and appropriate transfer of people from acute to subacute settings, and ensuring community-based services are in place to support healthcare needs;
ensuring effective planning for discharge and care planning occurs, including comprehensive aged care assessment where necessary, in order to provide appropriate support for independent living and minimise unplanned readmissions to hospital;
for services that receive Commonwealth aged Care funding, complying with the Commonwealth’s quality and safety requirements; and
reduced waiting times for access to emergency Dental Health Services.
2019-20 Budget Statements 42 Canberra Health Services

Table 17: Output 1.4: Subacute and Community Services1
2018-19 2019-20Estimated Outcome Budget
$'000 $'000Total Cost2 181,711 179,858Controlled Recurrent Payments3 26,268 -
Notes:1. This Output Class was previously Output Class 1.5 Rehabilitation, Aged and Community Care in the 2018-19 Budget Statements. Due
to the organisational Administrative Arrangements Order, this output class has been renamed and renumbered. 2. The decrease in Total Cost for 2019-20 Budget from the 2018-19 estimated outcome is due mainly to the Administrative
Arrangements Order, reflecting that the 2018-19 estimated outcome includes three months operation of the former Health Directorate.
3. Canberra Health Services receives funding through the Local Hospital Network and not from Controlled Recurrent Payments.
Transferred Outputs
Population Health (formerly Output 1.3)
This output has been transferred to the ACT Health Directorate following the Administrative Arrangements Order on 1 October 2018. The related Accountability Indicators have been transferred to the ACT Health Directorate (refer to Output 1.2: Healthy Communities).
Table 18: Population Health (formerly Output 1.3)
2018-19 2019-20Estimated Outcome Budget
$'000 $'000Total Cost 13,429 -Controlled Recurrent Payments 13,109 -
2019-20 Budget Statements 43 Canberra Health Services

Accountability Indicators
Output Class 1: Health and Community Care
Output 1.1: Acute Services
Table 19: Accountability Indicators Output 1.1
2018–19Targets
2018–19Estimated Outcome
2019–20Targets
Percentage of Elective Surgery Cases Admitted on Time by Clinical Urgencya. Urgent – admission within 30 days is desirable for a
condition that has the potential to deteriorate quickly to the point that it may become an emergency1
n/a n/a 100%
b. Semi-urgent – admission within 90 days is desirable for a condition causing some pain, dysfunction or disability which is not likely to deteriorate quickly or become an emergency1
n/a n/a 80%
c. Non-urgent – admission within 365 days is desirable for a condition causing minimal or no pain, dysfunction or disability, which is not likely to deteriorate quickly, and which does not have the potential to become an emergency1
n/a n/a 93%
The Proportion of Emergency Department Presentations that are Treated within Clinically Appropriate Timeframes
d. One (resuscitation seen immediately)2 n/a n/a 100%e. Two (emergency seen within 10 mins)2 n/a n/a 80%f. Three (urgent seen within 30 mins)2 n/a n/a 75%g. Four (semi urgent seen within 60 mins)2 n/a n/a 70%h. Five (non-urgent seen within 120 mins)2 n/a n/a 70%i. All presentations2 n/a n/a 70%National Weighted Activity Units NWAU{18} NWAU{18} NWAU{19}j. Admitted services3 83,543 81,816 n/ak. Non-admitted services3,4 25,944 28,874 n/al. Emergency services3 12,415 11,803 n/am. Acute admitted mental health services3,5 5,766 6,580 n/an. Sub-acute services3,6 8,024 10,052 n/ao. Calvary services (out of scope)3,7 1,434 1,228 n/a
Notes:1. These Accountability Indicators were Strategic Objectives from the Local Hospital Network in 2018-19 that reported Territory wide
outcomes. The 2018-19 Targets and estimated outcomes are reported on page 65. The 2019-20 targets are for Canberra Health Services performance only.
2. These Accountability Indicators were Strategic Objectives from the Local Hospital Network in 2018-19 that reported Territory wide outcomes. The 2018-19 Targets and estimated outcomes are reported on page 66. The 2019-20 targets are for Canberra Health Services performance only.
3. These Indicators have been discontinued and will only be reported at the Territory wide level through the Local Hospital Network.4. Non-admitted activity is estimated to be 11% above the target in 2018-19, which was largely driven by increased patient volume in
services such as urology, general medicine and midwifery and maternity.
2019-20 Budget Statements 44 Canberra Health Services

5. Admitted mental health activity is 14% above the target in 2018-19 due to an increase in average complexity per separation for services such as schizophrenia disorders, major affective disorders and drug intoxication and withdrawal.
6. Sub/Non-acute admitted activity is 25% above the target in 2018-19 due to an increase in the number of patients receiving rehabilitation care and maintenance care, reflecting the commissioning of the University of Canberra Hospital earlier this financial year.
7. Calvary out-of-scope activity is 14% below the target in 2018-19, which was largely driven by a shift in patient casemix in non-admitted services. This however does not affect Commonwealth funding to the ACT.
Output 1.2: Mental Health, Justice Health and Alcohol and Drug Services
Table 20: Accountability Indicators Output 1.2
2018–19Targets
2018–19Estimated Outcome
2019–20Targets
a. Adult mental health program community service contacts1
198,000 185,000 198,000
b. Children and youth mental health program community service contacts2
72,000 82,000 72,000
c. Mental health rehabilitation and specialty services3 26,250 30,700 26,250d. Alcohol and drug services community contacts 70,000 66,000 70,000e. Proportion of detainees at the Alexander
Maconochie Centre with a completed health assessment within 24 hours of detention
100% 100% 100%
f. Proportion of detainees in the Bimberi Youth Detention Centre with a completed health assessment within 24 hours of detention
100% 100% 100%
g. Justice health services community contacts 155,000 135,200 150,000h. Percentage of current clients on opioid treatment
with management plans498% 95% 98%
i. Proportion of mental health clients contacted by a Canberra Health Services community facility within 7 days post discharge from inpatient services5
n/a n/a 75%
Notes:1. The 2018-19 estimated outcome variance is largely due to staff vacancies and modifications to service functions. These changes
have meant more community based visiting rather than phone contact resulting in less overall occasions of services.2. The 2018-19 estimated outcome variance is due to increases in demand and staff levels particularly in the acute areas. The program
has been expanded through the Youth Mental Health Assertive Outreach and Expansion of the Perinatal Mental Health Service budget initiatives.
3. The 2018-19 estimated outcome variance is due mainly to demand for rehabilitation and speciality mental health services.4. The 2018-19 estimated outcome variance is due to adjustments in clinical and operational practices resulting in less occasions of
services.5. This Accountability Indicator was reported in the Local Hospital Network (1.1.h) in 2018-19 and will only report on contacts by
Canberra Health Services for 2019-20. The 2018-19 Target and estimated outcome are reported on page 69.
2019-20 Budget Statements 45 Canberra Health Services

Output 1.3: Cancer Services
Table 21: Accountability Indicators Output 1.3
2018–19Targets
2018–19Estimated Outcome
2019–20Targets
a. Participation rate, proportion of women aged 50 to 74 who had a breast screen1
n/a n/a 60%
b. Total breast screens 18,500 18,700 19,500c. Number of breast screens for women aged 50 to 74 2 13,000 15,440 n/ad. Percentage of women who receive results of screen
within 28 days2100% 100% n/a
e. Percentage of screened patients who are assessed within 28 days3
90% 84% 90%
Radiotherapy Treatment Within Standard Timeframesf. Emergency – treatment starts within 48 hours4 n/a n/a 100%g. Palliative – treatment starts within 2 weeks4 n/a n/a 90%h. Radical – treatment starts within 4 weeks4 n/a n/a 90%
Notes:1. This is a new Accountability Indicator and was previously reported as Strategic Indicator 4 in the 2018-19 Budget Statements in the
former Health Directorate. The 2018-19 Target and estimated outcome are reported on page 38.2. These Accountability Indicators have been discontinued.3. The 2018-19 timely recall to assessment has been impacted by program capacity as well as client choice. Screening capacity
increased significantly with the engagement of locum radiographers. This resulted in an increase in the number of women recalled for assessment. This in turn exceeded available assessment appointments and resulted in some women exceeding the 28 day timeframe.
4. These Accountability Indicators are new and were previously reported as Strategic Objective 3 in the former Health Directorate. The 2018-19 Targets and estimated outcomes are reported on page 38.
2019-20 Budget Statements 46 Canberra Health Services

Output 1.4: Subacute and Community Services
Table 22: Accountability Indicators Output 1.4
2018-19Targets
2018-19Estimated Outcome
2019-20Targets
a. Number of nursing (domiciliary and clinic based) occasions of service1
91,890 89,000 n/a
b. Number of allied health regional services (occasions of service) 1,2
30,630 25,000 n/a
c. Mean waiting time for clients on the dental services waiting list3
6 months 8 months 12 months
d. Percentage of the Women’s Health Service Intake Officer’s clients who receive an intake and assessment service within 14 working days of their initial referral1
100% 97% n/a
e. Proportion of clients attending ‘Well Women's Check’ within the Women's Health Service that are from culturally and linguistically diverse communities1
40% 41% n/a
f. Proportion of children aged 0-14 who are entering substitute and kinship care within the ACT who attend the Child at Risk Health Unit for a health and wellbeing screen1
90% 93% n/a
g. Sub-acute bed days of care at University of Canberra Hospital4
n/a n/a 27,600
h. Walk in Centre presentations to Gungahlin4 n/a n/a 20,000i. Walk in Centre presentations to Belconnen4 n/a n/a 24,000j. Walk in Centre presentations to Tuggeranong4 n/a n/a 24,000k. Median wait time to be seen, in minutes (all
Walk in Centre’s combined)4n/a n/a <30 minutes
Notes:1. These Accountability Indicators have been discontinued. 2. The 2018-19 estimated outcome variance reflects reductions in activity due in part to staff vacancies and unplanned personal leave.
Physiotherapy occasions of service are also down due to an increase in group sessions.3. The lower estimated outcome and 2019-20 target relates to reductions in Commonwealth National Partnership Agreement funding.4. These Accountability Indicators are new in 2019-20.
2019-20 Budget Statements 47 Canberra Health Services

Changes to Appropriation
Table 23: Changes to appropriation – Controlled Recurrent Payments
2018-19 Estimated Outcome
$'000
2019-20 Budget
$'000
2020-21 Estimate
$'000
2021-22 Estimate
$'000
2022-23 Estimate
$'000
2018-19 Budget 310,654 313,625 294,875 266,943 266,943
2019-20 Budget Technical AdjustmentsRevised Indexation Parameters - - - - 3,111Transfer - Separation of Canberra Health Services and ACT Health Directorate
-208,728 -313,625 -294,875 -266,943 -270,054
2019-20 Budget 101,926 - - - -
2019-20 Budget Statements 48 Canberra Health Services

Table 24: Changes to appropriation – Expenses on Behalf of the Territory
2018-19 Estimated Outcome
$'000
2019-20 Budget
$'000
2020-21 Estimate
$'000
2021-22 Estimate
$'000
2022-23 Estimate
$'000
2018-19 Budget 2,620 5,692 8,609 932 932
2019-20 Budget Technical AdjustmentsRevised Indexation Parameters - - - - 25Transfer - Separation of Canberra Health Services and ACT Health Directorate
-2,620 -5,692 -8,609 -932 -957
2019-20 Budget - - - - -
2019-20 Budget Statements 49 Canberra Health Services

Table 25: Changes to appropriation – Capital Injections, Controlled
2018-19 Estimated Outcome
$'000
2019-20 Budget
$'000
2020-21 Estimate
$'000
2021-22 Estimate
$'000
2022-23 Estimate
$'000
2018-19 Budget 123,012 105,465 11,017 4,981 4,661
FMA Section 16B Rollovers from 2017-18Better Infrastructure Fund 1,540 - - - -Bowes St Fit Out 6 - - - -Clinical Infrastructure Improvement Project – Acute Aged Care and Cancer Inpatients
168 - - - -
Critical Hospital Infrastructure Systems – Enhancing patient and staff safety
821 - - - -
Major Building Plant Replacement and Upgrade 4 - - - -More mobile dental clinics 539 - - - -More nurse-led Walk in Centres 558 - - - -Replacement of CT Scanner at the Canberra Hospital 78 - - - -Training our future health workforce 200 - - - -Enterprise Bargaining Agreement (EBA) pay increase back pay
6,079 - - - -
2019-20 Budget Policy DecisionsDelivering the Weston Creek Walk in Centre 2,000 2,120 - - -Delivering the Inner North Walk in Centre - 1,100 614 - -Expanding pharmacy services at The Canberra Hospital - 2,212 3,318 - -More mental health services at The Canberra Hospital - 1,764 756 - -More public medical imaging services for Canberra Hospital
- - 2,800 6,100 2,300
Opioid treatment services on Canberra’s northside - 611 - - -
2019-20 Budget Technical AdjustmentsNgunnawal Bush Healing Farm -66 - - - -Aluminium Composite Panels - Centenary Hospital -153 - - - -Clinical Services and Inpatient Unit Design and Infrastructure Expansion (CSIUDIE)
-14 - - - -
Clinical Services Redevelopment - Phase 3 -26 - - - -Continuity of Health Services Plan - Essential Infrastructure
-74 - - - -
Revised Funding Profile:- Accommodation to support people with Mental Health
782 1,611 -2,159 -234 -
- ACT Health critical assets upgrades -9,743 -6,456 16,199 - -- Aluminium Composite Panels Centenary Hospital -526 526 - - -- Clinical Services & Inpatient Unit Design & Infrastructure Expansion
-489 3 486 - -
- Clinical Services Redevelopment Phase 2 -217 217 - - -- Clinical Services Redevelopment Phase 3 311 -311 - - -- Delivering the Weston Creek Walk-in Centre -325 325 - - -- Health Infrastructure Program - Project Management Continuation
- -490 490 - -
- Improved infrastructure for acute aged care and cancer patient - Ward 14A/B
-3,744 -256 4,000 - -
2019-20 Budget Statements 50 Canberra Health Services

2019-20 Budget Statements 51 Canberra Health Services

Table 25: Changes to appropriation – Capital Injections, Controlled (continued)
2018-19 Estimated Outcome
$'000
2019-20 Budget
$'000
2020-21 Estimate
$'000
2021-22 Estimate
$'000
2022-23 Estimate
$'000
- More nurse-led Walk in Centres Gungahlin 815 -815 - - -- More nurse-led Walk in Centres Weston -82 82 - - -- New Medical Imaging Equipment -500 500 - - -- Secure Mental Health -754 754 - - -- Sterilising Services Relocation & Upgrade -2,894 2,894 - - -- The Canberra Hospital Essential Works - Infrastructure Engineering
-874 874 - - -
- Training our future health workforce -1,400 1,100 300 - -- Upgrading & Maintaining ACT Health Assets (UMAHA)
6,511 -22,789 16,278 - -
- University of Canberra Car Park -1,594 1,594 - - -- University of Canberra Hospital 4,443 -9,483 5,040 - -- Weston Creek Region Community Health Infrastructure
-2,000 2,000 - - -
Revised Indexation Parameters - - - - 117Secure Mental Health Facility -1 - - - -Sterilising Services - Relocation and Upgrade -110 - - - -Transfer - Better Infrastructure Fund between EBT & Capital injection
312 - - - -
Transfer – Separation of Canberra Health Services and ACT Health Directorate
-29,829 -12,287 -887 - -
Transfer - Supported Mental Health Dwellings to Housing ACT
- -2,900 - - -
University of Canberra Car Park (Grant Component) -2,160 - - - -University of Canberra Public Hospital (Construction) -3,334 - - - -Upgrading & Maintaining ACT Health Assets (UMAHA) -3,417 - - - -
2019-20 Budget 83,853 69,965 58,252 10,847 7,078
2019-20 Budget Statements 52 Canberra Health Services

Summary of 2019-20 Infrastructure Program
Table 26: 2019-20 Canberra Health Services Infrastructure Program
Project 2019-20$'000
2020-21$'000
2021-22$'000
2022-23$'000
Four YearInvestment
$'000
PhysicalCompletion
Date
Work In ProgressACT Health critical assets upgrades 6,324 16,199 - - 22,523 Sep-21Clinical Services and Inpatient Unit Design and Infrastructure Expansion
926 486 - - 1,412 Jul-19
Clinical Services Redevelopment Phase 2
217 - - - 217 Jun-19
Clinical Services Redevelopment Phase 3
700 - - - 700 Jun-19
Health Infrastructure Program – Project management continuation
- 490 - - 490 Jun-18
Improved infrastructure for acute aged care and cancer inpatients
9,380 4,000 - - 13,380 May-20
More mental health accommodation 4,944 3,401 86 - 8,431 Nov-20More nurse-led Walk in Centres 505 - - - 505 Nov-19New medical imaging equipment 500 - - - 500 Jun-20Aluminium composite panels – Centenary Hospital
526 - - - 526 Jun-18
Secure Mental Health Unit 754 - - - 754 Nov-16Sterilising Services – Relocation and upgrade
2,894 - - - 2,894 Sep-19
The Canberra Hospital – Essential infrastructure and engineering works
1,748 - - - 1,748 Aug-19
Training our future health workforce 1,400 300 - - 1,700 Jun-20University of Canberra Public Hospital
3,885 5,040 - - 8,925 Feb-18
University of Canberra Public Hospital Car Park (Grant)
1,594 - - - 1,594 Jul-18
Upgrading and maintaining ACT Health assets
19,432 16,278 - - 35,710 Dec-20
Total Work In Progress 55,729 46,194 86 - 102,009
Capital Upgrade ProgramsBetter Infrastructure Fund 4,104 4,570 4,661 4,778 18,113 Sep-20Total Capital Upgrade Programs 4,104 4,570 4,661 4,778 18,113
2019-20 Budget Statements 53 Canberra Health Services

Table 26: 2019-20 Canberra Health Services Infrastructure Program (continued)
Project 2019-20$'000
2020-21$'000
2021-22$'000
2022-23$'000
Four YearInvestment
$'000
PhysicalCompletion
Date
New WorksDelivering the Inner North Walk in Centre
1,100 614 - - 1,714 Aug-20
Delivering the Weston Creek Walk in Centre
4,445 - - - 4,445 Nov-19
Expanding pharmacy services at The Canberra Hospital
2,212 3,318 - - 5,530 Sep-20
More mental health services at The Canberra Hospital
1,764 756 - - 2,520 Sep-20
More public medical imaging services for Canberra Hospital
- 2,800 6,100 2,300 11,200 Mar-21
Opioid treatment services on Canberra’s northside
611 - - - 611 Jun-20
Total New Capital 10,132 7,488 6,100 2,300 26,020
Total Infrastructure Program 69,965 58,252 10,847 7,078 146,142
2019-20 Budget Statements 54 Canberra Health Services

Financial Statements
Table 27: Canberra Health Services: Operating Statement
2018-19 Budget
$'000
2018-19 Estimated Outcome
$'000
2019-20 Budget
$'000
Var%
2020-21 Estimate
$'000
2021-22 Estimate
$'000
2022-23 Estimate
$'000
Income
Revenue310,654 Controlled Recurrent
Payments101,926 - -100 - - -
1,051,282 User Charges 1,079,524 1,158,567 7 1,193,287 1,233,698 1,253,1034,546 Grants 4,546 4,659 2 4,775 4,894 5,016
191 Interest 191 195 2 199 204 2072,062 Resources Received Free
of Charge2,062 2,097 2 2,156 2,151 2,199
14,218 Other Revenue 12,259 14,528 19 15,760 16,083 16,436
1,382,953 Total Revenue 1,200,508 1,180,046 -2 1,216,177 1,257,030 1,276,961
Gains1,017 Other Gains 1,017 1,042 2 1,068 1,095 1,122
1,017 Total Gains 1,017 1,042 2 1,068 1,095 1,122
1,383,970 Total Income 1,201,525 1,181,088 -2 1,217,245 1,258,125 1,278,083
Expenses 780,388 Employee Expenses 758,213 742,095 -2 771,776 796,420 806,091
99,666 Superannuation Expenses 92,054 101,832 11 103,562 105,260 106,335396,291 Supplies and Services 327,288 315,579 -4 325,515 332,044 341,001
50,817 Depreciation and Amortisation
36,511 32,375 -11 33,247 35,795 37,568
99,066 Grants and Purchased Services
33,610 16,766 -50 17,185 17,614 18,055
9,636 Cost of Goods Sold 9,367 9,877 5 10,125 10,377 10,636436 Interest Expenses 436 479 10 479 490 490
7,674 Other Expenses 5,627 5,703 1 5,850 5,999 6,045
1,443,974 Total Expenses 1,263,106 1,224,706 -3 1,267,739 1,303,999 1,326,221
-60,004 Operating Result -61,581 -43,618 29 -50,494 -45,874 -48,138
-60,004 Total Comprehensive Income
-61,581 -43,618 29 -50,494 -45,874 -48,138
2019-20 Budget Statements 55 Canberra Health Services

Table 28: Canberra Health Services: Balance Sheet
Budgetat
30/6/19 $'000
2018-19 Estimated Outcome
$'000
Budgetat
30/6/20 $'000
Var%
Estimateat
30/6/21 $'000
Estimateat
30/6/22 $'000
Estimateat
30/6/23 $'000
Current Assets81,745 Cash and Cash Equivalents 48,908 47,878 -2 41,588 43,006 44,428
3,029 Investments - - - - - -35,464 Receivables 28,430 29,443 4 30,453 31,461 32,467
9,418 Inventories 7,084 7,284 3 7,484 7,684 7,8847,339 Other Assets 4,852 4,917 1 4,982 5,047 5,112
136,995 Total Current Assets 89,274 89,522 .. 84,507 87,198 89,891
Non Current Assets1,336,571 Property, Plant and
Equipment1,120,482 1,164,990 4 1,208,166 1,233,046 1,221,086
57,511 Intangible Assets - - - - - -21,259 Capital Works in Progress 11,216 14,375 28 6,282 13,582 5,13014,765 Other Assets 1,669 1,669 - 1,669 1,669 1,669
1,430,106 Total Non Current Assets 1,133,367 1,181,034 4 1,216,117 1,248,297 1,227,885
1,567,101 TOTAL ASSETS 1,222,641 1,270,556 4 1,300,624 1,335,495 1,317,776
Current Liabilities92,204 Payables 45,121 46,391 3 47,671 49,501 51,342
0 Interest-Bearing Liabilities 425 425 - 425 425 4250 Finance Leases - 686 # 1,372 2,058 2,744
261,126 Employee Benefits 239,789 256,413 7 273,720 291,521 309,8057,363 Other Liabilities 8,188 8,927 9 9,666 9,866 10,066
360,693 Total Current Liabilities 293,523 312,842 7 332,854 353,371 374,382
Non Current Liabilities0 Interest-Bearing Liabilities 2,069 2,069 - 2,069 2,069 2,0690 Finance Leases - 365 # 730 1,095 1,460
19,372 Employee Benefits 16,239 18,123 12 20,056 22,022 23,9871,462 Other Provisions 91 91 - 91 91 91
22,272 Other Liabilities - - - - - -
43,106 Total Non Current Liabilities
18,399 20,648 12 22,946 25,277 27,607
403,799 TOTAL LIABILITIES 311,922 333,490 7 355,800 378,648 401,989
1,163,302 NET ASSETS 910,719 937,066 3 944,824 956,847 915,787
1,030,677 Accumulated Funds 780,555 806,902 3 814,660 826,683 785,623132,625 Asset Revaluation Surplus 130,164 130,164 - 130,164 130,164 130,164
1,163,302 TOTAL FUNDS EMPLOYED 910,719 937,066 3 944,824 956,847 915,787
2019-20 Budget Statements 56 Canberra Health Services

Table 29: Canberra Health Services: Statement of Changes in Equity
Budgetat
30/6/19 $'000
2018-19 Estimated Outcome
$'000
Budgetat
30/6/20 $'000
Var%
Estimateat
30/6/21 $'000
Estimateat
30/6/22 $'000
Estimateat
30/6/23 $'000
Opening Equity967,669 Opening Accumulated Funds 963,807 780,555 -19 806,902 861,710 826,683132,625 Opening Asset Revaluation
Reserve130,164 130,164 - 130,164 130,164 130,164
1,100,294 Balance at the Start of the Reporting Period
1,093,971 910,719 -17 937,066 991,874 956,847
Comprehensive Income-60,004 Operating Result - Including
Economic Flows-61,581 -43,618 29 -50,494 -45,874 -48,138
-60,004 Total Comprehensive Income -61,581 -43,618 29 -50,494 -45,874 -48,138
- Total Movement in Reserves - - - - - -
Transactions Involving Owners Affecting Accumulated Funds123,012 Capital Injections 83,853 69,965 -17 58,252 10,847 7,078
- Inc/Dec in Net Assets due to Admin Restructure
-205,524 - 100 - - -
123,012 Total Transactions Involving Owners Affecting Accumulated Funds
-121,671 69,965 158 58,252 10,847 7,078
Closing Equity1,030,677 Closing Accumulated Funds 780,555 806,902 3 814,660 826,683 785,623
132,625 Closing Asset Revaluation Reserve
130,164 130,164 - 130,164 130,164 130,164
1,163,302 Balance at the end of the Reporting Period
910,719 937,066 3 944,824 956,847 915,787
2019-20 Budget Statements 57 Canberra Health Services

Table 30: Canberra Health Services: Cash Flow Statement
2018-19 Budget
$'000
2018-19 Estimated Outcome
$'000
2019-20 Budget
$'000
Var %
2020-21 Estimate
$'000
2021-22 Estimate
$'000
2022-23 Estimate
$'000
CASH FLOWS FROM OPERATING ACTIVITIESReceipts
310,654 Controlled Recurrent Payments
101,926 - -100 - - -
1,047,059 User Charges 1,075,301 1,154,259 7 1,188,928 1,229,296 1,248,7014,546 Grants 4,546 4,659 2 4,775 4,894 5,016
191 Interest Received 191 195 2 199 204 20771,846 Other 69,868 73,607 5 76,244 77,998 78,377
1,434,296 Operating Receipts 1,251,832 1,232,720 -2 1,270,146 1,312,392 1,332,301
Payments764,710 Employee 743,752 727,446 -2 756,382 780,487 789,662
95,358 Superannuation 87,746 97,417 11 99,147 100,845 101,920396,106 Supplies and Services 327,103 316,524 -3 326,351 332,945 341,854
99,066 Grants and Purchased Services
33,610 16,766 -50 17,285 17,714 18,155
452 Interest Expenses 452 504 12 504 515 5159,636 Related to Cost of Goods
Sold9,367 9,877 5 10,125 10,377 10,636
57,990 Other 55,924 56,188 .. 57,614 59,063 59,1091,423,318 Operating Payments 1,257,954 1,224,722 -3 1,267,408 1,301,946 1,321,851
10,978 NET CASH INFLOW/(OUTFLOW) FROM OPERATING ACTIVITIES
-6,122 7,998 231 2,738 10,446 10,450
CASH FLOWS FROM INVESTING ACTIVITIESReceipts
- Proceeds from Sale/Maturity of Investments
2,879 - -100 - - -
- Investing Receipts 2,879 - -100 - - -
Payments133,943 Purchase of Property,
Plant and Equipment90,684 78,298 -14 66,585 19,180 15,411
133,943 Investing Payments 90,684 78,298 -14 66,585 19,180 15,411
-133,943 NET CASH INFLOW/(OUTFLOW) FROM INVESTING ACTIVITIES
-87,805 -78,298 11 -66,585 -19,180 -15,411
2019-20 Budget Statements 58 Canberra Health Services

Table 30: Canberra Health Services: Cash Flow Statement (continued)
2018-19 Budget
$'000
2018-19 Estimated Outcome
$'000
2019-20 Budget
$'000
Var %
2020-21 Estimate
$'000
2021-22 Estimate
$'000
2022-23 Estimate
$'000
CASH FLOWS FROM FINANCING ACTIVITIESReceipts
123,012 Capital Injections 83,853 69,965 -17 58,252 10,847 7,078123,012 Financing Receipts 83,853 69,965 -17 58,252 10,847 7,078
Payments- Repayment of Finance
Lease Liabilities- 695 # 695 695 695
- Payment of Transferred Cash Balances
1,419 - -100 - - -
- Financing Payments 1,419 695 -51 695 695 695
123,012 NET CASH INFLOW/(OUTFLOW) FROM FINANCING ACTIVITIES
82,434 69,270 -16 57,557 10,152 6,383
47 NET INCREASE/(DECREASE) IN CASH AND CASH EQUIVALENTS
-11,493 -1,030 91 -6,290 1,418 1,422
81,698 CASH AT THE BEGINNING OF REPORTING PERIOD
60,401 48,908 -19 47,878 41,588 43,006
81,745 CASH AT THE END OF REPORTING PERIOD
48,908 47,878 -2 41,588 43,006 44,428
2019-20 Budget Statements 59 Canberra Health Services

Notes to the Controlled Budget Statements
On 1 October 2018, the former Health Directorate was separated into two Directorates, the ACT Health Directorate and Canberra Health Services. For the purposes of these statements, the 2018-19 Budgets reflect the former combined Health Directorate and the 2018-19 estimated outcome includes three months operation of the former combined Health Directorate, plus nine months of Canberra Health Services.
Therefore, in most instances the variances between the original 2018-19 Budget and the 2018-19 estimated outcome and the variances between the 2018-19 estimated outcome and the 2019-20 Budget relate to the separation of the former Health Directorate.
Significant variations that do not relate to the separation of the former Health Directorate are as follows:
Operating Statement
controlled recurrent payments: from 2019-20 all controlled recurrent payments will be received via the ACT Local Hospital Network and therefore appear as user charges.
user charges: the increase of $79.043 million in the 2019-20 Budget from the 2018-19 estimated outcome is mainly due a change in the way Canberra Health Services receives controlled recurrent payments via the ACT Local Hospital Network.
other revenue: the increase of $2.269 million in the 2019-20 Budget from the 2018-19 estimated outcome is mainly due to services provided under the National Disability Insurance Scheme (NDIS), previously provided as in-kind.
superannuation expenses: the increase of $9.778 million in the 2019-20 Budget from the 2018-19 estimated outcome is due mainly to changes in superannuation contribution rates.
Balance Sheet
capital works in progress: the increase of $3.159 million in the 2019-20 Budget from the 2018-19 estimated outcome is mainly due to new capital works projects including pharmacy works, electro convulsive therapy and the inner north Walk in Centre.
current and non current employee benefits: the increase of $18.508 million in the 2019-20 Budget from the 2018-19 estimated outcome is mainly due to wage rises and growth in staff.
Statement of Changes in Equity
capital injections: the decrease of $13.888 million in the 2019-20 Budget from the 2018-19 estimated outcome is due to a smaller Capital Works program which is summarised on the Infrastructure table.
2019-20 Budget Statements 60 Canberra Health Services

Cash Flow Statement
Variations in the Statement are explained in the notes above.
2019-20 Budget Statements 61 Canberra Health Services

Financial Statements - Territorial
Table 31: Canberra Health Services: Statement of Income and Expenses on behalf of the Territory
2018-19 Budget
$'000
2018-19 Estimated Outcome
$'000
2019-20 Budget
$'000
Var%
2020-21 Estimate
$'000
2021-22 Estimate
$'000
2022-23 Estimate
$'000
Revenue2,620 Payment for Expenses on
Behalf of the Territory- - - - - -
1,410 Taxes, Fees and Fines 389 - -100 - - -
4,030 Total Revenue 389 - -100 - - -
4,030 Total Income 389 - -100 - - -
Expenses 2,620 Grants and Purchased
Services133 - -100 - - -
1,410 Transfer Expenses 389 - -100 - - -
4,030 Total Expenses 522 - -100 - - -
- Operating Result -133 - 100 - - -
- Total Comprehensive Income
-133 - 100 - - -
2019-20 Budget Statements 62 Canberra Health Services

Table 32: Canberra Health Services: Statement of Assets and Liabilities on behalf of the Territory
Budgetat
30/6/19 $'000
2018-19 Estimated Outcome
$'000
Budgetat
30/6/20 $'000
Var%
Estimateat
30/6/21 $'000
Estimateat
30/6/22 $'000
Estimateat
30/6/23 $'000
Current Assets674 Cash and Cash Equivalents - - - - - -
51 Receivables - - - - - -
725 Total Current Assets - - - - - -
Non Current Assets
- Total Non Current Assets - - - - - -
725 TOTAL ASSETS - - - - - -
Current Liabilities300 Payables - - - - - -261 Other Liabilities - - - - - -
561 Total Current Liabilities - - - - - -
Non Current Liabilities
- Total Non Current Liabilities
- - - - - -
561 TOTAL LIABILITIES - - - - - -
164 NET ASSETS - - - - - -
REPRESENTED BY FUNDS EMPLOYED
164 Accumulated Funds - - - - - -
164 TOTAL FUNDS EMPLOYED - - - - - -
2019-20 Budget Statements 63 Canberra Health Services

Table 33: Canberra Health Services: Statement of Changes in Equity on behalf of the Territory
Budgetat
30/6/19 $'000
2018-19 Estimated Outcome
$'000
Budgetat
30/6/20 $'000
Var%
Estimateat
30/6/21 $'000
Estimateat
30/6/22 $'000
Estimateat
30/6/23 $'000
Opening Equity164 Opening Accumulated 2,366 - -100 - - -
164 Balance at the Start of the Reporting Period
2,366 - -100 - - -
- Operating Result - Including Economic Flows
-133 - 100 - - -
- Total Movement in Reserves
- - - - - -
Closing Equity164 Closing Accumulated
Funds- - - - - -
164 Balance at the end of the Reporting Period
- - - - - -
2019-20 Budget Statements 64 Canberra Health Services

Table 34: Canberra Health Services: Cash Flow Statement on behalf of the Territory
2018-19 2018-19 2019-20 Var 2020-21 2021-22 2022-23Budget Estimated
OutcomeBudget % Estimate Estimate Estimate
$'000 $'000 $'000 $'000 $'000 $'000CASH FLOWS FROM OPERATING ACTIVITIESReceipts
2,620 Payment for Expenses on Behalf of the Territory
- - - - - -
1,410 Taxes, Fees and Fines 389 - -100 - - -261 Other 13 - -100 - - -
4,291 Operating Receipts 402 - -100 - - -
Payments2,620 Grants and Purchased Services 133 - -100 - - -1,410 Transfer of Territory Receipts to
the ACT Government389 - -100 - - -
261 Other 13 - -100 - - -4,291 Operating Payments 535 - -100 - - -
- NET INCREASE/(DECREASE) IN CASH AND CASH EQUIVALENTS
-1,089 - 100 - - -
674 CASH AT THE BEGINNING OF REPORTING PERIOD
1,089 - -100 - - -
674 CASH AT THE END OF REPORTING PERIOD
- - - - - -
2019-20 Budget Statements 65 Canberra Health Services

Notes to the Territorial Budget Statements
Functions undertaken through the Territorial account were transferred to the ACT Health Directorate Territorial account on 1 October 2018. The 2018-19 estimated outcome therefore reflects 3 months of operation only.
Taxes, fees and fines and transfer expenses relate to regulatory fees collected by the former Health Directorate prior to 1 October 2018.
In 2018-19, grants and purchased services relate to capital grants paid to Calvary Public Hospital prior to 1 October 2018.
2019-20 Budget Statements 66 Canberra Health Services

ACT LOCAL HOSPITAL NETWORK
PurposeThe ACT Local Hospital Network was established under the Health Act 1953, and is administered by the Director-General of the ACT Health Directorate and supported by staff from the ACT Health Directorate.
The ACT Local Hospital Network receives Activity Based Funding (ABF) from both the Commonwealth and the ACT Governments, and block funding for teaching, training and research. It purchases public hospital services from five ACT public hospital providers:
Canberra Hospital;
University of Canberra Hospital;
Calvary Public Hospital;
Clare Holland House; and
Queen Elizabeth II Family Centre.
2019-20 PrioritiesOperational initiatives to be pursued in 2019-20 include:
receiving and distributing funding for public hospital services under the National Health Reform Agreement (NHRA);
purchasing public hospital services from five ACT public hospital providers; and
funding the expansion of Calvary services including urology, the emergency department and two additional operating theatres.
Estimated Employment LevelThe ACT Local Hospital Network does not employ any staff. All staff providing administrative support for the ACT Local Hospital Network are employed by the ACT Health Directorate.
2019-20 Budget Statements 67 ACT Local Hospital Network

Strategic Objectives and Indicators
Strategic Objective 1
Establishment of an integrated planning, funding and performance monitoring framework that drives coordinated, high-quality health care service delivery
Table 1: Number of Public Hospital Performance Agreements
Strategic Indicator 2018–19 2018–19 2019–20Target Estimated
OutcomeTarget
Performance Agreements with Public Hospital Service Providers in place1
n/a n/a 2
Note:1. This is a new Strategic Indicator for 2019-20. The Canberra Hospital and the University of Canberra Hospital are contracted under
the same agreement, as is Calvary Public Hospital Bruce and Clare Holland House.
Strategic Objective 2
Percentage of Elective Surgery Cases Admitted on Time by Clinical Urgency
Table 2: Percentage of Elective Surgery Cases Admitted on Time by Clinical Urgency
Strategic Indicator
Clinically recommended time by urgency category
2018–19 2018–19 2019-20Targets Estimated
OutcomeTargets1
Urgent—admission within 30 days is desirable for a condition that has the potential to deteriorate quickly to the point that it may become an emergency
100% 96% n/a
Semi urgent—admission within 90 days is desirable for a condition causing some pain, dysfunction or disability which is not likely to deteriorate quickly or become an emergency
78% 78% n/a
Non urgent—admission at some time in the future acceptable for a condition causing minimal or no pain, dysfunction or disability, which is not likely to deteriorate quickly and which does not have the potential to become an emergency
91% 79% n/a
Note:1. This Strategic Objective has been moved to the ACT Health Directorate Accountability Indicators 1.1.b to d and will be reported as a
Territory wide indicator as shown on page 13. This measure is also included in Canberra Health Services as Accountability Indicators 1.1a to c, measuring timeliness only for Canberra Health Services.
2019-20 Budget Statements 68 ACT Local Hospital Network

Strategic Objective 3
Improved Emergency Department Timeliness
Table 3: Strategic Indicator 3.1: The Proportion of Emergency Department Presentations that are Treated within Clinically Appropriate Timeframes
Strategic Indicator 2018–19 2018–19 2019-20Targets Estimated
OutcomeTargets1
One (resuscitation seen immediately) 100% 100% n/aTwo (emergency seen within 10 mins) 80% 75% n/aThree (urgent seen within 30 mins) 75% 33% n/aFour (semi urgent seen within 60 mins) 70% 48% n/aFive (non urgent seen within 120 mins) 70% 84% n/aAll presentations 70% 48% n/a
Note:1. This Strategic Objective has been moved to Canberra Health Services Accountability Indicators 1.1.d to i for 2019-20 and will
measure timeliness performance for Canberra Health Services only as shown on page 43. ‘All Presentations’ for Territory wide is reported in the ACT Health Directorate under Accountability Indicator 1.1a.
Table 4: Strategic Indicator 3.2: The proportion of Emergency Department presentations whose length of stay in the Emergency Department is four hours or less
Strategic Indicator 2018–19 2018-19 2019-20Targets Estimated
OutcomeTargets1
The proportion of Emergency Department presentations who either physically leave the Emergency Department for admission to hospital, are referred for treatment or are discharged, whose total time in the Emergency Department is within four hours
90% 60% n/a
Note:1. This Strategic Objective has been discontinued in the Local Hospital Network and will be reported by the ACT Health Directorate
under Strategic Objective 3 as shown on page 4.
2019-20 Budget Statements 69 ACT Local Hospital Network

Strategic Objective 4
Maximising the Quality of Hospital Services
Table 5: Strategic Indicator 4.1: The proportion of people who undergo a surgical operation requiring an unplanned return to the operating theatre within a single episode of care due to complications of their primary condition
Strategic Indicator 2018–19 2018–19 2019-20Targets Estimated
OutcomeTargets1
Canberra Hospital <1.0% 0.8% n/aCalvary Public Hospital <0.5% 0.4% n/a
Note:1. This Strategic Objective has been discontinued in the Local Hospital Network and will be reported by the Health Directorate under
Accountability Indicator 1.1.f as shown on page 13.
Table 6: Strategic Indicator 4.2: The proportion of people separated from ACT public hospitals wo are re-admitted to hospital within 28 days of their separation due to complications of their condition (where the re-admission was unforeseen at the time of separation)
Strategic Indicator 2018–19 2018–19 2019-20Targets Estimated
OutcomeTargets1
Canberra Hospital <2.0% 1.2% n/aCalvary Public Hospital <1.0% 0.8% n/a
Note:1. This Strategic Objective has been discontinued in the Local Hospital Network and will be reported by the Health Directorate under
Accountability Indicator 1.1.g as shown on page 13.
Table 7: Strategic Indicator 4.3: The number of people admitted to hospitals per 10,000 occupied bed days who acquire a Staphylococcus Aureus Bacteraemia infection (SAB infection) during their stay
Strategic Indicator 2018–19 2018–19 2019-20Targets Estimated
OutcomeTargets1
Canberra Hospital <2.0 per 10,000 1.2 per 10,000 n/aCalvary Public Hospital <2.0 per 10,000 0.0 per 10,000 n/a
Note:1. This Strategic Objective has been discontinued in the Local Hospital Network and will be reported by Canberra Health Services at
Strategic Objective 5 as shown on page 37. Canberra Health Services will report on their performance only in 2019-20.
Table 8: Strategic Indicator 4.4: The estimated hand hygiene rate
Strategic Indicator 2018–19 2018–19 2019-20Targets Estimated
OutcomeTargets1
Canberra Hospital 75% 83% n/aCalvary Public Hospital 75% 78% n/a
Note:1. This Strategic Objective has been discontinued in the Local Hospital Network and will be reported by Canberra Health Services at
Strategic Objective 6 as shown on page 37. Canberra Health Services will report on their performance only in 2019-20.
2019-20 Budget Statements 70 ACT Local Hospital Network

Output ClassesThe ACT Local Hospital Network will receive funding under the NHRA and purchase public hospital services from the Canberra Hospital, University of Canberra Hospital, Calvary Public Hospital, Clare Holland House and Queen Elizabeth II Family Centre.
The NHRA commits to funding public hospitals using Activity Based Funding where practicable using the National Efficient Price (NEP) determined by the Independent Hospital Pricing Authority (IHPA). The national efficient price is based on the projected average cost of a National Weighted Activity Unit (NWAU).
An NWAU is a measure of health service activity expressed as a common unit, against which the national efficient price (NEP) is paid. It provides a way of comparing and valuing each public hospital service (whether it is an admission, emergency department presentations or outpatient episode), by weighing it for its clinical complexity. The average hospital service is worth one NWAU – the most intensive and expensive activities are worth multiple NWAU’s, the simplest and least expensive are worth fractions of an NWAU. NWAU’s are updated annually.
The 2019-20 National Efficient Price is $5,134 per NWAU.
Output Class 1: ACT Local Hospital Network
Table 9: Output Class 1: ACT Local Hospital Network
2018-19 2019-20Estimated Outcome Budget
$'000 $'000Total Cost 1,175,946 1,305,623Controlled Recurrent Payments 654,588 771,178
2019-20 Budget Statements 71 ACT Local Hospital Network

Accountability Indicators
Output Class 1: ACT Local Hospital Network
Table 10: Accountability Indicators Output 1.1
2018-19Targets
2018-19Estimated Outcome
2019-20Targets
NWAU{18} NWAU{18} NWAU{19}a. Admitted Services – National Weighted Activity
Units1101,853 100,031 101,917
b. Non-admitted Services – National Weighted Activity Units1,2
18,897 21,524 20,758
c. Emergency Services – National Weighted Activity Units1
19,389 18,632 19,590
d. Acute Admitted Mental Health Services – National Weighted Activity Units1,3
8,433 9,209 9,824
e. Sub-Acute Services – National Weighted Activity Units1,4
10,125 11,656 12,340
f. Total in Scope – National Weighted Activity Units1 158,697 161,052 164,429g. Percentage of mental health clients with outcome
measures completed565% 71% n/a
h. Proportion of mental health clients contacted by a Health Directorate community facility within 7 days post discharge from inpatient services6
75% 74% n/a
Notes:1. National Weighted Activity Unit (NWAU) is the ‘currency’ that is used to express the price weights for all services that are funded on
an activity basis. NWAU {18} is the currency as defined by the Independent Hospital Pricing Authority in the National Price Determination 2018-19, while NWAU {19} is the currency for 2019-20. NWAU{19} and NWAU{18} are not directly comparable. These measures combine the results for Canberra Hospital, University of Canberra Hospital and Calvary Public Hospital.
2. Non-admitted estimated outcome is 14% above the 2018-19 target, which was largely driven by increased in patient volume in services such as midwifery and maternity, urology and general medicine.
3. Admitted mental health activity is 9% above the 2018-19 target, which was largely driven by an increase in average complexity per separation in services such as schizophrenia disorders, major affective disorders and drug intoxication and withdrawal.
4. Sub/Non-acute admitted activity is 15% above the 2018-19 target, which was largely driven by an increase in the number of patients receiving rehabilitation care and maintenance care, reflecting the commissioning of the University of Canberra Hospital earlier in the financial year.
5. This measure has been discontinued as a Local Hospital Network Accountability Indicator for 2019-20 and will be reported by ACT Health Directorate as a Territory wide indicator under Accountability Indicator 1.3.a as shown on page 15.
6. This measure has been discontinued as a Local Hospital Network Accountability Indicator for 2019-20 and will be reported by Canberra Health Services 1.2.i as shown on page 44. Canberra Health Services will report on their performance only.
2019-20 Budget Statements 72 ACT Local Hospital Network

Changes to Appropriation
Table 11: Changes to appropriation – Controlled Recurrent Payments
2018-19 Estimated Outcome
$'000
2019-20 Budget
$'000
2020-21 Estimate
$'000
2021-22 Estimate
$'000
2022-23 Estimate
$'000
2018-19 Budget 669,990 674,088 695,188 725,173 725,173
2018-19 Budget ReviewCaring for older Canberrans at home 869 2,558 3,065 3,142 3,220Commencing operations of the Drug and Alcohol Court
276 775 1,742 - -
Delivering the Weston Creek Walk-in Centre - - 43 85 85Flu vaccinations for children 492 501 513 526 539
2019-20 Budget Policy Decisions7-day-a-week Mental Health Consultation Liaison service
- 800 1,234 1,266 1,292
ACT Health Core IT Systems to align with the Digital Health Strategy
- - - - -6,338
Alternative justice pathways for people with mental illness
- 731 749 768 787
Boosting police for a growing city - 82 277 285 -Delivering the Inner North Walk in Centre - - 2,648 2,687 2,744Delivering the Weston Creek Walk in Centre - 1,946 2,705 2,887 2,933Expanding early intervention and diversion programs for people experiencing alcohol and drug dependence
- 949 644 660 677
Expanding frontline services at The Canberra Hospital
- 11,448 11,614 11,934 12,106
Expanding health services at the Alexander Maconochie Centre
- 259 266 273 277
Expanding palliative care for older Canberrans - 408 363 373 519Expanding pharmacy services at The Canberra Hospital
- 302 545 749 813
Expanding public dermatology services - 175 180 185 188Expanding public Fracture Clinic services - 556 1,139 1,167 1,197Expanding public inpatient mental health care - 1,680 1,722 1,765 1,809Expanding public ophthalmology services - 250 - - -Expanding the Centenary Hospital for Women and Children
- - 3,990 14,990 20,510
Expanding the emergency department at Calvary Public Hospital
- 3,021 6,143 6,352 6,475
Improving access to maternity services across Canberra
- 513 515 529 537
Maintaining support for disability services in the transition to the full scheme National Disability Insurance Scheme
- 1,179 1,208 1,239 1,270
More mental health services at The Canberra Hospital
- - 488 999 1,078
More public medical imaging services for Canberra Hospital
- 100 677 1,217 1,458
2019-20 Budget Statements 73 ACT Local Hospital Network

Table 11: Changes to appropriation – Controlled Recurrent Payments (continued)
2018-19 Estimated Outcome
$'000
2019-20 Budget
$'000
2020-21 Estimate
$'000
2021-22 Estimate
$'000
2022-23 Estimate
$'000
More specialised women’s health care - 114 214 220 223More support for families travelling for healthcare - 250 512 525 538More surgical theatres at Calvary Public Hospital - 1,539 3,302 3,461 3,625More urology services at Calvary Public Hospital - 432 962 991 1,021Opioid treatment services on Canberra’s northside - - 750 770 790Protecting teens with meningococcal ACWY vaccinations
- 150 153 158 160
Strengthening care for childhood and gestational diabetes
- 567 765 784 796
Strengthening care for chronic disease - 240 462 474 481Strengthening care for older Canberrans - 470 482 494 506Training ACT Government frontline workers to respond to family violence
- 210 288 296 300
Transfer – New Initiative ICT Expenses to ACT Health Directorate
- -572 -679 -717 -738
2019-20 Budget Technical AdjustmentsCommonwealth National Health Reform Agreement -15,402 - - - -19,222Efficiency Target -1,637 -4,272 -4,703 -4,808 -4,907Improving Safety of Older Drivers - 300 - - -Revised Indexation Parameters - - - - 8,889Revised Superannuation Parameters - 9,230 9,230 9,230 9,230Saving - Comcare Premium - -5,531 -5,531 -5,531 -5,531Saving - Insurance Premium - -3,800 - - -Saving - SMS Procurement - Health Labour Hire Project
- -401 -401 -401 -401
Transfer - National Disability Insurance Scheme to Community Services Directorate
- -2,854 -2,925 -2,998 -3,073
Transfer - Separation of Canberra Health Services and ACT Health Directorate
- 72,785 45,422 16,352 14,333
2019-20 Budget 654,588 771,178 785,961 798,551 786,369
2019-20 Budget Statements 74 ACT Local Hospital Network

Financial Statements
Table 12: ACT Local Hospital Network: Operating Statement
2018-19 Budget
$'000
2018-19 Estimated Outcome
$'000
2019-20 Budget
$'000
Var%
2020-21 Estimate
$'000
2021-22 Estimate
$'000
2022-23 Estimate
$'000
Income
Revenue669,990 Controlled Recurrent
Payments654,588 771,178 18 785,961 798,551 786,369
107,921 User Charges 107,921 110,619 2 113,385 116,219 119,124398,035 Grants 413,437 423,826 3 451,293 480,544 511,779
1,175,946 Total Revenue 1,175,946 1,305,623 11 1,350,639 1,395,314 1,417,272
- Total Gains - - - - - -
1,175,946 Total Income 1,175,946 1,305,623 11 1,350,639 1,395,314 1,417,272
Expenses 1,169,126 Grants and Purchased
Services1,169,126 1,298,441 11 1,343,072 1,387,338 1,409,097
6,820 Payments to ACT Government Agencies
6,820 7,182 5 7,567 7,976 8,175
1,175,946 Total Expenses 1,175,946 1,305,623 11 1,350,639 1,395,314 1,417,272
- Operating Result - - - - - -
- Total Comprehensive Income
- - - - - -
2019-20 Budget Statements 75 ACT Local Hospital Network

Table 13: ACT Local Hospital Network: Balance Sheet
Budgetat
30/6/19 $'000
2018-19 Estimated Outcome
$'000
Budgetat
30/6/20 $'000
Var%
Estimateat
30/6/21 $'000
Estimateat
30/6/22 $'000
Estimateat
30/6/23 $'000
Current Assets3,771 Cash and Cash Equivalents 500 500 - 500 500 500
24,218 Receivables 34,887 34,887 - 34,887 34,887 34,887
27,989 Total Current Assets 35,387 35,387 - 35,387 35,387 35,387
Non Current Assets
- Total Non Current Assets - - - - - -
27,989 TOTAL ASSETS 35,387 35,387 - 35,387 35,387 35,387
Current Liabilities14,780 Payables 15,606 15,606 - 15,606 15,606 15,606
14,780 Total Current Liabilities 15,606 15,606 - 15,606 15,606 15,606
Non Current Liabilities
- Total Non Current Liabilities
- - - - - -
14,780 TOTAL LIABILITIES 15,606 15,606 - 15,606 15,606 15,606
13,209 NET ASSETS 19,781 19,781 - 19,781 19,781 19,781
REPRESENTED BY FUNDS EMPLOYED
13,209 Accumulated Funds 19,781 19,781 - 19,781 19,781 19,781
13,209 TOTAL FUNDS EMPLOYED 19,781 19,781 - 19,781 19,781 19,781
2019-20 Budget Statements 76 ACT Local Hospital Network

Table 14: ACT Local Hospital Network: Statement of Changes in Equity
Budgetat
30/6/19 $'000
2018-19 Estimated Outcome
$'000
Budgetat
30/6/20 $'000
Var%
Estimateat
30/6/21 $'000
Estimateat
30/6/22 $'000
Estimateat
30/6/23 $'000
Opening Equity13,209 Opening Accumulated 19,781 19,781 - 19,781 19,781 19,781
13,209 Balance at the Start of the Reporting Period
19,781 19,781 - 19,781 19,781 19,781
- Total Movement in Reserves
- - - - - -
Closing Equity13,209 Closing Accumulated
Funds19,781 19,781 - 19,781 19,781 19,781
13,209 Balance at the end of the Reporting Period
19,781 19,781 - 19,781 19,781 19,781
2019-20 Budget Statements 77 ACT Local Hospital Network

Table 15: ACT Local Hospital Network: Cash Flow Statement
2018-19 Budget
$'000
2018-19 Estimated Outcome
$'000
2019-20 Budget
$'000
Var %
2020-21 Estimate
$'000
2021-22 Estimate
$'000
2022-23 Estimate
$'000
CASH FLOWS FROM OPERATING ACTIVITIESReceipts
669,990 Controlled Recurrent Payments 654,588 771,178 18 785,961 798,551 786,369107,921 User Charges 107,921 110,619 2 113,385 116,219 119,124398,035 Grants 413,437 423,826 3 451,293 480,544 511,779
21,089 Other 21,089 21,994 4 21,994 22,544 22,5441,197,035 Operating Receipts 1 ,197,035 1,327,617 11 1,372,633 1,417,858 1,439,816
Payments1,175,946 Grants and Purchased Services 1,175,946 1,305,623 11 1,350,639 1,395,314 1,417,272
21,089 Other 21,089 21,994 4 21,994 22,544 22,5441,197,035 Operating Payments 1,197,035 1,327,617 11 1,372,633 1,417,858 1,439,816
- NET CASH INFLOW/(OUTFLOW) FROM OPERATING ACTIVITIES
- - - - - -
3,771 CASH AT THE BEGINNING OF REPORTING PERIOD
500 500 - 500 500 500
3,771 CASH AT THE END OF REPORTING PERIOD
500 500 - 500 500 500
2019-20 Budget Statements 78 ACT Local Hospital Network

Notes to the Controlled Budget Statements
Significant variations are as follows:
Operating Statement
controlled recurrent payments:
- the decrease of $15.402 million (2 per cent) in the 2018-19 estimated outcome from the original budget is due to increased commonwealth revenue; and
- the increase of $116.590 million (18 per cent) in the 2019-20 Budget from the 2018-19 estimated outcome is due to indexation, new initiatives and a change in methodology in the way Canberra Health Services receive funding from ACT Government.
grants revenue: this funding relates to Activity Based Funding under the National Health Reform Agreement. The increase of $15.402 million in the estimated outcome from the original budget is mainly due to back adjustments related to the 2016-17 and 2017-18 financial years.
grants and purchased services: the increase of $129.315 million in the 2019-20 Budget from the 2018-19 estimated outcome is due to indexation, new initiatives and a change in methodology in the way Canberra Health Services will receive its funding from ACT Government.
Balance Sheet
receivables: the increase of $10.669 million in the 2018-19 estimated outcome from the original budget is due to outstanding cross border health receipts.
Cash Flow Statement
Variations in the Statement are explained in the notes above.
2019-20 Budget Statements 79 ACT Local Hospital Network