acs cg cg-2009-00544k 1. - rutgers school of engineering
TRANSCRIPT
pubs.acs.org/crystal Published on Web 09/28/2009 r 2009 American Chemical Society
DOI: 10.1021/cg900544k
2009, Vol. 94680–4684
Synthesis of Nanostructured Tungsten Oxide (WO2.9) Fibers and Discs
J. F. Al-Sharab,*,† R. K. Sadangi,† V. Shukla,† S. D. Tse,‡ and B. H. Kear†
†Center for Nanomaterials Research, and ‡Mechanical & Aerospace Engineering, Rutgers UniversityPiscataway, New Jersey 08854
Received May 20, 2009; Revised Manuscript Received August 27, 2009
ABSTRACT: Evaporation of WO3.0 powder during transmission electron microscopy resulted in the formation of nanofibersof WO2.9, which deposited on adjacent cooler regions of the carbon substrate. Controlled experiments using the inert gascondensation method were performed to investigate the formation mechanism of the nanofibers. Depending on the growthconditions, different morphologies of WO2.9 phase were observed. Structural characterization was carried out using analyticalelectron microscopy techniques. On the basis of these observations, a qualitative growth model is proposed.
Introduction
Tungsten trioxide (WO3-x) phases have been the subject ofextensive research1-4 because of their growing technologicalimportance. The materials have applications in gas andhumidity sensors,5 electronic information displays, colormemorydevices, photoelectric sensors, superconductors, elec-trochromic devices, ferroelectrics,6-8 Li-ion batteries,9,10 andsemiconductors.6 This wide range of applications is due to thelarge number of crystalline formsdisplayedbyWO3-xphases,which include cubic, orthorhombic, tetragonal, monoclinic,and several perovskite structures, dependingon the processingenvironment and oxygen partial pressure.2,11,12 Recently,various methods have been reported for preparing tungstenoxide nanowires and nanostructures.13-19 However, methodscapable of synthesizing high quality nanostructured WO3-x
phases are still lacking.13 Some progress has been made inpreparing WO3 nanorods by heating a tungsten tip14 and bythermal oxidation.13 However, these techniques still lack theability to control orientation and defect density. Here, a newmethod is described for synthesizing WO2.9 nanofibers andnanodiscs that display a high degree of crystalline perfection.
The new method was discovered during routine transmis-sion electron microscopy (TEM) observations of orthorhom-bic WO3.0 nanopowders. When the electron-beam intensitywas increased sufficiently, a small portion of the nanopowderexperienced vaporization, likely by sublimation, and thevaporized species then condensed to form nanofibers onadjacent cooler regions of the carbon substrate. Furtheranalysis showed that the nanofibers were highly perfect singlecrystals of tetragonal WO2.9. The long axis or growth direc-tion of the nanofibers was [110], and their flat surfaces werepredominantly (001), that is, parallel to the basal plane of thetetragonal structure.
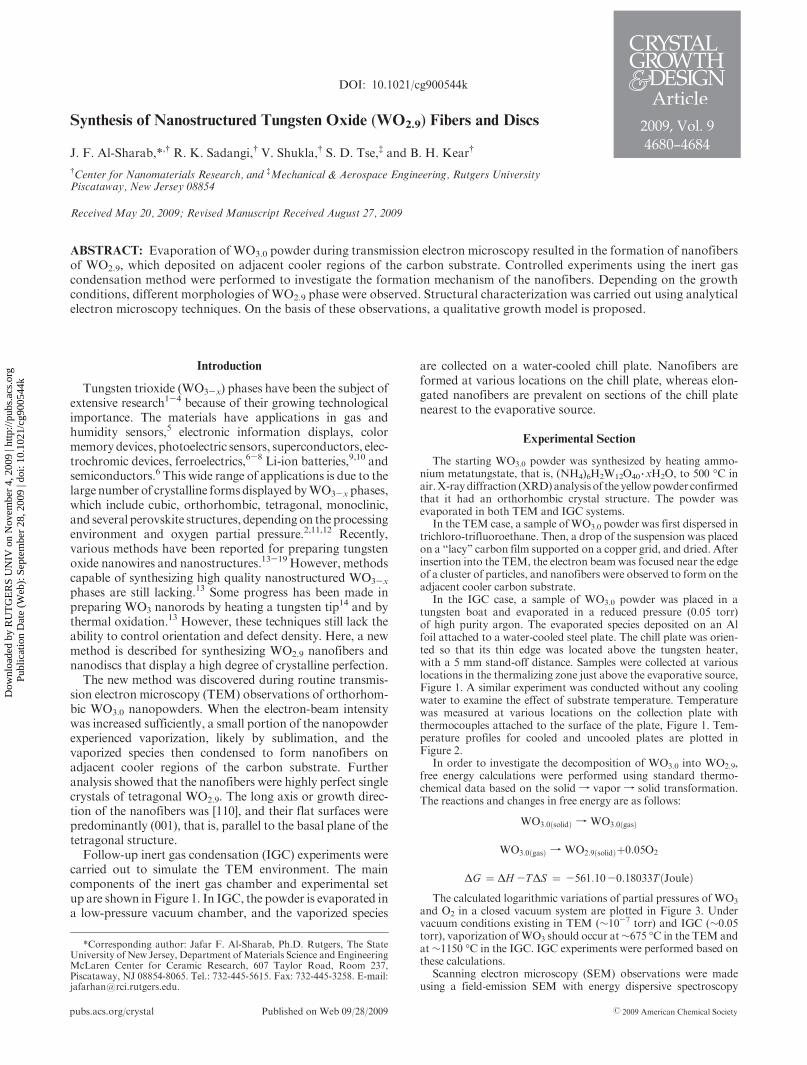
Follow-up inert gas condensation (IGC) experiments werecarried out to simulate the TEM environment. The maincomponents of the inert gas chamber and experimental setup are shown inFigure 1. In IGC, the powder is evaporated ina low-pressure vacuum chamber, and the vaporized species
are collected on a water-cooled chill plate. Nanofibers areformed at various locations on the chill plate, whereas elon-gated nanofibers are prevalent on sections of the chill platenearest to the evaporative source.
Experimental Section
The starting WO3.0 powder was synthesized by heating ammo-nium metatungstate, that is, (NH4)6H2W12O40 3xH2O, to 500 �C inair.X-ray diffraction (XRD)analysis of the yellowpowder confirmedthat it had an orthorhombic crystal structure. The powder wasevaporated in both TEM and IGC systems.
In the TEM case, a sample ofWO3.0 powder was first dispersed intrichloro-trifluoroethane. Then, a drop of the suspension was placedon a “lacy” carbon film supported on a copper grid, and dried. Afterinsertion into the TEM, the electron beamwas focused near the edgeof a cluster of particles, and nanofibers were observed to form on theadjacent cooler carbon substrate.
In the IGC case, a sample of WO3.0 powder was placed in atungsten boat and evaporated in a reduced pressure (0.05 torr)of high purity argon. The evaporated species deposited on an Alfoil attached to a water-cooled steel plate. The chill plate was orien-ted so that its thin edge was located above the tungsten heater,with a 5 mm stand-off distance. Samples were collected at variouslocations in the thermalizing zone just above the evaporative source,Figure 1. A similar experiment was conducted without any coolingwater to examine the effect of substrate temperature. Temperaturewas measured at various locations on the collection plate withthermocouples attached to the surface of the plate, Figure 1. Tem-perature profiles for cooled and uncooled plates are plotted inFigure 2.
In order to investigate the decomposition of WO3.0 into WO2.9,free energy calculations were performed using standard thermo-chemical data based on the solid f vapor f solid transformation.The reactions and changes in free energy are as follows:
WO3:0ðsolidÞ f WO3:0ðgasÞ
WO3:0ðgasÞ f WO2:9ðsolidÞþ0:05O2
ΔG ¼ ΔH -TΔS ¼ -561:10-0:18033TðJouleÞThe calculated logarithmic variations of partial pressures of WO3
and O2 in a closed vacuum system are plotted in Figure 3. Undervacuum conditions existing in TEM (∼10-7 torr) and IGC (∼0.05torr), vaporization ofWO3 should occur at∼675 �C in the TEM andat∼1150 �C in the IGC. IGC experiments were performed based onthese calculations.
Scanning electron microscopy (SEM) observations were madeusing a field-emission SEM with energy dispersive spectroscopy
*Corresponding author: Jafar F. Al-Sharab, Ph.D. Rutgers, The StateUniversity of New Jersey, Department ofMaterials Science and EngineeringMcLaren Center for Ceramic Research, 607 Taylor Road, Room 237,Piscataway, NJ 08854-8065. Tel.: 732-445-5615. Fax: 732-445-3258. E-mail:[email protected].
Dow
nloa
ded
by R
UT
GE
RS
UN
IV o
n N
ovem
ber
4, 2
009
| http
://pu
bs.a
cs.o
rg
Pub
licat
ion
Dat
e (W
eb):
Sep
tem
ber
28, 2
009
| doi
: 10.
1021
/cg9
0054
4k
Article Crystal Growth & Design, Vol. 9, No. 11, 2009 4681
(EDS) attachment. Grain or crystallite size was determined by highresolution transmission electron microscopy (HRTEM). Intensityanalyses of selected area electron diffraction (SAED) patterns weremade using Process-Diffraction software.20 Simulations of SAED
patterns were performed using Java electron microscopy (JEMS)software.21
Results and Discussion
Various WO2.9 particle morphologies were observed afterevaporation of WO3.0 powder in TEM and IGS systems.
Figure 1. Schematic diagram of inert gas condensation (IGC) process showing the experimental setup and locations on the collecting platewhere samples were collected.
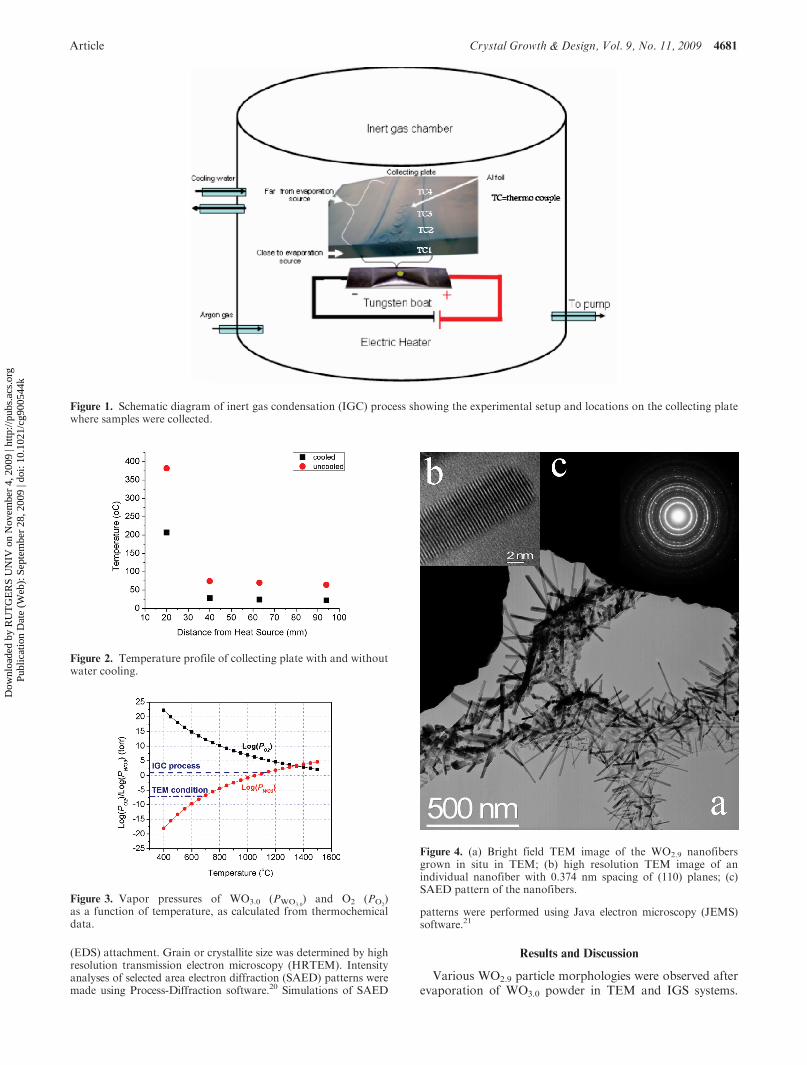
Figure 2. Temperature profile of collecting plate with and withoutwater cooling.
Figure 3. Vapor pressures of WO3.0 (PWO3.0) and O2 (PO2
)as a function of temperature, as calculated from thermochemicaldata.
Figure 4. (a) Bright field TEM image of the WO2.9 nanofibersgrown in situ in TEM; (b) high resolution TEM image of anindividual nanofiber with 0.374 nm spacing of (110) planes; (c)SAED pattern of the nanofibers.
Dow
nloa
ded
by R
UT
GE
RS
UN
IV o
n N
ovem
ber
4, 2
009
| http
://pu
bs.a
cs.o
rg
Pub
licat
ion
Dat
e (W
eb):
Sep
tem
ber
28, 2
009
| doi
: 10.
1021
/cg9
0054
4k
4682 Crystal Growth & Design, Vol. 9, No. 11, 2009 Al-Sharab et al.
Three distinct particle morphologies were identified: (i) nano-discs, (ii) nanofibers, and (iii) nanorods.
Nanofibers Formed in the TEM. Figure 4a shows a brightfield image of WO2.9 fibers after exposure to a high intensityelectron beam. Nanofibers are formed in bands on thecarbon substrate adjacent to the electron-beam impingementzone. The fiber dimensions are inversely proportional totheir distance from that zone. Typically, the fibers are ∼400nm in length and ∼30 nm in diameter. A high resolutionlattice image, Figure 4b, shows that the fibers are defect-freesingle crystals. In a few cases, small twins are observed infibers with diameters > 25 nm.
Electron diffraction of an area containing many suchnanofibers, Figure 4c, shows continuous concentric rings,indicating random orientation of very fine fibers. Analysisof the diffraction pattern is given in Table 1. In this table,d-spacings along with their corresponding planes are givenand compared to two standard structures: tetragonal WO2.9
(space group P4/nmm) and monoclinic WO2.92 (space groupP2/c). The data show that the nanofibers have WO2.9
chemistry, tetragonal structure, and [110] growth direction.Tungsten and oxygen only are detected by EDS analysis.Nucleation and growth of nanofibers, therefore, must haveoccurredwithout the assistance of a catalyst. This conclusionis supported by the absence of visible catalyst particles at thetips of the fibers, Figure 4b.
It has been reported1 that reductive decomposition ofWO3.0 occurs at temperatures> 625 �C.Moreover, as notedabove, thermodynamic chemical calculations also indicatethat reduction ofWO3 toWO2.9 can occur in the low oxygenpartial pressure environments of TEM (∼10-7 Torr) andIGC (∼0.05 Torr) systems. When a high intensity electronbeam impinges on WO3 particles, the localized increase intemperature causes evaporation or sublimation. Subsequentcondensation of the vaporized species in the low oxygenenvironment leads to the growth of WO2.9 nanofibers,
apparently nucleating at ledges in the carbon film. Nanofi-bers grow in length by a tip-accretion mechanism andthicken by a ledge-growth mechanism.
Nanostructures Formed in the IGC. To evaluate the influ-ence of substrate temperature on the morphology of con-
Table 1. Indexing of Diffraction Patterns of TEM and IGC Grown
Particlesa
standard tetragonalWO2.9 (P4/nmm(124))
standardmonoclinic
WO2.92 (P2/c(13))
d-spacingsfrom TEMgrown
nanofibers (A)
d-spacingsfrom IGCgrown
nanodiscs (A)d-spacings
(A) (h k l)d-spacings
(A) (h k l)
4.1700 (1 0 14)3.8200 (0 1 0)
3.757 3.746 3.7400 (1 1 0)3.6800 (1 0 16)
3.127 3.107 3.1000 (1 0 1)2.7100 (4 0 12)
2.661 2.650 2.6500 (2 0 0) 2.6500 (1 1 16)2.205 2.171 2.2000 (2 0 1) 2.2100 (4 1 12)
2.002 2.0200 (2 1 1)1.874 1.855 1.8800 (2 2 0) 1.8780 (6 0 6)
1.768 1.7800 (1 0 2) 1.6952 (1 2 16)1.679 1.655 1.6700 (3 1 0) 1.6853 (3 2 5)1.545 1.543 1.5300 (3 1 1)
1.4800 (2 1 2)1.332 1.343 1.3300 (4 0 0)
1.3001.251 1.25 1.2500 (3 3 0)1.181 1.164 1.1700
aThe d-spacings of standard tetragonal WO2.9 and monoclinicWO2.92 along with their corresponding planes are presented forcomparison.
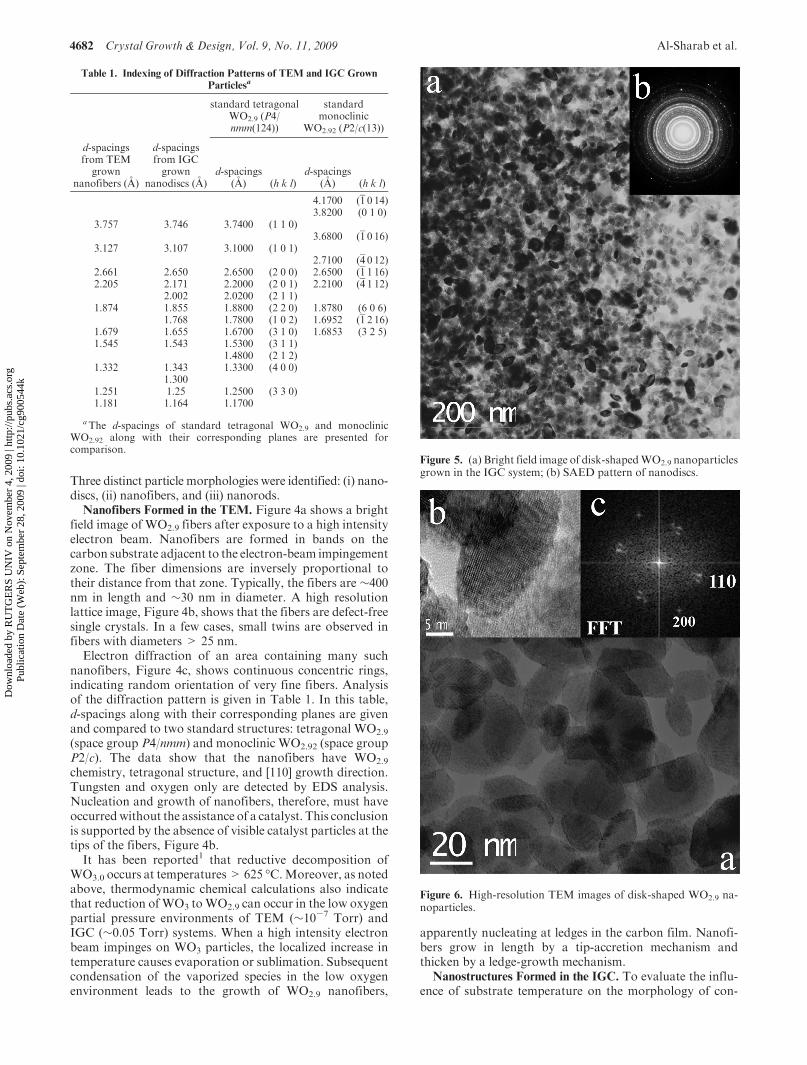
Figure 5. (a) Bright field image of disk-shapedWO2.9 nanoparticlesgrown in the IGC system; (b) SAED pattern of nanodiscs.
Figure 6. High-resolution TEM images of disk-shaped WO2.9 na-noparticles.
Dow
nloa
ded
by R
UT
GE
RS
UN
IV o
n N
ovem
ber
4, 2
009
| http
://pu
bs.a
cs.o
rg
Pub
licat
ion
Dat
e (W
eb):
Sep
tem
ber
28, 2
009
| doi
: 10.
1021
/cg9
0054
4k
Article Crystal Growth & Design, Vol. 9, No. 11, 2009 4683
densed WO2.9 nanoparticles, IGC processing was carriedwith and without water cooling of the substrate.
Nanostructures generated by vapor condensation on thewater-cooled substrate are primarily in the form of faceteddiscs. Figure 5 shows a bright field image and diffractionpattern of disk-shaped nanoparticles. Indexing of the dif-fraction pattern gives a good match to the P4/nmm tetra-gonalWO2.9 phase, Table 1. Figure 6 shows a high resolutionimage of the same particles. The indexed spots in the fastFourier transform (FFT) patterns correspond to the (110)and (200) planes with [001] zone axis. Hence, the major axisof a typical faceted particle is parallel to the [110] direction.The double spots in the FFT pattern are due to overlap oftwo crystals that share a common z-axis.
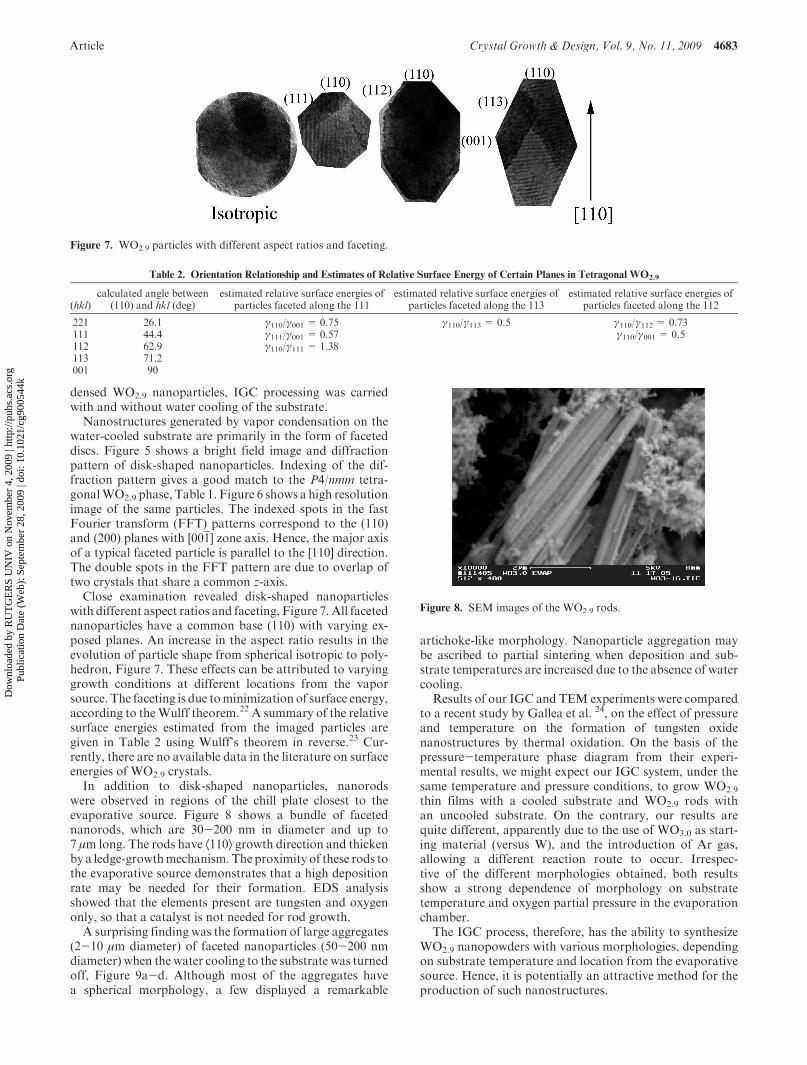
Close examination revealed disk-shaped nanoparticleswith different aspect ratios and faceting, Figure 7.All facetednanoparticles have a common base (110) with varying ex-posed planes. An increase in the aspect ratio results in theevolution of particle shape from spherical isotropic to poly-hedron, Figure 7. These effects can be attributed to varyinggrowth conditions at different locations from the vaporsource. The faceting is due tominimization of surface energy,according to theWulff theorem.22 A summary of the relativesurface energies estimated from the imaged particles aregiven in Table 2 using Wulff’s theorem in reverse.23 Cur-rently, there are no available data in the literature on surfaceenergies of WO2.9 crystals.
In addition to disk-shaped nanoparticles, nanorodswere observed in regions of the chill plate closest to theevaporative source. Figure 8 shows a bundle of facetednanorods, which are 30-200 nm in diameter and up to7 μm long. The rods have Æ110æ growth direction and thickenby a ledge-growthmechanism. The proximity of these rods tothe evaporative source demonstrates that a high depositionrate may be needed for their formation. EDS analysisshowed that the elements present are tungsten and oxygenonly, so that a catalyst is not needed for rod growth.
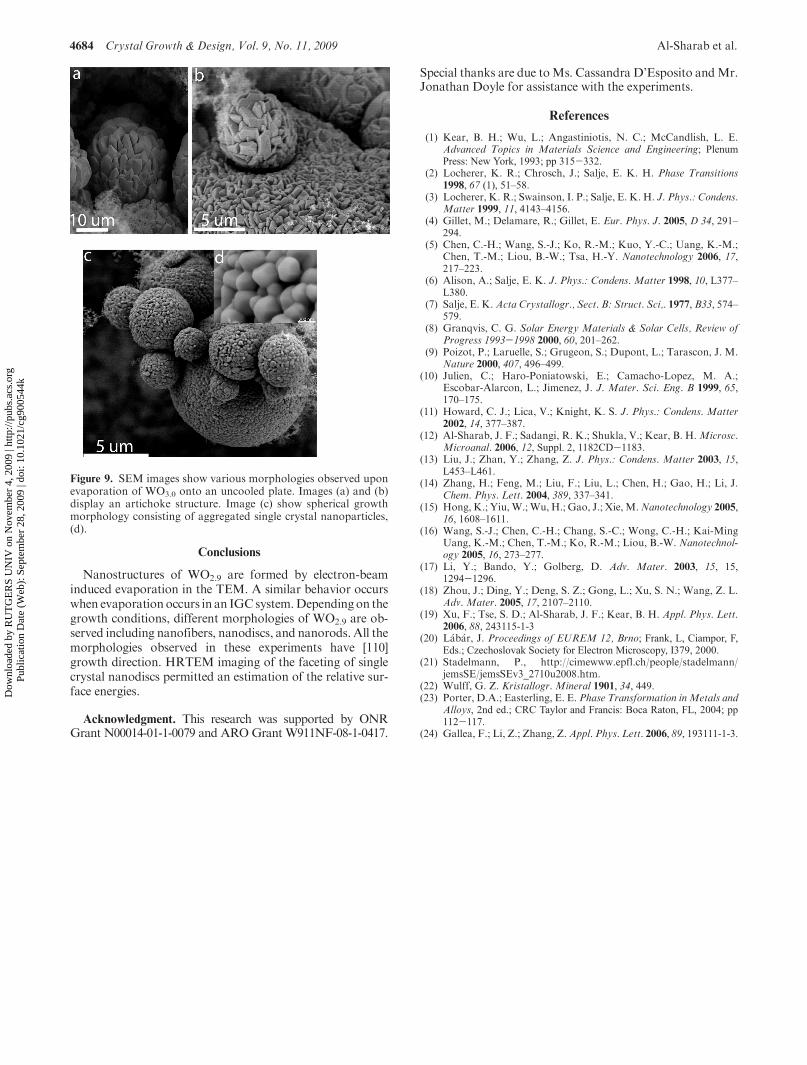
A surprising finding was the formation of large aggregates(2-10 μm diameter) of faceted nanoparticles (50-200 nmdiameter) when the water cooling to the substrate was turnedoff, Figure 9a-d. Although most of the aggregates havea spherical morphology, a few displayed a remarkable
artichoke-like morphology. Nanoparticle aggregation maybe ascribed to partial sintering when deposition and sub-strate temperatures are increased due to the absence of watercooling.
Results of our IGC and TEM experiments were comparedto a recent study by Gallea et al. 24, on the effect of pressureand temperature on the formation of tungsten oxidenanostructures by thermal oxidation. On the basis of thepressure-temperature phase diagram from their experi-mental results, we might expect our IGC system, under thesame temperature and pressure conditions, to grow WO2.9
thin films with a cooled substrate and WO2.9 rods withan uncooled substrate. On the contrary, our results arequite different, apparently due to the use of WO3.0 as start-ing material (versus W), and the introduction of Ar gas,allowing a different reaction route to occur. Irrespec-tive of the different morphologies obtained, both resultsshow a strong dependence of morphology on substratetemperature and oxygen partial pressure in the evaporationchamber.
The IGC process, therefore, has the ability to synthesizeWO2.9 nanopowders with various morphologies, dependingon substrate temperature and location from the evaporativesource. Hence, it is potentially an attractive method for theproduction of such nanostructures.
Figure 7. WO2.9 particles with different aspect ratios and faceting.
Table 2. Orientation Relationship and Estimates of Relative Surface Energy of Certain Planes in Tetragonal WO2.9
(hkl)calculated angle between
(110) and hkl (deg)estimated relative surface energies of
particles faceted along the 111estimated relative surface energies of
particles faceted along the 113estimated relative surface energies of
particles faceted along the 112
221 26.1 γ110/γ001 = 0.75 γ110/γ113 = 0.5 γ110/γ112 = 0.73111 44.4 γ111/γ001 = 0.57 γ110/γ001 = 0.5112 62.9 γ110/γ111 = 1.38113 71.2001 90
Figure 8. SEM images of the WO2.9 rods.
Dow
nloa
ded
by R
UT
GE
RS
UN
IV o
n N
ovem
ber
4, 2
009
| http
://pu
bs.a
cs.o
rg
Pub
licat
ion
Dat
e (W
eb):
Sep
tem
ber
28, 2
009
| doi
: 10.
1021
/cg9
0054
4k
4684 Crystal Growth & Design, Vol. 9, No. 11, 2009 Al-Sharab et al.
Conclusions
Nanostructures of WO2.9 are formed by electron-beaminduced evaporation in the TEM. A similar behavior occurswhen evaporationoccurs in an IGCsystem.Dependingon thegrowth conditions, different morphologies of WO2.9 are ob-served including nanofibers, nanodiscs, and nanorods. All themorphologies observed in these experiments have [110]growth direction. HRTEM imaging of the faceting of singlecrystal nanodiscs permitted an estimation of the relative sur-face energies.
Acknowledgment. This research was supported by ONRGrant N00014-01-1-0079 and AROGrant W911NF-08-1-0417.
Special thanks are due toMs. Cassandra D’Esposito andMr.Jonathan Doyle for assistance with the experiments.
References
(1) Kear, B. H.; Wu, L.; Angastiniotis, N. C.; McCandlish, L. E.Advanced Topics in Materials Science and Engineering; PlenumPress: New York, 1993; pp 315-332.
(2) Locherer, K. R.; Chrosch, J.; Salje, E. K. H. Phase Transitions1998, 67 (1), 51–58.
(3) Locherer, K. R.; Swainson, I. P.; Salje, E. K. H. J. Phys.: Condens.Matter 1999, 11, 4143–4156.
(4) Gillet, M.; Delamare, R.; Gillet, E. Eur. Phys. J. 2005, D 34, 291–294.
(5) Chen, C.-H.; Wang, S.-J.; Ko, R.-M.; Kuo, Y.-C.; Uang, K.-M.;Chen, T.-M.; Liou, B.-W.; Tsa, H.-Y. Nanotechnology 2006, 17,217–223.
(6) Alison, A.; Salje, E. K. J. Phys.: Condens. Matter 1998, 10, L377–L380.
(7) Salje, E. K.Acta Crystallogr., Sect. B: Struct. Sci,. 1977, B33, 574–579.
(8) Granqvis, C. G. Solar Energy Materials & Solar Cells, Review ofProgress 1993-1998 2000, 60, 201–262.
(9) Poizot, P.; Laruelle, S.; Grugeon, S.; Dupont, L.; Tarascon, J. M.Nature 2000, 407, 496–499.
(10) Julien, C.; Haro-Poniatowski, E.; Camacho-Lopez, M. A.;Escobar-Alarcon, L.; Jimenez, J. J. Mater. Sci. Eng. B 1999, 65,170–175.
(11) Howard, C. J.; Lica, V.; Knight, K. S. J. Phys.: Condens. Matter2002, 14, 377–387.
(12) Al-Sharab, J. F.; Sadangi, R. K.; Shukla, V.; Kear, B. H.Microsc.Microanal. 2006, 12, Suppl. 2, 1182CD-1183.
(13) Liu, J.; Zhan, Y.; Zhang, Z. J. Phys.: Condens. Matter 2003, 15,L453–L461.
(14) Zhang, H.; Feng, M.; Liu, F.; Liu, L.; Chen, H.; Gao, H.; Li, J.Chem. Phys. Lett. 2004, 389, 337–341.
(15) Hong, K.; Yiu,W.;Wu, H.; Gao, J.; Xie,M.Nanotechnology 2005,16, 1608–1611.
(16) Wang, S.-J.; Chen, C.-H.; Chang, S.-C.; Wong, C.-H.; Kai-MingUang, K.-M.; Chen, T.-M.; Ko, R.-M.; Liou, B.-W. Nanotechnol-ogy 2005, 16, 273–277.
(17) Li, Y.; Bando, Y.; Golberg, D. Adv. Mater. 2003, 15, 15,1294-1296.
(18) Zhou, J.; Ding, Y.; Deng, S. Z.; Gong, L.; Xu, S. N.; Wang, Z. L.Adv. Mater. 2005, 17, 2107–2110.
(19) Xu, F.; Tse, S. D.; Al-Sharab, J. F.; Kear, B. H. Appl. Phys. Lett.2006, 88, 243115-1-3
(20) L�ab�ar, J. Proceedings of EUREM 12, Brno; Frank, L, Ciampor, F,Eds.; Czechoslovak Society for Electron Microscopy, I379, 2000.
(21) Stadelmann, P., http://cimewww.epfl.ch/people/stadelmann/jemsSE/jemsSEv3_2710u2008.htm.
(22) Wulff, G. Z. Kristallogr. Mineral 1901, 34, 449.(23) Porter, D.A.; Easterling, E. E. Phase Transformation inMetals and
Alloys, 2nd ed.; CRC Taylor and Francis: Boca Raton, FL, 2004; pp112-117.
(24) Gallea, F.; Li, Z.; Zhang, Z.Appl. Phys. Lett. 2006, 89, 193111-1-3.
Figure 9. SEM images show various morphologies observed uponevaporation of WO3.0 onto an uncooled plate. Images (a) and (b)display an artichoke structure. Image (c) show spherical growthmorphology consisting of aggregated single crystal nanoparticles,(d).
Dow
nloa
ded
by R
UT
GE
RS
UN
IV o
n N
ovem
ber
4, 2
009
| http
://pu
bs.a
cs.o
rg
Pub
licat
ion
Dat
e (W
eb):
Sep
tem
ber
28, 2
009
| doi
: 10.
1021
/cg9
0054
4k