acrwc little otter creek - 2011 water quality summary
TRANSCRIPT

8/2/2019 ACRWC Little Otter Creek - 2011 Water Quality Summary
http://slidepdf.com/reader/full/acrwc-little-otter-creek-2011-water-quality-summary 1/2
Addison County Riverwatch Collaborative
Little Otter Creek - 2011 Water Quality Summary
The Addison County Riverwatch Collaborative has been monitoring water quality in the Little Otter Creek since1997. During 2011, six sites were tested for phosphorus, nitrogen and turbidity on the first Wednesday in Apriland May (Spring sampling dates) and in June, July, and August (Summer sampling dates). E.coli was testedonly on the Summer dates. A scheduled
September event was cancelled due todamages sustained at the LaRosa AnalyticalLaboratory during Tropical Storm Irene. Flow inthe river during the July and August sampledates represented low to baseflow conditions(based on records for the USGS gage near theRoute 7 crossing). Flows on the April, May andJune dates were moderate to high, due to snowmelt and spring rains.
E.coli counts in the Little Otter Creekstations were well above the statestandard of 77 MPN / 100 mL on all threesample dates: June 1, July 6, & August 3,
– except for stations LOC4.3 and LOC10on August 3. Flows on the July and
August sample dates were low, whereasflows were high during the June eventfollowing rains on May 27 and 28. E.coliconcentrations detected at these stationsduring 2011 are relatively consistent withhistoric monitoring results. Mud Creekstation (MDC1.2) has traditionally hadelevated E.coli as it is located directlydownstream of a dairy pasture wherelivestock have direct access to the stream.
Turbidity levels in the Little Otter Creek at the six stations weremoderate to high and oftenexceeded the Vermont standard of 10 NTUs (for Class B cold-water fisheries). Values ranged from 5.8to 428 NTUs, with a mean level of 78 NTUs for the five sample dates,including the two spring samplingevents on April 6 and May 4.
It is interesting to note that –for essentially the same flowcondition (287 to 288 cfs) –turbidity values at all stations weresignificantly higher on May 4 thanthey were on June 1. This findingmay be related to the greater prevalence of bare, unvegetatedsoils in the floodplains and along
banks of the river and contributing tributaries and ditches during the earlier May sampling event. The May 4sampling event occurred during the rising limb of a streamflow hydrograph in response to a relatively minor
Site Location Town
LOC14.4 Plank Rd. New Haven
LOC10 Monkton Road Ferrisburgh
LOC8 Wing Rd bridge Ferrisburgh
LOC7.8 Middlebrook Rd (North) Ferrisburgh
LOC4.3 Route 7 Bridge Ferrisburgh
MDC1.2 Wing Rd./Middlebrook Rd. (South) Ferrisburgh
2011 - Little Otter CreekSummer E.coli Results (MPN/100 mL)
1
10
100
1000
10000
LOC14.4
LOC10
LOC8
LOC7.8
LOC4.3
MDC1.2
Sampling
Stations
Date:
DMF (cfs):
Percentile:
June 1
288
4.3%
July 6
37
38%
August 3
11
73%
VT State Standard = 77 MPN/100 mL
2011 - Little Otter CreekSpring/Summer Turbidity Results (NTUs)
0.1
1
10
100
1000
10000
LOC14.4
LOC10
LOC8
LOC7.8
LOC4.3
MDC1.2
Sampling
Stations
Date:
DMF
(cfs):
April 6
313
3.7%
July 6
37
38%
August 3
11
73%
May 4
287
4.3%
June 1
288
4.3%
VT State Standard = 10 NTUs
2010 – 2011Focus Watershed
8/2/2019 ACRWC Little Otter Creek - 2011 Water Quality Summary
http://slidepdf.com/reader/full/acrwc-little-otter-creek-2011-water-quality-summary 2/2
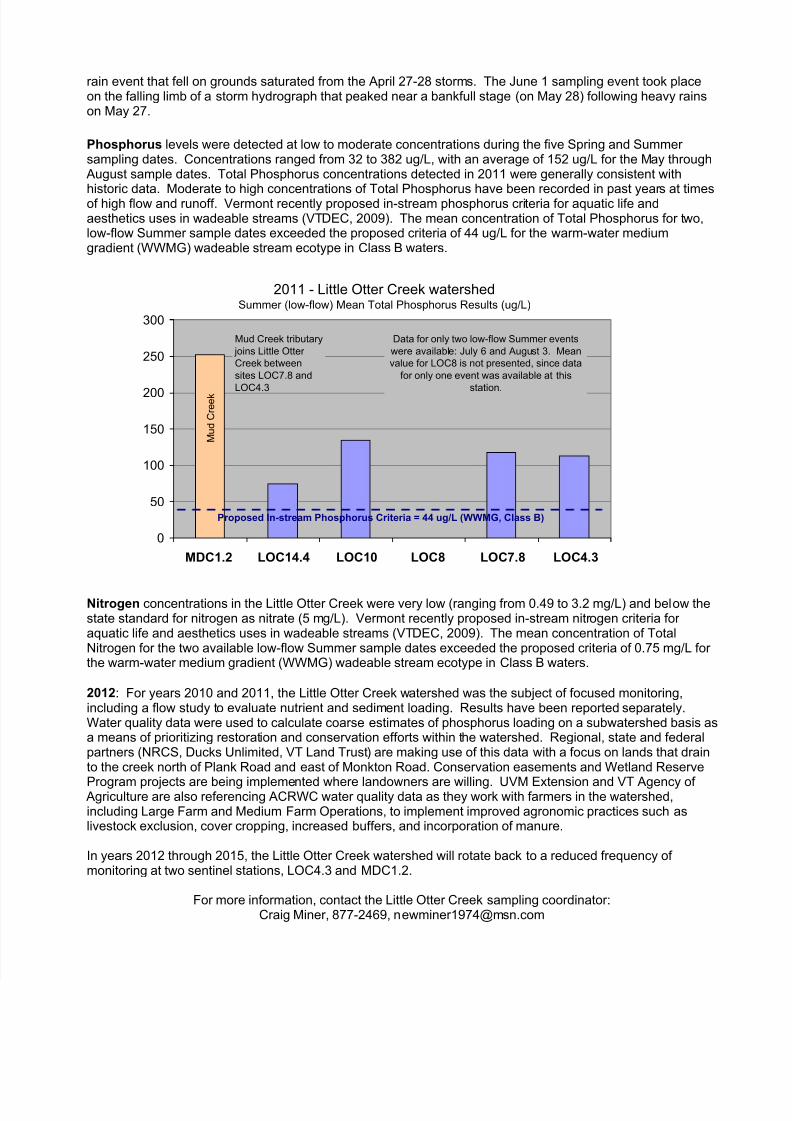
2011 - Little Otter Creek watershedSummer (low-flow) Mean Total Phosphorus Results (ug/L)
0
50
100
150
200
250
300
MDC1.2 LOC14.4 LOC10 LOC8 LOC7.8 LOC4.3
Proposed In-stream Phosphorus Criteria = 44 ug/L (WWMG, Class B)
Mud Creek tributary
joins Little Otter
Creek between
sites LOC7.8 and
LOC4.3
M u d C r e e k
Data for only two low-flow Summer events
were available: July 6 and August 3. Mean
value for LOC8 is not presented, since data
for only one event was available at this
station.
rain event that fell on grounds saturated from the April 27-28 storms. The June 1 sampling event took placeon the falling limb of a storm hydrograph that peaked near a bankfull stage (on May 28) following heavy rainson May 27.
Phosphorus levels were detected at low to moderate concentrations during the five Spring and Summer sampling dates. Concentrations ranged from 32 to 382 ug/L, with an average of 152 ug/L for the May through
August sample dates. Total Phosphorus concentrations detected in 2011 were generally consistent withhistoric data. Moderate to high concentrations of Total Phosphorus have been recorded in past years at timesof high flow and runoff. Vermont recently proposed in-stream phosphorus criteria for aquatic life andaesthetics uses in wadeable streams (VTDEC, 2009). The mean concentration of Total Phosphorus for two,low-flow Summer sample dates exceeded the proposed criteria of 44 ug/L for the warm-water mediumgradient (WWMG) wadeable stream ecotype in Class B waters.
Nitrogen concentrations in the Little Otter Creek were very low (ranging from 0.49 to 3.2 mg/L) and below thestate standard for nitrogen as nitrate (5 mg/L). Vermont recently proposed in-stream nitrogen criteria for aquatic life and aesthetics uses in wadeable streams (VTDEC, 2009). The mean concentration of TotalNitrogen for the two available low-flow Summer sample dates exceeded the proposed criteria of 0.75 mg/L for the warm-water medium gradient (WWMG) wadeable stream ecotype in Class B waters.
2012: For years 2010 and 2011, the Little Otter Creek watershed was the subject of focused monitoring,including a flow study to evaluate nutrient and sediment loading. Results have been reported separately.Water quality data were used to calculate coarse estimates of phosphorus loading on a subwatershed basis asa means of prioritizing restoration and conservation efforts within the watershed. Regional, state and federalpartners (NRCS, Ducks Unlimited, VT Land Trust) are making use of this data with a focus on lands that drainto the creek north of Plank Road and east of Monkton Road. Conservation easements and Wetland Reserve
Program projects are being implemented where landowners are willing. UVM Extension and VT Agency of Agriculture are also referencing ACRWC water quality data as they work with farmers in the watershed,including Large Farm and Medium Farm Operations, to implement improved agronomic practices such aslivestock exclusion, cover cropping, increased buffers, and incorporation of manure.
In years 2012 through 2015, the Little Otter Creek watershed will rotate back to a reduced frequency of monitoring at two sentinel stations, LOC4.3 and MDC1.2.
For more information, contact the Little Otter Creek sampling coordinator:Craig Miner, 877-2469, [email protected]