acronyms and abbreviations - department of trade and · pdf file ·...
TRANSCRIPT

Acronyms and Abbreviations
AEP Academic Engagement Plan
ARSO African Organisation for Standardisation
BSC Balanced Scorecard
CRM Customer Relationship Management
CASCO Conformity Assessment Standards Committee
DoE Department of Energy
ERP Enterprise Resource Planning
GDP Gross Domestic Product
ICASA Independent Communications Authority of South Africa
ICT Information and Communications Technology
IEC International Electrotechnical Commission
IPAP Industrial Policy Action Plan implemented by the dti to achieve the NIPF
ISO International Organization for Standardization
MISS Minimum Information Security Standard
LIMS Laboratory Information Management System
NDP National Development Plan
NEHAWU National Education, Health and Allied Workers’ Union
NETFA National Electrical Testing Facility
NIPF National Industrial Policy Framework
NRCS NationalRegulatorforCompulsorySpecifications
OHSA Occupational Health and Safety Act
SABS South African Bureau of Standards
SADC Southern African Development Community
SADCSTAN South African Development Community Cooperation in Standardization
SANS South African National Standards
SEDA Small Enterprise Development Agency
SME Small and Medium Enterprises
SMME Small, Medium and Micro Enterprises
TC Technical Committee
the dti The Department of Trade and Industry
ACRONYMS AND ABBREVIATIONS PREFACE 03Foreword by the Chairperson 04Overview by the CEO 06
PART A 1.Strategic Overview 08
1.1 Vision 081.2 Mission 081.3 Values 081.4 Legislative Mandates 081.5 Governance Structures 09
2.Situational Analysis 15
2.1 Service Delivery Environment 152.2 Impact to the economy 152.3 Review of Revenue and Expenditure 162.4 Economic Outlook 172.5 SWOT Analysis 18
3. Strategic priorities 22
4. Strategic Objectives 22
4.1 Growth 224.2 Customer Centricity 234.3 Productivity 234.4 Competent and Empowered Employees 244.5 Alignment to the dti 24
PART B 5. Divisional Overview 27 5.1 Standards 275.2Certification 295.3 Training 305.4 Testing 315.5 SABS Design Institute 325.6 Internal Services 32
PART C 6. Organisational Performance Indicators 37
PART D 7. Financial Plan 44
7.1 Statement of Financial Performance 447.2Statementoffinancialposition 487.3Projectedcashflowstatement 49
Table of Contents
01

8. Matenality Statement 50
PART E 9. Other Plans 53
9.1 Fraud Prevention Plan 539.2 Risk Management Plan 539.3 Strategic Risk Register 539.4 Information Technology Plan 56 9.5 Asset Management Plan 57
ANNEXURE A: DESCRIPTION OF THE PLANNING PROCESS 58ANNEXURE B: INDICATOR PROFILES 62
02
Preface
03
ItisherebycertifiedthatthisCorporatePlanwasdevelopedbyManagementoftheSouthAfricanBureauofStandardsundertheguidanceofitsBoardandaccuratelyreflectstheperformancetargetsthattheExecutive will endeavour to achieve given the resources available in the 2016/17 – 2018/19 budget.
---------------------------------Ian PlaatjesExecutive: Corporate Services
---------------------------------Boitumelo MosakoChiefFinancialOfficer
---------------------------------Boni MehlomakuluChiefExecutiveOfficer
---------------------------------Jeff MolobelaChairman of the Board

Foreword by the Chairperson
The recent emissions testing scandal in the United States, in which a global motor vehicle manufacturer admitted to employing technological deception to bypass environmental regulations for millions of its diesel-powered vehicles, serves as a timely reminder of the critical (and often under-valued) role that standards, testing and certification play in our daily lives and well-being. While the manufacturer deliberately flouted emissions regulations that protect the environment, the fact that those regulatory controls were so easily bypassed and that the deception was uncovered by a third party rather than the regulator is of great concern.
In Durban, a businessman was charged with culpable homicide when the roof of a mall that was being constructed collapsed, killing 2 people and injuring 29. The enquiry into the disaster concluded that the provisions of the building regulations were not complied with and that the court order to halt the construction, issued days before the collapse, was completely ignored.
Developing robust standardisation protocols and procedures, which close loopholes and comprehensively fulfil the protective function for which they are designed, is thus an on-going challenge for all standardisation bodies, including the SABS.
The South African economy continues to be beset by a number of challenges, amongst others, the looming budget deficit, downgrading by credit rating agencies, student protests resulting in a freeze in university fee increases, industrial action, high unemployment rate with estimated 49% youth unemployment at the end of 2014, skills shortages, weak demand from trading partners, low GDP growth rates estimated to below 1.5% as well as inadequate energy supply. While the government continues to look at systematic challenges hampering economic growth, public entities are being called upon to make a meaningful socio-economic impact and align themselves to national policies.
At the SABS, a good foundation has been laid and achievements over the last five years include, amongst others, the development of capabilities to test new products in line with key government programmes, implementation of new schemes such as Local Content Verification and developing the SABS Design Institute into a national centre of excellence that improves the competitiveness of South African products as well as growing entrepreneurship and industrialisation. The organisation has had three successive years of clean financial audit by the Auditor-General and five years of steady growth. Focus in the next three years is on building more trust in the products that we offer. This means consistently ensuring timely delivery of services, building robust systems and processes that enforce rightcontrolsandaretraceable,continuouslydevelopingourtechnicalknow-howanddealingeffectivelywith non-compliance to governance.
The role of ICT is crucial in transforming the SABS into a service provider that is driven by customer service excellence. The ICT Transformation Programme is already under way and seeing it through to completion will be one of the most important milestones in our journey towards this transformation in the next three years.
04

The effort invested in forging strategic partnerships with regulators and public sector entities will intensify in order to provide services of a high standard in a more sustainable manner. Focus is on improving alignment of standardisation activities to national imperatives in order to maximise the impact of the SABS on the South African economy.
The progress that is being made towards organisational renewal and sustainable growth is satisfactory and through our collective effort with the Board, the CEO and management, I am confident that the SABS is being steered into a bright new path. We are grateful to our shareholder, the dti, for their continued support.
-----------------------------------Jeff MolobelaChairperson of the SABS Board
Foreword by the Chairperson
05
Overview by the CEO
It is my pleasure to present this Corporate Plan for the South African Bureau of Standards, which covers the period 2016/17 to 2018/19. The plan builds onto the foundation of organisational renewal strategy of 2010 which was aimed at repositioning the SABS beyond its regulatory history. The emphasis over thelastfiveyearswasondiversifyingservices,connectingwithcustomersandstakeholders,improvinggovernance and operational efficiencies as well as on empowering our employees to contribute to the success of the organisation.
This plan is centred around the organisational renewal programmes with a greater focus on achieving impact from investments over the last five years. Performance will be measured using the Balanced Scorecard (BSC) that has the four pillars of Growth, Customer Centricity, Productivity as well as Competent and Empowered Employees.
GrowthA number of milestones were achieved in the last five years, including:• TheestablishmentoftheEconomicImpactUnittofacilitatethedeliveryofstandardsthathave an overall net benefit to the economy;• Thedevelopmentofcapabilitiestotestnewproductsinlinewithkeygovernmentprogrammes including the testing of set-top boxes to support the digital migration project;• ImplementationofnewCertificationschemessuchasLocalContentVerification;• Improvementinthecollaborationwithinternationalstandardsbodies,especiallyintherestof Africa with defined action plans on capacity building projects; and • Developingcapacity,throughtheSABSDesignInstitute,tosupportthegovernment’spro grammes to grow entrepreneurship and industrialisation, especially amongst the youth.
In the last financial year, the delivery of standardisation services into the economy was increased as highlighted by the number of home-grown standards published that exceeded the annual target of 225 to reach 232, a total of 58 entrepreneurs who were assisted at the SABS Design Institute through various SMME development projects as well as the development of two new schemes and three training courses. Year-on-year growth in revenue was 8% and this achievement affords the SABS the ability to meet its operating costs as well as to reinvest for greater service delivery.
In the next three years the standards development processes will be aligned to the needs of the economy and plans to become a trusted partner to the government and industry bodies will be intensified. Focus will also be on developing new products and services in order to intensify the impact of standardisation in the South African economy.
Customer CentricityImproving customer centricity is critical to the SABS as it is an imperative to transition from the regulatory mindset of the pre-2008 era into a service oriented organisation. Over the last five years, a number of systems were implemented, including the Customer Relationship Management (CRM) tool for customer queries and the upgrade to the Standards Webstore that resulted in the centralisation of customer information and an improvement in the quality of customer engagement and information providedthroughthesesystems.Thebenefitsthatcanbederivedfromtheseinitiativeswillbemaximised.Building trust requires the acceleration of programmes to improve customer and stakeholder experiences across all services. Through consolidating all our efforts on customer service excellence under one executive leadership in the Enterprise Development division, the execution of this programme will be prioritised in the next three years.
06
Overview by the CEO
ProductivityIncreasing operational efficiencies is another imperative to enhancing service delivery and turnaround times for standardisation services to have greater impact on the economy. Key initiatives that will deliver this capability include technology enablement through the ICT transformation as well as the laboratory upgrade programmes.
ICT is fundamental to our ability to deliver consistent, reliable and measurable services to our customers. In the next three years, focus will be on the execution of a business and process modernisation pro-gramme using ICT that will transform all facets of the business. This modernisation will result in an improved execution of our governance processes and controls that are imperative for an organisation such as the SABS that sells trust and integrity.
Developing an enhanced capability to offer full-specification testing for regulated products will also be a priority over the next three years. The laboratory reorganisation project that is looking at matching external market demand to internal capacity to guide the allocation of resources to the laboratories is under way. The project will, as a key outcome, also look at creating partnerships with other testing facilities as a means to close some of the capability or capacity gaps identified.
Competent and Empowered EmployeesThe greatest asset of our organisation is the skills and competencies of our employees. As a technical institute we require technical expertise to deliver on our mandate and over the years various initiatives have been put in place to develop and retain talent, including:• TheimplementationoftheTalentManagementStrategyandSuccessionPlanningthatwas aligned with the personal developmental needs as well as the requirements of the organisation:• ACompetencyDevelopmentFrameworkthatfacilitatedthedevelopmentofskills,especially those in standard writing, testing and auditing; and• ALeadershipDevelopmentFrameworktoaddressdeficienciesinmanagerialandleadership competencies.
Focus in the next three years is on executing programmes that will expose our technical experts to best practice and on executing mechanisms to further guide the whole organisation towards a customer-centric culture. To cement our programmes towards a highly skilled organisation that sells trust and impartiality, the SABS employees need to truly embrace the values of the organisation that include integrity, accountability and customer centricity. The success of all programmes depends to a great extent on this. The executive management remains committed to building excellence in all areas of our operations. We are grateful for the Board for their deep passion and commitment to the SABS. The heightened level of engagement by the Board with the programmes of the organisation has inspired the executive team to achieve more for the SABS. We are challenged and supported with the same level of passion.
-----------------------------------Boni Mehlomakulu, PhDChief Executive Officer
07

PART A
1.1 Vision
To be the trusted standardisation and quality assurance service provider of choice.
1.2 Mission
The SABS provides standards and conformity assessment services to contribute towards the efficient functioning of the economy.
1.3 Values
As the SABS transforms and moves towards a culture of high performance in delivering standardisation services, it is guided by the following values:
• Impartiality• Innovation• Accountability• Integrity• Quality• CustomerCentricity
1.4 Legislative Mandates
The SABS is the national standardisation body in South Africa established in terms of the Standards Act No. 24 of 1945 and continues to exist in accordance with the amended Standards Act, No. 08 of 2008, to:
• Develop,promoteandmaintainSouthAfricanNationalStandards(SANS);• Promotequalityinconnectionwithcommodities,productsandservices;and• Renderconformityassessmentservicesandassistinmattersconnectedtherewith.
The promulgation of the revised Standards Act of 2008 resulted in the exit of the regulatory authority of the SABS and the establishment of a separate entity responsible for the administration of compulsory specifications in the interests of public health, public safety and the public environment. This entity, the National Regulator for Compulsory Specifications (NRCS), was established in terms of the NRCS Act of 2008 and also falls under the Department of Trade and Industry. The rationale for the separation was to remove the potential conflict of interest in the SABS value chain.
1. Strategic Overview
08

1.5 Governance Structures
The SABS is primarily mandated to provide standardisation services by the Standards Act No. 24 of 1945, as amended in 2008 (No. 8 of 2008). In terms of governance, the organisation must comply to the legislated prescripts included in the Public Finance Management Act, (Act No.1 of 1999) (PFMA), the National Treasury Guidelines for Public Entities 2014 and the Companies Act (Act No. 71 of 2008). In addition, the SABS is guided by the South African Code of Corporate Practices and Conduct, as recommended in the King Report on Corporate Governance (King III).
The Department of Trade and Industry (the dti) is the Executive Authority of the SABS. In terms of the Treasury Regulations, the SABS, together with the Executive Authority, sign a Shareholder Compact annually that sets strategic objectives and clarifies roles and responsibilities, including that of the Board.
1.5.1 Composition of the Board of Directors
The size of the Board is prescribed in section 6 (2) of the Standards Act, 2008 (Act No. 8 of 2008), which requires a minimum of seven (7) and a maximum of nine (9) members, appointed by the Shareholder. Members may not serve more than two terms of five years each.
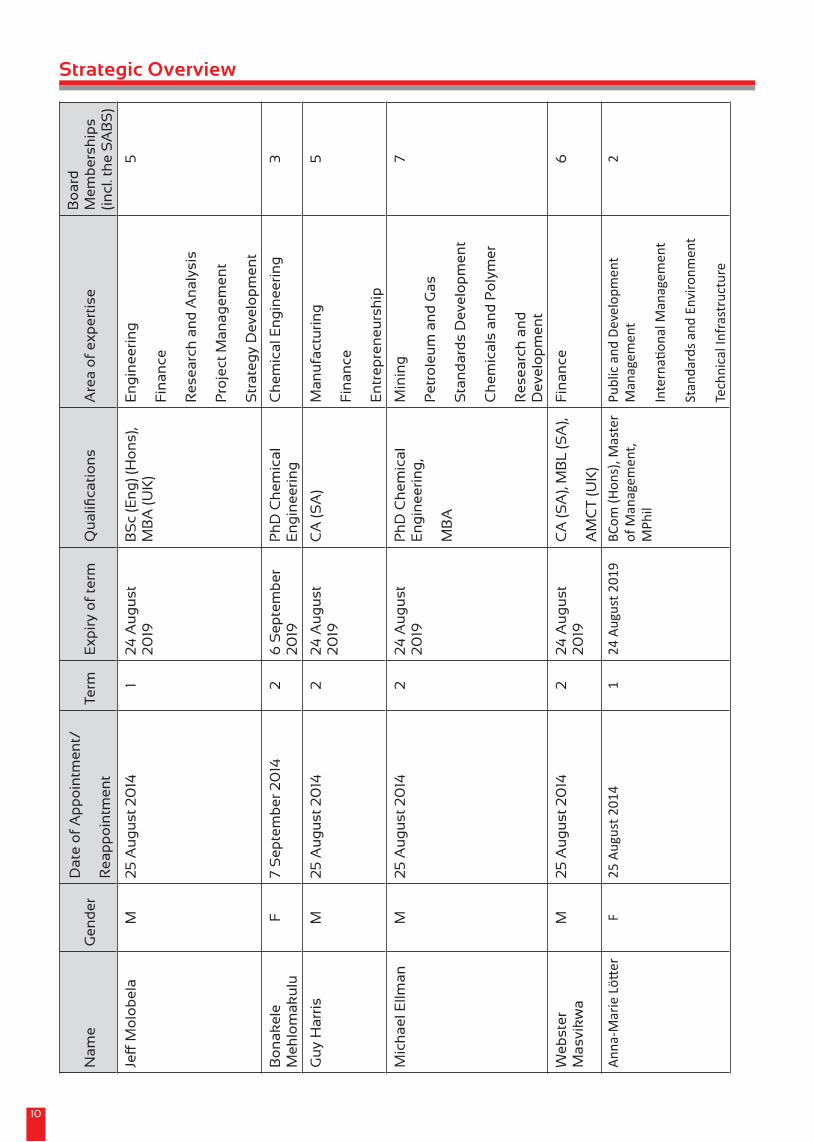
In line with the recommendations of King III, the SABS has a unitary Board structure, comprising seven independent non-executive members, one non-executive member and one executive member. In assessing the status of members, the principles as set out in King III are applied. The table below re-flects current members of the board.
Strategic Overview
09
Nam
eG
end
erD
ate
of
Ap
po
intm
ent/
Rea
pp
oin
tmen
tTe
rmE
xpir
y o
f te
rmQualifica
tions
Are
a o
f ex
per
tise
Bo
ard
M
emb
ersh
ips
(incl
. th
e S
AB
S)
JeffM
olobela
M2
5 A
ug
ust
20
141
24
Au
gu
st
20
19B
Sc
(En
g) (
Ho
ns)
, M
BA
(UK
)E
ng
inee
rin
g
Fin
ance
Res
earc
h a
nd
An
alys
is
Pro
ject
Man
agem
ent
Str
ateg
y D
evel
op
men
t
5
Bo
nak
ele
Meh
lom
aku
luF
7 S
epte
mb
er 2
014
26
Sep
tem
ber
2
019
Ph
D C
hem
ical
E
ng
inee
rin
gC
hem
ical
En
gin
eeri
ng
3
Gu
y H
arri
sM
25
Au
gu
st 2
014
22
4 A
ug
ust
2
019
CA
(SA
)M
anu
fact
uri
ng
Fin
ance
En
trep
ren
eurs
hip
5
Mic
hae
l Ellm
anM
25
Au
gu
st 2
014
22
4 A
ug
ust
2
019
Ph
D C
hem
ical
E
ng
inee
rin
g,
MB
A
Min
ing
Pet
role
um
an
d G
as
Sta
nd
ard
s D
evel
op
men
t
Ch
emic
als
and
Po
lym
er
Res
earc
h a
nd
D
evel
op
men
t
7
Web
ster
M
asvi
kw
aM
25
Au
gu
st 2
014
22
4 A
ug
ust
2
019
CA
(SA
), M
BL
(SA
),
AM
CT
(UK
)
Fin
ance
6
Anna
-Mar
ie L
ötter
F25
Aug
ust 2
014
124
Aug
ust 2
019
BCom
(Hon
s), M
aste
r of
Man
agem
ent,
MPh
il
Publ
ic a
nd D
evel
opm
ent
Man
agem
ent
Inte
rnati
onal
Man
agem
ent
Stan
dard
s and
Env
ironm
ent
Tech
nica
l Inf
rast
ruct
ure
2
Strategic Overview
10

Elek
anya
ni N
dlov
uF
25 A
ugus
t 201
41
24 A
ugus
t 201
9BS
c
(Ele
ctric
al
Engi
neer
ing)
Elec
tric
al E
ngin
eerin
g
Tech
nica
l Inf
rast
ruct
ure
and
Gove
rnan
ce
Risk
Man
agem
ent
Stra
tegy
Dev
elop
men
t
2
Niv
ashn
ee
Nar
aind
ath
F25
Aug
ust 2
014
124
Aug
ust 2
019
BA, L
LB, L
LM
Dipl
oma
in
Nuc
lear
La
w (F
ranc
e)
Adm
itted
Atto
rney
Lega
l: Li
tigati
on,
draft
ing
of
com
mer
cial
co
ntra
cts,
le
gal
opin
ions
Corp
orat
e Go
vern
ance
Nuc
lear
, Em
ploy
men
t and
Com
mer
cial
Law
Lega
l Com
plia
nce
Risk
Man
agem
ent
1
Strategic Overview
11

1.5.2 Committees of the Board
The Board established 5 committees to assist in discharging its responsibilities.
Audit and Risk Committee
The Audit and Risk Committee oversees compliance with all legal and regulatory requirements as necessary under South African legislation, and applies the corporate governance principles for audit committees as required by King III. During the period under review, the Committee revised its terms of reference in accordance with the recommendations contained in King III. The Board subsequently approved the revised terms of reference.
The Committee comprised four independent non-executive directors, the majority of whom have the requisite financial skills and experience to fulfil their duties on the Committee. The Chief Executive Officer,theChiefFinancialOfficer,andrepresentativesofinternalauditaswellastheGroup’sexternalauditors attended committee meetings by invitation.
The Committee is, amongst others, mandated to review the effectiveness of internal controls, ensure satisfactory standards of governance and compliance, maintain oversight of financial results and integrated reporting, and ensure that the Group has an effective policy and plan for risk management, including risk control systems. In this regard, the Committee maintains oversight over financial reporting risks, internal financial risks as well as fraud and IT risks, as they relate to financial reporting.
Finance and Investment Committee
The Finance and Investment Committee comprises five non-executive members. The Chief Executive Officer and the Chief Financial Officer attend meetings by invitation. The Committee’s mandate is to:• EnsurethatthedailyoperationalcashflowneedsoftheSABSwerebeingmet;• Ensurethattherearesufficientavailablefundstoallowforanyunforeseenexpensesorother cash flow needs; • Provideformedium-andlong-termcapitalexpenditure;• Provideforthepost-retirementmedicalliabilityandanyotherspecificliabilities:and• ReviewallmaterialcapitalinvestmentsrelatingtopropertyandtheICTStrategy.
Social and Ethics Committee
The Social and Ethics Committee comprises four non-executive members. As required by the Companies Act, 2008 (Act No. 71 of 2008) and King III, this Committee oversees and monitors activities in relation to social and economic development, corporate citizenship and ethical behaviour, stakeholder and consumer relations as well as safety, health and environmental issues at the SABS.
HR and Remuneration Committee
The HR and Remuneration Committee comprises four non-executive members appointed by the Board. The Chief Executive Officer and the Executive Human Capital Development attend meetings but recuse themselves when their remuneration and performance are discussed.
The Committee assists the Board in the development of compensation policies, plans and performance goals, as well as specific compensation levels for the SABS. The committee annually manages the Board’s evaluation of the performance of the Executive Team.
Strategic Overview
12
Nominations CommitteeThe Nominations Committee comprises three non-executive directors and assists the Board by ensuring that, amongst others:
• AformalprocessisestablishedforappointingmembersoftheBoardaswellasthe Chief Executive Officer and the Executive Management team;• SuccessionplansforBoardmembers,theChiefExecutiveOfficerandExecutiveManagement are in place;• Aformalinductionprogrammefornewmembersisdevelopedandimplemented;• Continuousprofessionaldevelopmentprogrammesareimplementedformembers;and• Theperformanceofmembersisconsideredshouldtheirtermsexpireandreappointmentis recommended.
1.5.3 The Executive Committee
The CEO has appointed a seven-member Executive Committee (EXCO) that assists in overseeing and managing the day-to-day running of the organisation. The CEO ensures that the relevant legislation and regulations are adhered to, and that adequate internal financial control systems are in place to provide reasonable certainty in respect of the completeness and accuracy of accounting records, the integrity and reliability of financial statements and the safeguarding of assets.
The performance of members of the Executive Committee is evaluated against their agreed performance contracts, which are aligned with the Organisational Scorecard, and is annually recommended by the HR and Remuneration Committee for approval by the Board.The Executive Committee comprised the following members:
• ChiefExecutiveOfficer:BonakeleMehlomakulu(ChairpersonoftheExecutiveCommittee)• ChiefFinancialOfficer:BoitumeloMosako• ExecutiveCertification:FrankMakamo• ExecutiveTesting:KatimaTemba• ExecutiveStandards:SadhvirBissoon• ExecutiveCorporateServices:IanPlaatjes• ExecutiveHumanCapitalDevelopment:ZaneMoosa
Strategic Overview
13

1.5.4 Organisation structure
the
dti
Exe
cuti
ve: E
nte
rpri
se
Dev
elo
pm
ent
New
Exe
cuti
ve: S
tan
dar
ds
S B
isso
on
Exe
cuti
ve: T
esti
ng
K T
emb
aExe
cutive
:Certific
ation
F M
akam
oChiefFinan
cialO
ffice
rB
Mo
sak
oE
xecu
tive
: Hu
man
Cap
ital
Z M
oo
saE
xecu
tive
: C
orp
ora
te S
ervi
ces
I Pla
atje
s
Go
vern
ance
Inte
rnal
Au
dit
,R
isk
, Co
mp
lian
ce a
nd
Acc
red
itat
ion
Man
agem
ent
Au
dit
& R
isk
Co
mm
itte
e o
f th
e B
oar
dB
oar
d o
f D
irec
tors
Go
vern
ance
Co
mp
any
Sec
reta
rial
Ch
ief
Exe
cuti
veB
Meh
lom
aku
lu
Strategic Overview
14
2. Situational Analysis
The SABS operational environment is influenced by a number of external and internal factors.
2.1 Service Delivery Environment
The SABS, as a national standardisation body that forms part of the government’s technical infrastructure organisations, is an enabler for growth in the economy. While many external factors pose challenges to the organisation, the SABS of today has many opportunities to thrive. The growth and sustainability of the SABS partly lies in the use of South African National Standards and the available conformity assessment infrastructure at the SABS in the procurement of goods and services by all government entities. The local industry has suffered greatly from procurement practices that specify foreign standards.
The role of the SABS in the development of national standards is to guide the agenda and prioritise activities to balance the standards development needs of different sectors of the industry against national policies. Furthermore the SABS must take the lead in using standardisation to address, amongst others, key execution challenges across all sectors of the government to demonstrate a practical response to the true needs of society. The manner in which new work items are generated in the standards development process require an overhaul and must be informed by a broader range of requirements and policies. This implies that the SABS Standards division must achieve greater alignment with national priorities and industry needs, Testing must be upgraded to support priority sectors and greater collaboration with regulators must be prioritised.
The SABS must be relentless in maintaining its reputation as a trusted quality assurance partner in order to support growth in the economy. Practically, this means working tirelessly to ensure timely delivery of services, continuous development of technical know-how, implementing robust systems andprocesses,recruitmentofcompetentemployeesaswellasdealingeffectivelywithnon-complianceto governance. The promise of trust will give regulators and industry bodies comfort in putting their reliance on the services of the SABS.
2.2 Impact on the economy The SABS forms an important part of the South African technical infrastructure organisations known asStandardsQualityAccreditationMetrology (SQAM)andprovidesstandardisationservices tofacilitate the achievement of economic and developmental objectives of the government. The SABS is mandated to develop, promote and maintain South African National Standards and conduct conformity assessment services related to the standards developed.
In pursuing this mandate the SABS has steadily grown the number of national standards developed and uses its leadership positions in regional and international bodies to advance standardisation objectives that benefit the South African economy and the broader region. Amongst key leadership positions that the SABS holds are:• MembershipoftheCounciloftheInternationalOrganizationforStandardization(ISO);• MembershipoftheISOTechnicalManagementBoard;• ChairmanshipoftheCommitteeonConformityAssessment(CASCO)ofISO;• MembershipoftheInternationalElectrotechnicalCommission(IEC)CouncilBoard;and• TreasureroftheAfricanOrganisationforStandardisation(ARSO).
Strategic Overview
15

In terms of the of the conformity assessment mandate, the SABS has an established laboratory complex and has over the years been developing capacity and capability to meet the needs of regulators as well as the market.
The SABS Design institute, as an important component of the standardisation value chain, is increasingly becoming prominent as a centre of excellence for design and innovation and has demonstrated success in deploying design capability to support the achievement of national economic policy goals.
2.3 Review of Revenue and Expenditure
Revenue has been growing steadily over recent years from the time when the SABS Act of 1945 was amended in 2008. An organisational renewal strategy that was developed in 2010 was aimed at implementing post-regulatory plans that would break performance out of years of steady decline in revenue as well as to respond to the reduction in real terms in funding from parliament. The strategy challenged the organisation to achieve R1 billion in total revenue by 2016 to drive the SABS towards sustainable growth. It was a goal that required improved operational efficiency, customer service and people development from all parts of the organisation. It featured an estimated average annual growth in income of 13% over the period. Year-on-year growth peaked at 15% in 2011/12, indicating that the SABS can in fact achieve growth in revenue.
Revenue in 2007/08 and 2008/09 includes levies of R99 million and R47 million respectively. These levies were collected for the last time in 2008 when the legislation was amended.
-1% -2%-4% -5% 4% 8% 2% 8% 18%15% 9% 9% 6%
Strategic Overview
16
8%

Between 2010 and 2015:• Totalrevenuegrewby43%andaveraged9%perannumovertheperiod;• Certificationrevenuegrewby86%andaveraged17%perannum;• Testingrevenueshrunkby6%,duepartlytoincomefromregulatorysamplesthataresubjectto supply chain restrictions;• Trainingrevenuegrewby62%andaveraged12%perannum;and• Standardssalesgrewby52%andaveraged10%perannum;
The rate at which expenditure grew over the period (relative to revenue) was influenced by both the investment into new capacities in the organisation and a 3-year wage agreement with the National Education,HealthandAlliedWorkers’Union(NEHAWU)thatwaseffectivefrom2013/14.
RevenueofR645.7millioninthefirstyearoftheplanningperiodisprojectedtogrowby7%,graduallygrowing to R759.1 million, thereby translating to a double digit cumulative growth over the three year planning period.
2.4 Economic Outlook
Global economic growth is projected to reach 3.8% in 2016.1 The domestic economic growth outlook has deteriorated with the forecast GDP growth rate revised down to 0.9% for 2016 mainly due to exchange rate and food price factors. 2 Constraints in electricity supply continue to threaten industrial output, particularly in mining and manufacturing, and drought conditions continue to reduce agricultural output.3
The country’s currency, which is generally viewed as the share price of a country, is expected to remain weak.Therandexperiencedasignificantdepreciationinthesecondhalfof2015andremainsvolatileinresponse to domestic and global developments due to negative sentiments towards emerging economies, South Africa’s exposure to commodities, China’s economic slowdown, potential disruptions from higher USA interest rates which are likely to result in higher borrowing costs, and internal challenges that include a constrained outlook in the manufacturing and mining sectors.
Fiscal resources remain constrained and government will work within these resource constraints to continue supporting social and economic development in a weak economic environment.4 Investment in infrastructure by government departments and large state-owned enterprises remain priorities over the nextthreeyears.Governmentalsoremainscommittedtodeficit-neutralcapitalfinancingofstate-ownedcompanies in the years ahead. This is evident from the budget cuts on government grants already implementedinthecurrent2015/16financialyear.
Unemployment continues to pose significant challenges, reaching 25.5% in the third quarter of 2015.5 Growth outlook in the manufacturing sector, although recovered somewhat in the third quarter of 2015, remains constrained. The mining sector’s contribution to the GDP is expected to decline following contraction in this sector, while Agriculture – a key labour-intensive sector – is expected to further contract due to the drought. The main boost to the country’s GDP is expected from services which contributed towards increased economic activity in the quarter.
Strategic Overview
17
1. World Economic Outlook, International Monetary Fund, July 2015
2. Monetary Policy Committee Statement 28 January 2016, SARB
3. 2015 Medium Term Budget Policy Statement, October 2015
4. 2015 Medium Term Budget Policy Statement, October 2015
5. QuarterlyLabourForceSurvey(QLFS),3rdQuarter2015,StatisticsSouthAfrica

Potential impact of the domestic outlook on the SABS:The deteriorating domestic outlook could have a negative impact on the SABS revenue sources. The sectors that the SABS is currently servicing are likely to experience a decline in growth in the period ahead. Factors such as the proposed electricity tariffs will contribute towards higher inflation, and higher operational costs for sectors such as mining, agriculture, manufacturing, automotive and retail, will exert pressure on industry growth. These sectors currently utilise the SABS conformity assessment services which generate almost 90% of revenue. A reduced demand for these services will negatively impact the business. Other external factors such as the possible establishment of independent mark schemes that may compete directly with the SABS Mark could see a decrease in Mark holders in favour of the new independent schemes. The depreciating rand will also affect the SABS planned National Electrical Testing Facility (NETFA) recapitalisation programme in the period ahead.
Industry’s inability to accommodate non-core expenses such as training, in an attempt to reduce operational costs, could result in reduced demand for SABS training services and lead to reduced revenue streams for the business. The rolling out of capacity building programmes for SMMEs could be negatively affectedbecausegovernmentresourcesmayberedirectedtootherkeypriorityareassuchaseducationand social services. This could impact on the ability to generate increased revenues due to less investment in SMME development initiatives in various sectors, including government departments and agencies.
Against these tough economic conditions, the double-digit revenue growth rates reflected in this Corporate Plan represent a necessarily aggressive approach to closing the revenue gap created by the reductioninparliamentarygrantfundingduetofiscalconstraints.
2.5 SWOT Analysis
The strengths, weaknesses, opportunities and threats below represent the current state and together with all the analysis in section 5, are used to surface matters that will be addressed in the plan.
2.5.1 Strengths
There are currently a number of capabilities that enable the SABS to perform well and discharge its mandate. The following are highlighted as strengths:• Astandardsdevelopmentcapabilitywithafullspectrumofend-to-endstandardisationservicesin theformofCertification,Training,DesignaswellasTestingandInspections;• SABSisthesoleproviderofcertainspecialisedtestingservicestothemarketandtotheregion;• Accesstoanetworkofregionalandinternationalstandardsbodiestobenchmarkstandardisation best practice; and• Astrongbalancesheetsupportedbygoodassets,includingrealestate.
2.5.2 Weaknesses
A number of internal factors impede the SABS from achieving its objectives, key amongst them are:• Theslowtransitionfromaregulatorytoaserviceorganisationwhichimpactsservicedeliveryand customer services;• Limitedrequisiteskillstodeliversolutionstoadynamicandchangingbusinessenvironment;• Inadequatecapabilitytoconductfulltestingonallcompulsoryspecifications;• Limitedentrepreneurshipandlackofinsightondevelopmentanddeliveryofnewbusiness opportunities;• ICTinfrastructurethathashistoricallybeenneglected,resultinginantiquatedbusinessprocesses;
Strategic Overview
18
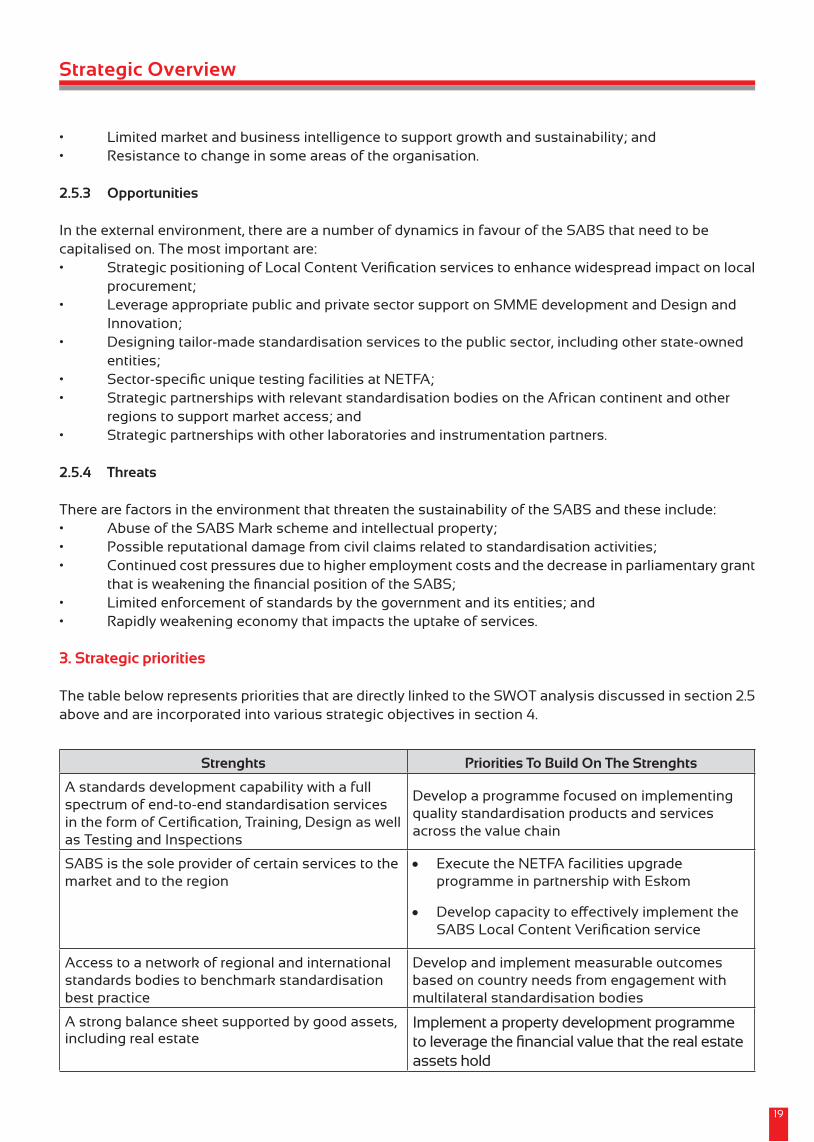
• Limitedmarketandbusinessintelligencetosupportgrowthandsustainability;and• Resistancetochangeinsomeareasoftheorganisation.
2.5.3 Opportunities
In the external environment, there are a number of dynamics in favour of the SABS that need to be capitalised on. The most important are:• StrategicpositioningofLocalContentVerificationservicestoenhancewidespreadimpactonlocal procurement;• LeverageappropriatepublicandprivatesectorsupportonSMMEdevelopmentandDesignand Innovation; • Designingtailor-madestandardisationservicestothepublicsector,includingotherstate-owned entities; • Sector-specificuniquetestingfacilitiesatNETFA;• StrategicpartnershipswithrelevantstandardisationbodiesontheAfricancontinentandother regions to support market access; and• Strategicpartnershipswithotherlaboratoriesandinstrumentationpartners.
2.5.4 Threats
There are factors in the environment that threaten the sustainability of the SABS and these include:• AbuseoftheSABSMarkschemeandintellectualproperty;• Possiblereputationaldamagefromcivilclaimsrelatedtostandardisationactivities;• Continuedcostpressuresduetohigheremploymentcostsandthedecreaseinparliamentarygrant thatisweakeningthefinancialpositionoftheSABS;• Limitedenforcementofstandardsbythegovernmentanditsentities;and• Rapidlyweakeningeconomythatimpactstheuptakeofservices.
3. Strategic priorities
The table below represents priorities that are directly linked to the SWOT analysis discussed in section 2.5 above and are incorporated into various strategic objectives in section 4.
Strategic Overview
Strenghts Priorities To Build On The Strenghts
A standards development capability with a full spectrum of end-to-end standardisation services intheformofCertification,Training,Designaswellas Testing and Inspections
Develop a programme focused on implementing quality standardisation products and services across the value chain
SABS is the sole provider of certain services to the market and to the region
• Execute the NETFA facilities upgrade programme in partnership with Eskom
• DevelopcapacitytoeffectivelyimplementtheSABSLocalContentVerificationservice
Access to a network of regional and international standards bodies to benchmark standardisation best practice
Develop and implement measurable outcomes based on country needs from engagement with multilateral standardisation bodies
A strong balance sheet supported by good assets, including real estate
Implement a property development programme toleveragethefinancialvaluethattherealestateassets hold
19
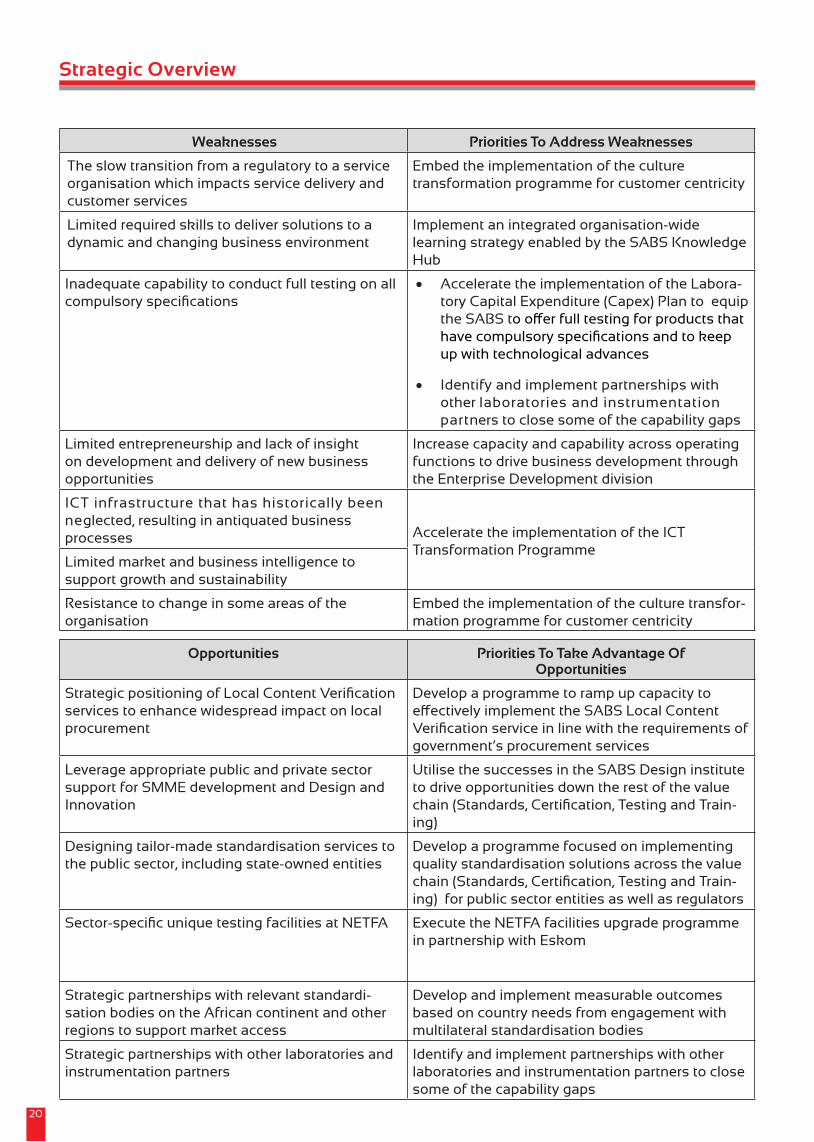
Weaknesses Priorities To Address Weaknesses
The slow transition from a regulatory to a service organisation which impacts service delivery and customer services
Embed the implementation of the culture transformation programme for customer centricity
Limited required skills to deliver solutions to a dynamic and changing business environment
Implement an integrated organisation-wide learning strategy enabled by the SABS Knowledge Hub
Inadequate capability to conduct full testing on all compulsoryspecifications
• Accelerate the implementation of the Labora-tory Capital Expenditure (Capex) Plan to equip the SABS toofferfulltestingforproductsthathavecompulsoryspecificationsandtokeepup with technological advances
• Identify and implement partnerships with other laboratories and instrumentation partners to close some of the capability gaps
Limited entrepreneurship and lack of insight on development and delivery of new business opportunities
Increase capacity and capability across operating functions to drive business development through the Enterprise Development division
ICT infrastructure that has historically been neglected, resulting in antiquated business processes Accelerate the implementation of the ICT
Transformation ProgrammeLimited market and business intelligence to support growth and sustainability
Resistance to change in some areas of the organisation
Embed the implementation of the culture transfor-mation programme for customer centricity
Opportunities Priorities To Take Advantage Of Opportunities
StrategicpositioningofLocalContentVerificationservices to enhance widespread impact on local procurement
Develop a programme to ramp up capacity to effectivelyimplementtheSABSLocalContentVerificationserviceinlinewiththerequirementsofgovernment’s procurement services
Leverage appropriate public and private sector support for SMME development and Design and Innovation
Utilise the successes in the SABS Design institute to drive opportunities down the rest of the value chain(Standards,Certification,TestingandTrain-ing)
Designing tailor-made standardisation services to the public sector, including state-owned entities
Develop a programme focused on implementing quality standardisation solutions across the value chain(Standards,Certification,TestingandTrain-ing) for public sector entities as well as regulators
Sector-specificuniquetestingfacilitiesatNETFA Execute the NETFA facilities upgrade programme in partnership with Eskom
Strategic partnerships with relevant standardi-sation bodies on the African continent and other regions to support market access
Develop and implement measurable outcomes based on country needs from engagement with multilateral standardisation bodies
Strategic partnerships with other laboratories and instrumentation partners
Identify and implement partnerships with other laboratories and instrumentation partners to close some of the capability gaps
Strategic Overview
20

Strategic Overview
Threats Priorities To Overcome Threats
Abuse of the SABS Mark scheme and intellectual property
Develop and implement an integrated strategy to manage SABS intellectual property which includes among others the SABS Mark and SANS copyrights
Possible reputational damage from civil claims related to standardisation activities
Develop and implement governance structures that will reinforce compliance to policies and procedures as well as strengthen controls within the business
Continued cost pressures due to higher employment costs and the decrease in parliamentary grant that is weakening the financialpositionoftheSABS
Implement measures to reduce overall operatingcoststobelowinflation
Limited enforcement of standards by the government and its entities.
Continue to lobby the dti to develop more measures to reinforce standardisation in the economy for the common good
Rapidly weakening economy that impacts the uptake of services
• Develop a programme focused on implementing quality standardisation solutions across the value chain for public sector entities as well as regulators
• Increase capacity and capability across operating functions to drive business development through the Enterprise Development division
• Improve communication to stakeholders and focus on informing and re-enforcing the value that the SABS brings to them
• Develop and implement an SABS marketing strategy to enhance the value propositionoftheSABSserviceofferingsto both private and public sectors
21
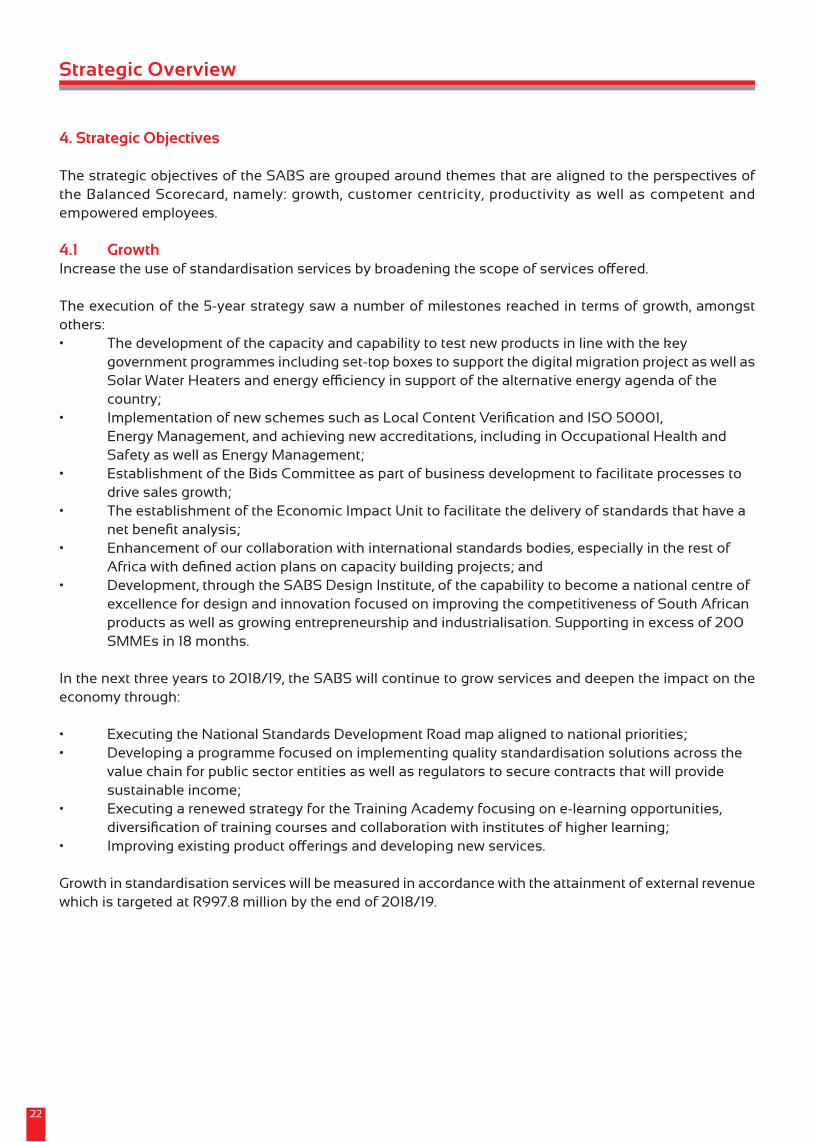
4. Strategic Objectives
The strategic objectives of the SABS are grouped around themes that are aligned to the perspectives of the Balanced Scorecard, namely: growth, customer centricity, productivity as well as competent and empowered employees.
4.1 GrowthIncreasetheuseofstandardisationservicesbybroadeningthescopeofservicesoffered.
The execution of the 5-year strategy saw a number of milestones reached in terms of growth, amongst others:• Thedevelopmentofthecapacityandcapabilitytotestnewproductsinlinewiththekey government programmes including set-top boxes to support the digital migration project as well as SolarWaterHeatersandenergyefficiencyinsupportofthealternativeenergyagendaofthe country;• ImplementationofnewschemessuchasLocalContentVerificationandISO50001, Energy Management, and achieving new accreditations, including in Occupational Health and Safety as well as Energy Management; • EstablishmentoftheBidsCommitteeaspartofbusinessdevelopmenttofacilitateprocessesto drive sales growth;• TheestablishmentoftheEconomicImpactUnittofacilitatethedeliveryofstandardsthathavea netbenefitanalysis;• Enhancementofourcollaborationwithinternationalstandardsbodies,especiallyintherestof Africawithdefinedactionplansoncapacitybuildingprojects;and• Development,throughtheSABSDesignInstitute,ofthecapabilitytobecomeanationalcentreof excellence for design and innovation focused on improving the competitiveness of South African products as well as growing entrepreneurship and industrialisation. Supporting in excess of 200 SMMEs in 18 months.
In the next three years to 2018/19, the SABS will continue to grow services and deepen the impact on the economy through:
• ExecutingtheNationalStandardsDevelopmentRoadmapalignedtonationalpriorities;• Developingaprogrammefocusedonimplementingqualitystandardisationsolutionsacrossthe value chain for public sector entities as well as regulators to secure contracts that will provide sustainable income;• ExecutingarenewedstrategyfortheTrainingAcademyfocusingone-learningopportunities, diversificationoftrainingcoursesandcollaborationwithinstitutesofhigherlearning;• Improvingexistingproductofferingsanddevelopingnewservices.
Growth in standardisation services will be measured in accordance with the attainment of external revenue which is targeted at R997.8 million by the end of 2018/19.
Strategic Overview
22

4.2 Customer Centricity
Put the customer at the forefront of everything we do.
In the lastfiveyears, focuswasplacedon implementing initiativesto improvecustomercentricity.Keyamongst them was leveraging technology to improve customer experience, including:• TheimplementationoftheCustomerRelationshipManagement(CRM)systemthatresulted in greater centralisation of customer information and an improvement in the quality of customer engagement; and • TheimplementationofISOlutionseCommitteesinthestandardsdevelopmentenvironmentto enhance collaboration with external stakeholders.
A number of advisory and consultation forums have been set up as mechanisms to proactively engage withstakeholdersinthedifferentsectorsoftheindustry.Anumberofhighlevelstakeholders,includingthe president, ministers, deputy ministers and other parliamentarians were hosted to showcase the work that the SABS does and to spread knowledge of the important role that the SABS plays in the economy.
Focus in the next three years will be on:• Developingandimplementinganationalstandardisationpromotionprogrammeasmandatedby the Standards Act to increase awareness of standardisation;• DevelopingandimplementinganSABSmarketingstrategytoenhancethevaluepropositionofthe SABSserviceofferingstobothprivateandpublicsectors;• IncreasingtheimpactofdesignservicesbygrowingthenumberofnewSMMEsserviced;• Continuingtoinfluenceandsupportgovernmentpolicyinaddressingsocio-economicgoalswithin the Standardisation and Design agenda.
4.3 Productivity Improve the operational performance of the SABS to enable delivery of quality outputs for customers and the South African economy.In the last few years, technologies were implemented to improve productivity in order to drive improved levels of customer service, including the implementation of the Laboratory Information Management System (LIMS), an online Webstore for the sale of standards, the eCommittees collaboration tool as well as the JD Edwards Lead-to-Revenue module. Focus was also on driving internal services to improve productivity and provide improved levels of service to the operating functions. The following was achieved: • AProcurementstrategy,includingprocessesandprocedurestofullycomplywithPFMA, was implemented. As a result, the SABS was presented with a clean audit award for three consecutive years on the strength of compliance to supply chain processes;• ThefirstphaseoftheICTstrategy,thatrevampedtheentireICTinfrastructureoftheSABS,was completed and focus shifted to implementing business applications such as Enterprise Resource Planning (ERP) to modernise the entire business operation. This is still in progress and will be accelerated.
Focus in the next three years will be on:• DevelopingandimplementinganintegratedstrategytomanageSABSintellectualpropertywhich includes among others the SABS Mark and SANS copyrights; • FurtheraligningStandardsDevelopmentandTestingtonationalimperatives,specificallythe National Development Plan;• ExecutingtheNETFARecapitalisationprogramme;and• ImplementingtherevitalisedICTstrategytomoderniseoperations.
Strategic Overview
23
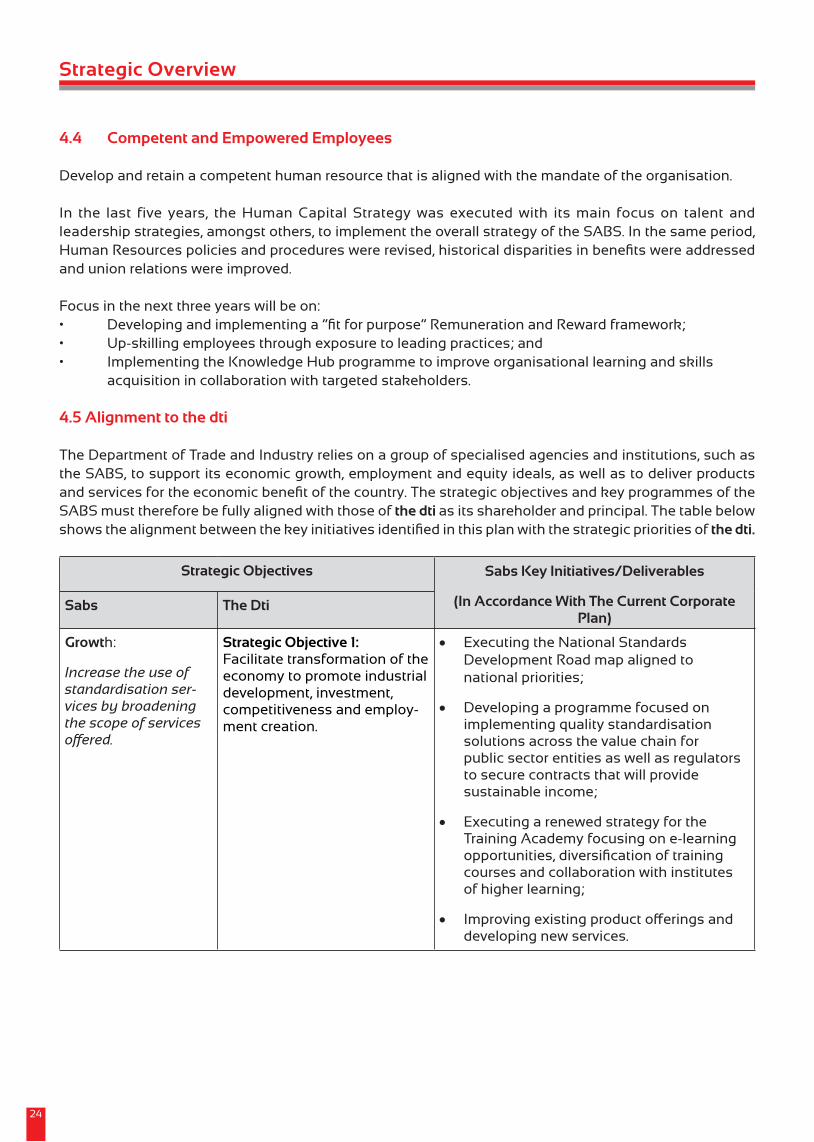
4.4 Competent and Empowered Employees
Develop and retain a competent human resource that is aligned with the mandate of the organisation.
In the last five years, the Human Capital Strategy was executed with its main focus on talent and leadership strategies, amongst others, to implement the overall strategy of the SABS. In the same period, HumanResourcespoliciesandprocedureswererevised,historicaldisparitiesinbenefitswereaddressedand union relations were improved.
Focus in the next three years will be on:• Developingandimplementinga“fitforpurpose”RemunerationandRewardframework;• Up-skillingemployeesthroughexposuretoleadingpractices;and• ImplementingtheKnowledgeHubprogrammetoimproveorganisationallearningandskills acquisition in collaboration with targeted stakeholders.
4.5 Alignment to the dti
The Department of Trade and Industry relies on a group of specialised agencies and institutions, such as the SABS, to support its economic growth, employment and equity ideals, as well as to deliver products andservicesfortheeconomicbenefitofthecountry.ThestrategicobjectivesandkeyprogrammesoftheSABS must therefore be fully aligned with those of the dti as its shareholder and principal. The table below showsthealignmentbetweenthekeyinitiativesidentifiedinthisplanwiththestrategicprioritiesofthe dti.
Strategic Objectives Sabs Key Initiatives/Deliverables
(In Accordance With The Current Corporate Plan)
Sabs The Dti
Growth:
Increase the use of standardisation ser-vices by broadening the scope of services offered.
Strategic Objective 1: Facilitate transformation of the economy to promote industrial development, investment, competitiveness and employ-ment creation.
• Executing the National Standards Development Road map aligned to national priorities;
• Developing a programme focused on implementing quality standardisation solutions across the value chain for public sector entities as well as regulators to secure contracts that will provide sustainable income;
• Executing a renewed strategy for the Training Academy focusing on e-learning opportunities,diversificationoftrainingcourses and collaboration with institutes of higher learning;
• Improvingexistingproductofferingsanddeveloping new services.
Strategic Overview
24

Strategic Overview
Strategic Objectives Sabs Key Initiatives/Deliverables
(In Accordance With The Current Corporate Plan)Sabs The Dti
Customer centricity:
Put the customer at the forefront of everything we do.
Strategic Objective 2: Build mutually beneficial re-gional and global relations to advance South Africa’s trade, industrial policy and economic development objectives.
Strategic Objective 3: Facilitate broad-based economic participation through targeted intervention to achieve more inclusive growth.
Strategic Objective 4: Create a fair regulatory environment that enables investment, trade and enterprise development in an equitable and socially responsible manner.
• Developing and implementing a national standardisation promotion programme as mandated by the Standards Act to increase awareness of standardisation;
• Developing and implementing an SABS marketing strategy to enhance the value propositionoftheSABSserviceofferingsto both private and public sectors;
• Increasing the impact of design services by growing the number of new SMMEs serviced; and
• Continuingtoinfluenceand
support government policy in addressing socio-economic goals within the
Standardisation and Design agenda.
25
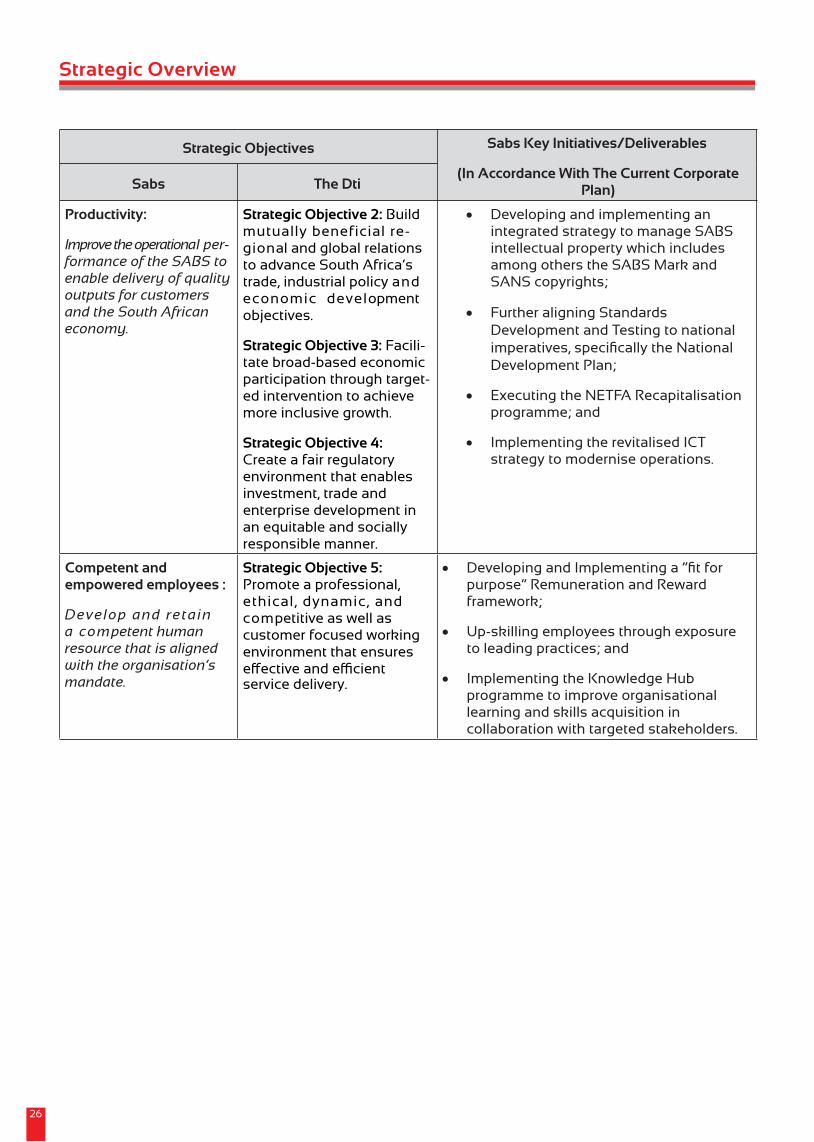
Strategic Objectives Sabs Key Initiatives/Deliverables
(In Accordance With The Current Corporate Plan)Sabs The Dti
Productivity:
Improve the operational per-formance of the SABS to enable delivery of quality outputs for customers and the South African economy.
Strategic Objective 2: Build mutually beneficial re-gional and global relations to advance South Africa’s trade, industrial policy and economic development objectives.
Strategic Objective 3: Facili-tate broad-based economic participation through target-ed intervention to achieve more inclusive growth.
Strategic Objective 4: Create a fair regulatory environment that enables investment, trade and enterprise development in an equitable and socially responsible manner.
• Developing and implementing an integrated strategy to manage SABS intellectual property which includes among others the SABS Mark and SANS copyrights;
• Further aligning Standards Development and Testing to national imperatives,specificallytheNationalDevelopment Plan;
• Executing the NETFA Recapitalisation programme; and
• Implementing the revitalised ICT strategy to modernise operations.
Competent and empowered employees :
Develop and retain a competent human resource that is aligned with the organisation’s mandate.
Strategic Objective 5: Promote a professional, ethical, dynamic, and competitive as well as customer focused working environment that ensures effectiveandefficientservice delivery.
• DevelopingandImplementinga“fitforpurpose”RemunerationandRewardframework;
• Up-skilling employees through exposure to leading practices; and
• Implementing the Knowledge Hub programme to improve organisational learning and skills acquisition in collaboration with targeted stakeholders.
Strategic Overview
26

PART B

5. Divisional Overview
5.1 Standards
As the custodian of South African National Standards (SANS), the SABS is committed to maintaining an effectivestandardsdevelopmentandgovernanceframework,supportedbythecontributionofexpertisefromrelevantnationalstakeholderintereststodeliverfitforpurposetechnicalsolutionsforapplicationby the public and private sector. The development of national standards is an industrialisation and public safety tool geared to contribute to and support national socio-economic development goals. Our membership of international standards organisations such as ISO and IEC provides the SABS with international best practice and benchmarking opportunities for establishing and implementing good standardisation principles, state of the art technological know-how and governance structures for developing SANS.
The division has produced satisfactory performance against key performance indicators and the implementation of strategic projects in the recent past, some of which include the implementation of the ISOlutionseCommitteesplatformforeffectivestakeholdercollaboration,developmentoftheISO9001quality management system, update of the standards development business process and the implementation of departmental productivity tools. These projects were aimed at improving the engagement with all relevantstakeholdersandimprovingoperationalefficienciesinthestandardsdevelopmentenvironment.
Performance highlights include:• Thepublishingof232home-grownstandardsagainstthetargetof225,representinga3%increase year-on-year;• ImplementationofISOlutionseCommitteesandactivationofaccountsbycommitteemembers that reached 81% against a target of 80%; • Completionof89%ofIndustrialPolicyActionPlan(IPAP)commitmentsagainstatargetof80%; and• TheachievementofrevenueofR25.5million,representingan11%year-on-yeargrowth,eventhough this is 9% below target.
Thelegislativechangein2008governingtherevisedmandateofSABShashadsignificantimplicationson the standards development process and management of its stakeholders. The subsequent transition into the new mandate for standards development was not completely articulated and implemented as evidenced in publications that address regulatory matters. The new mandate for standards development has often been misunderstood. This has created confusion in the public and private sector with the perception that the SABS continues to develop regulatory standards. Our role in standardisation of facilitating innovation, improving access to markets and creating competitive opportunities while underpinning regulation is not widely understood at the strategic level in business and government.
As the entity that has oversight and governance responsibilities for the development of national stand-ards,theSABSismindfulofthechallengesthatneedtobeaddressedinordertoeffectivelydeliveronourmandate. These include:
• Historicalstandardsdevelopmentpracticesthatdonotreflectthenewlegislatedmandateofthe SABS, Act No 8 of 2008;• Limitedstrategicinfluenceandparticipationinregionalandinternationalstandardsdevelopment agenda;• Inadequateprocessingofjustificationandprioritisationofstandardsprojectsalignedtonational interests; • Astakeholderportfoliothatisperceivedtohavelimitedrepresentationofthebroadernational interests; and• Limitedskillsandcompetenciestoeffectivelymanagecommitteedynamicswithdiverse stakeholder portfolio.
27
While a standards strategy was developed in 2010 to address the capacity and skills gap within the division, it had become clear that most of the investment in standards needs to be directed in line with national priorities. The SABS has subsequently drafted a national standards development framework in 2015 providing parameters that guide investments into the development of national standards and adoption of international standards within the South African socio-economic policy environment i.e. NDP and IPAP. A key priority of this framework is balancing health, safety and environmental concerns with the rewards of trade, innovation and economic competitiveness for all stakeholders including industry, government and consumers. The framework will be implemented during the 2016-2018 period with priorities on addressing historical regulatory standards, lesser consensus documents and the review and implementation of policies and procedures in alignment with the Standards Act of 2008.
The division will also focus on the implementation of a renewed Academic Engagement Plan (AEP) as part of the framework of the SABS Knowledge Hub. The AEP aims to provide broader impact-driven outcomes by enhancing partnerships with academic institutions and schools. The SABS aims to further develop andtransferstandardisationmodulescontributingtoacademicqualificationstherebystrengtheningtheknowledge of the next generation of South African leaders. Some of the expected outputs include the establishment of an academic forum to develop and guide the implementation of the programme, increased participation of academics in standards development activities as well as promoting standardisation researchtopicsaspartofqualifications.Theschoolsprogrammewillestablishanddeveloppartnershipstoeducate young pupils on societal, environmental, and safety aspects of standards that impact their lives and the importance of standards in protecting them from danger and in improving their livelihood.
The development of skills and competencies of employees to align to the divisional mandate remains a vital focus area as the review and update of the current competency development programme (CDP) modules have become necessary. The CDP framework and priority modules including the implementation of a governance structure will be reviewed to enhance the impact of the programme thereby creating employee excellence in executing the standards development mandate. The accessibility of standards to the public through diversifying the distribution channels and modernising the e-commerce platform is an important aspect of the SABS modernisation strategy. This includes the protection of the copyright of all publications and implementing controls and tools to prevent the abuse of SABS copyright material. Focus will be on the implementation of the ISOlutions Webstore as a short term measure while the organisational ICT strategy designs and implements a holistic e-commerce platform.
5.1.1 Objectives
In the period to the end of 2018/19 the division will focus on the following priorities:• ImplementationoftheStandardsDevelopmentFrameworkalignedtonationalimperatives, specificallytheNationalDevelopmentPlan;• ImplementationoftheEducationaboutStandardisationprogramme;and• Reviewandrevisionofthecompetencydevelopmentprogrammetoaligntotheskillsand competencies required to achieve the divisional mandate.
Divisional Overview
28

5.2 Certification
ThecorebusinessofCertificationistheprovisionofanindependent,thirdparty,conformityassessmentserviceforsystemsandproducts,inaccordancewithpredefinedstandards.CertificationservicessuppliedbytheSABSincludeProductCertificationSystems,ManagementCertificationSystems,ConsignmentInspectionsandLocalContentVerification.ManagementSystemCertificationschemessuchasQualityManagementSystem(ISO9001),FoodSafetyManagement System (FSSC 22000) and Energy Management System (ISO 50001) provide assurance ontheeffectivenessandvalidityofaclient’smanagementsystem(s)intermsofquality,safetyandgoodgovernance.ProductCertificationschemes (theSABSMark)providea thirdpartyguaranteeofquality,safetyandreliabilityofproductstotheconsumer.TheSABShasdevelopedalocalcontentcertificationscheme and established capacity in accordance with the Preferential Procurement Policy Framework Act (PPPFA)toprovideLocalContentCertificationVerificationandbaselineauditsforsuppliersofgoodsandservices. Third party Consignment Inspection services are provided to external purchasing bodies to assist in their purchasing operations, including the production of item descriptions, the preparation of tender documents, the a djudication of contracts and the inspection of deliverables. 5.2.1 Context
ThecertificationbusinesshasbeenthekeydriverofrevenuegrowthfortheSABSinthelastfewyears,peaking at 20% annual growth in 2012/13, and averaging about 17% per annum from 2009/10. Although Certificationservicesoperateinahighlycompetitivemarket,oneofthebiggestthreatstothebusinessistherepealoftheR999regulationthataffordedholdersoftheSABSMarkexemptionfrompayingleviesto the NRCS.
Until 2008 when the Standards Act of 1945 was amended, the SABS operated as a regulator that had powers to make decisions on the number and type of tests to conduct on products to satisfy compliance as well as on accepting test reports from other laboratories, including international testing houses. The SABS Mark was in some instances issued against partially tested products and this compelled the National Regulator for Compulsory Specifications to refrain from fully recognising the SABS Mark as proof of compliance to quality requirements. The practice of issuing the SABS Mark against partially tested products wasstoppedandthiswillaffectCertificationrevenueassomeSABSMarkpermitswillbecancelleddueto partial compliance.
TheLocalContentVerificationunitdeliveredlowerthanexpectedrevenuebutwiththeissuingoftheInstruction Note by the National Treasury that will compel tenders to have post-award local content verificationasabiddingcondition,thisshouldchange.
Performance highlights in 2014/15 include: • Thenumberofcertificationschemesthatweredevelopedthatreached2,againstatargetof2 (ISO15001 (Energy Management) and FSSC22001 (Food Service Management); and• Allaccreditationasatthebeginningoftheyearwasmaintained.
AkeyfactoraffectingtheCertificationdivision’sperformanceisICT,whichisdramaticallychangingthecertificationbusiness landscapeasauditingevolvestowardspaperless,electronic,onlineandreal-timeprocesses.Theeffectiveuseofcertificationandauditingtoolsisverycriticalasitwillimprovetheintegrityofourprocessesandsystemsandwillfacilitatethedeliveryofcertificationservicesthataretrustedbycustomers.TrustandintegrityarekeydriversofgrowthandsustainabilityinCertification.
Divisional Overview
29
Revenue in 2014/15 reached R326.4 million, translating into 13% year-on-year growth and 3% positive variancetothebudgetofR315.7million.Thiswasmadepossiblebyeffectivemanagementoftherevenuepipeline and focus on customer retention in the last year.
5.2.2 Objectives
In the next three years to 2018/19, focus will be on:• RampingupLocalContentVerificationservicesinresponsetotheInstructionNoteissuedby National Treasury; • ImplementingthepolicythatwilleffectivelydealwithMarkschemeabuseinthemarket;• RepositioningtheSABSMarkschemetoheightenthevalueoftheSABSMarktobothprivateand public sectors; and• Developingandimplementingaprogrammefocusedondevelopingqualitysolutionsforpublic sector entities as well as regulators. 5.3 Training
The Training Academy forms a critical part of the SABS value chain of services to increase the use of standardisation for improved economic, environmental and social impact. The Academy provides knowledge onthevalueofstandardsandoffersskillsdevelopmenttocustomerswhoneedtoimplementthem.TheSABS Training Academy provides a diverse range of structured courses on standards, such as ISO 9001, QualityManagement Systems, ISO 14001, EnvironmentalManagement Systems andOHSAS 18001,Occupational Health and Safety Systems.
5.3.1 Context
The Training Academy operates in a very dynamic and highly competitive environment that requires atangiblevaluepropositiontoourcustomers.Itsgrowthoverthelastfiveyearshasbeensteadyatanaverageofabout12%perannumandhasgreatpotentialtogrowoffitsbasethatisstillconsideredlow.Although it has been plagued by operational and leadership challenges from 2013/14, it has managed to achieve the target to develop three new training courses in 2014/15. Apart from turning around business operationsinTrainingtoregainthetrustofcustomers,theunitneedstodevelopandimplementaflexible,entrepreneurial model to meet the dynamic requirements of its customers. During the 2014/15 performance year, the demand for training on the two main standards published by the International Organization for Standardization (ISO 9001 and ISO 14001) was low as the market was anticipating the revision of these standards. With the publication of the revised ISO 9001 and ISO 14001 in October 2015, demand for training in these standards is expected to increase and this will positively impactTrainingrevenuein2016/17.Certifiedcompaniesarerequiredtomigratetheircurrentcertificationinto the new standards by 2018. . 5.3.2 Objectives
In the period to end of 2018/19 the division will focus on the following priorities:
• Identifyexpandedopportunitiesfornewtrainingcoursesincollaborationwiththestandards development and other services in the value chain;• Implementalternativetrainingdeliverymodelssuchase-learning;computer-basedtrainingand distance learning; • Implementaneffectivepartnershipstrategytogrowservicestonewcustomers;and• Implementarevisedpricingmodelforallservicesofferedtoensurecompetitivenessinthemarket.
Divisional Overview
30
5.4 Testing
The regulatory split in 2008 continues to have far-reaching negative implications for Testing. Business processes and practices are still hampered by habits and characteristics carried over from the previous legislation.
5.4.1 Context
The division is undergoing numerous transformative initiatives that are intended to al i g n i t t o t h e p o s t - 2008 legislative landscape. In particular, focus is on ensuring that testing is carried out against fullrequirementsofnationalstandards.Infulfillingtherequirementstotestfullyagainststandards,theSABS also aligns to the prescripts of the Consumer Protection Act, 2008 (No. 68 of 2008). SABS in its evolution possessed attributes of being a science council to a regulator and this meant that industries could perform research and development activities for the purposes of commercialisation. However, by virtueofthepowersvestedonSABSthen,theSABSwasinapositiontoissueexemptionsasitsawfit.This practice was deep-rooted and did not appreciate legislative implications to the SABS, amongst others the intellectual property rights as described in the Publicly Financed Research and Development Act, 2008 (No. 51 of 2008). This act makes provision for the protection, utilisation and commercialisation ofintellectualpropertyemanatingfrompubliclyfinancedresearchanddevelopmentinstitutions,includingthe SABS.
A number of directives were issued on 26 January 2016 to stop the practice of partial testing which was disguisedas“customerspecificrequirements”aswellastosensitiseemployeestotheimpactoflegislativereform post the 2008 regulatory split. This was a reinforcement of the organisation’s position which was made in 2012. Business processes are also in the process of being aligned with more emphasis given to policies and procedures that govern daily Testing activities.
The Testing division has embarked on an assessment of all laboratories to ascertain viability and alignment to market realities. The analysis has revealed areas of focus that require further investment such as in the electrotechnical cluster and has highlighted sectors in chemical, biological and automotive industries whose testing services are in decline. This makes it necessary to consider discarding and mothballing some of the Testing services and to seek new substitutes where required. Where possible, shared testing instrumentation will be considered to ensure optimal utilisation of equipment that is compatible with other test methods that may exist. Opportunities in the alternative energy and energy efficiencysectorsremainstrategicareastoexploreandwillbepursuedifdemandexists.
A consultative process with key stakeholders is underway to inform them of the need to test products tofullspecification.Theseindustryengagementspresentauniqueopportunityfortheorganisationtoappreciate where the market is going and provide an opportunity to further align the testing infrastructure to market realities.
5.4.2 Objectives
In the next three years to 2018/19, the Testing division needs to transform into a trusted, commercially viable unit by:• Implementingtherecommendationsofthelaboratoryre-organisationprojectinordertoidentify laboratories which should be prioritised in terms of resources;• ExecutingtheNETFARecapitalisationprogramme;• AcceleratingtheimplementationoftheLaboratoryCapitalExpenditurePlantoclosethegaps identifiedinfulfillingfulltestingoncompulsoryspecificationsaswellasonservicingCertification
Divisional Overview
31
customers;• Identifyingandimplementingpartnershipswithotherlaboratoriesandinstrumentationpartnersto close some of the capability gaps; and• Developingmechanismstoensurethatintegrityinthetestingprocessesismaintained.
5.5 SABS Design Institute
The SABS Design Institute was formally established in the 1960s to stimulate the development of the manufacturing industry in South Africa through engineering and product design. Forming an important pillar of the standardisation value chain at the South African Bureau of Standards, it became a driving force behind the promotion of industrial design in the country. Over the last few years, the Institute has become a national centre of excellence for design and innovation that is focused on supporting entrepreneurship and industrialisation through localised innovation, especially amongst the black youth using design.
5.5.1 Context
The SABS Design Institute’s programme that develops SMMEs has seen tremendous success in 2014/15 where the number of SMMEs for whom improvement projects were developed and implemented exceeded the annual target of 25 to reach 58. A number of programmes were successfully implemented, amongst others:• TheYoungMoversProgrammethatwasintroducedinpartnershipwithTransnetandJunior Achievement South Africa (JASA) to encourage innovation and entrepreneurship at grassroots level;• TheNextGenerationIndustrialistFairthatnurturesacceleratedfutureindustrialistsintheInstitute and that has seen approximately 70 new products and services reaching various stages on the entrepreneurial development continuum; and• ApartnershipwithTransnetthatestablishedtheTransnetDesign,InnovationandResearchCentre, aimed at providing facilities and resources for SMMEs to research and develop innovative and commercially viable ideas.
The SABS has over the last few years invested in the development of the capacity and capability to support the development of entrepreneurs and industrialists through design. Further growth in services will require funding and other support from various government and other entities that require the use of the services and the facility.
5.5.2 Objectives
In the next three years to 2018/19, the SABS Design Institute will:• IncreasetheimpactofdesignservicesbygrowingthenumberofnewSMMEsserviced;and• Continuetotakeleadershipinguidinggovernmentpolicyonthegrowthanddevelopmentofthe South African design capacity.
5.6 Internal Services
The SABS business is under increasing pressure to optimise business processes and reduce costs, to become more competitive and increase revenue, to meet and exceed stakeholder expectations, to comply withall regulations, to rewardeffectivelyand improveproductivity. Akeyenabler inovercomingthese
Divisional Overview
32

business challenges is a robust, internal, technology driven, services orientated supporting capability.5.6.1 Information Technology Over the past three years, the ICT function has been implementing an IT transformation programme whose firstphasewasfocusedonbuildingasolidICTinfrastructure.Duringtheperiod,theinfrastructurewasrationalised and consolidated, some disparate technologies were overhauled and standardised, obsolete hardware was refreshed, business continuity was implemented and ICT asset management was improved. In the last year, the ICT Governance Framework was strengthened by reconstituting the ICT Steering Committee to make it more strategic in line with the heightened focus on modernising of the business through ICT. The new ICT Steering Committee has focused on, amongst others, reviewing the ICT road map to fast track the implementation of the ICT programme. The modernisation road map puts the customer at the forefront and prioritises programmes to implement business processes and business intelligence to support the transformation towards customer centricity.
In the next three years, priority will be on: • DevelopingandimplementingacomprehensiveBusinessModernisationProgrammetotransform theorganisationintoefficient,effective,customer-centricoperationsusingICT;• AcceleratingtheimplementationofBusinessIntelligencetoprovideoneversionofthetruthto facilitateaneffectivestrategyexecution;• ReviewingthecurrentICTOperatingModelandclosingcapabilityandcapacitygapsthatwill impede the execution of the Business Modernisation Programme; • DevelopingandimplementingarobustEnterpriseArchitecturethatcanaccommodatediversedata types, digital technologies and channels to facilitate interoperability and integration; • Adoptingadigitalbusinessmodelbasedonservice-orientedarchitecture(SOA)tostrategically and sagely communicate with external stakeholders; and• BuildingICTservicesthataresecurebydesign,byensuringthatinformationsecurityisintrinsic to our business processes, solutions development, and daily operations. Security will be factored into our initial designs, not bolted on afterwards.
5.6.2 Stakeholder Management and Customer Service
One the four pillars that drive the execution of the SABS corporate strategy is customer centricity. While the existing stakeholder management framework addresses the broad issues of segmentation and engagement strategies for all stakeholder types, integrated customer processes that deal with cross-divisional complexitiesofcustomerownership,salesandservicearenotyetfullydefined.Theobjectivetoachieve“oneversionofthetruth”toimproveservicedeliveryisdependentontheexecutionofprocessesthatareeffective,efficient,comprehensiveandthatcutacrossdivisions. In thenext threeyears,anoperatingmodel will be implemented that will include:• Integratedend-to-endcustomerprocessessuchassales,acquisition,distributionandservicing across the enterprise;• Advancedcustomerinsights,datamanagementandgovernance;• Mechanismtoeffectivelyandcontinuouslysolicitfeedbackfromstakeholders;• Effectivecustomerloyaltyprogrammesandincentiveschemes;• Productdevelopmentandmanagement;and• StakeholderEngagementProtocolsthatarealignedtothestakeholderengagementstrategy.
Divisional Overview
33
5.6.3 Marketing and Communication
As an organisation that has quality assurance as its principal activity, the SABS needs to be trusted and its integrity must be beyond question. While the SABS brand has lost some of its lustre over the years, research has shown that in some sectors it is still respected. This provides the opportunity to reinforce the brand and to communicate the value that the SABS brings to their products and services through consistent messaging that positions the SABS as a trusted quality assurance partner. In the next three years, the marketing function will be modernised and will execute activities that will strengthen the messaging and value proposition of the SABS to stakeholders across the value chain.
5.6.4 Human Capital
The success in implementing the SABS Strategy relies heavily on our ability to attract and retain competent andmotivatedemployees.TheHumanCapital strategydefines the roadmap fordeveloping,attract-ing and retaining employees, and outlines actionable steps to facilitate the cultural transformation of the SABS from a regulator to a customer-centric, service-oriented organisation. In the next three years, focus will be on the following:• ImplementingIntegratedTalentManagementpracticeswherecareerpathsforcriticalworkforce segments will be revised in line with the needs of the organisation;• Creatinganenablingenvironmenttoprovidetheleadershiprequiredtomovetheorganisationtoa high performance organisation through - Engaged, capable and able leadership; - Leaders that operate at appropriate level; - Measuringsuccessandeffectivenessofleadershipandmanagementdevelopmentpro grammes; and - A transformed employer brand. • Developinganintegratedorganisation-widelearningstrategyenabledbytheSABSKnowledge Hub; and• ReviewingtheERFrameworkandaligningitwithbestpractice.
5.6.5 Finance
TheFinancefunctionisevolvingfrombeingpurelyabackofficefunctiontoakeystrategicdriverofbusinessactivitiesasitisahubthatcollatesallfinancialandnon-financialinformationthatfeedsintotheanalysisofoperationalactivities.Thisthereforerequiresthefinancefunctiontoobtainanddeployextraordinarytools that will ensure that it can adequately support the business whilst maintaining a clean audit and ensuring that governance and risk management processes remain embedded. AkeystrategicobjectiveofFinanceistoensurefinancialsustainabilityoftheSABSduringthistimeofchange and tough economic conditions including maintaining a balance between enhancing return on the investment portfolio whilst protecting capital and assets. Finance will therefore focus on the following key activities:
• Governance-includesreflectingonthecurrentpoliciesandproceduresandtheirappropriateness to the current state of the SABS. This will include the review and establishment of policies and continuously monitoring and evaluating their execution. Governance is the over–arching principle, bothatthestrategicandoperationallevel,thatwillfacilitatefinancialsustainabilityandenhance
Divisional Overview
34

decision making processes.• CostContainment–costmanagementandtheimplementationofinnovativesolutionstolower costswillcontinueinlightoftougheconomicconditionsandfiscalchallengesimpactingnegatively on revenue and grant funding levels. This will include the restructuring of the post-retirement medical aid liability.
• AssetManagementStrategy–theimplementationofthisstrategyremainsakeypriorityandfocus is on seeking an instrumentation partnership to execute it. Return on investment and evaluation against the competitive landscape will be the key considerations of this implementation. This strategy also incorporates the optimisation of the current property portfolio whose details are provided under section 8.6.5.
• WorkingCapitalManagement-thecashflowpositionoftheSABShasbeenundersomescrutiny during the last few months. The decrease in core funding has placed an even bigger burden on the SABS to generate more of its own cash. The drive on cost containment is a very important factor and will assist with the management of the cash resources to ensure that the SABS will have sufficientresourcestofunditsoperationalactivities.Earlydisbursementoftheparliamentarygrant fromthedtiisbeingconsideredtoensureadequateoperationalcashflowsandenhancedreturnon investment.
5.6.6 Supply Chain
The department has maintained compliance to the PFMA and other supply chain management regulations includingPPPFA,contributingsignificantlytotheachievementoftheSABScleanauditawardforthethirdyear in a row.
Focus is on maintaining good governance particularly within contracts management and cost containment as well as in savings in line with key strategic objectives. The key strategic objective in the next three years is to improve sustainability of supplies through: • Implementingane-sourcingpractice;• Implementingacontractandsupplierperformancemanagementsystem;• Seamlessintegrationofsourcingpracticestoincreasecustomervalue;and• Drivinginnovationinitiativesincollaborationwithsuppliers.
5.6.7 Facilities
The Facilities group provides, operates and maintains the physical environment in which the SABS conducts its business and serves its clients. The areas of focus for facilities are as follows:
• Physical Infrastructure – the implementation of the Public Private Partnership (PPP) programme will be the key focus in the next three years and will include the following:
The execution of the Groenkloof development master plan that will take the form of a Public Private Partnership. The PPP programme will be managed by a service provider to ensure focus on the core business of the SABS; Other properties within the SABS portfolio that were approved for sale such as a section of the Durbanoffice;and
Divisional Overview
35
The development of an ownership structure.
TheCapeTownofficerequiressignificantimprovementsandthesewillalsobeprioritisedduringthenextthree years. • Security-expandingthenarrowphysicalsecuritysystemtocomprehensiveandintegratedsecurity management that includes document security, personnel security and other measures required by the Minimum Information Security Standard. A range of state audits and comprehensive security reviewshavebeenconductedandthegapsthatwereidentifiedareintheprocessofbeingclosed. The next three years will therefore focus on implementing security upgrades in both physical and information assets. This will include an investment in security related ICT under the auspices of the ICT modernisation programme.
5.6.8 Business Risk
The risk culture of the SABS is driven mostly at Executive and General Management level and this has resulted in increased exposure to risks related to governance of processes at operational level, including the issuing of the SABS Mark. This issue is receiving attention and focus is on continuing to build trust in the SABS as a quality brand. Within this context, the organisation is embarking on the annual review of the Risk Management Framework which includes the risk strategy and policy as well as the draft Risk Appetite Framework (RAF).
Furthermore,astrategicintenttodriveefficiencywithintheriskgovernance,processandculturewasdrafted with the aim of creating a risk aware culture and elevating the state of risk management to best practicewithinthreeyearsandleadingpracticeswithinfiveyears.Thefollowingobjectivesareprioritised:• Providetheframeworkwithinwhichtheorganisationwillidentify,assessandeffectivelymanage risks and compliance to ensure achievement of its objectives;• Instilacultureofriskandcompliancemanagement,riskownershipbeingpractisedaseveryone’s responsibility and develop a common risk language;• ComplywithappropriateRiskManagementpracticesintermsofcorporategovernance;and• Developgovernancestructurewhichwillensurealignment,compliancetopoliciesandprocedure
Divisional Overview
36

PART C
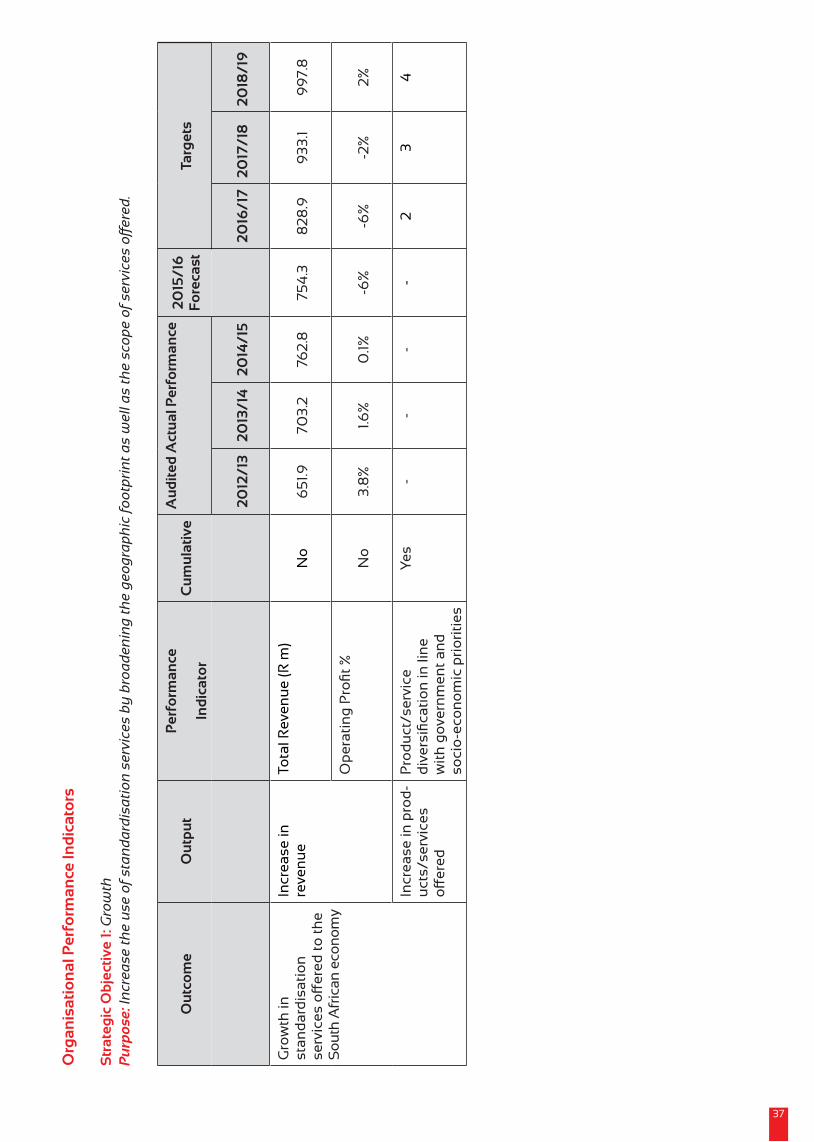
Org
anis
atio
nal
Per
form
ance
Ind
icat
ors
Str
ateg
ic O
bje
ctiv
e 1:
Gro
wth
Pu
rpo
se: I
ncr
ease
th
e u
se o
f st
an
da
rdis
ati
on
ser
vice
s b
y b
roa
den
ing
th
e g
eog
rap
hic
fo
otp
rin
t a
s w
ell a
s th
e sc
op
e o
f se
rvic
es o
ffer
ed.
Ou
tco
me
Ou
tpu
tP
erfo
rman
ce
Ind
icat
or
Cu
mu
lati
veA
ud
ited
Act
ual
Per
form
ance
20
15/1
6
Fo
reca
stTa
rget
s
20
12/1
32
013
/14
20
14/1
52
016
/17
20
17/1
82
018
/19
Gro
wth
in
st
and
ard
isat
ion
se
rvices
offered
tothe
South African
eco
nomy
Incr
ease
in
re
ven
ue
Tota
l Rev
enu
e (R
m)
No
65
1.970
3.2
762
.875
4.3
82
8.9
93
3.1
99
7.8
OperatingProfit%
N
o3
.8%
1.6%
0.1%
-6%
-6%
-2%
2%
Incr
ease
in p
rod
-u
cts/
serv
ices
offered
Pro
du
ct/s
ervi
ce
diversific
ationin
line
wit
h g
ove
rnm
ent
and
soci
o-e
con
om
ic p
rio
riti
es
Yes
--
--
23
4
37

Qu
arte
rly
Mile
sto
nes
Ou
tco
me
Ou
tpu
tP
erfo
rman
ce
Ind
icat
or
Cu
mu
lati
ve
ove
r th
e fo
ur
qu
arte
rs
20
16/1
7 T
arg
etTa
rget
s
Q1
Q2
Q3
Q4
Gro
wth
in
stan
dar
dis
a-ti
on
ser
vice
s offered
tothe
South African
ec
on
om
y
Incr
ease
in
reve
nu
eTo
tal R
even
ue
(R m
)
Yes
82
8.9
175
.54
14.5
65
3.5
82
8.9
OperatingProfit%
N
o-6
%-6
%-6
%-6
%-6
%
Incr
ease
in
pro
du
cts/
se
rvic
es
offered
Pro
du
ct/
se
rvicediversifi-
cati
on
in li
ne
wit
h
go
vern
men
t an
d
soci
o-e
con
om
ic
pri
ori
ties
Yes
2-
-1
2
38
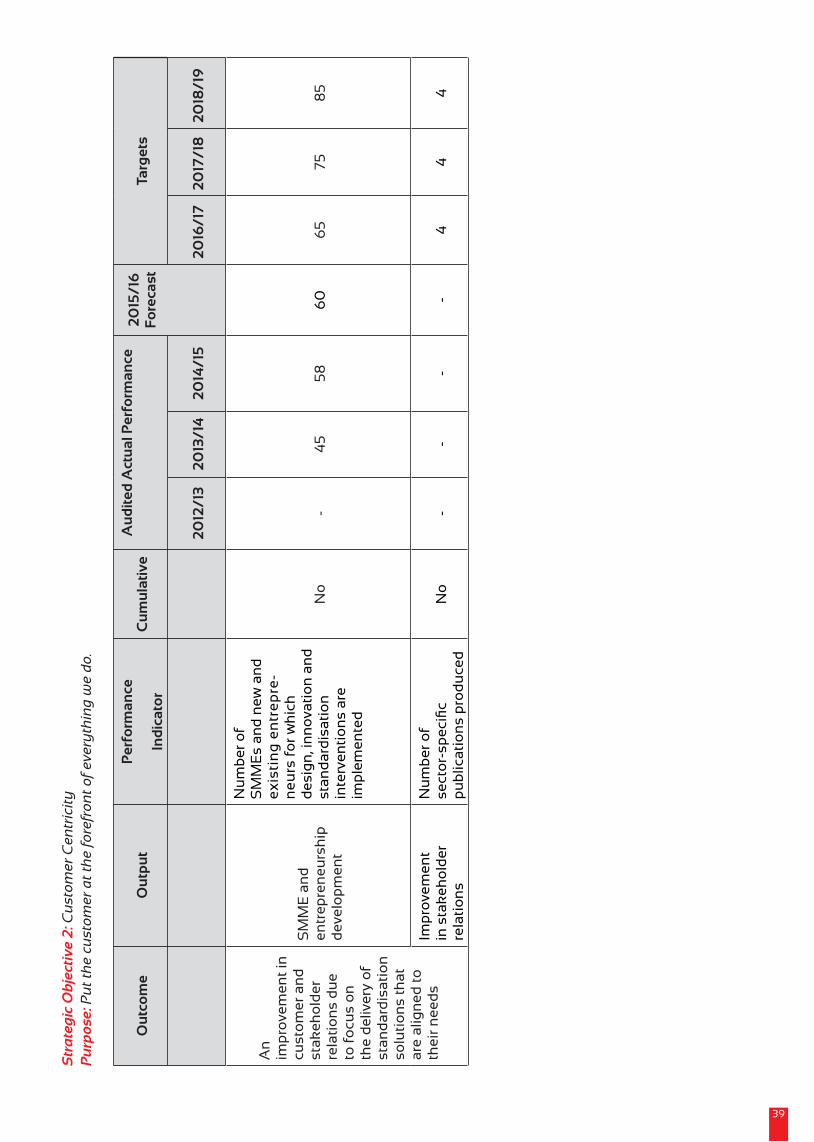
Str
ate
gic
Ob
ject
ive
2: C
ust
om
er C
entr
icit
yP
urp
ose
: Pu
t th
e cu
sto
mer
at
the
fore
fro
nt
of
ever
yth
ing
we
do
.
Ou
tco
me
Ou
tpu
tP
erfo
rman
ce
Ind
icat
or
Cu
mu
lati
veA
ud
ited
Act
ual
Per
form
ance
20
15/1
6
Fo
reca
stTa
rget
s
20
12/1
32
013
/14
20
14/1
52
016
/17
20
17/1
82
018
/19
An
im
pro
vem
ent
in
cust
om
er a
nd
st
akeh
old
er
rela
tio
ns
du
e to
fo
cus
on
th
e d
eliv
ery
of
stan
dar
dis
atio
n
solu
tio
ns
that
ar
e al
ign
ed t
o
thei
r n
eed
s
SM
ME
an
d
en
trep
ren
eurs
hip
d
evel
op
men
t
Nu
mb
er o
f
S
MM
Es
and
new
an
d
e
xist
ing
en
tre
pre
-n
eu
rs f
or
wh
ich
des
ign
, in
no
vati
on
an
d
stan
dar
dis
atio
n
in
terv
enti
on
s ar
e
imp
lem
ente
d
No
-4
55
86
06
575
85
Imp
rove
men
t in
sta
keh
old
er
re
lati
on
s
Nu
mb
er o
f
sector-sp
ecific
pu
blic
atio
ns
pro
du
ced
No
--
--
44
4
39

40
Qu
arte
rly
Mile
sto
nes
Str
ate
gic
Ob
ject
ive
3: P
rod
uct
ivit
yP
urp
ose
: Im
pro
ve t
he
op
era
tio
na
l per
form
an
ce o
f th
e S
AB
S t
o e
na
ble
del
iver
y o
f q
ua
lity
ou
tpu
ts f
or
cust
om
ers
an
d t
he
So
uth
Afr
ica
n e
con
om
y
Out
com
eO
utpu
tPe
rfor
man
ce
Indi
cato
r
Cum
ulat
ive
over
the
four
qua
rter
s20
16/1
7 Ta
rget
Targ
ets
Q1
Q2
Q3
Q4
An
imp
rove
men
t in
cu
sto
mer
an
d s
tak
eho
lder
rel
a-ti
on
s d
ue
to f
ocu
s o
n t
he
del
iver
y o
f st
and
ard
isat
ion
so
luti
on
s th
at
are
alig
ned
to
th
eir
nee
ds
SM
ME
an
d
entr
epre
ne
urs
hip
d
eve
lop
men
t
Nu
mb
er o
f S
MM
Es
for
wh
ich
d
es
ign
an
d i
nn
ova
tio
n
inte
rven
tio
ns
are
imp
lem
ente
d
Yes
65
-2
04
56
5
Imp
rove
men
t in
sta
keh
old
er
re
lati
on
s
Numberofse
ctor-sp
ecific
pu
blic
atio
ns
pro
du
ced
Yes
41
23
4
Out
com
eO
utpu
tPe
rfor
man
ce
Indi
cato
rCu
mul
ative
Audi
ted
Actu
al P
erfo
rman
ce20
15/1
6 Fo
reca
stTa
rget
s
2012
/13
2013
/14
2014
/15
2016
/17
2017
/18
2018
/19
Imp
rove
-m
ent
in p
ro-
du
ctiv
ity
and
o
per
atio
nal
p
erfo
rman
ce
Mo
der
nis
atio
n
of
the
SA
BS
o
per
atio
ns
Nu
mb
er o
f se
rvic
e lin
es(C
ertific
ation,
Trai
nin
g, T
est-
ing
, Sta
nd
ard
s,
En
terp
rise
Dev
elo
pm
ent
and
S
ales
, Lo
cal C
on
ten
t Verifica
tionand
Co
rpo
rate
Ser
vice
s)
wh
ose
bu
sin
ess
pro
cess
es
are
a
uto
ma
ted
Yes
--
--
12
3
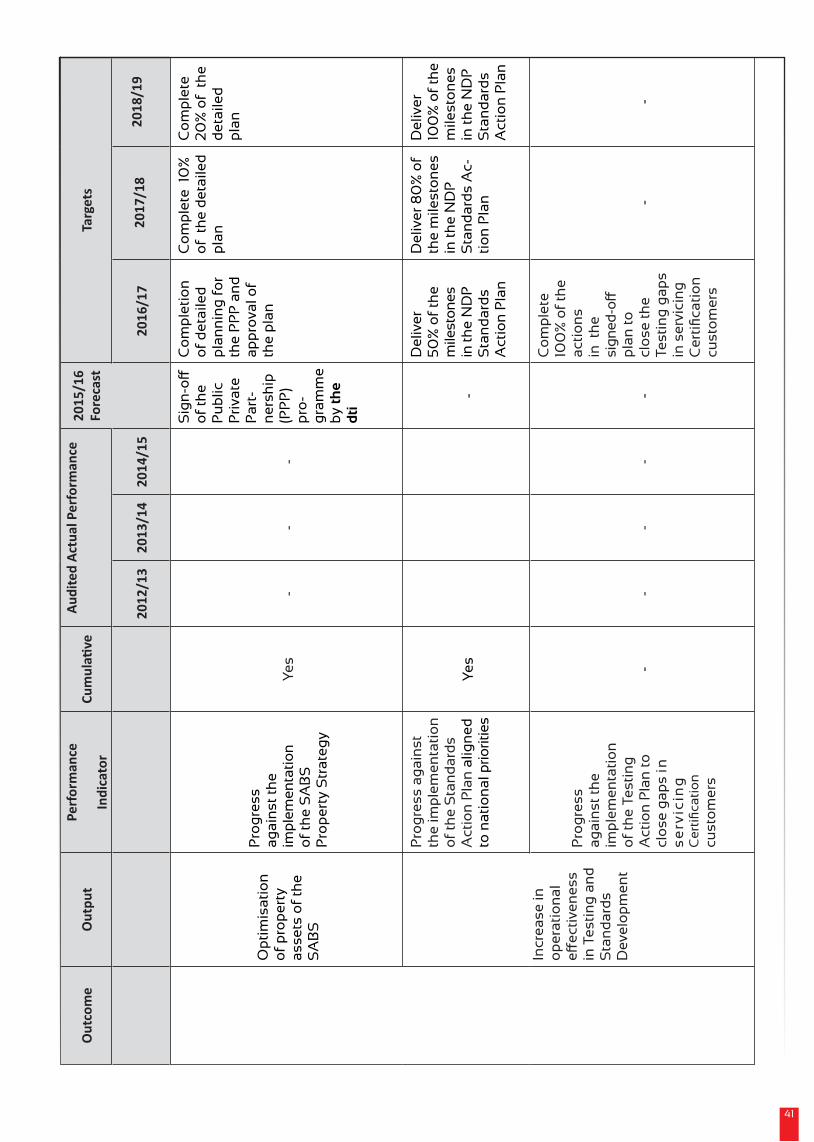
41
Out
com
eO
utpu
tPe
rfor
man
ce
Indi
cato
rCu
mul
ative
Audi
ted
Actu
al P
erfo
rman
ce20
15/1
6 Fo
reca
stTa
rget
s
2012
/13
2013
/14
2014
/15
2016
/17
2017
/18
2018
/19
Op
tim
isat
ion
o
f p
rop
erty
as
sets
of
the
SA
BS
Pro
gre
ss
agai
nst
th
e
im
ple
men
tati
on
o
f th
e S
AB
S
Pro
per
ty S
trat
egy
Yes
--
-
Sign-o
ff
of
the
Pu
blic
P
riva
te
Par
t-n
ersh
ip
(PP
P)
pro
-g
ram
me
by
the
dti
Co
mp
leti
on
o
f d
etai
led
p
lan
nin
g f
or
the
PP
P a
nd
ap
pro
val o
f th
e p
lan
Co
mp
lete
10
%
of
th
e d
etai
led
p
lan
Co
mp
lete
2
0%
of
th
e d
etai
led
p
lan
Incr
ease
in
op
erat
ion
al
effec
tive
nes
sin
Tes
tin
g a
nd
S
tan
dar
ds
D
evel
op
men
t
Pro
gre
ss a
gai
nst
th
e im
ple
men
tati
on
o
f th
e S
tan
dar
ds
Act
ion
Pla
n a
lign
ed
to n
atio
nal
prio
ritie
sY
es-
Del
iver
5
0%
of
the
mile
sto
nes
in
the
ND
P
Sta
nd
ard
s A
ctio
n P
lan
Del
iver
80
% o
f th
e m
ilest
on
es
in t
he
ND
P
Sta
nd
ard
s A
c-ti
on
Pla
n
Del
iver
10
0%
of
the
mile
sto
nes
in
th
e N
DP
S
tan
dar
ds
Act
ion
Pla
n
Pro
gre
ss
agai
nst
th
e
im
ple
men
tati
on
o
f th
e Te
stin
g
Act
ion
Pla
n t
o
clo
se g
aps
in
se
rvic
ing
Certific
ation
cust
om
ers
--
--
-
Co
mp
lete
10
0%
of
the
acti
on
s
in t
he
signed
-off
pla
n t
o
clo
se t
he
Test
ing
gap
s in
ser
vici
ng
Certific
ation
cust
om
ers
--

Str
ate
gic
Ob
ject
ive
4: C
om
pet
ent
an
d E
mp
ow
ered
Em
plo
yee
sP
urp
ose
: Dev
elo
p a
nd
ret
ain
a c
om
pet
ent
hu
ma
n r
eso
urc
e th
at
is a
lign
ed w
ith
th
e o
rga
nis
ati
on
’s m
an
da
te.
Ou
tco
me
Ou
tpu
tP
erfo
rman
ce
Ind
icat
or
Cu
mu
lati
veA
ud
ited
Act
ual
Per
form
ance
20
15/1
6
Fo
reca
stTa
rget
s
20
12/1
32
013
/14
20
14/1
520
16/1
720
17/1
820
18/1
9
Co
mp
e-te
nt
and
em
po
wer
ed
empl
oyee
s to
dri
ve
imp
rove
d
serv
ice
d
eliv
ery
Dev
elo
pm
ent
of
tech
nic
al
exp
erti
seN
um
ber
of
tech
nic
al
em
plo
yees
th
at h
ave
com
-p
lete
d s
pec
ialis
t tr
ain
ing
w
ith
lead
ing
par
tner
s
Yes
--
--
58
12
Nu
mb
er o
f D
oct
ora
l an
d
M
aste
rs g
rad
uat
es
re
cru
ited
into
th
e
K
no
wle
dg
e H
ub
sec
tors
in
su
pp
ort
of
Test
ing
an
d
Sta
nd
ard
s d
evel
op
men
t
No
--
-2
22
42
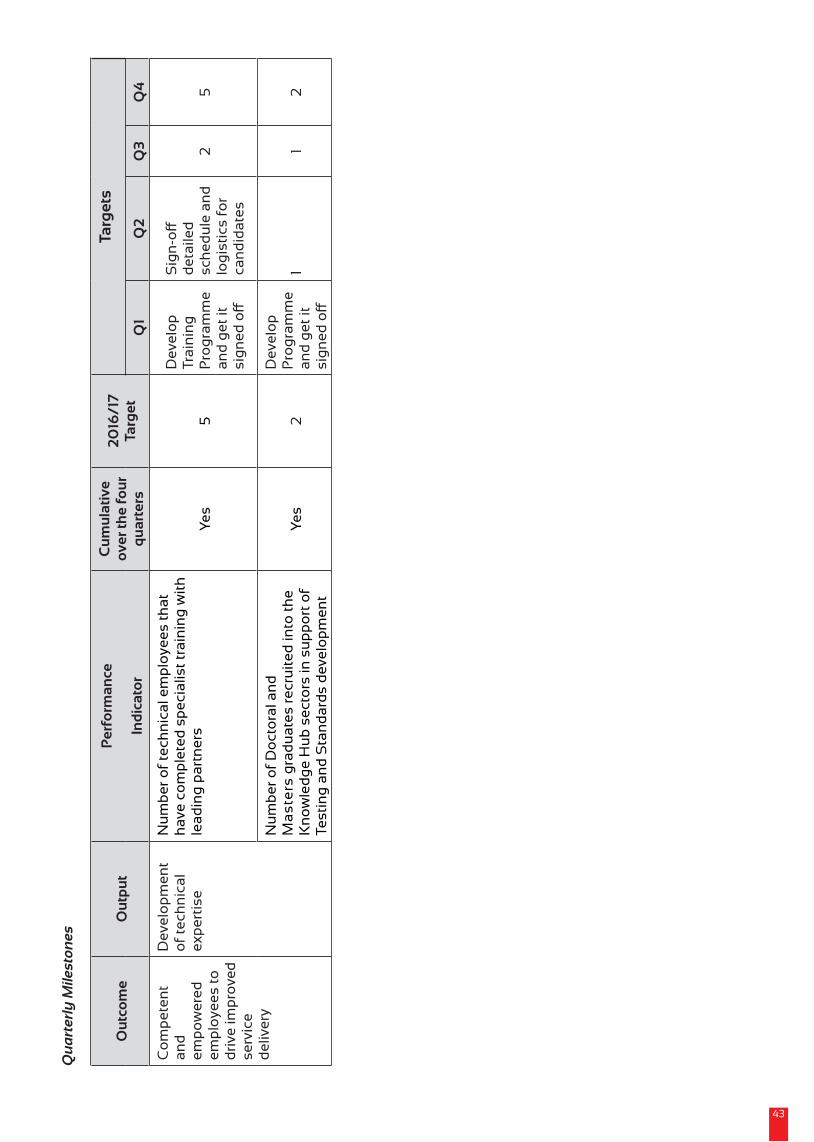
Qu
art
erly
Mile
sto
nes
Ou
tco
me
Ou
tpu
tP
erfo
rman
ce
Ind
icat
or
Cu
mu
lati
ve
ove
r th
e fo
ur
qu
arte
rs
20
16/1
7
Targ
et
Targ
ets
Q1
Q2
Q3
Q4
Co
mp
eten
t
and
em
po
wer
ed
emp
loye
es t
o
dri
ve im
pro
ved
se
rvic
e d
eliv
ery
Dev
elo
pm
ent
of
tech
nic
al
exp
erti
se
Nu
mb
er o
f te
chn
ical
em
plo
yees
th
at
hav
e co
mp
lete
d s
pec
ialis
t tr
ain
ing
wit
h
lead
ing
par
tner
sY
es5
Dev
elo
p
Trai
nin
g
Pro
gra
mm
e
and
get
it
signed
off
Sign-o
ff
det
aile
d
sch
edu
le a
nd
lo
gis
tics
fo
r ca
nd
idat
es
25
Nu
mb
er o
f D
oct
ora
l an
d
Ma
ste
rs g
rad
uat
es r
ecru
ited
into
th
e
K
no
wle
dg
e H
ub
sec
tors
in s
up
po
rt o
f Te
stin
g a
nd
Sta
nd
ard
s d
evel
op
men
t
Yes
2
Dev
elo
p
Pro
gra
mm
e
and
get
it
signed
off
11
2
43

PART D
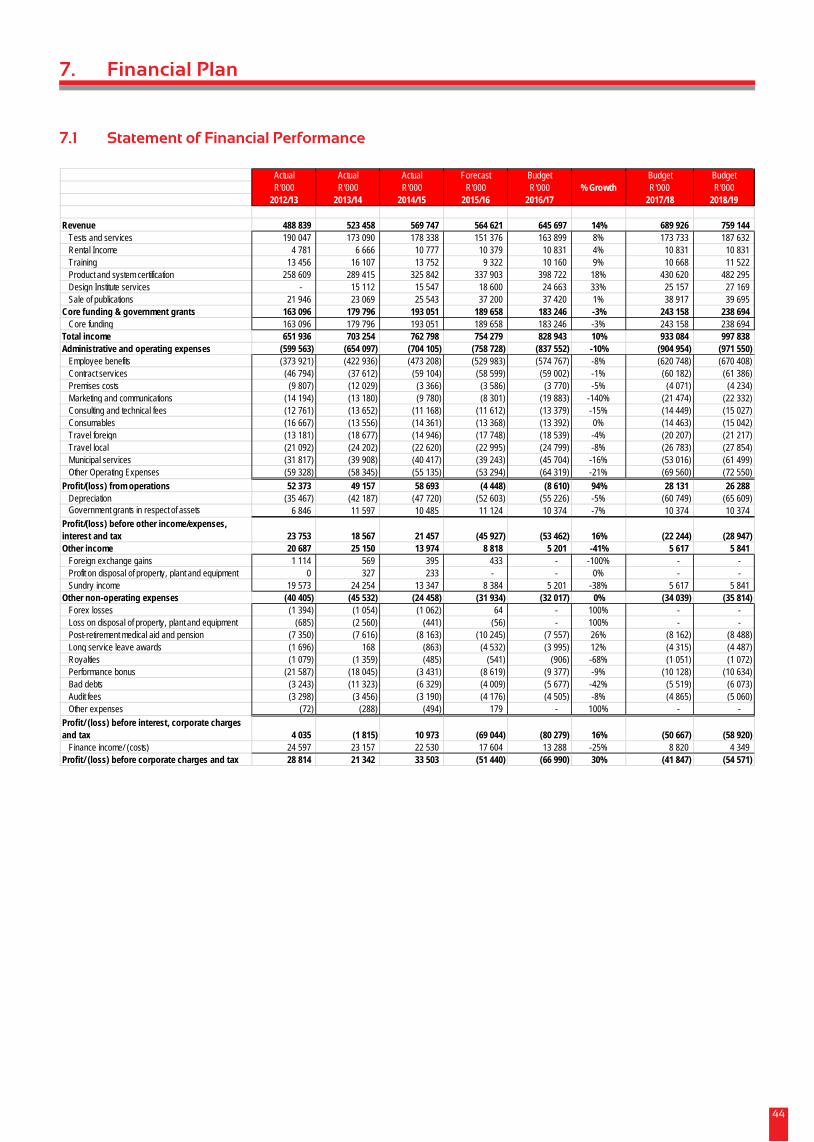
7. Financial Plan
7.1 Statement of Financial Performance
Actual Actual Actual Forecast Budget Budget BudgetR'000 R'000 R'000 R'000 R'000 % Growth R'000 R'000
2012/13 2013/14 2014/15 2015/16 2016/17 2017/18 2018/19
Revenue 488 839 523 458 569 747 564 621 645 697 14% 689 926 759 144 Tests and services 190 047 173 090 178 338 151 376 163 899 8% 173 733 187 632 Rental Income 4 781 6 666 10 777 10 379 10 831 4% 10 831 10 831 Training 13 456 16 107 13 752 9 322 10 160 9% 10 668 11 522 Product and system certification 258 609 289 415 325 842 337 903 398 722 18% 430 620 482 295 Design Institute services - 15 112 15 547 18 600 24 663 33% 25 157 27 169 Sale of publications 21 946 23 069 25 543 37 200 37 420 1% 38 917 39 695
Core funding & government grants 163 096 179 796 193 051 189 658 183 246 -3% 243 158 238 694 Core funding 163 096 179 796 193 051 189 658 183 246 -3% 243 158 238 694
Total income 651 936 703 254 762 798 754 279 828 943 10% 933 084 997 838 Administrative and operating expenses (599 563) (654 097) (704 105) (758 728) (837 552) -10% (904 954) (971 550)
Employee benefits (373 921) (422 936) (473 208) (529 983) (574 767) -8% (620 748) (670 408) Contract services (46 794) (37 612) (59 104) (58 599) (59 002) -1% (60 182) (61 386) Premises costs (9 807) (12 029) (3 366) (3 586) (3 770) -5% (4 071) (4 234) Marketing and communications (14 194) (13 180) (9 780) (8 301) (19 883) -140% (21 474) (22 332) Consulting and technical fees (12 761) (13 652) (11 168) (11 612) (13 379) -15% (14 449) (15 027) Consumables (16 667) (13 556) (14 361) (13 368) (13 392) 0% (14 463) (15 042) Travel foreign (13 181) (18 677) (14 946) (17 748) (18 539) -4% (20 207) (21 217) Travel local (21 092) (24 202) (22 620) (22 995) (24 799) -8% (26 783) (27 854) Municipal services (31 817) (39 908) (40 417) (39 243) (45 704) -16% (53 016) (61 499) Other Operating Expenses (59 328) (58 345) (55 135) (53 294) (64 319) -21% (69 560) (72 550)
Profit/(loss) from operations 52 373 49 157 58 693 (4 448) (8 610) 94% 28 131 26 288 Depreciation (35 467) (42 187) (47 720) (52 603) (55 226) -5% (60 749) (65 609) Government grants in respect of assets 6 846 11 597 10 485 11 124 10 374 -7% 10 374 10 374
Profit/(loss) before other income/expenses, interest and tax 23 753 18 567 21 457 (45 927) (53 462) 16% (22 244) (28 947) Other income 20 687 25 150 13 974 8 818 5 201 -41% 5 617 5 841
Foreign exchange gains 1 114 569 395 433 - -100% - - Profit on disposal of property, plant and equipment 0 327 233 - - 0% - - Sundry income 19 573 24 254 13 347 8 384 5 201 -38% 5 617 5 841
Other non-operating expenses (40 405) (45 532) (24 458) (31 934) (32 017) 0% (34 039) (35 814) Forex losses (1 394) (1 054) (1 062) 64 - 100% - - Loss on disposal of property, plant and equipment (685) (2 560) (441) (56) - 100% - - Post-retirement medical aid and pension (7 350) (7 616) (8 163) (10 245) (7 557) 26% (8 162) (8 488) Long service leave awards (1 696) 168 (863) (4 532) (3 995) 12% (4 315) (4 487) Royalties (1 079) (1 359) (485) (541) (906) -68% (1 051) (1 072) Performance bonus (21 587) (18 045) (3 431) (8 619) (9 377) -9% (10 128) (10 634) Bad debts (3 243) (11 323) (6 329) (4 009) (5 677) -42% (5 519) (6 073) Audit fees (3 298) (3 456) (3 190) (4 176) (4 505) -8% (4 865) (5 060) Other expenses (72) (288) (494) 179 - 100% - -
Profit/ (loss) before interest, corporate charges and tax 4 035 (1 815) 10 973 (69 044) (80 279) 16% (50 667) (58 920)
Finance income/ (costs) 24 597 23 157 22 530 17 604 13 288 -25% 8 820 4 349 Profit/ (loss) before corporate charges and tax 28 814 21 342 33 503 (51 440) (66 990) 30% (41 847) (54 571)
44

7.1.1 Revenue
RevenueofR645.7millioninthefirstyearoftheplanningperiodisprojectedtogrowby7%,graduallygrowingto R759.1 million, thereby translating to a double-digit cumulative growth over the three year planning period. This double-digit growth is an aggressive approach by the organisation to strive to close the gap createdbythereductionintheparliamentarygrantfundingduetofiscalconstraintsunderachallengingeconomic climate as highlighted earlier in the economic overview section.
ThesecondproposedcutinthegovernmentgrantofR68millionwillbeeffectedin2016/17,bringingthetotal core funding allocation to R183.2 million, R243.2 million will be allocated in 2017/18. Fiscal constraints are anticipated to continue into 2018/19, with a further reduction of core funding of R54.6 million. The allocation of the core funding in 2018/19 will be R238.7 million.
Total income is thus projected to increase from R828.9 million in 2016/17 to R997.8 million in 2018/19.CertificationrevenuewillgrowfromR398.7millionin2015/16toR430.6millionin2018/19.MuchofthisrevenuegrowthwillbeattributabletotheLocalContentVerificationservicesassomegovernmentcontracts have been secured.
The Testing business has experienced losses of volume in recent times. Although a turnaround strategy is being applied, the results thereof are expected to manifest over this three year planning period, hence a gradual growth of 6% and 8% on a year to year basis is projected. Testing revenue will grow from R163.9 million in 2016/17 to R187.6 million in 2018/19.
The Training Academy is projecting revenue of R10.2 million in 2016/17 growing to R11.5 million in 2018/19, translating to a single-digit growth rate on a year to year basis. The revised marketing brochure was introducedinthecurrentfinancialyearandadditionaltrainingplatformswillbeintroduced.Thefinalisationof the revision in the management systems standards will also contribute to the demand in training of these standards in the 2016/2017 year.
Design Institute services revenue will increase from R24.7 million in 2016/17 to R27.2 million in 2018/19. Agreements with key strategic organisations, such as Transnet, are the main contributors to the growth. Saleof publicationswill increase in linewith inflationary targetsover theplanningperiod. Revenue isprojectedatR37.4millionforthefinancialyear2016/17,growingtoR39.7millionin2018/19.Newandinnovativedistribution methods and channels are being investigated to make standards available to a wider target market.
Rentalincomeisexpectedtoremainflatoverthethreeyearplanningperiod.Thebudgetdoesnotincorporateany added revenue that may be earned from dti entities requiring space.
7.1.2 Expenditure
Administrative and operating expenses are expected to grow by 16% cumulatively from R837.6 million to R971.6 million over the three year planning period. The growth in these expenses is driven mainly by employee benefit costs which constitute about 70% of the budgeted administrative and operating expenses. Employee benefit costs are increasing from R574.8million in 2016/17 to R670.4million in2018/19. The increase in these costs is as a result of the upward cost of living adjustments. The increase inemployeebenefitsforthe2016/2017year isbudgetedat8%aboveforecast indicatingthe limitonmulti-year wage settlement agreement between the SABS and NEHAWU considering the current revenue levels.
Financial Plan
45

Financial Plan
Contractservicesarebeingactivelymanagednot tosurpass thegeneral inflation rates.Thishasbeenachieved through negotiating reduced scope of work, thereby eliminating non-value adding services.
Consulting fees have been curbed as a result of implementing cost containment measures as prescribed by the National Treasury’s Instruction 1 of 2013/14 which prescribes cost containment measures that accountingofficersofgovernmentinstitutionsneedtofollow.
Local and foreign travel costs have been capped at a single-digit growth rate on a year to year basis over the planning period.
MunicipalservicescostsofR45.7millionareprojectedtoincreaseinlinewiththeexpectedtariffincreasesfrom Eskom.
Marketing and communications cost of approximately R20 million per year for the next three years will drive the SABS message to the market to re-institute the quality brand that the SABS stands for and create awareness both at potential customer and consumer level.
Concertedcostcontainmentmeasuresonnon-essentialserviceshaveresultedinasignificantreductionin other expenses in the current year. This will be continued into the next three years, hence minimal expense increases are projected in this area.
7.1.3 Profitability
The SABS is projecting a net loss position of R67.0 million in 2016/17 reducing to R54.6 million by 2018/19 despite the aggressive double-digit growth in revenue planned for the period against current tough economic conditions that are expected to continue. The loss is driven mainly by the reduction in the core fundingofR45minthe2015/2016yearandR68minthe2016/2017financialperiod.Costcontainmentmeasureshavebeenextensivelyappliedexceptforemployeebenefitswhichcontributeover60%tothecost structure. TheENEguidelinesdonotallowbudgetingfordeficit.Therefore,toensurecompliance,abreak-evenposition has been presented with a proviso in the chapter highlighting the budgeted loss to align with the Corporate Plan.
46

7.2 Capital Expenditure
Financial Plan
47
2017/18 2018/19 GRAND TOTALReplacement New Total
Testing 36,829,375 24,849,233 61,678,608 14,694,000 12,775,000 89,147,608 Automotive & Mechanical 12,630,000 12,435,000 25,065,000 350,000 750,000 26,165,000 Chem Bio/Material 10,134,000 1,690,000 11,824,000 11,314,000 8,830,000 31,968,000 Electrotechnical 5,155,375 2,399,233 7,554,608 - - 7,554,608 Mining & Minerals 8,910,000 8,325,000 17,235,000 3,030,000 3,195,000 23,460,000
- West Coast - 6,370,000 6,370,000 2,050,000 - 8,420,000
- Standards - - - - - -
- Design Institute - - - - - -
- Corporate 49,395,000 54,432,000 103,827,000 130,789,000 204,949,000 439,565,000 Finance - - - - - - Facilities 23,445,000 24,432,000 47,877,000 114,789,000 200,949,000 363,615,000 Human Capital - - - - - - Corporate Services - - - - - - ICT 25,950,000 30,000,000 55,950,000 16,000,000 4,000,000 75,950,000
- TOTAL 86,224,375 85,651,233 171,875,608 147,533,000 217,724,000 537,132,608
2016/17
CAPEX BUDGET 2016 - 2019
A capital expansion plan of R537.1 million has been budgeted for the next three-year period.
Approximately 15% of the budget relates to upgrades of infrastructure which includes upgrade to the NETFA, West Coast facilities, Secunda laboratories and other regional facilities. The investment in NETFA represents a small component of a complete overhaul that needs to be done at NETFA as most of the assets are at the end of their useful lives. The SABS is currently working on sourcing funding for the additional investments required.
Budgets have been provided for upgrades to the Groenkloof campus at approximately 46% of the Capex budget which seeks to optimise the SABS property ensuring that functional requirements are met, operationalefficiencyimproved,legislativerequirementsmaintainedandthecreationofadditionalrevenuestreams in the form of rental income. Security upgrades have been provided for at approximately 6% of the budget.
A further 14% of the expenditure will be invested into ICT infrastructure, including the implementation of a new ERP system, business intelligence software, computer tracking software for assets, management informationsystem,replacementofICTequipmentandautomationofcertificationprocesses.
The balance of the budget at 18% will be invested in the rejuvenation and replacement of laboratory equipment.
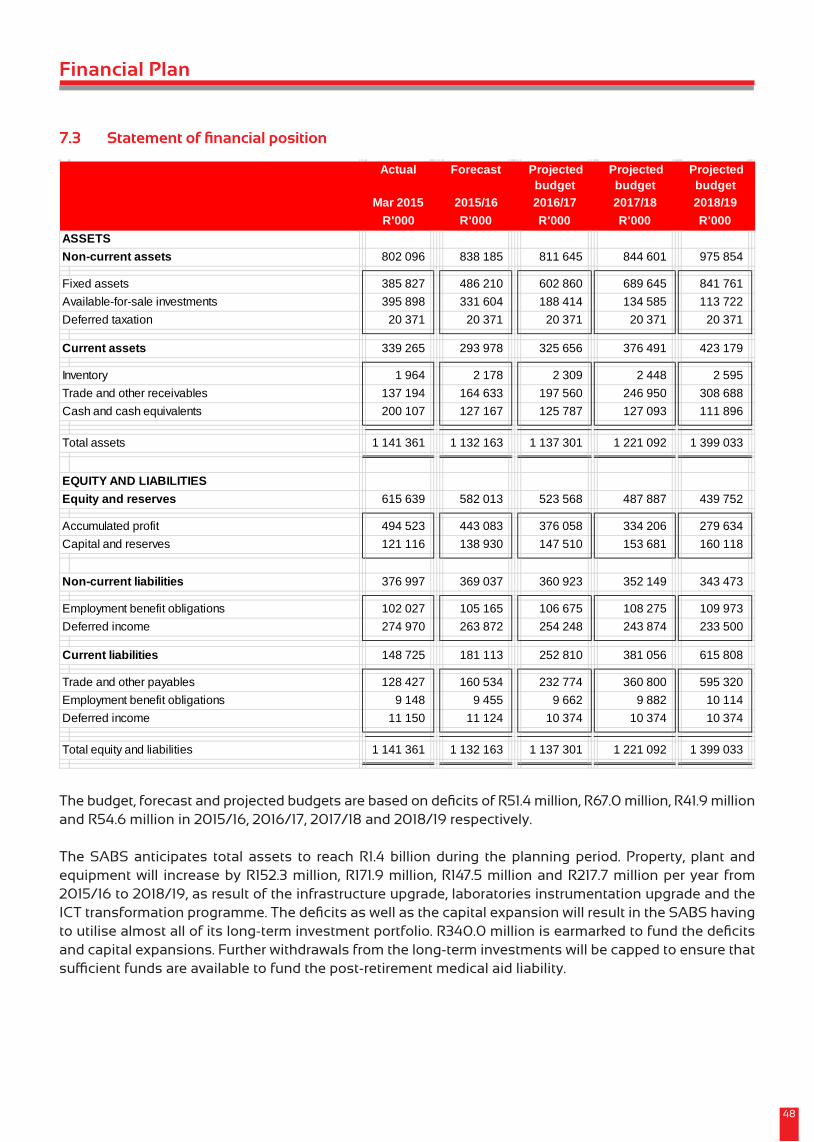
Financial Plan
48
7.3 Statement of financial position
Actual Forecast Projected budget
Projected budget
Projected budget
Mar 2015 2015/16 2016/17 2017/18 2018/19R'000 R'000 R'000 R'000 R'000
ASSETSNon-current assets 802 096 838 185 811 645 844 601 975 854
Fixed assets 385 827 486 210 602 860 689 645 841 761 Available-for-sale investments 395 898 331 604 188 414 134 585 113 722 Deferred taxation 20 371 20 371 20 371 20 371 20 371
Current assets 339 265 293 978 325 656 376 491 423 179
Inventory 1 964 2 178 2 309 2 448 2 595 Trade and other receivables 137 194 164 633 197 560 246 950 308 688 Cash and cash equivalents 200 107 127 167 125 787 127 093 111 896
Total assets 1 141 361 1 132 163 1 137 301 1 221 092 1 399 033
EQUITY AND LIABILITIESEquity and reserves 615 639 582 013 523 568 487 887 439 752
Accumulated profit 494 523 443 083 376 058 334 206 279 634 Capital and reserves 121 116 138 930 147 510 153 681 160 118
Non-current liabilities 376 997 369 037 360 923 352 149 343 473
Employment benefit obligations 102 027 105 165 106 675 108 275 109 973 Deferred income 274 970 263 872 254 248 243 874 233 500
Current liabilities 148 725 181 113 252 810 381 056 615 808
Trade and other payables 128 427 160 534 232 774 360 800 595 320 Employment benefit obligations 9 148 9 455 9 662 9 882 10 114 Deferred income 11 150 11 124 10 374 10 374 10 374
Total equity and liabilities 1 141 361 1 132 163 1 137 301 1 221 092 1 399 033
Thebudget,forecastandprojectedbudgetsarebasedondeficitsofR51.4million,R67.0million,R41.9millionand R54.6 million in 2015/16, 2016/17, 2017/18 and 2018/19 respectively.
The SABS anticipates total assets to reach R1.4 billion during the planning period. Property, plant and equipment will increase by R152.3 million, R171.9 million, R147.5 million and R217.7 million per year from 2015/16 to 2018/19, as result of the infrastructure upgrade, laboratories instrumentation upgrade and the ICTtransformationprogramme.ThedeficitsaswellasthecapitalexpansionwillresultintheSABShavingtoutilisealmostallofitslong-terminvestmentportfolio.R340.0millionisearmarkedtofundthedeficitsand capital expansions. Further withdrawals from the long-term investments will be capped to ensure that sufficientfundsareavailabletofundthepost-retirementmedicalaidliability.

Cash reserves will be maintained at a minimum of two months’ operating expenses and additional requirements will be funded from investment capital.
Duetotheanticipatedincreaseincommercialrevenue,receivableswill increaseby20%inthefirsttwoyears and 25% in the last two years. Trade and other payables are expected to increase by 25% in 2015/16, 45% in 2016/17, 55% in 2017/18 and 65% in 2018/19.
The deferred income liability relates to funding received from the stakeholder for the construction of the new laboratory building as well as the refurbishment of the C-block. Funding utilised will be recognised in income, as the depreciation on the projects is recognised as an expense over the useful life of the asset.
7.4 Projected cash flow statement
Financial Plan
Actual Forecast
Projected budget
Projected budget
Projected budget
Mar 2015 2015/16 2016/17 2017/18 2018/19R'000 R'000 R'000 R'000 R'000
Cash inflow from operating activities 46 934 3 316 18 726 88 839 175 227
Cash received from customers 765 740 746 782 811 591 899 685 1 006 910 Cash paid to suppliers and employees (741 520) (761 070) (806 153) (819 666) (836 032)
Cash generated from/(utilised by) operations 24 220 (14 288) 5 438 80 019 170 878Net finance revenue 22 714 17 604 13 288 8 820 4 349
Cash outflow from investing activities (133 104) (76 256) (20 106) (87 533) (190 424)
Purchase of fixed assets (56 191) (152 986) (171 876) (147 533) (217 724)Purchase of intangible assets (5 168) - - - -
233 - - - - Purchase of available-for-sale investments (71 978) (8 270) (8 230) (5 000) (2 700)Disposal of available-for-sale investments - 85 000 160 000 65 000 30 000
Cash inflow from financing activitiesFunding for government specific projects 2 819 - - - -
(83 351) (72 940) (1 380) 1 306 (15 197)
283 458 200 107 127 167 125 787 127 093
Cash and cash equivalents at end of year 200 107 127 167 125 787 127 093 111 896
Proceeds on disposal of property, plant and equipment
(Decrease)/increase in cash and cash equivalentsCash and cash equivalents at beginning of year
The SABS’ cash and cash equivalents comprise the funds received from the shareholder for the infrastructure project, funds for capital investment portfolio and the net working capital.
CashandcashequivalentsofR111.9millionareprojectedfor31March2019,significantlylowerthantheR200.1 million as at 31 March 2015. Cash reserves will be maintained at a minimum of two months’ operating expenditure and where capital expansion requires further investment, the long-term investments will be utilised. Effortswillbeembarkedontorequestearlyreceiptsofgrantfromthe dtitoenhancecashflowmanage-ment.
49

In accordance with the Public Finance Management Act, the SABS has agreed to a framework of acceptable levelsofmaterialityandsignificancewithourexecutiveauthority,the dti.
In terms of Treasury Regulations 28.1.5 issued in terms of the Public Management Finance Act, 1999 (Act No 1 of 1999), the accounting authority of the SABS must develop and agree a framework of acceptable levelsofmaterialityandsignificancewiththerelevantexecutiveauthorityinconsultationwiththeexternalauditors.ThisisthematerialityframeworkfortheSABSConsolidatedGroupfinancialstatements.
Materiality Statement
Material
Section 50(1)
The accounting authority for a public entity must –
Qualitative: The SABS is committed to have an open and transparent culture and to disclose any relevant information to its stakeholders. Materiality can only be determined if the nature of the information is known.
(a) exercise the duty of utmost care to ensure reasonable protection of the assets and records of the public entity;
(b) actwithfidelity,honesty, integrityandin the best interest of the public entity inmanagingthefinancialaffairsofthepublic entity;
(c) on request, disclose to the executive authority responsible for that public entity or the legislature to which the public entity is accountable, all material facts, including those reasonably discoverable, which in any way influencethedecisionoractionsoftheexecutive authority or that legislature; and
Quantitative: R2070000
(d) seek,withinthesphereofinfluenceofthat accounting authority, to prevent any prejudice to the financial interestof the state.
50
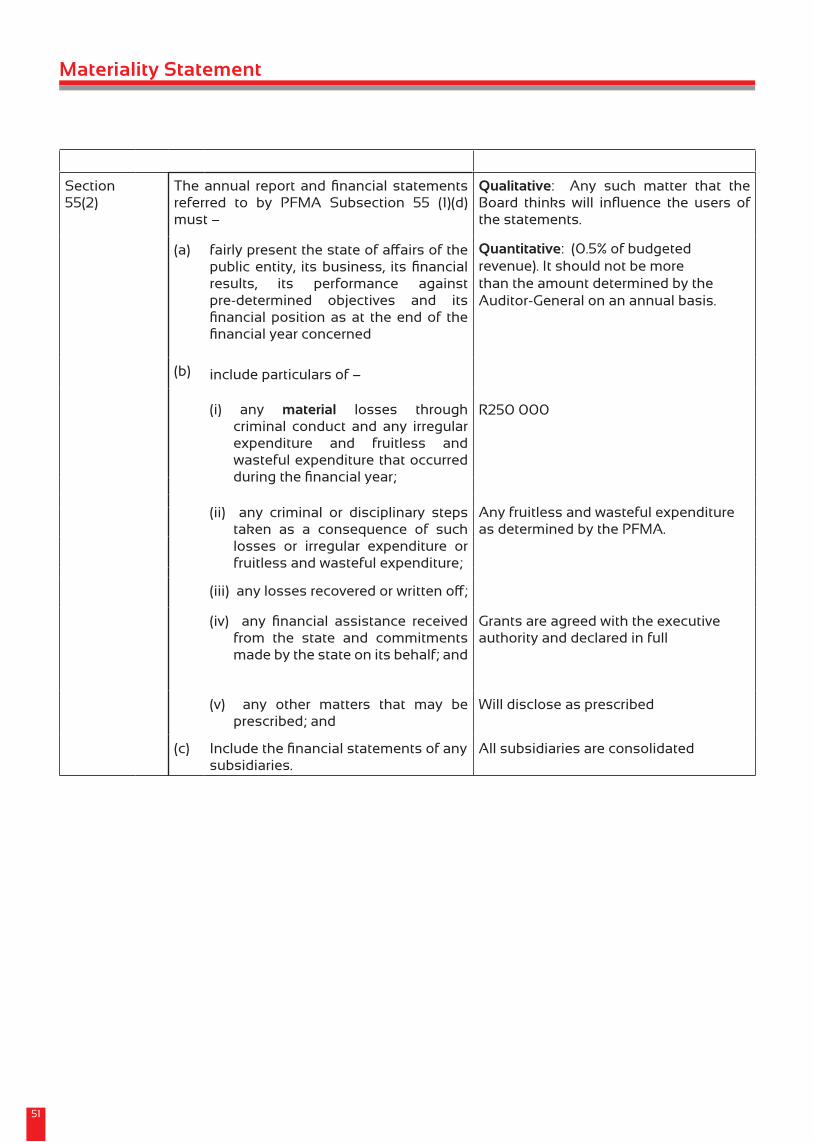
Materiality Statement
Material
Section 55(2)
Theannual reportandfinancial statementsreferred to by PFMA Subsection 55 (1)(d) must –
Qualitative: Any such matter that the Board thinkswill influence the users ofthe statements.
Quantitative: (0.5% of budgeted revenue). It should not be more than the amount determined by the Auditor-General on an annual basis.
(a) fairlypresentthestateofaffairsofthepublicentity, itsbusiness, itsfinancialresults, its performance against pre-determined objectives and its financialpositionasat theendof thefinancialyearconcerned
(b) include particulars of –
(i) any material losses through criminal conduct and any irregular expenditure and fruitless and wasteful expenditure that occurred duringthefinancialyear;
R250 000
(ii) any criminal or disciplinary steps taken as a consequence of such losses or irregular expenditure or fruitless and wasteful expenditure;
Any fruitless and wasteful expenditure as determined by the PFMA.
(iii)anylossesrecoveredorwrittenoff;
(iv) any financial assistance receivedfrom the state and commitments made by the state on its behalf; and
Grants are agreed with the executive authority and declared in full
(v) any other matters that may be prescribed; and
Will disclose as prescribed
(c) Includethefinancialstatementsofanysubsidiaries.
All subsidiaries are consolidated
51
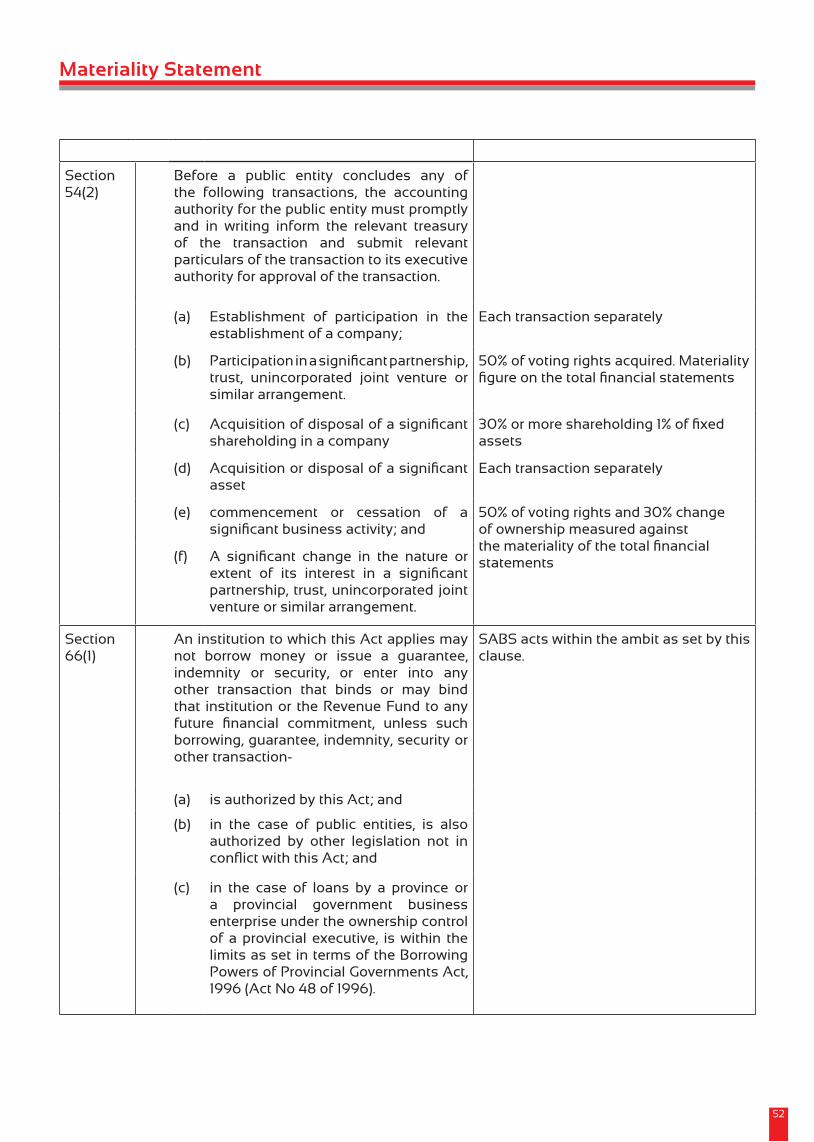
Materiality Statement
Material
Section 54(2)
Before a public entity concludes any of the following transactions, the accounting authority for the public entity must promptly and in writing inform the relevant treasury of the transaction and submit relevant particulars of the transaction to its executive authority for approval of the transaction.
(a) Establishment of participation in the establishment of a company;
Each transaction separately
(b) Participationinasignificantpartnership,trust, unincorporated joint venture or similar arrangement.
50% of voting rights acquired. Materiality figureonthetotalfinancialstatements
(c) Acquisitionofdisposalofasignificantshareholding in a company
30%ormoreshareholding1%offixedassets
(d) Acquisitionordisposalofasignificantasset
Each transaction separately
(e) commencement or cessation of a significantbusinessactivity;and
50% of voting rights and 30% change of ownership measured against thematerialityofthetotalfinancialstatements(f) A significant change in the nature or
extent of its interest in a significantpartnership, trust, unincorporated joint venture or similar arrangement.
Section 66(1)
An institution to which this Act applies may not borrow money or issue a guarantee, indemnity or security, or enter into any other transaction that binds or may bind that institution or the Revenue Fund to any future financial commitment, unless suchborrowing, guarantee, indemnity, security or other transaction-
SABS acts within the ambit as set by this clause.
(a) is authorized by this Act; and
(b) in the case of public entities, is also authorized by other legislation not in conflictwiththisAct;and
(c) in the case of loans by a province or a provincial government business enterprise under the ownership control of a provincial executive, is within the limits as set in terms of the Borrowing Powers of Provincial Governments Act, 1996 (Act No 48 of 1996).
52

PART E
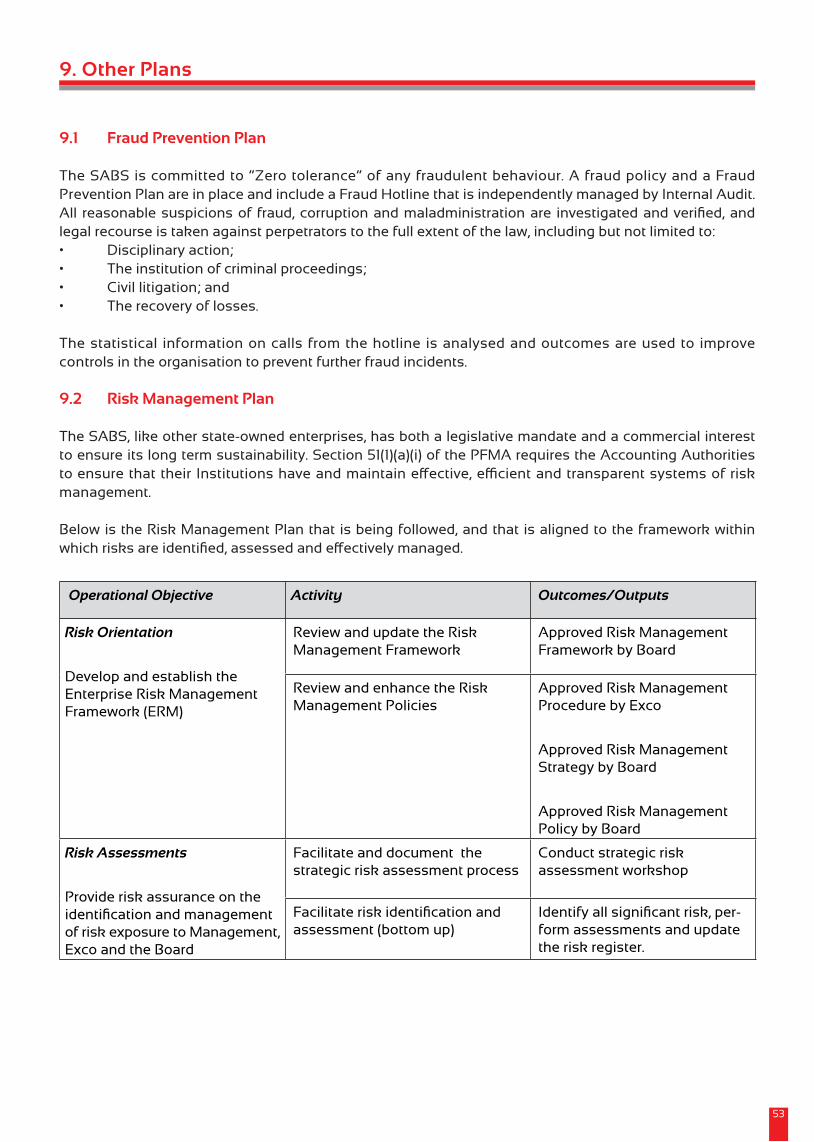
9.1 Fraud Prevention Plan
TheSABSiscommittedto“Zerotolerance”ofanyfraudulentbehaviour.AfraudpolicyandaFraudPrevention Plan are in place and include a Fraud Hotline that is independently managed by Internal Audit. All reasonablesuspicionsof fraud,corruptionandmaladministrationare investigatedandverified,andlegal recourse is taken against perpetrators to the full extent of the law, including but not limited to:• Disciplinaryaction;• Theinstitutionofcriminalproceedings;• Civillitigation;and• Therecoveryoflosses.
The statistical information on calls from the hotline is analysed and outcomes are used to improve controls in the organisation to prevent further fraud incidents.
9.2 Risk Management Plan
The SABS, like other state-owned enterprises, has both a legislative mandate and a commercial interest to ensure its long term sustainability. Section 51(1)(a)(i) of the PFMA requires the Accounting Authorities toensurethattheir Institutionshaveandmaintaineffective,efficientandtransparentsystemsofriskmanagement.
Below is the Risk Management Plan that is being followed, and that is aligned to the framework within whichrisksareidentified,assessedandeffectivelymanaged.
9. Other Plans
Operational Objective Activity Outcomes/Outputs
Risk Orientation
Develop and establish the Enterprise Risk Management Framework (ERM)
Review and update the Risk Management Framework
Approved Risk Management Framework by Board
Review and enhance the Risk Management Policies
Approved Risk Management Procedure by Exco
Approved Risk Management Strategy by Board
Approved Risk Management Policy by Board
Risk Assessments
Provide risk assurance on the identificationandmanagementof risk exposure to Management, Exco and the Board
Facilitate and document the strategic risk assessment process
Conduct strategic risk assessment workshop
Facilitateriskidentificationandassessment (bottom up)
Identifyallsignificantrisk,per-form assessments and update the risk register.
53
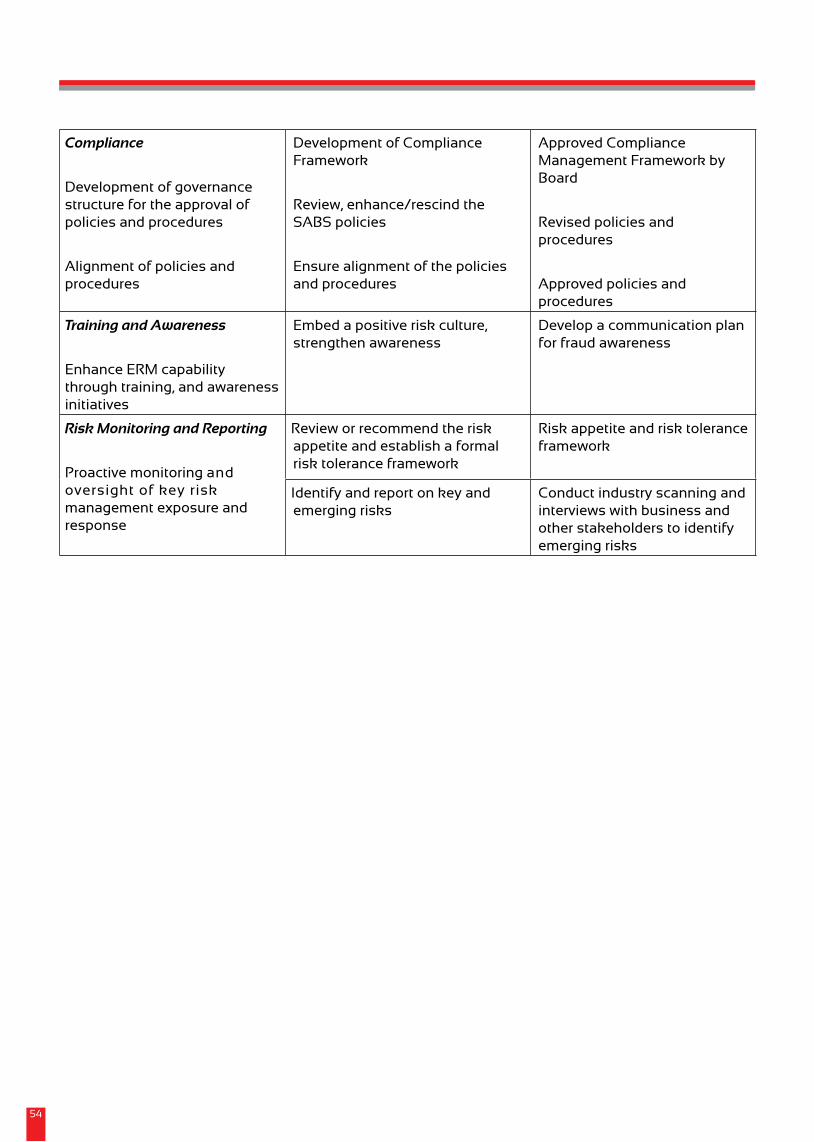
Compliance
Development of governance structure for the approval of policies and procedures
Alignment of policies and procedures
Development of Compliance Framework
Review, enhance/rescind the SABS policies
Ensure alignment of the policies and procedures
Approved Compliance Management Framework by Board
Revised policies and procedures
Approved policies and procedures
Training and Awareness
Enhance ERM capability through training, and awareness initiatives
Embed a positive risk culture, strengthen awareness
Develop a communication plan for fraud awareness
Risk Monitoring and Reporting
Proactive monitoring and oversight of key risk management exposure and response
Review or recommend the risk appetite and establish a formal risk tolerance framework
Risk appetite and risk tolerance framework
Identify and report on key and emerging risks
Conduct industry scanning and interviews with business and other stakeholders to identify emerging risks
54

9.3 Strategic Risk Register
Strategic risks affect the company’s long term positioning, performance and achievement of strategic objectives.ThefollowingarestrategicrisksthathavebeenidentifiedbytheSABSmanagementthat,ifnotmanagedeffectively,canhinderprogressagainsttargetsintheCorporatePlan.
# Identified Risk Mitigating Actions
1 Inadequate controls and governance structures in some areas of the business
• Review and align policies and procedures to best practice
• Promote a culture of accountability where non-compliance to the SABS policy and procedures constitute serious misconduct
• Develop and implement a communication awareness plan on key regulatory and governance requirements that apply to standardisation
2 Antiquated Testing equipment that hampers the ability to conduct full testing oncompulsoryspecification
• Source instrument partners to close the capacity and capability gaps in the short term
• Invest in ICT and equipment
3 Inadequate levels of automation of business processes
• A new business process capability is being created that will include the acquisition of a BPM tool
4 Ineffectivestakeholdermanagement processes
• Execute the stakeholder management strategy and apply continuous improvement where necessary
• Establish the Enterprise Development function with special focus on comprehensive stakeholder engagement
• Expand the functionality of the CRM to include all customer engagements
5 Increasingemployeebenefitcosts against marginal reve-nue growth
• Aligntheemployeebenefitcoststogrowthinrevenuethroughimplementinga“fitforpurpose”Remunerationand Reward framework
55
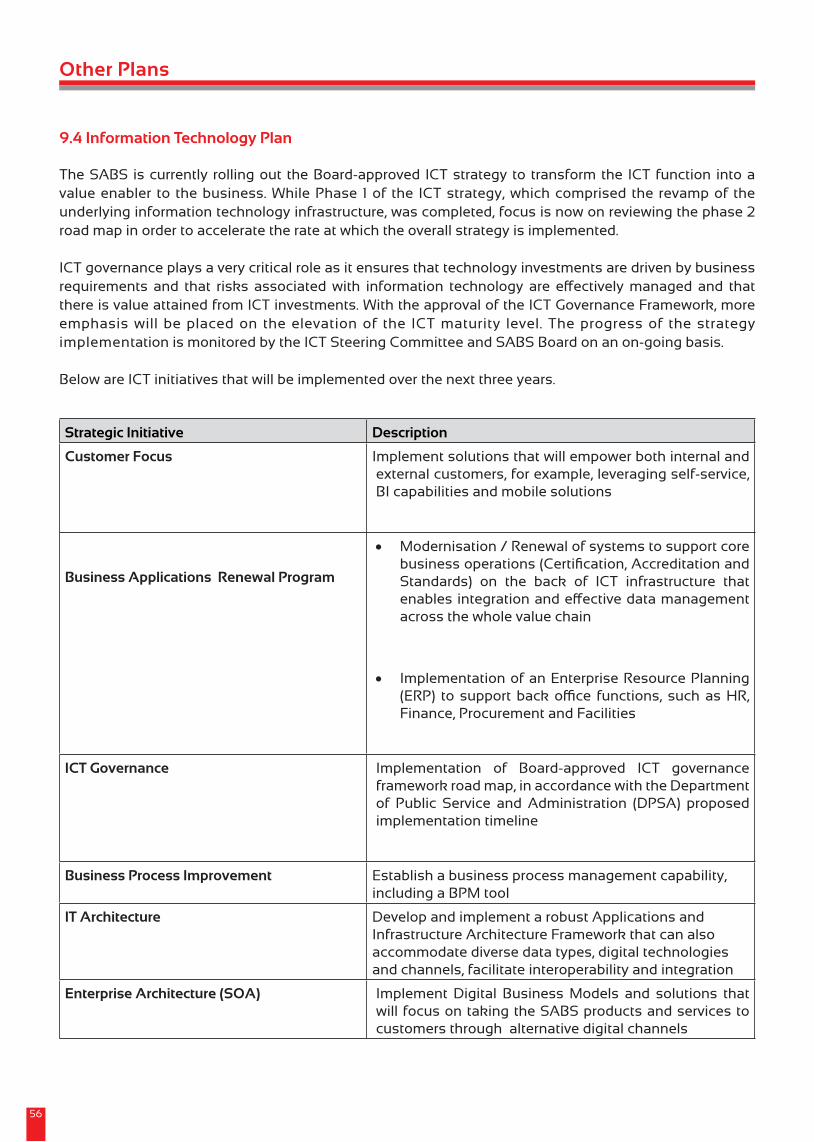
9.4 Information Technology Plan
The SABS is currently rolling out the Board-approved ICT strategy to transform the ICT function into a value enabler to the business. While Phase 1 of the ICT strategy, which comprised the revamp of the underlying information technology infrastructure, was completed, focus is now on reviewing the phase 2 road map in order to accelerate the rate at which the overall strategy is implemented.
ICT governance plays a very critical role as it ensures that technology investments are driven by business requirements and that risks associatedwith information technology are effectivelymanaged and thatthere is value attained from ICT investments. With the approval of the ICT Governance Framework, more emphasis will be placed on the elevation of the ICT maturity level. The progress of the strategy implementation is monitored by the ICT Steering Committee and SABS Board on an on-going basis.
Below are ICT initiatives that will be implemented over the next three years.
Strategic Initiative Description
Customer Focus Implement solutions that will empower both internal and external customers, for example, leveraging self-service, BI capabilities and mobile solutions
Business Applications Renewal Program
• Modernisation / Renewal of systems to support core businessoperations(Certification,AccreditationandStandards) on the back of ICT infrastructure thatenablesintegrationandeffectivedatamanagementacross the whole value chain
• Implementation of an Enterprise Resource Planning (ERP) to supportbackoffice functions, suchasHR,Finance, Procurement and Facilities
ICT Governance Implementation of Board-approved ICT governance framework road map, in accordance with the Department of Public Service and Administration (DPSA) proposed implementation timeline
Business Process Improvement Establish a business process management capability, including a BPM tool
IT Architecture Develop and implement a robust Applications and Infrastructure Architecture Framework that can also accommodate diverse data types, digital technologies and channels, facilitate interoperability and integration
Enterprise Architecture (SOA) Implement Digital Business Models and solutions that will focus on taking the SABS products and services to customers through alternative digital channels
Other Plans
56
9.5 Asset Management Plan
The Asset Management Plan of the SABS follows an integrated approach that ensures that asset management objectives are aligned to the overall strategic objectives of the organisation. The Asset Management Plan supports the strategic objectives of growth, productivity, retention of competent employees and customer centricity respectively through:• On-timedeliveryoftherightmixofassetsthatperformstobusinessneeds;• Performanceofinstalledassetsonasustainablebasis;and• Creatingandmaintainingdesirableplacesofwork.
The Asset Management Plan is presented on the following three levels:• Longrangeormasterplanningthatforecastsassetrequirementsforuptotenyearsintothefuture. Themasterplanprimarilyaddressessignificantcapitalinterventionsrelatedtoland,buildingsand infrastructure.• Mediumrangeplanning(threetofiveyears)thatisfocusedonlaboratoryequipmentaswellas detailedplanningofproperty,buildingandinfrastructureprojectsidentifiedinthemasterplan.• Shortrangeplanningofuptotwoyearsofexecutionofapprovedfundedlaboratoryequipment, building and infrastructure projects drawn from the medium range plan.
TheeffectivemanagementoflaboratoryinfrastructureisastrategicimperativefortheSABSandformsakey component of the overall Asset Management Plan. At the end of the 2013/14 performance year, the Laboratory Information Management System (LIMS) was implemented and is currently being embedded and optimised to provide accurate testing information. Focus in the next three years will be on using LIMS to improve the management of laboratory assets through:• Maintainingacompleteinventoryoflaboratoryinstruments;• Managingtheutilisationofassetsandusingthedatatoinformcapitalexpendituredecisions;and• Managingbothroutineandnon-routinemaintenanceaswellasrecordingfaultsandbreakdowns toeffectivelymanagedown-time.
Physical Asset Management is governed through approved policy and procedure and addresses the physical life cycle of the asset from acquisition to disposal as well as its accounting treatment. More recently, the Capex Committee was added to asset management governance and is comprised of diverse functional representatives who review and support new asset requests or investments to assure comprehensiveness of applications, optimisation of investment and alignment to organisational priorities.
Other Plans
57

ANNEXURE
A

DESCRIPTION OF THE PLANNING PROCESS
The planning process of the SABS runs for the majority of the performance year and is integrated with reporting (monitoring and evaluation). The key feature of the process depicted above is the review sessions with the Executive Committee as well as with the Board to ensure alignment in terms of objectives and key indicators. The planning process starts in the second quarter of the performance year with divisions developing insight documents that are used as input into the strategic planning session of the Executive Committee. The programmes and outcomes of the strategic planning session inform budgeting process before a consolidated SABS Corporate Plan is developed. The planning process is concluded with the sign-off of individual performance contracts that are cascaded directly from the business plan, organisational scorecard as well as divisional scorecards.
Description Of The Planning Process
58

ANNEXURE
B

Strategic Objective 1: Increase the use of standardisation services by broadening the scope of service
Indicator Profiles
Indicator title Revenue generated from services
Short definition Total revenue from sales and services; including core funding and rental income
Purpose/importance To provide a measure of the relevance of the organisation’s outputs to the shareholders and users of its products
Alternative indicator None
Potential other uses of indicator
None
Source/collection of data The SABS Financial Accounting System
Lead/coordinating agency The SABS Finance division
Method of calculation AccountingpoliciesforpreparationoftheSABSfinancialstatementsin accordance with GAAP/IFRS. Income excluding core funding.
Baseline R754.3 m
Target and target date for the indicator
R828.9m in 2016/17
R933.1m in 2017/18
R997.8m in 2018/19
Data limitations No limitation
Quality assurance strategy Auditedfinancialstatementsareused
Calculation type Non-cumulative
New indicator No
Reporting cycle Quarterlytothe dti and to the Board; monthly reporting internally
Desired performance >R 1 billion total revenue by 2017/18
Indicator responsibility ExecutivesforTesting,Certification,Standards,TrainingandDesignInstitute
59

Indicator title Operating profit percentageShort definition Operating Profit that is achieved by the organisation Purpose/importance The SABS needs to make sufficient revenue to cover all costs in order to be
sustainableAlternative indicator NonePotential other uses of indicator NoneSource/collection of data Income statements from Group FinanceLead/coordinating agency Group FinanceMethod of calculation (Operating Profit after depreciation/Total Income)*100%
Total Income includes Parliamentary funding Baseline -6%Target and target date for the indi-cator
-6% in 2016/17
-2% in 2017/18
2% in 2018/19Data limitations No limitationQuality assurance strategy Audited financial statements are usedType of indicator OutcomeCalculation type Non-cumulativeNew indicator NoReporting cycle Quarterly to the dti and to the Board; monthly reporting internallyDesired performance >10%Indicator responsibility Chief Financial Officer
Indicator Profiles
60

Indicator Profiles
Indicator titleIncrease in services to support growth in services offered in line with government and socio-economic priorities
Short definition Newofferingsandproductsdevelopedtoincreasethescopeofservicesoffered
Purpose/importance This indicator encourages a continuous development of new services to maintain alignment to the changing needs of the economy
Alternative indicator None
Potential other uses of indicator None
Source/collection of data Product Information Sheet;
Product/Service Brochure
Lead/coordinating agency Certificationdivision
Method of calculation Countthenumberofnewservicesandofferings
Baseline None
Target and target date for the indicator
2 in 2016/17
3 in 2017/18
4 in 2018/19
Data limitations No limitation
Quality assurance strategy Signed-offdocumentationbyresponsibleexecutive;Internalauditassures performance information every quarter
Type of indicator Output
Calculation type Cumulative
New indicator Yes
Reporting cycle Quarterlytothe dti and to the Board; monthly reporting internally
Desired performance Atleast2newofferingsayear
Indicator responsibility Executive:Certification
61
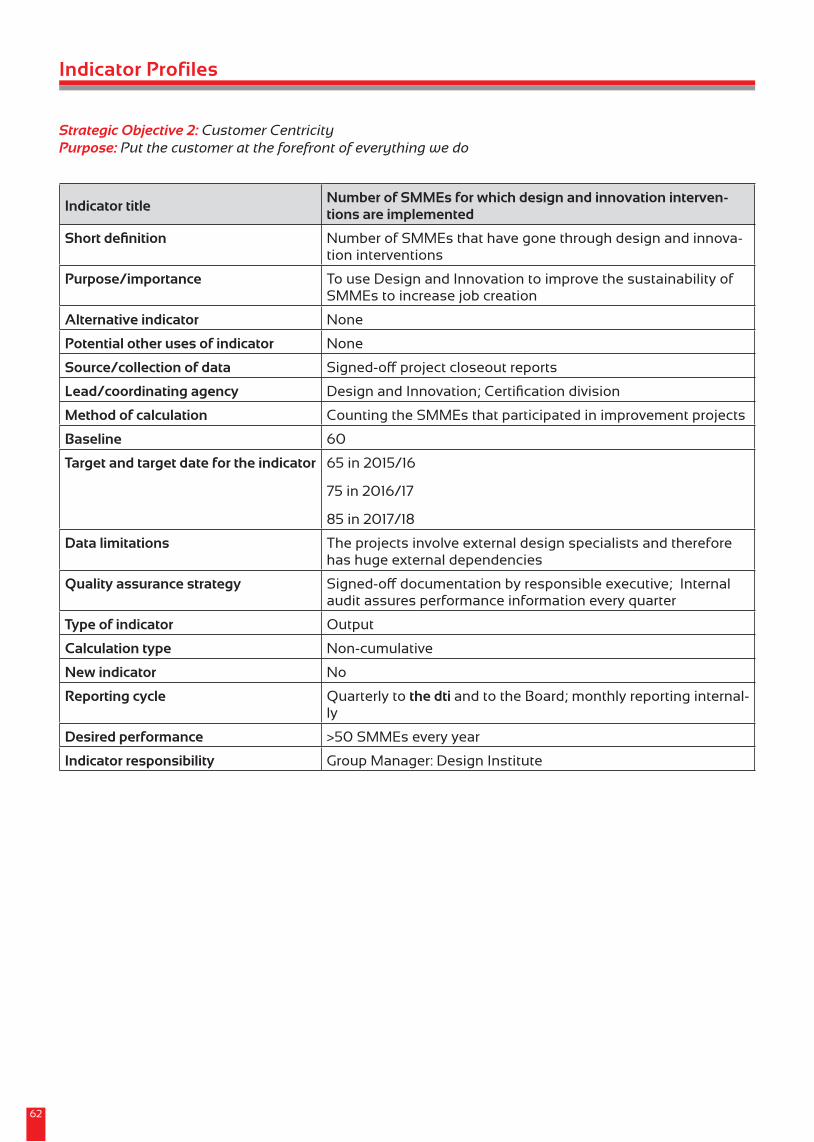
Strategic Objective 2: Customer CentricityPurpose: Put the customer at the forefront of everything we do
Indicator titleNumber of SMMEs for which design and innovation interven-tions are implemented
Short definition Number of SMMEs that have gone through design and innova-tion interventions
Purpose/importance To use Design and Innovation to improve the sustainability of SMMEs to increase job creation
Alternative indicator None
Potential other uses of indicator None
Source/collection of data Signed-offprojectcloseoutreports
Lead/coordinating agency DesignandInnovation;Certificationdivision
Method of calculation Counting the SMMEs that participated in improvement projects
Baseline 60
Target and target date for the indicator 65 in 2015/16
75 in 2016/17
85 in 2017/18
Data limitations The projects involve external design specialists and therefore has huge external dependencies
Quality assurance strategy Signed-offdocumentationbyresponsibleexecutive;Internalaudit assures performance information every quarter
Type of indicator Output
Calculation type Non-cumulative
New indicator No
Reporting cycle Quarterlytothe dti and to the Board; monthly reporting internal-ly
Desired performance >50 SMMEs every year
Indicator responsibility Group Manager: Design Institute
Indicator Profiles
62

Indicator Profiles
Indicator title Number of sector-specific publications produced
Short definition Number of sector-specific publications produced and distributed to various sectors to highlight the importance of standardisation
Purpose/importance Thesector-specificpublicationswillincreaseunderstandingand awareness of standardisation as a tool that should be used to improve performance and service delivery
Alternative indicator None
Potential other uses of indicator None
Source/collection of data Electronic copies of publications produced
Lead/coordinating agency Certificationdivision
Method of calculation Counting the number of publications produced
Baseline None
Target and target date for the indicator 4 in 2015/16
4 in 2016/17
4 in 2017/18
Data limitations None
Quality assurance strategy Signed-offdocumentationbyresponsibleexecutive;Internalaudit assures performance information every quarter
Type of indicator Output
Calculation type Non-cumulative
New indicator Yes
Reporting cycle Quarterlytothe dti and to the Board; monthly reporting internally
Desired performance 4 every year
Indicator responsibility Executive: Corporate Services
63
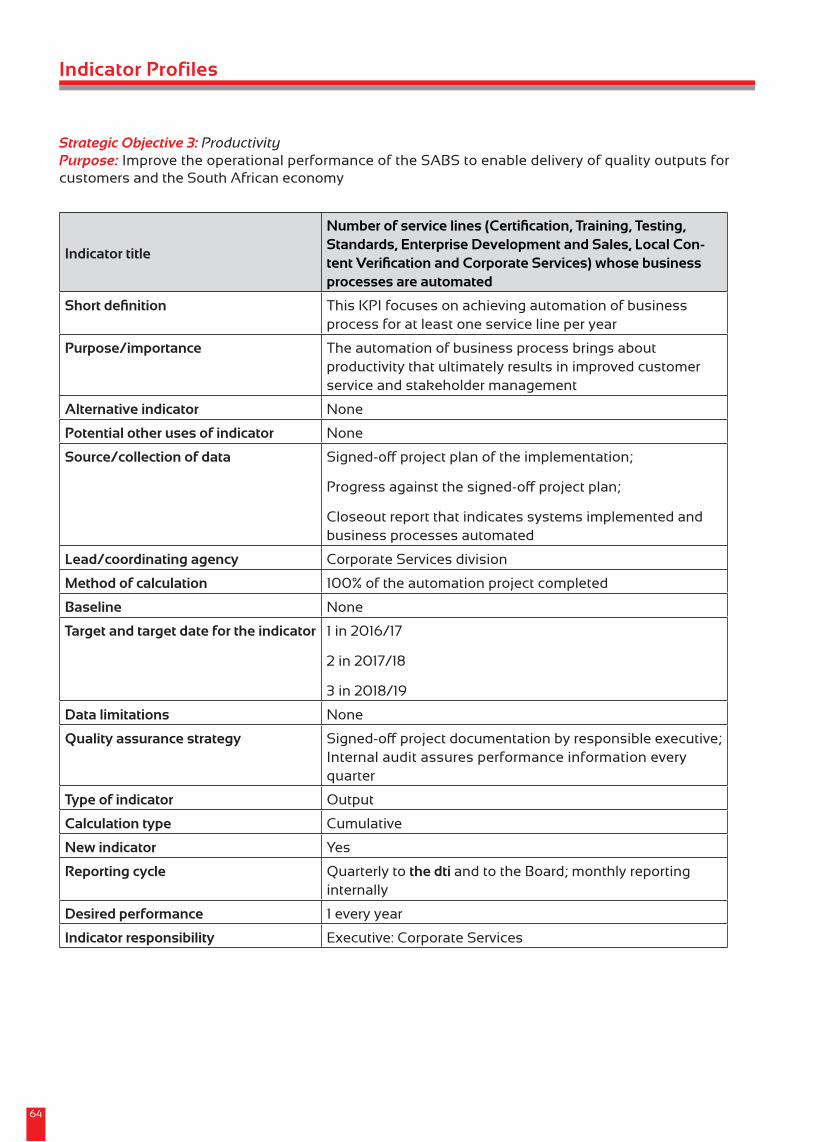
Strategic Objective 3: ProductivityPurpose: Improve the operational performance of the SABS to enable delivery of quality outputs for customers and the South African economy
Indicator title
Number of service lines (Certification, Training, Testing, Standards, Enterprise Development and Sales, Local Con-tent Verification and Corporate Services) whose business processes are automated
Short definition This KPI focuses on achieving automation of business process for at least one service line per year
Purpose/importance The automation of business process brings about productivity that ultimately results in improved customer service and stakeholder management
Alternative indicator None
Potential other uses of indicator None
Source/collection of data Signed-offprojectplanoftheimplementation;
Progressagainstthesigned-offprojectplan;
Closeout report that indicates systems implemented and business processes automated
Lead/coordinating agency Corporate Services division
Method of calculation 100% of the automation project completed
Baseline None
Target and target date for the indicator 1 in 2016/17
2 in 2017/18
3 in 2018/19
Data limitations None
Quality assurance strategy Signed-offprojectdocumentationbyresponsibleexecutive;Internal audit assures performance information every quarter
Type of indicator Output
Calculation type Cumulative
New indicator Yes
Reporting cycle Quarterlytothe dti and to the Board; monthly reporting internally
Desired performance 1 every year
Indicator responsibility Executive: Corporate Services
Indicator Profiles
64

Indicator Profiles
Indicator titleProgress against the implementation of the SABS Property Strategy
Short definition Progress against the implementation of the SABS Property Strategy that includes the Public Private Partnership to develop the Groenkloof facility
Purpose/importance The development will maximise the value of the asset. The property is large, some parts are unused and it is on a prime site.
Alternative indicator None
Potential other uses of indicator None
Source/collection of data Signed-offprojectplanoftheimplementation;
Progressagainstthesigned-offprojectplan
Lead/coordinating agency Finance division
Method of calculation 20%ofthesigned-offprojectplancompleted
Baseline SigningoffofthePPPbythe dti
Target and target date for the indicator Completion of detailed planning for the PPP and approval of the plan in 2016/17
10%ofthesigned-offprojectplancompletedin2017/18
20%ofthesigned-offprojectplancompletedin2018/19
Data limitations None
Quality assurance strategy Signed-offprojectdocumentationbyresponsibleexecutive;Internal audit assures performance information every quarter
Type of indicator Output
Calculation type Cumulative
New indicator Yes
Reporting cycle Quarterlytothe dti and to the Board; monthly reporting internally
Desired performance Full development completed by 2019/20
Indicator responsibility ChiefFinancialOfficer
65

Indicator titleProgress against the implementation of the Standardisation Action Plan directly aligned to the National Development Plan
Short definition Progress against the implementation of the Standardisation Action Plan that is directly linked to the National Development Plan
Purpose/importance It is important for standards development activities to be linked directly to national imperatives
Alternative indicator None
Potential other uses of indicator None
Source/collection of data Signed-offActionPlan;
Signed-offdetailedprojectplanforexecutingidentifiedactions;
Progressagainstthesigned-offprojectplan
Lead/coordinating agency Standards division
Method of calculation Progressagainstsigned-offprojectplan
Baseline None
Target and target date for the indicator 50% of progress made against the plan in 2016/17
80% of progress made against the plan in 2017/18
100% of progress made against the plan in 2018/19
Data limitations None
Quality assurance strategy Signed-offprojectdocumentationbyresponsibleexecutive;Internal audit assures performance information every quarter
Type of indicator Output
Calculation type Cumulative
New indicator Yes
Reporting cycle Quarterlytothe dti and to the Board; monthly reporting internally
Desired performance Full alignment to the National Development Plan by 2018/19
Indicator responsibility Executive: Standards
Indicator Profiles
66

Indicator Profiles
Indicator titleProgress against the implementation of the Testing Action Plan to close gaps in serving Certification customers
Short definition Progress against the implementation of the Testing Action PlantoclosegapsthatwereidentifiedservingCertificationcustomers
Purpose/importance GrowthinboththeTestingandCertificationbusinessisdependent on the extent to which all gaps are closed
Alternative indicator None
Potential other uses of indicator None
Source/collection of data Signed-offActionPlan;
Signed-offdetailedprojectplanforexecutingidentifiedactions;
Progressagainstthesigned-offprojectplan
Lead/coordinating agency Testing division
Method of calculation Progressagainstsigned-offprojectplan
Baseline None
Target and target date for the indicator Implementation of 100% of the action plan in 2016/17
Data limitations None
Quality assurance strategy Signed-offprojectdocumentationbyresponsibleexecutive;Internal audit assures performance information every quarter
Type of indicator Output
Calculation type Cumulative
New indicator Yes
Reporting cycle Quarterlytothe dti and to the Board; monthly reporting internally
Desired performance Full alignment to the National Development Plan by 2018/19
Indicator responsibility Executive: Testing
67

Indicator titleNumber of technical employees that have completed specialist training with leading partners
Short definition Number of technical employees that have completed specialist training with leading international partners with the aim of building capacity and capability in South Africa
Purpose/importance It is important for the SABS to have the capacity and the capability to conduct all required testing at the SABS facilities in South Africa
Alternative indicator None
Potential other uses of indicator None
Source/collection of data Signed-offDetailedTrainingPlan;
Signed-offcompletionreportsbycandidates
Lead/coordinating agency Human Capital division
Method of calculation Progressagainstthesigned-offTrainingPlan;
Completion reports by candidates
Baseline None
Target and target date for the indicator 5 employees trained in 2016/17
8 employees trained in 2017/18
12 employees trained in 2018/19
Data limitations None
Quality assurance strategy Signed-offprojectdocumentationbyresponsibleexecutive;Internal audit assures performance information every quarter
Type of indicator Output
Calculation type Cumulative
New indicator Yes
Reporting cycle Quarterlytothe dti and to the Board; monthly reporting internally
Desired performance At least 10 candidates receive specialist training by 2018/19
Indicator responsibility Executive: Human Capital
Indicator Profiles
68
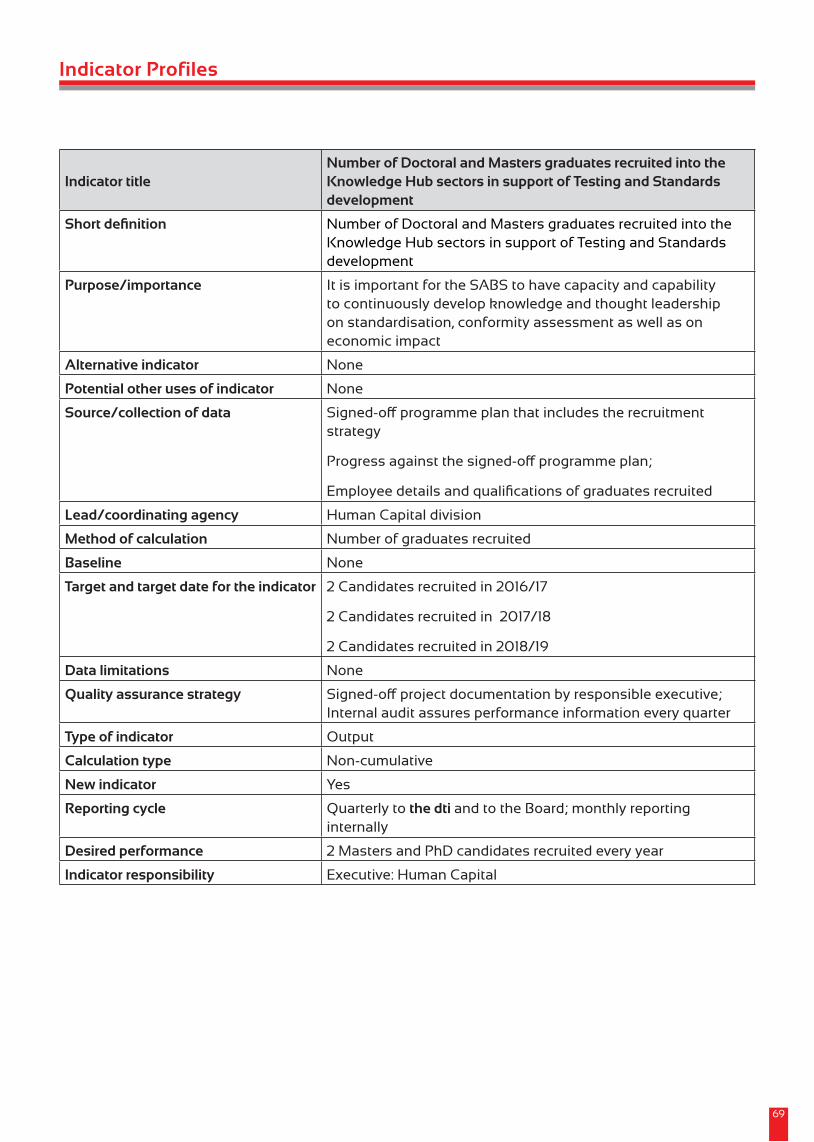
Indicator Profiles
69
Indicator titleNumber of Doctoral and Masters graduates recruited into the Knowledge Hub sectors in support of Testing and Standards development
Short definition Number of Doctoral and Masters graduates recruited into the Knowledge Hub sectors in support of Testing and Standards development
Purpose/importance It is important for the SABS to have capacity and capability to continuously develop knowledge and thought leadership on standardisation, conformity assessment as well as on economic impact
Alternative indicator None
Potential other uses of indicator None
Source/collection of data Signed-offprogrammeplanthatincludestherecruitmentstrategy
Progressagainstthesigned-offprogrammeplan;
Employeedetailsandqualificationsofgraduatesrecruited
Lead/coordinating agency Human Capital division
Method of calculation Number of graduates recruited
Baseline None
Target and target date for the indicator 2 Candidates recruited in 2016/17
2 Candidates recruited in 2017/18
2 Candidates recruited in 2018/19
Data limitations None
Quality assurance strategy Signed-offprojectdocumentationbyresponsibleexecutive;Internal audit assures performance information every quarter
Type of indicator Output
Calculation type Non-cumulative
New indicator Yes
Reporting cycle Quarterlytothe dti and to the Board; monthly reporting internally
Desired performance 2 Masters and PhD candidates recruited every year
Indicator responsibility Executive: Human Capital
