acr 2015 workforce study report i | p a g e · acr 2015 workforce study report iii | p a g e ......
TRANSCRIPT

ACR 2015 Workforce Study Report i | P a g e

Support for this project was by
American College of Rheumatology Committee on Training and Workforce Issues (COTW)
2200 Lake Boulevard NE, Atlanta, GA 30319
Submitted by: Academy for Academic Leadership
3565 Piedmont Road, N.E. Building One, Suite 430
Atlanta, Georgia 30305 ● (702) 685-1171

ACR 2015 Workforce Study Report ii | P a g e
COPYRIGHT © 2016 and 2017 This document contains proprietary research, copyrighted materials, and literary property of American College of Rheumatology (ACR). No changes may be made to this document without the express written permission of the ACR. All other trademarks or copyrights within are property of their respective owners.
American College of Rheumatology 2200 Lake Boulevard NE Atlanta, GA 30319
Academy for Academic Leadership 3565 Piedmont Road, N.E. Building One, Suite 430 Atlanta, Georgia 30305

ACR 2015 Workforce Study Report iii | P a g e
Acknowledgements AAL would like to thank the American College of Rheumatology (ACR) for providing the support for this workforce study. AAL would like to thank all the members of the ACR Workforce Study Group (WSG) who provided insight and expertise that greatly assisted in the success of this project. In particular, AAL would like to thank the co-chairs, Drs. Daniel Battafarano and Seetha Monrad for their continuous support, patience, motivation, enthusiasm, and immense knowledge and insight. AAL would like to thank Ms. Kamilah Lewis, Director, Training and Workforce, American College of Rheumatology, for her continued support and guidance for the WSG. AAL would like to thank Ms. Lauren Evans, Senior Specialist, Practice Guidelines Development, who provided valuable membership information for the WSG. The ACR WSG would like to express their gratitude to the Arthritis Foundation for their support in developing and distributing patient surveys. Gathering data from patients added an additional dimension to the workforce study that had not been included in the 2005 workforce study.

ACR 2015 Workforce Study Report iv | P a g e
Revisions
1. Clarification to further explain how the Clinical FTE was applied to pediatric rheumatologists. Clarifications were added to sections E.5.2, 1.2.1, and 6.1.2.
2. Correction of references made to Nurse Practitioners (NPs) as Advance Practice Nurses (APNs). To ensure consistency, all were changed to Nurse Practitioners (NPs).

ACR 2015 Workforce Study Report v | P a g e
Table of Contents Acknowledgements ..................................................................................................................................... iii
Revisions ..................................................................................................................................................... iv
EXECUTIVE SUMMARY ................................................................................................................................ 1
E.1 Purpose of the Report ....................................................................................................................... 1
E.1.1 Supply-based Method. ............................................................................................................... 1
E.1.2 Demand-based Method. ............................................................................................................ 1
E.1.3 Needs-based Method. ................................................................................................................ 1
E.1.4 Integrated Method. .................................................................................................................... 1
E.2 Brief Review of Literature ................................................................................................................. 2
E.2.1 Prevalence of Doctor-Diagnosed Arthritis. ................................................................................ 3
E.2.2 Incidence of Doctor-Diagnosed Arthritis. .................................................................................. 3
E.2.3 Current Workforce. .................................................................................................................... 4
E.2.4 Diversity of the Workforce. ........................................................................................................ 5
E.2.5 Geographic Distribution. ............................................................................................................ 6
E.2.6 Metropolitan Statistical Areas (MSA)......................................................................................... 6
E.3 Supply and Demand Projections ....................................................................................................... 7
E.3.1 Supply-Demand Model Assumptions. ........................................................................................ 7
E.3.2 Supply Factors. ........................................................................................................................... 9
E.3.3 Demand Factors. ...................................................................................................................... 12
E.3.4 Excess Demand for Adult Rheumatologists. ............................................................................ 13
E.3.5 Excess Demand for Pediatric Rheumatologists. ....................................................................... 14
E.3.6 Sensitivity Testing. ................................................................................................................... 16
E.4 Worst-Case and Best-Case Scenario Models .................................................................................. 19
E.4.1 Adult Rheumatology ................................................................................................................ 19
E.4.2 Pediatric Rheumatology ........................................................................................................... 21
E.5 Limitations of the 2015 Workforce Study ....................................................................................... 23
E.5.1 Baseline Rheumatology Specialist Numbers. ........................................................................... 23
E.5.2 Full-time Equivalent (FTE) calculations. ................................................................................... 23
E.5.3 Primary Data Collection ........................................................................................................... 23
E.5.4 Evaluation of Model Factors .................................................................................................... 24
E.6 Recommendations for Addressing Excess Demand ........................................................................ 24
E.6.1 General Recommendation: Reassess Workforce Strategic Plan .............................................. 24

ACR 2015 Workforce Study Report vi | P a g e
E.6.2 Recruitment of Rheumatology Workforce ............................................................................... 25
E.6.3 Access-to-Care.......................................................................................................................... 26
1. INTRODUCTION ..................................................................................................................................... 28
1.1 Purpose ........................................................................................................................................... 28
1.2 Rheumatology Workforce ............................................................................................................... 29
1.2.1 Clinical FTE Defined. ................................................................................................................. 30
1.3 Workforce Study Analysis and Limitations ..................................................................................... 31
1.4 References ................................................................................................................................ 32
2. LITERATURE REVIEW SUMMARY ........................................................................................................... 34
2.1 Introduction .................................................................................................................................... 34
2.2 Implications ..................................................................................................................................... 36
2.3 Prevalence of Rheumatic Diseases ................................................................................................. 37
2.4 Incidence of Rheumatic Diseases .................................................................................................... 39
2.5 Arthritis-Attributable Limitations and Disability ............................................................................. 39
2.6 References ...................................................................................................................................... 41
3. CURRENT WORKFORCE ..................................................................................................................... 43
3.1 Defining the Current Workforce ..................................................................................................... 43
3.1.1 Rheumatology Physician Providers. ......................................................................................... 44
3.1.2 Non-Physician Specialty Providers. .......................................................................................... 44
3.2 Characteristics of Current Workforce ............................................................................................. 46
3.2.1 AAMC Physician Specialty Data................................................................................................ 46
3.2.2 ABIM Physician Specialty Data. ................................................................................................ 46
3.2.3 ABP Physician Specialty Data. .................................................................................................. 46
3.2.4 Data from 2015 Workforce Survey. ......................................................................................... 46
3.3 Diversity of the Workforce .............................................................................................................. 47
3.3.1 Gender Differences. ................................................................................................................. 48
3.3.2 Race/Ethnic Differences. .......................................................................................................... 50
3.3.3 Generational Differences. ........................................................................................................ 50
3.4 Geographic Distribution of Rheumatologists .................................................................................. 51
3.4.1 Adult Rheumatology Distribution. ........................................................................................... 51
3.4.2 Pediatric Rheumatology Distribution. ...................................................................................... 52
3.4.3 Regional Distribution of Physician per Population. ................................................................. 52
3.4.3 Metropolitan Statistical Areas (MSA). ..................................................................................... 54

ACR 2015 Workforce Study Report vii | P a g e
3.5 References ...................................................................................................................................... 56
4. SUPPLY AND DEMAND .......................................................................................................................... 59
4.1 Introduction .................................................................................................................................... 59
4.2 Supply-Demand Model ................................................................................................................... 60
4.2.1 Supply-Demand Model Assumptions ....................................................................................... 60
4.3 Supply Factors ................................................................................................................................. 61
4.3.1 Current rheumatology providers and demographic changes. ................................................. 62
4.3.2 Fellowships. .............................................................................................................................. 64
4.3.3 Succession planning trends. ..................................................................................................... 66
4.3.4 Patient workload trends (e.g., # patients and # of working hours) ......................................... 66
4.3.5 Practice setting (non-academic vs. academic health center). ................................................. 72
4.4 Demand Factors .............................................................................................................................. 73
4.4.1 Regression Modeling. ............................................................................................................... 73
4.4.2 Per Capita Income. ................................................................................................................... 75
4.4.3 Prevalence of Rheumatic Diseases. ......................................................................................... 75
4.4.4 Health Care Coverage and Utilization ...................................................................................... 76
4.4.5 Changes in the population demographics. .............................................................................. 79
4.5 References ...................................................................................................................................... 80
5. SUPPLY-DEMAND PROJECTIONS ....................................................................................................... 84
5.1 Supply Adult Rheumatology Services ....................................................................................... 84
5.1.1 Geographic Distribution ........................................................................................................... 86
5.1.2 RVU-productivity ...................................................................................................................... 87
5.1.3 Succession Factor ..................................................................................................................... 88
5.1.4 Gender factor ........................................................................................................................... 88
5.1.5 Generational differences factor ............................................................................................... 88
5.1.6 Full-time/Part-time factor ........................................................................................................ 88
5.1.7 Practice Setting ........................................................................................................................ 88
5.1.8 New Graduate Entrants to the Workforce (FITs) ..................................................................... 89
5.2 Supply Pediatric Rheumatology Services .................................................................................. 89
5.2.1 Geographic Distribution ........................................................................................................... 91
5.2.2 RVU-productivity ...................................................................................................................... 92
5.2.3 Succession Factor ..................................................................................................................... 92
5.2.4 Gender factor ........................................................................................................................... 93

ACR 2015 Workforce Study Report viii | P a g e
5.2.5 Generational differences factor ............................................................................................... 93
5.2.6 Full-time/Part-time factor ........................................................................................................ 93
5.2.7 Practice Setting ........................................................................................................................ 93
5.2.8 New Entrants to the Workforce (FIT) ....................................................................................... 93
5.3 Supply Non-Physician Services ........................................................................................................ 94
5.4 Demand Rheumatology Services (Adult and Pediatric) .................................................................. 94
5.4.1 Prevalence of Rheumatoid Diseases. ....................................................................................... 95
5.4.2 Patient Demographics. ............................................................................................................. 95
5.4.3 Per Capita Income. ................................................................................................................... 95
5.4.4 Health Care Expenditures. ....................................................................................................... 95
5.4.5 Excess Demand for Adult Rheumatologists. ............................................................................ 95
5.4.6 Excess Demand for Pediatric Rheumatologists. ....................................................................... 97
5.5 Sensitivity Testing ........................................................................................................................... 99
5.5.1 Sensitivity Testing. ................................................................................................................. 100
5.6. Best-Case and Worst-Case Scenario Models ............................................................................... 103
5.6.1 Adult Rheumatology: ............................................................................................................. 104
5.7 References .................................................................................................................................... 109
6. DISCUSSION AND RECOMMENDATIONS ............................................................................................. 111
6.1 Limitations of the 2015 Workforce Study ..................................................................................... 111
6.1.1 Baseline Rheumatology Specialist Numbers. ......................................................................... 111
6.1.2 Full-time Equivalent (FTE) calculations .................................................................................. 111
6.1.3 Primary Data Collection ......................................................................................................... 111
6.1.4 Evaluation of Model Factors .................................................................................................. 112
6.2 Recommendations for Addressing Excess Demand ...................................................................... 112
6.2.1 General Recommendation: Reassess Workforce Strategic Plan ............................................ 112
6.2.2 Recruitment of Rheumatology Workforce............................................................................. 113
6.2.3 Access-to-Care ....................................................................................................................... 114
Appendix A. ACR Workforce Study Group Membership ........................................................................ 117
Appendix B. Workforce Process Chart ................................................................................................... 119
Appendix C. Supply and Demand Model ................................................................................................ 120
Appendix D. Active Adult Rheumatologists by State ............................................................................. 122
Appendix E. Active Pediatric Rheumatologists by State ........................................................................ 125
Appendix F. Active Rheumatologists U.S. Distribution by Region ......................................................... 128

ACR 2015 Workforce Study Report ix | P a g e
Appendix G. Regional Distribution of ACR Workforce Survey Respondents .......................................... 129
Appendix H. Metropolitan Statistical Areas ............................................................................................ 130

ACR 2015 Workforce Study Report x | P a g e
List of Tables Page #
E-1. Prevalence Estimates of Rheumatic Diseases ……………………………………………………………………. 3
E-2. Current Primary Rheumatology Workforce by Specialty……………………………………………………. 5
E-3. Regional Distribution of Physician per Population Data Breakdown …………………………………. 6
E-4. Adult Rheumatology Workforce Supply Projections………………………………………………………….. 9
E-5. Pediatric Rheumatology Workforce Supply Projections…………………………………………………….. 9
E-6. Adult Rheumatology Workforce Demand Projections……………………………………………………….. 12
E-7. Pediatric Rheumatology Workforce Demand Projections………………………………………………….. 12
E-8. Sensitivity Testing for Gender Differences…………………………………………………………………………. 17
E-9. Sensitivity Testing for Retirement Projections…………………………………………………………………… 17
E-10. Sensitivity Testing for Part-time vs. Full-time Workforce…………………………………………………. 17
E-11. Sensitivity Testing for Numbers of Rheumatologists Working in Private Practice…………….. 18
E-12. Sensitivity Testing for New Graduate Entrants into Workforce………………………………………… 18
E-13. Sensitivity Testing for Mid-Level Providers………………………………………………………………………. 19
E-14. Sensitivity Testing for Patient Demand……………………………………………………………………………. 19
E-15. Model A Supply and Demand - Adult Rheumatology (Worst-Case Scenario)……………………. 20
E-16. Model B Supply and Demand - Adult Rheumatology (Best-Case Scenario)………………………. 20
E-17. Model C Supply and Demand - Pediatric Rheumatology (Worst-Case Scenario)………………. 21
E-18. Model D Supply and Demand - Pediatric Rheumatology (Best-Case Scenario)…………………. 22
2-1 Prevalence Estimates of Rheumatic Diseases in U.S……………………………………………………………. 39
3-1 Current Primary Rheumatology Workforce by Specialty ………….………………………………………… 43
3-2 Comparison ACR Membership Profile Numbers to Workforce Study Respondents…………….. 47
3-3 Race and Ethnic Breakdown of Respondents by Discipline…………………………………………………. 50
3-4 Regional Physician per Population Data Breakdown…………………………………………………………… 53
3-5 Comparison Regional Data to Survey Respondents…………………………………………………………….. 54
4-1 Current Primary Provider Rheumatology Workforce by Training………………………………………… 62
4-2 Total Adult Rheumatologist Candidates Certified……………………………………………………………….. 62
4-3 Adult Rheumatologists with Valid Certificates by State ……………………………………………………… 62
4-4 Number of Pediatric Diplomates Certified by year……………………………………………………………… 63
4-5 Number of Initial Adult Rheumatology Fellowship Certifications………………………………………… 64
4-6 Percentage of Board Exam Pass Rates Adult Rheumatology Fellows…………………………………… 65
4-7 Adult Rheumatology Fellows Match Trend Data…………………………………………………………………. 65
4-8 Pediatric Rheumatologist Medical School Tracking by Year …..…………………………………………… 65
4-9 Pediatric Rheumatology Fellows Trend Data……………………..…………………………………………….... 65
4-10 Reported Average Annual Patient Visits by Gender………………………………………………………….. 68
4-11 Physician Reported Wait Times for New Patient Appointments……………………………………….. 68
4-12 Physician Reported Average Time Intervals for Stable Patients with Rheumatic Disease… 68
4-13 Factors Affecting Demand………………………………………………………………………………………………… 69
4-14 Regression Modeling Factors Affecting Demand………………………………………………………………. 75
4-15 Number People and Events Reported for Arthritic Diseases, US, 2013……………………………… 76

ACR 2015 Workforce Study Report xi | P a g e
List of Tables Page #
4-16 U.S. Population Trends (Millions) 2005-2060……………………………………………………………………. 79
5-1 Current Workforce Baseline Numbers………………………………………………………………………………… 84
5-2 Summary of Factors/Assumptions Applied to Adult Rheumatology Supply Projections……… 86
5-3 Regional Distribution of Adult Physician per Population Data Breakdown……..…………………… 87
5-4 Adult Rheumatology Workforce Supply Projections…………………………………………………………… 89
5-5 Summary of Factors/Assumptions Applied to Pediatric Rheumatology Supply Projections… 91
5-6 Regional Distribution of Pediatrician Physician per Population Data Breakdown………………… 92
5-7 Pediatric Rheumatology Workforce Supply Projections………………………………………………………. 94
5-8 Adult Rheumatology Workforce Patient Demand Projections…………………………………………….. 96
5-9 Pediatric Rheumatology Workforce Patient Demand Projections…………………………………....... 97
5-10 Sensitivity Testing for Gender Differences……………………………………………………………………….. 100
5-11 Sensitivity Testing for Retirement Projections…………………………………………………………………. 101
5-12 Sensitivity Testing for Part-time vs. Full-time Workforce………………………………………………….. 101
5-13 Sensitivity Testing for Numbers of Rheumatologists Working in Private Practice……………… 101
5-14 Sensitivity Testing for New Graduate Entrants into Workforce………………………………………... 102
5-15 Sensitivity Testing for Mid-Level Providers……………………………………………………………………….. 102
5-16 Sensitivity Testing for Patient Demand……………………………………………………………………………… 102
5-17 Summary of Factors/Assumptions Applied Projections…………………………………………………….. 103
5-18. Model A Supply and Demand - Adult Rheumatology (Worst-Case Scenario)……………………. 104
5-19. Model B Supply and Demand - Adult Rheumatology (Best-Case Scenario) ……………………… 105
5-20. Model C Supply and Demand - Pediatric Rheumatology (Worst-Case Scenario) ……………… 107
5-21. Model D Supply and Demand - Pediatric Rheumatology (Best-Case Scenario) ………………… 107

ACR 2015 Workforce Study Report xii | P a g e
List of Figures Page # E-1. Comparison of Projected Supply Adult Rheumatology Workforce……………………………………… 10
E-2. Adult Physician Workforce Projections: Actual vs. Clinical FTE…………………………………………… 10
E-3. Comparison of Projected Supply of Pediatric Rheumatology Workforce……………………………. 11
E-4. Pediatric Physician Workforce Projections: Actual vs. Clinical FTE……………………………………… 11
E-5. Comparison of Projected Supply and Projected Demand of Adult Rheumatologists………….. 13
E-6. Projection of Male vs. Female Adult Rheumatologists, 2005-2030…………………………………….. 14
E-7. Comparison of Projected Supply and Projected Demand of Pediatric Rheumatologists……… 15
E-8. Projection of Male vs. Female Pediatric Rheumatologists, 2005-2030……………………………….. 16
2-1 Projected Prevalence of Doctor-Diagnosed Arthritis-U.S. Adults >18, 2005-2030……………….. 38
2-2 Self-Reported Functional Limitation……………………………………………………………………………………. 40
2-3 Arthritis Attributable Work Limitations by State…………………………………………………………………. 41
3-1 Gender Differences by Specialty…………………………………………………………………………………………. 48
3-2 Age Distribution by Gender for Adult Rheumatologists………………………………………………………. 49
3-3 Age Distribution by Gender for Pediatric/Med-Ped Rheumatologists…………………………………. 49
3-4 Percent Comparisons: Generational Comparisons by Discipline…………………………………………. 51
3-5 Breakdown of Adult Rheumatologists by Region………………………………………………………………… 52
3-6 Breakdown of Pediatric Rheumatologists by Region…............................................................ 53
3-7 New MSA Areas, 2013………………………………………………………………………………………………………… 55
4-1 Factors Affecting Supply and Demand………………………………………………………………………………… 60
4-2 Perceived Difficult in Seeking Urgent Care Treatment………………………………………………………… 69
4-3 Providers Patients Seek for Urgent Care……………………………………………………………………………… 70
4-4 2015 Medscape Physician Compensation Report………………………………………………………………… 71
4-5 Rheumatologist Compensation by Geographic Area, 2015 ………………………………………………… 72
4-6 Overall Career Satisfaction…………………………………………………………………………………………………. 73
4.7 Regression model formula Adult Rheumatologists……………………………………………………………… 74
4.8 Regression model formula Pediatric Rheumatologists………………………………………………………… 74
4-9 Prevalence of Common Forms of Arthritis in the U.S. .……………………………………………………….. 76
4-10 Average Annual Cost of Rheumatology Care, Journal of Managed Pharmacy……………………. 77
4-11 Rheumatologists participation in Payment Models…………………………………………………………… 78
4-12 Price Increases in DMARDs over Time………………………………………………………………………………. 79
5-1 Projected Supply of Adult Rheumatology Workforce………………………………………………………….. 85
5-2 Adult Physician Workforce Projections: Actual vs. Clinical FTE …………………………………………... 85
5-3 Projected Supply of Pediatric Rheumatology Workforce.....…………………………….…………………. 90
5-4 Pediatric Physician Workforce Projections: Actual vs. Clinical FTE………………………….…………… 90
5-5 Comparison of Projected Supply and Projected Demand of Adult Rheumatologists ………..… 96
5-6 Projection of Male vs. Female Adult Rheumatologists, 2005-2030……………………………………… 97
5-7 Comparison of Projected Supply and Projected Demand of Pediatric Rheumatologists…….. 98
5-8 Projection of Male vs. Female Pediatric Rheumatologists, 2005-2030……………………………….. 99
5-9 Adult Rheumatology Sensitivity Testing Results………………………………………………………………….. 106
5-10 Pediatric Rheumatology Sensitivity Testing Results …………………………………………………………. 108

ACR 2015 Workforce Study Report xiii | P a g e
List of Appendices Page # A: ACR Workforce Study Group Membership………………………………………………………………………….. 117
B: Workforce Process Flowchart……………………………………………………………………………………………… 119
C: Supply and Demand Model…………………………………………………………………………………………………. 120
D: Active Adult Rheumatologists by State……………………………………………………………………………….. 122
E: Active Pediatric Rheumatologists by State…………………………………………………………………………… 125
F: Active Rheumatologists U.S. Distribution by Region……………………………………………………………. 128
G: Regional Distribution of ACR Workforce Survey Respondents…………………………………………….. 129
H: Metropolitan Statistical Areas…………………………………………………………................................. 130

ACR 2015 Workforce Study Report 1 | P a g e
EXECUTIVE SUMMARY The American College of Rheumatology Workforce Study Group (WSG) was comprised of a core leadership group consisting of two co-chairs appointed by the ACR Committee on Workforce and Training, an ACR representative, and two AAL representatives (Appendix A). In addition, there were eight core members and additional expert liaisons made up of various affiliations and disciplines to ensure a wide-range of ideas and experiences in the field of rheumatology.
E.1 Purpose of the Report Ten years have elapsed since the last workforce study, and much has changed. There are many anticipated challenges now and in the near future to train and sustain a robust workforce of rheumatology specialists. There are many types of workforce studies using a variety of methods. Listed below are key workforce modeling methods.
E.1.1 Supply-based Method. This approach determines simple future projections of the numbers of required health workers based on proposed thresholds for workforce density. This equates to determining the total number of physicians in the workforce without regard for patient need.
E.1.2 Demand-based Method. This approach draws on observed health services utilization rates for different population groups, and then applies these rates to the future population profile to determine the scope and nature of expected demands for services. These demands are converted into required health personnel by means of established productivity standards or norms (e.g., RVUs, etc.).
E.1.3 Needs-based Method. This more in-depth approach explores likely changes in population needs for health services based on changes in patterns of disease, disabilities and injuries, and the numbers and kinds of services required to respond to these outcomes. Similar to the demand-based model, these demands are converted into required health personnel by means of established productivity standards or norms.
E.1.4 Integrated Method. This framework combines all the major methodologies listed above, including socio-economic factors that drive economic demand, epidemiological factors that drive needs, and utilization rates that incorporate the current use of healthcare services. This patient-centered approach captures a more realistic clinical full time equivalent (FTE) and better picture of access-to-care issues. The 2015 workforce ACR workforce study employed this methodology.
This purpose of this workforce study was to:
1) describe the character and composition of the current clinical rheumatology workforce; 2) recognize demographic and employment trends; 3) inform workforce and succession planning for the ACR/ARHP to ensure appropriate access to
care for patients with rheumatic diseases; 4) develop assumptions regarding the key factors affecting the supply of and demand for
rheumatologists; 5) identify potential paths for the evolution of workforce supply and demand and their associated
implications;

ACR 2015 Workforce Study Report 2 | P a g e
6) conduct a comprehensive patient-centered, integrative approach that attempts to capture both a more realistic clinical FTE and better picture of access-to-care issues; and
7) conduct sensitivity analyses on the workforce model to determine holistic ‘best’ case and ‘worst’ case scenarios.
Information for this study was gathered from several sources, including data from the 2005 ACR workforce study; published research, white papers, position papers, reports from government agencies, and the Institute of Medicine (IOM); and data from professional organizations. Primary data was gathered using four online questionnaires developed by the WSG, subsequently validated, and delivered electronically to supplement secondary data. These surveys gathered information from the following groups:
1) Primary Rheumatology Providers and Health Professionals 2) Fellows-in-Training (FIT) 3) Adult Patients with Rheumatic Diseases* 4) Parents of Pediatric Patients and Young Adults with Rheumatic Diseases*
* The Arthritis Foundation assisted in developing and distributing these surveys.
In addition to the surveys, weekly conference calls with members of the WSG, individual interviews, and focus groups with select stakeholders augmented the primary data collection. The result was three individual reports submitted to the ACR: 1) comprehensive literature review, 2) survey report document, and 3) 2015 ACR Workforce Study. These documents collectively helped determine critical workforce issues facing rheumatology now and in the future, and helped the WSG to develop final recommendations presented to the ACR Board.
E.2 Brief Review of Literature The comprehensive literature review report provides more detail of identified critical areas. The consultant team reviewed over 150 documents (e.g., key documents, references, bibliography, and resources). The health care workforce is one of the most important factors in the health care system today and instrumental in stimulating, creating, and maintaining health care improvement. The health care system has reached a crossroads, shifting from acute care to chronic health problems. This places new demands on the health care workforce. In order to meet these new demands, the workforce must consider the provider’s role from the broadest perspective, including population-based care, the multiple levels of the health care system, and the care continuum. Because of rapid technological advances and the advent of large collaborative initiatives, the health care workforce is expanding well beyond traditional sub-disciplines and scholarly boundaries to include expertise from many other fields. In today’s environment, the structure, content, and process of work have changed. This will influence the rheumatology workforce in a number of ways. The following key areas were identified as having far-reaching implications in the future rheumatology workforce.
1) Demographic changes in workforce and patient population 2) Workforce demands (more time pressured, more mobile, and less dependent on geography) 3) Access to care and health disparities 4) Faculty recruitment and retention 5) Student debt, residency and fellowship training

ACR 2015 Workforce Study Report 3 | P a g e
6) Leadership development and succession planning 7) Clinical practice guidelines and accreditation challenges 8) Infrastructure and policy issues 9) Team-based, interdisciplinary, alternative, and collaborative models 10) Disruptive technological competence 11) Learning, literacy, and life skills that graduates must possess (lifelong learning)
E.2.1 Prevalence of Doctor-Diagnosed Arthritis. With the aging of the U.S. population, there was an anticipated significant increase in the prevalence of doctor-diagnosed arthritis in the next 20-25 years. By the year 2030, an estimated 67 million adults (25% of the projected total adult population) aged 18 years and older will have doctor-diagnosed arthritis, compared with the 52.5 million adults in 2012. These expected estimates may be conservative, as they did not account for the current trends in obesity, which may contribute to future cases of osteoarthritis (OA). According to the National Health Information Systems Surveillance statistics, almost 23% adults over the age of 18 self-reported doctor-diagnosed arthritis, with significantly higher age-adjusted occurrences in women (23.9%) than in men (18.6%).16 Arthritis prevalence increases with age, with a higher percentage being in women than men in all age groups. Table E-1 details the prevalence estimates of rheumatic diseases in the U.S. Table E-1. Prevalence Estimates of Rheumatic Diseases
Disease Prevalence Rheumatoid arthritis 1.3 million U.S. adults Juvenile arthritis 294,000 people in the U.S. Spondylarthritides 0.6 to 2.4 million U.S. adults over 15 Systemic lupus erythematosus 161,000 to 322,000 U.S. adults Systemic sclerosis 49,000 U.S. adults Sjögren’s syndrome 0.4 to 3.1 million adults Clinical osteoarthritis 27 million U.S. people age 25 and older Polymyalgia rheumatica 711,000 people in the U.S. Giant cell arteritis 228,000 people in the U.S. Gout 8 million people in the U.S. Fibromyalgia 5 million people in the U.S. Note. Helmick et al., 2008;
18 Lawrence et al., 2008
19
It was difficult to determine the percentages of OA patients seen by rheumatologists. Without understanding this factor, and because of the small number of internal medicine specialists that focus on rheumatology, excess demand trends could result in a substantial burden for rheumatologist services.
Depending on whether the percentage of OA patients seen by adult rheumatologists increases or decreases, the burden of existing patients could significantly affect the need for more rheumatology specialists
E.2.2 Incidence of Doctor-Diagnosed Arthritis. Estimating the incidence, or the number of new cases in a defined population over a defined period-of-time, is also very difficult. To do so required knowing the disease status of everyone in the defined population at the start of the defined time-period and then counting every new case that occurred until the end of the time-period. Because of these challenges, generalizability was difficult given that incidence studies are typically conducted in small population groups and in small geographic areas. Consequently, there was no national estimate of doctor-diagnosed arthritis incidence. As in prevalence data, there was little to document the percentages of OA patients seen by rheumatologists. Rheumatologists likely see a certain percentage of OA patients in their practice

ACR 2015 Workforce Study Report 4 | P a g e
and at least some of them are new patients. It was noted that the incidence rate of OA increases with age and does not level off until about the age of 80. Additionally, women have higher rates than men do, especially after age 50. Men have a 45% lower risk of incidence of knee OA and 36% reduced risk of hip OA than women. Given these estimates, similar to prevalence, depending on whether the percentage of OA patients seen by rheumatologists increases or decreases, the burden of new patients could significantly affect the need for more specialists in both pediatric and adult rheumatology specialties.
E.2.3 Current Workforce. Understanding the character and composition of the overall rheumatology workforce is essential to meet the challenges facing the profession as well as provide adequate care for patients with rheumatic and musculoskeletal diseases. Expectations regarding the future supply of and demand for rheumatologists have broad implications for training, recruitment, practice management, funding, and understanding the needs for providing care for increasing numbers of patients. In 2005, the ACR conducted a comprehensive rheumatology workforce study. The purpose of the 2005 workforce study was to gain a better understanding of the factors affecting rheumatologist supply and demand. Workforce planning involves a continuous process of shaping and structuring the workforce to ensure there is sufficient and sustainable capacity to meet organizational objectives now and in the future. Ten years have lapsed since the last workforce study, and it was again time for the ACR to analyze the current rheumatology workforce in order to make some predictions about the future of rheumatology.
The establishment of the baseline number of the currently active rheumatology provider (physicians, NPs, and PAs) workforce was the first step in a workforce study. Because many studies have not looked at the difference between the actual total numbers of physicians vs. the number of total clinical FTE, the baseline number was even more difficult to determine. To establish a realistic starting point, the WSG started with information about the number of physicians from the most recently published data. This included all of those who have completed their specialty training in one of the two specialties (adult rheumatology and pediatric rheumatology). After reviewing the most recent reports from the American Board of Internal Medicine (ABIM) and the American Board of Pediatrics (ABP) for those who have current certifications, some discrepancies in data were evident. Some data were not reported for every state, and in some states if the numbers were under 10 in the subspecialty, no data were reported at all. Therefore, data for these states were augmented from the ACR website “find a rheumatologist” function. This service provided data of members and their specialty (e.g., adult, pediatric, adult/pediatric, internal medicine, orthopedics, etc.). Subsequently, these data were supplemented with several other sources including the 2015 workforce study survey. The numbers in table E-2 were considered the most realistic and reliable estimate for adult and pediatric rheumatologists, as well as NPs and PAs. It is important to note that some of the supplemental data tables and graphs may report higher or lower numbers because of how the data were reported in the literature. However, these data were used to help present regional and state data in order to assess potential trends. An estimated 5,595 active adult rheumatologists equated to 4,997 clinical FTE (number actively treating patients). This number represents an average of 48,997.5 adults per adult rheumatologist in the U.S. An estimated 300 active pediatric rheumatologists equated to 287 clinical FTE (number actively treating patients). This number represents an average of 261,420.5 children per pediatric rheumatologist in the U.S (Table E-2).
There are approximately 5,000 rheumatology nurses working in the U.S.; not all are nurse practitioners (NP). However, given about 5% of all practicing nurses are NPs, it was estimated that of the 5,000 who are practicing in rheumatology, approximately 250 are NPs within the U.S. Using the most current numbers from the ACR membership, there are 270 self-reported NPs. Of these, 22 self-identified

ACR 2015 Workforce Study Report 5 | P a g e
as being in pediatrics. The ACR membership numbers suggest a higher percentage in rheumatology (13%) compared to what the literature suggests. For future projections, we used 5% increase in NPs entering the rheumatology workforce. For establishing baseline, the ratio used in the workforce study for NPs was 248 specializing in adult rheumatology and 22 specializing in pediatric rheumatology. While there is no good report on the clinical FTE of NPs, it was assumed that NPs did clinical service and that averaging part-time, etc. the total would be approximately 0.9 clinical FTE for every NP. In 2013 there were 95,583 certified physician assistants (PAs) in the U.S. Approximately 8% of PAs practice in Internal Medicine subspecialties (n=4,178) and 1.9% practice in pediatrics. (n=534). According to the American Academy for Physician Assistants (AAPA), there were currently 211 members working in the field of rheumatology. AAPA also estimated that about 1.7% of PAs work in pediatric subspecialties. Using the most current numbers from the ACR membership, there were 135 self-reported PAs. Of these, three self-identified as being in pediatrics, which is consistent with the literature of approximately 1.7%. For the purposes of the baseline, the ratio used in the workforce study for PAs was 207 specializing in adult rheumatology and 4 specializing in pediatric rheumatology. While there is no good report on the clinical FTE of PAs, it was assumed that PAs did clinical service and that averaging part-time, etc. the total would be approximately 0.9 clinical FTE for every PA. Below provides a summary breakdown and comparison of the most current calculated primary rheumatology provider workforce, both actual numbers and clinical FTE, including Nurse Practitioners and Physician Assistants (Table E-2).
Table E-2. Current Primary Rheumatology Workforce by Specialty
Specialty Training Adult Pediatric
Total Numbers
Estimated Clinical FTE
Total Numbers
Estimated Clinical FTE
Rheumatologists 5,595 4,997 300 287 Nurse Practitioners* 248 228 22 20 Physician Assistants* 207 190 4 4 Total Active Primary Providers 6,050 5,415 326 311 Sources: AMA, ABIM, ABP; RNS, AAPA, PRCSG, & ACR Workforce Study Survey Results. ABIM most current numbers of active rheumatologists were provided February 2016. *Numbers were pulled from the non-physician association information and the published literature. These numbers only reflect active certificates.
E.2.4 Diversity of the Workforce. One critical element of the workforce to explore was the diversity of the rheumatology workforce. This was important in projecting the workforce needs for essential training programs that can meet these challenges. Two key factors that have workforce implications included gender and generational differences. By 2020, female physicians will make up more than half (57%) of all adult rheumatologists with 43% being male. More than half (68%) of all pediatric rheumatologists are already female with 32% being male. Information from the 2015 State Physician Workforce Data Book published by the Centers for Workforce Studies reported that female physicians work seven (7) fewer hours each week and treat 30% fewer patients on average than their male counterparts. The number of female rheumatologists is expected to continue to grow, implying the overall average number of patient visits will continue to decline. As the millennials enter the workforce (defined as providers under the age of 35), there will be more emphasis on the value of both leisure time and earnings. Since 2005, there has been a 5% decrease in patient load for millennial physicians per week. Based on data from both 2015 workforce study survey

ACR 2015 Workforce Study Report 6 | P a g e
and data from the literature, currently about 6% of adult rheumatologists and approximately 11% of pediatric rheumatologists are millennials. However, as Baby Boomers are replaced with millennials, the overall average number of patient visits is also anticipated to decline.
E.2.5 Geographic Distribution. In 2013, the ACR Committee on Rheumatology Training and Workforce (COTW) published a paper on the regional distribution of adult rheumatology practices in the U.S., along with the factors associated with that distribution. The authors found there were many areas saturated with adult rheumatologists (high ratio of adult rheumatologists within a specific geographic area). However, there were many areas where the ratio of adult rheumatologists in a given geographic area was small, resulting in access to care issues that needed to be addressed. In 2015, there were 41,658 adults per adult rheumatologist and 229,443 total children per pediatric population in the U.S and Puerto Rico. Based on a report from the U.S. Census Bureau, approximately 23% of the U.S. population is under 18 years of age.28 This implies that there are about 24 adult rheumatologists for every 1 million adults and approximately 3 pediatric rheumatologists for every 1 million children. This is up slightly for adult rheumatologists from the 2005 workforce study, which found there to be 22.0 adult rheumatologists for every 1 million adults. However, it is about the same for pediatric rheumatologists from the 2005 workforce study. Table E-3 provides the most current regional distribution of adult and pediatric rheumatologists. The breakdown demonstrates that there are five areas (including Puerto Rico) where there is a less than 10% of adult rheumatologists serving the region, and six areas where there is a less than 10% of pediatric rheumatologists serving the region. Table E-3. Regional Distribution of Physician per Population Data Breakdown
Region
Adult Rheumatologists Pediatric Rheumatologists
N % by
Region
Adult Population/
Region
Adult/ Physician
Ratio N
% by Region
Child Population
/Region
Children/ Physician
Ratio
1 Northeast 1264 21.1 33,719,386 26,676.7 81 24.8 9,762,002 120,518.5 2 Mid-Atlantic 1028 17.1 35,555,292 34,586.9 57 17.4 9,835,635 172,555.0 3 Southeast 698 11.6 41,940,692 60,087.0 25 7.6 12,092,867 483,714.7 4 Great Lakes 957 16.0 39,642,918 41,424.2 50 15.3 12,633,687 252,673.7 5 North Central 255 4.3 12,026,980 47,164.6 19 5.8 3,603,818 189,674.6 6 South Central 493 8.2 25,975,519 52,688.7 17 5.2 8,383,137 493,125.7 7 Southwest 233 3.9 15,415,990 66,163.0 8 2.4 4,840,522 605,065.3 8 West 742 12.4 30,763,180 41,459.8 40 12.2 9,813,241 245,331.0 9 Northwest 262 4.4 11,947,352 45,600.6 22 6.7 3,264,394 148,381.5
10 Puerto Rico 64 1.1 2,750,008 42,968.9 8 2.4 798,389 99,798.6 Totals 5995 249,737,317 41,657.6 327 75,027,692 229,442.5
Sources: AMA, ABIM, ABP; RNS, AAPA, & ACR Workforce Study Survey Results. ABIM most current numbers of active rheumatologists were provided February 2016 for continuous U.S. and Puerto Rico.
E.2.6 Metropolitan Statistical Areas (MSA). A metropolitan statistical area (MSA) is a geographical region with a relatively high population density at its core and close economic ties throughout the area. The precise definition of any given metropolitan area can vary with the source; however, a typical metropolitan area is centered on a single large city that wields substantial influence over the region (e.g., Chicago, Atlanta, etc.). Some metropolitan areas contain more than one large city with no single municipality holding a substantially dominant position (e.g., Dallas–Fort Worth, Minneapolis–Saint Paul). The Office of Management and Budget (OMB) define the MSAs. The Census Bureau and other federal government agencies use these data for statistical purposes.29 Appendix H details the top ten MSAs with breakdown by estimates of the number of adult and pediatric rheumatologists actively practicing. The

ACR 2015 Workforce Study Report 7 | P a g e
rates have changed since the 2005 workforce study, but six of the top ten remain relatively constant. As in 2005, the Boston metropolitan area continues to enjoy the highest concentration of rheumatologists (both adult and pediatric). The rates in 2015 are 52.2 per 1 million people for adults and 3.8 per 1 million for children. This has increased from 39.9 per 1 million people for adults and 2.7 per 1 million for children in 2005. Three of the top ten MSAs saw changes in their concentration. These included Philadelphia, Washington, and Atlanta, where the concentration decreased for adult rheumatologists, but saw a slight increase in pediatric rheumatologists. In some geographic areas of the United States with populations of fewer than 50,000 people, adults might have to travel 200 miles or more to see a rheumatologist. It is clear that there is a severe shortage of rheumatologists, especially pediatric rheumatologists. There are four states with less than 15 adult rheumatologists to cover the entire state (North Dakota, South Dakota, Vermont, and Wyoming) and two states that have no board-certified practicing pediatric rheumatologists (Alaska and New Mexico). In addition, there are many states where there are only 1-3 board certified pediatric rheumatologists for the entire state. As a result, and supported by the results from the patient surveys, hundreds of thousands of patients with rheumatic diseases have severely limited access to the care. Over a quarter (27%) of adult patients, 26.3% pediatric patients, and 16.7% of young adult patients had to wait more than 4 months to see a rheumatologist, with about 9% of adults and 7% of pediatric patients taking greater than 12 months to see a rheumatologist from initial onset of symptoms.
E.3 Supply and Demand Projections In this section, factors affecting supply and demand were defined and detailed. Health workforce planning informs understanding of the demand for the health care services provided by the profession. Because there are many workforce models to choose from, the WSG first began with a review of the methodology used in the 2005 workforce study. In 2005, the Lewin Group used a more traditional method for determining workforce needs. The challenge was to develop a workforce model that would allow for comparisons to the 2005 study while including the complexity of patient-care needs that can be translated into clinical care requirements. The WSG was instrumental in defining various supply and demand model factors and their associated estimated ratios. The supply portion of the model included: 1) the current active baseline supply (both actual numbers and clinical FTE), 2) new graduate entrants, 3) attrition, and 4) various demographic factors to determine the future active supply. The demand portion of the model included: 1) health care utilization patterns, 2) prevalence of disease, 3) changes in patient demographics, 4) cost of rheumatology care, and 5) per capita income impact. A separate survey was provided to the fellow-in-training (FITs) to gather more data relative to new entrants entering the workforce to ensure a more accurate and comprehensive supply model. Because a survey was purposefully used to obtain FIT data, the median age of the main workforce study respondents was higher than estimated in 2005. Additionally, patients were queried to help determine their perceived needs for the demand model. These new elements added additional dimensions that allowed for evaluating the perceived differences in demand and need between rheumatologists and patients.
E.3.1 Supply-Demand Model Assumptions. The following are the assumptions that were used in the modeling. These assumptions were developed, in part, by information by the literature. This information was then supplemented by data collected from the workforce study surveys. Through expert guidance of the WSG, the assumptions were finalized.
E.3.1.1 Current rheumatology providers/demographic changes. The baseline supply projections assumed that the patterns of rheumatologists providing services would remain relatively constant with no anticipated increases in programs or services. The physicians’ workload (patients and average hours per week), retirement and mortality patterns, patterns of patient care hours worked, and demographic

ACR 2015 Workforce Study Report 8 | P a g e
composition of the current workforce reflects the trends in the literature and results from the workforce survey. Projections for the workforce model included one for actual numbers and one for clinical FTE.
E.3.1.2 Fellowships. The baseline supply projections assumed the number of openings for fellowships will remain constant and all openings filled. The number of projected new graduates entering the workforce would remain constant in the model. For the baseline (2015 numbers), the assumption was made that those who graduated in 2014 were already in the workforce. Subsequently, these numbers were added annually. Projections for the workforce model included one for actual numbers and one for clinical FTE.
E.3.1.3 Patient Need. The baseline demand projections assumed there was an anticipated increase in demand for rheumatology services by approximately 27% by the year 2020 and 45% through the year 2025. The baseline projection of patient need assumed changes in trends in the U.S. population as outlined in Section 4.2.
E.3.1.4 Published Data. The model included membership data provided by the ACR (February 2016), published literature on workforce, data collected from the workforce survey, and projected national shortages for rheumatology care.
E.3.1.5 Number of OA Patients Treated by Rheumatologists. It was difficult to determine the percentages of OA patients seen by rheumatologists. Without understanding this factor, and because of the small number of internal medicine specialists that focus on rheumatology, excess demand trends could result in a substantial burden for rheumatologist services. Depending on whether the percentage of OA patients seen by rheumatologists increases or decreases, the burden could significantly affect the need for more specialists in both pediatric and adult rheumatology. This gap will unlikely be filled with the addition of fellowship programs alone, but rather will need far more collaborative efforts involving other rheumatology providers such as NPs and PAs to supplement the rheumatology provider workforce. In addition, there is a great need to focus on more innovative and resourceful approaches to workforce capability development. This workforce capacity development necessitates a broad, comprehensive, and multifaceted focus of the entire system that includes a wide range of key activities, strategies, and policies affecting rheumatology. Information gathered from published studies suggested that the population of OA patients treated by rheumatologists was somewhere between 6% and 22%. The WSG agreed that adult rheumatologists have a portion of OA patients. It was difficult to determine an average percentage. To ensure we captured a number that does not underestimate or overinflate the OA patient workload, the WSG selected an initial percentage slightly higher than the published literature (25%) with the understanding that the actual percentage could potentially be higher or lower.
E.3.1.6 Nurse Practitioners and Physician Assistants. The baseline supply projections assumed the percentage of NPs in rheumatology would remain constant at about 5% of all NPs. An increase in the number of NPs overall between now and 2030 is expected to be approximately 31%. The percentage of PAs in rheumatology would also remain constant at about 1.9% of all PAs. An increase in the number of PAs overall between now and 2030 is expected to be approximately 30%. While there is little documentation regarding clinical FTE of NPs/PAs, it was assumed that NPs/PAs worked mostly performing clinical service. Averaging similar factors as in the rheumatology workforce such as part-time, gender, patient load, etc., the total clinical FTE was estimated to be 0.9 for every NP/PA.

ACR 2015 Workforce Study Report 9 | P a g e
E.3.2 Supply Factors. The WSG identified several supply factors as “necessary” for accurately calculating the future supply of rheumatology primary providers. To assess the capacity, the following were included in the model (Appendix C):
1) Current rheumatology providers and associated demographic characteristics 2) Number of new graduates entering the workforce 3) Succession planning trends and workload trends (e.g., retirement, reduction in patient workload) 4) Practice patterns (e.g., part-time vs. full-time, FTEs) 5) Practice setting (non-academic vs. academic health center) 6) Wage elasticities
Tables E-4 and E-5 detail the workforce supply projections for adult and pediatric rheumatology. To assess the number actually providing patient care, these numbers reflect clinical FTE. Table E-4. Adult Rheumatology Workforce Supply Projections (Clinical FTE)
Supply 2015 Base
2020 Projections 2025 Projections 2030 Projections
Total % Diff.
2015-2020 Total
% Diff. 2020-2025
% Diff. 2015-2025
Total % Diff.
2025-2030 % Diff.
2015-2030
Adult^ 4,997 4,470 -10.5 3,645 -18.6 -27.1 3,455 -5.2 -30.9 NP 228 306 +23.4 313 +2.3 +26.2 320 +2.2 +29.0 PA 190 251 +32.1 263 +21.3 +38.4 276 +4.9 +45.3 Total 5,415 5,027 -7.8 4,221 -16.0 -22.6 3,974 -5.9 -27.1 Note: ^Numbers include new graduating fellows entering into the workforce annually; clinical FTE for adult rheumatologists assumes non-academic settings (80%)=1 FTE and AMC settings (20%)=0.5 FTE; NP and PA=0.9 FTE.
Table E-5. Pediatric Rheumatology Workforce Supply Projections (Clinical FTE)
Supply 2015 Base
2020 Projections 2025 Projections 2030 Projections
Total % Diff.
2015-2020 Total
% Diff. 2020-2025
% Diff. 2015-2025
Total % Diff.
2025-2030 % Diff.
2015-2030
Peds^ 287 264 -8.0 243 -7.9 -15.0 231 -4.9 -19.5 NP 20 23 +15.0 24 +4.3 +20.0 25 +4.2 +25.0 PA 4 4 0.0 5 +25.0 +25.0 5 0 +25.0 Total 313 291 -7.0 272 -6.5 -13.1 261 -4.0 -16.6 Note: ^Numbers include new graduating fellows entering into the workforce annually; clinical FTE for pediatric rheumatologists assumes non-academic settings (5%)=1 FTE and AMC setting=0.8 FTE (95%); NP and PA=0.9 FTE.
Figure E-1 graphically depicts the adult rheumatology workforce supply projections in clinical FTE. Figure E-2 compares actual numbers of projected physicians in the workforce compared to the clinical FTE (projected number treating patients). Figure E-3 graphically depicts the pediatric rheumatology workforce supply projections in clinical FTE. Figure E-4 compares actual numbers of projected physicians in the workforce compared to the clinical FTE (projected number treating patients).

ACR 2015 Workforce Study Report 10 | P a g e
Figure E-1. Comparison of Projected Supply Adult Rheumatology Workforce
Figure E-2. Adult Physician Workforce Projections: Actual Number vs. Clinical FTE
2015 2020 2025 2030
Adult 4,997 4,470 3,645 3,455
NP 228 306 313 320
PA 190 251 263 276
Total 5,415 5,027 4,221 3,974
4,997
4,470
3,645 3,455
228 306 313 320 190 251 263 276
5,415
5,027
4,221 3,974
0
1,000
2,000
3,000
4,000
5,000
6,000
Projected Clinical
FTE
2015 2020 2025 2030
Clinical FTE 4,997 4,470 3,645 3,455
Total N 5,595 5,385 4,515 4,346
4,997
4,470
3,645 3,455
5,595 5,385
4,515 4,346
Projected Numbers

ACR 2015 Workforce Study Report 11 | P a g e
Figure E-3. Comparison of Projected Supply of Pediatric Rheumatology Workforce
Figure E-4. Pediatric Physician Workforce Projections: Actual Number vs. Clinical FTE
2015 2020 2025 2030
Peds 287 264 243 231
NP 20 23 24 25
PA 4 4 5 5
Total 313 291 272 261
287
264 243
231
20 23 24 25 4 4 5 5
313
291 272
261
0
50
100
150
200
250
300
350
Number Clinical
FTE
0
50
100
150
200
250
300
2015 2020 2025 2030
FTE Equivalent 287 264 243 231
TOTAL Number 300 280 271 251
287 264
243 231
300 280 271
251
Projected Numbers

ACR 2015 Workforce Study Report 12 | P a g e
E.3.3 Demand Factors. Demand model factors were included in an initial regression model to determine which factors significantly contribute to the demand (Appendix C). The list below represents those factors found to be significant contributors to demand.
1. Health care utilization 2. Provider practice trends 3. Disease prevalence across various demographic groups 4. Changes in the population demographics 5. Per capita income 6. Access to care (physician per population and geographic trends)
Tables E-6 and E-7 provide supply and demand projections for 2020, 2025, and 2030. In addition, these are also compared to the 2015 baseline. These projections were calculated based on clinical FTE. Table E-6. Adult Rheumatology Workforce Demand Projections
Projections Baseline 2020 2025 2030
Projected Workforce Supply* 4,997 4,470 3,645 3,455 Projected Need 6,115 6,796 7,490 8,184 Difference (Excess Demand)** 1,118 2,326 3,845 4,729 Percent Change Projected Year +22.3 +52.0 +105.5 +137.8 Excess Demand based on 2015 Baselineβ ---- 1,799 2,493 3,187 Percent Change Compared 2015 Baseline ---- +36.0 +49.9 +63.8 Number projected with Disease± 22,500,000 25,421,467 28,571,024 36,361,586 Adults with Disease/Physician (Supply) £ 4,502.7 5,687.1 7,838.4 10,524.3 Adults with Disease/Physician (Need)± 3,679.5 3,740.7 3,814.6 4,443.0 Note: *Supply numbers represent clinical FTE; **Number of excess demand compared to same year supply projections;
βNumber of excess demand compared to 2015 baseline numbers; ±Number of projected patients with
rheumatic diseases plus 25% OA patient load; £Number of adults with disease per physician based on current
projections; ±Number adults with disease per physician if projected physician need is met. The 2005 Workforce
Study projected supply of adult rheumatologists of 5,008 by 2025 and demand of 7219.
Table E-7. Pediatric Rheumatology Workforce Demand Projections
Projections Baseline 2020 2025 2030
Projected Workforce Supply* 287 264 243 231 Projected Need 382 407 434 461 Difference (Excess Demand)** 95 143 191 230 Percent Change Projected Year +33.1 +54.2 +78.6 +99.6 Excess Demand based on 2015 Baselineβ ---- 120 147 174 Percent Change Compared 2015 Baseline ---- +41.8 +51.2 +60.6 Number projected with Disease± 300,000 362,479 362,479 481,420 Adults with Disease/Physician (Supply) £ 1,045.3 1,373.0 1,491.7 2,084.1 Adults with Disease/Physician (Need)± 785.3 890.6 835.2 1,044.3 Note: *Supply numbers represent clinical FTE; **Number of excess demand compared to same year supply projections;
βNumber of excess demand compared to 2015 baseline numbers; ±Number of projected patients with
rheumatoid diseases plus 25% OA patient load; £Number of adult with disease per physician based on current
projections; ±Number adults with disease per physician if projected physician need is met. The 2005 workforce
study projected supply of pediatric rheumatologists of 271 by 2025 and demand of 287.

ACR 2015 Workforce Study Report 13 | P a g e
E.3.4 Excess Demand for Adult Rheumatologists. The estimated excess demand for 2015 was 1,118. This equates to a current excess demand of 35.9%. By 2030, the estimated excess demand will be 8,184, which is approximately a 138% increase over the projected supply of 3,455 clinical FTE, and a 64% increase based on 2015 baseline. Figure E-5 compares the projected supply and projected demand of adult rheumatologists, comparing where applicable to the data from the 2005 ACR workforce study. The demand projections between the 2005 and 2015 workforce study reports are comparable. The 2015 projected supply trends appear to be going in the same direction; however, there is a distinctively steeper drop in the 2015 workforce study compared to that of the 2005 workforce study. The WSG examined these trends and attributed this decrease to higher anticipated retirements and changing workforce demographics. These factors, along with differences in clinical FTE calculations, were likely contributors to this steeper projected downward trend.
Figure E-5. Comparison of Projected Supply and Projected Demand of Adult Rheumatologists
Note. Data from 2005 workforce study (2005 to 2025); Data from the 2015 workforce study (2015 to 2030).
2005 2010 2015 2020 2025 2030
2005 Projected Supply 4,946 5,019 4,940 4,806 4,643
2005 Projected Demand 4,946 5,422 5,968 6,584 7,219
2015 Projected Supply 4,997 4,470 3,645 3,455
2015 Projected Demand 6,115 6,796 7,490 8,184
4,946 5,019
4,940 4,806
4,643
4,946
5,422 5,968
6,584
7,219
4,997
4,470
3,645 3,455
6,115
6,796
7,490
8,184
0
1,000
2,000
3,000
4,000
5,000
6,000
7,000
8,000
9,000
Projected Clinical FTE

ACR 2015 Workforce Study Report 14 | P a g e
Figure E-6 graphically depicts the workforce trends of adult rheumatologists separated by gender. The projection of gender differences in adult rheumatologists does appear to be strikingly different in 2015 compared with 2005. The projections in the 2005 WFS indicated an increasingly higher proportion of male rheumatologists. However, in the 2015 WFS, there is a projected shift from more male adult rheumatologists to more female adult rheumatologists in the workforce between 2015 and 2020, with that trend continuing through 2030.
Figure E-6. Projection of Male vs. Female Adult Rheumatologists, 2005-2030
Note. Data from 2005 workforce study (2005 to 2025); Data from the 2015 workforce study (2015 to 2030).
E.3.5 Excess Demand for Pediatric Rheumatologists. The estimated excess demand for 2015 was 95. This equates to a current excess demand of 33%. By 2030, the estimated excess demand will be 461, which is a two-fold increase over the projected supply of 231, and a 61% increase based on 2015 baseline. Figure E-5 and E-6 graphically depict the workforce trends overall and separated by gender. Figure E-7 compares the projected supply and projected demand of pediatric rheumatologists, comparing where applicable to the data from the 2005 ACR workforce study. The demand projections in the 2015 WFS report are significantly different from the 2005 workforce study. The 2015 projected demand trends
2005 2010 2015 2020 2025 2030
2005 Projected Female Supply 1,494 1,833 2,226 2,660 3,147
2005 Projected Male Supply 3,452 3,589 3,742 3,924 4,072
2015 Projected Female Supply 2,039 2,548 2,077 1,970
2015 Projected Male Supply 2,958 1,922 1,568 1,485
1,494
1,833
2,226
2,660
3,147
3,452 3,589
3,742 3,924
4,072
2,039
2,548
2,077 1,970
2,958
1,922
1,568 1,485
0
500
1,000
1,500
2,000
2,500
3,000
3,500
4,000
4,500
Projected Clinical FTE

ACR 2015 Workforce Study Report 15 | P a g e
appear to be going in the same direction; however, the demand curve from the 2015 WFS is much greater. The supply also appears to take a steeper drop than projected in the 2005 workforce study. The WSG examined the demand trends and attributed this increase on the changes in the type of patients seen by the pediatric rheumatologist. The WSG also examined the supply trends and attributed the decreases in supply to higher anticipated retirements and changing workforce demographics. These factors and differences in FTE calculations were also likely contributors to this downward trend. Expanding coverage and ACA
Figure E-7. Comparison of Projected Supply and Projected Demand of Pediatric Rheumatologists
Note. Data from 2005 workforce study (2005 to 2025); Data from the 2015 workforce study (2015 to 2030).
Figure E-8 compares projected supply and demand of pediatric rheumatologists by gender, 2005 to 2030. As in Figure E-6, we compared these to the projections from the 2005 workforce study. The projections of gender differences in pediatric rheumatologists does not appear all that different in terms of trends in 2015 than in 2005, in that there continues to be much higher percentages of female pediatric rheumatologists than males. The projections between the two continue the same downward projection that parallels the downward projection of supply.
2005 2010 2015 2020 2025 2030
2005 Projected Supply 218 238 248 252 254
2005 Projected Demand 218 231 247 267 287
2015 Projected Supply 287 264 243 231
2015 Projected Demand 382 407 434 461
218 238
248 252 254
218 231
247 267
287 287 264
243 231
382 407
434
461
0
50
100
150
200
250
300
350
400
450
500
Projected Clinical FTE

ACR 2015 Workforce Study Report 16 | P a g e
Figure E-8. Projection of Male vs. Female Pediatric Rheumatologists, 2005-2030 Note. Data from 2005 workforce study (2005 to 2025); Data from the 2015 workforce study (2015 to 2030).
E.3.6 Sensitivity Testing. The baseline model included the best estimates of all factors that contributed to both the supply and demand. It is also important to analyze various effects (increases and decreases) of the identified factors on the outcome. Sensitivity testing is one method commonly used for these analyses. The main goal of sensitivity analysis is to gain insight into which assumptions are critical, (e.g., which assumptions affect choice) and potentially may vary due to unexpected changes in estimated economic, geographic, and demographic variables. This process involved changing various input factor values of the model to see their effect on the output variable. Separate modeling was used to examine how changes in key parameters of the assumptions influenced supply and demand projections. It should be noted that all variables (factors) have a synergistic effect on the workforce. That is to say that a change in one variable could change how the other variables perform. While sensitivity projections were initially conducted on each variable separately, two new models were generated: ‘best case’ and ‘worst case’ scenarios. It should be noted that all original numbers entered into the models reflect actual numbers and not clinical FTE. Clinical FTE was computed once all other factors were entered. Sensitivity testing for the supply included changes in gender differences, retirement projections, full-time/part-time status, practice settings, new entrants into the workforce, non-physician providers (NPs and PAs). Sensitivity testing for the demand included changes in the patient population.
E.3.6.1. Gender differences. The baseline model used the reported percentage of women-to-men in both adult and pediatric rheumatology. For adults, the increase also took into account the anticipated
2005 2010 2015 2020 2025 2030
2005 Projected Female Supply 112 131 143 150 159
2005 Projected Male Supply 106 107 104 102 95
2015 Projected Female Supply 195 180 165 157
2015 Projected Male Supply 92 84 78 74
112
131 143
150 159
106 107 104 102
95
195
180 165
157
92 84 78 74
0
50
100
150
200
250
Projected Clinical FTE

ACR 2015 Workforce Study Report 17 | P a g e
shift of more females in the future workforce. Literature suggests this trend will continue, therefore sensitivity testing increased the number of females in both the adult and pediatric projections by 10% and 15% and projected percentages for 2020, 2025, and 2030. The ranges listed in Table E-8 indicate the numbers used for the sensitivity testing for females for each predicted year (2020 to 2030). The percentages of males were adjusted accordingly. Table E-8. Sensitivity Testing for Gender Differences
Gender 2020 2025 2030
Base 10%
Increase 15%
Increase Base
10% Increase
15% Increase
Base 10%
Increase 15%
Increase
Adult Female 3,070 3,377 3,530 2,573 2,830 2,959 2,478 2,726 2,850
Ped. Female 191 210 220 184 202 212 171 188 196
Note. 2015 adult actual number baseline females=2,283; 2015 pediatric actual number baseline females=204. Modeling that included associated increases and/or decreases in the number of males accordingly.
E.3.6.2. Retirement. Based on the literature and 2015 workforce survey results, baseline retirement for adult rheumatologists was predicted to be 50% and for pediatric rheumatologists was predicted to be 32%. These percentages were lowered by 10% and increased by 10% to provide a range from 40%-60% retirement for adults and 22% to 42% retirement for pediatric rheumatologists. The ranges listed in Table E-9 indicate the numbers used for the sensitivity testing for projected retirements for adults (40% to 60%) and for pediatric (22% to 42%) for each predicted year (2020 to 2030). Table E-9. Sensitivity Testing for Retirement Projections
Year Adult Rheumatologists Pediatric Rheumatologists
Current Model
40% 60% Current Model
22% 42%
2020 5,385 3,231 2,154 280 218 190 2025 4,515 2,709 1,806 271 211 184 2030 4,346 2,608 1,738 251 196 171
E.3.6.3. Full-time/Part-time factor. The 2015 workforce survey results indicated that 18% of FITs were seeking part-time employment. Information from the literature supported these trends. The percentages were decreased from 18% to 10% and increased to 25% in both adults and pediatrics to determine the effect on this factor. The ranges listed in Table E-10 indicate the numbers used for the sensitivity testing for the number of part-time workers that was used in the sensitivity testing for each predicted year (2020 to 2030). Table E-10. Sensitivity Testing for Part-time vs. Full-time Workforce
Year Adult Rheumatologists Pediatric Rheumatologists
Current Model
10% 25% Current Model
10% 25%
2020 5,385 4,846 4,039 280 252 210
2025 4,515 4,063 3,386 271 244 203
2030 4,346 3,911 3,259 251 226 188

ACR 2015 Workforce Study Report 18 | P a g e
E.3.6.4. Practice Setting. There is little data to determine the ratio of rheumatologists in non-academic versus academic medical centers (AMC), especially for adult rheumatologists. This affects the clinical FTE calculation because of the assumption that those in AMCs likely do not work full-time treating patients. The WSG estimated that 80% adults and 5% pediatric work in non-academic settings. These percentages were then changed to provide a range from 75% to 90% for adults in non-academic settings and a range from 10% to 15% for pediatric in non-academic settings to see the effect on projections. The ranges listed in Table E-11 indicate the numbers used for the sensitivity testing for the number of who work in non-academic settings in the sensitivity testing for each predicted year (2020 to 2030). The percentages of those in non-academic settings were adjusted accordingly. Table E-11. Sensitivity Testing for Numbers of Rheumatologists Working in Non-Academic Settings
Year Adult Pediatric
Current Model
75% in Private Practice
90% in Private Practice
Current Model
10% in Private Practice
15% in Private Practice
2020 5,385 4,039 4,847 280 28 42 2025 4,515 3,386 4,064 271 27 41 2030 4,346 3,260 3,911 251 25 38
Note. Modeling that included associated increases and/or decreases in the number working in academic setting accordingly.
E.3.6.5. New Graduates. The baseline models assumed the number of new graduates in both adult and pediatric rheumatology would remain the same and the fill-rate was 100%. Subsequently, three scenarios were used: 1) no change in the number of new rheumatology fellowships and a fill-rate of 50%; 2) an increase in the number of new graduates by 10% with 100% fill-rate, and 3) increase the number of new graduates by 25% with 100% fill-rate (Table E-12). This brought a range of new entrants into the adult rheumatology workforce from a potential decrease of 325 to an increase of 165 by 2020. By 2030, this range would go from a decrease of 975 to a possible increase of 495. These ranges are listed below for each predicted year (2020 to 2030). For pediatric rheumatologists, this brought a range of new entrants from a potential decrease of 45 to an additional 25 by 2020, and a decrease of 135 to a potential increase of 75 by 2030. These new graduate entrants’ ranges are listed below for each predicted year (2020 to 2030). Table E-12. Sensitivity Testing for New Graduate Entrants into Workforce
Year Adult Fellows Pediatric Fellows
50% filled 10% Increase 25% Increase 50% filled 10% Increase 25% Increase
2020 -325 +65 +165 -45 +10 +25 2025 -650 +130 +330 -90 +20 +50 2030 -975 +195 +495 -135 +30 +75
E.3.6.6 Nurse Practitioners and Physician Assistants. NP/PAs have been identified as one means of augmenting the rheumatology workforce. Assuming successful recruitment and training efforts are in place, the sensitivity testing increased the number of NP/PAs available for rheumatology from the estimated 2% to 5% to a range of 10% to 30% (Table E-13). These ranges are listed below for each predicted year (2020 to 2030). Note: these ranges are in actual numbers, not yet converted to clinical FTE.

ACR 2015 Workforce Study Report 19 | P a g e
Table E-13. Sensitivity Testing for Nurse Practitioners and Physician Assistants
NPs/PAs 2020 2025 2030
Base 10% 30% Base 10% 30% Base 10% 30%
Adult NP 336 370 437 344 378 447 352 387 458 Pediatric NP 276 304 359 289 318 376 304 334 395
Adult PA 22 24 29 26 29 34 28 31 36 Pediatric PA 4 4 5 6 7 8 6 7 8 Note: 2015 Base Adult NPs=248; Adult PAs = 207; 2015 Base Pediatric NPs=22; Pediatric PAs=4
E.3.6.7. Osteoarthritis Patients (OA). It was very difficult to determine the actual number of OA patients seen by adult rheumatologists. Based on the literature the WSG originally used 25% for the original workforce model. This sensitivity testing included two scenarios: 1) rheumatologists treat no OA patients in their practice, and 2) rheumatologists’ patient pool consists of 50% patients with OA (Table E-14). These ranges are listed below for each predicted year (2020 to 2030).
Table E-14. Sensitivity Testing for Patient Demand
Year Range Increased
Supply Due to Patient Demand
Base 25% OA Patient Load
0% OA Patient Load
50% OA Patient Load
2020 3,741-4,486 25,421,467 14,123,037 36,719,897 2025 4,204-5,012 28,571,024 16,116,732 41,025,317 2030 5,390-6,262 36,631,586 16,116,732 51,253,895
E.4 Worst-Case and Best-Case Scenario Models
E.4.1 Adult Rheumatology Following the sensitivity testing, all the new factor limits were then added to the model to generate a “worst-case” scenario and a “best-case” scenario. The first model (Model A) represents the worst-case scenario, or what the workforce might look like if projections were underestimated (Table E-15). The second model (Model B) represents the best-case scenario, or what the workforce might look like if projections were overestimated (Table E-16). Numbers for rheumatologists were calculated as clinical FTE.
E.4.1.1 Model A: Supply and Demand Adult Rheumatologists (Worst-Case Scenario) (Table E-15). When considering the worst-case scenario, the clinical FTE supply would go from the original projected 3,455 in 2030 to 3,056, an additional decrease of about 12% (399 clinical FTE of adult rheumatologists). Including the current projected NP/PA workforce, it would only improve the projected decrease about 2%, to about 10%. The excess demand for 2015 was estimated to be 1,118 in the original workforce model, but in the worst-case scenario increases to 1,596, which means the excess demand would increase from 22% to 32% with an additional excess demand for 478 clinical FTEs. The excess demand by 2030 would increase from 4,729 to 5,566, bringing the potential increase from about 52% to just over 86%, with an additional excess demand for 837 clinical FTEs. In the worst-case scenario, this would bring the adults with disease per physician (supply) from 6504 to 16,772 by 2030; that is an overall 21% increase from the 2015 baseline.

ACR 2015 Workforce Study Report 20 | P a g e
Table E-15. Model A Supply and Demand - Adult Rheumatology (Worst-Case Scenario)
Supply 2015 Base
2020 2025 2030
Total % Diff.
2015-2020 Total
% Diff. 2020-2025
% Diff. 2015-2025
Total % Diff.
2025-2030 % Diff.
2015-2030
Adult 4,997 3,888 -30.51% 3,455 -11.1 -38.3 3,056 -11.6 -45.6
NP 228 275 +20.6 282 +2.5 +23.7 288 +2.1 +23.7
PA 190 226 +18.9 237 +4.9 +24.7 248 +4.6 +30.5
Total 5,415 4,389 -18.9 3,974 -9.5 -26.6 3,592 -9.6 -33.7
Demand Baseline 2020 2025 2030
Projected Workforce Supply* 4,997 3,888 3,455 3,056
Projected Need 6,593 7,234 7,928 8,622
Difference (Excess Demand)** -1,596 -3,346 -4,283 -5,566
Percent Change Projected Year +31.9 +86.1 +129.5 +182.1
Excess Demand based on 2015 Baselineβ ----- -2,237 -2,931 -3,625
Percent Change Compared 2015 Baseline ----- +44.8 +58.7 +72.5
Number projected with Disease± 32,500,000 36,719,897 41,025,317 51,253,895
Adults with Disease/Physician (Supply) £ 6,503.9 9,444.4 11,874.2 16,771.6
Adults with Disease/Physician (Need)± 4,929.5 5,076.0 5,174.7 5,944.5 Note: *Supply numbers represent clinical FTE; **Number of excess demand compared to same year supply projections;
βNumber of excess demand compared to 2015 baseline numbers; ±Number of projected patients with
rheumatic diseases plus 50% OA patient load; £Number of adult with disease per physician based on current
projections; ±Number adults with disease per physician if projected physician need is met. Numbers include new
graduating fellows entering into the workforce annually.
E.4.1.2 Model B: Supply and Demand Adult Rheumatologists (Best-Case Scenario) (Table E-16). When considering the best-case scenario, the supply would go from the original projected 3,455 in 2030 to 5,214, an increase of about 51% (up 1,759 clinical FTE for adult rheumatologists). Including the current projected NP/PA workforce, it would not increase the workforce by any significant amount. The excess demand for 2015 was estimated to be 1,118 in the original workforce model, but in the best-case scenario decreases to 719, which means the excess demand would decrease from 22% to 14%. The excess demand by 2030 would increase from 4,729 to 5,214 bringing the potential increase from about 52% to only about 27% with an additional excess demand for 485 clinical FTEs. In the best-case scenario, this would bring the adults with disease per physician supply from 2,501.5 to 3,563 by 2030; that is a 27% increase above the 2015 baseline. Table E-16. Model B Supply and Demand - Adult Rheumatology (Best-Case Scenario)
Supply 2015 Base
2020 2025 2030
Total % Diff.
2015-2020 Total
% Diff. 2020-2025
% Diff. 2015-2025
Total % Diff.
2025-2030 % Diff.
2015-2030
Adult 4,997 5,777 +3.25% 5,488 -5.1% -1.9% 5,214 -5.0% -6.8%
NP 228 398 +74.6 407 +2.2 +78.5 416 +2.2 +82.5
PA 190 326 +71.6 342 +4.9 +80.0 359 +5.0 +88.9
Total 5,415 6,501 +20.1 6,237 -4.1 +15.1 5,989 -4.0 +10.6

ACR 2015 Workforce Study Report 21 | P a g e
Table E-16. Model B Supply and Demand - Adult Rheumatology (Best-Case Scenario) - Continued
Demand Baseline 2020 2025 2030
Projected Workforce Supply* 4,997 5,777 5,488 5,214
Projected Need 5,716 6,313 6,420 6,602
Difference (Excess Demand)** -719 -536 -932 -1,388
Percent Change Projected Year +14.4 +9.28 +16.98 +26.6
Excess Demand based on 2015 Baselineβ ----- -1,316 -1,423 -1,605
Percent Change Compared 2015 Baseline ----- +26.3 +28.47 +32.1
Number projected with Disease± 12,500,000 14,264,577 16,029,154 18,576,189
Adults with Disease/Physician (Supply) £ 2,501.5 2,469.2 2,920.8 3,562.8
Adults with Disease/Physician (Need)± 2,186.8 2,259.6 2,496.8 2,813.7 Note: *Supply numbers represent clinical FTE; **Number of excess demand compared to same year supply projections;
βNumber of excess demand compared to 2015 baseline numbers; ±Number of projected patients with
rheumatic diseases plus 0% OA patient load; £Number of adult with disease per physician based on current
projections; ±Number adults with disease per physician if projected physician need is met.
Numbers include new
graduating fellows entering into the workforce annually.
E.4.2 Pediatric Rheumatology Two additional models (best-case and worst-case) were also generated for pediatric rheumatology. The first model (Model A) displayed represents the worst-case scenario, or what would the workforce looks like if projections were underestimated (Table E-17). The second model (Model B) represents the best-case scenario. That is to say, what would the projections look like if projections were overestimated
(Table E-18). Numbers for rheumatologists are computed as clinical FTE.
E.4.2.1 Model C: Supply and Demand Pediatric Rheumatologists (Worst-Case Scenario) (Table E-17). When considering the worst-case scenario, the supply would go from the original projected 231 in 2030 to 119, an additional decrease of about 49% (112 clinical FTE of pediatric rheumatologists). Including the current projected NP/PA workforce would improve the projected decrease about 25%, to about 24%. The excess demand for 2015 was estimated to be 95 in the original workforce model, but in the worst-case scenario increases to 153, which means the excess demand would increase from 33% to 53% with an additional excess demand for 58 clinical FTE of pediatric rheumatologists. The excess demand by 2030 would increase from 230 to 395, bringing the potential increase from about 61% to just over 79%, with an additional excess demand for 165 clinical FTE. In the worst-case scenario, this would bring the children with disease per physician supply from 1,045.3 to 4,244.5 by 2030; that is a three-fold increase from the 2015 baseline. Table E-17. Model C Supply and Demand - Pediatric Rheumatology (Worst-Case Scenario)
Supply 2015 Base
2020 2025 2030
Total % Diff.
2015-2020 Total
% Diff. 2020-2025
% Diff. 2015-2025
Total % Diff.
2025-2030 % Diff.
2015-2030
Pediatric 287 224 -22.0 134 -40.2 -53.3 119 -11.2 -58.5 NP 20 21 -5.0 22 +4.8 +10.0 23 +4.5 +15.0 PA 4 4 0 5 +25% +25% 5 0 +25% Total 311 249 -19.9 161 -35.3 -48.2 147 -8.7 -52.7

ACR 2015 Workforce Study Report 22 | P a g e
Table E-17. Model C Supply and Demand - Pediatric Rheumatology (Worst-Case Scenario) - Continued
Demand Baseline 2020 2025 2030
Projected Workforce Supply* 287 234 134 119 Projected Need 440 462 487 514 Difference (Excess Demand)** +153 +228 +353 +395 Percent Change +53.3 +97.4 +263.4 +331.9 Excess Demand based on 2015 Baselineβ ----- +175 +200 +227 Percent Change ----- +61.0 +69.7 +79.1 Number projected with Disease± 300,000 461,936 475,406 505,099 Children with Disease/Physician (Supply) £ 1,045.3 1,974.1 3,547.8 4,244.5 Children with Disease/Physician (Need)± 681.8 999.9 976.2 982.7 Note: *Supply numbers represent clinical FTE; **Number of excess demand compared to same year supply projections;
βNumber of excess demand compared to 2015 baseline numbers; ±Number of projected patients with
rheumatic diseases; £Number of children with disease per physician based on current projections;
±Number children
with disease per physician if projected physician need is met. Numbers include new graduating fellows entering into the workforce annually.
E.4.2.3 Model D: Supply and Demand Pediatric Rheumatologists (Best-Case Scenario) (Table E-18). When considering the best-case scenario for the supply of pediatric rheumatologists, the percentage difference in the number of projected clinical FTE of rheumatologists goes from 287 in 2015 to 281 in 2030; that is a slight decrease by about 6%. The anticipated increase in NPs increases by about 44% in 2030 and for PAs by 75%. In this best-case scenario, the total difference in 2030 from 2015 would be a decrease of only 2%. The excess demand for 2015 was estimated to be 95 in the original workforce model, but in the best-case scenario is 60 in 2015, which means the excess demand would decrease to 24%. In the best-case scenario, the excess demand by 2030 would increase to 107. This would bring the children with disease per physician from 1,045.3 to 974 by 2030; that is approximately a 7% decrease from 2015. Table E-18. Model D Supply - Pediatric Rheumatology (Best-Case Scenario)
Supply 2015 Base
2020 2025 2030
Total % Diff.
2015-2020 Total
% Diff. 2020-2025
% Diff. 2015-2025
Total % Diff.
2025-2030 % Diff.
2015-2030
Pediatric 287 346 +15.3 305 -11.8 +1.7 281 -7.9 -6.3 NP 20 30 +50.0 31 +3.3 +55.0 33 +6.5 +65.0 PA 4 5 +25% 7 +40% +75% 7 0 +75% Total 311 381 -22.5 343 -10.0 -10.3 321 -6.4 -3.2 Demand Baseline 2020 2025 2030 Projected Workforce Supply* 287 346 305 281 Projected Need 382 377 402 429 Difference (Excess Demand)** +60 +31 +80 +107 Percent Change +18.6 +25.7 +24.8 +33.2 Excess Demand based on 2015 Baselineβ ----- +55 +102 +129 Percent Change ----- +17.1 +34.0 +43.0
Number projected with Disease± 300,000 291,000 282,270 273,802 Children with Disease/Physician (Supply) £ 1,045.3 841.0 925.5 974.4 Children with Disease/Physician (Need)± 785.3 771.9 702.2 638.2 Note: *Supply numbers represent clinical FTE; **Number of excess demand compared to same year supply projections;
βNumber of excess demand compared to 2015 baseline numbers; ±Number of projected patients with

ACR 2015 Workforce Study Report 23 | P a g e
rheumatic diseases; £Number of children with disease per physician based on current projections;
±Number children
with disease per physician if projected physician need is met. Numbers include new graduating fellows entering into the workforce annually.
Figure 5-7 and 5-8 in Section 5 of the 2015 workforce study provides a graph indicating the ranges for adult and pediatric rheumatology workforce projections, comparing the original model to the best-case and worst-case scenarios.
E.5 Limitations of the 2015 Workforce Study
E.5.1 Baseline Rheumatology Specialist Numbers. It was difficult to determine accurately the following:
1) the number of rheumatologists (both adult and pediatric) in the workforce actually treating patients;
2) the number of rheumatologists (both adult and pediatric) who are currently board certified but are no longer be treating patients;
3) the accurate percentage breakdown between rheumatologists working in non-academic and those working in academic medical centers for adult rheumatology, and to some degree pediatric rheumatology;
4) the number of Med-Peds subspecialists and how they are documented to ensure they are not being counted twice (under both adult and pediatric rheumatology)
5) the number of non-rheumatology specialists (internists, family practitioners, orthopedists, etc.) who may be treating ‘arthritis.’
E.5.2 Full-time Equivalent (FTE) calculations. Determining specific trends in the full-time equivalent (FTE) number of rheumatologists who are actively treating patients presented a challenge for the WSG. To do so, it was necessary to assess the hours treating patients or the number of patients treated each day, to convert the actual number of rheumatologists into full-time equivalent (FTE) numbers. Because the negotiated time (or percentage) of each faculty member treating patients, conducting research, performing administrative duties or teaching varies within and between institutions, it was difficult to obtain accurate information regarding FTE for the academic workforce as a whole, even more so with the pediatric rheumatology workforce. Therefore, to provide the best estimated clinical FTE for the academic workforce, the average for academic work settings was used. To further complicate the assumptions was the incomplete data on what proportion of the non-academic workforce worked part time. Synthesizing all these elements, the following standard definitions for the initial workforce model for FTE was: Adult Rheumatology Workforce Pediatric Rheumatology Workforce Private Practice (80%)=1 FTE per physician Private Practice (5%) = 1 FTE per physician AMCs (20%)=0.5 FTE per physician AMCs (95%)=0.8 FTE per physician
E.5.3 Primary Data Collection While an analysis was conducted to ensure sufficient power for each of the surveys distributed, it is important to note that the main workforce survey was primarily targeted to the ACR membership, which

ACR 2015 Workforce Study Report 24 | P a g e
may limit the generalizability to the overall rheumatology workforce. While every effort was made to pull responses from all areas of rheumatology (both within and outside the ACR), more responses were received from adult rheumatologists working in academic medical centers than in the private sector. Additionally, it was difficult to determine the specific percentage of adult rheumatologists working in non-academic versus those working in academic medical centers. In contrast, the overwhelming majority of pediatric rheumatologists work in academic settings. New dimensions were added to this workforce study compared to the previous one. First, fellows-in-training (FITs) completed a separate survey with a 93% response rate. This provided additional information regarding providers entering the workforce, both in adult and pediatric rheumatology. Patient data was also a new dimension added to the 2015 workforce study. With the assistance of the Arthritis Foundation, data was collected from adults, young adults, and pediatric patients. While the data from patients provided a different perspective to that of providers, it was important to show caution in generalizing data from the survey respondents to all patients with rheumatic diseases. These data contributed to the demand model. Lastly, because surveys collect data at one single point in time, we cannot measure changes across time. Data collected in 2005 was used to construct 2015 comparison questions with similar content. Errors due to missing data (question non-response) and item misinterpretation by respondents may also exist.
E.5.4 Evaluation of Model Factors While the predictions appear to be precise, the primary purpose of projections is not to set distant targets, but rather to identify what actions need to be taken in the near future to ensure movement towards achieving long-term objectives. Every effort was made to determine an exact number of rheumatologists and clinical FTE in a “needs-based” sense. However, projections are typically based on past and planned productivity, distribution, and employment patterns of the workforce. They also require predictions about how national politics, population health needs and the delivery of services will change in the future. Therefore, there should be no normative significance or established standard attributed to the supply-demand estimates. There are too many dynamics and confounding variables at play, including retirement projections, workforce supply projections, workload and work activities, succession planning, etc., that factor into the prediction to achieve such precision. Unforeseen and unplanned events could influence the demand for rheumatology services in the next 10-15 years. Thus, these estimates should be interpreted as representing a broad range, under the assumption that all other factors remain constant. The factors that were used for the model were pulled from several sources. These include the published literature, focus groups, surveys, and individual interviews. The WSG was instrumental in defining various supply and demand factors and their associated ratios. The WSG made every effort to interpret the factors as accurately as possible to develop a realistic workforce model. In addition, sensitivity testing was completed to determine the best-case and worst-case scenarios to provide a range.
E.6 Recommendations for Addressing Excess Demand This section highlights approaches that the ACR can consider to address the projected excess demand for rheumatologist services.
E.6.1 General Recommendation: Reassess Workforce Strategic Plan The WSG recommends the ACR Board of Directors assess the 2013-2016 Strategic Plan for meeting academic and non-academic rheumatology supply and demand needs based on the current workforce

ACR 2015 Workforce Study Report 25 | P a g e
study results. The primary challenges will be 1) recruitment of the rheumatology workforce 2) providing adequate access to rheumatology care for patients, and 3) supporting the existing workforce, particularly those within the non-academic community. Over the next 10 years, the combination of baby boomer retirements, shifting demographics of incoming providers (e.g., gender, generational, percentage international medical graduates, etc.), disparities in the regional distribution of rheumatologists, and the Affordable Care Act will dramatically affect access to rheumatology care. Future challenges to recruitment of clinical and academic rheumatologists include student debt, unfilled fellowship positions, competing specialties, and rheumatology salaries. Levels of ACR membership and the volunteer workforce will also be impacted by these workforce changes. Given all these challenges, innovative strategies are needed.
E.6.2 Recruitment of Rheumatology Workforce
E.6.2.1 Graduate Medical Education. It is essential that recruitment of a rheumatology workforce begin early with teaching at the medical student level, as well as in pediatric and internal medicine residency training. This strategy is also applicable to PA and NP graduate school programs, from the classroom to clinical rotations.
E.6.2.2 Fellowship Training. The WSG recommends exploring strategies for filling existing fellowship slots, including evaluation of the current regional distribution of fellowship programs and challenges with existing GME funding. While increasing the number of fellowship positions will not solve the absolute shortage of rheumatologists, innovative strategies should be explored to help look at redistribution of the workforce; this may involve increasing the number of fellowship positions in specified underserved areas. Further, augmenting the traditional clinical and biomedical training curriculum with the science of health care delivery (including health economics, policy, population health, etc.) will help support trainees entering the workforce in the current health care environment
E.6.2.3 Loan Repayment Plans. Student loan debt is influencing medical students, internal medicine and pediatric residents to pursue other more lucrative subspecialties instead of rheumatology. The potential strategy of increased number of loan repayment plans could serve as both a recruiting tool and a strategy to improve access to care in underserved rheumatology regions in the US. Other approaches to recruitment include improved salaries, changes in reimbursement models, increases in reimbursement rates, and policy changes in health care delivery and health care financing.
E.6.2.4 Academic Rheumatology. The current FIT survey suggested that current fellows consider academics a more ideal primary work setting; however, close to 50% of the adult fellows anticipated entering private practice. The remainder of respondents, including the vast majority of pediatric fellows, anticipated a career in academics as clinician educators, clinical investigators, and researchers (basic science and translational). Although this is an excellent sign for academic rheumatology, the Division Directors responses in the workforce study survey indicated that junior academic rheumatologists were transitioning into non-academic positions more than before due to difficulty with academic advancement and tenure, insecure research funding, higher salary opportunities, and student loan debt. The WSG recognizes that the Division Director Special Committee has identified cultivating academic faculty for leadership positions and more guidance in succession planning as a priority and this 2015 workforce study further supports this approach. While 60% of the Division Directors indicated their institution provides internal leadership opportunities or funding for external leadership programs, this does not appear to be consistent across the board. Exploring the development of formal mentorship and leadership training programs for academic rheumatology is critical for recruitment and retention. A more

ACR 2015 Workforce Study Report 26 | P a g e
formal academic pathway program would help junior academic faculty plan and implement successful careers, cultivate collaboration and leadership, and assist with securing research funding and competitive grants.
E.6.2.5 Private Practitioners. Rheumatologists in private practice experience their own set of barriers. Reported key barriers to practice included reimbursement issues, preauthorization, EMR implementation, lack of staff, lack of time with patients, and difficulty in recruiting rheumatologists. Strategies should be explored to assist private practitioners.
E.6.2.6 Non-Physician Provider (Nurse Practitioners (NP) and Physician Assistants (PA). The ACR/ARHP should strongly consider optimal strategies for increasing the numbers of NPs and PAs to augment the workforce and access-to-care. Several authors have suggested that employing NPs and/or PAs for patients in need of laboratory monitoring, those with chronic conditions, and those requiring a greater focus on education and coping skills, can lead to better patient outcomes and more efficiently utilization of rheumatologists’ time. Data from the survey indicate that only about one-quarter of rheumatologists are in a practice with an NP or PA. In addition, best estimates indicate that less than 1% of the existing rheumatology NPs/PAs work in pediatric rheumatology. Thus, there appears to be substantial room for increasing the role of non-physician providers in both adult and pediatric rheumatology. In addition, the ACR/ARHP should investigate strategies for providing appropriate rheumatology training for NPs/PAs. Currently, limited rheumatology-based resources are available to aid in the readiness of an NP or PA to join a rheumatology practice. The ARHP Working Group is vested in the development of a standardized curriculum for NPs and PAs. Additional consideration could be given to a more formal training program that parallels rheumatology fellowship training for physicians. This recommendation carries with it a greater commitment in terms of time and financial resources. Better training could serve to increase interest in our specialty among health professionals and increase exposure of students in NP and PA schools to our specialty.
E.6.2.7 Volunteer Workforce. The volunteer ACR/ARHP workforce is a critical and integral aspect of the overall rheumatology workforce that cannot be underemphasized. Volunteer activities include spearheading/assisting in advocacy, training, continuing education, mentoring, and recruitment efforts. Recruiting recent fellow graduates as ACR members and integrating them into the volunteer workforce early is essential to sustain a viable volunteer workforce and a long-standing commitment to the ACR/ARHP. In addition, novel opportunities and formats for volunteerism must be developed to match the future workforce and the current practice environment. The WSG recommends recruitment challenges could be further investigated and subdivided within existing ACR/ARHP committees such as Committee on Training and Workforce, Division Directors Special Committee, Pediatric Rheumatology Specialty Committee, ARHP Practice Committee, Membership/ Marketing Committees, etc.
E.6.3 Access-to-Care
E.6.3.1 Supply and Demand Models. It is clear that the demand for services will continue to increase with the aging population, the continued implementation of the Affordable Care Act, and disparities in the regional distribution of rheumatologists in the U.S. The major areas to consider include 1) the role of primary care practitioners in the management of common musculoskeletal conditions and 2) strategies to improve options for access to rheumatology care (both adult and pediatric), especially in underserved areas of the U.S. While there is not anticipated to be an increase in pediatric patients as there will be in geriatric patients, there is still a significant projected excess need, especially in select regional areas. The

ACR 2015 Workforce Study Report 27 | P a g e
strategies for underserved areas might include visiting rheumatology consultants to clinics, locum tenens, training PAs/NPs, and telehealth initiatives.
E.6.3.2 Practice Efficiency. As the supply of rheumatology providers is declining and the demand for rheumatology care is increasing over the next 10 years, practice efficiency becomes most critical. Managing rheumatology care in the office, at an academic medical center, and at the State or Regional level has to become more efficient. A routine disease management approach with multidisciplinary and interprofessional rheumatology providers may become necessary to optimally manage the larger demand but also maintain quality outcomes. Leveraging technology by developing new practice models that utilize screening consultations (e.g., telehealth models) for early connective tissue disease versus primary care oriented musculoskeletal problems may be essential (although it is important to factor in the significant challenges and shortages faced by the primary care workforce). Maintaining a current ACR/ARHP website for patient education, practice models, business practices, collaboration, etc., is very helpful for providers and patients. The role of an innovative electronic medical record (EMR) for improving efficiency, documentation, and reimbursement is a continuous challenge.
E.6.3.3 Barriers for Access to Care. There are many potential barriers to care including insurance companies, reimbursement plans, liability, state and federal regulations, pharmaceutical costs, EMRs, excess demand for services, and others. Advocacy groups and committees with the ACR/ARHP and individual states will need to better define processes that effectively assist practicing rheumatology health professionals and medical centers to facilitate continued delivery of high quality rheumatology care.
The WSG recommends the access to care challenges be further investigated by Committee on Workforce and Training, ARHP Practice Committee, CORC, the Government Affairs Committee, and the Committee on Registries and Health Information Technology. This executive summary provides a brief overview. More details of the workforce study are provided in this report in more detail.

ACR 2015 Workforce Study Report 28 | P a g e
1. INTRODUCTION
1.1 Purpose The American College of Rheumatology contracted with the Academy for Academic Leadership (AAL) to conduct a rheumatology workforce study. This purpose of this workforce study was to:
1) describe the character and composition of the current rheumatology workforce; 2) recognize demographic and employment trends; 3) inform workforce and succession planning for the ACR/ARHP to ensure appropriate access to
care for patients with rheumatic diseases; 4) development assumptions regarding the key factors affecting the supply of and demand for
rheumatologists; 5) identify potential paths for the evolution of workforce supply and demand and their associated
implications; 6) conduct a comprehensive patient-centered, integrative approach that attempts to capture both a
more realistic clinical FTE and better picture of access-to-care issues; and 7) conduct sensitivity analyses on the workforce model to determine holistic ‘best’ case and ‘worst’
case scenarios.
Information for this study was gathered from several sources, including data from the 2005 ACR workforce study; published research, white papers, position papers, reports from government agencies, and the Institute of Medicine (IOM); and data from professional organizations. Primary data was gathered using four online questionnaires developed by the WSG, subsequently validated, and delivered electronically to supplement secondary data. These surveys gathered information from the following groups:
1) Primary Rheumatology Providers and Health Professionals 2) Fellows-in-Training (FIT) 3) Adult Patients with Rheumatic Diseases* 4) Parents of Pediatric Patients and Young Adults with Rheumatic Diseases*
* The Arthritis Foundation assisted in developing and distributing these surveys. This report consists of the following sections:
E) Executive summary 1) Introduction 2) Brief review of the literature, 3) Description of the current workforce, 4) Factors affecting the supply and demand, 5) Workforce projections, 6) Discussion and recommendations
The executive summary provides a summary of the project including key findings. Section 1 provides a brief synopsis of the literature. A comprehensive literature review report was submitted to supplement this section. In addition, a third report that includes results from four (4) surveys that were conducted was also submitted with the 2015 workforce study document. Section 2 defines, describes, and provides

ACR 2015 Workforce Study Report 29 | P a g e
a snapshot of the current rheumatology workforce including nurse practitioners (NP) and physician assistants (PA). Section 3 examines the multiple factors identified as significantly affecting the supply and demand of the rheumatology workforce. Section 4 provides rheumatology workforce projections. In this section, the workforce model is defined and explained. Additionally, results from the sensitivity testing are presented along with a best-case and worst-case scenario of supply and demand for both adult and pediatric rheumatology. Major contributors for this study were members of the Workforce Study Group (WSG) formed by the leadership team (Co-chairs Drs. Daniel Battafarano and Seetha Monrad, Ms. Kamilah Lewis, ACR representative, Drs. Marcia Ditmyer and Val Gokenbach, AAL Consultants). The WSG members were a source of institutional and clinical information relevant to the rheumatology physician workforce, as well as guidance for the study itself. In addition, the WSG members’ opinion and judgment of the current state of the profession, its future state, and factors affecting it were invaluable. In addition to the leadership team, the WSG included twelve (12) ACR and ARHP core members from both non-academic and academic medical centers with a wide-range of experiences in the field of rheumatology (Appendix A). Early in the discussions, WSG concluded that because of the dramatic and rapid changes in today’s market, it would be very difficult to determine what the workforce might look like in 20 years. Because of this, the WSG decided to construct a model that would identify emerging and consolidating trends that will shape the workforce within the next 15 years. The demographics of the U.S. workforce is changing drastically, which means the profile of the average rheumatologist will also evolve—younger, more minority and culturally diverse, more likely to be female, less likely to enjoy a long-term relationship with an employer, and more likely to insist upon work-life balance. In addition, the number of workers over age 60 will continued to increase in the next 5-10 years ultimately resulting in more retirements than anticipated in the 2005 workforce study. The unprecedented aging of the world’s population and the strong positive correlation between aging and disability will continue to create a significant challenge for the rheumatology workforce. That is to say, as more rheumatologists retire at higher than originally projected rates, the U.S. population continues to age, and the anticipated demographic changes of the incoming workforce will likely have a synergistic effect on the workforce exacerbating the existing workforce shortage. The Bureau of Labor Statistics projected that over the next 10 years, 40 million people will enter the work force (about 25 million will leave the work force and 109 million will remain).1 Health care occupations and industries are expected to have the fastest employment growth and to add the most jobs between 2014 and 2024.1 However, with the increase in the proportion of the population in older age groups, more people in the labor force will be entering prime retirement age. As a result, the labor force participation rate is projected to decrease and labor force growth to slow. Over the next decade, instead of having nearly all increases in employment coming from the 25-54 age group, fewer than 30% of the added workers will be in this category with nearly half of the additional workers coming from the over 55 age group and 20% from younger workers. The declining proportion of baby boomer generation in the work force has a number of implications including rising shares of workers with 25 years of experience or less than 7 years of experience. These trends were addressed in this study.
1.2 Rheumatology Workforce The U.S. is facing a significant deficit of physicians. The health care labor shortage in the United States has been widely documented and is expected to last for the foreseeable future. The Council on Graduate

ACR 2015 Workforce Study Report 30 | P a g e
Medical Education projects a shortage of 85,000 physicians in 2020, which is approximately 10% of today’s physician workforce. The Association of American Medical Colleges projects a shortage of 124,000 full-time physicians by 2025.2 According to Twentieth Report of COGME, the current U.S. primary care physician workforce is in jeopardy of accelerated decline because of decreased production and accelerated attrition.3 In addition to the shortage of workforce, maldistribution of the workforce continues to be an obstacle, with rural Americans constituting about 20% of the total population, or nearly 62 million people living outside metropolitan statistical areas.4 In 2005, only 11.4% of physicians practiced in rural locations.5 In addition, shortages of non-physician providers including nurse practitioners and physician assistants have also become more apparent. Problems with the distribution of physicians and other health professionals are ongoing for rural areas. The National Rural Health Association (NRHA) believed that it was essential for rural areas to have an adequate and able workforce to deliver needed health care services.6 Workforce shortages are especially serious in many Western regions of the United States. Arthritic diseases can affect the joints, muscles and bones causing pain, swelling, stiffness and deformity that can have a profound effect on an individuals’ ability to work and perform daily tasks. There are more than 200 types of these diseases, including rheumatoid arthritis, osteoarthritis, gout, lupus, back pain, osteoporosis, and tendinitis. Some of these are very serious diseases that can be difficult to diagnose and treat. This study addresses primary providers including rheumatologists as well as NPs and PAs.
1.2.1 Clinical FTE Defined. Because rheumatologists’ primary employment activities might be outside the realm of clinical care (e.g., research, service, teaching, and administration), the supply and demand analysis focused on the need for clinical services (i.e., number treating patients) and computed the projected workforce in clinical FTE. Defined by the U.S. Government, an FTE is a “full-time equivalent” employee who is paid for working 2,080 hours per year (8 hours per day x 5 days per week).7-8 A full-time equivalent employee can be a combination of employees, each of whom individually is not a full-time employee, but who, in combination, are equivalent to a full-time employee. The difficulty in determining the actual number of FTE in the workforce treating patients (clinical FTE) arises because each non-academic and academic institution defines the parameters for standardized expectations across their workforce, optimized physician productivity, and access to healthcare. Physicians in academic medicine have pressures surrounding research and teaching, thus less time for clinical activities. In addition, over the past 20 years there has been more pressure on academic physicians to generate more of their salary through patient care, thus reducing time for research, service, and/or teaching.9 Academic centers are attempting to generate greater professional revenues from clinical activities to fund their academic mission and to operate their clinical practices more efficiently. This is partially due to decreased state, federal, philanthropic, and research funding, as well as lower reimbursement rates. Because of these changes, it was not possible to compute an exact clinical FTE for this workforce study. However, the WSG agreed on the following clinical FTE definition for adult rheumatologists: 1.0 clinical FTE per physician in non-academic settings and 0.5 clinical FTE per physician in academic settings. For pediatric rheumatologists, the clinical FTE definition differed: 1.0 clinical FTE per physician in non-academic settings and 0.8 clinical FTE per physician in academic settings. In addition, based on assumptions regarding the NP/PA workforce, clinical FTE for these professions was 0.9.

ACR 2015 Workforce Study Report 31 | P a g e
1.3 Workforce Study Analysis and Limitations In full disclosure, there was no attempt to determine the exact number of rheumatologists in a needs-based sense. Projections are typically based on past and planned production and movements of the workforce, as well as predictions of health needs and delivery of services. Because of this, there was no normative significance (or established standard) attributed to the demand estimates. In addition, while the predictions appear to be precise, the primary purpose of projections is not to set targets, but rather identify adverse trends and actions that should be taken in the near future to ensure movement towards achieving longer-term solutions. There are many dynamics and confounding variables at play (e.g., requirement projections, supply projections, workload and work activities, succession planning) that factor into the prediction to achieve such precision. While every effort was made to include all factors that might affect the future workforce, unforeseen and unplanned events could influence the demand for rheumatology services in the next 10-15 years. Thus, interpretation of these estimates represents a broad range under the assumption that all other factors remain constant. Our overall assessment was based on the systematic analysis of various scenarios and factors that research indicated were likely to affect the future supply and demand. Because the true effect of some factors could not be anticipated, the workforce model was designed to allow for rapid evaluation of alternate assumptions or projections. The 2015 ACR/ARHP Workforce Study was completed using several primary and secondary data sources, including, ACR member data, state licensure registries, 200 ACR workforce study, professional organizations, and other medical literature and four web-based surveys. Rheumatology health professionals and fellows-in-training completed two of the surveys. With the assistance from the Arthritis Foundation, two additional surveys collected data from adult, young adult and parents of pediatric rheumatology patients. Analyses of survey responses compared demographic changes, fellowship trends, retirement trends, patient workload and practice setting patterns, barriers to practice, and access to care issues. The following outlines the limitations of the primary data collected.
1) While there was a good faith effort to reach beyond ACR membership, the primary data collected was predominantly from ACR members. State affiliates were asked to distribute the workforce survey, as were individuals from the WSG. However, because of this, responses from the main workforce study survey were predominantly from members of the ACR. Caution should be placed on generalizability of these results.
2) Because surveys collect data at a single point in time, it was difficult to measure changes in the population across time. Data previously collected in 2005 were used as a basis for developing the 2015 survey. While some items in the 2015 study were the same as in the 2005 study, data were considered cross-sectional in nature and not longitudinal. However, comparisons were made between similar items from the two surveys to assess potential changes in responses.
3) Non-response bias is common in survey research and the result of respondents selectively leaving items blank. To help reduce non-response bias, a review of all surveys was completed to ensure appropriate inclusion in the analyses. It was assumed that if a respondent left some items blank but completed items throughout the entire survey, they either chose not to respond to certain items or the items were not applicable due to logic designed in the survey. It was difficult to determine if those who responded to all items differed significantly from those who selectively left items blank, thus creating some non-response bias.
4) Patient data was collected through the assistance of the Arthritis Foundation (AF). The AF has collected emails from adults diagnosed with rheumatic diseases, parents with children diagnosed with rheumatic diseases, and young adults diagnosed with rheumatic diseases. Those on these lists previously agreed to respond to surveys that were sent to them by the AF. This could

ACR 2015 Workforce Study Report 32 | P a g e
potentially present a bias in the results. Individuals who agree to participate in research studies may potentially differ in knowledge, attitudes, and perceptions from those who chose not to agree to participate. Caution should be used when interpreting these data.
5) It was assumed that all respondents would answer honestly when completing the survey. However, respondents might have felt uncomfortable in providing accurate and honest answers.
6) Survey items could have been interpreted differently by respondents. Every effort was made to ensure clarity in the items prior to distribution of the survey through reliability and validity assessments.
7) Web-based surveys could potentially reflect some coverage bias. Despite exponential growth of the Internet there are still large numbers of people who do not have access to or choose not to use the Internet. Thus, some of the target population may not have had an opportunity to complete one of the four (4) surveys.
The following are limitations relative to the secondary data collected. 1) Data collected from published literature have limitations in themselves. These same limitations
will also carry over into this study. The estimates of supply and demand were based on these data. Therefore, there was no assumption of normative significance in the estimates. In addition, this study did not include any unanticipated event that could possibly change the supply and demand model. Unanticipated factors cannot be predicted and therefore the assumptions were based on equilibrium of the market.
2) Because workforce modeling is multi-faceted, the influence of multiple factors on the future supply of health care providers and demand for services cannot be easily predicted or modeled. For example, the supply projection methodology cannot predict or incorporate hypothetical new trends in specialty choice by health professions graduates.
3) Health system changes could improve the efficiency and adequacy of providers’ supply, resulting in the need for fewer providers to deliver care resulting in more patients being seen per provider than anticipated. System-level changes cannot be accurately anticipated or predicted.
4) While a good faith effort was made to determine variations in the distribution of rheumatology providers, such as in rural and remote areas, it is difficult to assess the percentage of providers that will elect to provide services in medically underserved areas in the future.
1.4 References
1. Employment Projections: 2014-2024 Summary. Retrieved May 26, 2016 from http://www.bls.gov/news.release/ecopro.nr0.htm
2. Association of American Medical Colleges. (2008). The complexities of physician supply and demand: Projections through 2025. Retrieved April 19, 2016 from: https://members.aamc.org/eweb/upload/The%20Complexities%20of%20Physician%20Supply.pdf
3. Council on Graduate Medical Education. Twentieth Report. Retrieved May 26, 2016 from http://www.hrsa.gov/advisorycommittees/bhpradvisory/cogme/reports/twentiethreport.pdf
4. Chen FM, Fordyce MA, Andes S. Hart LG. (2008). U.S. Rural Physician Workforce: Analysis of Medical School Graduates from 198801997. WWAMI: The Rural Health Working Paper Series. 113.
5. National Advisory Committee on Rural Health and Human Services. (2008) The 2008 Report to the Secretary: Rural Health and Human Services Issues. U.S. Department of Health and Human Services, April.
6. National Rural Health Association. (2011). HPSA & MUA Negotiated Rulemaking. July 7
ACR 2015 Workforce Study Report 33 | P a g e
7. Internal Revenue Service. Averaging Full-time and Full-time Equivalent Employees and Why it Matters. 2016. Retrieved June 21, 2016 from: https://www.irs.gov/affordable-care-act/employers/averaging-fulltime-and-fulltime-equivalent-employees-and-why-it-matters.
8. Internal Revenue Service. Small Business Health Care Tax Credit Questions and Answers: Determining FTEs and Average Annual Wages. Retrieved June 21, 2016 from: https://www.irs.gov/uac/small-business-health-care-tax-credit-questions-and-answers-determining-ftes-and-average-annual-wages
9. Borges NJ, Navarro AM, Grover A, Hoban JD. How, when, and why do physicians choose careers in academic medicine? A literature review. Acad Med. 2010;85:680-686.
ACR 2015 Workforce Study Report 34 | P a g e
2. LITERATURE REVIEW SUMMARY
2.1 Introduction As part of the 2015 WFS, a comprehensive environmental scan and literature review were conducted to analyze secondary data regarding the current workforce across rheumatology professionals. Several concentration areas were addressed during this process. Those included:
1) Changes in the 21st Century Workforce. 2) Performance management strategies addressing new business drivers or deliverables. 3) Changes in the patient demographics. 4) Job descriptions and work allocation affecting duties and responsibilities. 5) Compensation and the identification of recruitment, retention, and performance incentives. 6) Rising costs of medical education and increases in student loan debt. 7) Key demographic changes affecting the rheumatology workforce. 8) Recruitment strategies addressing anticipated fellowship vacancies. 9) Retention strategies to prevent or mitigate turnover across the profession. 10) Succession planning to identify anticipated vacancies. 11) Access to care and health disparities.
A comprehensive literature review document submitted to the ACR covers these critical areas in more detail. Section 2 provides a brief summary of that literature review. The leadership team reviewed over 150 documents (e.g., key documents, references, bibliography, and resources) to produce the literature review. The workforce is one of the most important factors in the health care system today.1-2 Health care providers are instrumental in stimulating, creating, and maintaining health care improvement. The health care system has reached a crossroads, shifting from acute care to chronic health problems that place new demands on the workforce. In order to meet these new demands, expansion of workforce competencies is critical. This does not invalidate the existing competencies, but rather underscores the importance of new competencies as a complement to the existing ones. These include core competencies such as patient-centered care, collaboration, quality improvement, employment of evidence-based practice, and information/communication technology. Additionally, the workforce must consider the providers’ role from the broadest perspective, including population-based care, the multiple levels of the health care system, and the care continuum.3-4 Because of rapid technological advances and the advent of large collaborative initiatives, the health care workforce is expanding well beyond traditional sub-disciplines and scholarly boundaries to include expertise from many other fields.
The expansion of the core competencies was established to prepare the health care workforce for the 21st century to provide care for patients suffering from chronic conditions.4 The core competencies will shift current thinking about providing care for patients with ongoing health problems and reform the training and preparation of the health care workforce in the 21st Century. The importance and rapid proliferation of technologies raises important questions as to how to train the next generation of specialists, not only to use particular tools, but also to be prepared for a changing technological landscape. In addition, the advent of new and expanding types of data raises additional questions about how to train the next generation in approaches to data sharing and analysis. Additionally, there is an increasing need to prepare investigators to bridge the translational gap between basic science and

ACR 2015 Workforce Study Report 35 | P a g e
clinical application. Given this changing landscape, it is critical to explore what the workforce of the 21st century will look like, and project the workforce needs for essential training programs to ensure they are able to meet the challenges. The U.S. is at a point where there may be as much as a 5-million-person shortage of people with a post-secondary education by 2020.5-8 The U.S. ranks 5th in tertiary attainment among those 25-64 years old and 12th among those 25-34 years old worldwide. This means that the U.S. is quickly losing its rank, and that other high-performing nations are out-educating and out-competing on many levels. Even given the high unemployment rates of the recession in 2011, U.S. companies reported that they could not fill as many as 600,000 jobs because workers did not possess the necessary skills (or competencies). Many of those deficiencies were in health care. Across the U.S., there are 5,800 designated primary care Health Professional Shortage Areas (HPSAs).9 In addition to the challenge of filling shortages for primary care, there is the challenge of filling shortages for specialists—which is even more challenging with a dramatic increase in cost of education (student load debt) and recruitment costs for highly specialized expertise. It is necessary to ask what has changed. Today, higher education is no longer a luxury or a privilege, but a necessity. The workforce landscape is changing faster than the education system can keep up with it. The U.S. Department of Labor10 reported that individuals who were born between 1957 and 1964 held an average of 5.3 jobs between ages 23 and 42. Conversely, 91% of millennials (individuals born between 1977 and 1997) are expected to stay in a job for less than three years, meaning they would have between 15 and 20 jobs over the course of their working lives.10 Moreover, the top ten in-demand jobs in 2013 did not even exist in 2004. Because of the changes in demographics and technologies, physicians must learn to work collaboratively within a complex, information-driven system where efficiency and outcomes are continuously analyzed to provide feedback for quality improvement. Challenges will continue to emerge. This means that educators within the U.S. education system prepare students for jobs that do not yet exist, using technologies that have not yet been invented, in order to solve problems that have not been discovered. For the first time in U.S. history, four generations are working side-by-side who are vastly different in their upbringing and communication styles. In health care fields, three of the four generations are the most predominant. However, there are still some active health care providers over the age of 80, especially physicians, who tend to work longer than other health care professionals do. Today’s health care education glossary includes terms such as learner-centered environment, competency-based education, inter-professional education, authentic assessment, and person-centered care. Today’s students are moving towards a future where they must master competencies considered to be critically important to success in today’s world, particularly in contemporary careers and workplaces. Between 1980 and 2005, medical school enrollment was flat.11 In 2006, the AAMC called for a 30% increase in medical school enrollment due to the anticipated physician shortage. Since then, expansion of class sizes in existing schools and the establishment of new medical schools has increased enrollment by more than 21% compared to 2002, putting us on pace to meet the 30% goal by 2017.11 The increased number of potential slots in medical school has increased the competition for the top candidates. Despite an estimated shortage of more than 90,000 physicians across all specialties by 2020, Medicare support for graduate medical education (GME) has prevented a meaningful increase in residency positions since 1997.11 Is the rheumatology field ready to meet head-on the challenges that face the future workforce? What will it take? What will the workforce look like? How will the pressures of increasing student debt, decreases in state funding, increases in regulatory and accreditation requirements, and lack of public confidence change the student profile?
ACR 2015 Workforce Study Report 36 | P a g e
In a recent study, employers reported the top 10 skills they plan to prioritize when they recruit from the class of 2015.6 These skills are not easily measured. These can be grouped into three different categories: 1) learning skills such as working in a team, decision-making, & problem solving; 2) literacy skills such as computer and writing skills; and 3) life skills that include planning and organizing skills, communication and people skills. These 10 skills have always been essential; however, they are even more important in a world where constant and fast change is the new normal. These 21st century skills have taken a central role in policy discussions because they are critical components of college and career readiness. However, along with attracting, developing, and retaining young emerging leaders comes the growing importance on competency assessment beyond simple academic content knowledge. In health care, these assessments are rated on three different scales: 1) relevance, 2) importance, and 3) consequence or harm. Moving forward depends on translation of competence into practice.
2.2 Implications True data-driven decision-making is only partially about data. A clear, shared vision and leadership play a major role in data-driven decision-making. It takes strong leadership to inspire a shared vision and to implement policies and professional development programs based on these data to advance the ACR vision, mission, and goals. Data can also provide critical support for the ACR to continue their innovative work by identifying needed education programs, research activities, advocacy events, and practice support. In today’s environment, the structure, context, and process of the rheumatology workforce have changed. To ensure a comprehensive workforce analysis, the following must be considered as areas that have far-reaching implications in the future rheumatology workforce.
1) Demographic changes in workforce and patient population 2) Workforce demands (more time pressures, more mobility, and less dependent on geography) 3) Access to care and health disparities 4) Team-based, interdisciplinary, alternative, and collaborative workforce models 5) Leadership development and succession planning 6) Learning, literacy, and life skills that graduates must possess (lifelong learning) 7) Faculty recruitment and retention 8) Student debt, residency and fellowship training 9) Clinical practice guidelines and accreditation challenges 10) Disruptive technological 11) Infrastructure and policy issues
In today's world, health care has changed drastically due to competitive pressures and technological breakthroughs. Organizations need to be leaner and more agile, more focused on identifying value from the customer perspective, more tuned to dynamic competitive requirements and strategy, and less hierarchical/more collaborative in structure and decision authority. This is true of both academic and non-academic medical settings. While many factors contribute to the changing patterns of the rheumatology workforce, key factors include: 1) increase pressure in health care to be more competitive, agile, and customer focused; 2) identify more collaborative workforce models that include technology breakthroughs; and 3) develop internal activities and processes that allow the workforce to respond more rapidly to the marketplace by reducing cycle time while supporting continual change and innovation.

ACR 2015 Workforce Study Report 37 | P a g e
The health care field has experienced a different type of crisis with the growing demand of caring for an increasing number of patients with chronic co-morbid diseases. This global crisis will receive greater attention as we move further into the 21st Century.12 This crisis has led to a shortage of health care workers here and abroad. The challenge for 21st Century educators is preparing a workforce that will be able to care for patients with chronic conditions. Effective care for patients with ongoing health problems requires treatment that is continuous across settings and types of providers, which requires a coordinated effort. Now more than ever before, health care workers need to be collaborative and work together across disciplines to develop treatment plans, goals, and implementation strategies that focus on the needs, values, and preferences of patients and their families. Additionally, self-management behavior and skills need to be developed and implemented, and subsequently supported by a workforce that encourages preventive initiatives. To ensure a prepared workforce, core competencies should be addressed for delivering effective health care to patients with chronic diseases. Additionally, students in the health professions should be exposed to opportunities that allow for interactive learning with those outside their profession. This interprofessional learning environment prepares students for more deliberate, collaborative practice and a patient-centered and community/population-oriented U.S. health care system.13 In addition to the additional core competencies expected of today’s health care workforce, there has been a push to change current accreditation standards for all of the health professions. In 2014, members of the American Osteopathic Association (AOA) House of Delegates voted to support a decision by the AOA Board of Trustees to pursue a new, single accreditation system for graduate medical education by 2020.14 The purpose of this was to allow graduates of osteopathic and allopathic medical schools to complete their residency and/or fellowship achieving common milestones and competencies. The American Medical Association (AMA) fully supports the creation of one accreditation system for graduate medical education (GME) programs that will now include graduates of both allopathic and osteopathic medical schools.15 These general core competencies are:
1) Patient care and technical skills: compassionate, appropriate, effective 2) Medical knowledge: know and can apply/do and apply 3) Practice-based learning and improvement: assessment of own patient care, evidence-based
approaches, improvement 4) Interpersonal and communication skills: motivational interviewing (verbal and non-verbal skills) 5) Professionalism: committed to professional responsibilities, ethical principles and sensitivity to
diverse patient populations 6) Systems-Based Practice: awareness and utilization of the larger context and system of health
care in providing optimal patient care It is clear that any workforce must look at the preparation of the future workforce as part of its analysis. What frameworks and recommendations are needed to help prepare students and ensure they are college ready? What research and recommendations are needed to align definitions and measures to impact policy and programmatic decisions?
2.3 Prevalence of Rheumatic Diseases With the aging of the U.S. population, the prevalence of doctor-diagnosed arthritis is expected to increase significantly in the next 20-25 years.16 By the year 2030, an estimated 67 million (25% of the

ACR 2015 Workforce Study Report 38 | P a g e
projected total adult population) adults aged 18 years and older will have doctor-diagnosed arthritis, compared with the 52.5 million adults in 2012 (Figure 2-1).17 It is expected that these estimates may be conservative as they do not account for the current trends in obesity, which may contribute to future cases of osteoarthritis. Because of the small number of internal medicine specialists that focus on rheumatology, these demand trends will result in a substantial burden for rheumatologist services.16 This burden will ultimately increase the need for more specialists in both pediatric and adult rheumatology, potentially requiring more fellowship programs, as well as the need for more collaborative efforts with mid-level providers, to supplement the rheumatology workforce. According to the National Health Information Systems Surveillance statistics, almost 23% adults over the age of 18 reported doctor-diagnosed arthritis, with significantly higher age-adjusted occurrences in women (23.9%) than in men (18.6%).16 Not surprisingly, arthritis prevalence increases with age, but it is higher in women than men in all age groups. Figure 2-1 graphically depicts the projected prevalence of doctor-diagnosed arthritis among U.S. Adults Aged 18 Years and Older between 2005-2030.16 Table 2-1 presents the prevalence estimates of various rheumatic diseases.18-19 Data on the prevalence of RA is from the Rochester Epidemiology Project in Minnesota.17 In 2005, the age-standardized prevalence of RA among women in the Rochester Epidemiology Project had increased to 1% (9.8 per 1,000) from 0.8% (7.7 per 1,000) in 1995.17 However, the prevalence among men was the same (0.4%) in 1995 and 2005 (4.1 per 1,000 in 1995 and 4.4 per 1,000 in 2005).19 Another study, in Ontario, Canada, reported an increase in RA prevalence among both women and men from 1996 to 2010.18 The authors attributed to increasing emphasis on early diagnosis and treatment of RA and environmental changes.18
Figure 2-1. Projected Prevalence of Doctor-Diagnosed Arthritis-U.S. Adults >18, 2005-203016

ACR 2015 Workforce Study Report 39 | P a g e
Table 2-1. Prevalence Estimates of Rheumatic Diseases in U.S. Disease Prevalence Rheumatoid arthritis 1.3 million adults Juvenile arthritis 294,000 people Spondylarthritides 0.6 to 2.4 million adults over 15 Systemic lupus erythematosus 161,000 to 322,000 adults Systemic sclerosis 49,000 adults Sjögren’s syndrome 0.4 to 3.1 million adults Clinical osteoarthritis 27 million people age 25 and older Polymyalgia rheumatica 711,000 people Giant cell arteritis 228,000 people Gout 8 million people Fibromyalgia 5 million people Note. Helmick et al., 2008;
18 Lawrence et al., 2008
19
2.4 Incidence of Rheumatic Diseases Estimating the incidence, or the number of new cases in a defined population over a defined period of time, is very difficult. To do so, it would require knowing the disease status of everyone in the defined population at the start of the defined time period and then counting every new case that occurs until the end of the time period. Because of these challenges, incidence studies have only been conducted in small population groups in small geographic areas, making generalizability very difficult. Consequently, we have no national estimate of arthritis incidence. However, some assumptions can be made. Incidence rates of OA increased with age, and level off around age 80.20 Additionally, women had higher rates than men, especially after age 50. Men have a 45% lower risk of incidence of knee OA and 36% reduced risk of hip OA than women.20
2.5 Arthritis-Attributable Limitations and Disability The overall impact that arthritis has on individuals is considered significant. Approximately 31% (8.3 million) working age adults with doctor-diagnosed arthritis report being limited in work activities due to the disease22-24 Further, 40% of adults reported activities are very difficult or they could not perform at least 1 out of 9 important activities of daily living. These limitations restrict many adults from functioning as productive members in their community (Figure 2-2).21 Arthritis is the most common cause of disability.21-23 Of the 53 million adults with a doctor diagnosis of arthritis, more than 22 million say arthritis causes them to have trouble with their usual activities. Arthritis affects 52.5 million (22.7%) adults, (more than 1 in 5) and reportedly is the nation’s most common cause of disability.22 According to data from the 2010-2012 National Health Interview Survey (NHIS) Arthritis Surveillance Survey, 22.7 million (9.8% of all adults) have self-reported arthritis and arthritis-attributable activity limitation.22 In addition, childhood arthritis is the number one cause of acquired disability in children. Childhood arthritis is the sixth most common chronic childhood disease (after asthma, congenital heart disease, cerebral palsy, diabetes, and epilepsy).22 Approximately 300,000 children in the U.S. suffer from some form of arthritis or rheumatic disease.22

ACR 2015 Workforce Study Report 40 | P a g e
Figure 2-2. Self-Reported Functional Limitation21-23
Note: Functional limitation is defined as "very difficult" or "cannot do" for the following activities: grasp small objects; reach above one's head; sit more than 2 hours; lift or carry 10 pounds; climb a flight of stairs; push a heavy object; walk a 1/4 mile; stand more than 2 hours; stoop, bend, or kneel.
By a large margin, musculoskeletal system and connective tissue disorders remain the leading cause of new and ongoing disability claims. According to the Council of Disability Awareness, the number one long-term disability claims in 2012 and 2013 was musculoskeletal/connective tissue diseases.21 In 2012, 28.7% of new claims and 30.8% of existing claims were due to musculoskeletal/connective tissue disorders; in 2013, 28.6% were new claims and 28.7% were existing claims. In all states, working-age adults face some work limitations attributed to arthritis. Figure 2-3 indicates that states in the Midwest and South have the highest population prevalence of arthritis-attributable work limitation.21-23 Rheumatic diseases constitute a major health problem in the general adult population due to their high prevalence.23 Diagnosing and treating rheumatic diseases early reduces the enormous personal burden these diseases place on patients, as well as the financial toll they place on society. Due to the associated risk factors, there is reason for concern in terms of the increasing numbers of patients relative to the workforce trends. Additionally, for society there is a significant financial cost through greater health care spending on extended hospital stays and tests. In addition, indirect costs of increased unemployment and disability payments are considerable. During the early stages of rheumatic disease, most of the costs are related to direct medical expenses for aggressive treatment regimens. The cost profile shifts occur with the incorporation of indirect costs related to work limitations. Reducing indirect costs can help significantly reduce the burden. Without proper treatment, people with rheumatic diseases face a life-long battle. Understanding these burdens and other access to care, health disparities, and workforce limitations are important in preparing the workforce to meet these needs.

ACR 2015 Workforce Study Report 41 | P a g e
Figure 2-3. Arthritis Attributable Work Limitations by State21-23
2.6 References 1. Gallegos A. Medical experts say physician shortage goes beyond primary care. AAMC, 2014. Retrieved
April 8, 2015 from https://www.aamc.org/newsroom/reporter/february2014/370350/physician-shortage.html
2. Health Resources and Services Administration. The Future of the Nursing Workforce: National- and State-Level Projections, 2012-2025. National Center for Health Workforce Analysis, 2015. Retrieved April 8, 2015 from http://bhpr.hrsa.gov/healthworkforce/
3. Pruitt SD, Epping-Jorday JE. Preparing the 21st century global health care workforce. BMJ, 2005;330:637. doi: http://dx.doi.org/10.1136/bmj.330.7492.637
4. World Health Organization. Preparing workforce for the 21st Century. http://www.who.int/chp/knowledge/publications/workforce_report.pdf, 2005.
5. Manpower Group. Manpower Group Annual Survey Reveals U.S. Talent Shortages Persist. 2014. Retrieved April 8. 2015 from http://www.manpowergroup.us/campaigns/talent-shortage-2014
6. National Association of Colleges and Employers. 2013. Top 10 Skills for Job Candidates. Retrieved April 8, 2015 from https://www.naceweb.org/s04032013/top-10-job-skills.aspx
7. Nicol D, Draper S. A blueprint for transformational organizational change in higher education: REAP as a case study. 2009. Retrieved April 8, 2015 from http://www.psy.gla.ac.uk/~steve/rap/docs/NicolDraperTransf4.pdf
8. Carnevale AP, Hanson AR, Gulish A. Failure to Launch: structural shift and the lost generation. Georgetown University Center on Education and the Workforce. 2013. Retrieved April 6, 2015 from https://cew.georgetown.edu/wp-content/uploads/2014/11/FTL_ExecSum.pdf
9. HRSA. Workforce Shortage. Retrieved January 22, 2016 from: http://www.hrsa.gov/shortage/, 2015

ACR 2015 Workforce Study Report 42 | P a g e
10. Bureau of Labor Statistics, 2015. Number of Jobs Held, Labor Market Activity, and Earnings Growth Among the Youngest Baby Boomers: Results from a Longitudinal Survey Summary http://www.bls.gov/news.release/nlsoy.nr0.htm
11. Association of American Medical Colleges. 2013 U.S. Medical School Applicant and Enrollment Data and Addressing Physician Shortages. Retrieved June 3, 2016 from https://www.aamc.org/download/359300/data/102813.pdf.
12. HRSA. Health Workforce. Retrieved April 8, 2015 from http://ahrf.hrsa.gov/categories.htm#1 13. Interprofessional Education Collaborative Expert Panel. (2011). Core competencies for
interprofessional collaborative practice: Report of an expert panel. Washington, D.C.: Interprofessional Education Collaborative.
14. American Osteopathic Association. The Single GME Accreditation System. Retrieved June 9, 2015 from http://www.osteopathic.org/inside-aoa/single-gme-accreditation-system/Pages/default.aspx.
15. American Medical Association. AMA Supports Creation of New GME Accreditation System, Praises Collaboration by Allopathic and Osteopathic Medical Communities . 2014, Retrieved June 9, 2015 from http://www.ama-assn.org/ama/pub/news/news/2014/2014-02-26-ama-supports-creation-of-new-gme-accreditation-system.page
16. Centers for Disease Control and Prevention. Prevalence of doctor-diagnosed arthritis and arthritis-attributable activity limitation—United States, 2003–2005. MMWR, 2006;55:1089–1092. Available from: http://www.cdc.gov/mmwr/preview/mmwrhtml/mm5540a2.htm 17
17. Myasoedova E, Crowson CS, Kremers HM, Therneau TM, Gabriel SE. Is the incidence of rheumatoid arthritis rising: Results from Olmsted County, Minnesota, 1955-2007. Arthritis Rheum, 2010;62(6):1576-1582. doi:10.1002/art.27425. PubMed PMID: 20191579; PubMed Central PMCID: PMC2929692
18. Helmick CG et al. Estimates of the prevalence of arthritis and other rheumatic conditions in the United States. Part I. Arthritis Rheum. 2008 Jan;58(1):15-25. doi:10.1002/art.23177.
19. Lawrence RC et al. Estimates of the Prevalence of Arthritis and Other Rheumatic Conditions in the United States, Part II. Arthritis Rheum, 2008 Jan; 58(1): 26–35. doi:10.1002/art.23176
20. Silman AJ, Hochberg MC. Epidemiology of the rheumatic diseases. 2nd edition: Oxford University Press; 2001.Hootman JM, Helmick CG. Projections of U.S. prevalence of arthritis and associated activity limitations. Arthritis and Rheumatism, 2006;54:266–229.
21. Council for Disability Awareness. 2014 CDA long term disability claims review. Retrieved November 5, 2015 from http://www.disabilitycanhappen.org/research/CDA_LTD_Claims_Survey_2014.pdf
22. Centers for Disease Control and Prevention (CDC). The power of prevention. Chronic disease…the public health challenge of the 21st century. Retrieved November 5, 2015 from http://www.cdc.gov/chronicdisease/pdf/2009-Power-of-Prevention.pdf
23. Hootman JM, Helmick CG. Projections of U.S. prevalence of arthritis and associated activity limitations. Arthritis and Rheumatism, 2006;54:266–229.

ACR 2015 Workforce Study Report 43 | P a g e
3. CURRENT WORKFORCE
Understanding the character and composition of the overall rheumatology workforce is essential to meet the challenges facing the profession as well as provide adequate care for patients with rheumatic and musculoskeletal diseases. Expectations regarding the future supply of and demand for rheumatologists have broad implications for training, recruitment, practice management, funding, and understanding the needs for providing care for the anticipated increasing numbers of patients. In 2005 - 2006, the American College of Rheumatology (ACR) conducted a comprehensive rheumatology workforce study, the purpose of which was to gain a better understanding of the factors affecting rheumatologist supply and demand. Workforce planning involves a continuous process of shaping and structuring the workforce to ensure there is sufficient and sustainable capacity to meet organizational objectives now and in the future. Ten years have lapsed since the last workforce study, and it is again time for the ACR to analyze the current rheumatology workforce in order to make some predictions about the future of rheumatology.
3.1 Defining the Current Workforce The WSG was instrumental in helping define the current workforce. The question about whom the group should concentrate on was discussed in detail. In the long run, it was decided to include in the supply numbers both physicians and specialists who directly provide care. These numbers included adult rheumatologists, pediatric rheumatologists, Med-Ped rheumatologists, nurse practitioners and physician assistants. The supply model includes Fellows-in-Training (FITs) as they entered the workforce each year. FITs were not counted for 2015, the assumption being graduates from 2014 were already in the 2015 workforce. Several sources were used to gather data to help determine the most accurate current rheumatology workforce numbers.1-8 Defined baseline active rheumatologists included most recently published data of all those who have completed their rheumatology subspecialty training. After looking through the most recent reports from the American Board of Internal Medicine (ABIM) and the American Board of Pediatrics (ABP) for those who have current certifications, it appeared there were still some discrepancies in the data. Some of these reports did not include all data for every state. In some states if the numbers were under 10 in the subspecialty reporting was not required. Therefore, data in these states were collected using the ACR website “find a rheumatologist” function. This service provided by the ACR includes members and their specialty/subspecialty (e.g., adult, pediatric, adult/pediatric, internal medicine, orthopedics, etc.). As previously mentioned, these data augmented the other sources of data.1-4,8 A summary breakdown of what the WSG felt was the most current picture of the primary providers both in actual numbers and clinical FTE is in Table 3-1.
Table 3-1. Current Primary Rheumatology Workforce by Specialty
Adult Pediatric
Specialty Training Total Clinical FTE Total Clinical FTE Rheumatologists 5,595 4,997 300 287 Nurse Practitioners* 248 228 22 20 Physician Assistants* 207 190 4 4
Total Active Primary Providers 6,050 5,415 326 311
Sources: AMA, ABIM, ABP; RNS, AAPA, PRCSG, & ACR Workforce Study Survey Results. ABIM most current numbers of active rheumatologists were provided February 2016. *Numbers were pulled from the non-physician association information and the published literature. These numbers only reflect active certificates.

ACR 2015 Workforce Study Report 44 | P a g e
3.1.1 Rheumatology Physician Providers. There were a total of 783,982 MDs and 62,644 DOs active physicians as of 2014.1 Of those, 691,086 MDs and 57,232 DOs reported they were actively treating patients. The supply of physician FTEs in all non-primary care fields is expected to grow overall by 21% between 2010 and 2025.8 Based on the Supply and Demand for non-Primary Care Practitioners Report, the projected FTE supply for rheumatology specialists for 2025 was 5,505, which represents a projected 1.5 FTE supply per 100,000 persons in 2025. The 2005 ACR workforce study projected the supply of adult rheumatologists to be 5,008 by 2025 with a need of over 7,000. While there was an anticipated change in supply (19%), there was no projected changes in FTE supply per 100,000 persons (1.5/100,000) in both 2010 and 2025.8 This was likely attributed to the increase in demand paralleling the increase in supply.
3.1.1.1 Adult Rheumatologists. The ABIM reported 6,198 certificates issued in the U.S. in total with 5,716 total current valid certificates.4 These numbers are consistent with the numbers from the American Medical Association (AMA). Of the number of certificates that were issued annually by the ABIM, approximately 200 were issued each year for rheumatology, with 790 being issued since 2010.4 There are currently 113 adult rheumatology programs holding a total of 460 FITs, with 232 openings/positions for year 1.2-4 Of those who have achieved certification in rheumatology, approximately 84% maintain their certification.4 The breakdown by states (including Puerto Rico) can be found in Appendix C. Currently, an estimated 5,595 active adult rheumatologists equates to on average 41,879.2 adults per physician ratio.4 This ratio increases to 52,104.5 when using projected clinical FTE (N=4,997).
3.1.1.2 Pediatric Rheumatologists. The ABP tracks career trends and subspecialty trends.3 Since 1990, the percentage of candidates who elect a subspecialty has decreased slightly (33% in 1990 to 30% in 2014). The percentage has fluctuated across the 2 decades to a low of 20% in 1998 and a high of 34% in 2011. The total number of fellow graduates increased from 47 in 2003 to 83 in 2014. American medical graduates (AMGs) increased from 27 (57.4%) in 2003 to 56 (67.5%) in 2014.3 The International Medical graduates (IMGs) increased from 20 (42.6%) in 2003 to 27 (32.5%) in 2014. A majority of these graduates are female (71%) compared to 29% males. In addition, there is a combined Internal Medicine/pediatric rheumatology fellowship that prepares fellows-in-training to care for both children and adults with rheumatic disease. This fellowship combination is especially attractive to areas that cannot support a full-time pediatric rheumatologist. For purposes of this workforce study, these Med-Ped are included in the pediatric supply numbers. The breakdown by states (including Puerto Rico) can be found in Appendix C. Currently, an estimated 300 active pediatric rheumatologists equates to on average 250,092.3 children per physician ratio.3 This ratio increases to 261,420.53 when using projected clinical FTE (N=287).
3.1.2 Non-Physician Specialty Providers. There are significant anticipated changes in the national supply of physicians, nurse practitioners (NPs), and physician assistants (PAs) in 35 predefined non-primary care specialties and subspecialties.6-8,10 Between 2010 and 2025, the NP supply is projected to grow in all areas by 213% percent in medical subspecialties, 118% in non-primary care medical specialties, and 181% across all surgical fields.8 The anticipated growth in medical subspecialty fields is 6% (20% to 26%). The PA supply is estimated to be 9,100 in medical subspecialties, 20,400 in surgical specialties, and 23,000 in non-primary care medical specialty areas.8 By 2025, the PA supply is projected to grow by 110% (to 19,000) in medical subspecialties, 99% (to 40,500) in surgical specialties, and 117% (to 49,900) in non-primary care medical specialty areas.8 Signs of excess demand for rheumatology services have already been seen.8,11 In an attempt to meet these growing demands, approximately 25% of rheumatologists have already expanded their practices to include a NPs and PAs.11
3.1.2.1 Nurse Practitioners (NPs). Nursing is the nation's largest health care profession, with more than 3.1 million registered nurses nationwide. Of all licensed RNs, 2.6 million or 84.8% are

ACR 2015 Workforce Study Report 45 | P a g e
employed in nursing. There are approximately 12,273 NP graduates which was an increase of approximately 69% since 2001.5 Overall enrollment for nursing was up by 20.5% (154 schools reporting), with an increase in graduations by 1.9% (92 schools reporting) from 2008 to 2009.5 Doctor of Nursing Practice (DNP) programs account for the largest share of the growth in this student population with a 40.9% increase in enrollments reported in 2015 (85 schools reporting).6 Currently, there are an estimated 5,000 rheumatology nurses; not all are NPs. However, given about 4% of all practicing nurses are NPs, it was estimated that of the 5,000 who are practicing in rheumatology, approximately 270 are NPs within the U.S (248 in Adult Rheumatology and 22 in Pediatric Rheumatology). Currently, an estimated 248 active nurse practitioners working in adult rheumatology, which equates to an estimated 228 clinical FTE. An estimated 22 nurse practitioners working in pediatric rheumatology equates to an estimated 20 clinical FTE. HRSA projects a 30% increase in the supply of NPs over the period 2010-2020. This number will be used to help with projected increases in the NP population in Rheumatology. It is also estimated that by the year 2025, there will only be about half of the RNs required to meet the demand, which will also help in calculating the number for the supply model.11-12 Changes in the non-primary care NP supply somewhat mirrors those of physicians, with the greatest growth expected in the fields of physical medicine and rehabilitation, and emergency medicine. The per capita supply of NPs is projected to increase across all non-primary care specialties with the greatest increases expected in obstetrics-gynecology and pediatric subspecialties.6 According to the U.S. Bureau of Labor Statistics, registered nursing is the top occupation in terms of the largest job growth from 2008-2018.10 More than 581,500 new RN jobs will be created through 2018 and by 2025 the U.S. nursing shortage will grow to more than 260,000 registered nurses.10 NP rheumatology workforce supply is expected to increase by 202% by 2025 (400 to 1,100).7,10,12 The projected supply per 100,000 persons for nursing is not expected to change significantly by 2025 (2.3 per 100,000 to 2.6 per 100,000).5-6 In 2012, the American Nursing Association (ANA) recognized Rheumatology Nursing as a specialty.13-17 The score and standards of practice were published in 2014.13 Core Curriculum for RN training is available from the Rheumatology Nurses Society. In 2014, the American Nurses Credentialing Center (ANCC) and the Rheumatology Nurses Society (RNS) announced plans to develop a new board certification through portfolio for Rheumatology Nursing. NPs who work in the field of rheumatology reported treating rheumatoid arthritis (96.8%), psoriatic arthritis (95.8%), osteoarthritis (63.2%), axial spondylarthritis (62.8%), systemic lupus erythematosus (51.6%), and scleroderma (34.7%).13-14 In addition to providing primary care, NPs can also assist in managing a rheumatology practice.
3.1.2.2 Physician Assistants (PA). PAs are also a very important part of the U.S. medical workforce.18-19
Because of the anticipated physician shortages in the U.S. workforce by 2025, there may be more reliance on non-physician providers.18-19 There were approximately 43,500 certified PAs in 2003, with growth rate of 119% reaching 95,583 in 2013.18 PA enrollment rates were anticipated to increase by 350 (5%) in 2011 and continue to increase thereafter, but at a decreasing rate, declining to 100 new graduates in 2025.18 In 2013 there were 95,583 certified PAs in the U.S. Approximately 8% of PAs practice in Internal Medicine subspecialties (n=4,178) and 1.9% practice in pediatrics. (n=534).20 According to the American Academy for Physician Assistant’s, there are currently 211 members who work in the field of rheumatology (207 AR; 4 PR). This equates to 190 clinical FTE for adult rheumatology and 4 clinical FTE pediatric rheumatology.

ACR 2015 Workforce Study Report 46 | P a g e
According to the U.S. Bureau of Labor Statistics, the supply of Physician Assistants is projected to grow 30% from 2014 to 2024, which is a faster than the average for all occupations.21 PA rheumatology workforce supply is expected to increase by 112% by 2025 (200 to 500).8,22 Similar to physician and NP FTE supply change per 100,000 persons, the projected supply per 100,000 persons is not expected to change by 2025 (0.1 per 100,000 persons to 0.1 per 100,000 persons).8
3.2 Characteristics of Current Workforce
In addition to the information gathered from the AMA, ABIM, ABP, RNS, NCCPA, and other published data, primary data was collected during the current workforce study. These data were used to determine the demographics of the current active workforce. While information was also gathered on other rheumatology specialists, such as researchers, Pharm-D, OT-PT, etc., only primary providers were considered in calculating the workforce supply numbers. Three surveys were developed, validated, and distributed. The main workforce survey focused on rheumatology specialists. Two supplementary surveys were distributed, one to Fellows-in-Training (FITs) and one to patients (adult, young adult, and pediatric). Complete results can be found in the workforce study survey report.21 Below details statistics gathered from AAMC, ABIM, ABP, and the workforce survey.
3.2.1 AAMC Physician Specialty Data.2 Eighty-seven percent (87%) of practicing rheumatologists actively treated patients, with the remaining teaching, conducting research, and administration.2 The average number of people per physician reported in December 2013 was 59,012.2 Of active rheumatologists, 59.2% were male and 40.8% female, with 46.1% were over the age of 55.2 Between 2008 and 2013, there was an increase of 14.6% in practicing rheumatologists. Between 2008 and 2013, there was a 5.1% increase in total fellows (197 to 207). Of those in fellowships during 2013 year, 58.8% are female with 41.2% male, indicating a shift in gender demographics.
3.2.2 ABIM Physician Specialty Data.4 The reported average number of people per physician differs significantly in data reported by the ABIM, where the average overall across all 50 states and Puerto Rico for adult rheumatologists was 61,477 per physician.4 ABIM reported a total of 6,198 certificates awarded in all states and Puerto Rico, with 5,716 valid as of March 2015. In 2014, there were 202 rheumatology certificates awarded. Within the subspecialty of Rheumatology, 58% maintain their certificate in Internal Medicine and 84% maintain their subspecialty certification.
3.2.3 ABP Physician Specialty Data.3 As of December 2014, there were 364 total rheumatology pediatric subspecialty diplomates certified. According to the ABP 2014 workforce data, 66.7% are female with 33.3% males. In 2014, of the 83 total fellows, 59 (71.1%) were female and 24 (28.9%) male. Of those who reported working full-time, 59.6% were female and 40.4% male. One hundred percent (100%) of those reporting they worked part-time were female. The report indicated that over 50% currently working spend more than 50 hours at work each week. Less than 20% indicated they did not have an academic affiliation, indicating most pediatric rheumatologists work in an academic environment. The majority of their time is spent in direct inpatient/outpatient care (61.4%) with 67.9% in outpatient subspecialty pediatric care settings. Research was the next highest percentage (26.5%) of their time spent in professional tasks. Medical education and other tasks account for the remainder of their time.
3.2.4 Data from 2015 Workforce Survey.9 To achieve sufficient power from the rheumatology specialist survey, (power of 0.80), a minimum sample size of 370 total surveys were needed, assuming a

ACR 2015 Workforce Study Report 47 | P a g e
normal distribution of respondents across the disciplines. In 2005, a little over 1700 surveys were received. The goal was to reach a minimum response rate of 30% (n=1902) response rate to meet or exceed the survey response rate from 2005. A total of 1996 completed surveys (31.5% response rate: 1996/6342) were included in the 2015 ACR workforce study. This response rate represents a power greater than 0.95 for good generalizability. In addition to the ensuring a minimum total number of responses received, it was also important to ensure good distribution of responses across the disciplines. Table 3-2 details the response rate by specialty compared to ACR/ARHP membership numbers (as of February 2016. Table 3-2. Comparison ACR Membership Profile Numbers to 2015 ACR WFS Survey Respondents Specialty Membership Response Rates
N % N %
Adult Rheumatologist 3866 84.9 1297 68.5 Pediatric Rheumatologist/Med-Ped 220 4.8 380 21.2 Nurse Practitioners 82 1.8 87 4.5 Physician Assistant 28 0.6 26 1.3 Grand Total 3642 ----- 1790 ----- Note: Total N for surveys was 1996 however not everyone completed this item. In addition, membership numbers provided by ACR reflect only those members who completed their profile as of February 29, 2016 (N=4,555). Thus the total number of members by specialty does not necessarily reflect 100% of ACR membership.
While not all rheumatology specialists in the U.S. belong to the ACR/ARHP, it was reasonable to assume that most respondents would be members. Data collected met the criteria from the power analysis, and distribution of respondents was relative representative of the ACR membership. ACR did not have a specialty category for Med-Peds and for purposes of determining representation, the pediatric and Med-Ped group were combined, thus representing a higher percentage than ACR profile numbers. With the distribution of the sample, it was felt that inferences from the survey could be made relative to the rheumatology primary providers. However, caution should be placed on these inferences to non-ACR members. Of the adult rheumatology practitioners who responded to the ACR workforce study, 1185 (89%) reported being Board Certified in Adult Rheumatology. Of the pediatric specialists, 257 (94%) reported being board certified in Pediatric Rheumatology. Results of the 2015 ACR Workforce survey reported a higher percentage of respondents who actively treat patients (n=1381; 95%) than the AAMC, ABIM and ABP. This is likely due to the fact that the survey item included those treated by their staff and fellows. The average number of patients that respondents reported seeing per week (including patients that were treated by their staff and fellows) was 54 (SD=14.0).9 A majority of adult rheumatologists (n=627; 61.5%) and Med-Peds (n=40; 66.7%) were male while a majority of pediatric rheumatologists were female (61.2%). Additionally, females dominated the NP and PA workforce as well.
3.3 Diversity of the Workforce
The expansion of the core competencies developed to prepare the health care workforce for the 21st century will help the medical profession and all other health professionals to provide care for patients suffering from chronic conditions, such as rheumatoid arthritis, more effectively.23 These core competencies will shift current thinking about providing care for patients with ongoing health problems and reform the training and preparation of the health care workforce in the 21st Century.24 The importance and rapid proliferation of technologies raises important questions as to how to train the next

ACR 2015 Workforce Study Report 48 | P a g e
generation of specialists, not only to use particular tools, but to be prepared for a changing technological landscape. In addition, the advent of new and expanding types of data raises additional questions about how to train the next generation in approaches to data sharing and analysis. There is an increasing need to prepare investigators to bridge the translational gap between basic science and clinical application. Given this changing landscape, it is critical to explore the diversity of the rheumatology workforce, and project the workforce needs for essential training programs to ensure they are able to meet the challenges. The elements that will be explored in this section include gender, race/ethnic, and generational differences. Results on gender, race/ethnicity, and generational differences from the 2015 ACR workforce survey will be presented in sections 3.3.1, 3.3.2, and 3.3.3 below.
3.3.1 Gender Differences. Figure 3-1 displays the gender differences by specialty. There were more male adult rheumatology respondents and more female pediatric rheumatology respondents. Additionally, there were more female Nurse Practitioner and Physician Assistant respondents.
Figure 3-1. Gender Differences by Specialty (N=1380)
Figure 3-2 diagrams the age breakdown between male and female adult rheumatologists. Results suggest that there are significantly more male adult rheumatologists over the age of 55 than females. However, while the data suggests that there are more females entering the adult rheumatology field than males, the amount is not significantly different at this point, but the workforce projections indicate that more females will be entering the workforce each year, therefore, this changing trend will need to be closely monitored. When comparing Pediatric/Med-Ped responses, there were significantly more females than males in the 36-45 age group but not in the older age groups. It is still important to continue to closely
Adult Ped/Med-Ped ANP PA
Male 627 123 4 6
Female 384 166 60 10
627
123
4 6
384
166
60
10
0
100
200
300
400
500
600
700
Numbers
Provider Specialty

ACR 2015 Workforce Study Report 49 | P a g e
monitor gender diversity trends (Figure 3-3). These most current data were used in the workforce study model.
Figure 3-2. Age Distribution by Gender for Adult Rheumatologists (N=851)
Figure 3-3. Age Distribution by Gender for Pediatric/Med-Ped Rheumatologists (N=259)
<35 36-45 46-55 56-65 >65
Male 19 91 108 212 197
Female 41 135 95 98 15
19
91
108
212 197
41
135
95 98
15 0
50
100
150
200
250
Frequency
Age Group
<35 36-45 46-55 56-65 >65
Male 8 33 24 34 26
Female 24 70 33 31 8
8
33
24
34
26 24
70
33 31
8 0
10
20
30
40
50
60
70
80
Frequency
Age Group

ACR 2015 Workforce Study Report 50 | P a g e
3.3.2 Race/Ethnic Differences. Table 3-3 details the breakdown from the workforce survey self-reported responses relative to race and ethnicity. These data indicate that there is a lack of diversity with regard to race/ethnicity in the field across the primary providers (including NPs and PAs). The lack of diversity in the rheumatology field is displayed in the results of the survey. Over 80% of the respondents reported being non-Hispanic, with about more than 75% being white. Diversity of the workforce is a critical topic of concern for the COTW and an area in which the ACR should focus specific initiatives.
3.3.3 Generational Differences. Millennials, or America’s youth, born between 1982 and 2000, now number 83.1 million and represent more than 1/4 of the nation’s population, exceeding that of the 75.4 million baby boomers.25 Overall, millennials are more diverse than the generations that preceded them, with 44.2% being part of a minority race or ethnic group. The landscape is changing faster than we can change with it. The U.S. Department of Labor reported that baby boomers (born from 1957 to 1964) held on average of 5.3 jobs between ages 23 to 42. Conversely, 91% of millennials born 1977-1997 are expected to stay in a job for less than three years, meaning they would have 15-20 jobs over the course of their working lives.26 In addition to that, the top ten in-demand jobs in 2013 did not exist in 2004. Physicians must now learn to work collaboratively within a complex, information-driven system, where continuous improvement mechanisms are in place to provide feedback for quality improvement and data for research. Challenges will continue as students are preparing for jobs that do not yet exist, using technologies that have not yet been invented, in order to solve problems that have not yet been identified. Table 3-3. Race and Ethnic Breakdown of Respondents by Discipline
Ethnicity Adult Pediatric Med-Ped NP PA
N % N % N % N % N %
Hispanic 85 8.5 20 8.7 1 1.7 3 4.9 0 0
Non-Hispanic 832 83.5 191 83.0 56 93.3 55 90.2 13 92.9
American Indian or Alaskan Native
3 0.3 0 ----- 1 1.7 0 ----- 0 -----
Asian 153 15.0 34 14.5 4 6.7 1 1.6 0 -----
African American 8 0.8 3 1.3 0 ----- 0 ----- 0 -----
Native Hawaiian or Pacific Islander
1 0.1 2 0.9 0 ----- 0 ----- 2 12.5
White 751 73.6 174 74.0 51 85.0 59 92.2 14 87.5
>2 races 22 2.2 6 2.6 3 5.0 3 4.7 0 -----
Figure 3-4 details the breakdown from the workforce survey self-reported responses relative to generational differences by reported specialty from workforce study data. The operational definition of “generational difference” was: 1) Baby Boomers - 56 years of age and older; 2) Generation X - between 36 and 55 years of age; and 3) Millennials - 35 years of age or younger. Baby Boomers represented the majority of the adult rheumatology respondents (n=524; 51.4%) followed closely by the generation X (n=436; 42.8%). Conversely, pediatric rheumatology respondents were predominantly made up of Generation X (n=146; 62.1). There is an apparent shift from baby boomers to Generation X and now to Millennials.

ACR 2015 Workforce Study Report 51 | P a g e
Figure 3-4. Percent Comparisons: Generational Comparisons by Discipline (N=1395)
3.4 Geographic Distribution of Rheumatologists In 2013, the ACR COTW published a paper on the regional distribution of adult rheumatology practices in the U.S., along with the factors associated with that distribution.27 The study found there were many areas saturated with adult rheumatologists (high ratio of adult rheumatologists within a specific geographic area); however, there were many areas with a small ratio of adult rheumatologists in a given geographic area resulting in excess demand that should be addressed. Data presented here describes the most current snapshot of adult and pediatric rheumatologists practicing in the U.S. and Puerto Rico. Complete data for all states and regions is located in Appendices D through F. It should be noted that prior to including data pulled from the ACR website “Find a Rheumatologist” service there were seven (7) states with either incomplete or no reported data.
3.4.1 Adult Rheumatology Distribution. Figure 3-5 presents a breakdown of adult rheumatologists by region. More specific state and regional information including gender where reported can be found in Appendices E and F. Prior to data pulled from the ACR “Find a Rheumatologist” service, there were three (3) states that were without any reported adult rheumatologists: Alaska, North Dakota, and Wyoming. The overall average adult rheumatologist physician per person across the U.S. was 41,657.6. The largest person per physician ratio by region is the Southwest at 66,163 physicians per person, followed next by the Southeast at 60,087 persons per physician and South Central at 52,689 persons per physician (Table 3-4).
0%
10%
20%
30%
40%
50%
60%
70%
80%
90%
100%
Adult Ped/Med-Ped NP PA
Millennials 60 32 7 7
Generation X 436 162 26 4
Baby Boomers 524 101 31 5
524
101 31
5
436
162 26
4
60 32 7
7
Percentage
Specialty

ACR 2015 Workforce Study Report 52 | P a g e
Figure 3-5. Breakdown of Adult Rheumatologists by Region2,4
3.4.2 Pediatric Rheumatology Distribution. Figure 3.6 presents a breakdown of pediatric rheumatologists by region. More specific state and regional information including gender where reported can be found in Appendices E and F. Prior to data pulled from the ACR “Find a Rheumatologist” service, there were ten (10) states that were without any reported pediatric rheumatologist: Idaho, Nevada, Montana, North Dakota, South Dakota, New Mexico, Wyoming, New Hampshire, West Virginia, Alaska, and Puerto Rico. Afterward, there was one state without a reported pediatric rheumatologist: Alaska. The overall average pediatric rheumatologist physician per child across the U.S. is 229,443. The largest physician per child by region is Southwest at 605,065 followed by the South Central at 493,126 and Southeast at 483,715 physicians per child (Table 3-4).
3.4.3 Regional Distribution of Physician per Population. Table 3-4 provides a snapshot of the breakdown of regional data by average number of persons-per-physician within a region for both adult and pediatric rheumatologists. A full breakdown by region of all respondents including patient data is location in Appendix E. Table 3-5 combines the numbers (and percentages) by region and compares them to data collected in the workforce survey. These data show relatively consistent information about the distribution of the adult and pediatric rheumatologists. In 2015, there were 17.4 adult rheumatologists and 0.9 pediatric rheumatologists-per-million people in the U.S. Approximately 25.5% of the U.S. population is under 19 years of age.28 This implies that there are 23.3 adult rheumatologists for every 1 million adults and 3.7 pediatric rheumatologists for every 1 million children. This is up slightly from the 2005 workforce study, which found there to be 22 adult rheumatologists for every 1 million adults and 3 pediatric rheumatologists for every one million children.

ACR 2015 Workforce Study Report 53 | P a g e
Figure 3-6. Breakdown of Pediatric Rheumatologists by Region3
Table 3-4. Regional Distribution of Physician per Population Data Breakdown
Region
Adult Rheumatologists Pediatric Rheumatologists
Active Rheum
Adult Population per Region
Adult per Physician
Ratio
Active Rheum
Child Population per Region
Child per Physician
Ratio N % N %
1 Northeast 1264 21.1 33,719,386 26,676.7 81 24.8 9,762,002 120,518.5
2 Mid-Atlantic 1028 17.1 35,555,292 34,586.9 57 17.4 9,835,635 172,555.0
3 Southeast 698 11.6 41,940,692 60,087.0 25 7.6 12,092,867 483,714.7
4 Great Lakes 957 16.0 39,642,918 41,424.2 50 15.3 12,633,687 252,673.7
5 North Central 255 4.3 12,026,980 47,164.6 19 5.8 3,603,818 189,674.6
6 South Central 493 8.2 25,975,519 52,688.7 17 5.2 8,383,137 493,125.7
7 Southwest 233 3.9 15,415,990 66,163.0 8 2.4 4,840,522 605,065.3
8 West 742 12.4 30,763,180 41,459.8 40 12.2 9,813,241 245,331.0
9 Northwest 262 4.4 11,947,352 45,600.6 22 6.7 3,264,394 148,381.5
10 Puerto Rico 64 1.1 2,750,008 42,968.9 8 2.4 798,389 99,798.6
Total 5996 249,737,317 41,657.6 327 75,027,692 229,442.5
Sources: AMA, ABIM, ABP; RNS, AAPA, & ACR Workforce Study Survey Results. ABIM most current numbers of active rheumatologists received February 2016. These numbers reflect all certificates and number from ACR “Find a Rheumatologist” service. Therefore, totals are slightly higher than the projected current active adult workforce of 5,595 and pediatric workforce of 300.

ACR 2015 Workforce Study Report 54 | P a g e
Table 3-5. Comparison Regional Data to Survey Respondents
Region
AAMC, ABIM, ABP 2015 Workforce Survey
Adult Pediatric* Adult Pediatric**
N % N % N % N % Northeast 1264 21.1 81 24.8 174 14.7 38 10.6 Mid-Atlantic 1028 17.1 57 17.4 175 14.8 58 16. Southeast 698 11.6 25 7.6 103 8.7 22 6.1 Great Lakes 957 16 50 15.3 136 11.5 40 11.2 North Central 255 4.3 19 5.8 27 2.3 17 4.7 South Central 493 8.2 17 5.2 204 17.2 41 11.5 Southwest 233 3.9 8 2.4 84 7.1 32 8.9 West 742 12.4 40 12.2 199 16.8 76 21.2 Northwest 262 4.4 22 6.7 82 6.9 34 9.5 Puerto Rico 64 1.1 8 2.4 ----- ----- ----- ----- Total 5995 327 1184 358 Note: *Does not include Med-Ped; **Includes Med-Ped. These numbers reflect all certificates and number from ACR “Find a Rheumatologist” service. Therefore, totals are slightly higher than the projected current active adult workforce of 5,595 and pediatric workforce of 300.
In 2015, there were 17.4 adult rheumatologists and 0.9 pediatric rheumatologists per million people in the U.S. Report by the Census Bureau,28 approximately 25.5% of the U.S. population is under 19 years of age. This implies that there are 23.3 adult rheumatologists for every 1 million adults and 3.7 pediatric rheumatologists for every 1 million children. This is up slightly from the 2005 workforce study, which found there to be 22 adult rheumatologists for every 1 million and 3 pediatric rheumatologists for every one million.
3.4.3 Metropolitan Statistical Areas (MSA). A metropolitan statistical area (MSA) is a geographical region with a relatively high population density at its core and close economic ties throughout the area.29 The precise definition of any given metropolitan area can vary with the source; however, a typical metropolitan area is centered on a single large city that wields substantial influence over the region (e.g., Chicago, Atlanta, etc.). Some metropolitan areas contain more than one large city with no single municipality holding a substantially dominant position (e.g., Dallas–Fort Worth, Minneapolis–Saint Paul). MSAs are defined by the Office of Management and Budget (OMB) and used by the Census Bureau and other federal government agencies for statistical purposes.29 The top ten MSAs with breakdown by estimates of the number of adult and pediatric rheumatologists actively practicing in the MSA are listed in Appendix F. OMB identifies metropolitan areas around the United States using a set of criteria based largely on population density and commuting patterns. Every 10 years, in anticipation of the next decennial census, OMB reviews and occasionally revises the criteria it uses to define metropolitan areas then issues new designations using those criteria and updated census data. On February 28, 2013, OMB announced the revised metropolitan area designations developed using the new criteria and Census 2010 data (Figure 3-7).30 Changes included new metropolitan statistical areas (MSAs) as well as the shape of some existing MSAs where counties have been added and deleted (Figure 3-7). If these MSAs are adopted by Centers for Medicare & Medicaid Services (CMS), which they typically are, these changes would affect many aspects of the Medicare program and have broad implications for hospitals, skilled nursing facilities, home health agencies, ambulatory surgery centers, ambulance service suppliers and other provider types. The new MSAs also could present new challenges and opportunities for hospitals with respect to

ACR 2015 Workforce Study Report 55 | P a g e
wage index geographic reclassification. The new MSAs also could present new challenges and opportunities for hospitals and providers with respect to wage index geographic reclassification. Figure 3-7. New MSA Areas, 201330
While CMS has issued a proposal to adopt the new MSAs, as of now, they have not done so. Geographic designation plays a large role in Medicare payment and regulation. CMS uses the MSA delineations to classify counties and providers in those counties into urban and rural areas, because Medicare payments are based on location within an urban or rural area. Adoption of these new MSA designations would impact Medicare payment for many providers when geographic wage index adjustments are made to reflect labor cost variations between localities. CMS calculates a distinct wage index for each MSA and one wage index per state for the areas that lie outside of the MSAs. MSA changes could cause significant wage index swings for some areas for virtually all provider types. Geographic designation also plays a role in determining, among other things, disproportionate share payment adjustments, ambulance payments, federally qualified health center payments and counting of medical residents for hospital direct and indirect medical education payments. The new designations also may affect hospitals with or seeking Rural Referral Center, Sole Community Hospital, Medicare Dependent Hospital, and Critical Access Hospital status, all of which are contingent upon being located outside of an MSA or reclassified as such. The number of rheumatologists within MSAs have changed since the 2005 workforce study, but six of the top ten remain relatively constant.31 As in 2005, Boston metropolitan area continues to enjoy the highest concentration of rheumatologists (both adult and pediatric). The rates in 2015 are 52.2 per 1 million people for adults and 3.8 per 1 million for pediatric. This has increased from 39.9 per 1 million people for adults and 2.7 per 1 million for pediatric in 2005. Three of the top ten MSAs saw changes in their concentration. These included Philadelphia, Washington, and Atlanta, where the concentration

ACR 2015 Workforce Study Report 56 | P a g e
decreased for adult rheumatologists, but saw a slight increase in pediatric rheumatologists. In some geographic areas of the U.S. with populations of fewer than 50,000 people, adults might have to travel 200 miles or more to see a rheumatologist.2 Currently there are 6,100 designated Primary Care Health Professional Shortage Areas (HPSA) in the U.S.30 Primary Care HPSAs are defined based on a physician-to- population ratio of 1:3 per 500. In other words, when there are 3,500 or more people per primary care physician, an area is eligible for primary care HPSA designation. With regard specifically to rheumatology services, in populations with less than 50,000 people there was limited access to a practicing rheumatologist. Travel to the nearest practice in 50 of the 479 Micropolitan areas was greater than 100 miles.30 There is a severe shortage of rheumatologists, especially that of pediatric rheumatologists. There are four states with less than 15 adult rheumatologists to cover the entire state (North Dakota, South Dakota, Vermont, and Wyoming) and two states that have no board-certified practicing pediatric rheumatologists (Alaska and New Mexico) (Appendices D and E). In addition, there are many states where there is only 1-3 board certified pediatric rheumatologists for the entire state. As a result, patients in need have severely limited access to the care. Confirmed by the results from patient surveys, over a quarter (27%) of adult patients, 26.3% pediatric patients, and 16.7% of young adult patients reported waiting more than 4 months to get in to see a rheumatologist from initial onset of symptoms, with about 9% of adults and 7% of pediatric patients taking greater than 12 months. When asked about their urgent care follow-up needs, the greatest proportion of patient respondents felt that it was only somewhat difficult (n=293; 35%) to not at all difficult (n=326, 39%) to get an appointment with their rheumatologist. However, there was a smaller percentage from each patient group that reported difficulty in getting in to see their specialist when seeking urgent follow-up care (adults: n=123; 24.61%; parents of pediatric patients: n=75; 17.7%; young adults: n-13; 3.1%). According to the Arthritis Foundation, due to the scarcity of pediatric rheumatologists, only ¼ of children with juvenile arthritis are currently able to see a pediatric rheumatologist.31 Even when a child with childhood arthritis is able to see a pediatric rheumatologist, often the indirect costs of travel, lost time from work and school are many multiples of the direct health care costs. This was also confirmed in the 2015 workforce study survey of patients. While a majority of adult patients were able to find a rheumatologist within <2 hours (53%), only 46% of pediatric and young adults were able to find one less than 2 hours from their home. They reported that fuel costs, overnight lodging, missing work to get to appointments, and child care were all indirect costs associated with the rheumatology care. Section 4 will look at the current workforce reported in Section 3 and develop a workforce supply-demand model.
3.5 References
1. American Medical Association. (2015). 2015 State Physician Workforce Data Book, Centers for Workforce Studies. Retrieved January 20, 2015 from: http://members.aamc.org/eweb/upload/2015StateDataBook%20(revised).pdf
2. Association of American Medical Colleges. (2013). 2014 Physician Specialty Data Book. Retrieved January 20, 2016 from: https://members.aamc.org/eweb/upload/Physician%20Specialty%20Databook%202014.pdf
3. The American Board of Pediatrics. (2014). Workforce Data, 2014-2015. Retrieved January 20, 2016 from: https://www.abp.org/content/workforce-data
4. American Board of Internal Medicine. (2015). Statistics and Data. Retrieved January 20, 2016 from: http://www.abim.org/about/statistics-data.aspx

ACR 2015 Workforce Study Report 57 | P a g e
5. American Association of Colleges of Nursing. (2015). Student enrollment expands at U.S. Nursing Colleges and Universities for the 9th year despite financial challenges and capacity restraints. Retrieved January 20, 2016 from: http://www.aacn.nche.edu/news/articles/2009/09enrolldata
6. HRSA. (2014). The U.S. Nursing Workforce: Trends in Supply and Education. Retrieved January 20, 2016 from: http://bhpr.hrsa.gov/healthworkforce/reports/nursingworkforce/nursingworkforcefullreport.pdf
7. Kepler A. The future is here: the role of nurse practitioners in Rheumatology. The Rheumatologist, Nov 2012. Retrieved July 2, 2015 from http://www.the-rheumatologist.org/article/the-future-is-here-the-role-of-nurse-practitioners-in-rheumatology/
8. HRSA. (2014). Projecting the Supply and Demand for non-Primary Care Practitioners through 2020. Retrieved January 20, 2016 from: http://bhw.hrsa.gov/healthworkforce/supplydemand/usworkforce/clinicalspecialties/clinicalspecialties.pdf
9. American College of Rheumatology Workforce Study Taskforce The 2105 Workforce Study of Rheumatology Specialists in the United States: Survey Results. Unpublished. 2015.
10. Bureau of Labor Statistics. Registered Nurses. Occupational Outlook Handbook, 2015. Retrieved January 21, 2016 from: http://www.bls.gov/ooh/health care/registered-nurses.htm
11. Bodenheimer T, Pham HH. Primary care: current problems and proposed solutions. Health Aff (Millwood). 2010;29:799-805.
12. Bureau of Labor Statistics. Registered Nurses. Occupational Outlook Handbook, 2015. Retrieved January 21, 2016 from: http://www.bls.gov/ooh/health care/registered-nurses.htm
13. Sargen M, Hooker RS, Cooper RA. Gaps in the supply of physicians, advance practice nurses, and physician assistants. J Am Coll Surg. 2011 Jun;212(6):991-9. Epub 2011 Apr 3.
14. Duffy M. Rheumatology Nursing: Scope and Standard of Practice. American Nurses Association, 2014. ISBN: 9781558105157.
15. Goh L, Samanta J, Samanta, A. Rheumatology nurse practitioners’ perceptions of their role. Musculoskeletal Care. 2006;4: 88-100.
16. Nursingschools.net. Rheumatology Nurse. Retrieved January 21, 2016 from: http://www.nursingschools.net/profiles/rheumatology-nurse/
17. Rheumatology Nurse Newsletter. The evolving role of the rheumatology nurse. Author: 2010, 3(4). Retrieved January 21, 2016 from: https://static1.squarespace.com/static/50c9089fe4b0a97682f9922b/t/52dec1d4e4b057d0ae9f4c93/1390330324350/RNN_Vol3_Issue4_EvolvingRole.pdf
18. Hooker RS., Cawley JF, Everett CM. (2011). Predictive modeling the physician assistant supply: 2010-2015. Research Articles, 126, 707-716.
19. Hooker RS, Cawley JF, Asprey DP. Physician assistants: policy and practice. 3rd ed. Philadelphia: F.A. Davis; 2010.
20. NCCPA, 2013 statistical profile of Certified Physician Assistants. Retrieved January 21, 2016 from: https://www.nccpa.net/Upload/PDFs/2013StatisticalProfileofCertifiedPhysicianAssistants-AnAnnualReportoftheNCCPA.pdf
21. Bureau of Labor Statistics. Physician Assistants. Occupational Outlook Handbook, 2015. Retrieved January 21, 2016 from: http://www.bls.gov/ooh/health care/registered-nurses.htm
22. Deal CL, Hooker R, Harrington T, et al. The United States rheumatology workforce: Supply and demand, 2005–2025. Arthritis Rheum. 2007;56:722-729.
23. Pruitt SD, Epping-Jorday JE. Preparing the 21st century global health care workforce. BMJ, 2005;330:637. http://dx.doi.org/10.1136/bmj.330.7492.637
24. World Health Organization. Preparing workforce for the 21st Century. http://www.who.int/chp/knowledge/publications/workforce_report.pdf, 2005.
ACR 2015 Workforce Study Report 58 | P a g e
25. U.S. Census Bureau. Millennials Outnumber Baby Boomers and Are Far More Diverse, Census Bureau Reports. Retrieved January 23, 2016 from: https://www.census.gov/newsroom/press-releases/2015/cb15-113.html
26. Carnevale AP, Hanson AR, Gulish A. Failure to Launch: structural shift and the lost generation. Georgetown University Center on Education and the Workforce. 2013. Retrieved April 6, 2015 from https://cew.georgetown.edu/wp-content/uploads/2014/11/FTL_ExecSum.pdf
27. ACR Committee on Rheumatology Training and Workforce Issues. The regional distribution of rheumatologists: What can we do, what should we do? Arthritis & Rheumatism, 2013; 65(12):3011-3013.
28. U.S. Census Bureau. Population by Age and Sex. Retrieved January 23, 2016 from: https://www.census.gov/population/age/data/2012comp.html
29. U.S. Census Bureau. State and Metropolitan Area Data Book: 2010, 7th Ed. U.S. Government Printing Office. ISBN:0-16-084189-7. 2010, April.
30. Health Resources and Services Administration. Shortage Designation: Health Professional Areas & Medically Underserved Areas/Populations. Retrieved January 23, 2016 from: http://www.hrsa.gov/shortage/
31. Deal CL, Hooker R, Harrington T, et al. The United States rheumatology workforce: Supply and demand, 2005–2025. Arthritis Rheum. 2007;56:722-729.
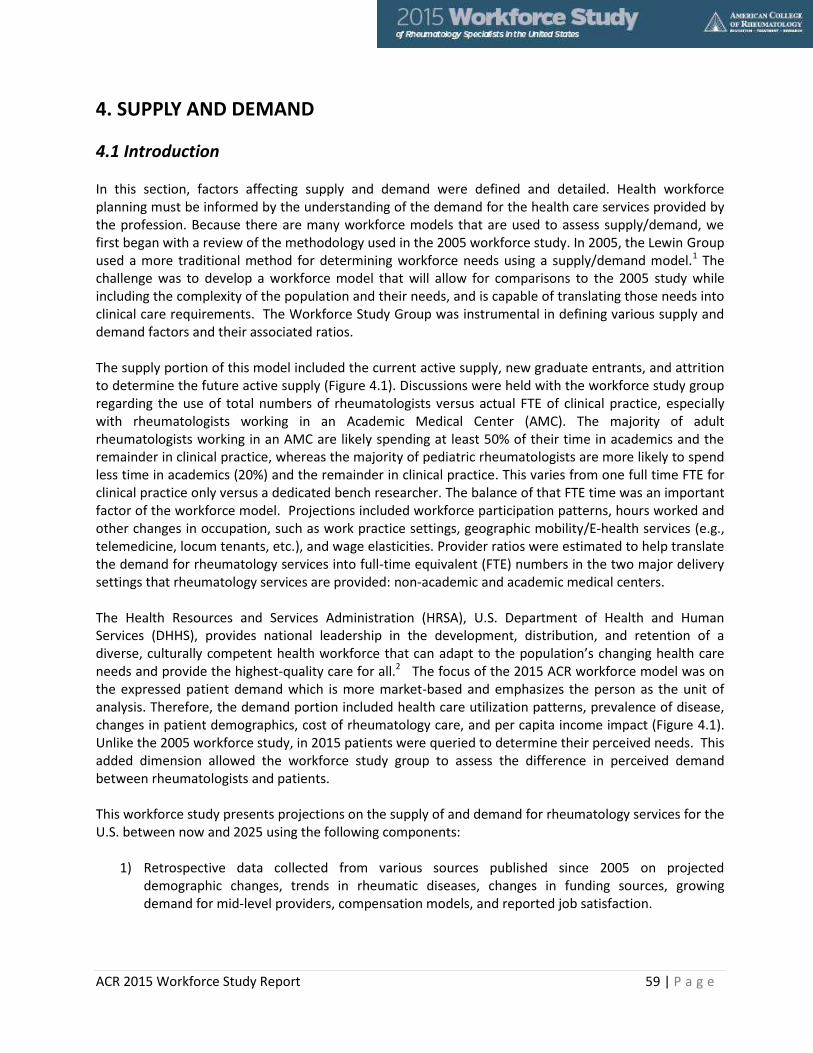
ACR 2015 Workforce Study Report 59 | P a g e
4. SUPPLY AND DEMAND
4.1 Introduction In this section, factors affecting supply and demand were defined and detailed. Health workforce planning must be informed by the understanding of the demand for the health care services provided by the profession. Because there are many workforce models that are used to assess supply/demand, we first began with a review of the methodology used in the 2005 workforce study. In 2005, the Lewin Group used a more traditional method for determining workforce needs using a supply/demand model.1 The challenge was to develop a workforce model that will allow for comparisons to the 2005 study while including the complexity of the population and their needs, and is capable of translating those needs into clinical care requirements. The Workforce Study Group was instrumental in defining various supply and demand factors and their associated ratios. The supply portion of this model included the current active supply, new graduate entrants, and attrition to determine the future active supply (Figure 4.1). Discussions were held with the workforce study group regarding the use of total numbers of rheumatologists versus actual FTE of clinical practice, especially with rheumatologists working in an Academic Medical Center (AMC). The majority of adult rheumatologists working in an AMC are likely spending at least 50% of their time in academics and the remainder in clinical practice, whereas the majority of pediatric rheumatologists are more likely to spend less time in academics (20%) and the remainder in clinical practice. This varies from one full time FTE for clinical practice only versus a dedicated bench researcher. The balance of that FTE time was an important factor of the workforce model. Projections included workforce participation patterns, hours worked and other changes in occupation, such as work practice settings, geographic mobility/E-health services (e.g., telemedicine, locum tenants, etc.), and wage elasticities. Provider ratios were estimated to help translate the demand for rheumatology services into full-time equivalent (FTE) numbers in the two major delivery settings that rheumatology services are provided: non-academic and academic medical centers. The Health Resources and Services Administration (HRSA), U.S. Department of Health and Human Services (DHHS), provides national leadership in the development, distribution, and retention of a diverse, culturally competent health workforce that can adapt to the population’s changing health care needs and provide the highest-quality care for all.2 The focus of the 2015 ACR workforce model was on the expressed patient demand which is more market-based and emphasizes the person as the unit of analysis. Therefore, the demand portion included health care utilization patterns, prevalence of disease, changes in patient demographics, cost of rheumatology care, and per capita income impact (Figure 4.1). Unlike the 2005 workforce study, in 2015 patients were queried to determine their perceived needs. This added dimension allowed the workforce study group to assess the difference in perceived demand between rheumatologists and patients. This workforce study presents projections on the supply of and demand for rheumatology services for the U.S. between now and 2025 using the following components:
1) Retrospective data collected from various sources published since 2005 on projected demographic changes, trends in rheumatic diseases, changes in funding sources, growing demand for mid-level providers, compensation models, and reported job satisfaction.

ACR 2015 Workforce Study Report 60 | P a g e
2) Primary data collected between September 2015 and December 2015 from rheumatology specialists (physician and non-physician), fellows-in-training, and patients (adult, young adult and pediatric).
Figure 4-1. Factors Affecting Supply and Demand
4.2 Supply-Demand Model Although the demand for physicians is expected to continue, some factors that we considered might temper growth. New technologies can potentially allow physicians to treat more patients in the same amount of time, thereby reducing the number of physicians needed to complete the same tasks. Smarter-faster-more connected-on demand. These are the global trends that are redefining and revolutionizing every industry – and health care is just getting started. Technology could potentially play a key role in meeting the needs of patients and health care system organizations, through transparency of consumer expectations, real-time insights, and virtual access. As more millennials drive the workforce, these trends should be explored more. However, there are many barriers to expanding these services including policy and legal constraints (e.g., physician licensing across state lines, credentialing, and reimbursement). In addition, NPs and PAs are expected to grow significantly, and could potentially assume many of the routine duties of physicians and may be used to reduce costs at hospitals and doctor’s offices. However, the number of NPs and PAs in rheumatology is limited and therefore creates another barrier. Because of these challenges facing the workforce, one model for adult and one model for pediatric workforce that considered the most conservative estimates were developed. Sensitivity testing was subsequently conducted to determine range projections. The estimated projection factors were based on the literature and expert feedback from the workforce study members.
4.2.1 Supply-Demand Model Assumptions
4.2.1.1 Current rheumatology providers/demographic changes. The baseline supply projections assume that the patterns of rheumatologists providing services will remain relatively constant with no
Factors Affecting Supply 1. Current rheumatology providers/
demographic changes 2. Number of competing fellowships 3. Succession planning trends 4. Patient workload and practice settings
SUPPLY
Factors Affecting Demand 1. Healthcare usage trends 2. Prevalence of rheumatic diseases 3. Patient demographics 4. Growth of aging US population 5. Per capita income
DEMAND

ACR 2015 Workforce Study Report 61 | P a g e
anticipated increases in programs or services. The physicians’ workload (patients and average hours per week), retirement and mortality patterns, patterns of patient care hours worked, and demographic composition of the current workforce reflects the trends in the literature and results from the workforce survey.
4.2.1.2 Fellowships. The number of openings for fellowships will remain constant and all openings will be filled. Number of projected new graduates entering the workforce will remain constant every year for projection. Assume the 2015 workforce number includes those who graduated are already in the workforce; each year the projected number of new graduates is added to the end of year workforce number.
4.2.1.4 Patient Need. There is an expected increase in demand for rheumatology services by about 27% by the year 2020 and 45% through the year 2025.3-5 The baseline projection of patient need assumed changes in trends in the U.S. population as outlined in Section 4.2.
4.2.1.5 Published Data. Membership data provided by the ACR, published literature on workforce, survey data collected, and projected national shortages for rheumatology care were incorporated in the model.
4.2.1.6 Number of OA Patients Treated by Rheumatologists. There is little documentation regarding the percentage of OA patients that rheumatologists treat on a regular basis. Studies suggest that the population of OA patients treated by rheumatologists was between 6% and 22%.6 To ensure we capture a number that does not underestimate the OA patient workload, we selected a percentage slightly higher than the published literature (25%) with the understanding that this percentage could either be higher or lower.
4.2.1.7 Mid-level Providers. The percentage of NPs in Rheumatology will remain constant at less than 1% of all NPs; an increase in the number of NPs overall between now and 2015 is expected to be 31%. The percentages of PAs in Rheumatology will also remain constant at less than 1%; an increase in the number of PAs overall between now and 2015 is expected to be 30%.7-9
4.3 Supply Factors Several supply factors were identified as “necessary” for accurately computing the future supply of rheumatology primary providers. The following assumptions were necessary to assess the future supply of rheumatology services. To complete the capacity, the following were included in the model (Appendix C):
1) Current rheumatology providers and associated demographic characteristics 2) Number of new graduates entering the workforce 3) Succession planning trends and workload trends (e.g., retirement and reduction in patient
workload) 4) Practice patterns (e.g., part-time vs. full-time) 5) Practice setting (non-academic vs. academic health center) 6) Wage elasticities

ACR 2015 Workforce Study Report 62 | P a g e
4.3.1 Current rheumatology providers and demographic changes. Producing a current snapshot of rheumatology providers and projecting the demographic changes were very critical to making projections. Table 4-1 summarizes the current rheumatology primary provider workforce. For purposes of determining the supply side of the workforce model, only those who provide direct patient care were included: adult rheumatologists, pediatric rheumatologists, NPs and PAs. The numbers of pediatric rheumatologists include those who self-reported being Med-Ped specialty in the 2015 workforce survey. The total baseline number of primary providers in rheumatology is 6,845. The details are highlighted further in this section. Note: Section 3 covers the current workforce in greater detail. Table 4-1. Current Primary Provider Rheumatology Workforce by Training
Specialty Training Adult Pediatric
Total Numbers
Estimated Clinical FTE
Total Numbers
Estimated Clinical FTE
Rheumatologists 5,595 4,997 300 287 Nurse Practitioners* 248 228 22 20 Physician Assistants* 207 190 4 4 Total Active Primary Providers 6,050 5,415 326 311 Sources: AMA, ABIM, ABP; RNS, AAPA, PRCSG, & ACR Workforce Study Survey Results. ABIM most current numbers of active rheumatologists were provided February 2016. *Numbers were pulled from the non-physician association information and the published literature. These numbers only reflect active certificates.
4.3.1.1 Adult Rheumatologists. There are currently an estimated 5,595 active adult rheumatologists including Puerto Rico. Using 2014 census population data about adults (18 and older), this equates to an average 41.879.2 adult rheumatologist per person ratio (Appendix D). Table 4-2 displays the total number of rheumatologists in the workforce and the number of valid certificates issued by the ABIM as of February 2016 (not including Puerto Rico). Table 4-3 breaks these numbers down by state. State data was based on the most recent self-reported address provided to the ABIM by the physician and the reason why the total valid certificates and state data might not match.13 However, this is the most current and best data to use for purposes of the workforce study. Because of the limitations of the state data, the number of valid certificates in U.S. was used as current number of adult rheumatologists. To become certified in internal medicine, a physician must complete the requisite predoctoral medical education, meet the graduate medical education training requirements, demonstrate clinical competence in the care of patients, meet the licensure and procedural requirements, and pass the ABIM Internal Medicine Certification Examination. Table 4-2. Total Adult Rheumatologist Candidates Certified
Total Issued U.S. All Countries (Non-US)
Total Valid Total Valid Total Valid
6621 6012 5930 5531 188 130 Note: Not including Puerto Rico
Table 4-3. Adult Rheumatologists with Valid Certificates by State
State # in
Workforce # Current, Valid Cert.
State # in
Workforce # Current, Valid Cert.
Alabama 74 71 Montana 20 18 Alaska 8 7 Nebraska 31 32 Arizona 37 76 Nevada 31 26 Arkansas 79 23 New Hampshire 43 41

ACR 2015 Workforce Study Report 63 | P a g e
Table 4-3. Adult Rheumatologists with Valid Certificates by State - Continued
State # in
Workforce # Current, Valid Cert.
State # in
Workforce # Current, Valid Cert.
California 721 265 New Jersey 221 200 Colorado 95 52 New Mexico 32 31 Connecticut 110 58 New York 477 455 DC 28 18 North Carolina 183 163 Delaware 19 6 North Dakota 11 12 Florida 330 239 Ohio 229 210 Georgia 105 101 Oklahoma 41 33 Hawaii 21 17 Oregon 80 84 Idaho 19 19 Pennsylvania 327 322 Illinois 256 253 Puerto Rico 64 --- Indiana 84 78 Rhode Island 25 25 Iowa 43 43 South Carolina 69 62 Kansas 45 40 South Dakota 13 11 Kentucky 61 57 Tennessee 99 90 Louisiana 63 63 Texas 373 339 Maine 21 22 Utah 38 37 Maryland 227 210 Vermont 14 16 Massachusetts 277 258 Virginia 153 136 Michigan 169 164 Washington 132 120 Minnesota 101 104 West Virginia 22 19 Mississippi 40 40 Wisconsin 118 112 Missouri 112 105 Wyoming 3 4 Source: ABIM,
13 February 2016: includes Puerto Rico
4.3.1.2 Pediatric Rheumatologists. The total number of diplomate certificates granted through December 2014 were 364. Using data available on pediatric rheumatologists by state, there is an estimated 364 active pediatric rheumatologists (Appendix E). Using 2014 census population data about children (<18 years of age), this equates to on average 204,482.2 patients per pediatric rheumatologist.3 Table 4-4 are the total number of diplomates with currently valid certificates issued by the ABP as of December 31, 2014. Table 4-4. Number of Pediatric Diplomates Certified by year
92 94 96 98 00 03 04 06 09 11 13 Total
87 38 26 13 15 13 23 22 33 42 52 364 Source: ABP Data
12
4.3.1.3 Non-Physician Providers. The literature suggests that that midlevel providers may help to alleviate some access to care issues.7 Rheumatology is one discipline where NPs and PAs are employed and have been so for about 30 years.8 It has been suggested that NPs and PAs employed in rheumatology represents a less visible workforce, because it has proven difficult to assess precise numbers.9 Projecting the magnitude of greater demand for services is a difficult task, but research has consistently shown that persons with health insurance use more health care than do people without coverage. The Congressional Budget Office estimated that, through the ACA, 15 million uninsured persons would secure coverage in 2014, and that number will increase to 35 million by 2016.14 They have not yet reached these numbers.

ACR 2015 Workforce Study Report 64 | P a g e
However, as more receive insurance, there will be a need to support a more active role for mid-level providers in team-based care.15
4.3.1.4.1 Nurse Practitioners (NPs). Projected increases in the number of persons in the U.S. with health insurance affect the projection of NPs in the next 10 years. NPs are listed as 7th in the top 15 fastest growing occupations 2014-2024.16 A report in 2012 estimated that the supply of NPs will grow from 86,000 to 198,000 (130%) from 2012 to 2025.15 With the number of NPs expected to increase 31% in the next ten years only about 1% of NPs will work in rheumatology.16 According to the workforce survey, approximately 46% of NPs in rheumatology are planning on retiring in the next 5-10 years (7.8% in the next 5 years and 39.1% in 6 to 10 years).
4.3.1.4.2 Physician Assistants (PA). In 2013 there were 95,583 certified PAs in the U.S. Approximately 8% of PAs practice in Internal Medicine subspecialties (n=4,178) and 1.9% practice in pediatrics. (n=534).17 According to the American Academy for Physician Assistants, there are currently 211 members who work in the field of rheumatology. PAs are also effective providers of physician-direct care and can help alleviate some of the access to care issues. In 2012, there were 86,500 certified PAs.18 About 10.3% of the PAs work in internal medicine subspecialties with 1.7% in pediatric subspecialties.18 The 2010 PA Census report found 297 out of 12,352 Internal Medicine Subspecialists practice in adult rheumatology (2.4%) and only 4 out of 3,028 (<1%) practice in pediatric rheumatology.18 PAs are listed in the top 15 fastest growing occupations 2014-2024.16 The number of PAs is projected to increase by 30.4% in the next ten years (15% within 5 years and 6.3% in 6 to 10 years).17-18
4.3.2 Fellowships. When considering the future supply of rheumatologists, graduating fellows who enter the workforce must be included in the model. This not only depends on the number of available positions, but the fill-rate of those positions.
4.3.2.1 Adult Rheumatologists. According to ACGME, there were 113 adult rheumatology programs with a total of 431 available positions.19-20 The programs for adult rheumatology specialists are predominantly 2 years in length (average number of graduates if programs are full each year is 215). Table 4-5 details the trends of those who graduated and received their certification by year (initial only). Table 4-5. Number of Initial Adult Rheumatology Fellowship Certifications
05 06 07 08 09 10 11 12 13 14 Total
Internal Med 7066 6779 7311 6913 6818 7019 6740 6969 7380 7439 28,528 Adult Rheum 173 177 190 186 208 210 203 188 197 202 790 Source: ABIM Data
13
Table 4-6 compares first time pass rates for adult rheumatologists between 2014 and 2015. Approximately 1.4% of those in the fellowship do not graduate from the program. Table 4-7 presents the most current MATCH trend data regarding adult rheumatology fellowships. In 2015, approximately 10% of the first year fellowship positions went unfilled. While the model looks at all of the positions being filled, sensitivity testing will look at the effect of unfilled positions as well as adding more fellowships. In the supply model, our baseline assumption is that rheumatology fellowship positions will remain constant at the 2014-2015 level and all positions filled. The numbers indicate a high completion rate approaching 100%. These data indicate that approximately 190 adult rheumatologists entered the market in 2015. More than half (53%) of fellows are from international medical schools (IMGs), with 11% osteopathic, and 36% from U.S. LCME accredited schools. While it is difficult to assess the number of

ACR 2015 Workforce Study Report 65 | P a g e
IMGs who remain in the U.S., data from the fellows’ survey indicated that of the fellows completing the adult rheumatology fellowship, 83% plan to practice in the U.S. It is therefore reasonable to assume that most adult rheumatology IMGs will contribute to the U.S. workforce. More than half (57%) are female and 42% are male. A majority of fellows are white, non-Hispanic (n= 128) followed by Asian or Pacific Islander (n=128). The average age of fellows is 32.8. Table 4-6. Percentage of Board Exam Pass Rates Adult Rheumatology Fellows
2014 2015
# % # %
Internal Medicine 5607 80 5984 88 Adult Rheum 278 87 165 88 Source: ABIM Data
13
Table 4-7. Adult Rheumatology Fellows Match Trend Data
2010 2011 2012 2013 2014 2015
Number of Programs 97 102 100 104 106 107 Number of Positions 179 184 187 195 206 209 Number Positions Filled 165 163 177 186 189 190 Number Positions Unfilled 14 21 10 9 17 19 Number of Applicants 274 225 240 244 230 245 Number Applicants Matched 165 163 177 186 189 190 Number Applicants Unmatched 109 62 63 58 41 55 Source: The MATCH: National Resident Matching Program. 2014 Appointment Year
16-17
4.3.2.2 Pediatric Rheumatologists. According to ACGME, there were 34 pediatric rheumatology programs with a total of 76 available positions.19-20 Table 4-8. compares medical school tracking for pediatric rheumatologists between 2005 and 2014. The programs for pediatric rheumatology specialists is 3 years in length (32 in year 1, 20 in year 2, and 24 in year 3). Approximately 3.9% of fellows do not graduate the program. Table 4-8. Pediatric Rheumatologist Medical School Tracking by Year
05 06 07 08 09 10 11 12 13 14 Total
65 74 81 88 87 93 86 84 80 83 821 Source: ABP Data
12
Table 4-9 presents the most current trend data regarding pediatric rheumatology fellowships. In 2015, approximately 45% of the first year fellowship positions went unfilled. Table 4-9. Pediatric Rheumatology Fellows Trend Data
2010 2011 2012 2013 2014 2015
Number of Programs 20 23 21 30 29 30 Number of Positions 24 27 27 36 38 40 Number Positions Filled 13 14 15 18 26 22 Number Positions Unfilled 11 13 12 18 12 18 Number of Applicants 18 18 19 21 30 27 Number Applicants Matched 13 14 15 18 26 22 Number Applicants Unmatched 5 4 4 3 4 5 Source: The MATCH: National Resident Matching Program. 2014 Appointment Year
19-20

ACR 2015 Workforce Study Report 66 | P a g e
In the supply model, our baseline assumption is that rheumatology fellowship positions and fill rates will remain constant at the 2014-2015 level. The numbers indicate a high completion rate approaching 100%. These data indicate that approximately 22 pediatric rheumatologists entered the market in 2015. Approximately one third (30%) of fellows are from international medical schools (IMGs), with 12% osteopathic, and 68% from U.S. LCME accredited schools. While it is difficult to assess the number or IMGs who remain in the U.S., data from the FIT survey indicated that of the fellows completing the pediatric rheumatology fellowship, 76% plan to practice in the U.S. It is therefore reasonable to assume that most pediatric rheumatology IMGs will contribute to the U.S. workforce. Over 70% (71%) are female with 28% male. A majority of fellows are White, Non-Hispanic (n=44) followed by Asian or Pacific Islander (n=34). The average age is 31.7.
4.3.3 Succession planning trends. Another factor that affects the supply of rheumatologists is the age and rate at which rheumatologists leave practice. The physician workforce is aging, with a large portion of baby boomers who are reaching retirement. This in light of the potential increases in their demand makes succession patterns critical to the workforce supply model. There are many reasons provided for why rheumatologists are leaving or planning to leave the workforce, from retirement, mortality, disability, and changes in career patterns. Data were pulled from the U.S. Census Bureau for labor force participation rates for physicians and data from the Centers for Disease Control and Prevention (CDC) regarding probability that a physician of a given age, sex, and USMG/IMG status will remain in the workforce from year to year. The accuracy of physician supply projections has been questioned because of uncertainty about physician retirement patterns, entry into the profession by U.S. and international medical graduates, and the effect of an increasing number of female physicians. Data from the literature suggest that physicians tend to retire at a more advanced age than individuals in other occupations.21 However, the ABIM does not maintain data for physicians over the age of 75, and the previous workforce study also made the assumption that providers would retire by the age of 75.1 We will maintain that assumption in this workforce study. The workforce estimates pulled from the literature suggest the lifecycle patterns observed in recent cohorts and the size of new cohorts entering the workforce would remain relatively constant at observed levels.21 These data suggest that there are more young physicians entering the workforce and fewer older physicians remaining active due to the aging population, resulting in estimates of a smaller and younger physician workforce now and in the future.21 This is supported by the workforce study survey which indicated that approximately 50% of adults and 32% of pediatric/Med-Ped rheumatologists plan to retire within the next 10 years. Similarly, there were large numbers of mid-level providers (43%) who also reported that they plan to retire within the next ten years. Based on these data, it is assumed that the workforce would likely see larger percentage retiring within the next ten years that were projected in 2005.
4.3.4 Patient workload trends (e.g., # patients and # of working hours)
4.3.4.1 Relative Value Units (RVUs). Physician productivity is defined in terms of total patient care hours worked or number of patients seen during a given period of time. An increase or decrease in physician productivity would increase or decrease the supply of services. Prior to 1992, physician services were paid based on “usual, customary, and reasonable” fees.22 In 1989, statutory amendments were enacted which required CMS to develop and implement a fee schedule derived from a resource‐based relative value scale (RBRVS) and adjusted geographically only for cost differences. (42 U.S.C. § 1395w‐4).23 Three factors are included Medicare payments: 1) the resource-based relative value scale (RBRVS), 2) the geographic practice cost indexes (GPCIs), and 3) the monetary conversion factor. The

ACR 2015 Workforce Study Report 67 | P a g e
initial conversion factor was set at $31.001 in 1992.22 In 2016, the net reduction in expenditures resulting from adjustments to relative values of what was considered misvalued codes was 0.23% resulting in a conversion factor of $35.8279.22 While RVUs are part of the Medicare system, they have become a national standard, and that most commercial carriers benchmarks its fee schedule to the Medicare fee schedule.22 While RVUs are of major concern for rheumatologists, generally speaking, alternative payment models had negligible effects on the aggregate income of individual physicians.23 There is an underlying desire to have better alignment between what physicians think they should do for patients and what they are paid to do. Productivity analysis has always been a challenge for rheumatology managers because almost every study provides different numbers. The average annual growth rate for rheumatology specialists is very small. Because of this it was assumed no change in productivity (RVUs) in the model.
4.3.4.2 Reported Average Hours Worked. AMA statistics report that the average hours per week and average weeks per year providing direct patient care vary substantially by specialty.10 Since 1996 there has been a downward trend in average hours worked in pediatrics, obstetrics and gynecology, and general and family practice, with those over age 65 having the largest drop in direct patient care.5 Based on an analysis of the 1998 AMA Socioeconomic Monitoring System (SMS), the average number of hours worked by physician age, sex, and specialty were estimated and used as the baseline to determine changes in the total FTE of physicians.22 The baseline supply projections assumed that average hours worked remain constant over time within each age by sex by specialty category. If the demographic composition of the rheumatology workforce changed over time, such that by 2025, rheumatologists were providing 45 hours per week, on average, rather than the reported 54 in 1998, then each rheumatologist in 2025 would be counted as 0.83 of a FTE Rheumatologist (45/54=0.83). Women constitute a growing portion of the physician workforce, and AMA reported female physicians worked 7 fewer hours per week than male physicians.10 The average hours worked per week in patient care activities reported in 1998 for internal medicine subspecialties was 54 and pediatric subspecialties was 53.10 In 2015, the average number of reported hours worked per week for adult rheumatologists was 53, and for pediatric rheumatologists was 55. Med-Ped rheumatologists reported slightly higher with 59 hours per week. The average number of reported hours per week appears to remain relatively constant being very close to the AMA reported numbers of 1998 report. It should be noted that physicians practicing in Micropolitan Statistical Areas (MSA) worked on average of 15% more hours than do those working in Metropolitan Statistical Areas.25 The total number of hours is critical in terms of physician job satisfaction and patient care. While it was difficult to determine the total number that reflected direct patient care, the workforce study did include a factor to compensate for gender differences, generational differences, and part-time workforce.
4.3.4.3 Mean Number of Patient Visits. According to the 2015 workforce study, approximately 95% of adult and pediatric rheumatologists currently treat patients. In the 2005 workforce study, the number of patient visit means were applied to the age/sex distribution of rheumatologists.10 These data were compared to reported average annual patient visits in 2015 (Table 4-10). The average annual patient visits have decreased significantly in 2015 compared to 2005 numbers. This can be due to the number of factors, including the changes in demographic characteristics of respondents (e.g., increasing age of providers, shift in generational differences, etc.). Overall, the average decrease in patient load per week was about 19% for women and 14% for men.

ACR 2015 Workforce Study Report 68 | P a g e
Table 4-10. Reported Average Annual Patient Visits by Gender
Females Average # Annual
Visits 2005 Females
Average # Annual Visits 2015
Percent Difference
<40 2,754 <40 1,768 -34.8% 40-49 3,018 40-49 2,236 -25.9% 50-55 2,543 50-55 2,446 -3.8% Overall Average 2,772 Overall Average 2,249 -18.9%
Males Average # Annual
Visits 2005 Males
Average # Annual Visits 2015
Percent Difference
<40 3,515 <40 2,912 -17.16% 40-49 4,166 40-49 3,432 -17.62 50-55 3,243 50-55 3,224 -0.6% Overall Average 3,646 Overall Average 3,133 -14.1%
4.3.4.4 Patient Wait Times. Respondents were asked if they currently accept new patients. Of those who responded to this item in the workforce survey, 96% (n=1263) reported currently accepting new patients. Of those, 56% (n=702) require new patients to have a physician referral. Table 4-11 looked at the physician self-reported appointment wait times of new patients for all respondents. Table 4-12 includes the physician self-reported average time interval for a follow-up/continuity appointment (time between visits) for stable patients with rheumatic disease. Table 4-11. Physician Reported Wait Times for New Patient Appointments
Primary Diagnoses Total Adult Ped/Med-Ped
N % N % N %
<7 days 126 10.0 76 8.3 47 17.9 7 to 14 days 248 19.9 161 17.6 78 29.7 15 to 30 days 299 24.0 218 23.8 65 24.7 31 to 60 days 278 22.3 225 24.6 37 14.1 61 to 90 days 174 14.0 140 15.3 19 7.2 >90 days 120 9.6 96 10.5 17 6.5 Note. Data may not equal 100% due to missing data.
Table 4-12. Physician Reported Average Time Intervals for Stable Patients with Rheumatic Disease
Primary Diagnoses Total Adult Ped/Med-Ped
N % N % N %
1 to 2 months 127 10.3 101 10.6 26 9.4 3 months 752 61.2 557 58.6 195 70.4 4 to 6 months 332 27.0 277 29.1 55 19.9 >6 months 17 1.4 16 1.7 1 0.4 Note. Data may not equal 100% due to missing data.
When looking at reported wait time for new patient appointments, rheumatologists reported that almost half (45.9%) of their new patients have a wait time longer than 30 days. It appears that 3 months is the most common appointment interval for stable patients with rheumatic diseases. Table 4-13 indicates that there are 27% of adults, 26.3% pediatric, and 16.7% of young adult patients have to wait longer than 3 months for first patient visit following the initial onset of symptoms. This varies from the perceived wait times physicians reported. This discrepancy is an important issue to discuss further as it pertains to workforce analysis.

ACR 2015 Workforce Study Report 69 | P a g e
About 27% patients who responded to our survey indicated that they were not able to get in to see a specialist within 90 days. This discrepancy is an important issue to discuss further as it pertains to workforce analysis. Respondents were also asked whether they were able to make their routine follow-up appointment in the time period in which the physician recommended. Over 75% (n=439; 76.3%) of adults and 58.4% (n=215) of pediatric/young adults reporting they were able to do so. Of the young adult group, 17 (22.4%) still receive care from a pediatric rheumatologist while the remainder have transitioned to an adult rheumatologist for their care. The mean age when the young adults transitioned to an adult rheumatologist was 20 (SD=3). Table 4-13. Patient Reported Wait Times from Initial Onset of Diseases
Wait Time Adults Parent of Child Young Adult
N % N % N %
Less than one month 171 29.7 96 32.9 13 1.3 1 to 3 months 218 37.9 113 38.7 33 43.4 4 to 6 months 67 11.7 36 12.3 12 15.7 7 to 12 months 36 6.3 21 7.2 4 0.5 >12 months 52 9.0 20 6.8 4 0.5 Note. Data may not equal 100% due to missing data.
Patients were also asked how difficult they found it to make an appointment for urgent follow-up care with their rheumatologist. Figure 4-2 displays the perceived difficulty of patients to obtain an appointment with their rheumatologist when seeking urgent care. While the greatest proportion of all respondent groups felt that it was only somewhat difficult or not at all difficult, there is still a percentage from each that perceives difficulty in getting in to see their specialist when they are seeking urgent care (adults: n=123; 24.61%; parents of pediatric patients: n=75; 17.7%; young adults: n-13; 3.1%). Patients who indicated they were not able to get in quickly to see their own specialist for care for urgent follow-up appointments, were asked to identify who they went to for treatment (Figure 4-3).
Figure 4-2. Perceived Difficult in Seeking Urgent Care Treatment
0%10%20%30%40%50%60%70%80%90%
100%
Very Difficult Difficult SomewhatDifficult
Not at allDifficult
Pediatrics 6 7 33 19
Young Adults 27 38 93 94
Adults 55 68 167 213
55 68 167 213
27 38 93 94
6 7 33 19
Percentage

ACR 2015 Workforce Study Report 70 | P a g e
Figure 4-3. Providers Patients Seek for Urgent Care
4.3.4.5 Changes in Earning Potential. Earnings of rheumatologists are not a specific factor that affects the supply and demand. It is more an outcome of the supply and demand for the services. A physician’s net worth does affect the ability to maintain a certain expected lifestyle. Average expected income and higher net worth increases the propensity to retire. Because physician income correlates with age, age can be used as a predictor of retirement. Results in the workforce study found 57% of adult rheumatologists, 67% pediatric rheumatologists, and 40% of Med-Ped rheumatologists come from a dual income household. When cross referencing, approximately 50% of adult rheumatologists over 56 years of age earned over $250,000 per year, while only 34% of pediatric and Med-Ped rheumatologists earn over $250,000 per year. A drop in net earnings due to market or other forces will reduce physician earnings potential, which ultimately reduces the opportunity cost of retirement thus making it more likely that physicians will retire earlier while their earning are still higher. It was reported in the 2005 workforce study that excess demand for rheumatologist might result in higher incomes for rheumatologists over the next 20 years.1 However, rheumatologists were the only specialists in the Medscape 2015 Physician Compensation Survey to report a substantial drop in income (4%) from last year (Figure 4-4).26 This puts the rheumatologists 5th from the bottom in terms of income potential, with pediatrics in last place. Additionally, less than half of self-employed rheumatologists and just over 50% of employed rheumatologists feel they are fairly compensated.26 Therefore, it might be expected that more rheumatologists of retirement age would in fact carry out their succession plan as reported. While job satisfaction does not directly factor into the workforce supply-demand model, it is an important factor to discuss, especially as it relates to compensation. Rheumatologists overall career
0%
10%
20%
30%
40%
50%
60%
70%
80%
90%
100%
UrgentCare/ER
Pediatrician AnotherRheum
Primary Care
Pediatrics 78 0 43 378
Young Adults 46 180 13 43
Adults 19 0 9 37
19 9 37
46
180
13
43
78 43
378
Percentage
ACR 2015 Workforce Study Report 71 | P a g e
satisfaction was relatively high, ranking 8th of 26 specialties, with 54% reporting overall satisfaction.26 This was confirmed by the 2015 workforce study with 54% reporting they were very satisfied or satisfied. However, two areas in the 2015 ACR workforce study showed higher levels of dissatisfaction, reimbursement rates (n=476; 23.8%) and requirement for EMR (n=476; 23.8%). Even with a relative high job satisfaction, the number of rheumatologists saying they would choose their specialty again has dropped since the 2011 Medscape report, going from 66% to 44%.26-27
Figure 4-4. 2015 Medscape Physician Compensation Report26
Earnings differed substantially depending on where and type of practice of rheumatologists. The highest earnings were in the Southeast ($222,000), where the physicians made almost twice the pay as in the Northwest ($114,000). Earnings in the South Central region averaged $214,000, and in the mid-Atlantic, they made $189,000. Those numbers show a geographical shift since the 2011 report, in which the highest rheumatologist earners were in the Great Lakes region ($190,000) and the lowest were in the West, at $145,000 (Figure 4-5). Additionally, those who are self-employed earn about 16.23% more than those who are salaried.26 Physicians who work in non-academic settings earn more than those working in Academic Medical Centers.26 Those in multispecialty group practices earn about 3.1% more than those in solo practice, while those in private practice earn between 16% to 45% more than those in academic medical centers.26 In the 2015 ACR workforce survey, a majority of each specialty were from dual income families. When looking at overall gross income, over 40% (n=411; 40.3%) of adult rheumatologists reported an overall gross income of $150,000 to $249,999, while 62% (n=146) of pediatric rheumatologists reported an overall gross income of $100,000 to $199,999. Physicians in the West and South Central part of the U.S.

ACR 2015 Workforce Study Report 72 | P a g e
report the highest income holding the largest portion of those reporting greater than $300,000 in gross income. The challenge for CMS in setting Medicare fees is how to address the higher cost of living in certain areas of the U.S. against the need to attract physicians to underserved places with lower costs of living. These issues will be important when considering recommendations for improving access to care.28
Figure 4-5. Rheumatologist Compensation by Geographic Area, 201526
4.3.5 Practice setting (non-academic vs. academic health center). In addition to physician age, sex, and specialty, there are two additional trends that could affect workforce: employment type and practice location. Workforce survey data was used to supplement this information. A little over seventy-six percent (76.6%) of respondents indicated they worked within an academic medical center while 21.5% indicated they worked in non-academic setting. When further dividing these numbers, approximately 2% responded to working both for an academic medical center and solo practice. These data were further divided to determine what percentage of adult and pediatric work in academic medical centers versus solo practice. Not surprisingly, more pediatric rheumatologists work in academic medical centers with a smaller percentage working in both academic medical centers and non-academic settings. Of the adult rheumatologists, 71.4% indicated they worked in an academic medical center, with 27.1% in non-academic settings. Approximately 1.5% of pediatrics indicated they worked in both settings. This workforce study will assume approximately 80% of adult rheumatologists work in non-academic settings with 20% in academic medical centers. Further, that 85% pediatric rheumatologists work in academic medical centers with 15% in non-academic settings. When considering future workforce projections, practice setting is an area of concern. In the 2015 Medscape Compensation Report, less than half (44%) of rheumatologists said they would choose their same medical specialty again. This is a 33.3% drop since the 2011 report (66%).26-27 Even more surprising was that only 15% of respondents in this 2015 Medscape Compensation Report indicated they would choose the same practice setting. This is a 69.4% drop since the 2011 report (49%).26-27 To determine the

ACR 2015 Workforce Study Report 73 | P a g e
level of general career satisfaction, Medscape averaged the percentage of rheumatologists who again would choose medicine, those who would choose their own specialty, and those who thought they were fairly compensated. At 54%, rheumatologists came in 8th in overall satisfaction, which is slightly higher than last year’s percentages (53%) but slightly lower in ranking (Figure 4-6).
Figure 4-6. Overall Career Satisfaction26
4.4 Demand Factors
The following factors were used to assess the future supply of rheumatology services. To complete the demand, the following were included in an initial regression model to determine if they significantly contribute to the demand (Appendix C):
1. Health care utilization 2. Provider practice trends 3. Disease prevalence across various demographic groups 4. Changes in the population demographics 5. Per capita income 6. Access to care (physician per population and geographic trends)
4.4.1 Regression Modeling.29 Figure 4-7 is the regression formula used to assess the percentage accounted for of these factors on the adult rheumatology demand. Figure 4-8 is the regression formula used to assess the percentage accounted for of these factors on the pediatric rheumatology demand.

ACR 2015 Workforce Study Report 74 | P a g e
∆(𝑅𝑑
𝑝𝑜𝑝) = 𝑓(∆𝑃𝑇, ∆𝐼, ∆𝑈𝐼, ∆𝑃𝐶, ∆𝑃65)
Figure 4.7. Regression model formula Adult Rheumatologists
∆(𝑅𝑑
𝑝𝑜𝑝) = 𝑓(∆𝑃𝑇, ∆𝐼, ∆𝑈𝐼, ∆𝑃𝐶)
Figure 4.8. Regression model formula Pediatric Rheumatologists
4.4.1.1 Explanation of Regression Model. Overall delta () is the change in the population ratio of rheumatologists (R), interpreted as the “demand.” The function includes the change in real per capita income in the area (I), the change in provider practice trends (PT), health care utilization (UI), the change in prevalence (PC), and the change in the percentage of the population over age 65 (P65). The change in percentage of population over 65 was not included in the pediatric model. The ratio of adult and pediatric rheumatologists to population by region was used as the dependent variable and calculated based on information collected through the ABIM and ABP. Information regarding the per capita income, provider practice trends, health care utilization and prevalence is explained in detail below. Backward stepwise statistic was used, allowing for modification of the current model by removing the variable with the largest significance from the model first and working backward to the variable with the lowest significance. All the variables contributed significantly to the model for both adult (F=39.06, p<0.001; R2=0.37) and pediatrics (F=30.55, p=0.13; R2 = 0.70). The R2 is interpreted as seventy percentage of the independent variables combined account for the dependent variables. All of these variables significantly contributed to the model. This information was used to determine demand predictions (Table 4-14).
4.4.1.2 Goodness-of-Fit. The goodness-of-fit statistic provides information on whether the data fits the model that you have selected. The goodness-of-fit determines whether you are able to predict the dependent variable based on the independent variables you selected. The Pearson chi-square was used to determine whether the data was a good fit. The p-value is used to make this determination with a number closer to 1 indicating a better fit. Results indicate the model was a good fit (p=0.81).
4.4.1.3 Multicollinearity. It was also important to check for multicollinearity. If variables are highly correlated they might lead to unstable regression estimates. Multicollinearity is evaluated by assessing the inter-correlations (Eigenvalues) among the predictors. There was no presence of multicollinearity.
4.4.1.4 Elasticity of Demand. Elasticity of demand measures how responsive demand is to changes in the specified variable. More specifically, it is the percent change in quantity demand relative to one percent change in price, controlling for everything else. A negative elasticity indicates that as one goes up the other goes down (e.g., a decrease in a service would result in an increase in the demand). For both adults and children, prevalence of disease and the growing of the aging population has the greatest impact on the demand. This is likely due to the percent growth rate between those over 65 and those

ACR 2015 Workforce Study Report 75 | P a g e
under 18. Using the geographic variation in the physician to population ratio, we are able to estimate the effects that various factors have on the demand for rheumatologists. In particular, we have found a strong positive association between these factors and demand for rheumatologists; however, caution should be placed on these variables because there is a great deal of variation in the data to estimate it more precisely. Table 4-14. Regression Modeling Factors Affecting Demand
Factors Adult
Rheumatologists Pediatric
Rheumatologists Elasticity Statistic p-value Statistic p-value
Health care usage trends 14.81 0.042 21.4 0.028 0.15 Prevalence of rheumatic diseases 51.95 0.014 23.6 0.014 0.45 Patient demographics 68.23 0.008 94.8 0.006 0.002 Growth of aging US population 25.01 0.028 --- --- 0.29 Per capita income 19.06 0.034 18.2 0.033 0.015
4.4.2 Per Capita Income. Most Americans have believed that the United States will provide real opportunities to earn an income that rises steadily and substantially over time. Current conventional wisdom argues that wages have stagnated and most Americans have made, at best, modest income progress since the 1970s.31 From 2002 to 2013, the incomes of most households stagnated or declined even as they aged through nine years of expansion and two years of recession. The only types of households with rising incomes were those headed by people in their mid-to-late 20’s in 2002 and those headed by college graduates. Even in those household, the gains were much smaller than those achieved by those in the 1980’s and 1990’s. Per capita disposable income determines an individual’s ability to purchase goods or services. It is computed using incomes earned from all sources minus taxes, savings, and some non-tax payments.32 This is then divided by the total US population. Based on compound growth 2010-2015, and forecasted value for 2020, the estimated compound growth for 2015-2025 is 2.5%, which is up 1.5% from the 2005 workforce study supply-demand calcuations.30
4.4.3 Prevalence of Rheumatic Diseases. An estimated 52.5 million adults in the United States were told by a doctor that they have some form of arthritis, rheumatoid arthritis, gout, lupus, or fibromyalgia.31 Osteoarthritis is by far the most common form of arthritis. Overall, in the United States, OA affects 13.9% of adults aged 25 years and older and 33.6% (12.4 million) of those 65 years and older. It was estimated that 26.9 million US adults were diagnosed with OA in 2005, an increase of almost 6 million from 1990 (approximately 23% increase).31 Today more than 40 million people in the U.S. have been diagnosed with OA, an increase since 2005 of 13.1 million which represents a 33% increase since 2005. By 2030, is it estimated that 70 million Americans will be at risk for developing OA.31-32 Of persons aged 65 and older, approximately 50% have reported doctor-diagnosed arthritis. Figure 4-9 compares the common forms of diagnosed arthritis in millions across the U.S. With the aging of the US population, the prevalence of doctor-diagnosed arthritis is expected to increase in the coming decades. An estimated 1.5 million adults had rheumatoid arthritis in 2007, an estimated 3.0 million adults had gout in 2005, and an estimated 5.0 million adults had fibromyalgia in 2005.31-35 An estimated 300,000 children under age 18 have some form of arthritis or rheumatic condition; this represents approximately 1 in every 250 children in the U.S.36 Table 4-15 highlights the number of people with arthritis and other connective tissue/joint diseases by hospital outpatient or office visits, inpatient stays, ER visits, prescribed medications, home health care services, and total. In the US, it is estimated that 1.5 million adults and 300,000 children have a rheumatic disease.31-35

ACR 2015 Workforce Study Report 76 | P a g e
There is little documentation regarding the percentage of OA patients that rheumatologists treat on a regular basis. One study in 2009, using 2005 data, suggested that the population of OA patients treated by rheumatologists was approximately 6%, with another 22% being treated by the mid-level providers.9 Because this model is ten years old, data was not considered reliable for purposes of projections. With the demand for rheumatology services expected to increase by about 45% through the year 2025, including higher percentage of OA patients in the model will change the picture dramatically.
Figure 4-9 Prevalence of Common Forms of Arthritis in the U.S.31-35
Table 4-15. Number People and Events Reported for Arthritic Diseases, US, 2013
Outpatient/ Office-
Provider Visits Emergency Room Visits
Prescribed Medicines
Home Health
Any Service
Number of People 15,284 1,029 11,020 -- 19,630 Number of Events 74,598 1,237 26,131 -- 74,598 % Distribution by Service 45.5 3.0 15.0 --- --- Note. Number of people reported in thousands, MEPS, 2015
38
4.4.4 Health Care Coverage and Utilization
4.4.4.1 Cost of Rheumatology Care. With the cost of health care increasing, cost of rheumatology care is no different. Medical costs attributable to RA in the 2013 US Medical Expenditure Panel Survey (MEPS), were 37.7 billion ($2500 per person) which is up from 22.7 billion ($2000 per person) in 2005.38 It is estimated that 60% (22.64 billion) of the costs associated with rheumatic diseases are direct medical costs (out-of-pocket medical expenditures paid by patients, family members, and government), with 40% (15.5 billion) indirect (lost earnings, travel expenses, day care for children, etc.).38
0
5
10
15
20
25
30
JuvenileIdiopathi
cArthritis
PsoriaticArthritis
PolyRheum
RheumArthritis
Gout Osteo-arthritis
Per Million 0.3 0.52 0.7 1.3 6.1 26.9
Numbers in
Millions
Type of Arthritis

ACR 2015 Workforce Study Report 77 | P a g e
Intangible costs (premature mortality and deterioration in quality of life) were $39.2 billion. In 2010, a meta-analysis was used to calculate the societal cost of rheumatoid arthritis.39 The aggregate economic burden of RA only resulted in 19.3 billion annually. On a per patient basis, the cost represented approximately $14,900 each year. The intangible costs for RA represented an additional $19.9 billion each year, raising the total societal cost to 39.2 billion or approximately $30,300 per patient. These costs take into consideration many factors not included in MEPS data, but clearly support the fact that the cost of rheumatoid diseases is large burden to society.39 When looking at costs associated with rheumatic diseases, it is important to factor in the use of biologics. Utilization of biologics continues to grow. Figure 4-10 shows the average cost for patients using specialty drugs compared to RA patients who are not using specialty drugs. Those who are using specialty drugs have a 72% higher annual expenditure. Overall, RA accounts for 1/4 of all specialty drug spending in the US and accounted for approximately 1/5 of all health plan specialty drug spending by the end of 2014. Currently there are 10 different biological agents approved for RA on the US market. The cost of these drugs has increased significantly since the newer DMARDS have been introduced. Figure 4-4 shows the price increases over time as new DMARDs were introduced (2014 prices).
Figure 4-10. Average Annual Cost of Rheumatology Care, Journal of Managed Pharmacy40
4.4.4.2 Effect of ACA on Workforce.41 The Affordable Care Act was projected to increase Medicaid expenditures by a total of $514 billion for 2012 through 2021, an increase of about 9% over projections of Medicaid spending without the impact of the legislation.41 Most of this increase is projected to be paid by the Federal government ($468 billion, or about 91%), which would be about 15% greater than projected Federal expenditures excluding the impact of the Act. The most significant change to Medicaid is the expansion of Medicaid eligibility beginning in January 2014. This expansion is projected to add 8.7 million people to enrollment in FY 2014 (increase of 15%) and 18.3 million (an increase of 31%) by FY 2021 compared to pre-Affordable Care Act estimates. Medicare is not part of the Health Insurance Marketplace established by the health care law, so the effects of Medicare on the Rheumatology workforce will be the result of increased rates of Medicare eligible beneficiaries. When looking at rheumatologists, there are a very few rheumatologists in the US who participate in concierge practices and/or cash-only practices. Participation in accountable care organizations,
$19,830
$34,163
+72% All RA Patients
RA Patients Treated with
Specialty Drugs

ACR 2015 Workforce Study Report 78 | P a g e
however, continues to rise dramatically, from 28% in 2014 to 38% currently, with 9% more expecting to be part of an ACO in 2016 (Figure 4-11).
Figure 4-11. Rheumatologists participation in Payment Models26
Physicians today face potential cuts in Medicare/Medicaid payments by more than 13% by the end of the decade.41 In spite of this, 84% of employed and 66% of self-employed rheumatologists said they would continue taking new and current Medicare or Medicaid patients. In 2014, 66% of employed and only 45% of self-employed rheumatologists said they would take these patients. There was a corresponding decrease among self-employed rheumatologists not taking new Medicaid or Medicare, from 20% to 15%, and a slight increase among those who are employed (from none to 3%). In addition, there was a dramatic decline among undecided employed rheumatologists between last year and now, from 27% to 13%, and among those who were self-employed, from 36% to 18%. This decline, coupled with the overall increase in those taking Medicaid/Medicare patients, suggests that more undecided rheumatologists opted to take these patients. 4.4.4.2.1 Medicare Reimbursement.42-43 Because of the anticipated increase in older population, Medicare data is an important factor and one that is expected to grow significantly in the next 10 years. Prescription drug spending in the U.S. was about $457 billion in 2015, or 16.7% of overall health spending. In 2015, Medicare Part B spent $20 billion on outpatient drugs administered by physicians and hospital outpatient departments, an average of $1,945 per beneficiary.42-43 In 2015 alone, nearly 5.2 million seniors and people with disabilities received discounts of over $5.4 billion, for an average of $1,054 per beneficiary. This is an increase in savings compared to 2014, when 5.1 million Medicare beneficiaries received discounts of $4.8 billion, for an average of $941 per beneficiary.
4.4.4.2.2 Medicaid Reimbursement.44 The cost of Medicaid has increased significantly faster than the U.S. economy.44 In 1990 the expenditures for Medicaid represented 1.2% of the GDP, 2.1% in 2000, and 2.8% in 2011. It is anticipated that the expenditures will increase at an average annual rate of 6.4% and to

ACR 2015 Workforce Study Report 79 | P a g e
reach $795.0 billion by 2020.43 In addition, the average enrollment is expected to increase at an average annual rate of 3.4% over the next 10 years to reach 77.9 million.44
As of 2013, 2 of the top 10 Part B-covered drugs by total expenditures and by number of beneficiaries are for rheumatoid arthritis (Rituximab, and Infliximab). Total Medicare payments in 2013 based on additional separate payment + 6% in millions was $1,514 for Rituximab and $1,111 for Infliximab. The number of beneficiaries using these drugs were 69, 844 (payment per beneficiary was $21,262) and 59, 997 (payment per beneficiary was $18,129) respectively (Figure 4-12).45
Figure 4-12. Price Increases in DMARDs over Time45
4.4.5 Changes in the population demographics. When you consider the population demographics for purposes of demand projections for adult rheumatology services, you must consider the growth of the aging U.S. population along with the general demographics.
4.4.5.1 Growth of Aging U.S. Population. One of the major drivers of demand was population demographic changes especially the aging population.2,30 Table 4-16 demonstrates the rapid real and projected changes in the US population since the last workforce study in 2005, through 2060. Table 4-16. U.S. Population Trends (Millions) 2005-2060
Age Group 2005 2014 2020 2030 2040 2050 2060 % Change 2014-2060
<18 73 74 74 76 78 80 82 11.8 18-44 186 115 120 127 129 132 136 18.1 45-64 ----- 83 84 82 91 98 100 19.8 >65 37 46 56 74 82 88 98 112.2
Total 296.0 318.7 334.5 359.4 380.2 398.3 416.8 30.8 Note. Based on reported data on July 1 each year US Census Bureau
30

ACR 2015 Workforce Study Report 80 | P a g e
It should be noted, that the aging population would continue to grow at an alarming rate over the next 20 years. This will have a critical effect on the demand for services of adult rheumatologists.
4.4.5.2 Patient Demographics. Women are about 2.5 times more likely to get RA than men are. RA generally starts between the ages of 30 and 60 in women and somewhat later in life in men. The lifetime risk of developing RA is 4% for women and 3% for men. However, arthritis can strike at any age—even small children can get it. More than 300,000 children have the juvenile form of the disease.36 According to the Rochester Epidemiology Project in Minnesota,46 the prevalence of RA is increasing in women. In addition, the rate increased with age, peaking at 89 per 100,000 at ages 65-74. With the aging population rapidly growing, the demand for rheumatology services is expected to grow along with it. Age-adjusted estimates indicated that the rates increased from 1995 to 2007 by 2.5% each year for women and 0.5% each year for men.30 Considering gender ratios around the world, in the US, there are 98.3 men for every 100 women.30 In 2013, the US Census Bureau reported 161 million females to 156.1 males, with women outnumbering men 2-to-1 at 85 years of age and older. The gender differences did not increase in US between the 2000 and 2010 census.30 Based on these figures, it was assumed that the demand for rheumatology services would continue to rise with the increase in aging population and the ratio of women to men requiring services. 4.4.5.2.1 Adults. According to the U.S. Census Bureau, the population of adults 18 to 44 will increase from 115 million to 120 million in 2020 and 127 by 2030. That is an increase of about 4% in 2020 and about 5% in 2030. According to the U.S. Census Bureau, the population of adults ages 45-64 will not increase significantly. However, adults 65 years of age and older will increase from 46 million in 2014 to 56 million in 2020 and 74 million by 2030. That is an increase of about 18% by 2020 and about another 25% in 2030. These increases will be factored into the demand model.
4.4.5.2.2 Pediatrics. According to the U.S. Census Bureau, the population of children under the age of 18 is not expected to increase much between 2014 and 2030, remaining at approximately 74 million by 2020 and 76 million by 2030. That is an increase of about 3% in 2020 and 2030. These increases will be factored into the demand model.
4.5 References
1. Lewin Group. Workforce Study of Rheumatologists: Final Report. 2006, May 2. U.S. Department of Health and Human Services, Health Resources and Services Administration,
National Center for Health Workforce Analysis. Technical Documentation for HRSA’s Health Workforce Simulation Model. Rockville, Maryland: U.S. Department of Health and Human Services, 2014.
3. American College of Rheumatology. Rheumatic Diseases in America. 2013. Retrieved February 3, 2016 from http://www.rheumatology.org/portals/0/files/Rheumatic%20Diseases%20in%20America%20The%20Problem.%20The%20impact.%20The%20answers.pdf
4. Bureau of Labor Statistics. Economic and Employment Projections. United States Department of Labor. 2016. Retrieved February 3, 2016 from: http://www.bls.gov/news.release/ecopro.toc.htm
5. U.S. Department of Health and Human Services, Health Resources and Services Administration. The Physician Workforce: Projections and Research into Current Issues Affecting Supply and Demand.

ACR 2015 Workforce Study Report 81 | P a g e
2008. Retrieved February 7, 2016 from: http://bhpr.hrsa.gov/healthworkforce/reports/physwfissues.pdf
6. Miriam G, Cisternas MA, Yelin E, Katz JN, Solomon DH, Wright EA, Lousina E. Ambulatory Visit Utilization in a National, Population-based Sample of Adults with Osteoarthritis. Arthritis Rheum. 2009 Dec 15; 61(12): 1694–1703. doi:10.1002/art.24897.
7. Solomon DH, Bitton A, Fraenkel L, Brown E, Tsao P, Katz JN. Roles of nurse practitioners and physician assistants in rheumatology practices in the US. Arthritis Care Res (Hoboken). 2014 Jul;66(7):1108-13. doi:10.1002/acr.22255.
8. Hooker RS. The extension of rheumatology services with physician assistants and nurse practitioners. Best Pract Res Clin Rheumatol. 2008 Jun;22(3):523-33. doi:10.1016/j.berh.2007.12.006
9. Hooker RS, Cawley JF. The hidden rheumatology workforce. Arthritis Practitioner, 2005 1(3):34. 10. American Medical Association. (2015). 2015 State Physician Workforce Data Book, Centers for
Workforce Studies. Retrieved January 20, 2015 from: http://members.aamc.org/eweb/upload/2015StateDataBook%20(revised).pdf
11. Association of American Medical Colleges. (2013). 2014 Physician Specialty Data Book. Retrieved January 20, 2016 from: https://members.aamc.org/eweb/upload/Physician%20Specialty%20Databook%202014.pdf
12. The American Board of Pediatrics. (2014). Workforce Data, 2014-2015. Retrieved January 20, 2016 from: https://www.abp.org/content/workforce-data
13. American Board of Internal Medicine. (2015). Statistics and Data. Retrieved January 20, 2016 from: http://www.abim.org/about/statistics-data.aspx
14. The budget and economic outlook: fiscal years 2013 to 2023. Washington, DC: Congressional Budget Office, February 2013.
15. Auerbach DI. Will the NP workforce grow in the future? New forecasts and implications for health care delivery. Med Care, 2012;50:606-610
16. Bureau of Labor Statistics. Occupational Outlook Handbook. 2015. Retrieved February 2, 2015 from http://www.bls.gov/ooh/a-z-index.htm#P
17. American Academy of Physician Assistants. PA Fact Sheet. Vital Statistics. 2013. Retrieved February 2, 2016 from https://www.aapa.org/workarea/downloadasset.aspx?id=898
18. American Academy of Physician Assistants. (2011). 2010 AAPA Physician Assistant Census. Alexandria, VA. Retrieved February 2, 2016 from https://www.aapa.org/workarea/downloadasset.aspx?id=1454
19. ACGME. Rheumatology Programs Academic Year 2015-2016. United States. Retrieved February 7, 2016 from https://apps.acgme.org/ads/Public/Reports/ReportRun?ReportId=1&CurrentYear=2015&SpecialtyId=28&IncludePreAccreditation=false
20. ACGME. Data Resource Book. Academic Year 2014-2015. Retrieved February 7, 2016 from: http://www.acgme.org/acgmeweb/tabid/259/GraduateMedicalEducation/GraduateMedicalEducationDataResourceBook.aspx
21. Staiger DO, Auerbach DI, Buerhaus PI. Comparison of physician estimates and supply projections. JAMA. 2009 Oct 21; 302(15): 1674–1680. doi:10.1001/jama.2009.1461
22. American Medical Association. The Medicare Physician Payment Schedule. Retrieved February 8, 2016 from http://www.ama-assn.org/ama/pub/physician-resources/solutions-managing-your-practice/coding-billing-insurance/medicare/the-medicare-physician-payment-schedule.page
23. U.S. Government Publishing Office. 42 U.S.C. 1395W-4 – Payment for physicians’ services. Retrieved February 8, 2016 from: https://www.gpo.gov/fdsys/granule/USCODE-2010-title42/USCODE-2010-title42-chap7-subchapXVIII-partB-sec1395w-4
24. Bendix J. RVUs: A valuable tool for aiding practice management. Medical Economics. 2014. Retrieved February 8, 2016 from: http://medicaleconomics.modernmedicine.com/medical-

ACR 2015 Workforce Study Report 82 | P a g e
economics/content/tags/calculating-relative-value-units/rvus-valuable-tool-aiding-practice-m?page=full
25. U.S. Census Bureau. State and Metropolitan Area Data Book: 2010, 7th Ed. U.S. Government Printing Office. ISBN:0-16-084189-7. 2010, April.
26. Beckham C. Medscape 2015 Physician Compensation Survey. Retrieved March 3, 2016 from http://www.medscape.com/features/slideshow/compensation/2015/rheumatology
27. Beckham C. Medscape 2011 Physician Compensation Survey. Retrieved March 3, 2016 from http://www.medscape.com/features/slideshow/compensation/2011/rheumatology
28. Centers for Medicare and Medicaid Services. Medicare. Retrieved February 8, 2016 from: https://www.cms.gov/Medicare/Medicare.html
29. Pardoe I. Applied regression modeling: A business approach. Hoboken, NJ: John Wiley & Sons. 2012. 30. Colby SL, Ortman JM. Projections of the Size and Composition of the U.S. Population, 2014-2060.
U.S. Census Bureau. 2015. Retrieved February 3, 2016 from: https://www.census.gov/content/dam/Census/library/publications/2015/demo/p25-1143.pdf
31. Barbour KE, Helmick CG, Theis KA, Murphy LB, Hootman JM, Brady TJ, et al. Prevalence of Doctor-Diagnosed Arthritis and Arthritis-Attributable Activity Limitation — United States, 2010–2012. Morb Mortal Wkly Rep. 2013;62(44):869-873. PubMed PMID: 24196662.
32. Lawrence RC, Felson DT, Helmick CG, et al. Estimates of the prevalence of arthritis and other rheumatic conditions in the United States. Part II. Arthritis Rheum. 2008;58(1):26-35.
33. Myasoedova E, Crowson CS, Kremers HM, Therneau TM, Gabriel SE. Is the incidence of rheumatoid arthritis rising?” results from Olmsted County, Minnesota, 1955-2007. Arthritis Rheum. 2010;62(6):1576-1582. PubMed PMID: 20191579; PubMed Central PMCID: PMC2929692.
34. Zhu Y, Pandya BJ, Choi, HK. Prevalence of gout and hyperuricemia in the US general population. Arthritis & Rheum. 2011:63(10): 3136-3141.
35. Helmick CG, Felson DT, Lawrence RC. Estimates of the prevalence of arthritis and other rheumatic conditions in the United States. Arthritis & Rheum. 2008;58(1):15-25.
36. Espinosa M, Gottlieb BS. Juvenile Idiopathic Arthritis. Pediatr Rev, 2012;33:303-13. 37. American College of Rheumatology. Rheumatic Diseases in America. 2013. Retrieved February 3,
2016 from http://www.rheumatology.org/portals/0/files/Rheumatic%20Diseases%20in%20America%20The%20Problem.%20The%20impact.%20The%20answers.pdf
38. Agency for Health care Research and Quality. U.S. Department of Health & Human Services. Medical Expenditure Panel Survey (MEPS) 2015. Retrieved March 3, 2016 from: http://meps.ahrq.gov/mepsweb/
39. Bureau of Labor Statistics. Economic and Employment Projections. United States Department of Labor. 2016. Retrieved February 3, 2016 from: http://www.bls.gov/news.release/ecopro.toc.htm
40. Cardarelli WJ. Implications for Managed Care and Specialty Pharmacy in Rheumatoid Arthritis. Am J Manag Care, 2012;18:S315-S324)
41. Hofer AN, Abraham JM, Moscovice I. Expansion of coverage under the Patient Protection and Affordable Care Act and primary care utilization. Milbank Q, 2011;89:69-89
42. Centers for Medicare and Medicaid Services. Medicare. Retrieved February 8, 2016 from: https://www.cms.gov/Medicare/Medicare.html
43. Brooks M. Less money, more rules for US physicians in 2015. Medscape Medical News. January 2, 2015. http://www.medscape.com/viewarticle/837493 Accessed January 14, 2015.
44. Department of Health and Human Services. 2012 Actuarial Report on the Financial Outlook for Medicaid. 2013. Retrieved February 8, 2016 from: https://www.cms.gov/Research-Statistics-Data-and-Systems/Research/ActuarialStudies/downloads/MedicaidReport2012.pdf

ACR 2015 Workforce Study Report 83 | P a g e
45. OPTUM. Rheumatoid Arthritis Cost Drivers. 2014. Retrieved March 3, 2016 from: https://www.optum.com/thought-leadership/rheumatoid-arthritis-cost-drivers.html
46. Myasoedova E, Crowson CS, Kremers HM, Therneau TM, Gabriel SE. Is the incidence of rheumatoid arthritis rising: Results from Olmsted County, Minnesota, 1955-2007. Arthritis Rheum, 2010;62(6):1576-1582. doi:10.1002/art.27425. PubMed PMID: 20191579; PubMed Central PMCID: PMC2929692

ACR 2015 Workforce Study Report 84 | P a g e
5. SUPPLY-DEMAND PROJECTIONS The first step was to determine the current workforce as baseline. This was difficult given the information from various sources were limited to self-report and varied greatly. In Table 5-1 we included all primary rheumatology providers (physicians, nurse practitioners (NP) and physician assistants (PA), however in some of the modeling we only included physician numbers. Because of the anticipated excess demand, including mid-level providers in the baseline, predictions can be made to their effect on the workforce.
Below provides a summary breakdown and comparison of the more current calculated primary rheumatology provider workforce, both actual numbers and clinical FTE, including Nurse Practitioners and Physician Assistants (Table 5-1).
Table 5-1. Current Primary Rheumatology Workforce by Specialty
Adult Pediatric
Specialty Training Total
Numbers Estimated Clinical FTE
Total Numbers
Estimated Clinical FTE
Rheumatologists 5,595 4,997 300 287 Nurse Practitioners* 248 228 22 20 Physician Assistants* 207 190 4 4 Total Active Primary Providers 6,050 5,415 326 311
Sources: AMA, ABIM, ABP; RNS, AAPA, PRCSG, & ACR Workforce Study Survey Results. ABIM most current numbers of active rheumatologists were provided February 2016. *Numbers were pulled from the non-physician association information and the published literature. These numbers only reflect active certificates.
5.1 Supply Adult Rheumatology Services Figure 5-1 Details the projected supply of adult rheumatology workforce including the advanced practice nurses and the physician assistants. Figure 5-2 compares actual numbers of projected physicians in the workforce compared to the clinical FTE (projected number treating patients). The following details the explanation of the various factors included in the adult rheumatology workforce prediction model. The supply includes geographic distributions, productivity, succession trends, gender, generations, workload trends, practice setting, and new graduate entrants. Our model indicates a much larger decline in the supply of rheumatologists than in 2005 workforce study. This is likely due to two major factors: 1) increase in the number of rheumatologists planning on retiring, and 2) the projected reduction in patient workload and more seeking part-time work. Table 5-2 summaries the factors and their assumptions detailed below. Table 5-2 summaries the factors and assumptions that were applied to the base adult rheumatology workforce supply-demand model. Table 5-3 details the supply projections using 2015 numbers as baseline.

ACR 2015 Workforce Study Report 85 | P a g e
Figure 5-1 Projected Supply of Adult Rheumatology Workforce
Figure 5-2. Adult Physician Workforce Projections: Actual vs. Clinical FTE
2015 2020 2025 2030
Adult 4,997 4,470 3,645 3,455
NP 228 306 313 320
PA 190 251 263 276
Total 5,415 5,027 4,221 3,974
4,997
4,470
3,645 3,455
228 306 313 320 190 251 263 276
5,415
5,027
4,221 3,974
0
1,000
2,000
3,000
4,000
5,000
6,000
Projected Clinical
FTE
2015 2020 2025 2030
Clinical FTE 4,997 4,470 3,645 3,455
Total N 5,595 5,385 4,515 4,346
4,997
4,470
3,645 3,455
5,595 5,385
4,515 4,346
Projected Numbers

ACR 2015 Workforce Study Report 86 | P a g e
Table 5-2 Summary of Factors/Assumptions Applied to Adult Rheumatology Supply Projections
Factor Assumption
Geographic 1) No change in geographic services over next 10 years 2) Physicians practicing in MSAs work on average 15% less hours then those not
working in these areas. 3) On average adult rheumatologists work 53 hours per week.
Productivity 1) The average growth rate for rheumatology specialists is small and appears to getting smaller.
2) Because of this, no productivity factor was included in the initial model.
Succession 1) Over 50% of adult rheumatologists plan to retire in the next 5-10 years 2) About 80% of those who plan to retire anticipate a decrease in their patient load by
25%; therefore we factored a ¾ FTE for those who plan to retire.
Gender 1) In 2015, 59.2% were male and 40.8% female. 2) Anticipated change of 14% by 2030 from 41% to 59%. 3) Females are reported to work 7 fewer hours each week on average. 4) Females treated approximately 30% less than their male counterpart.
Full-time - Part-time
1) Assumed 18% work part-time. 2) Part-time were then assumed to work 0.5 FTE.
Practice Setting
1) Approximately 80% non-Academic settings and 20% Academic Medical Center. 2) One (1) Adult rheumatologist in non-academic settings would equal 1 FTE and that 1
adult rheumatologist in an academic medical center would equal 0.5 FTE.
OA Patients
1) Assumption that approximately 25% patients would be OA.
New Graduate Entrants
1) If all fellowship programs were filled each year, would be 215 graduates; 1.4% do not graduate.
2) About 53% are IMGs; 17% of the IMG FITs who were surveyed indicated they plan to practice outside the U.S.
3) Approximately 18.3% indicated they would work part-time; 90% of those were female (therefore this was added to the gender factor.
4) Assume all entering fellows are millennials, therefore no factor was applied.
5.1.1 Geographic Distribution
1) Because the top MSA areas remained relatively constant since 2005, the assumption was that the geographic services of rheumatologists would not significantly change over the next ten years.
2) The concentration for adult rheumatologists in six of the top ten MSAs remained relatively constant from 2005.
3) Three of the top ten MSA’s (Philadelphia, Washington, and Atlanta) reported a decreased concentration for adult rheumatologists.
4) Boston metropolitan area continues to enjoy the highest concentration of rheumatologists; rates in 2005 were 39.9 per 1 million population; rates in 2015 were 52.2 per 1 million population, an increase of approximately 24%.
5) Using the information from the literature and the 2015 workforce survey, the assumption was that adult rheumatologists worked an average of 53 hours per week. The average number of reported hours per week appears to remain constant from 2005. However, the literature

ACR 2015 Workforce Study Report 87 | P a g e
supports that physicians practicing in MSAs work on average 15% less hours, which was included in the workforce study calculations.
In 2013, the ACR COTW published a paper on the regional distribution of adult rheumatology practices in the U.S., along with the factors associated with that distribution. The authors found there were many areas saturated with adult rheumatologists (high ratio of adult rheumatologists within a specific geographic area). However, there were many areas where the ratio of adult rheumatologists in a given geographic area was small resulting in access to care issues that needed to be addressed. In 2015, there were 41,658 adults per adult rheumatologist and 229,443 total children per pediatric population in the U.S and Puerto Rico. Based on a report from the U.S. Census Bureau, approximately 23% of the U.S. population is under 18 years of age.28 This implies that there are about 24 adult rheumatologists for every 1 million adults and approximately 3 pediatric rheumatologists for every 1 million children. This is up slightly for adult rheumatologists from the 2005 workforce study, which found there to be 22.0 adult rheumatologists for every 1 million. However, it is about the same for pediatric rheumatologists from the 2005 workforce study. Table 5-3 provides the most current regional distribution of adult rheumatologists. The breakdown demonstrates that there are five areas including Puerto Rico where there is a less than 10% distribution of adult rheumatologists and six regional areas including Puerto Rico where there is a less than 10% distribution of pediatric rheumatologists. These numbers reflect actual numbers and not FTE. Table 5-3. Regional Distribution of Physician per Population Data Breakdown
Regions N % by Region Adult Population
per Region Adult per
Physican Ratio
1 Northeast 1264 21.1 33,719,386 26,676.7 2 Mid-Atlantic 1028 17.1 35,555,292 34,586.9 3 Southeast 698 11.6 41,940,692 60,087.0 4 Great Lakes 957 16.0 39,642,918 41,424.2 5 North Central 255 4.3 12,026,980 47,164.6 6 South Central 493 8.2 25,975,519 52,688.7 7 Southwest 233 3.9 15,415,990 66,163.0 8 West 742 12.4 30,763,180 41,459.8 9 Northwest 262 4.4 11,947,352 45,600.6
10 Puerto Rico 64 1.1 2,750,008 42,968.9 Total 5995 249,737,317 41,657.6
Sources: AMA, ABIM, ABP; RNS, AAPA, & ACR Workforce Study Survey Results. ABIM most current numbers of active rheumatologists (February 2016) and Puerto Rico. Numbers were pulled from mid-level provider associations’ information and other published literature. These numbers reflect all certificates.
5.1.2 RVU-productivity
1) The average annual growth rate for rheumatology specialists is very small; because of this it was assumed no change in productivity (RVUs) in the initial model.
2) Data supports that IM subspecialties saw a small increase by 0.7% compensation per work RVU in 2013; the work RVU changed by 0.1% resulting in an increase in compensation of 1.1%.
3) The average growth rate for rheumatology specialists is small and appears to get smaller. Because of this, no productivity factor was included in the initial model.

ACR 2015 Workforce Study Report 88 | P a g e
5.1.3 Succession Factor
1) Fifty percent (50%) of adult rheumatologists plan to retire within the next 10-15 years (16.7% 2015-2020; 16.7% 2020-2025; 16.7% 2025-2030).
2) Data from workforce survey indicate that the rate of decrease in patient load is strongly correlated with anticipated retirement. That is, those that are planning on retiring in the next 5-10 years will also decrease their patient load.
3) Over 80% of adult rheumatologists who plan to retire in the next five-ten years anticipate a decrease in their patient load by 25%. Of those that plan to retire, we factored in ¾ FTE for each to compensate for reduced patient workload over the next ten years.
5.1.4 Gender factor
1) Of active rheumatologists in 2015, 59.2% were male and 40.8% female. Of those in fellowships during 2013 year, 58.8% are female with 41.2% male, indicating a shift in gender demographics.
2) Assume a shift from 40.8% female rheumatologists in 2015 to 58.5% females in 2030 (percent change is 44.1).
3) Therefore, included a change of 44% by 2030 from 41% to 59%. 4) Females are reported to work 7 fewer hours each week on average; women have fewer numbers
of patient visits on average. 5) Females treated approximately 30% less than their male counterpart. 6) The number of women rheumatologists is expected to continue to grow implying the overall
average number of patient visits will continue to decline.
5.1.5 Generational differences factor
1) As the millennials enter the workforce, there will be more emphasis on the value of both leisure time and earnings.
2) A decreasing trend in patient load for millennials per week was about 15% from 2005. 3) Based on survey data and age data from literature; about 6% of adult rheumatologists are
millennials. 4) NOTE: To ensure these numbers were not factored in twice, assumption that all FIT respondents
were millennials and factored in fellows’ data, and the percentage of decreased workload for those over 65 was included in the retirement factor.
5.1.6 Full-time/Part-time factor
1) Medscape data reports 16% of women and 9% of men report working part-time, with most of them being 65 years of age and older.
2) Results from FIT survey, 18.3% were seeking to work part-time with a majority of them (90%) of those reporting being female.
3) For purposes of the workforce study we assumed 18% work part-time; part-time were then assumed to work .5 FTE.
5.1.7 Practice Setting
1) Approximately 80% non-Academic settings and 20% Academic Medical Center.

ACR 2015 Workforce Study Report 89 | P a g e
2) The 2015 workforce survey had a much higher percentage of AR from academic medical centers. However, it was assumed that more AR from AMC’s would complete the survey.
3) Assumption that 1 Adult rheumatologist in non-academic settings would equal 1 FTE and that 1 adult rheumatologist in and academic medical center would equal 0.5 FTE.
4) Because the exact ratio between the adult rheumatologists in non-academic vs. Academic medical center, we realize this is a limitation to the study.
5.1.8 New Graduate Entrants to the Workforce (FITs)
5.1.8.1 Number positions, fill-rates, and graduation rates. Of the 113 adult rheumatology programs, there are 454 available positions, average number graduating if all positions filled each year would be 215. Approximately 1.4% of those in the fellowship do not graduate from the program.
5.1.8.2 Effect of IMGs. Approximately 53% of AR fellows are IMGs; Approximately 17% of the IMG FITs who were surveyed indicated they plan to practice outside the U.S.
5.1.8.3 Gender factor. Of FITs who are seeking to work PT (18.3%), 90% were female; therefore, a factor was included in gender to reflect that.
5.1.8.4 Generational differences factor. Assume all entering fellows are millennials, therefore no factor was applied.
5.1.8.5 Full-time/Part-time factor. Survey results a little over 18% FITs were seeking to work part-time.
5.1.8.6 Practice Setting. Use same factor for FITs that we use in AR (80% non-academic vs. 20% AMC).
Table 5-4 details the workforce supply projections for adult rheumatology. To assess the number actually providing patient care, these numbers reflect FTE. Table 5-4. Adult Rheumatology Workforce Supply Projections
Supply 2015 Base
2020 Projections 2025 Projections 2030 Projections Total % Diff.
2015-2020 Total % Diff.
2020-2025 % Diff.
2015-2025 Total % Diff.
2025-2030 % Diff.
2015-2030
Adult^ 4,997 4470 -10.5 3,645 -18.6 -27.1 3,455 -5.2 -30.9 NP 228 306 +23.4 313 +2.3 +26.2 320 +2.2 +29.0 PA 207 251 +21.3 263 +21.3 +27.1 276 +4.9 +33.3 Total 5,452 5,027 -7.8 4,221 -16.0 -22.6 3,974 -5.9 -27.1 Note: ^Numbers include new graduating fellows entering into the workforce annually; clinical FTE for adult rheumatologists assumes non-academic settings (80%)=1 FTE and AMC settings (20%)=0.5 FTE; NP and PA=0.9 FTE.
5.2 Supply Pediatric Rheumatology Services Figure 5-3 details the projected supply of pediatric rheumatology workforce including the advanced practice nurses and the physician assistants. Figure 5-4 graphically depicts the pediatric rheumatology workforce supply projections in clinical FTE. The NP and PA numbers are actual total numbers and not clinical FTE.

ACR 2015 Workforce Study Report 90 | P a g e
Figure 5-3. Projected Supply of Pediatric Rheumatology Workforce
Figure 5-4. Pediatric Physician Workforce Projections: Actual vs. Clinical FTE
2015 2020 2025 2030
Peds 287 264 243 231
NP 20 23 24 25
PA 4 4 5 5
Total 313 291 272 261
287
264 243
231
20 23 24 25 4 4 5 5
313
291 272
261
0
50
100
150
200
250
300
350
Number Clinical
FTE
0
50
100
150
200
250
300
2015 2020 2025 2030
FTE Equivalent 287 264 243 231
TOTAL Number 300 280 271 251
287 264
243 231
300 280 271
251
Projected Numbers

ACR 2015 Workforce Study Report 91 | P a g e
The following details the explanation of the various factors included in the pediatric rheumatology workforce prediction model. Similar to adult rheumatologist projections, our model for pediatric rheumatologists indicate a much larger decline in the supply of than in 2005 workforce study. This is also likely due to the same two major factors: 1) increase in the number of rheumatologists planning on retiring, and 2) the projected reduction in patient workload and more seeking part-time work. In addition, pediatric rheumatology fellowships have more open positions not filled each year than do adult rheumatology fellowship programs, which also leads to a higher decline. Table 5-5 summaries the factors and assumptions that were applied to the base pediatric rheumatology workforce supply-demand model. Table 5-5 details the supply projections using 2015 numbers as baseline. Table 5-5 Summary of Factors/Assumptions Applied to Pediatric Rheumatology Supply Projections
Factor Assumption
Geographic 1) No change in geographic services over next 10 years 2) Physicians practicing in MSAs work on average 15% less hours then those not
working in these areas. 3) On average pediatric rheumatologists work 55 hours per week.
Productivity 1) Pediatric subspecialties saw an increase by 8.0% for compensation per work RVU in 2013.
2) The work RVU changed by 6.1% resulting in an increase in compensation of 1.0%.
Succession 1) About 32% of pediatric rheumatologists plan to retire in the next 5-10 years. 2) About 80% of those who plan to retire anticipate a decrease in their patient load by
25%, therefore we factored a ¾ FTE for those who plan to retire.
Gender 1) In 2015, 68% were female and 32% male. 2) Females are reported to work 7 fewer hours each week on average. 3) Females treated approximately 30% less than their male counterpart.
Full-time - Part-time
1) Assumed 17.5% work part-time. 2) Part-time were then assumed to work .5 FTE.
Practice Setting
1) Approximately 5% non-Academic settings and 95% Academic Medical Center. 2) One (1) pediatric rheumatologist in non-academic settings would equal 1 FTE and
that 1 pediatric rheumatologist in an academic medical center would equal 0.8 FTE.
New Graduate Entrants
1) If all fellowship programs were filled each year, would be 25 graduates; 3.9% do not graduate.
2) About 42.6% are IMGs; 23.9% of the IMG FITs who were surveyed indicated they plan to practice outside the U.S.
3) Approximately 18% indicated they would work part-time; 90% of those were female (therefore this was added to the gender factor.
4) Assume all entering fellows are millennials; therefore, no factor was applied.
5.2.1 Geographic Distribution
1) Because the top MSA areas remained relatively constant since 2005, the assumption is that the geographic services of rheumatologists will not significantly change over the next ten years.

ACR 2015 Workforce Study Report 92 | P a g e
2) The concentration for pediatric rheumatologists in six of the top ten MSAs remain relatively constant from 2005.
3) Three of the top ten MSA’s (Philadelphia, Washington, and Atlanta) reported a decreased concentration for adult rheumatologists.
4) Boston metropolitan area continues to enjoy the highest concentration of rheumatologists; rates in 2005 were 2.7 per 1 million children; rates in 2015 were 3.8 per 1 million children which is an increase of approximately 28%.
5) Using the literature and the workforce survey, the assumption was that pediatric rheumatologists worked an average of 55 hours per week. The average number of reported hours per week appears to remain constant from 2005. The literature supports that physicians practicing in MSAs work on average 15% less hours.
Table 5-6 provides the most current regional distribution of pediatric rheumatologists. The breakdown demonstrates that there are five areas including Puerto Rico where there is a less than 10% distribution of adult rheumatologists and six regional areas including Puerto Rico where there is a less than 10% distribution of pediatric rheumatologists. These numbers reflect actual numbers and not FTE. Table 5-6. Regional Distribution of Physician per Population Data Breakdown
Regions N % by Region Child Population
per Region Child per
Physician Ratio
1 Northeast 81 24.8 9,762,002 120,518.5 2 Mid-Atlantic 57 17.4 9,835,635 172,555.0 3 Southeast 25 7.6 12,092,867 483,714.7 4 Great Lakes 50 15.3 12,633,687 252,673.7 5 North Central 19 5.8 3,603,818 189,674.6 6 South Central 17 5.2 8,383,137 493,125.7 7 Southwest 8 2.4 4,840,522 605,065.3 8 West 40 12.2 9,813,241 245,331.0 9 Northwest 22 6.7 3,264,394 148,381.5
10 Puerto Rico 8 2.4 798,389 99,798.6 Total 327 75,027,692 229,442.5
Sources: AMA, ABIM, ABP; RNS, AAPA, & ACR Workforce Study Survey Results. ABIM most current numbers of active rheumatologists received February 2016. Numbers were pulled from mid-level provider associations’ information and other published literature. These numbers reflect all certificates.
5.2.2 RVU-productivity
1) The average annual growth rate for rheumatology specialists is very small; because of this it was assumed no change in productivity (RVUs) in the initial model.
2) Pediatric subspecialties saw an increase by 8.0% for compensation per work RVU in 2013; the work RVU changed by 6.1% resulting in an increase in compensation of 1.0%.
3) The average growth rate for rheumatology specialists is small and appears to get smaller. Because of this, no productivity factor was included in the initial model.
5.2.3 Succession Factor
1) Thirty-two percent (32%) of pediatric rheumatologists plan to retire within the next 10-15 years (10.7% 2015-2020; 10.7% 2020-2025; 10.7 2025-2030).

ACR 2015 Workforce Study Report 93 | P a g e
2) Data from workforce survey indicate that the rate of decrease in patient load is strongly correlated with anticipated retirement. That is, those that are planning on retiring in the next 5-10 years will also decrease their patient load.
3) Over 80% of pediatric rheumatologists who plan to retire in the next five-ten years anticipate a decrease in their patient load by 25%. Of those that plan to retire, we factored in ¾ FTE for each to compensate for reduced patient workload over the next ten years.
5.2.4 Gender factor
1) More than half (68%) pediatric rheumatologists are female; 32% are male.
5.2.5 Generational differences factor
1) Assume all entering fellows are millennials, therefore no factor was applied.
5.2.6 Full-time/Part-time factor
1) Survey results a little over 17.5% FITs were seeking to work part-time.
5.2.7 Practice Setting
1) Approximately 5% non-Academic settings and 95% Academic Medical Center. Assumption that 1 PR in PP would equal 1 FTE and that 1 PR in AMC would equal 0.8 FTE.
5.2.8 New Entrants to the Workforce (FIT)
5.2.8.1 Number positions, fill-rates, and graduation rates. Of the 36 pediatric rheumatology programs, there are 79 available positions, average number graduating if all positions filled each year would be 25. In 2015, about 45% are filled each year. Approximately 3.9% of fellows do not graduate the program.
5.2.8.2 Effect of IMGs. Approximately 42.6% of PR fellows are IMGs; Approximately 23.9% of the IMG FITs who were surveyed indicated they plan to practice outside the U.S.
5.2.8.3 Gender factor. Of FITs who are seeking to work PT (68%) were female, therefore a factor was included in gender to reflect that. There are approximately 68% women and 32% male for pediatric rheumatologists. When looking at the difference between work patterns between men and women, we looked at both previously published data and the workforce survey data. Females also are reported to work 7 fewer hours each week on average and fewer numbers of patient visits on average than their male counterparts. While overall females treated more patients than in 2005, females treat approximately 30% less than their male counterpart. While the number of women rheumatologists is expected to continue to grow, it would imply that the average number of visits would continue to decline.
5.2.8.4 Generational differences factor. Assume all entering fellows are millennials, therefore no factor was applied.

ACR 2015 Workforce Study Report 94 | P a g e
5.2.8.5 Full-time/Part-time factor. Survey results a little over 18% FITs were seeking to work part-time. Approximately 18% indicated they would work part-time; 90% of those were female (therefore this was added to the gender factor.
5.2.8.6 Practice Setting. Use same factor for FITs that we use in PR (5% non-Academic Settings and 95% Academic Medical Center). Table 5-7 details the workforce supply projections for pediatric rheumatology. To assess the number actually providing patient care, these numbers reflect FTE. Table 5-7. Pediatric Rheumatology Workforce Supply Projections
Supply 2015 Base
2020 Projections 2025 Projections 2030 Projections Total % Diff.
2015-2020 Total % Diff.
2020-2025 % Diff.
2015-2025 Total % Diff.
2025-2030 % Diff.
2015-2030
Peds^ 287 264 -8.0 243 -7.9 -15.0 231 -4.9 -19.5 NP 20 23 +15.0 24 +4.3 +20.0 25 +4.2 +25.0 PA 4 4 0.0 5 +25.0 +25.0 5 0 +25.0 Total 313 291 -7.0 272 -6.5 -13.1 261 -4.0 -16.6 Note: ^Numbers include new graduating fellows entering into the workforce annually; clinical FTE for pediatric rheumatologists assumes non-academic settings (5%)=1 FTE and AMC setting=0.8 FTE (95%); NP and PA=0.9 FTE.
5.3 Supply Non-Physician Services Numbers for non-physician providers that specifically work in rheumatology was very difficult to determine. Figures from the literature and discussions from ACR mid-level provider contacts helped determine a base line. There are an estimated 270 NPs currently working in rheumatology (248 in adult rheumatology and 22 in pediatric rheumatology). The percentage of NPs in Rheumatology will remain constant at less than 5%; an increase in the number of NPs is 31%. This should result in an anticipated increase of NPs in rheumatology to approximately 320 in adult rheumatology and to 25 in pediatric rheumatology by 2030. According to the workforce survey, approximately 46% of NPs in rheumatology are planning on retiring in the next 5-10 years, with 7.8% in the next 5 years and 39.1% in 6 to 10 years. There are an estimated 211 PAs currently working in rheumatology (207 in adult rheumatology and 4 in pediatric rheumatology). The percentages of PAs in Rheumatology will remain constant at about 1.9%. With an estimated increase in the number of PAs overall by 30%. This should result in an anticipated increase to 276 in adult rheumatology and 5 in pediatric rheumatology by 2030. According to the workforce study, approximately 31% plan to retire in the next 5 to 10 years, with 25% within 5 years and 6.3% in 6 to 10 years.
5.4 Demand Rheumatology Services (Adult and Pediatric) The following details the explanation of the demand factors for both adult and pediatric rheumatologists. The demand model includes the prevalence of disease, patient demographics, per capita income, and health care expenditures. The largest increase (almost 50%) in the demand is due to the growth of the U.S. population especially that of the older age group. While there is an increase in the number of youth,
ACR 2015 Workforce Study Report 95 | P a g e
that percentage is not nearly as great. The following factors were incorporated into the future demand model for rheumatology services. To complete the demand, the following were included in an initial regression model to determine if they significantly contribute to the demand (Appendix C):
1) Health care utilization 2) Provider practice trends 3) Disease prevalence across various demographic groups 4) Changes in the population demographics 5) Per capita income 6) Access to care (physician per population and geographic trends)
5.4.1 Prevalence of Rheumatoid Diseases. Approximately 52.5 million American adults have some form of arthritis. It is expected to increase by about 22% in the next ten years to 67 million. Of those about 50% will be adults 65 and older. Today more than 40 million people in the U.S. have been diagnosed with OA, an increase of 33% since 2005. With the demand for rheumatology services expected to increase by about 45% through the year 2025. An estimated 300,000 children under age 18 have some form of arthritis or rheumatic condition; this represents approximately 1 in every 250 children in the U.S.
5.4.2 Patient Demographics. Women are about 2.5 times more likely to get RA than men are. Age-adjusted estimates indicated that the rates increased in 1995 to 2007 by 2.5% each year for women and 0.5% each year for men. Adults 65 years of age and older will increase about 18% by 2020 and about another 25% in 2030. These increases will be factored into the demand model. According to the U.S. Census Bureau, the population of children under the age of 18 is not expected to increase much between 2014 and 2030, remaining at approximately 74 million by 2020 and 76 million by 2030. That is an increase of about 3% in 2020 and 2030. This increase will be factored into the demand model.
5.4.3 Per Capita Income. Based on compound growth 2010-2015, and forecasted value for 2020, the estimated compound growth for 2015-2020 is 2.5%, which is up 1.5% from the 2005 workforce study supply-demand calculations (see Section 4.3.1).
5.4.4 Health Care Expenditures. It is estimated that 60% (22.64 billion) of the costs associated with rheumatoid diseases are direct medical costs (out-of-pocket medical expenditures paid by patients, family members, and government), with 40% (15.5 billion) indirect (lost earnings, travel expenses, day care for children, etc.). The uninsured rate overall decreased between 2013 and 2014 by 2.9%. The Affordable Care Act was projected to increase Medicaid expenditures by a total of $514 billion for 2012 through 2021, an increase of about 9% over projections of Medicaid spending without the impact of the legislation. The most significant change to Medicaid is the expansion of Medicaid eligibility beginning in January 2014. This expansion is projected to add 8.7 million people to enrollment in FY 2014 (increase of 15%) and 18.3 million (an increase of 31%) by FY 2021 compared to pre-Affordable Care Act estimates. Medicare is not part of the Health Insurance Marketplace established by the health care law, so the effects of Medicare on the Rheumatology workforce will be the result of increase rates of Medicare eligible beneficiaries.
5.4.5 Excess Demand for Adult Rheumatologists. The excess demand for 2015 was estimated to be 560, which means there is an almost 10% excess demand currently. By 2030, there is a projected estimated need of 8,184, which is about a 192.2% increase of the estimated supply of 2,801, and 46% increase based on 2015 baseline. Table 5-8 details the adult rheumatology workforce demand projections.

ACR 2015 Workforce Study Report 96 | P a g e
Table 5-8. Adult Rheumatology Workforce Demand Projections Demand Baseline 2020 2025 2030
Projected Workforce Supply* 4,997 4,470 3,645 3,455 Projected Need 6,115 6,796 7,490 8,184 Difference (Excess Demand)** 1,118 2,326 3,845 4,729 Percent Change Projected Year +22.3 +52.0 +105.5 +137.8 Excess Demand based on 2015 Baselineβ ---- 1,799 2,493 3,187 Percent Change Compared 2015 Baseline ---- +36.0 +49.9 +63.8 Number projected with Disease± 22,500,000 25,421,467 28,571,024 36,361,586 Adults with Disease/Physician (Supply) £ 4,502.7 5,687.1 7,838.4 10,524.3 Adults with Disease/Physician (Need)± 3,679.5 3,740.7 3,814.6 4,443.0 Note: *Supply numbers represent clinical FTE; **Number of excess demand compared to same year supply projections;
βNumber of excess demand compared to 2015 baseline numbers; ±Number of projected patients with
rheumatoid diseases plus 25% OA patient load; £Number of adult with disease per physician based on current
projections; ±Number adults with disease per physician if projected physician need is met. The 2005 Workforce
Study projected supply of adult rheumatologists of 5,008 by 2025 and demand of 7219.
Figure 5-5 compares the projected supply and projected demand of adult rheumatologists, comparing where applicable to the data from the 2005 ACR workforce study. The demand projections between the 2005 and 2015 workforce study reports are comparable. The 2015 projected supply trends appear to be going in the same direction; however, there is a distinctively steeper drop in the 2015 workforce study compared to that of the 2005 workforce study. The WSG examined these trends and contributed this decrease to higher anticipated retirements and changing workforce demographics. These factors and differences in clinical FTE calculations were also likely contributors to this steeper downward trend.
Figure 5-5. Comparison of Projected Supply and Projected Demand of Adult Rheumatologists
2005 2010 2015 2020 2025 2030
2005 Projected Supply 4,946 5,019 4,940 4,806 4,643
2005 Projected Demand 4,946 5,422 5,968 6,584 7,219
2015 Projected Supply 4,997 4,470 3,645 3,455
2015 Projected Demand 6,115 6,796 7,490 8,184
4,946 5,019
4,940 4,806 4,643
4,946 5,422
5,968 6,584
7,219
4,997
4,470 3,645 3,455
6,115
6,796
7,490 8,184
0
1,000
2,000
3,000
4,000
5,000
6,000
7,000
8,000
9,000
Projected Clinical FTE

ACR 2015 Workforce Study Report 97 | P a g e
Note. Data from 2005 workforce study (2005 to 2025); Data from the 2015 workforce study (2015 to 2030). Figure 5-6 graphically depicts the workforce trends of adult rheumatologists separated by gender. The projection of gender differences in adult rheumatologists does appear to be as strikingly different in 2015 than in 2005. The projections in the 2005 WFS indicated an increasingly higher proportion of male rheumatologists. However, in the 2015 WFS, there is a projected shift from more male adult rheumatologists to more female adult rheumatologists in the workforce between 2015 and 2020 with that trend continuing through 2030.
Figure 5-6. Projection of Male vs. Female Adult Rheumatologists, 2005-2030
Note. Data from 2005 workforce study (2005 to 2025); Data from the 2015 workforce study (2015 to 2030).
5.4.6 Excess Demand for Pediatric Rheumatologists. The excess demand for 2015 was estimated to be 82, which means there is a 27.3% excess demand currently. By 2030, there is a projected estimated need of 461, which is about a 99.6% increase of the estimated supply compared to the projected supply of 231, and 5.37% increase based on 2015 baseline. Table 5-9 details the pediatric rheumatology workforce demand projections. Table 5-9. Pediatric Rheumatology Workforce Demand Projections
Demand Baseline 2020 2025 2030
Projected Workforce Supply* 287 264 243 231 Projected Need 382 407 434 461 Difference (Excess Demand)** 95 143 191 230 Percent Change Projected Year +33.1 +54.2 +78.6 +99.6 Excess Demand based on 2015 Baselineβ ---- 120 147 174 Percent Change Compared 2015 Baseline ---- +41.8 +51.2 +60.6 Number projected with Disease± 300,000 362,479 362,479 481,420
2005 2010 2015 2020 2025 2030
2005 Projected Female Supply 1,494 1,833 2,226 2,660 3,147
2005 Projected Male Supply 3,452 3,589 3,742 3,924 4,072
2015 Projected Female Supply 2,039 2,548 2,077 1,970
2015 Projected Male Supply 2,958 1,922 1,568 1,485
1,494
1,833
2,226
2,660
3,147 3,452
3,589 3,742
3,924 4,072
2,039
2,548
2,077 1,970
2,958
1,922
1,568 1,485
0
500
1,000
1,500
2,000
2,500
3,000
3,500
4,000
4,500
Projected Clinical FTE

ACR 2015 Workforce Study Report 98 | P a g e
Table 5-9. Pediatric Rheumatology Workforce Demand Projections - Continued
Demand Baseline 2020 2025 2030
Adults with Disease/Physician (Supply) £ 1,045.3 1,373.0 1,491.7 2,084.1 Adults with Disease/Physician (Need)± 785.3 890.6 835.2 1,044.3 Note: *Supply numbers represent clinical FTE; **Number of excess demand compared to same year supply projections;
βNumber of excess demand compared to 2015 baseline numbers; ±Number of projected patients with
rheumatoid diseases plus 25% OA patient load; £Number of adult with disease per physician based on current
projections; ±Number adults with disease per physician if projected physician need is met. The 2005 workforce
study projected supply of pediatric rheumatologists of 271 by 2025 and demand of 287.
Figure 5-7 displays the projected supply with the projected demand from 2005 to 2030, using the projected supply and demand numbers from both the 2005 ACR workforce study and the current workforce study. The projections between the two reports are much more different in the supply and demand in the 2015 workforce study than in the 2005 study. The elements that contribute to these differences include the greater percentage in 2015 of baby boomers anticipated to retire, the changes in the demographics that include an increased number of females in the workforce and the shift from baby boomers to the millennial generation who are both estimated to work less hours and treat significantly less patients than the current baby boomer workforce. These factors and differences in FTE calculations were also likely contributors to this downward trend.
Figure 5-7. Comparison of Projected Supply and Projected Demand of Pediatric Rheumatologists
Note. Data from 2005 workforce study (2005 to 2025); Data from the 2015 workforce study (2015 to 2030).
Figure 5-8 compares projected supply and demand of pediatric rheumatologists by gender, 2005 to 2030. Like in Figure 5-6, we compared these to the projections from the 2005 workforce study. The projections of gender differences in pediatric rheumatologists does not appear all that different in terms of trends in 2015 than in 2005 in that there continues to be much higher percentages of female pediatric
2005 2010 2015 2020 2025 2030
2005 Projected Supply 218 238 248 252 254
2005 Projected Demand 218 231 247 267 287
2015 Projected Supply 287 264 243 231
2015 Projected Demand 382 407 434 461
218 238 248 252
254
218 231
247 267 287 287
264
243 231
382 407
434 461
0
50
100
150
200
250
300
350
400
450
500
Projected Clinical FTE

ACR 2015 Workforce Study Report 99 | P a g e
rheumatologists than males. The projections between the two continue the same downward projection that parallels the downward projection of supply.
Figure 5-8. Projection of Male vs. Female Pediatric Rheumatologists, 2005-2030
Note. Data from 2005 workforce study (2005 to 2025); Data from the 2015 workforce study (2015 to 2030).
5.5 Sensitivity Testing The baseline model included the best estimates of all factors that contribute to both the supply and demand. However, it was also important to analyze effects of different variables on the outcome. One method commonly used for this is referred to as sensitivity testing. The main goal of sensitivity analysis is to gain insight into which assumptions are critical, (e.g., which assumptions affect choice) and potentially may vary due to unexpected changes in estimated economic, geographic, and demographic variables. This process involves various ways of changing input values of the model to see the effect on the output variable. In some situations, you can use a single model to investigate several alternatives. In other cases, you may use a separate model for each alternative. In using this approach, values are entered into the spreadsheet to see what effect each has on the ultimate outcome, in this case the supply and demand in the workforce. It is important to examine how changes in the assumptions and key parameters of the model influence supply and demand projections. These then can be used to prioritize future data collection by focusing on those parameters/assumptions that have the most significant impact on predicted workforce requirements. It should be noted, that rarely does on variable change with no effect on other variables. That is to say, each variable in a supply/demand model has a synergist effect, therefore, while sensitivity projections were conducted on each critical variable identified by the WSG, ultimately these were entered into the models to produce a ‘best case’ and ‘worst case’ scenario.
A summary of the baseline supply projections assumed that the patterns of rheumatologists providing services would remain relatively constant with no anticipated increases in programs or services. In addition, the number of openings for fellowships will remain constant and all openings filled.
2005 2010 2015 2020 2025 2030
2005 Projected Female Supply 112 131 143 150 159
2005 Projected Male Supply 106 107 104 102 95
2015 Projected Female Supply 195 180 165 157
2015 Projected Male Supply 92 84 78 74
112 131
143 150 159
106 107 104 102
95
195 180
165 157
92 84 78 74
0
50
100
150
200
250
Projected Clinical FTE

ACR 2015 Workforce Study Report 100 | P a g e
Additionally, the number of projected new graduates entering the workforce will remain constant every year for projection and the number of IMGs practicing in the U.S. would remain as identified in 2015. Summarizing the percentage of NPs in Rheumatology would remain constant at less than 5% of all NPs; an increase in the number of NPs overall between now and 2030 was expected to be 31%. The percentages of PAs in Rheumatology would also remain constant at 1.9%; an increase in the number of PAs overall between now and 2030 was expected to be 30%.
A summary of the projected increases in demand included an increase in the U.S. aging population with an anticipated increase in demand for rheumatology services by about 27% by the year 2020 and 45% through the year 2025. A baseline assumption was also included the anticipated number of OA patients seen by rheumatologists. To ensure a number captured did not underestimate the OA patient workload, a percentage slightly higher than the published literature (25%) was used with the understanding that this percentage could be either higher or lower.
5.5.1 Sensitivity Testing. The baseline model included the best estimates of all factors that contributed to both the supply and demand. It is also important to analyze various effects (increases and decreases) of the identified factors on the outcome. Sensitivity testing is one method commonly used for these analyses. The main goal of sensitivity analysis is to gain insight into which assumptions are critical, (e.g., which assumptions affect choice) and potentially may vary due to unexpected changes in estimated economic, geographic, and demographic variables. This process involved changing various input factor values of the model to see their effect on the output variable. Separate modeling was used to examine how changes in key parameters of the assumptions influenced supply and demand projections. It should be noted that all variables (factors) have a synergistic effect on the workforce. That is to say that a change in one variable could change how the other variables perform. While sensitivity projections were initially conducted on each variable separately, two new models were generated: ‘best case’ and ‘worst case’ scenarios. It should be noted that all original numbers entered into the models reflect actual numbers and not clinical FTE. Clinical FTE is computed once all other factors are entered and the model is run. Sensitivity testing for the supply included changes in gender differences, retirement projections, full-time/part-time status, practice settings, new entrants into the workforce, non-physician providers (NPs and PAs). Sensitivity testing for the demand included changes in the patient population.
5.5.1.1. Gender differences. The baseline model used the reported percentage of women-to-men in both adult and pediatric rheumatology. For adults, the increase also took into account the anticipated shift of more females in the future workforce. Literature suggests this trend will continue, therefore sensitivity testing decreased the number of females in both the adult and pediatric projections by 10% and increased by 10% and projected percentages for 2020, 2025, and 2030. The ranges listed in Table 5-10 indicate the numbers used for the sensitivity testing for females for each predicted year (2020 to 2030). The percentages of males were adjusted accordingly. Table 5-10. Sensitivity Testing for Gender Differences
Gender 2020 2025 2030
Base 10%
Decrease 15%
Increase Base
10% Decrease
15% Increase
Base 10%
Decrease 15%
Increase
Adult Female 3,070 2,763 3,530 2,573 2316 2,959 2,478 2,230 2,850
Ped. Female 191 172 220 184 166 212 171 154 196
Note. 2015 adult actual number baseline females=2,283; 2015 pediatric actual number baseline females=204. Modeling that included associated increases and/or decreases in the number of males accordingly.

ACR 2015 Workforce Study Report 101 | P a g e
5.5.1.2. Retirement. Based on the literature and 2015 workforce survey results, baseline retirement for adult rheumatologists was predicted to be 50% and for pediatric rheumatologists was predicted to be 32%. These percentages were lowered by 10% and increased by 10% to provide a range from 40%-60% retirement for adults and 22%-42% retirement for pediatric rheumatologists. The ranges listed in Table 5-11 indicate the numbers used for the sensitivity testing for projected retirements for adults (40% to 60%) and for pediatric (22% to 42%) for each predicted year (2020 to 2030). Table 5-11. Sensitivity Testing for Retirement Projections
Year Adult Rheumatologists Pediatric Rheumatologists
Current Model
40% 60% Current Model
22% 42%
2020 5,385 3,231 2,154 280 218 190 2025 4,515 2,709 1,806 271 211 184 2030 4,346 2,608 1,738 251 196 171
5.5.1.3. Full-time/Part-time factor. The 2015 workforce survey results indicated that 18% of FITs were seeking part-time employment. Information from the literature supported these trends. The percentages were decreased from 18% to 10% and increased to 25% in both adults and pediatrics to determine the effect on this factor. The ranges listed in Table 5-12 indicate the numbers used for the sensitivity testing for the number of part-time workers that was used in the sensitivity testing for each predicted year (2020 to 2030). Table 5-12. Sensitivity Testing for Part-time vs. Full-time Workforce
Year Adult Rheumatologists Pediatric Rheumatologists
Current Model
10% 25% Current Model
10% 25%
2020 5,385 4,846 4,039 280 252 210
2025 4,515 4,063 3,386 271 244 203
2030 4,346 3,911 3,259 251 226 188
5.5.1.4. Practice Setting. There is little data to determine the ratio of rheumatologists in non-academic versus academic medical centers (AMC), especially for adult rheumatologists. This affects the clinical FTE calculation because of the assumption that those in AMCs likely do not work full-time treating patients. The WSG estimated that 80% adults and 5% pediatric work in non-academic settings. These percentages were then changed to provide a range from 75% to 90% for adults in non-academic settings and a range remaining at 5 and increasing to 15% for pediatric in non-academic settings to see the effect on projections. The ranges listed in Table 5-13 indicate the numbers used for the sensitivity testing for the number of who work in non-academic settings in the sensitivity testing for each predicted year (2020 to 2030). The percentages of those in non-academic settings were adjusted accordingly. Table 5-13. Sensitivity Testing for Numbers of Rheumatologists Working in Non-Academic Settings
Year Adult Pediatric
Current Model
75% 90% Current Model
5% 15%
2020 5,385 4,039 4,847 280 280 322 2025 4,515 3,386 4,064 271 271 312 2030 4,346 3,260 3,911 251 251 289

ACR 2015 Workforce Study Report 102 | P a g e
5.5.1.5. New Graduates. The baseline models assumed the number of new graduates in both adult and pediatric rheumatology would remain the same and the fill-rate was 100%. Subsequently, three scenarios were used: 1) no change in the number of new rheumatology fellowships and a fill-rate of 50%; 2) an increase in the number of new graduates by 10% with 100% fill-rate, and 3) increase the number of new graduates by 25% with 100% fill-rate (Table 5-14). This brought a range of new entrants into the adult rheumatology workforce from a potential decrease of 325 to an increase of 165 by 2020. By 2030, this range would go from a decrease of 975 to a possible increase of 495. These ranges are listed below for each predicted year (2020 to 2030). For pediatric rheumatologists, this brought a range of new entrants from a potential decrease of 45 to an additional 25 by 2020, and a decrease of 135 to a potential increase of 75 by 2030. These numbers are actual numbers and not FTE. The FTE factor is applied once they enter the workforce. These new graduate entrants’ ranges are listed below for each predicted year (2020 to 2030). Table 5-14. Sensitivity Testing for New Graduate Entrants into Workforce
Year Adult Fellows Pediatric Fellows
50% filled 10% Increase 25% Increase 50% filled 10% Increase 25% Increase
2020 -325 +65 +165 -45 +10 +25 2025 -650 +130 +330 -90 +20 +50 2030 -975 +195 +495 -135 +30 +75
5.5.1.6 Non-Physician Providers. NP/PAs have been identified as one means of augmenting the rheumatology workforce. Assuming successful recruitment and training efforts are in place, the sensitivity testing increased the number of NP/PAs available for rheumatology from the estimated about 2% to 5% to a range of 10% to 30% (Table 5-15). These ranges are listed below for each predicted year (2020 to 2030). Note: these ranges are in actual numbers, not yet converted to clinical FTE. Table 5-15. Sensitivity Testing for Nurse Practitioners and Physician Assistants
2020 2025 2030
NPs/PAs Base 10% 30% Base 10% 30% Base 10% 30%
Adult NP 336 370 437 344 378 447 352 387 458 Pediatric NP 276 304 359 289 318 376 304 334 395
Adult PA 22 24 29 26 29 34 28 31 36 Pediatric PA 4 4 5 6 7 8 6 7 8 Note: 2015 Base Adult NPs=306; Adult PAs = 251; 2015 Base Pediatric NPs=23; Pediatric PAs=4
5.5.1.7. Osteoarthritis Patients (OA). It was very difficult to determine the actual number of OA patients seen by adult rheumatologists. Based on the literature the WSG originally used 25% for the original workforce model. This sensitivity testing included two scenarios: 1) rheumatologists treat no OA patients in their practice, and 2) rheumatologists’ patient pool consists of 50% patients with OA (Table 5-16). These ranges are listed below for each predicted year (2020 to 2030). Table 5-16. Sensitivity Testing for Patient Demand in Adult Rheumatology Only
Year Increased Supply
Range Base 25% OA Patient Load
0% OA Patient Load
50% OA Patient Load
2020 3,741-4,486 25,421,467 14,123,037 36,719,897 2025 4,204-5,012 28,571,024 16,116,732 41,025,317 2030 5,390-6,262 36,631,586 16,116,732 51,253,895

ACR 2015 Workforce Study Report 103 | P a g e
5.6. Best-Case and Worst-Case Scenario Models Two additional models were generated based on these tests, one that will look at the worst case scenario and one that will look at the best case scenario. Table 5-17 summaries the factors/assumptions applied to the projections. Table 5-17 Summary of Factors/Assumptions Applied Projections
Factor Assumption NPs & PAs
One means to augment the workforce is to recruit and train NPs and PAs to work in rheumatology. At present there is about 1% of PAs with a 46% retirement prediction. At present there is less than 1% of PAs with a 31% retirement prediction. Clinical FTE for NPs and PAs was estimated to be 0.9 for every 1 NP/PA. 1) Models A & C (Worst Case Scenarios). Assumes a decrease in NPs/PAs in
rheumatology by 10% 2) Models B & D (Best Case Scenarios). Assumes an increase in NPs/PAs in
rheumatology by 30% New Graduate Entrants
Three different scenarios were used for sensitivity testing: 1) with current level of fellowships with 50% fill rate of new fellowship positions, 2) 10% increase in fellowship positions with all fellowship positions filled, and 3) 25% increase in fellowship positions with all positions filled. 1) Models A & C (Worst Case Scenarios). Assumes current level of fellowship positions
with 50% filled 2) Models B & D (Best Case Scenarios). Assumes an increase in fellowship openings by
25% with all filled Gender Considering the number of women in the workforce, the two models looked at a
decrease from the current prediction by 10% and an increase from the current position by 10%. 1) Models A & C (Worst Case Scenarios). Assumes a increase in the number of women
in workforce by 10% 2) Models B & D (Best Case Scenarios). Assumes an decrease in the number of women
in workforce by 10% Succession Plans
Considering the number of rheumatologists planning to retire, the two models looked at a decrease from the current prediction by 10% and an increase from the current position by 10%. 1) Models A & C (Worst Case Scenarios). Assumes a decrease in the projected number
of retirees in workforce by 10% 2) Models B & D (Best Case Scenarios). Assumes an increase in the projected number
of retirees in workforce by 10% Part-time and Full-time
Considering the number of rheumatologists planning to work part-time, the two models looked at an increase of part-time workers from the current prediction by 10% and a decrease of from the current position by 25%. 1) Models A & C (Worst Case Scenarios). Assumes an increase in the projected
number of physicians in workforce by 10% 2) Models B & D (Best Case Scenarios). Assumes a decrease in the projected number
of physicians in workforce by 25%

ACR 2015 Workforce Study Report 104 | P a g e
Table 5-17 Summary of Factors/Assumptions Applied Projections - Continued Factor Assumption Practice Settings
The base original model assumed 80% adults and 5% pediatric work in non-academic settings. 1) Models A & C (Worst Case Scenarios). Assumes an increase in the number of
physicians in non-academic settings to 90% for adults and leave at 5% percent for pediatric
2) Models B & D (Best Case Scenarios). Assumes a decrease in the number of physicians in non-academic settings to 75% for adults and 15% for pediatric
Patient Demand of OA Patients
The base Original Model assumed adult rheumatologists would treat approximately 25% OA patients in their practice. 1) Models A & C (Worst Case Scenarios). Assumed a 50% increase in OA patient load 2) Models B & D (Best Case Scenarios). Assumed no treatment of an OA patients
Patient Demand of Pediatric Patient Load
The base Original Model assumed pediatric rheumatologists would see about an increase in 3% increase in demand 1) Models A & C (Worst Case Scenarios). Assumed greater than 10% increase in patient
demand 2) Models B & D (Best Case Scenarios). Assumed less than a 3% increase in patient
demand
5.6.1 Adult Rheumatology: Following the sensitivity testing, all the new factor limits were then added to the model to generate a “worst-case” scenario “best-case” scenario. The first model (Model A) represents the worst-case scenario. That is to say, what the workforce might look like if projections were underestimated. The second model (Model B) represents the best-case scenario. That is to say, what the workforce might look like if projections were overestimated. Numbers for rheumatologists are computed as clinical FTE.
5.6.1.1 Model A: Supply and Demand Adult Rheumatologists (Worst-Case Scenario) (Table 5-18). When considering the worst-case scenario, the clinical FTE supply would go from the original projected 3,455 in 2030 to 3,056, an additional decrease of about 12% (399 clinical FTE of adult rheumatologists). Including the current projected NP/PA workforce, it would only improve the projected decrease about 2%, to about 10%. The excess demand for 2015 was estimated to be 1,118 in the original workforce model, but in the worst-case scenario increases to 1,596, which means the excess demand would increase from 22% to 32% with an additional excess demand for 478 clinical FTEs. The excess demand by 2030 would increase from 4,729 to 5,566, bringing the potential increase from about 52% to just over 86%, with an additional excess demand for 837 clinical FTEs. In the worst-case scenario, this would bring the adults with disease per physician (supply) from 6504 to 16,772 by 2030; that is an overall 21% increase from the 2015 baseline.
Table 5-18. Model A Supply and Demand - Adult Rheumatology (Worst-Case Scenario)
Supply 2015 Base
2020 2025 2030
Total % Diff.
2015-2020 Total
% Diff. 2020-2025
% Diff. 2015-2025
Total % Diff.
2025-2030 % Diff.
2015-2030
Adult 4,997 3,888 -30.51% 3,455 -11.1 -38.3 3,056 -11.6 -45.6
NP 228 275 +20.6 282 +2.5 +23.7 288 +2.1 +23.7
PA 190 226 +18.9 237 +4.9 +24.7 248 +4.6 +30.5
Total 5,415 4,389 -18.9 3,974 -9.5 -26.6 3,592 -9.6 -33.7

ACR 2015 Workforce Study Report 105 | P a g e
Table 5-18. Model A Supply and Demand - Adult Rheumatology (Worst-Case Scenario) - Continued
Demand Baseline 2020 2025 2030
Projected Need 6,593 7,234 7,928 8,622
Difference (Excess Demand)** -1,596 -3,346 -4,283 -5,566
Percent Change Projected Year +31.9 +86.1 +129.5 +182.1
Excess Demand based on 2015 Baselineβ ----- -2,237 -2,931 -3,625
Percent Change Compared 2015 Baseline ----- +44.8 +58.7 +72.5
Number projected with Disease± 32,500,000 36,719,897 41,025,317 51,253,895
Adults with Disease/Physician (Supply) £ 6,503.9 9,444.4 11,874.2 16,771.6
Adults with Disease/Physician (Need)± 4,929.5 5,076.0 5,174.7 5,944.5 Note: *Supply numbers represent clinical FTE; **Number of excess demand compared to same year supply projections;
βNumber of excess demand compared to 2015 baseline numbers; ±Number of projected patients with
rheumatoid diseases plus 50% OA patient load; £Number of adult with disease per physician based on current
projections; ±Number adults with disease per physician if projected physician need is met. Numbers include new
graduating fellows entering into the workforce annually.
5.6.1.3 Model B: Supply and Demand Adult Rheumatologists (Best-Case Scenario) (Table 5-19). When considering the best-case scenario, the supply would go from the original projected 3,455 in 2030 to 5,214, an increase of about 51% (up 1,759 clinical FTE for adult rheumatologists). Including the current projected NP/PA workforce, it would not increase the workforce by any significant amount. The excess demand for 2015 was estimated to be 1,118 in the original workforce model, but in the best-case scenario decreases to 719, which means the excess demand would decrease from 22% to 14%. The excess demand by 2030 would increase from 4,729 to 5,214 bringing the potential increase from about 52% to only about 27% with an additional excess demand for 485 clinical FTEs. In the best-case scenario, this would bring the adults with disease per physician supply from 2,501.5 to 3,563 by 2030; that is a 27% increase above the 2015 baseline. Table 5-19. Model B Supply and Demand - Adult Rheumatology (Best-Case Scenario)
Supply 2015 Base
2020 2025 2030
Total % Diff.
2015-2020 Total
% Diff. 2020-2025
% Diff. 2015-2025
Total % Diff.
2025-2030 % Diff.
2015-2030
Adult 4,997 5,777 +3.25% 5,488 -5.1% -1.9% 5,214 -5.0% -6.8%
NP 228 398 +74.6 407 +2.2 +78.5 416 +2.2 +82.5
PA 190 326 +71.6 342 +4.9 +80.0 359 +5.0 +88.9
Total 5,415 6,501 +20.1 6,237 -4.1 +15.1 5,989 -4.0 +10.6
Demand Baseline 2020 2025 2030
Projected Workforce Supply* 4,997 5,777 5,488 5,214
Projected Need 5,716 6,313 6,420 6,602
Difference (Excess Demand)** -719 -536 -932 -1,388
Percent Change Projected Year +14.4 +9.28 +16.98 +26.6
Excess Demand based on 2015 Baselineβ ----- -1,316 -1,423 -1,605
Percent Change Compared 2015 Baseline ----- +26.3 +28.47 +32.1
Number projected with Disease± 12,500,000 14,264,577 16,029,154 18,576,189
Adults with Disease/Physician (Supply) £ 2,501.5 2,469.2 2,920.8 3,562.8
Adults with Disease/Physician (Need)± 2,186.8 2,259.6 2,496.8 2,813.7 Note: *Supply numbers represent clinical FTE; **Number of excess demand compared to same year supply projections;
βNumber of excess demand compared to 2015 baseline numbers; ±Number of projected patients with

ACR 2015 Workforce Study Report 106 | P a g e
rheumatoid diseases plus 0% OA patient load; £Number of adult with disease per physician based on current
projections; ±Number adults with disease per physician if projected physician need is met.
Numbers include new
graduating fellows entering into the workforce annually.
Figure 5.9 graphically combines the best-case and worst-case scenario of the adult rheumatology workforce to compare the sensitivity testing with the 2015 workforce projections. This display the error bars in which the workforce supply and demand could fall given any of the changes that were identified in the sensitivity tests.
Figure 5.9 Adult Rheumatologist Projections Sensitivity Testing Results
5.6.2 Pediatric Rheumatology: Two additional models were generated based on these tests, one that
will look at the worst-case scenario and one that will look at the best-case scenario. The first model (Model A) displayed represents the worst-case scenario. That is to say, what would the projections look like if projections were underestimated (Table 5-20 and 5-21). The second model (Model B) represents the best-case scenario. That is to say, what would the projections look like if projections were overestimated (Table 5-22 and 5-23).
5.6.1.4 Model C Supply and Demand Pediatric Rheumatologists (Worst-Case Scenario) (Table 5-20). When considering the worst-case scenario, the supply would go from the original projected 231 in 2030 to 119, an additional decrease of about 49% (112 clinical FTE of pediatric rheumatologists). Including the current projected NP/PA workforce would improve the projected decrease about 25%, to about 24%. The excess demand for 2015 was estimated to be 95 in the original workforce model, but in the worst-case scenario increases to 153, which means the excess demand would increase from 33% to 53% with an additional excess demand for 58 clinical FTE of pediatric rheumatologists. The excess
2015 2020 2025 2030
Supply 4,997 4,470 3,645 3,455
Demand 6,115 6,796 7,490 8,184
4,997 4,470
3,645 3,455
6,115
6,796
7,490
8,184
0
1,000
2,000
3,000
4,000
5,000
6,000
7,000
8,000
9,000
Projected Clinical FTE 3,888
5,777 5,488
8
3,455
5,214
3,056
Best Case Scenario Supply/Demand Worst Case Scenario Supply/Demand
6,313
7,234
3
8,666
6,602 6,420
7,928

ACR 2015 Workforce Study Report 107 | P a g e
demand by 2030 would increase from 230 to 395, bringing the potential increase from about 61% to just over 79%, with an additional excess demand for 165 clinical FTE. In the worst-case scenario, this would bring the children with disease per physician supply from 1,045.3 to 4,244.5 by 2030; that is a three-fold increase from the 2015 baseline. Table 5-20. Model C Supply and Demand - Pediatric Rheumatology (Worst-Case Scenario)
Supply 2015 Base
2020 2025 2030
Total % Diff.
2015-2020 Total
% Diff. 2020-2025
% Diff. 2015-2025
Total % Diff.
2025-2030 % Diff.
2015-2030
Pediatric 287 224 -22.0 134 -40.2 -53.3 119 -11.2 -58.5 NP 20 21 -5.0 22 +4.8 +10.0 23 +4.5 +15.0 PA 4 4 0 5 +25% +25% 5 0 +25% Total 311 249 -19.9 161 -35.3 -48.2 147 -8.7 -52.7 Demand Baseline 2020 2025 2030
Projected Workforce Supply* 287 234 134 119 Projected Need 440 462 487 514 Difference (Excess Demand)** +153 +228 +353 +395 Percent Change Projected Year +53.3 +97.4 +263.4 +331.9 Excess Demand based on 2015 Baselineβ ----- +175 +200 +227 Percent Change Compared 2015 Baseline ----- +61.0 +69.7 +79.1 Number projected with Disease± 300,000 461,936 475,406 505,099 Children with Disease/Physician (Supply) £ 1,045.3 1,974.1 3,547.8 4,244.5 Children with Disease/Physician (Need)± 681.8 999.9 976.2 982.7 Note: *Supply numbers represent clinical FTE; **Number of excess demand compared to same year supply projections;
βNumber of excess demand compared to 2015 baseline numbers; ±Number of projected patients with
rheumatic diseases; £Number of children with disease per physician based on current projections;
±Number children
with disease per physician if projected physician need is met. Numbers include new graduating fellows entering into the workforce annually.
5.6.1.5 Model D Supply and Demand Pediatric Rheumatologists (Best-Case Scenario) (Table 5-21). When considering the best-case scenario for the supply of pediatric rheumatologists, the percentage difference in the number of projected clinical FTE of rheumatologists goes from 287 in 2015 to 281 in 2030; that is a slight decrease by about 6%. The anticipated increase in NPs increases by about 44% in 2030 and for PAs by 75%. In this best-case scenario, the total difference in 2030 from 2015 would be a decrease of only 2%. The excess demand for 2015 was estimated to be 95 in the original workforce model, but in the best-case scenario is 60 in 2015, which means the excess demand would decrease to 24%. In the best-case scenario, the excess demand by 2030 would increase to 107. This would bring the children with disease per physician from 1,045.3 to 974 by 2030; that is approximately a 7% decrease from 2015. Table 5-21. Model D Supply - Pediatric Rheumatology (Best-Case Scenario)
Supply 2015 Base
2020 2025 2030
Total % Diff.
2015-2020 Total
% Diff. 2020-2025
% Diff. 2015-2025
Total % Diff.
2025-2030 % Diff.
2015-2030
Pediatric 287 346 +15.3 305 -11.8 +1.7 281 -7.9 -6.3 NP 20 30 +50.0 31 +3.3 +55.0 33 +6.5 +65.0 PA 4 5 +25% 7 +40% +75% 7 0 +75% Total 311 381 -22.5 343 -10.0 -10.3 321 -6.4 -3.2

ACR 2015 Workforce Study Report 108 | P a g e
Table 5-21. Model D Supply - Pediatric Rheumatology (Best-Case Scenario) - Continued
Demand Baseline 2020 2025 2030 Projected Workforce Supply* 287 346 305 281 Projected Need 382 377 402 429
Difference (Excess Demand)** +60 +31 +80 +107 Percent Change Projected Year +18.6 +25.7 +24.8 +33.2 Excess Demand based on 2015 Baselineβ ----- +55 +102 +129 Percent Change Compared 2015 Baseline ----- +17.1 +34.0 +43.0 Number projected with Disease± 300,000 291,000 282,270 273,802 Adults with Disease/Physician (Supply) £ 1,045.3 841.0 925.5 974.4 Adults with Disease/Physician (Need)± 785.3 771.9 702.2 638.2 Note: *Supply numbers represent clinical FTE; **Number of excess demand compared to same year supply projections;
βNumber of excess demand compared to 2015 baseline numbers; ±Number of projected patients with
rheumatic diseases; £Number of children with disease per physician based on current projections;
±Number children
with disease per physician if projected physician need is met. Numbers include new graduating fellows entering into the workforce annually.
Figure 5.10 graphically combines the best-case and worst-case scenario of the pediatric rheumatology workforce to compare the sensitivity testing with the 2015 workforce projections. This display the error bars in which the workforce supply and demand could fall given any of the changes that were identified in the sensitivity tests.
Figure 5.10 Pediatric Rheumatologist Projections Sensitivity Testing Results
2015 2020 2025 2030
Supply 287 264 243 231
Demand 382 407 434 461
287 264
243 231
382 407
434 461
0
50
100
150
200
250
300
350
400
450
500
Projected Cliniccal FTE
Best Case Scenario Supply/Demand
Worst Case Scenario Supply/Demand
377
462
514
429
402
487
305
134
119
281
346
234

ACR 2015 Workforce Study Report 109 | P a g e
5.7 References 1. Medscape Physician Compensation Report, 2015. Retrieved February 13, 2016 from:
http://www.medscape.com/features/slideshow/compensation/2015/public/overview#page=18 2. Medscapte Rheumatologist Compensation Report 2015.
http://www.medscape.com/features/slideshow/compensation/2015/rheumatology#page=21 3. ACR, 2009 Rheumatology Economic Survey, Final Report 2010. Retrieved February 13, 2016 from:
http://www.rheumatology.org/Portals/0/Files/ACR_Economic_Survey_Report_2009.pdf 4. US Department of Health and Human Services. The Physicians Workforce. December
2008.http://bhpr.hrsa.gov/healthworkforce/reports/physwfissues.pdf Accessed March 7, 2015. 5. Sibert KS. Don't quit this day job. New York Times. June 11,
2011.http://www.nytimes.com/2011/06/12/opinion/12sibert.html?src=me&ref=general Accessed March 7, 2015.
6. ACGME. Rheumatology Programs Academic Year 2015-2016. United States. Retrieved February 7, 2016 from https://apps.acgme.org/ads/Public/Reports/ReportRun?ReportId=1&CurrentYear=2015&SpecialtyId=28&IncludePreAccreditation=false
7. ACGME. Data Resource Book. Academic Year 2014-2015. Retrieved February 7, 2016 from: http://www.acgme.org/acgmeweb/tabid/259/GraduateMedicalEducation/GraduateMedicalEducationDataResourceBook.aspx
8. U.S. Department of Health and Human Services, Health Resources and Services Administration. The Physician Workforce: Projections and Research into Current Issues Affecting Supply and Demand. 2008. Retrieved February 7, 2016 from: http://bhpr.hrsa.gov/healthworkforce/reports/physwfissues.pdf
9. Kentros C, Barbato C. Using Normalized RVU Reporting to Evaluate Physician Productivity, 2013. Retrieved February 14, 2016 from http://www.hfma.org/Content.aspx?id=18548
10. Vaudrey B. Compensation 2013: Evolving Models, Emerging Approaches. Retrieved February 14, 2016 from: https://www.sullivancotter.com/wp-content/uploads/2013/09/AMGA_2013_Evolving-Models-Emerging-Approaches_LVaudreyLoos.pdf
11. U.S. Department of Health and Human Services, Health Resources and Services Administration. The Physician Workforce: Projections and Research into Current Issues Affecting Supply and Demand. 2008. Retrieved February 7, 2016 from: http://bhpr.hrsa.gov/healthworkforce/reports/physwfissues.pdf
12. American Board of Pediatrics. Workforce Data, 2014-2015. Retrieved April 19, 2016 from https://www.abp.org/content/workforce-data
13. Melbourne Institute of Applied Economic and Social Research & Australian Health Workforce Institute. Refining the National Workforce Planning Model, Final Report, April 2010. Retrieved March 6, 2016 from http://www.ahwo.gov.au/documents/Publications/2011/Refining%20the%20National%20Workforce%20Planning%20Model.pdf\
14. Microsoft Excel. Sensitivity Analysis using Excel, Chapter 2. Retrieved March 6, 2016 from http://treeplan.com/chapters/sensitivity-analysis-using-excel.pdf
15. Hunink M, Glasziou P, Siegel J, et al. “Chapter 11: Variability and Uncertainty” in Decision Making in Health and Medicine: Integrating Evidence and Values. Cambridge, UK: Cambridge Press, 2004. 339-363.
16. Briggs et al. Model Parameter Estimation and Uncertainty: A Report of the ISPOR-SMDM Modeling Good Research Practices Task Force – 6. Value in Health, 2012, 15: 835- 842.

ACR 2015 Workforce Study Report 110 | P a g e
17. Hayward Medical Communications. What is sensitivity analysis? Health economics. 2009. Retrieved March 7, 2016 from: http://www.medicine.ox.ac.uk/bandolier/painres/download/whatis/What_is_sens_analy.pdf

ACR 2015 Workforce Study Report 111 | P a g e
6. DISCUSSION AND RECOMMENDATIONS This section highlights approaches that the ACR can consider to address the projected excess demand for rheumatologist services.
6.1 Limitations of the 2015 Workforce Study
6.1.1 Baseline Rheumatology Specialist Numbers. It was difficult to determine accurately the following:
1) the number of rheumatologists (both adult and pediatric) in the workforce actually treating patients;
2) the number of rheumatologists (both adult and pediatric) who are currently board certified but are no longer be treating patients;
3) the accurate percentage breakdown between rheumatologists working in non-academic and those working in academic medical centers for adult rheumatology, and to some degree pediatric rheumatology;
4) the number of Med-Peds subspecialists and how they are documented to ensure they are not being counted twice (under both adult and pediatric rheumatology)
5) the number of non-rheumatology specialists (internists, family practitioners, orthopedists, etc.) who may be treating ‘arthritis.’
6.1.2 Full-time Equivalent (FTE) calculations Determining specific trends in the full-time equivalent (FTE) number of rheumatologists who are actively treating patients presented a challenge for the WSG. To do so, it was necessary to assess the hours treating patients or the number of patients treated each day, to convert the actual number of rheumatologists to full-time equivalent (FTE) numbers. Because the negotiated time (or percentage) of each faculty member treating patients, conducting research, performing administrative duties or teaching varies within and between institutions, it was difficult to obtain accurate information regarding FTE for the academic workforce as a whole, even more so with the pediatric rheumatology workforce. Therefore, to provide the best estimated clinical FTE for the academic workforce, the average for academic work settings was used. To further complicate the assumptions was the incomplete data on what proportion of the non-academic workforce worked part time. Synthesizing all these elements, the following standard definitions for the initial workforce model for FTE was: Adult Rheumatology Workforce Pediatric Rheumatology Workforce Private Practice (80%)=1 FTE per physician Private Practice (5%) = 1 FTE per physician AMCs (20%)=0.5 FTE per physician AMCs (95%)=0.8 FTE per physician
6.1.3 Primary Data Collection While an analysis was conducted to ensure sufficient power for each of the surveys distributed, it is important to note that the main workforce survey was primarily targeted to the ACR membership, which may limit the generalizability to the overall rheumatology workforce. While every effort was made to pull responses from all areas of rheumatology (both within and outside the ACR), more responses were

ACR 2015 Workforce Study Report 112 | P a g e
received from adult rheumatologists working in academic medical centers than in the private sector. Additionally, it was difficult to determine the specific percentage of adult rheumatologists working in non-academic versus those working in academic medical centers. In contrast, the overwhelming majority of pediatric rheumatologists work in academic settings. New dimensions were added to this workforce study compared to the previous one. First, fellows-in-training (FITs) completed a separate survey with a 93% response rate. This provided additional information regarding providers entering the workforce, both in adult and pediatric rheumatology. Patient data was also a new dimension added to the 2015 workforce study. With the assistance of the Arthritis Foundation, data was collected from adults, young adults, and pediatric patients. While the data from patients provided a different perspective to that of providers, it was important to show caution in generalizing data from the survey respondents to all patients with rheumatic diseases. These data contributed to the demand model. Lastly, because surveys collect data at one single point in time, we cannot measure changes across time. Data collected in 2005 was used to construct 2015 comparison questions with similar content. Errors due to missing data (question non-response) and item misinterpretation by respondents may also exist.
6.1.4 Evaluation of Model Factors While the predictions appear to be precise, the primary purpose of projections is not to set distant targets, but rather to identify what actions need to be taken in the near future to ensure movement towards achieving long-term objectives. Every effort was made to determine an exact number of rheumatologists and clinical FTE in a “needs-based” sense. However, projections are typically based on past and planned productivity, distribution, and employment patterns of the workforce. They also require predictions about how national politics, population health needs and the delivery of services will change in the future. Therefore, there should be no normative significance or established standard attributed to the supply-demand estimates. There are too many dynamics and confounding variables at play, including retirement projections, workforce supply projections, workload and work activities, succession planning, etc., that factor into the prediction to achieve such precision. Unforeseen and unplanned events could influence the demand for rheumatology services in the next 10-15 years. Thus, these estimates should be interpreted as representing a broad range, under the assumption that all other factors remain constant. The factors that were used for the model were pulled from several sources. These include the published literature, focus groups, surveys, and individual interviews. The WSG was instrumental in defining various supply and demand factors and their associated ratios. The WSG made every effort to interpret the factors as accurately as possible to develop a realistic workforce model. In addition, sensitivity testing was completed to determine the best-case and worst-case scenarios to provide a range.
6.2 Recommendations for Addressing Excess Demand This section highlights approaches that the ACR can consider to address the projected excess demand for rheumatologist services.
6.2.1 General Recommendation: Reassess Workforce Strategic Plan The WSG recommends the ACR Board of Directors assess the 2013-2016 Strategic Plan for meeting academic and non-academic rheumatology supply and demand needs based on the current workforce

ACR 2015 Workforce Study Report 113 | P a g e
study results. The primary challenges will be 1) recruitment of the rheumatology workforce 2) providing adequate access to rheumatology care for patients, and 3) supporting the existing workforce, particularly those within the non-academic community. Over the next 10 years, the combination of baby boomer retirements, shifting demographics of incoming providers (e.g., gender, generational, percentage international medical graduates, etc.), disparities in the regional distribution of rheumatologists, and the Affordable Care Act will dramatically affect access to rheumatology care. Future challenges to recruitment of clinical and academic rheumatologists include student debt, unfilled fellowship positions, competing specialties, and rheumatology salaries. Levels of ACR membership and the volunteer workforce will also be impacted by these workforce changes. Given all these challenges, innovative strategies are needed.
6.2.2 Recruitment of Rheumatology Workforce 6.2.2.1 Graduate Medical Education. It is essential that recruitment of a rheumatology workforce begin early with teaching at the medical student level, as well as in pediatric and internal medicine residency training. This strategy is also applicable to PA and NP graduate school programs, from the classroom to clinical rotations.
6.2.2.2 Fellowship Training. The WSG recommends exploring strategies for filling existing fellowship slots, including evaluation of the current regional distribution of fellowship programs and challenges with existing GME funding. While increasing the number of fellowship positions will not solve the absolute shortage of rheumatologists, innovative strategies should be explored to help look at redistribution of the workforce; this may involve increasing the number of fellowship positions in specified underserved areas. Further, augmenting the traditional clinical and biomedical training curriculum with the science of health care delivery (including health economics, policy, population health, etc.) will help support trainees entering the workforce in the current health care environment.
6.2.2.3 Loan Repayment Plans. Student loan debt is influencing medical students, internal medicine and pediatric residents to pursue other more lucrative subspecialties instead of rheumatology. The potential strategy of increased number of loan repayment plans could serve as both a recruiting tool and a strategy to improve access to care in underserved rheumatology regions in the US. Other approaches to recruitment include improved salaries, changes in reimbursement models, increases in reimbursement rates, and policy changes in health care delivery and health care financing.
6.2.2.4 Academic Rheumatology. The current FIT survey suggested that current fellows consider academics a more ideal primary work setting; however, close to 50% of the adult fellows anticipated entering private practice. The remainder of respondents, including the vast majority of pediatric fellows, anticipated a career in academics as clinician educators, clinical investigators, and researchers (basic science and translational). Although this is an excellent sign for academic rheumatology, the Division Directors responses in the workforce study survey indicated that junior academic rheumatologists were transitioning into non-academic positions more than before due to difficulty with academic advancement and tenure, insecure research funding, higher salary opportunities, and student loan debt. The WSG recognizes that the Division Director Special Committee has identified cultivating academic faculty for leadership positions and more guidance in succession planning as a priority and this 2015 workforce study further supports this approach. While 60% of the Division Directors indicated their institution provides internal leadership opportunities or funding for external leadership programs, this does not appear to be consistent across the board. Exploring the development of formal mentorship and leadership training programs for academic rheumatology is critical for recruitment and retention. A more

ACR 2015 Workforce Study Report 114 | P a g e
formal academic pathway program would help junior academic faculty plan and implement successful careers, cultivate collaboration and leadership, and assist with securing research funding and competitive grants.
6.2.2.5 Private Practitioners. Rheumatologists in private practice experience their own set of barriers. Reported key barriers to practice included reimbursement issues, preauthorization, EMR implementation, lack of staff, lack of time with patients, and difficulty in recruiting rheumatologists. Strategies should be explored to assist private practitioners.
6.2.2.6 Non-Physician Provider (Nurse Practitioners (NP) and Physician Assistants (PA). The ACR/ARHP should strongly consider optimal strategies for increasing the numbers of NPs and PAs to augment the workforce and access-to-care. Several authors have suggested that employing NPs and/or PAs for patients in need of laboratory monitoring, those with chronic conditions, and those requiring a greater focus on education and coping skills, can lead to better patient outcomes and more efficiently utilization of rheumatologists’ time. Data from the survey indicate that only about one-quarter of rheumatologists are in a practice with an NP or PA. In addition, best estimates indicate that less than 1% of the existing rheumatology NPs/PAs work in pediatric rheumatology. Thus, there appears to be substantial room for increasing the role of non-physician providers in both adult and pediatric rheumatology. In addition, the ACR/ARHP should investigate strategies for providing appropriate rheumatology training for NPs/PAs. Currently, limited rheumatology-based resources are available to aid in the readiness of an NP or PA to join a rheumatology practice. The ARHP Working Group is vested in the development of a standardized curriculum for NPs and PAs. Additional consideration could be given to a more formal training program that parallels rheumatology fellowship training for physicians. This recommendation carries with it a greater commitment in terms of time and financial resources. Better training could serve to increase interest in our specialty among health professionals and increase exposure of students in NP and PA schools to our specialty.
6.2.2.7 Volunteer Workforce. The volunteer ACR/ARHP workforce is a critical and integral aspect of the overall rheumatology workforce that cannot be underemphasized. Volunteer activities include spearheading/assisting in advocacy, training, continuing education, mentoring, and recruitment efforts. Recruiting recent fellow graduates as ACR members and integrating them into the volunteer workforce early is essential to sustain a viable volunteer workforce and a long-standing commitment to the ACR/ARHP. In addition, novel opportunities and formats for volunteerism must be developed to match the future workforce and the current practice environment. The WSG recommends recruitment challenges could be further investigated and subdivided within existing ACR/ARHP committees such as Committee on Training and Workforce, Division Directors Special Committee, Pediatric Rheumatology Specialty Committee, ARHP Practice Committee, Membership/ Marketing Committees, etc.
6.2.3 Access-to-Care
6.2.3.1 Supply and Demand Models. It is clear that the demand for services will continue to increase with the aging population, the continued implementation of the Affordable Care Act, and disparities in the regional distribution of rheumatologists in the U.S. The major areas to consider include 1) the role of primary care practitioners in the management of common musculoskeletal conditions and 2) strategies to improve options for access to rheumatology care (both adult and pediatric), especially in underserved areas of the U.S. While there is not anticipated to be an increase in pediatric patients as there will be in geriatric patients, there is still a significant projected excess need, especially in select regional areas. The

ACR 2015 Workforce Study Report 115 | P a g e
strategies for underserved areas might include visiting rheumatology consultants to clinics, locum tenens, training PAs/NPs, and telehealth initiatives.
6.2.3.2 Practice Efficiency. As the supply of rheumatology providers is declining and the demand for rheumatology care is increasing over the next 10 years, practice efficiency becomes most critical. Managing rheumatology care in the office, at an academic medical center, and at the State or Regional level has to become more efficient. A routine disease management approach with multidisciplinary and interprofessional rheumatology providers may become necessary to optimally manage the larger demand but also maintain quality outcomes. Leveraging technology by developing new practice models that utilize screening consultations (e.g., telehealth models) for early connective tissue disease versus primary care oriented musculoskeletal problems may be essential (although it is important to factor in the significant challenges and shortages faced by the primary care workforce). Maintaining a current ACR/ARHP website for patient education, practice models, business practices, collaboration, etc., is very helpful for providers and patients. The role of an innovative electronic medical record (EMR) for improving efficiency, documentation, and reimbursement is a continuous challenge. Can facilitating clinical trials have an impact on access to care and managing more rheumatology patients in various areas of the U.S.?
6.2.3.3 Barriers for Access to Care. The WSG recommends the access to care challenges be further investigated by Committee on Workforce and Training, ARHP Practice Committee, CORC, the Government Affairs Committee, and the Committee on Registries and Health Information Technology. This executive summary provides a brief overview. More details of the workforce study are provided in this report in more detail.

ACR 2015 Workforce Study Report 116 | P a g e
APPENDICES

ACR 2015 Workforce Study Report 117 | P a g e
Appendix A. ACR Workforce Study Group Membership
CORE LEADERSHIP GROUP Member Affiliation Daniel Battafarano, DO Co-Chair
Division Director Professor of Medicine, Uniformed Services University of the Health Sciences San Antonio Military Medical Center
Seetha Monrad, MD Co-Chair
Division of Rheumatology University of Michigan
Kamilah Lewis Director, Training and Workforce American College of Rheumatology
Marcia Ditmyer, PhD, MBA, MS Vice President Academy for Academic Leadership (AAL)
Val Gokenbach, DM, RN, MBA, NEC-A, RWJF
Senior Consultant Academy for Academic Leadership (AAL)
CORE MEMBERSHIP GROUP Member Affiliation Anne R. Bass, MD Associate Professor of Clinical Medicine
Weill Cornell Medical College Rheumatology Fellowship Program Director Hospital for Special Surgery
Marcy Bolster, MD
Rheum Program Director Massachusetts General Hospital
Alan Erickson, MD
APD Rheumatology Fellowship University of Nebraska Medical Center
Jonathan Hausmann, MD
Fellow in Pediatric and Adult Rheumatology Boston Children’s Hospital Beth Israel Deaconess Medical Center
Marisa Klein-Gitelman, MD
Division Director, Northwestern University Feinberg School of Medicine
Lisa Imundo, MD
Pediatric Rheumatology Children's Hospital New York, NY

ACR 2015 Workforce Study Report 118 | P a g e
CORE MEMBERSHIP GROUP Member Affiliation Benjamin J Smith, PA-C, DFAAPA Physician Assistant in Rheumatology, McIntosh Clinic, P.C.
ARHP Past President
Chad Deal, MD Cleveland Clinic Foundation John Fitzgerald, MD, PhD Interim Division Director
UCLA
Karla Jones RN, MS, CPNP
Pediatrics Nurse Practitioner Nationwide Children’s Hospital, Columbus, OH

ACR 2015 Workforce Study Report 119 | P a g e
Appendix B. Workforce Process Chart

ACR 2015 Workforce Study Report 120 | P a g e
Appendix C. Supply and Demand Model

ACR 2015 Workforce Study Report 121 | P a g e

ACR 2015 Workforce Study Report 122 | P a g e
Appendix D. Active Adult Rheumatologists by State
State Total Active Total
Population± Total Adult Population±
People Per Physician
Female** Male**
Number Percent Number Percent
TOTAL 5,595 308,745,538 234,314,027 41,879.2 2284 41.0 1838 30.0
Alabama 74 4,858,979 3,766,795 50,902.6 19 16.0 27 37.0
Alaska 8 738,432 554,449 69,306.1 0 0.0 4 100.0
Arizona 37 6,828,065 5,139,601 138,908.1 29 37.2 25 32.1
Arkansas 79 2,978,204 2,275,548 28,804.4 16 37.1 13 31.0
California 721 39,144,818 29,647,840 41,120.4 295 43.2 258 37.6
Colorado 95 5,456,574 4,267,991 44,926.2 30 34.5 29 33.3
Connecticut 110 3,590,886 2,776,878 25,244.3 39 40.6 39 40.6
DC 28 945,934 743,726 26,561.6 31 59.6 11 21.2
Delaware 19 672,228 558,164 29,377.1 23 27.4 24 28.6
Florida 330 20,271,272 16,185,149 49,045.9 114 35.3 115 35.6
Georgia 105 10,214,860 7,712,474 73,452.1 50 41.0 39 32.0
Hawaii 21 1,431,603 1,115,340 53,111.4 3 12.0 7 28.0
Idaho 19 1,654,930 1,254,693 66,036.5 6 31.6 7 36.8
Illinois 256 12,859,995 9,663,089 37,746.4 97 44.7 67 30.9
Indiana 84 6,619,680 5,023,495 59,803.5 37 42.5 26 29.5
Iowa 43 3,123,899 2,412,843 56,112.6 14 35.9 11 28.2
Kansas 45 2,911,641 2,212,645 49,169.9 12 33.3 13 35.1
Kentucky 61 4,425,092 3,422,785 56,111.2 22 40.0 11 20.0
Louisiana 63 4,670,724 3,499,222 55,543.2 32 43.8 29 39.7
Maine 21 1,329,328 1,060,096 50,480.8 4 21.0 11 57.9
Maryland 227 6,006,401 4,600,107 20,264.8 91 46.9 63 32.5
Massachusetts 277 6,794,422 5,310,569 19,171.7 115 44.4 94 36.2
Michigan 169 9,922,576 7,435,518 43,997.1 60 40.5 45 30.4
Minnesota 101 5,489,594 4,199,631 41,580.5 34 39.5 33 38.4

ACR 2015 Workforce Study Report 123 | P a g e
Appendix D. Active Adult Rheumatologists by State - Continued
State Total Active Total
Population± Total Adult Population±
People Per Physician
Female** Male**
Number Percent Number Percent
Mississippi 40 2,992,333 2,232,883 55,822.1 11 40.7 10 37.0
Missouri 112 6,083,672 4,672,278 41,716.8 46 45.5 31 30.7
Montana 20 1,032,949 820,637 41,031.9 7 41.2 11 64.8
Nebraska 31 1,896,190 1,449,934 46,772.1 16 60.0 7 30.0
Nevada 31 2,890,845 2,225,760 71,798.7 12 46.2 14 53.8
New Hampshire 43 1,330,608 1,026,444 23,870.8 16 48.5 11 33.3
New Jersey 221 8,958,013 6,869,789 31,085.0 66 39.1 61 35.9
New Mexico 32 2,085,109 1,605,704 50,178.3 13 37.1 14 40.0
New York 477 19,795,791 15,374,915 32,232.5 235 49.6 171 35.9
North Carolina 183 10,042,802 7,773,964 42,480.7 64 40.0 46 28.8
North Dakota 11 756,927 614,963 55,905.7 2 40.0 3 60.0
Ohio 229 11,613,423 8,868,992 38,729.2 88 40.7 77 35.6
Oklahoma 41 3,911,338 3,016,265 73,567.4 20 46.5 14 32.6
Oregon 80 4,028,977 3,165,811 39,572.6 28 42.4 19 28.8
Pennsylvania 327 12,802,503 10,054,908 30,749.0 130 42.3 107 34.7
Puerto Rico 64 3,548,397 2,750,008 42,968.9 27 42.3 28 43.8
Rhode Island 25 1,056,298 807,025 32,281.0 14 43.8 12 37.5
South Carolina 69 4,896,146 3,859,797 55,939.1 23 34.3 26 38.8
South Dakota 13 858,469 664,317 51,101.3 2 14.3 5 35.7
Tennessee 99 6,600,299 5,121,384 51,731.2 28 30.4 33 35.9
Texas 373 27,469,114 20,683,706 55,452.3 146 42.9 79 23.2
Utah 38 2,995,919 2,176,934 57,287.7 10 34.5 13 44.8
Vermont 14 626,042 493,670 35,262.1 6 54.5 4 36.4
Virginia 153 8,382,993 6,502,809 42,502.0 64 47.4 40 29.6
Washington 132 7,170,351 5,681,928 43,044.9 48 44.0 41 37.6

ACR 2015 Workforce Study Report 124 | P a g e
Appendix D. Active Adult Rheumatologists by State - Continued
State Total Active Total
Population± Total Adult Population±
People Per Physician
Female** Male**
Number Percent Number Percent
West Virginia 22 1,844,128 1,461,817 66,446.2 4 23.5 7 41.2
Wisconsin 118 5,771,337 4,452,193 37,730.4 35 33.0 32 29.9
Wyoming 3 586,107 469,834 156,611.3 1 33.0 2 66.0
Note. People per physician data pulled from US Census 2012; *Data not reported in any ABIM/AAMC1-2 reports; numbers pulled from ACR website "find your rheumatologist" function,3 some of which were listed as both Adult and Ped, therefore cannot verify if these were adult rheumatologists who treats pediatric patients, or board certified Med-Ped and/or pediatric rheumatologists; **Not all numbers reported; ±Population data pulled from U.S. Census 2014 estimates.4
Sources: 1. Association of American Medical Colleges. (2013). The complexities of physician supply and demand: Projections from 2013 to 2015. HIS
Inc. Retrieved January 20, 2016 from: https://www.aamc.org/download/426248/data/thecomplexitiesofphysiciansupplyanddemandprojectionsfrom2013to2.pdf
2. American Board of Internal Medicine. (2015). Statistics and Data. Retrieved January 20, 2016 from: http://www.abim.org/about/statistics-data.aspx
3. American College of Rheumatology. Find a Rheumatologist. Retrieved January 31, 2016 from: http://www.rheumatology.org/Directories/Find-a-Rheumatologist
4. U.S. Census. Population Projections. Retrieved January 23, 2015 from: http://www.census.gov/

ACR 2015 Workforce Study Report 125 | P a g e
Appendix E. Active Pediatric Rheumatologists by State
State Total Active Children Population± Percent Total Population±
Person per Physician
TOTAL 327 75,027,692 ---- 229,442.5
Alabama 5 1,092,184 23.8 218,436.8
Alaska 0 183,983 26.5 NA
Arizona 2 1,688,464 25.4 844,232.0
Arkansas 2 702,656 24.4 351,328.0
California 38 9,496,978 24.9 249,920.5
Colorado 1 1,188,583 24.6 1,188,583.0
Connecticut 4 814,008 22.8 203,502.0
DC 3 202,208 22.9 67,402.7
Delaware 3 114,064 21.5 38,021.3
Florida 13 4,086,123 21.2 314,317.2
Georgia 4 2,502,386 26.1 625,596.5
Hawaii 2 316,263 23.6 158,131.5
Idaho 3 400,237 26.4 133,412.3
Illinois 8 3,196,906 24.7 399,613.3
Indiana 4 1,596,185 25.0 399,046.3
Iowa 3 711,056 23.6 237,018.7
Kansas 1 698,996 24.9 698,996.0
Kentucky 1 1,002,307 23.5 1,002,307.0
Louisiana 2 1,171,502 25.4 585,751.0
Maine 4 269,232 19.8 67,308.0
Maryland 15 1,406,294 23.8 93,752.9
Massachusetts 19 1,483,853 22.3 78,097.5
Michigan 6 2,487,058 23.8 414,509.7
Minnesota 6 1,289,963 23.8 214,993.8
Mississippi 1 759,450 25.6 759,450.0

ACR 2015 Workforce Study Report 126 | P a g e
Appendix E. Active Pediatric Rheumatologists by State - Continued
State Total Active Children Population± Percent Total Population±
Children per Physician
Missouri 11 1,411,394 23.8 128,308.5
Montana 2 212,312 21.9 106,156.0
Nebraska 1 446,256 25.2 446,256.0
Nevada 1 665,085 24.7 665,085.0
New Hampshire 9 304,164 22.0 33,796.0
New Jersey 7 2,088,224 23.2 298,317.7
New Mexico 0 479,405 24.2 NA
New York 31 4,420,876 22.7 142,608.9
North Carolina 9 2,268,838 24.3 252,093.1
North Dakota 2 141,964 22.3 70,982.0
Ohio 17 2,744,431 23.7 161,437.1
Oklahoma 1 895,073 24.9 895,073.0
Oregon 3 863,166 22.8 287,722.0
Pennsylvania 17 2,747,595 21.8 161,623.2
Puerto Rico 8 798,389.30 22.3 99,798.7
Rhode Island 1 249,273 22.3 249,273.0
South Carolina 2 1,036,349 23.3 518,174.5
South Dakota 1 194,152 24.7 194,152.0
Tennessee 4 1,478,915 23.7 369,728.8
Texas 14 6,785,408 27.5 484,672.0
Utah 4 818,985 31.6 204,746.3
Vermont 1 132,372 20.3 132,372.0
Virginia 7 1,880,184 23.5 268,597.7
Washington 13 1,488,423 22.8 114,494.1
West Virginia 1 382,311 20.9 382,311.0
Wisconsin 9 1,319,144 23.0 146,571.6

ACR 2015 Workforce Study Report 127 | P a g e
Appendix E. Active Pediatric Rheumatologists by State - Continued
State Total Active Children Population± Percent Total Population±
Children per Physician
Wyoming 1 116,273 22.4 116,273.0
Note. *Data not reported in any ABP/AAMC1-2 reports; numbers pulled from ACR website "find your rheumatologist" function; some of which were listed as both Adult and Ped, therefore cannot verify if these were adult rheumatologists who treats pediatric patients, or board certified Med-Ped and/or pediatric rheumatologists;3 ±Population data pulled from U.S. Census 2014 estimates.4
Sources: 1. Association of American Medical Colleges. (2013). The complexities of physician supply and demand: Projections from 2013 to 2015. HIS
Inc. Retrieved January 20, 2016 from: https://www.aamc.org/download/426248/data/thecomplexitiesofphysiciansupplyanddemandprojectionsfrom2013to2.pdf
2. The American Board of Pediatrics. (2014). Workforce Data, 2014-2015. Retrieved January 20, 2016 from: https://www.abp.org/content/workforce-data
3. American College of Rheumatology. Find a Rheumatologist. Retrieved January 31, 2016 from: http://www.rheumatology.org/Directories/Find-a-Rheumatologist
4. U.S. Census. Population Projections. Retrieved January 23, 2015 from: http://www.census.gov/

ACR 2015 Workforce Study Report 128 | P a g e
Appendix F. Active Rheumatologists U.S. Distribution by Region
Region State Distribution Adult Pediatric
N % # Population Per
Physician N % # Population
Per Physician
1 Northeast Maine, New York, New Hampshire, Massachusetts; Rhode Island, Connecticut, New Jersey, Vermont
1264 21.1 33,719,386 26,719.0 81 24.8 9,762,002 120,518.5
2 Mid-
Atlantic
Pennsylvania, Maryland, Delaware, Virginia, West Virginia, North Carolina, South Carolina, DC
1028 17.1 35,555,292 34,586.9 57 17.4 9,835,635 172,555.0
3 Southeast Louisiana, Mississippi, Alabama, Georgia, Kentucky, Tennessee, Florida
698 11.6 41,940,692 60,087.0 25 7.6 12,092,867 483,714.7
4 Great Lakes Minnesota, Wisconsin, Michigan, Illinois, Indiana, Ohio
957 16.0 39,642,918 41,424.2 50 15.3 12,633,687 252,673.7
5 North
Central North Dakota, South Dakota, Nebraska, Kansas, Iowa, Missouri
255 4.3 12,026,980 47,164.6 19 5.8 3,603,818 189,674.6
6 South
Central Texas, Oklahoma, Arkansas 493 8.2 25,975,519 52,688.7 17 5.2 8,383,137 493,125.7
7 Southwest Nevada, Utah, Arizona, New Mexico, Colorado
233 3.9 15,415,990 66,163.0 8 2.4 4,840,522 605,065.3
8 West California and Hawaii 742 12.4 30,763,180 41,459.8 40 12.2 9,813,241 245,331.0
9 Northwest Washington, Oregon, Idaho, Montana, Wyoming, and Alaska
262 4.4 11,947,352 45,600.6 22 6.7 3,264,394 148,381.5
10 Puerto Rico Puerto Rico 64 1.1 2,750,008 42,968.9 8 2.4 798,389 99,798.6
Note: Numbers do not include Med-Peds 5994 ---- 249,737,317 41,657.6 327 ---- 75,027,692 229,442.5

ACR 2015 Workforce Study Report 129 | P a g e
Appendix G. Regional Distribution of ACR Workforce Survey Respondents
Region Adult* Pediatric* Med-Ped* Fellows-in-
Training Nurse
Practitioners
Physician Assistants
Other Specialists
Adult Patients
Ped/Young Adults
Patients**
N % N % N % N % N % N % N % N % N %
Northeast 174 14.7 34 11.9 4 5.5 69 14.9 6 8.0 0 --- 19 14.2 85 15.1 49 11.6
Mid-Atlantic 175 14.8 43 15.1 15 20.5 72 15.5 10 13.3 4 21.1 32 23.9 68 12.1 57 13.5
Southeast 103 8.7 22 7.7 0 --- 39 8.4 4 5.3 3 15.8 13 9.7 79 14.0 77 18.2
Great Lakes 136 11.5 33 11.6 7 9.6 62 13.4 8 10.7 2 10.5 18 13.4 144 25.5 100 23.6
North Central 27 2.3 14 4.9 3 4.1 26 5.6 1 1.3 1 5.3 21 15.7 28 5.0 30 7.1
South Central 204 17.2 32 11.2 9 12.3 30 6.5 14 18.7 5 26.3 5 3.7 49 8.7 26 6.1
Southwest 84 7.1 25 8.8 7 9.6 10 2.2 9 12.0 0 --- 1 0.7 48 8.5 25 5.9
West 199 16.8 55 19.3 21 18.8 39 8.4 15 20.0 2 10.5 16 11.9 37 6.6 30 7.1
Northwest 82 6.9 27 9.5 7 9.6 16 3.4 8 10.7 2 10.5 9 6.7 17 3.0 12 2.8
Note: Numbers represent those who reported zip codes. Only US zip codes were included. Percentages are computed within the specialty. Numbers represent those who self-identified
themselves as Parents of Pediatric patients or young adults. Northeast=Maine, New York, New Hampshire, Massachusetts; Rhode Island, Connecticut, New Jersey, Vermont; Mid-
Atlantic=Pennsylvania, Maryland, Delaware, Virginia, West Virginia, North Carolina, South Carolina; Southeast=Louisiana, Mississippi, Alabama, Georgia, Kentucky, Tennessee, Florida;
Great Lakes: Minnesota, Wisconsin, Michigan, Illinois, Indiana, Ohio; North Central=North Dakota, South Dakota, Nebraska, Kansas, Iowa, Missouri; South Central=Texas, Oklahoma,
Arkansas; Southwest=Nevada, Utah, Arizona, New Mexico, Colorado; West = California and Hawaii; Northwest = Washington, Oregon, Idaho, Montana, Wyoming, and Alaska

ACR 2015 Workforce Study Report 130 | P a g e
Appendix H. Metropolitan Statistical Areas
Rank MSA 2014
Estimate 2010
Census %
Change Number
Physicians26 Number/ 1,000,000
Adult Number/ 1,000,000
Ped Number/ 1,000,000
--- United States 318,857,056 309,347,057 +2.98% 816,727 2561.4 1,838 5.8 145 0.5
1 New York-Northern New Jersey-
Long Island, NY-NJ-PA 20,092,883 19,567,410 +2.69% 88,290 4394.1 553 27.5 35 1.7
2 Los Angeles-Long Beach-Anaheim,
CA 13,262,220 12,828,837 +3.38% 41,883 3158.1 238 17.9 24 1.8
3 Chicago-Naperville-Elgin, IL-IN-WI 9,554,598 9,461,105 +0.99% 33,158 3470.4 180 18.8 12 1.3
4 Dallas-Fort Worth-Arlington, TX 6,954,330 6,426,214 +8.22% 14,179 2038.9 90 12.9 7 1.0
5 Houston-The Woodlands-Sugar
Land, TX 6,490,180 5,920,416 +9.62% 16,606 2558.6 77 11.9 6 0.9
6 Philadelphia-Camden-Wilmington,
PA-NJ-DE-MD 6,051,170 5,965,343 +1.44% 24,764 4092.4 136 22.5 18 3.0
7 Washington-Arlington-Alexandria,
DC-VA-MD-WV 6,033,737 5,636,232 +7.05% 24,027 3982.1 150 24.9 13 2.2
8 Miami-Fort Lauderdale-West Palm
Beach, FL 5,929,819 5,564,635 +6.56% 19,353 3263.7 118 19.9 5 0.8
9 Atlanta-Sandy Springs-Roswell, GA 5,614,323 5,286,728 +6.20% 13,631 2427.9 49 8.7 7 1.2
10 Boston-Cambridge-Newton, MA-
NH 4,732,161 4,552,402 +3.95% 26,566 5613.9 247 52.2 18 3.8