acoustic emission on line integrity monitoring of an
TRANSCRIPT
Paper 2e
Acoustic Emission On Line Integrity Monitoring of an Ammonia Converter
Vessel
During a routine ultrasonic inspection of the welds in the ammonia converter at PCS Nitrogen Trinidad Ltd, several cracks were found in one of the circumferential welds. These welds were repaired to the NBIC Code and a Fitness for Service analysis showed that the vessel was safe to return back to service. However, it was important to know whether further cracks were initiating and growing in service, and if so what was driving the crack growth. Conventional on line ultrasonic was not practical due to temperature constraints of the technology so instead an Acoustic Emission (AE) system was installed to monitor the area of concern. The system collects and displays AE data and process data locally as well as sends it via the Internet to a remote location for further analysis. It provides a continuous on line condition assessment of the vessel.
Stanley Reid PCS Nitrogen Trinidad Ltd
Sam Ternowchek
Physical Acoustics Corp
Introduction
coustic Emission Technology (AET) is a Non-Destructive Testing (NDT) technique that has been successfully
used in industry for many years as a means of detecting and locating defects in pressure equipment. It has been applied to vessels, spheres, bullets and piping with good results. As a global inspection technique it is capable of detecting and locating defects in the area being monitored. The conventional use of the technology is to use it as a periodic inspection either on line or off line depending on the operating conditions of the equipment and the ability of the process to create the pressure increments necessary for the
test. However, recent advances in equipment, software and the Internet have made this technology a very good method of monitoring the integrity of pressure equipment on-line while in normal operation. The need for this type of technology at this facility came about after a routine ultrasonic inspection of the welds in the ammonia converter. Several small indications were detected in both circumferential and longitudinal welds. After repairs were completed in accordance to the National Board Inspection Code (NBIC) a Fitness for Service analysis was performed which indicated the vessel could be returned safely to service. However, it was important to determine if the indications were growing and, if possible, what was driving them and when were they growing.
A
95 AMMONIA TECHNICAL MANUAL2009

Conventional ultrasonics was deemed not to be practical due to limitations in the ultrasonic technology when applied at high temperatures and also there would be no correlation with the process to determine what may be driving the cracks. Acoustic Emission monitoring was selected as the means of monitoring the vessel. Forty AE sensors were installed on the vessel and the monitoring instrumentation was located in the control room. Along with data from the AE sensors, the instrumentation monitors and records four temperature measurements on the vessel and one pressure value. This allows the AE data to be correlated with the process so that if and when defect growth is detected it can be correlated with the process to determine what may be driving the defect. The system is connected via the internet to the Physical Acoustics Corp. headquarters in Princeton, NJ where engineers monitor the AE data and provide a weekly report. This paper presents a summary of the results of over two years on line monitoring. BACKGROUND of CONVERTER The Ammonia Converter 105-D was designed and fabricated to ASME Section VIII, Division 2 in 1997 by Kellogg Brown & Root, built by Kawasaki Heavy Industries and commissioned in 1998. It operates at 1300 psi and 370° C (700° F). The upper shell region has an inside diameter of 381 cm. (150 inches) and is SA-387 Grade 11, Class 2 (1-1/4 Cr-1/2Mo) material. The lower shell region below the conical transition has an inside diameter of 335 cm. (132 inches) and is SA-302 Grade B (Mn-Mo) material. The shell thicknesses are 13.1 cm. (5-5/32 inches) and 9.8 cm. (3-55/64 inches) for the upper and lower shells, respectively. There are a total of 3 circumferential and 11 longitudinal welds in the upper section and 5 circumferential and 12 longitudinal welds in the lower section of the converter.
In January 2002 during normal plant operations, a small fire was observed emanating from the insulation in the lower section of the converter. Inspection showed that the leak was due to a crack on longitudinal weld (LWL-14); the crack had a length of 100mm on the internal diameter and 20mm on the exterior. All welds in the converter were inspected using Time of Flight Diffraction (TOFD) and no additional cracks were found. Additionally the manganese moly section of the converter was inspected to detect any signs of High Temperature Hydrogen Attack (HTHA) and none was found. Metallurgical analysis of the sample stated that the crack was due to Hydrogen Induced Cracking (HIC) resulting from improper heat treatment. Following this, during a plant turnaround in September 2005, an inspection of the converter revealed significant cracking along circumferential weld CWL-6. This crack was repaired and subsequent to this event an Acoustic Emission monitoring system was installed to monitor circumferential weld (CWL-6) since an inspection of the entire converter showed no indications on any other welds. In late 2007 the acoustic emission system was expanded to monitor all welds in the converter. A third incidence of cracking of welds in the converter was found during a planned shut- down of the plant in October 2008. Cracks were found in the circumferential weld (CWL-3) in the 1-1/4Cr section, in circumferential weld (CWL-6) and longitudinal welds (LWL-18 and LWL-19) in the manganese moly section of the converter. INSPECTION PLAN The inspection plan for the ammonia converter consisted of the following: TOFD of both upper and lower sections every turnaround (3 years). Prior to 2008 TOFD was performed on the lower section every turnaround and on the upper section every other turnaround.
96AMMONIA TECHNICAL MANUAL 2009

Inspections for HTHA was performed in the manganese moly section every turnaround. Acoustic emission monitoring of circumferential weld (CWL-6) in the manganese section of the converter began in 2005 and the AE monitoring was expanded to cover all welds in 2007.
11
Figure 1 Ammonia Synthesis Converter
ACOUSTIC EMISSION TECHNOLOGY Acoustic Emissions (AE) are transient elastic waves generated by the rapid release of energy from localized sources within a material. AE is sometimes referred to as micro-seismic activity. AE is considered a global inspection technique because a relatively small number of sensors can be used to evaluate the integrity of large and complex structures. AE testing has been
successfully applied for the structural integrity evaluation of various plant equipment such as pressure vessels, piping and storage tanks; it is also applied to other structures such as bridges, off-shore platforms and rail tank cars. There are many standards for using the technology in this manner. They include ASME, ASTM and other international societies.
Figure 2 Definition and schematic description of AE process AE signals can result when localized yielding occurs at a crack front. This may only be a few microns or at the most a few millimeters. It also occurs when crack faces rub together creating a stick slip mechanism, which can generate large signals also. Figure 2 illustrates the AE concept. When under a stimulus the microstructure movement produces a stress wave, which propagates through the material. At some point it reaches the surface and is detected by the piezoelectric sensor. This sensor converts the stress waves to an electrical signal, which can then be measured, and process by the system. When multiple sensors are used such as in this setup, the instrument can detect and locate where the source of the signal is on the structure. By measuring the time difference of arrival of the same signal at different sensors on the structure, knowing the distance between sensors and the velocity of sound in the material, the location of the source can be calculated. Figure 3 shows a signal being
97 AMMONIA TECHNICAL MANUAL2009
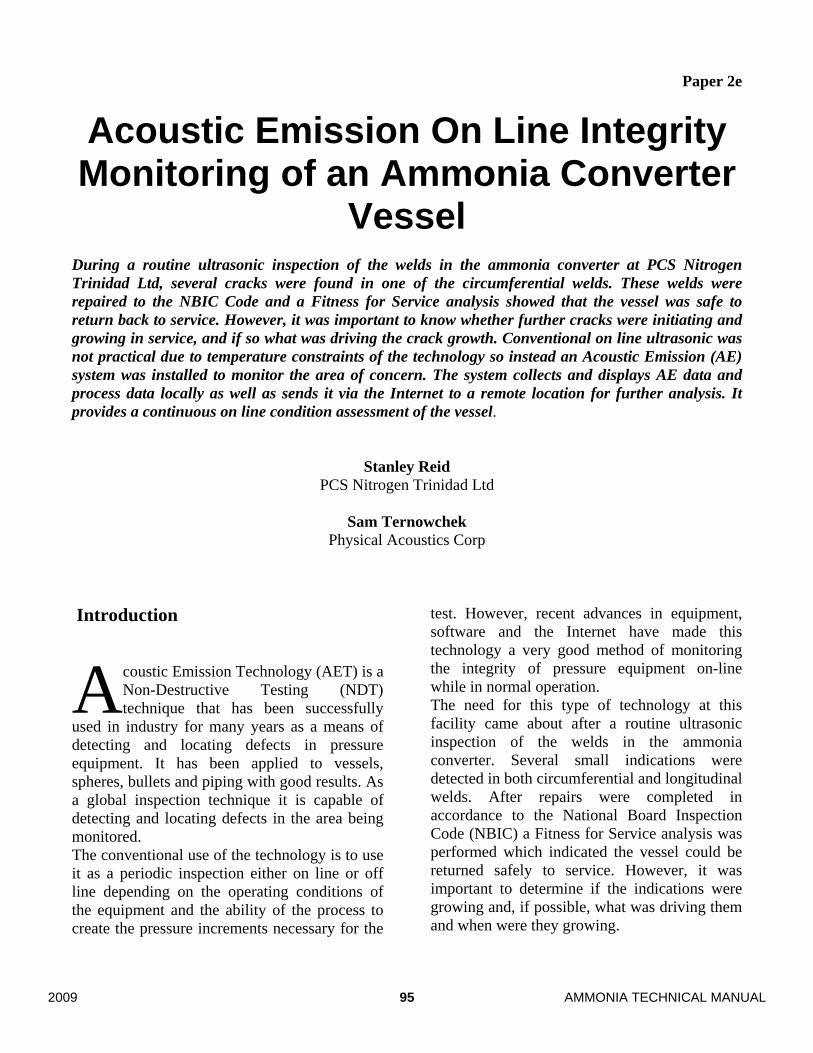
detected by two different sensors. The difference in arrival times can easily be seen in these plots. The ability to locate the source of the AE signals is an important function when using AE as on line monitor. There can be several different sources (crack locations and/or noise sources), which are emitting activity. Source location is a necessary tool to aid in segregating one source from another.
Figure 3 AE waveforms from two different sensors detecting the same source signal In the past, AE testing was conducted as a periodic inspection. It normally required a controlled stimulus be applied to the equipment. The stimulus was an increase in operating stress(s) to stimulate any defects, which were developing under the equipment operating envelope. In some cases this could be accomplished while the equipment was in service. If the operating environment produced an excess of background noise then the test would be performed off line during a shut down or turnaround. Once the test is completed, analysis of the data may indicate a need for careful monitoring for defect growth and/or the development of new defects.
Continuous, on-line monitoring is a different approach to the use of AE. Unlike periodic testing, it does not require changes in the operating envelope to stimulate a defect, although this could be of benefit. Because the defects develop and propagate under the operating envelope, the operating conditions become the stimulus. The standard operating conditions are the stimulus for AE defect activity. And as noted earlier, a major benefit of on-line monitoring is that it can help correlate defect growth and driving mechanism should process information be recorded with the AE data. Acoustic emission on line monitoring, therefore, can help optimize the operating conditions to minimize or eliminate defect growth and equipment damage. ACOUSTIC EMISSION SYSTEM The AE system used in this program is the latest, state of the art, digital system that processes conventional AE statistical data along with digital waveform recording. The project was implemented in two stages. The initial setup was intended to only monitor the indications in circumferential weld CWL-6. This required eight sensors, four equally spaced above the weld and four equally spaced, and offset by forty-five degrees from the top four, below the weld. Approximately a year later it was decided to add enough sensors as to provide 100% coverage over the complete vessel. This required an additional thirty-three sensors be added to the vessel for a total of forty-one sensors. Figure 4 shows the location of the sensors arranged to provide 100 % coverage of the vessel. Circumferential and longitudinal welds are numbered from top to bottom and longitudinal welds from left to right.
98AMMONIA TECHNICAL MANUAL 2009

Figure 4 AE Sensor Positions
The installation required the use of a device called a wave guide be welded to the vessel exterior. The wave guide is a stainless steel rod that has a point on one end and a cone shaped device on the other. The pointed end is welded to the vessel and the AE sensor is epoxyed to the other end and held in place by a protective cover. These are required because the skin temperature of the vessel exceeds the maximum rating for the AE sensors. After the wave guides are installed, coaxial cables are routed from the sensors to the AE system. From the sensor to the cable trays the cable is placed in conduit to protect from potential damage around the vessel. The cables are then routed in an existing cable tray going to the control room.
Figure 5 AE Sensor and Waveguide Assembly Besides data from the AE sensors, five process parameters, four temperatures and one pressure, are recorded by the AE system. The temperature and pressure signals are provided by the DCS via a 4-20 milliamp output. There is also an Ethernet connection to the AE system, which allows for remote monitoring of the system via Remote desktop monitoring. Engineers at Physical Acoustics Corporation access the system and interrogate it from their offices in New Jersey. Data is also transferred from the on-line system to the New Jersey location for detailed analysis. Figure 5 is a block diagram of the system configuration.
99 AMMONIA TECHNICAL MANUAL2009
System Schematic
AE sensors, strain gaugesThermocouples, etc.
Sensor Highway II
INTERNET
Control PCSecure Web server
Owner access via internet
UPS
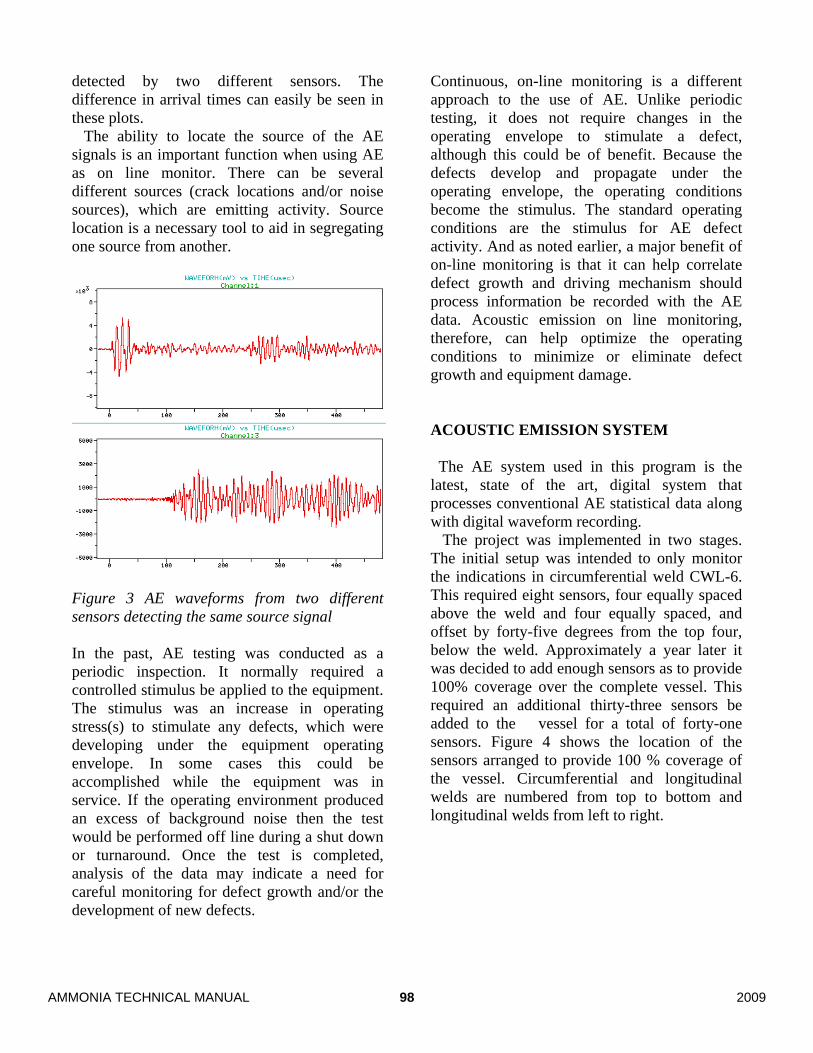
Figure 6 System Diagram
AE SYSTEM OPERATION The AE system is a Physical Acoustic Corporation (PAC) Model DiSP-56. The AE sensors are high frequency sensors with an integral preamplifier, which can drive over a thousand feet of coaxial cable. The Windows XP operating system allows for the instrument to be connected to the internet and remote access is provided through the Remote Desktop function. The system collects data from the forty-one AE sensors and the DCS parameters. It automatically stores them on the internal hard drive. The data is also displayed locally for plant personnel to observe. Several times during the week engineers from PAC access the system to observe its operation and scan the graphs. Should a severe flaw be detected, plant personnel would be immediately notified. Once a week they download the data stored on the hard drive to their location for detailed review and analysis. A report is prepared and forwarded to appropriate plant personnel. PCS NITROGEN TRINIDAD EXPERIENCE WITH AE PCS experience on the use of the Acoustic Emission system has been mixed. During the
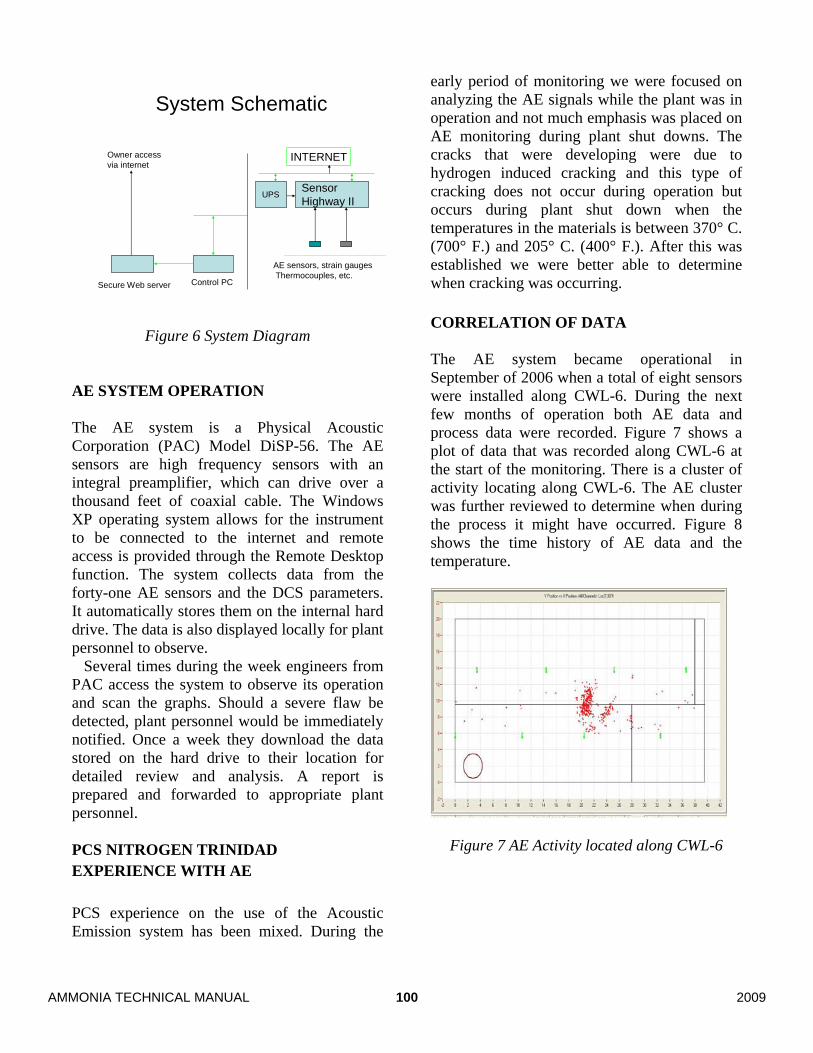
early period of monitoring we were focused on analyzing the AE signals while the plant was in operation and not much emphasis was placed on AE monitoring during plant shut downs. The cracks that were developing were due to hydrogen induced cracking and this type of cracking does not occur during operation but occurs during plant shut down when the temperatures in the materials is between 370° C. (700° F.) and 205° C. (400° F.). After this was established we were better able to determine when cracking was occurring. CORRELATION OF DATA The AE system became operational in September of 2006 when a total of eight sensors were installed along CWL-6. During the next few months of operation both AE data and process data were recorded. Figure 7 shows a plot of data that was recorded along CWL-6 at the start of the monitoring. There is a cluster of activity locating along CWL-6. The AE cluster was further reviewed to determine when during the process it might have occurred. Figure 8 shows the time history of AE data and the temperature.
Figure 7 AE Activity located along CWL-6
100AMMONIA TECHNICAL MANUAL 2009
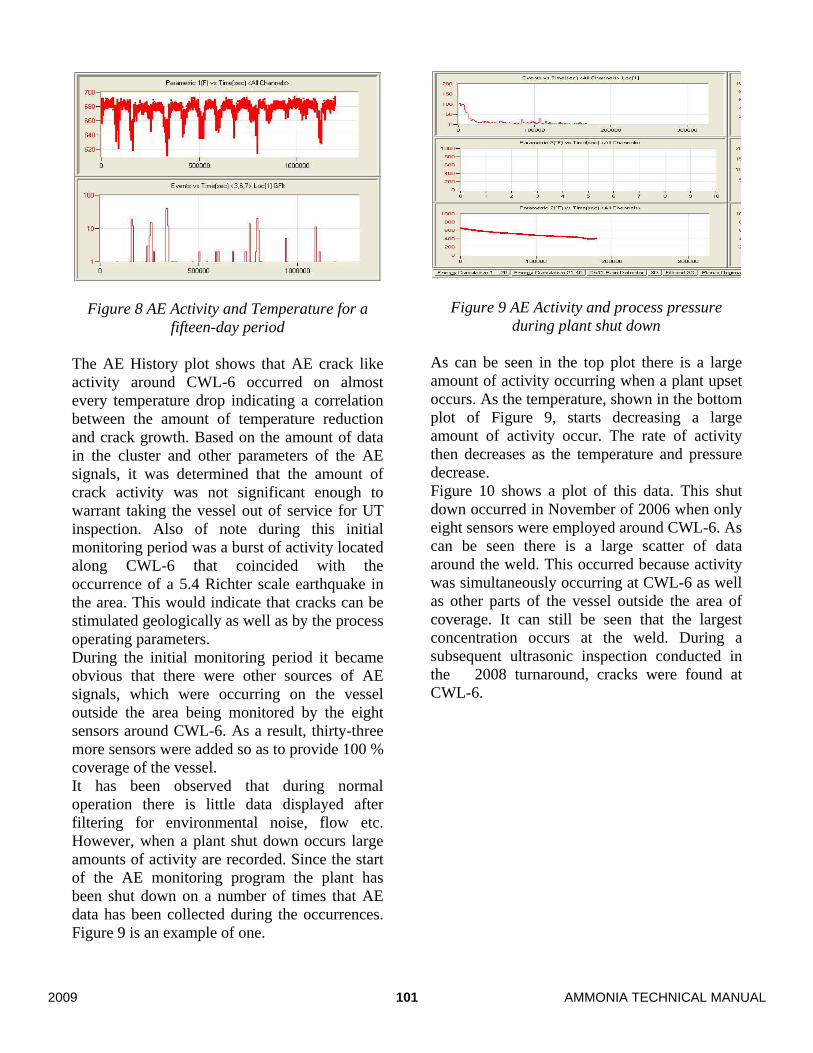
Figure 8 AE Activity and Temperature for a fifteen-day period
The AE History plot shows that AE crack like activity around CWL-6 occurred on almost every temperature drop indicating a correlation between the amount of temperature reduction and crack growth. Based on the amount of data in the cluster and other parameters of the AE signals, it was determined that the amount of crack activity was not significant enough to warrant taking the vessel out of service for UT inspection. Also of note during this initial monitoring period was a burst of activity located along CWL-6 that coincided with the occurrence of a 5.4 Richter scale earthquake in the area. This would indicate that cracks can be stimulated geologically as well as by the process operating parameters. During the initial monitoring period it became obvious that there were other sources of AE signals, which were occurring on the vessel outside the area being monitored by the eight sensors around CWL-6. As a result, thirty-three more sensors were added so as to provide 100 % coverage of the vessel. It has been observed that during normal operation there is little data displayed after filtering for environmental noise, flow etc. However, when a plant shut down occurs large amounts of activity are recorded. Since the start of the AE monitoring program the plant has been shut down on a number of times that AE data has been collected during the occurrences. Figure 9 is an example of one.
Figure 9 AE Activity and process pressure during plant shut down
As can be seen in the top plot there is a large amount of activity occurring when a plant upset occurs. As the temperature, shown in the bottom plot of Figure 9, starts decreasing a large amount of activity occur. The rate of activity then decreases as the temperature and pressure decrease. Figure 10 shows a plot of this data. This shut down occurred in November of 2006 when only eight sensors were employed around CWL-6. As can be seen there is a large scatter of data around the weld. This occurred because activity was simultaneously occurring at CWL-6 as well as other parts of the vessel outside the area of coverage. It can still be seen that the largest concentration occurs at the weld. During a subsequent ultrasonic inspection conducted in the 2008 turnaround, cracks were found at CWL-6.
101 AMMONIA TECHNICAL MANUAL2009

Figure 10 AE Data at CWL6 during Cool-down
Portion of Plant Upset Plant shutdowns generate a significant amount of activity. The data in figure 10 is typical of a shutdown. During the next eighteen months a few more shutdowns occurred. Figure 11 shows activity that was recorded during an upset in June of 2007.
Figure 11 AE Activity during Plant Upset
The large amount of data in a short period of time produces the scatter on the vessel. However, there are noticeable concentrations of
data near CWL-3, CWL-5, CWL-6 and LWL-18 and LWL-19 Another upset occurred in February of 2008. Just as the previous upset there was a large amount of data located around the vessel. Figure 12 show the activity during the February upset.
Figure 12 AE Activity during February Upset As in the previous upset there were clusters of data in the areas of CWL-3, CWL-5, CWL-6 and LWL-18 and LWL-19. In both cases CWL-3, CWL-6 and LWL-18 and LWL-19 were more active. The June upset produced more activity overall. This is believed to be due to the fact that there was a fast decrease in temperature during the plant shutdown that produced a large amount of data. This is shown in Figure 13.
Figure 13 AE Activity and Vessel Temperature
102AMMONIA TECHNICAL MANUAL 2009
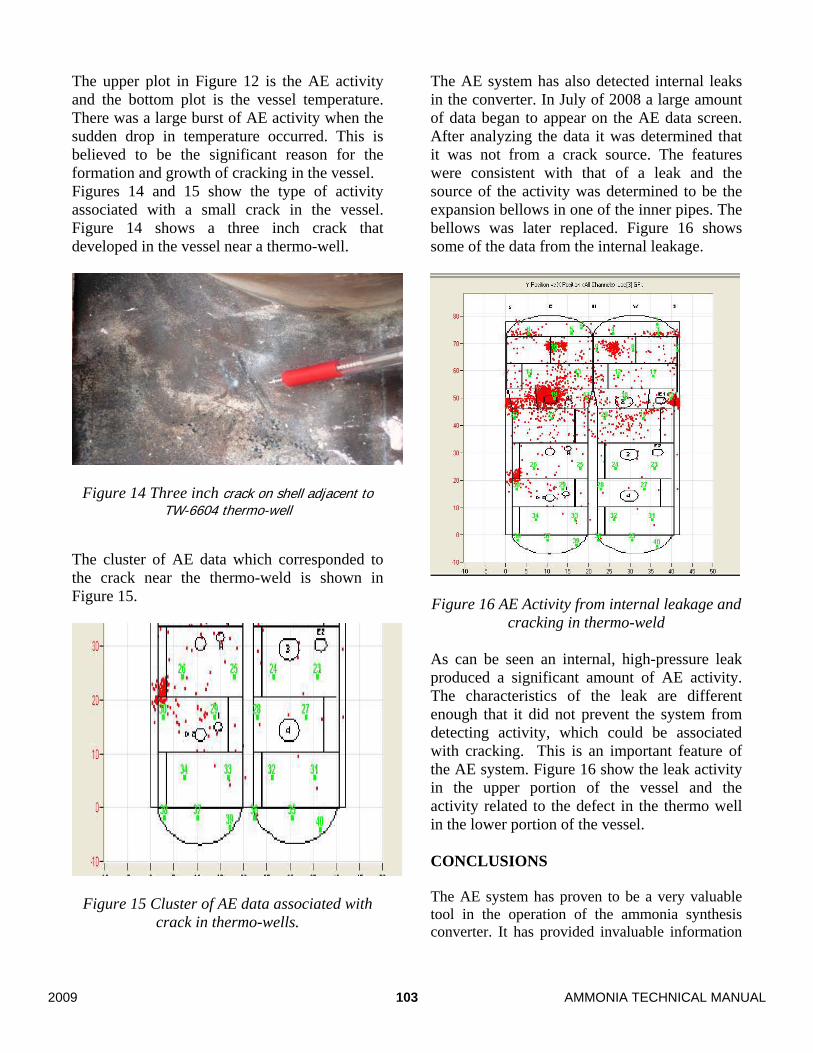
The upper plot in Figure 12 is the AE activity and the bottom plot is the vessel temperature. There was a large burst of AE activity when the sudden drop in temperature occurred. This is believed to be the significant reason for the formation and growth of cracking in the vessel. Figures 14 and 15 show the type of activity associated with a small crack in the vessel. Figure 14 shows a three inch crack that developed in the vessel near a thermo-well.
Figure 14 Three inch crack on shell adjacent to TW-6604 thermo-well
The cluster of AE data which corresponded to the crack near the thermo-weld is shown in Figure 15.
Figure 15 Cluster of AE data associated with crack in thermo-wells.
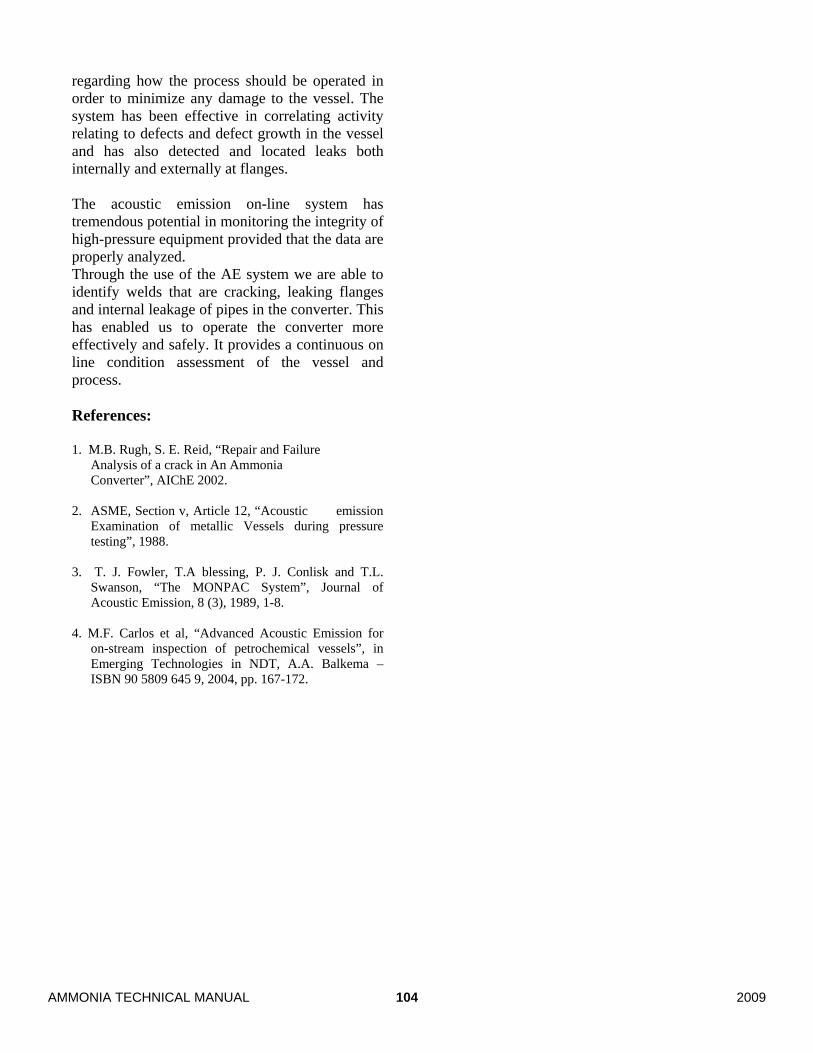
The AE system has also detected internal leaks in the converter. In July of 2008 a large amount of data began to appear on the AE data screen. After analyzing the data it was determined that it was not from a crack source. The features were consistent with that of a leak and the source of the activity was determined to be the expansion bellows in one of the inner pipes. The bellows was later replaced. Figure 16 shows some of the data from the internal leakage.
Figure 16 AE Activity from internal leakage and cracking in thermo-weld
As can be seen an internal, high-pressure leak produced a significant amount of AE activity. The characteristics of the leak are different enough that it did not prevent the system from detecting activity, which could be associated with cracking. This is an important feature of the AE system. Figure 16 show the leak activity in the upper portion of the vessel and the activity related to the defect in the thermo well in the lower portion of the vessel. CONCLUSIONS The AE system has proven to be a very valuable tool in the operation of the ammonia synthesis converter. It has provided invaluable information
103 AMMONIA TECHNICAL MANUAL2009
regarding how the process should be operated in order to minimize any damage to the vessel. The system has been effective in correlating activity relating to defects and defect growth in the vessel and has also detected and located leaks both internally and externally at flanges. The acoustic emission on-line system has tremendous potential in monitoring the integrity of high-pressure equipment provided that the data are properly analyzed. Through the use of the AE system we are able to identify welds that are cracking, leaking flanges and internal leakage of pipes in the converter. This has enabled us to operate the converter more effectively and safely. It provides a continuous on line condition assessment of the vessel and process. References: 1. M.B. Rugh, S. E. Reid, “Repair and Failure
Analysis of a crack in An Ammonia Converter”, AIChE 2002.
2. ASME, Section v, Article 12, “Acoustic emission Examination of metallic Vessels during pressure testing”, 1988.
3. T. J. Fowler, T.A blessing, P. J. Conlisk and T.L.
Swanson, “The MONPAC System”, Journal of Acoustic Emission, 8 (3), 1989, 1-8.
4. M.F. Carlos et al, “Advanced Acoustic Emission for
on-stream inspection of petrochemical vessels”, in Emerging Technologies in NDT, A.A. Balkema – ISBN 90 5809 645 9, 2004, pp. 167-172.
104AMMONIA TECHNICAL MANUAL 2009