acoustic emission characteristics of shale acoustic... · 2 acoustic emission characteristics of...
TRANSCRIPT

1
ACOUSTIC EMISSION CHARACTERISTICS OF SHALE
* Z. Moradian, Q. B. Li, S. Morgan, B. Gonçalves da Silva, J. T. Germaine, H. H. EinsteinDepartment of Civil and Environmental Engineering
Massachusetts Institute of Technology (MIT) 77 Massachusetts Avenue Cambridge, MA, 02139
(*Corresponding author: [email protected])
ISRM Congress 2015 Proceedings - Int’l Symposium on Rock Mechanics - ISBN: 978-1-926872-25-4
2
ACOUSTIC EMISSION CHARACTERISTICS OF SHALE
ABSTRACT
Shale gas and oil production has grown rapidly in recent years, and consequently there are increasing demands to understand the mechanical and microseismic properties of shale. Acoustic emission (AE) monitoring provides useful information on the fracture mechanisms of shale rocks, and provides a basis for interpreting field seismic observations. While there have been attempts for microseismic monitoring of conventional hydrocarbon reservoirs, shale presents a large number of issues that require further investigation. For this purpose, experiments were conducted to understand the characteristics of the AE waveforms propagated through Opalinus shale rock in the time and frequency domains. Frequency range, arrival time, first arrival amplitude and other parameters such as counts, duration and energy of the waves generated from artificial and natural sources in the shale specimens were detected and compared with AE characteristics of granite, a brittle rock that has been extensively investigated. The experimental tests showed that there are some important factors that influence the analyses and interpretations of seismic surveys and microseismic monitoring of shale compared to granite. One of these factors is the anisotropic behavior of shale that causes the wave to propagate with different velocities in different directions. Also bedding planes and micro-discontinuities in the shale cause attenuation of the waves. Thus the AE waveforms that arrive at the sensor are a distorted and attenuated versions of the source waveform.
KEYWORDS
Shale, Acoustic emission, Waveform, Time domain, Frequency domain, Anisotropy, Attenuation, Source Location
INTRODUCTION
Monitoring microseismic activity from hydraulic fracturing of shale provides vital information for mapping injection paths and fluid migration in order to check the effectiveness of the hydraulic fracture stimulation. Analysis of microseismic source locations can be used to identify fracture networks induced or mobilized during the hydraulic fracturing operation (Rotherd and Shapiro, 2003). On the other hand, by monitoring and assessing detected signals from hydraulic fracturing one can evaluate the induced seismic impact of the stimulation operation.
While there have been attempts to monitor microseismic events in conventional hydrocarbon reservoirs, shale presents a large number of issues that require further investigation. For this purpose, experiments were conducted on Opalinus shale to understand its acoustic emission (AE) characteristics in the time and frequency domains.
SAMPLE PREPARATION AND TESTING SETUP
Opalinus shale is a clay based shale in the Dogger formation occurring in the Jura Mountains and other
areas in Switzerland, France and Southern Germany. Its mineral composition and material properties can vary from location to location. Therefore, Opalinus shale from the Mont Terri site may be different from other Opalinus shale samples. Opalinus shale is a natural material with many natural flaws and heterogeneities that requires very careful specimen preparation.
In order to cut Opalinus shale without destroying it, all cutting techniques needed to be dry. The edges of the specimens were cut with a traditional tabletop band-saw with specialized carbide-tipped saw blades. The Opalinus shale samples were prepared from the horizontal bore cores from the Mont Terri Rock Laboratory in Switzerland. The bedding planes were approximately 30 degrees to the major axis of the core (Figure 1). The specimens were cut to fit within the cross-section of the core in order to maximize the total number of specimens that could be tested. Also cutting the specimens within the cross-section of the core allows one to rotate the bedding plane orientation (Morgan & Einstein, 2014).
ISRM Congress 2015 Proceedings - Int’l Symposium on Rock Mechanics - ISBN: 978-1-926872-25-4

3
Figure 1: Opalinus shale cores. Horizontal core samples obtained from the Mont Terri Underground Laboratory.
Bedding planes are approximately 30 degrees from the major axis of the core. Specimens were cut to fit within the cross section of the core to maximize the number of specimens.
The granite specimens were cut from blocks of Barre granite from a quarry of Adam’s Granite Company
Inc in Vermont. Tables 1 and 2 present the mechanical properties of the Opalinus shale and Barre granite specimens. Figure 2a shows the specimens prepared for this study.
Table 1: Material and mechanical properties of Opalinus shale (Wenk et al., 2008, Bock, 2009)
Properties Perpendicular to Bedding
Parallel to Bedding
Quartz Content 18 % Clay Content 60-68 % Carbonate Content 10-19 % Porosity 13.7 Water Content 6.4 Uniaxial Compressive Strength 14.9 MPa 11.6 MPa Young’s Modulus 1.5 GPa 3.8 GPa Poisson’s Ratio 0.25 0.35 Fracture Toughness, K1C 0.53 MN/m1.5 0.12 MN/m1.5
Table 2: Material and mechanical properties of Barre Granite (Goldsmith et al., 1976, Miller & Einstein, 2008)
Plagioclase 36% Quartz 32% K-Feldspar 18% Biotite 8% Muscovite 3% Granophyres Minerals 3% Young’s Modulus (GPa) 19.2 Uniaxial Compressive Strength (MPa) 151 Tensile Strength (MPa), Dog-Boned Direct Quasi-Static Test 5.08-10.65
The AE system used for this study contains four PCI-2 cards with 8 micro30S sensors from Physical
Acoustic Corporation (PAC). The sensors have a fairly wide band frequency of 150-400 KHz with a Resonant Frequency (Ref V/µbar) of 225 KHz, so they can be used for frequency analysis purposes. The pre-amplification was set at 40 dB and the threshold passing limit at 35 dB.
ISRM Congress 2015 Proceedings - Int’l Symposium on Rock Mechanics - ISBN: 978-1-926872-25-4

4
WAVEFORM SHAPE AND FREQUENCY RANGE
In order to have an insight into the response of shale, waveforms and power spectra of the detected
signals were plotted for different source mechanisms. Then these plots were compared to the responses in granite. The source mechanisms are pencil lead break (PLB), ball drop (BD) and ball on pin (BOP). These mechanisms are shown in Figure 2b. PLB is widely used as a reproducible source in AE testing. The lead of a pencil is pressed against the surface of the specimen until the lead breaks. In the BD experiments, a steel ball, 3.18 mm diameter, is dropped on the surface of the specimen from a height of 100 mm. A straw was used to assure the vertical path. In BOP experiment, a pin was attached to the end of the straw and the ball was dropped on the pin from a height of 100 mm.
(a) (b)
Figure 2: a) Shale and granite specimens, the dashed lines show the bedding direction in shale, b) Pencil lead break (PLB), ball drop (BD) and ball on pin (BOP) tests.
Figures 3, 4 and 5 represent the waveform and power spectrum of each source mechanism for shale and
granite. The sampling rate of the AE data acquisition was set to 5 MSPS and the registered size of the signals is 10 K which gives 2ms time length (Time length = sample size / sampling rate). The registration was pre-triggered at 256 µs in order to have better view of the signal arrival time.
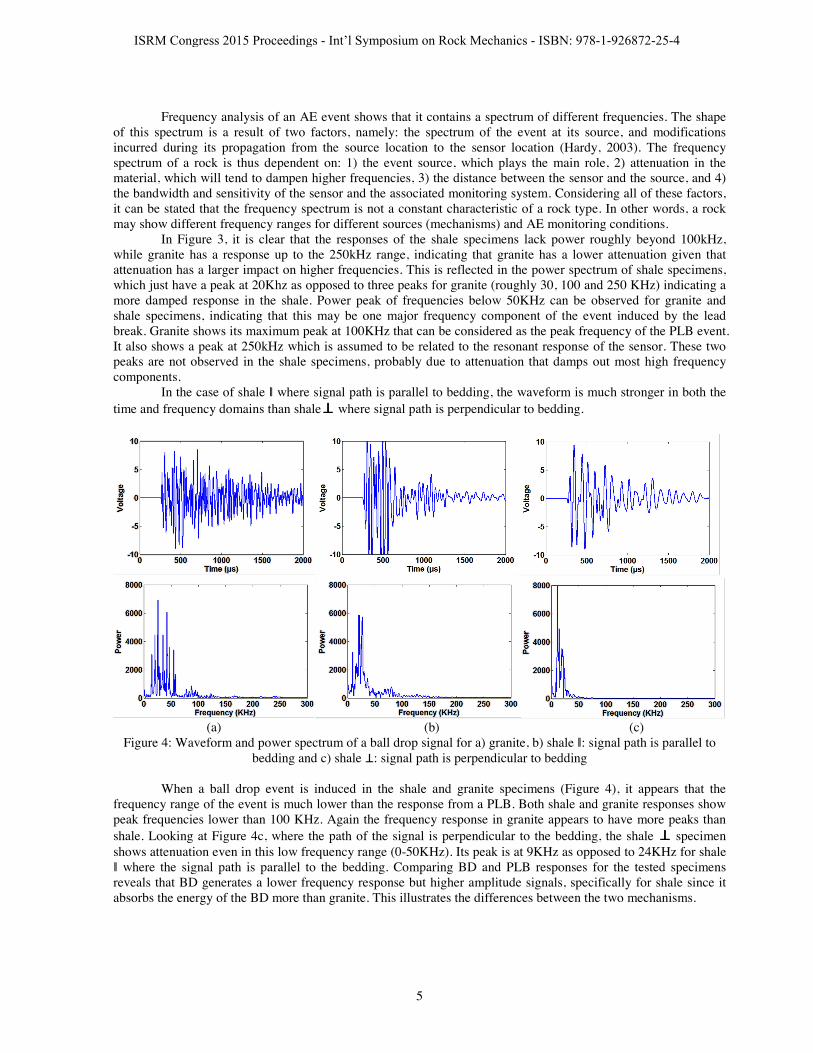
(a) (b) (c)
Figure 3: Waveform and power spectrum of a PLB signal for a) granite, b) shale ǁ: signal path is parallel to bedding and c) shale !!!!: signal path is perpendicular to bedding
ISRM Congress 2015 Proceedings - Int’l Symposium on Rock Mechanics - ISBN: 978-1-926872-25-4
5
Frequency analysis of an AE event shows that it contains a spectrum of different frequencies. The shape of this spectrum is a result of two factors, namely: the spectrum of the event at its source, and modifications incurred during its propagation from the source location to the sensor location (Hardy, 2003). The frequency spectrum of a rock is thus dependent on: 1) the event source, which plays the main role, 2) attenuation in the material, which will tend to dampen higher frequencies, 3) the distance between the sensor and the source, and 4) the bandwidth and sensitivity of the sensor and the associated monitoring system. Considering all of these factors, it can be stated that the frequency spectrum is not a constant characteristic of a rock type. In other words, a rock may show different frequency ranges for different sources (mechanisms) and AE monitoring conditions.
In Figure 3, it is clear that the responses of the shale specimens lack power roughly beyond 100kHz, while granite has a response up to the 250kHz range, indicating that granite has a lower attenuation given that attenuation has a larger impact on higher frequencies. This is reflected in the power spectrum of shale specimens, which just have a peak at 20Khz as opposed to three peaks for granite (roughly 30, 100 and 250 KHz) indicating a more damped response in the shale. Power peak of frequencies below 50KHz can be observed for granite and shale specimens, indicating that this may be one major frequency component of the event induced by the lead break. Granite shows its maximum peak at 100KHz that can be considered as the peak frequency of the PLB event. It also shows a peak at 250kHz which is assumed to be related to the resonant response of the sensor. These two peaks are not observed in the shale specimens, probably due to attenuation that damps out most high frequency components.
In the case of shale ǁ where signal path is parallel to bedding, the waveform is much stronger in both the time and frequency domains than shale!!!! where signal path is perpendicular to bedding.
(a) (b) (c)
Figure 4: Waveform and power spectrum of a ball drop signal for a) granite, b) shale ǁ: signal path is parallel to bedding and c) shale !: signal path is perpendicular to bedding
When a ball drop event is induced in the shale and granite specimens (Figure 4), it appears that the
frequency range of the event is much lower than the response from a PLB. Both shale and granite responses show peak frequencies lower than 100 KHz. Again the frequency response in granite appears to have more peaks than shale. Looking at Figure 4c, where the path of the signal is perpendicular to the bedding, the shale !!!! specimen shows attenuation even in this low frequency range (0-50KHz). Its peak is at 9KHz as opposed to 24KHz for shale ǁ where the signal path is parallel to the bedding. Comparing BD and PLB responses for the tested specimens reveals that BD generates a lower frequency response but higher amplitude signals, specifically for shale since it absorbs the energy of the BD more than granite. This illustrates the differences between the two mechanisms.
ISRM Congress 2015 Proceedings - Int’l Symposium on Rock Mechanics - ISBN: 978-1-926872-25-4
6
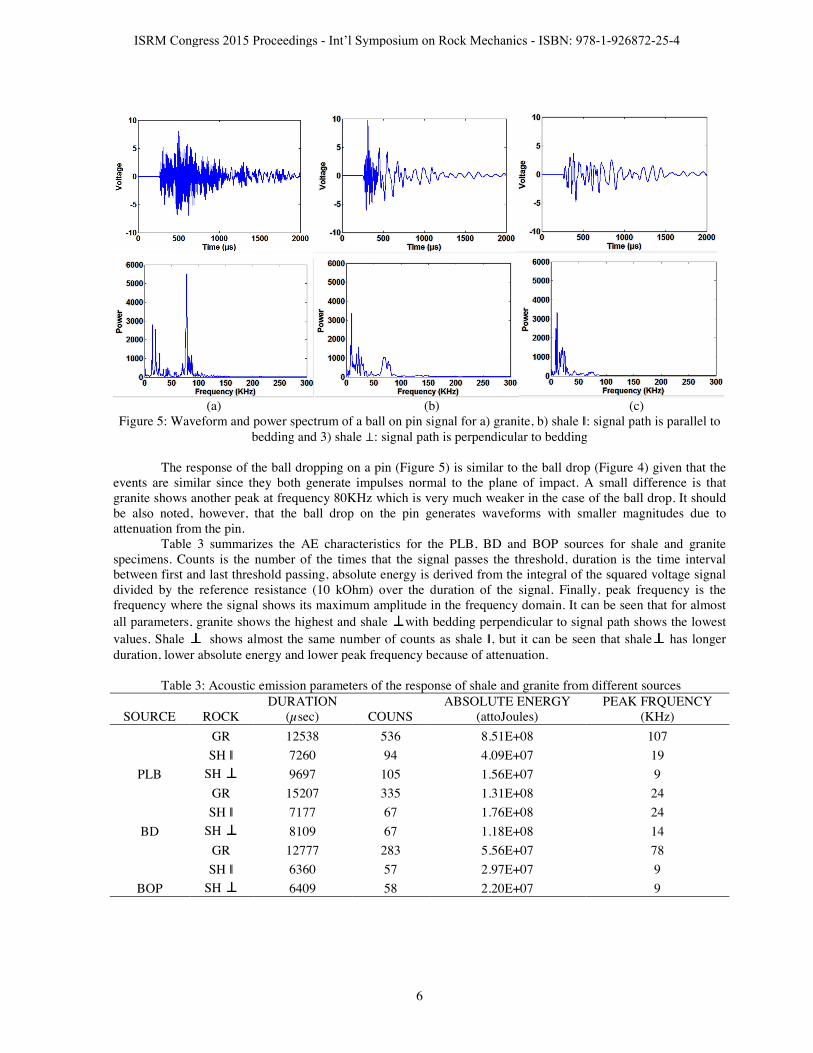
(a) (b) (c) Figure 5: Waveform and power spectrum of a ball on pin signal for a) granite, b) shale ǁ: signal path is parallel to
bedding and 3) shale !: signal path is perpendicular to bedding The response of the ball dropping on a pin (Figure 5) is similar to the ball drop (Figure 4) given that the
events are similar since they both generate impulses normal to the plane of impact. A small difference is that granite shows another peak at frequency 80KHz which is very much weaker in the case of the ball drop. It should be also noted, however, that the ball drop on the pin generates waveforms with smaller magnitudes due to attenuation from the pin.
Table 3 summarizes the AE characteristics for the PLB, BD and BOP sources for shale and granite specimens. Counts is the number of the times that the signal passes the threshold, duration is the time interval between first and last threshold passing, absolute energy is derived from the integral of the squared voltage signal divided by the reference resistance (10 kOhm) over the duration of the signal. Finally, peak frequency is the frequency where the signal shows its maximum amplitude in the frequency domain. It can be seen that for almost all parameters, granite shows the highest and shale !!!!with bedding perpendicular to signal path shows the lowest values. Shale !!!!" shows almost the same number of counts as shale ǁ, but it can be seen that shale!!!! has longer duration, lower absolute energy and lower peak frequency because of attenuation.
Table 3: Acoustic emission parameters of the response of shale and granite from different sources
SOURCE ROCK DURATION
(µsec) COUNS ABSOLUTE ENERGY
(attoJoules) PEAK FRQUENCY
(KHz)
PLB
GR 12538 536 8.51E+08 107 SH ǁ 7260 94 4.09E+07 19
SH !!!! 9697 105 1.56E+07 9
BD
GR 15207 335 1.31E+08 24 SH ǁ 7177 67 1.76E+08 24
SH !!!! 8109 67 1.18E+08 14
BOP
GR 12777 283 5.56E+07 78 SH ǁ 6360 57 2.97E+07 9
SH !!!! 6409 58 2.20E+07 9
ISRM Congress 2015 Proceedings - Int’l Symposium on Rock Mechanics - ISBN: 978-1-926872-25-4
7
ATTENUATION
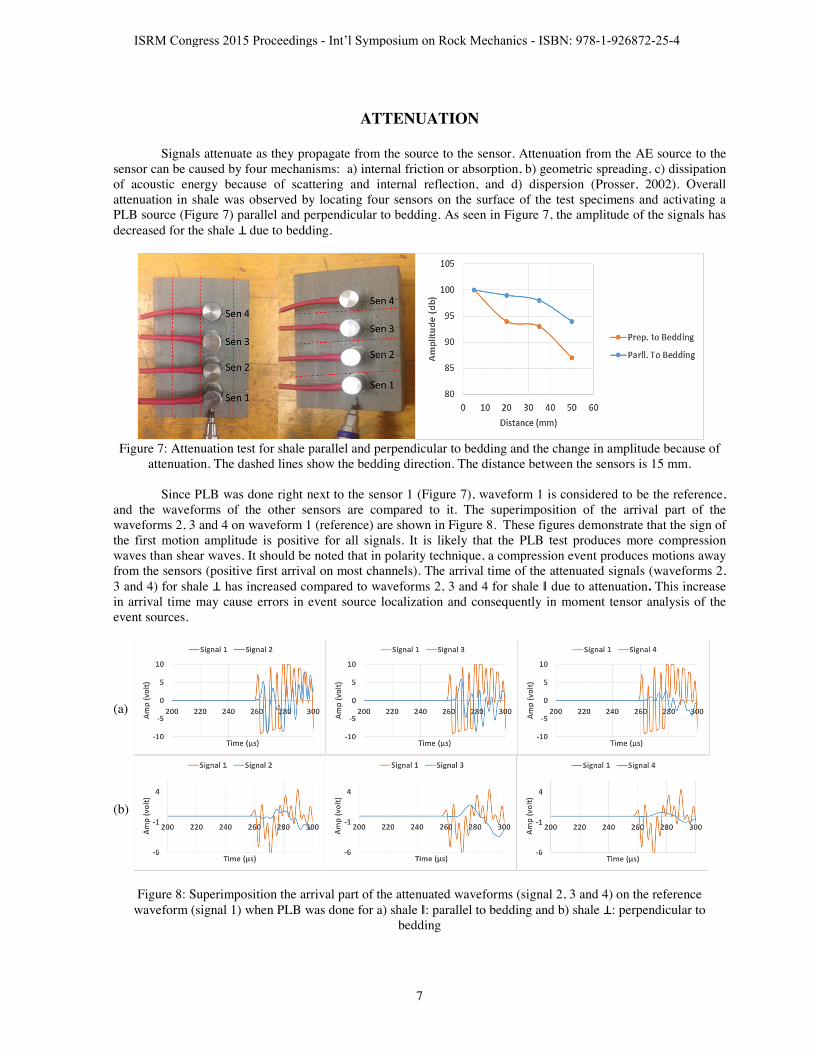
Signals attenuate as they propagate from the source to the sensor. Attenuation from the AE source to the sensor can be caused by four mechanisms: a) internal friction or absorption, b) geometric spreading, c) dissipation of acoustic energy because of scattering and internal reflection, and d) dispersion (Prosser, 2002). Overall attenuation in shale was observed by locating four sensors on the surface of the test specimens and activating a PLB source (Figure 7) parallel and perpendicular to bedding. As seen in Figure 7, the amplitude of the signals has decreased for the shale !"due to bedding.
Figure 7: Attenuation test for shale parallel and perpendicular to bedding and the change in amplitude because of
attenuation. The dashed lines show the bedding direction. The distance between the sensors is 15 mm. Since PLB was done right next to the sensor 1 (Figure 7), waveform 1 is considered to be the reference,
and the waveforms of the other sensors are compared to it. The superimposition of the arrival part of the waveforms 2, 3 and 4 on waveform 1 (reference) are shown in Figure 8. These figures demonstrate that the sign of the first motion amplitude is positive for all signals. It is likely that the PLB test produces more compression waves than shear waves. It should be noted that in polarity technique, a compression event produces motions away from the sensors (positive first arrival on most channels). The arrival time of the attenuated signals (waveforms 2, 3 and 4) for shale ! has increased compared to waveforms 2, 3 and 4 for shale ǁ due to attenuation. This increase in arrival time may cause errors in event source localization and consequently in moment tensor analysis of the event sources.
(a)
(b)
Figure 8: Superimposition the arrival part of the attenuated waveforms (signal 2, 3 and 4) on the reference waveform (signal 1) when PLB was done for a) shale ǁ: parallel to bedding and b) shale !: perpendicular to
bedding
ISRM Congress 2015 Proceedings - Int’l Symposium on Rock Mechanics - ISBN: 978-1-926872-25-4

8
Se
nsor
1
Sens
or 2
Sens
or 3
Sens
or 4
(a) (b) Figure 9: a) Waveforms and b) power spectra of a PLB test for showing the attenuation of shale ǁ when PLB was
done parallel to bedding. Waveforms and power spectra of sensors 2, 3 and 4 have been changed because of attenuation.
ISRM Congress 2015 Proceedings - Int’l Symposium on Rock Mechanics - ISBN: 978-1-926872-25-4

9
Sens
or 1
Sens
or 2
Sens
or 3
Sens
or 4
(a) (b) Figure 10: a) waveforms and b) power spectra of a PLB test for showing the attenuation of shale !"when PLB was
done perpendicular to bedding.
Figures 9 and 10 show how the attenuation, caused by bedding, has changed the waveform shapes and power spectra of the signal from sensor 1 to sensor 4. It should be noted that some attenuation has occurred for the case of shale ǁ, which may be caused by other heterogeneities such as grains or micro fissures.
ISRM Congress 2015 Proceedings - Int’l Symposium on Rock Mechanics - ISBN: 978-1-926872-25-4
10
AE LOCALIZATION ACCURACY AND PRECISION
The traditional localization techniques used in AE analysis usually require a homogeneous and isotropic medium to determine location of source events using arrival time and wave propagation velocity. In practice however, the materials being monitored are heterogeneous and anisotropic. This is due to heterogeneities of the microstructure (e.g. grains and pores), bedding planes and dynamic material changes caused by the damage mechanism itself (e.g. micro crack growth). These heterogeneities usually limit the accuracy and precision of traditional localization algorithms. Accuracy is how close a measured quantity is to the actual (true) quantity and precision is how close the measured quantities are to each other. Shale is among those materials that can contain all the above mentioned inhomogeneities.
The wave propagation velocities in the shale specimens were measured in different directions to the bedding planes. It was observed that the average velocity perpendicular to the bedding direction is 1050 m/s and parallel to the bedding is 3000 m/s. The range of the p-wave velocity parallel to the bedding direction is 2600-3100 m/s, producing a variability of 500/2850=18% (variability=range/average) which is lower than the variability for the velocity perpendicular to bedding direction of 900-1200 m/s (300/1050) =29%. This anisotropy in velocity causes a large amount of error in event source locations, if just one constant velocity is considered in calculations.
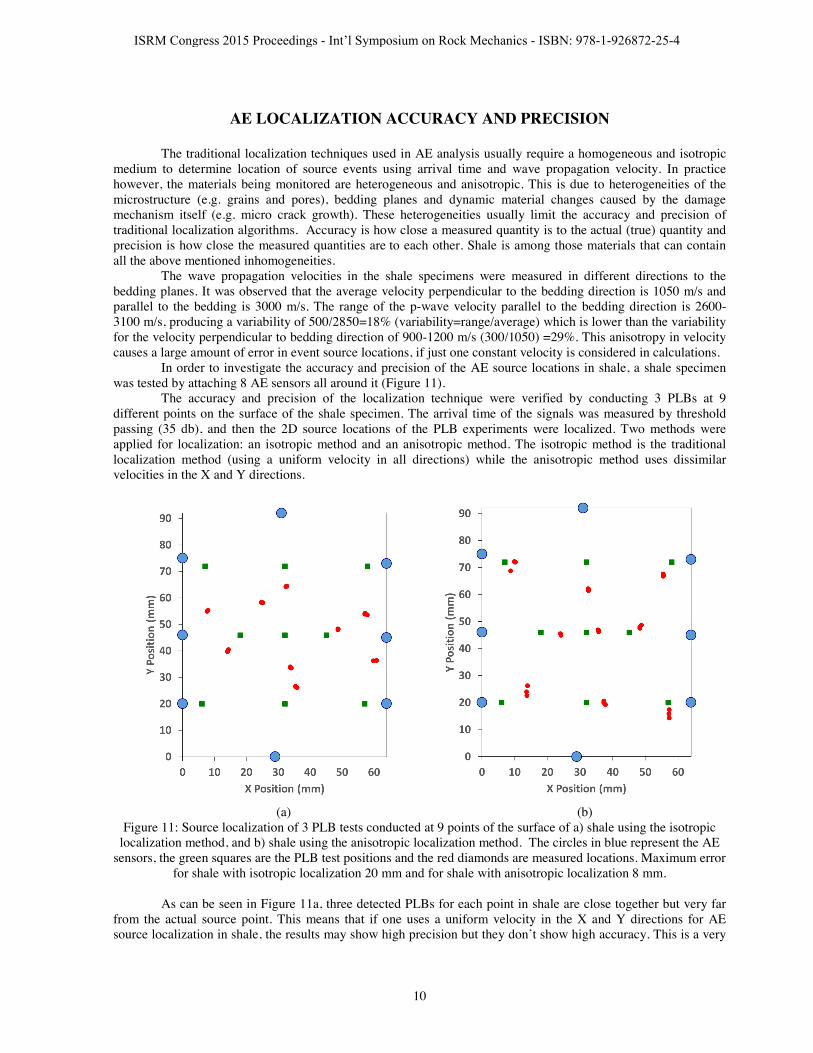
In order to investigate the accuracy and precision of the AE source locations in shale, a shale specimen was tested by attaching 8 AE sensors all around it (Figure 11).
The accuracy and precision of the localization technique were verified by conducting 3 PLBs at 9 different points on the surface of the shale specimen. The arrival time of the signals was measured by threshold passing (35 db), and then the 2D source locations of the PLB experiments were localized. Two methods were applied for localization: an isotropic method and an anisotropic method. The isotropic method is the traditional localization method (using a uniform velocity in all directions) while the anisotropic method uses dissimilar velocities in the X and Y directions.
(a) (b)
Figure 11: Source localization of 3 PLB tests conducted at 9 points of the surface of a) shale using the isotropic localization method, and b) shale using the anisotropic localization method. The circles in blue represent the AE
sensors, the green squares are the PLB test positions and the red diamonds are measured locations. Maximum error for shale with isotropic localization 20 mm and for shale with anisotropic localization 8 mm.
As can be seen in Figure 11a, three detected PLBs for each point in shale are close together but very far
from the actual source point. This means that if one uses a uniform velocity in the X and Y directions for AE source localization in shale, the results may show high precision but they don’t show high accuracy. This is a very
ISRM Congress 2015 Proceedings - Int’l Symposium on Rock Mechanics - ISBN: 978-1-926872-25-4

11
important lesson that must be taken into account when analysing any source locations (including for instance hydraulic fracturing), because this may lead to misinterpretation of the hydraulic fracture path.
One solution to overcome this discrepancy is to use anisotropic localization methods using different velocities in the X, Y and Z directions for 3D source localization or in X and Y directions for 2D source localization. Figure 11b shows how the accuracy of the location has been considerably increased by using the anisotropic localization technique which uses dissimilar velocities in the X and Y directions.
It should be noted that, although the anisotropic method increases the accuracy of the localization, especially for the points close to the center of the specimen, the accuracy is still low. As discussed in section earlier in this paper, attenuation of the signals increases the arrival time. As a consequence, the accuracy of the localization decreases because the observed arrival time is much higher than the true value. The threshold passing technique for source location also causes some error in localization results. The authors are working on developing an in-house program for localization by considering better arrival time detection techniques.
CONCLUSIONS
Acoustic emission signals of shale in two bedding configurations, parallel and perpendicular to the signal path, were compared to granite. These results revealed some facts about the effect of bedding and other heterogeneities on acoustic emission characteristics of shale. It was observed that:
The frequency range of the signals passed through Opalinus shale is lower than 100KHz for all source mechanisms. It means that because of attenuation, this shale does not pass signals with frequencies higher than 100KHz. In fact in most cases the main frequency components of shale are lower than 50KHz.
Bedding planes play an important role in acoustic emission characteristics of this shale. They cause a significant amount of attenuation in AE signals and they delay the arrival time of the signal. This causes errors in AE parameters and the source localization.
Anisotropic behavior of Opalinus shale produces different velocities in the X, Y and Z directions. This anisotropy must be considered when AE source localization is carried out. An anisotropic localization technique will increase both precision and accuracy of the localization of hydraulic fracturing paths in shale.
A proper localization technique that takes into account the real arrival time of the signals must be considered when dealing with shale. The threshold passing technique loses its applicability when the amplitude of the signals decreases due to attenuation. Because of attenuation, the arrival part of the signal is embedded into the background noise. Pre-amplification of the signals may help but it also saturates the signals of the sensors close to the event.
REFERENCES
Bock, H. (2009). Mont Terri Project. RA experiment: Updated Review of the Rock Mechanics Properties of the Opalinus Clay of the Mont Terri URL based on Laboratory and Field Testing. Q + S Consult, Technical Report TR 2008-04.
Goldsmith, W., Sackman, J.L., & Ewert, C. (1976). Static and dynamic fracture strength of Barre Granite. Int J Rock Mech Min Sci Geomech Abstr, 13, 303–309
Hardy, H. R. (2003). Acoustic Emission/Microseismic Activity: Volume 1: Principles, Techniques and Geotechnical Applications. CRC Press, 292 pages
Miller, J.T., & Einstein, H.H. (2008). Crack coalescence tests on granite. In: The 42nd U.S. Rock mechanics symposium (USRMS), June 29–July 2, 2008, San Francisco
Morgan, S.P., & Einstein, H.H. (2014). The Effect of Bedding Plane Orientation on Crack Propagation and Coalescence in Shale. 48th US Rock Mechanics / Geomechanics Symposium, Minneapolis, MN, USA, 1-4 June 2014.
Prosser, W. H. (2002). Acoustic Emission, Chapter 6, Nondestructive Evaluation: Theory, Techniques, and Applications, Peter J. Shull, CRC Press, 369-446.
Rothert, E., & Shapiro S. A. (2003). Microseismic monitoring of borehole fluid injections: Data modeling and inversion for hydraulic properties of rocks, Gepphysics, 68(2), 685-689
ISRM Congress 2015 Proceedings - Int’l Symposium on Rock Mechanics - ISBN: 978-1-926872-25-4

12
Wenk, H. R., Voltolini, M., Mazurek, M., Van Loon, L.R., & Vinsot, A. (2008). Preferred Orientations and Anisotropy in Shales: Callovo- Oxfordian Shale (France) and Opalinus Clay (Switzerland). The Clay Minerals Society, 56(3), 285-306.
ISRM Congress 2015 Proceedings - Int’l Symposium on Rock Mechanics - ISBN: 978-1-926872-25-4