acoustic design of swimming halls - teknisk … · the master thesis considers acoustic design of...
TRANSCRIPT

Master’s DissertationEngineering
Acoustics
MALIN HALL Report TV
BA-5048
MA
LIN H
ALL A
CO
USTIC
DESIG
N O
F SWIM
MIN
G H
ALLS
ACOUSTIC DESIGNOF SWIMMING HALLS
TVBA-5048HO.indd 1TVBA-5048HO.indd 1 2016-08-03 17:48:532016-08-03 17:48:53

DEPARTMENT OF CONSTRUCTION SCIENCES
DIVISION OF ENGINEERING ACOUSTICS
ISRN LUTVDG/TVBA--16/5048--SE (1-123) | ISSN 0281-8477
MASTER’S DISSERTATION
Supervisor: DELPHINE BARD, Assoc. Prof., Div. of Engineering Acoustics, LTH, Lund.
Examiner: Professor ERIK SERRANO, Div. of Structural Mechanics, LTH, Lund.
Copyright © 2016 by Division of Engineering Acoustics,Faculty of Engineering LTH, Lund University, Sweden.
Printed by Media-Tryck LU, Lund, Sweden, July 2016 (Pl).
For information, address:Division of Engineering Acoustics,
Faculty of Engineering LTH, Lund University, Box 118, SE-221 00 Lund, Sweden.
Homepage: www.akustik.lth.se
MALIN HALL
ACOUSTIC DESIGN OF SWIMMING HALLS


i
Abstract
The Master thesis considers acoustic design of swimming halls. Focus is put into design
solutions affecting the acoustic environment such as walls, absorbents and shape. The basis is
gained from literature studies and new information achieved specific for the thesis.
Swimming halls are built in a certain way that makes a good acoustic environment hard to
achieve. The construction consists of hard surfaces and with large volume which creates a loud
environment with lot of echoes. The safety aspect may be harmed by this and it can also cause
health problems.
The problem is that acoustic solutions are difficult to apply to swimming halls due to climate
and function demands, for example the lower parts of the walls being exposed to water and
contact. One problem is that acousticians are consulted at a later stage in the project where
available solutions are more limited. The acoustic influence is getting more prioritized
nowadays which is important in order to achieve a desired acoustic environment.
During the thesis persons with great expertise in areas regarding construction of swimming
halls, both acousticians and other professionals, are interviewed. Visitors and employees in
swimming halls have been consulted with questionnaires and the subjective part of acoustics is
gained. Measurements in Hylliebadet in Malmö have been performed as well as simulations of
a swimming hall in two versions. Parameters such as reverberation time, sound pressure level,
speech intelligibility etc. are investigated as well as the subjective opinion on the acoustic
environment in swimming halls.
The study presents results showing that the recommended reverberation time is achieved for
new swimming halls with absorbents placed on the ceiling and on the walls. It also shows that
the acoustic environment is improved by tilting a wall. The background noise is a part of the
problem and to reduce this is an important aspect. The speech intelligibility is important for
safety reasons and a sufficient level seems hard to achieve. The visitors are satisfied with the
environment but the employees are exposed to a work environment that needs to be improved.
Solutions suggested are primarily an addition of absorbents, lower ceiling height and one tilted
wall. Screens may be useful for educational purposes and water as a sound source should be
further investigated. Drains for example causes high background noise and more quiet solutions
would improve the acoustic environment and reduce the risk that visitors speak even louder,
which creates even more sound.
The tools to achieve this are to include an acoustician in the early stage of the project. When
acoustic solutions can be suggested before the design is determined the outcome is better and
the cost lower. It also avoids the risk for later alterations. The team working with the swimming
hall project should have experience from swimming halls and share this. Collaboration between
acousticians and architects creates better solutions and reduces the risk for undesired
compromises.


iii
Sammanfattning
Det här examensarbetet behandlar den akustiska utformningen av simhallar. Fokus ligger på de
lösningar som påverkar akustiken, så som väggar, absorbenter och utformningen. Grunden till
arbetet är baserat på befintlig litteratur och ny information framtaget för arbetet.
Simhallar är en svår akustisk lokal där många hårda ytor och stora volymer försvårar. Detta ger
en ljudmiljö med hög ljudnivå och långvariga reflektioner. Säkerhetsaspekten kan bli försämrad
på grund av detta. Dessutom kan en dålig ljudmiljö leda till hälsorisker.
Problemet är att akustiska lösningar är svåra att applicera på simhallar, mycket på grund av
klimatet och funktionskraven. Ett problem är att akustiker ofta tillfrågas i ett senare skede då
utformningen redan är fastställd vilket begränsar möjligheterna. Akustiken blir mer och mer
prioriterat och detta är viktigt för att uppnå en önskad ljudmiljö.
Under arbetes gång har kunniga personer tillfrågats och deras kunskap och erfarenhet är en
viktig del av underlaget för slutsatsen. Detta gjordes via intervjuer. Även enkäter har använts
där åsikter från besökare och anställda har kartlagts vilket inkluderar den subjektiva aspekten
av akustik. Egna mätningar har utförts på Hylliebadet i Malmö och utformningen av simhallen
har efterliknats och generaliserats för simuleringar. Två olika utformningar av simhall har
simulerats för att undersöka skillnaden. Resultaten är grundläggande för slutsatsen. Parametrar
som efterklangstid, ljudtrycksnivå, taluppfattbarhet med mera är undersökta tillsammans med
den subjektiva upplevelsen av ljudmiljön i simhallar.
Studien presenterar resultat som visar på att de rekommenderade efterklangstiderna uppnås för
nya simhallar med absorbenter i tak och på väggar. Att luta en vägg visar sig vara en förbättring.
Bakgrundsnivån är en del av problemet och att reducera detta är en viktig del av lösningen för
att uppnå god ljudmiljö. Taluppfattbarhet är viktigt för säkerhetsaspekten och resultaten visar
att det är svårt att uppnå en tillräckligt god nivå. Besökarna är nöjda med ljudmiljön men de
anställda är utsatta för en arbetsmiljö som behöver förbättring.
Föreslagna lösningar är framför allt absorbenter, låg takhöjd och en lutade vägg. Inlärnings-
situationen kan förbättras med avskärmning och vatten som ljudkälla bör studeras vidare.
Skvalprännorna ger till exempel upphov till höga bakgrundsnivåer och tystare lösningar skulle
förbättra ljudmiljön och reducera risken att besökarna höjer rösten för att överrösta och på så
sätt ökar ljudnivån ytterligare.
Verktygen för att uppnå detta är att tillfråga en akustiker tidigt i projektet. När akustiska
lösningar kan föreslås innan utformningen är bestämd kommer utfallet bli bättre och kostnaden
lägre. Då undviks också risken för behov av senare åtgärder. De som arbetar med
simhallsprojektet bör ha erfarenhet från tidigare simhallar och dela denna för bästa resultat.
Samarbete mellan akustiker och arkitekter skapar bättre lösningar och minskar risken för att
oönskade kompromisser uppstår.

v
Acknowledgments
This Master thesis is a part of the civil engineer program at the University of Lund and is the
final work of 30 credits. The work is performed at and in cooperation with ÅF Sound and
Vibration and for the division of Engineering Acoustics at LTH during the first semester during
2016.
During the process with the thesis support and knowledge from LTH and ÅF Infrastructure has
been highly appreciated. My supervisor Delphine Bard at LTH should have a big gratitude for
guiding, input and support. I want to thank all the people at Sound and vibration at ÅF for
helping me with the thesis with everything from measurement equipment and expertise to
comradely support.
Furthermore, I want to thank all the persons I got the opportunity to meet and interview. I also
want to express my gratitude to the employees at Hylliebadet and Kockums Fritid in Malmö
for helping me execute my thesis and to the people who took the time to answer my
questionnaires.
I also want to thank friends and family for their support.
Lund the 20th of May 2016
Malin Hall


vii
List of terms
SPL (dB) Sound pressure level
T20, T30 (s) Reverberation time
STI (-) Speech transmission index
S/N (dB) Signal to Noise
Leq (dB) Equivalent sound pressure level
LA (dB) A-weighted sound pressure level
LC (dB) C-weighted sound pressure level
LZ (dB) Z-weighted sound pressure level
F (Hz) Frequency
Α (-) Absorption coefficient
Phon (-) Loudness


Table of contents
1. Introduction ............................................................................................................................ 1
1.1. Background ...................................................................................................................... 1
1.2. Problem formulation ........................................................................................................ 1
1.3. Aims and objectives ......................................................................................................... 1
1.4. Limitations ....................................................................................................................... 2
1.5. Disposition of the study ................................................................................................... 2
2. Theory .................................................................................................................................... 5
2.1. Fundamental acoustics ..................................................................................................... 5
2.2. The hearing system ........................................................................................................ 13
2.3. Environmental acoustics ................................................................................................ 17
2.4. Speech intelligibility ...................................................................................................... 21
2.5. Construction management ............................................................................................. 25
2.6. Room acoustics .............................................................................................................. 27
2.7. Reference projects ......................................................................................................... 32
3. Guidelines ............................................................................................................................. 33
3.1. Demands ........................................................................................................................ 33
3.2. Certification ................................................................................................................... 34
3.3. Target values for sound pressure level .......................................................................... 34
4. Methodology ........................................................................................................................ 37
4.1. Description ..................................................................................................................... 37
4.2. Questionnaire and interviews ........................................................................................ 38
4.3. Motivation ..................................................................................................................... 39
5. Interviews and questionnaires .............................................................................................. 43
5.1. Interviews ...................................................................................................................... 43
5.2. Questionnaire visitors .................................................................................................... 51
5.3. Questionnaire employees ............................................................................................... 55
6. Measurements ....................................................................................................................... 57
6.1. Execution ....................................................................................................................... 57
6.2. Results ........................................................................................................................... 63
7. Simulations ........................................................................................................................... 67
7.1. Purpose .......................................................................................................................... 67
7.2. Model ............................................................................................................................. 67
7.3. Execution ....................................................................................................................... 68

7.4. Sabine’s formula ............................................................................................................ 77
7.5. Results ........................................................................................................................... 78
8. Discussion ............................................................................................................................ 83
8.1. Parameters ..................................................................................................................... 83
8.2. Measurements ................................................................................................................ 86
8.3. Simulations .................................................................................................................... 87
9. Conclusion ............................................................................................................................ 93
10. References .......................................................................................................................... 95
Appendix:
Appendix 1: Standard and certification
Appendix 2: Questionnaires
Appendix 3: Measurements
Appendix 4: Simulations

1
1. Introduction
1.1. Background Swimming halls are constructed for a very specific purpose. This leads to constructions
with hard surfaces and large volumes which creates a noisy environment for visitors and
employees (Socialstyrelsen, 2006). The sound waves bounces between walls, ceiling, floor and
water surface since they are all hard surfaces. Absorbents are frequently used to improve the
acoustic environment in buildings but due to the climate in swimming halls it isn’t as simple as
usual. The acoustic perspective is seldom a priority and is often consulted in a later phase.
The theoretical background of the study is published work about fundamental room acoustics
and acoustics in large rooms. Theory about the ear and the health effects of sound on humans
is also investigated along with acoustics in construction management. Besides that knowledge
about connections between values from measurements and experienced acoustic
environment will be used, for example reverberation time and speech intelligibility. Existing
projects to study are provided by ÅF.
The acoustic environment affects the health of people and therefore work environment is
an important issue to study (Arbetsmiljöverket, 2005). Health issues as tiredness as well
as increased heart rate are caused by noise pollution. For employees the performance at work
may be impaired. Another consequence of high sound pressure level is hearing damage.
Demands for acoustics in swimming halls are not specified and instead demands for other
similar occupations are used. One problematic issue is the integration of acoustics in the project,
which may occur in different phases of the building process. These are aspects that needs to be
evaluated. A complete guide for acoustic environment in swimming halls seems to be missing
and this thesis will be a contribution to the subject.
1.2. Problem formulation The purpose of the study is to present possible improvements of the acoustic contribution in the
design phase of swimming halls. The result will provide guidelines for future projects.
How should swimming halls be designed in order to have a good acoustic environment?
1.3. Aims and objectives The purpose of the Master thesis is to investigate the current state of the acoustic environment
in swimming halls, the acoustic part of the design phase and to detect possible
improvements. Questions to be answered are what kind of parameters are important, what is
experienced as good acoustics in swimming halls and how the design of the swimming
hall effects the acoustic environment. The thesis will investigate the design of swimming halls
in order to develop design guidelines and improvements.

2
Project aims:
o Analyze the acoustic part of the design phase of swimming halls
o Examine the design of swimming halls with measurements and simulations
o Detect connections between measurement values and experience
o Present possible improvements
1.4. Limitations In order to reach useful conclusions with the available amount of time limitations are necessary.
The study will examine the shape of swimming halls and the ability to effect the acoustic
environment in the design phase. The structural design will not be considered and thereby
measurements of airborne and structural borne sound between rooms will not
be executed. Measurements and questionnaires performed in one swimming hall will
provide values relatable to design and experience, but the study would be better with
measurements of several swimming halls in order to compare different executions. Due to time
limitations only one swimming hall is observed. The part of swimming halls that are considered
are for example pools for exercise or education and adventure baths. Other spaces such as
dressing rooms are excluded from the thesis. The main part of the thesis examines the acoustic
environment and the acoustic part of the design phase in general and interviews are not limited
to one swimming hall. Different absorbents and other materials are not observed at a detailed
level.
1.5. Disposition of the study The thesis is divided in chapter as following. The content and connections between topics are
explained further down.
1.5.1. Chapters 1. Introduction
2. Theory
3. Guidelines
4. Methodology
5. Interviews
6. Measurements
7. Simulations
8. Discussion
9. Conclusion
10. References
Chapter 5, 6 and 7 are new information derived for the thesis. The result for each part is included
in respective chapter and comparisons are done in the discussion. Further down the connections
between the content in the thesis are explained as well as the chosen methodology is briefly
introduced.
1.5.2. Content The Master thesis consists of a wide spectrum of collected information related to acoustics. The
focus is regarding to swimming halls but the literature is enclosing a greater region. The
connections between the topics are illustrated in the figure 1 below.

3
Figure 1: Flow chart describing the connection between the content of the thesis
Swimming halls are central in the thesis but the acoustics of swimming halls considers more
than absorbents and measurements. The ear and hearing impairment are included in the thesis
since it is a consequence of “bad” acoustics properties. Work environment is essential since
high sound pressure levels will affect the employees. The visitors may also be affected but the
greater consequences will harm the personnel and the theory of sound related to well-being and
performance as well as the opinion of employees are important for the thesis.
Swimming halls are partly used for education purposes and this is taken into consideration. The
sound environment effects the ability to learn and therefore is speech intelligibility etc. included
in the thesis. Related to this is the safety aspect, where alarms and screams for help needs to be
heard.
Fundamental acoustic theory is of course important in order to understand the way sound works
and to explain the situation in swimming halls. Construction management is explained in order
4
to emphasize the process, the roll of the acoustician and the consequences. The design phase is
fundamental for the design of the room and evolves from the guidelines. The design is focused
on absorbents and leaned walls. The outcome of the design phase is essential for the final
swimming hall.
1.5.3. Methodology In order to investigate the acoustic environment in swimming halls a literature study,
measurements, questionnaire and interviews will be performed, more about this in Chapter 3.
Measurements will be performed in one swimming hall. In order to investigate successful
factors the measurements are supplemented with questionnaires for visitors and employees.
Simulations of two versions of a similar swimming hall as for the measurements are executed.
Interviews: Interviews with more investigating questions for persons with sufficient knowledge
and experience.
Questionnaire: Questions with multiple alternatives for visitors and employees in swimming
halls.
Measurements: Reverberation time and sound pressure level are measured in one swimming
hall. The sound pressure level is measured with and without activity.
Simulations: Design of a swimming hall in two ways is simulated in order to be compared to
each other as well as to the measurements.
The questionnaire will detect connections between the acoustic experience in swimming halls
and the result from the measurements. The interviews will show how the acoustic work is
included in the development of swimming halls, give an explanation for the current situation
and show where improvements can be done.

5
2. Theory
2.1. Fundamental acoustics Fundamental acoustics theory is essential to explain in order to understand the way sound
works. Regarding acoustics the theory of sound is necessary to know. Further down some basic
theory of sound is introduced, for example characteristics, followed by common measures and
the application in buildings.
2.1.1. Sound The characteristics of sound such as content, movement and speed are introduced. Frequency
is an essential definition explained in this chapter.
Sound waves Sound is pressure variations in the air and is produced from example a vibrating surface (Ginn,
1978). The rapid fluctuations in the air are interpreted as sound in the human ear. The vibrations
create waves that spreads through a media, for example air. The waves are propagating though
the media by moved particles. One particle transfer momentum to the next particle and a moving
wave is created. The sound waves are disturbed by obstacles (Åkerlöf, 2001). Small obstacles
rarely affect the waves but large obstacles bends the waves which is called diffusing, see figure
2.
Figure 2: The waves reaction to small and big obstacles (Åkerlöf, 2001).
Several different kinds of waves exists: plane wave, diverging wave, spherical wave,
progressive wave and standing wave (Ginn, 1978). Plane waves are waves parallel to each
other. Diverging wave is when sound from a source is growing and have a lower intensity with
the distance. Spherical wave is sound from a source spreading in every direction. Progressive
wave is when transfer of energy is in the direction of propagation. Standing wave consists of
two or more waves emerging and constructs a wave with constant maximum and minimum,
this can appear in instruments and in rooms.

6
Speed of sound The speed of sound depends on the mass and elasticity of the medium, where the elasticity is
determined by a constant multiplied with the atmospheric pressure, see formula 1 (Ginn, 1978).
𝑐 = √1,4𝑃0
𝜌 (1)
𝑃0=atmospheric pressure
𝜌 =density of air
The speed of sound in air is 340 m/s (Socialstyrelsen, 2008). Sound is also spreading in other
materials and higher density leads to higher speed of sound.
Wavelength The wavelength, 𝜆, is the length the wave moves during a complete wave motion and the
distance between two successive pressure maxima or minima in a plane wave, see Figure
2figure 3 (Ginn, 1978). It is determined by the speed and frequency, se formula 2 below.
𝑐 = 𝑓𝜆 (2)
Figure 3: The wavelength for a clear tune (Åkerlöf, 2001).
The sound wave is affected by objects depending on the wavelength (Åkerlöf, 2001). High
frequencies with smaller wavelengths are reflected on the object and a sound shadow is created
behind the object. Sound waves with longer wavelengths is only a little disturbed and continues
almost as before.
Frequency Frequency is the number of waves per second (Åkerlöf, 2001). The frequency is given in the
unit Hertz, Hz, and calculated as formula 3 below depending on the period time, T.
𝑓 =1
𝑇 (3)
Sound often consists of several waves with different wavelengths (Åkerlöf, 2001). The audible
area reaches from 20 Hz to 20 000 Hz which are wavelengths from 17 meters to 17 millimeters.
Sound within the frequencies 20 to 200 Hz is low frequency sound (Socialstyrelsen, 2008). The
length of the sound waves then vary between 17 meters and 1.7 meters and the long length
makes it harder to reduce the sound waves. Low frequency sound travels longer due to this and
may spread through boundaries such as walls more than higher frequencies.
7
Sound consists of tones with different frequencies (Socialstyrelsen, 2008). One clear tone
consists only of one fundamental tone with one frequency. Noise is sound consisting of all
frequencies in a random distribution of strength. Speech is a mix of tones and noise. Sound
consisting of a large amount of low frequencies effects people more than sound without that.
Consequences are tiredness, irritation, headache, disturbed sleep and difficulties with
concentration.
Octave band The frequency content in a sound is divided in octave band and third octave band (Bernström,
1987). Octave band is a distribution of frequencies and one octave band consists of three third
octave band. The octave band is named with the middle frequency and the bands are called 125
octave band, 250 octave band and further on. Every middle frequency in the octave band is
twice as high as the previous. The highest frequency in an octave band is twice as high as the
lowest frequency. Sound calculations are often based on octave band while sound
measurements are performed in both octave and third octave band. A value for the whole
spectrum may be calculated in dB as well.
2.1.2. Measures Sound can be measured in several ways. The most relevant measures for the acoustic
environment in swimming halls, such as decibel and sound pressure level, are explained below.
Decibel Units used for acoustical measurements are mostly sound pressure, sound intensity and sound
power described in Pa, W/m2 and W (Ginn, 1978). Besides this a logarithmic scale is used in
order to include the wide range of audible intensities. One logarithmic scale is decibel, a relative
measurement related to a reference pressure, power or intensity, see figure 5. The denotation r
below is the power ratio corresponding one decibel.
𝐿𝑜𝑔10𝑟 = 0,1 (4)
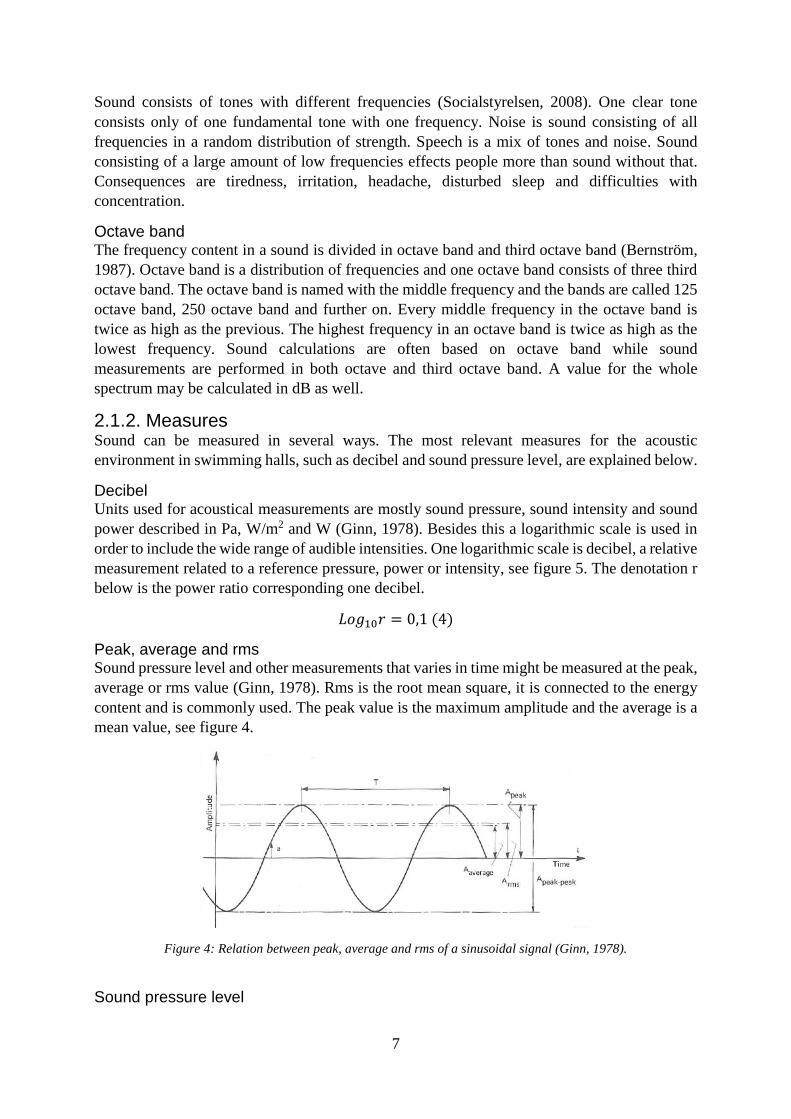
Peak, average and rms Sound pressure level and other measurements that varies in time might be measured at the peak,
average or rms value (Ginn, 1978). Rms is the root mean square, it is connected to the energy
content and is commonly used. The peak value is the maximum amplitude and the average is a
mean value, see figure 4.
Figure 4: Relation between peak, average and rms of a sinusoidal signal (Ginn, 1978).
Sound pressure level
8
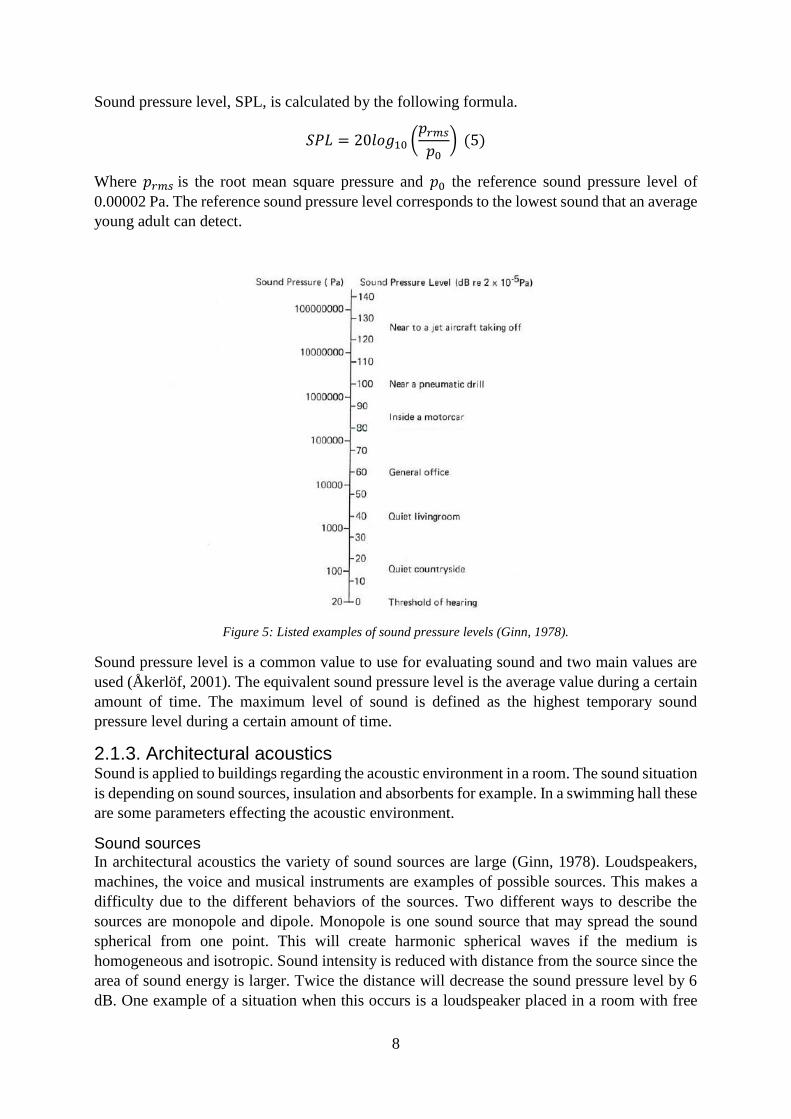
Sound pressure level, SPL, is calculated by the following formula.
𝑆𝑃𝐿 = 20𝑙𝑜𝑔10 (𝑝𝑟𝑚𝑠
𝑝0) (5)
Where 𝑝𝑟𝑚𝑠 is the root mean square pressure and 𝑝0 the reference sound pressure level of
0.00002 Pa. The reference sound pressure level corresponds to the lowest sound that an average
young adult can detect.
Figure 5: Listed examples of sound pressure levels (Ginn, 1978).
Sound pressure level is a common value to use for evaluating sound and two main values are
used (Åkerlöf, 2001). The equivalent sound pressure level is the average value during a certain
amount of time. The maximum level of sound is defined as the highest temporary sound
pressure level during a certain amount of time.
2.1.3. Architectural acoustics Sound is applied to buildings regarding the acoustic environment in a room. The sound situation
is depending on sound sources, insulation and absorbents for example. In a swimming hall these
are some parameters effecting the acoustic environment.
Sound sources In architectural acoustics the variety of sound sources are large (Ginn, 1978). Loudspeakers,
machines, the voice and musical instruments are examples of possible sources. This makes a
difficulty due to the different behaviors of the sources. Two different ways to describe the
sources are monopole and dipole. Monopole is one sound source that may spread the sound
spherical from one point. This will create harmonic spherical waves if the medium is
homogeneous and isotropic. Sound intensity is reduced with distance from the source since the
area of sound energy is larger. Twice the distance will decrease the sound pressure level by 6
dB. One example of a situation when this occurs is a loudspeaker placed in a room with free
9
space. A dipole or an acoustic doublet occurs when a source produces a sound spreading from
two directions.
Sound insulation Sound is able to spread between rooms in air or in the structure of the building (Ginn, 1978).
Sources to airborne sounds are e.g. speech and loudspeakers. Structure borne noise is created
by impact such as footsteps, slamming doors and some installations and travels through the
structure. Impacts are also a source to airborne sound. In order to prevent sound transmission
sound insulation is used. Airborne sound is spread between rooms by the separating boundary,
e.g. wall, floor or ceiling, where some sound is absorbed and some sound propagates through.
The airborne insulation is calculated with sound reduction index, R. Boundaries with larger
value of R will create a better insulation and a lower sound pressure level at the other room.
𝑅 = 10𝑙𝑜𝑔10 (𝑊1
𝑊2) 𝑑𝐵 (6)
𝑊1= sound power incident on the wall
𝑊2=sound power transmitted through the wall
For cases where the sound is diffuse and transmission is through the boundary calculations can
be done as below.
𝑅 = 𝐿1 − 𝐿2 + 10𝑙𝑜𝑔10 (𝑆
𝐴) 𝑑𝐵 (7)
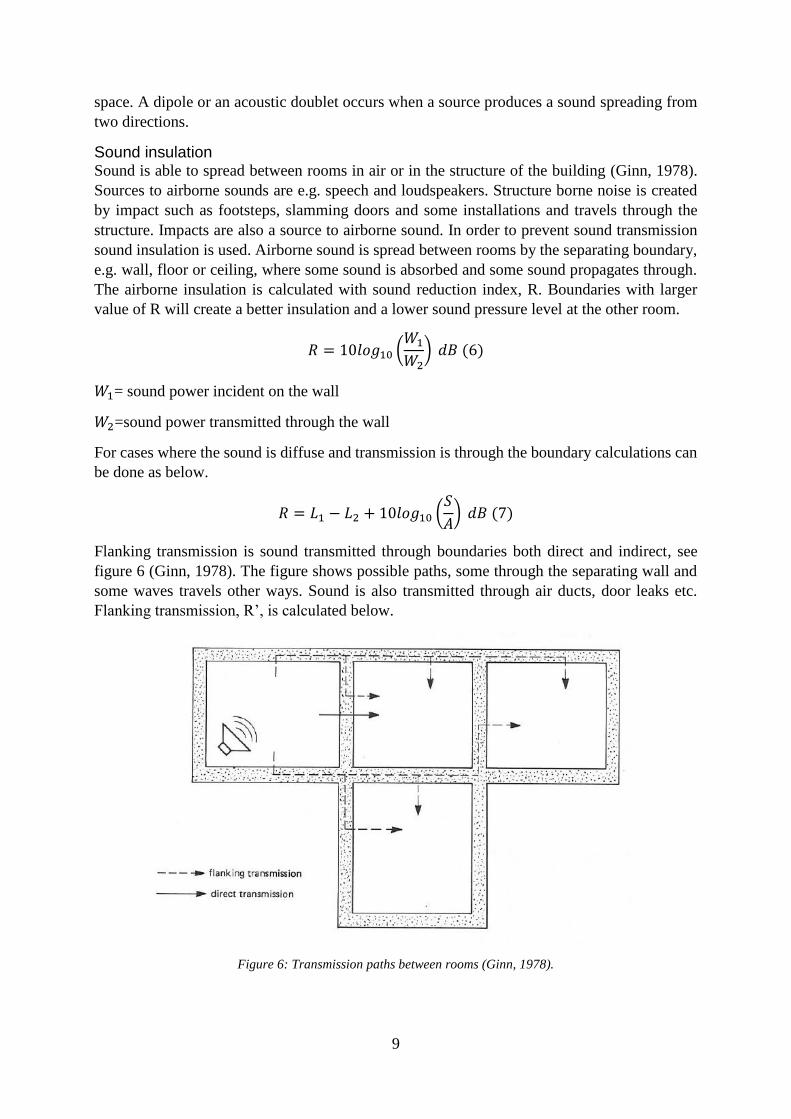
Flanking transmission is sound transmitted through boundaries both direct and indirect, see
figure 6 (Ginn, 1978). The figure shows possible paths, some through the separating wall and
some waves travels other ways. Sound is also transmitted through air ducts, door leaks etc.
Flanking transmission, R’, is calculated below.
Figure 6: Transmission paths between rooms (Ginn, 1978).
10
𝑅′ = 10𝑙𝑜𝑔10 (𝑊1
𝑊3) 𝑑𝐵 (8)
𝑊3=total sound power transmitted into the receiving room
Impact sound is prevented from spreading by impact sound insulation (Ginn, 1978). Vibrations
in the structure transmits sound to the receiving room. The insulation, Ln, is calculated by the
equation below.
𝐿𝑛 = 𝐿𝑖 − 10𝑙𝑜𝑔10 (𝐴0
𝐴) 𝑑𝐵 (9)
𝐿𝑛=normalized impact sound pressure level
𝐿𝑖=impact sound pressure level
𝐴0=10 m2 the reference absorption area
𝐴 =measured equivalent absorption area of the receiving room
Diffuse sound field In a room the sound waves will spread from the source (Kinsler, 2000). When the waves collide
with boundaries some waves are absorbed and the rest reflected back to the room. The
reflections collide with another boundary and the new reflections are sent back. After a while
this becomes a diffuse sound field where the energy density is constant. Reflections at the
boundaries produce a sound energy distribution becoming more uniform with time.
Reverberation time Reverberation time is defined as the time required for the sound pressure level to decrease 60
dB (Kinsler, 2000). With a continuous sound source two sound fields exists. The direct sound
creates the direct sound field and the reflections creates the reverberation sound field.
Sabine’s formula The reverberation time can be calculated with Sabine reverberation formula (Ginn, 1978). The
formula is derived from empirical studies of the relationship between the volume of a room and
the amount of absorptive materials. The parameters are related to the reverberation time as
below where T is reverberation time, V is volume and A is the total area of absorbents.
𝑇 = 0,161𝑉
𝐴 (10)
The formula is adapted for room volumes less than 1000 m3 and larger volumes are not accurate
calculated with Sabine’s formula (Saint-Gobain Ecophon AB, 2002).
Absorption coefficient Absorption coefficient, α, is a dimensionless measure for a materials capacity to absorb sound
waves (Saint-Gobain Ecophon AB, 2002). The value is decided from standardized
measurements of a sample of the material in a reverberation chamber, see figure 7.

11
Figure 7: Absorbent classes (Saint-Gobain Ecophon AB, 2002).
The picture shows the distribution of absorbents (Saint-Gobain Ecophon AB, 2002). The ability
to reduce sound is divided in absorption classes from A to E, where A is the best. The absorption
coefficient is on the left axis and the absorption for each frequency from 250 Hz to 4000 Hz is
shown on the x-axis. This is measured by the international standard EN ISO 354 and classified
by the international standard EN ISO 11654.
2.1.4. Sound absorbents Reflectors and absorbers are used in order to create a good acoustic environment (Ginn, 1978).
All surfaces in a room absorbs sound. Hard surfaces such as tile absorbs little sound but soft,
porous materials such as carpets absorbs far more sound. Sound absorbers have different
characteristics and can be divided into categories: porous material, panel absorbers, cavity
resonators and individual people and items of furniture (Kinsler, 2000). High frequencies are
absorbed with porous materials, for example textiles and soft furniture, and low frequencies are
best absorbed with thin sheets or openings (Rosenberg, 1992).
Porous absorbents Porous absorbers are effective for reducing specific frequencies (Kinsler, 2000). The effect is
small at the lower frequencies and increases with higher frequencies. The absorptivity increases
with the thickness of the material. In order to decrease lower frequencies, the absorbent is placed
a certain distance from the wall. Porous absorbents works due to friction and transforms some
of the sound waves to heath energy (Saint-Gobain Ecophon AB, 2002). The rest of the sound
energy is transmitted on the other side of the absorbent. Examples of porous absorbents are
acoustic tiles and plasters, mineral wool, carpets and curtains.
Panel absorbents Low frequencies are absorbed by panel absorbents, placed away from a solid backing (Kinsler,
2000). The panel vibrates and transforms some of the sound energy to heat energy. The effects
increases with porous materials between the panel and backing. Gypsum and plywood boards
are two examples of panel absorbers.

12
Cavity resonator A box or similar object with room for air and connected to the room by a thin split works as an
absorbent for frequencies close to the resonance (Kinsler, 2000). To create this panels or
elements in for example wood with perforations are used. This absorbents are made of
individual pieces where a few frequencies are absorbed or several absorbents with effectivity
over more frequencies. In order to make this absorbents more effective porous absorbents might
be used behind which makes more frequencies reduced (Saint-Gobain Ecophon AB, 2002).
People and furniture Sound absorption per item of clothing on a person or on a furniture can be measured. Wooden
furniture has some effect (Kinsler, 2000). Fabric works as porous absorbents but doesn’t affect
the reverberation time and speech intelligibility a lot since it concerns the higher frequencies,
outside the speech use (Saint-Gobain Ecophon AB, 2002).
In order to reach the best room acoustic environment the free space, the ceiling, should be used
(Saint-Gobain Ecophon AB, 2002). Sometimes addition of absorbents on the walls is necessary.
Absorbents on the ceiling are partly protected from wear. Above the absorbents a space with
air may be used in order to increase the absorbing effect, especially at the lower frequencies.

13
2.2. The hearing system The ear and the hearing system is a central theoretical part of acoustics and therefore
introduced in this chapter. The ear is fundamental for the relationship between sound and
health consequences, presented later on.
2.2.1. The ear The ear consists of three parts: the outer, middle and inner ear (Kinsler, 2000). The ear together
with the nervous system acts as a frequency analyzer and is one of the most delicate mechanical
structures in the human body. The ear is illustrated in figure 8. The pinna directs the sound into
the auditory canal, a tube about 2.8 cm long, leading to the eardrum. The middle ear consists of
three ossicles (bones). The malleus (hammer), the stapes (stirrup) and the incus (anvil) are the
three components and are placed in an air-filled space. The inner ear is connected to the middle
ear by the oval window and contains a liquid. The area between the eardrum and the oval
window acts as a broadly resonant coupler to the liquid. The inner ear consists of three parts:
the vestibule, semicircular canals and cochlea. The semicircular canals only contributes a sense
of balance, but the cochlea, with the shape of a snail shell, containing cilia (small hairs) sending
electrical impulses to the brain. When sound pressure reaches the eardrum it transforms into
vibrations that are forwarded to the cochlea through the middle ear (Ando, 1998). The stapes
drives the fluid in the cochlea which creates a traveling wave. The vibrations put the fluid in
motion and the membrane in the cochlea translates it with receptors of around 15000 hair cells.
These are nerve cells and transmits the message to the brain where it is interpreted.
Figure 8: The ear (Kinley, 2000).
2.2.2. Capacity The acoustic environment in a room is subjective and depends on the ability of the human ear
(Ginn, 1978). The ear can be compared to an extremely sensitive microphone and is, in
cooperation with the brain, a frequency analyzer capable to distinguish tones. The range of
sound pressure is wide, from 0.00001 Pa to over 100 Pa. The most sensitive range is between
1000 and 5000 Hz. The minimum intensity level perceptible by the ear is called the threshold
of hearing, as shown in figure 9. The threshold depends on the frequency, decreasing with
increasing frequency. The upper threshold is the threshold of feeling, where a tickling or feeling

14
occurs within the ear. The threshold of feeling is not as dependent of the frequency as the
threshold of hearing, and the threshold of feeling is therefore more even in the figure. Between
the thresholds areas of speech and music can be framed. The threshold of hearing is different
for each person, and is therefore a reason for the perceived acoustic experience in a room.
Figure 9: Audible range of frequencies and sound pressure levels (Ginn, 1978).
Sound is subjective and one parameter to explain this is loudness (Ginn, 1978). Loudness is a
non-linear function of frequency and sound intensity, for example is a higher frequency
hearable at lower sound pressure level than lower frequency, illustrated in figure 10. The figure
below is created from subjective experiments where the curves represent equal loudness of
sound intensity and frequency. Phon is the unit for loudness and the loudness level of each
curve is illustrated.

15
Figure 10: Equal loudness contours. L is sound pressure level (Kinsler, 2000).
2.2.3. Hearing damage Damaged hearing capacity is common and results in reduced sensitivity for high frequencies
(Bernström, 1987). In figure 9 the area of hearing will be decreased and the threshold of hearing
and the threshold of feeling will be closer to each other. In order to protect the ear from damage
there is the acoustic reflex (Kinsler, 2000). For high intensities the muscles of the ossicles
change the tension and reduces the amplitude of motion of the stapes. The inner ear is thereby
protected from damage. Sound for a shorter period of time might reduce the hearing temporary
and when the source of the sound is removed the hearing recovers, called a temporary threshold
shift (TTS). Sound with high intensity and longer duration can cause permanent threshold shift
(PTS) and the threshold of hearing will not go back to original capacity. At this stage the hair
cells in the inner ear are permanently damaged. Hearing loss is caused by high intensity sounds,
and hearing impairment means a loss in ability to understand speech. Two different kinds of
hearing loss reasons exist. Trauma is a high intensity sound that immediately causes a hearing
damage on for example eardrum, ossicles or hair cells. Chronic is lower sound levels than
trauma levels but repeated and is able to damage the hair cells after a period of time.
2.2.4. Risk for hearing damage Powerful sound during a shorter period of time might result in temporary reduced hearing
(Arbetsmiljöverket, 2005). Most times the ability to hear recovers but after exposure of
powerful sound during a longer period of time the ear might get permanently damaged. Higher
sound pressure level needs a shorter period of time in order to be dangerous. In order to judge
the harm of a sound the principle of same energy level is used (Socialstyrelsen, 2008). An
increase of sound pressure level of 3 dB gives the double effect and half the amount of time is
needed before a hearing damage may occur. For example, a sound pressure level of 85 dB may
proceed for 8 hours while 88 dB only for 4 hours. This varies between people and damages may
occur earlier for some people. With A-weighted sound level the maximum level before risk for

16
damage is 85 dB during a longer period of time (Arbetsmiljöverket, 2005). Even at 75-80 dB
there is a risk for more sensitive people.
2.2.5. Consequences The consequences of hearing damages are for example tinnitus, overly sensitive hearing and
reduced hearing ability (Socialstyrelsen, 2008). Tinnitus is a lingering ringing sound in the ear
occurring from a hearing damage. It can be temporary or permanent and is a symptom of e.g. a
hearing damage, not a disease itself. According to Socialstyrelsen (2008) about 15 % of the
Swedish people suffers from tinnitus, and 100 000 of them has severe problems. Four out of
five with tinnitus also suffers from reduced hearing ability. There is no cure but some possible
treatment to linger the troubles. Reduced hearing is one of the consequences of hearing damage.
Reduced hearing is the most common work disease over the whole world. Reduced hearing
increases the ability to perceive speech and may lead to social inconvenience etc. Overly
sensitive hearing is another consequence where sound with a high sound pressure level is
experienced as agonizing.
2.2.6. Weighted system The characteristics of the ear effects the ability to experience sound (Kinsler, 2000). In order to
adapt measurements to the ear different weighted sound levels exists. Most adapted to the way
of hearing is the A-weighted sound level. C-weighted sound level is relatively flat whit a lower
level at higher frequencies and is also commonly used, see figure 11.
Figure 11: Filter characteristics for A and C-weighted sound pressure levels (Ginn, 1978).

17
2.3. Environmental acoustics Acoustics related to the environment people are in are relevant. Sound is subjective and may be
experienced as desired or disturbing. The reasons behind this is explained in this chapter.
2.3.1. The character of the sound Sound can be disturbing, depending on the character of the sound (Bernström, 1987). Clear
tones are more disturbing than noise and short impulses are more disturbing than constant
sound. Sound is subjective and the sources we like are less disturbing than sources we can’t
control by our self. Other factors are time of the day, occupation, environment etc. The
characteristics of the sound effects the consequences (Arbetsmiljöverket, 2005). Sound pressure
level, frequency and durability will determine the outcome. Increasing sound pressure level,
tones and varying sound are more disturbing than the opposites. Low frequencies are known to
be tiring. The variation of sound is also effecting the experience of it (Socialstyrelsen, 2008).
Sound variation over time is divided into continuously, intermittent and impulses. Continuously
sound has only small variations of the sound pressure level over a certain amount of time. One
example of a continuously sound is a fan. This is often measured in equivalent sound pressure
level. Intermittent sound varies in level all the time and one example is an engine that starts and
stops all the time. Impulses are short and sudden sounds. The characteristics is presented by
distribution of frequencies etc. The level of disturbance is depending on the individual person
since the experience of sound is subjective (Arbetsmiljöverket, 2005). Noise covers speech and
noisy environments might obstruct speech and therefore be disturbing. In noisy environment
people might increase the level of speech and both increase the current sound pressure level
and be wearisome for the person.
2.3.2. Noise Arbetsmiljöverket (2005) defines noise as undesirable sound, both dangerous and disturbing
sound. Noise is interpreted as unwanted sound but physically it’s the same as sound
(Socialstyrelsen, 2008). The difference is due to the experience where noise is categorized as
undesired sound. It’s common to make a connection between noise and sound pressure level
(Dyrssen, 2014). Noise is often described as high sound level but even more important is the
fact that it is undesired sound, regardless the level. High sound pressure level at a club is not
experienced as disturbing by most of the visitors. When a sound interrupts our focus it is
experienced as disturbing, and thereby as noise. The acoustic expectation is important for the
experience of the sound, whether it is desired or not and if it is expected will affect the attitude
to it. Noise can be disturbing in both a psychological and physiological way (Arbetsmiljöverket,
2005). The noise might be related to a feeling or an experience, for example tiredness and
irritation, as psychological effects. Additional physiological consequences may appear, such as
increased heart rate and increased level of stress hormones, see figure 12. According to the
World Health Organization (1999) noise is a health issue and will probably continue as a
problem in the next century. To prevent consequences, it is important to have strategic actions
and control the noise level.

18
Figure 12: The effect on health from sound exposure (Saint-Gobain Ecophon AB, 2002).
2.3.3. Work-related diseases Work-related diseases are caused by short or long term exposure to a harmful source
(Arbetsmiljöverket, 2015). Inconvenience may occur after a few years and is both physical and
psychological. According to a study from Arbetsmiljöverket (2015) of work-related diseases in
Sweden year 2014, 15 percent of the reported cases are caused by physical causes, noise being
the most common. The result is impaired hearing and tinnitus and three out of four cases are
men. Employees in swimming halls are not mentioned in the report but are comparable with
elementary school teachers, employees at restaurants and culture work. At restaurants work-
related diseases is reported 72 times during 2014, 3 out of this is caused by noise and the same
numbers for culture and service work is 60 cases and 5 caused by noise. Elementary school
teachers is probably one of the most comparable profession and 77 out of 116 cases is caused
by noise.
Sound parameters Not possible to measure: informtion etc.
Measureble: Sound pressure level, dynamics, frequencies etc.
Indirect and direct parametersSituation parameters: communication, concentration, sleep
Individual parameters: ability to manage noise, experience of the sound source, noise sensitivity
Effect on physiological and psychological mechanisms when a sound is experienced as noise
Instant negative changesPhysiological: increases production of stress hormones, increased blood pressure, vasoconstriction
Psychological: tension, irritation
Chronic negative changesRisk for disturbed production of stress hormones, increased risk for to high or low levels of cortisol
Long term health effectsIncreased risk for calcification and impaired immune system

19
Percentage exposed to noise at least 25 percent of the working time according to
Arbetsmiljöverket (2014) is around 30 percent for men and 15 percent for women. This is based
on a survey but also compared to measurements, for example of sound pressure level. The
survey describes noise as too high sound pressure level to be able to speak normally. The
professions with most exposure to noise are for men building constructor, machine operator,
farming and metal worker and for women machine operator, pre-school teacher, high school
teacher and employees at restaurants. Teacher is comparable with employees at swimming
halls, as mentioned above, and this points to a high level of noise exposure.
2.3.4. Health consequences Community noise is a health issue. According to Mats Nilsson (2013) in a study of children
following are possible outcomes from noise exposure: decreased hearing, tinnitus, sleeping
difficulties, impaired learning and high stress levels. The amount of persons with hearing
damage is increasing with age and is more common for men than women. Vulnerable groups
for reduced speech intelligibility are children, elderly, people with hearing damage or people
not used to the spoken languages (World Health Organization, 1999). Decreased speech
intelligibility can cause problems with concentration, fatigue, decreased working capacity and
stress reactions as well as reduced self-confidence etc. Noise from installations for example
seldom causes hearing damages but can reduce the ability to concentrate and decrease speech
intelligibility (Nilsson, 2013). Locals such as schools and preschools needs to have a good
acoustic environment in order to help the users (World Health Organization, 1999). Speech
intelligibility and disturbing noise are essential acoustic questions for this kind of rooms.
The sound pressure level effects the speech intelligibility. Table 1: Speech intelligibility for
different sound pressure levels Arbetsmiljöverket (2005).Table 1 shows the connection between
A-weighted sound pressure level and the ability to understand speech according to
Arbetsmiljöverket (Arbetsmiljöverket, 2005).
Table 1: Speech intelligibility for different sound pressure levels Arbetsmiljöverket (2005).
dB(A) Speech intelligibility
70 Loud conversations can barely be heard at the distance of 1 meter for persons with
adequate hearing
55 Environment fulfills average demands for conversations with normal voice level
at close distance to the speaker
50 As above but at 5-10 meters
40 Environment fulfills average demands for speech intelligibility at close distance
even for elderly and people with impaired hearing as well as in foreign languages
35 As above but at 5-10 meters
Longer reverberant time increases echoes from speech and covers following sound
(Arbetsmiljöverket, 2005). This will be disturbing in normal rooms when the reverberant time
exceeds 0.8 s but in large rooms speech intelligibility is often hard to achieve. Noise and echoes
will perhaps cover important messages and therefore be a risk. At a worksite noise from the
occupancy is less disturbing than extraneous noise. Noise might lead to tiredness and stress

20
symptoms which will lead to decreased performance. High sound pressure level during a longer
period of time can lead to immediate tiredness.
Places with high sound pressure levels are e.g. sport activities, cafeterias in school buildings
and sports halls (Nilsson, 2013). Children are often exposed to this kind of places and are also
a vulnerable group. Noise can also occur from the people’s activities. A high level of
background noise, from example air ducts and reflections, will increase the sound pressure level
and also increase the sound from the activities since people will try to be louder than the
masking background noise. Reflections from the walls, floor and ceiling will delay the sound
and mask speech for example. The increased noise level both raises the listener’s threshold of
hearing and masks the information (Kinsler, 2000). In order to compensate for this people tend
to move closer, talk louder and use electronic devices.
21
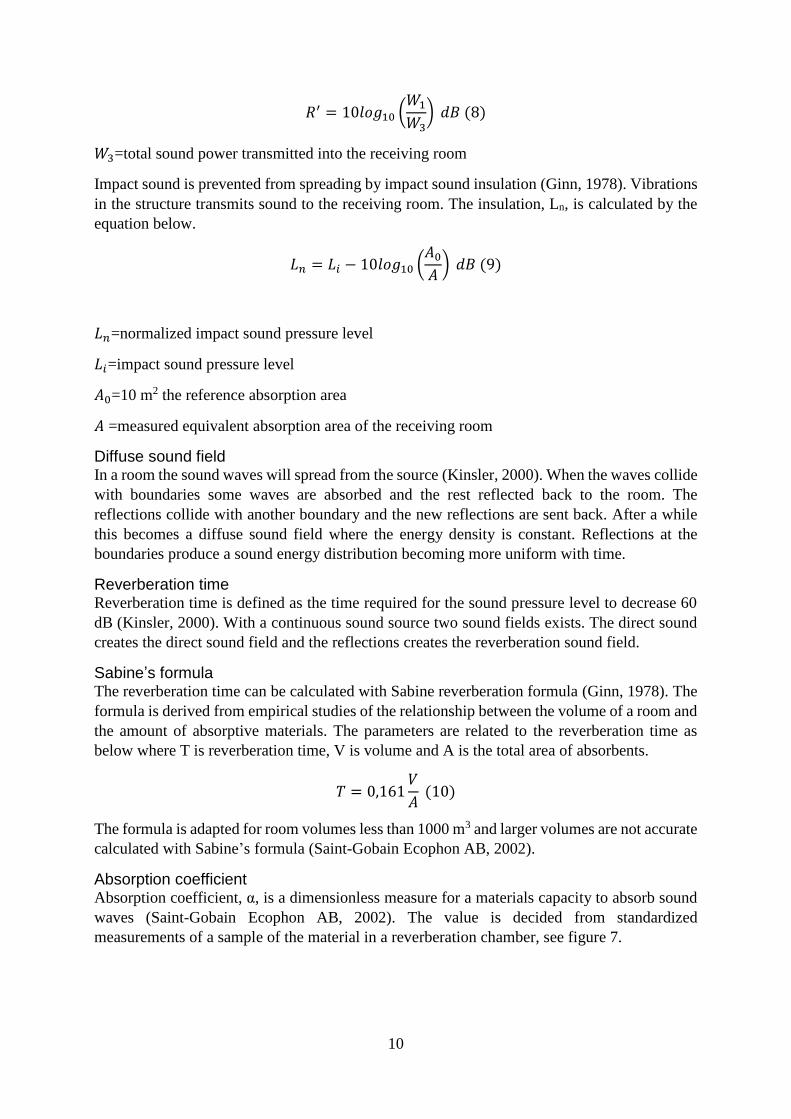
2.4. Speech intelligibility One essential value for the acoustic environment in swimming halls is speech intelligibility,
explained in this chapter.
2.4.1. Theory of speech intelligibility Speech intelligibility is the ability to hear speech in a room (Bernström, 1987). The speech
intelligibility is not the same at every point in the room. The speech intelligibility is often
subjective but there is also ways to measure this. If the speech intelligibility isn’t good this can
be due to a lot of factors. The design of the room may cause too high or too low absorption, too
high level of absorption reduces speech at greater distance and too low level of absorption is
decreasing the speech intelligibility. Also a high level of background noise can mask speech
and late reflections and echoes makes it harder. Speech is often within 100-6000 Hz, and with
the most important energy between 300 and 3000 Hz (World Health Organization, 1999).
Higher level of masking background noise and at higher amount of the high energy frequencies
will reduce the percentage heard by the listener. Signals such as fire alarms may also be masked
by background noise. With an interfering sound pressure level from background noise people
will raise their voice and increase the sound pressure level. In quiet surroundings the sound
pressure level at 1 m between speaker and listener is about 45-50 dB(A), but with a noisy
background shouting at 30 dB(A) higher is a possible outcome. Background noise reduces the
speech intelligibility but most word can often still be heard but causes greater strain of the
listener. Reverberation time over 1 s leads to loss in speech discrimination. In an ordinary
classroom the sound pressure level might be 65-70 dB(A) due to talking and moving of furniture
etc. (Saint-Gobain Ecophon AB, 2002). In order to be heard in this environment at least 10-15
dB(A) must be added to the speech and that results in screaming. By this, noise increases even
more noise.
A long reverberation time results in decreased speech intelligibility when sound from one word
still travels when the next word is heard (Saint-Gobain Ecophon AB, 2002). Our ability to hear
sound is effected by the relation between the sound pressure level of speech and the sound
pressure level of background noise. Factors affecting the speech intelligibility are the geometry
of the room, the acoustic characteristics of the room’s surfaces, the voice of the speaker and the
hearing capacity of the listener.
2.4.2. Measurements methods Speech intelligibility measurements the effectiveness or adequacy of communication (Brüel &
Kjaer, 2013). The level of understanding is often measured as a percentage of words, sentences
or phonemes. The percentage understood by the listener is the amount of speech intelligibility.
Physical measurements are performed with a small loudspeaker or similar sound source and a
microphone placed at the listener’s position. In order to measure the speech intelligibility
several methods exist, where STI, RASTI and STIPA are the most common. They are all
performed as mentioned and RASTI and STIPA are simplified versions of STI.
Speech intelligibility is effected by several parameters (Brüel & Kjaer, 2013). These are the
reasons to why the signal that is heard is never the same as the original source. The parameters
are listed below.

22
o Level of background noise
o Distance from the speaker to listener
o Loudness of the speech (signal strength)
o Voice spectrum of the speech
o Amount of reverberation (echoes)
In order to determine the speech intelligibility the background noise and the acoustics
preferences of the room are the most essential parameters. The parameters are illustrated below,
see figure 13 and 14.
Figure 13: Illustration of speech intelligibility in a conversation (Brüel & Kjaer, 2013).
Figure 14: Illustration of speech intelligibility in an educational situation (Brüel & Kjaer, 2013).
2.4.3. STI STI is measured over seven octave bands from 125 Hz to 8000 Hz (Brüel & Kjaer, 2013). The
result is a weighted value and is within the limits of 0 and 1, see table 2.
Table 2: Relation between STI and speech intelligibility (Brüel & Kjaer, 2013).
STI 0.00-0.30 0.30-0.45 0.45-0.60 0.60-0.75 0.75-1.00
Speech Intelligibility Bad Poor Fair Good Excellent

23
A value of 0.75 of the scale from 0 to 1 with STI is necessary for a good level of speech
intelligibility in a classroom (Saint-Gobain Ecophon AB, 2002). In order to achieve this, the
reverberation time should be 0.5 seconds or less and the background noise doesn’t exceed 30
dB(A) and 45 dB(C). A value above 0.8 is seldom exceeded in reality (Brüel & Kjaer, 2013).
2.4.4. Other methods RASTI (Rapid Speech Transmission Index) measure the speech intelligibility in an objectively
way (Saint-Gobain Ecophon AB, 2002). As mentioned, a loudspeaker is placed at the position
of the speaker and emits sound while a microphone is collecting the sound at the position of the
listener at two frequencies, 500 and 2000 Hz. STI is measured in the same way but at more
frequencies. RASTI was developed in order to shorten the measurement period (Brüel & Kjaer,
2013). For this method the background noise must be smooth in time and frequency, echoes
must be avoided and the reverberation time cannot be strongly frequency dependent. STIPA is
a measure method similar to STI but simplified in order to shorten the measurement
performance time, such as RASTI. Other methods are AI (Articulation Index) and %ALcons
(Articulation Loss of Consonants) for example (Saint-Gobain Ecophon AB, 2002). The % ALC
value varies from 0 to 100, where 0 is excellent. The value is corresponding to the reception of
the listener (Brüel & Kjaer, 2013).
2.4.5. Signal to Noise According to Robert Ljung (Ljung, 2010) the two acoustical parameters most effecting the
speech intelligible except for the absolute speech level is signal-to-noise and reverberation time.
Signal-to-noise, S/N, is a measurement of the signal’s strength in relation to the noise from
surrounding sources. A low S/N is decreasing the ability to hear speech. The background noise
could be noise from installations or noise from people’s activities. The speech intelligibility
uses cognitive resources and makes it harder to understand and remember the information. The
signal to noise ratio should be at least 15 dB(A) in order to achieve full sentence intelligibility
(Brüel & Kjaer, 2013). The SNR is a logarithmic ratio of the signal level and the noise level
compared to each other. Since a value of STI seldom is reach over 0.8, the SNR value above
15 dB(A) is a useful demand to achieve.
2.4.6. EDT, Early Decay Time EDT, Early Decay Time, measures the reverberation time (Brüel & Kjaer, 2013). For this
method the initial and highest level part of the decaying energy is crucial. The value is given
by the decay from 0 to 10 dB below the initial level and then calculated for the time to reach 60
dB less sound pressure level.
2.4.7. Speech and room design Speech contains vowels and consonants, the vowels are generally louder and more audible
(Ljung, 2010). Same as for reading, only consonants are understandable but only vowels are
not, applies for speaking. The human speech is mostly between 100 Hz and 8000 Hz, vowels
being in the lower frequency range. Rooms designed for learning should have reflections
reaching the audience all the way through the room (Ljung, 2010). Too much reflections will
decrease the speech intelligibility and make the teaching harder. Reflections reaching the
listener 35-40 ms after the direct sound improves the speech intelligibility. Later reflections will
instead mask the speech. By this, information may be lost. Longer reverberation time masks the
consonants more than vowels which decreases the understandability. A phenomena called

24
“Upward spread of masking” means that low frequency sound mask high frequency sounds
better than the opposite. Since vowels often are lower frequencies these are less reduced than
consonants, and thereby also decreases the ability to understand speech. Unfavorable acoustic
environments with high background noise level strains the working memory.
Table 3: Average vocal effort and sound level (Brüel & Kjaer, 2013).
Vocal effort dB(A)
Whispering 32
Soft 37
Relaxed 42
Normal (private) 47
Normal (public) 52
Raised 57
Loud 62
Very loud 67
Shouting 72
Max. shout 77
Vowels and consonants are not at the same energy level and the average level of consonants is
10-12 dB lower than vowels, see Table 3 (Brüel & Kjaer, 2013). Consonants are more important
than vowels in order to understand speech. Consonants contains most of the information and
separated syllables and words from one another.
2.4.8. Learning The environment in learning situations is essential to the result (Saint-Gobain Ecophon AB,
2002). Temperature may cause a decreased quality and to high temperature might be
compensated by raised vocal level. Sound, climate, air quality, ergonomic, light and lightning
are examples of factors contributing to the indoor environment. All of these considered as a
wholeness at the beginning of the design phase of a building will improve the result. The speech
intelligibility decreases with noise from ventilations, speech, traffic, steps, move of furniture
etc. Noise effects assignments that requires a lot of concentration more than other assignments.

25
2.5. Construction management In order to relate the importance of the design phase to the outcome of swimming hall projects
the theory of construction management is essential. Another important aspect regarding this
topic is cost effectiveness and influence throughout the process which are fundamental aspects
for achieving a successful result.
2.5.1. The building process The building process exists of the initial planning, the execution and the follow-up of a project
(Saint-Gobain Ecophon AB, 2002). The main activities are planning, design, construction and
maintenance, see figure 15. The process includes a lot of different professionals, for example
designers. The designers such as architects, engineers, acousticians and other specialists are
consults and are working with the planning and the design of the project. A consult is an expert
on a specific topic, for example installation and electrical. The consults contribute with special
knowledge and are important for the shape and functions of the building. The consults interpret
the demands ordered by the client. Client is a person, an organization, a company or similar that
starts the building project (Nordstrand, 2009). Client makes decisions about the design,
solutions, quality and environmental demands for example. Municipalities are the client of
schools, pre-schools, sports facilities etc. These are non-profit buildings. In the initial
investigation demands should be specified and a factor of success is to define these according
to required quality and to fulfill environmental standards (Saint-Gobain Ecophon AB, 2002).
One example of this is to plan for educational buildings away from noisy surroundings. The
consults, for example in acoustics, are included in the design phase of the building process
(Nordstrand, 2009).
Figure 15: The building process illustrated in the main steps.
2.5.2. Design phase The design phase is complex. New buildings has a lot of opportunities to choose from, but
renovations are limited (Nordstrand, 2009). During the process a large number of people are
involved and need to collaborate. Time and cost are decided early and the project needs to be
adapted to that. In project with a lot of possibilities the work of the architect is essential. In
order to find the best solutions for the specific project a lot of parameters needs to be taken in
consideration. The design work is a team work with all different kinds of consults together with
the architect and client. During the design phase communication is important and all solutions
that needs to be used by every different type of consult must be known by all participants. For
example, collisions are avoided by communication. One way to work with this is three
dimensions’ models where collisions are visual. During the process decisions are made and the
project progresses.
The design phase can be divided into three parts (Nordstrand, 2009). From an initial planning
program, the design of the building is decided and results in the first drafts with suggested
design. Next step is the structural system, installations etc. The consults, except for the architect,
usually joins the project in this phase. Last of all is a detailed design of the building. This is
presented in writing and drafts which constitutes the project documentation. This stages forms
the building and the consults has a big impact of the result.
Planning Design Construction Maintenance

26
Figure 16: Collaboration between influence and cost during the duration of a project (Sakonnet Associates ,
2016).
2.5.3. Influence and cost Society, demands and environmental decisions effects the building process. In order to achieve
a good result and a high quality with a low cost as much as possible should be decided in the
early stage of the building process, this is illustrated in figure 16 (Saint-Gobain Ecophon AB,
2002). Arrangements later in the process in more complicated and often expensive. In order to
achieve as large cost effective process as possible the acoustic questions needs to be maintained
at an early stage of the planning (Åkerlöf, 2001). The cost will increase a lot if the questions
are addressed during production and solutions made during maintenance may cost 10-100 times
as much as if the acoustics would have been addressed in the early stages. After the building is
delivered complains may occur on the acoustic environment and solutions to manage this are
very expensive.
27
2.6. Room acoustics Acoustics effects the experience in a room and may be used in order to create desired situations.
This chapter addresses the use of acoustics in buildings. Acoustics in locations such as
swimming halls are also introduced.
2.6.1. Acoustic room design Acoustic design in rooms are used for several purposes, e.g. increase speech intelligibility,
make it easy to hear music, tune down the sound from the general noise level and mask the
disturbing sound from speech and occupation (Bernström, 1987). The shape of the room affects
the acoustic environment. Examples of this are size, shape, surfaces as well as size and
placement of absorbents. Definition of room acoustics according to (Ginn, 1978):
"Consider a sound source which is situated in a room. Sound waves will propagate away from
the source until they encounter one of the room's boundaries where, in general, some of the
sound energy will be reflected back into the room, some will be absorbed and some will be
transmitted through the boundary. The complex sound field produced by the multitude of
reflections and the behavior of this sound field as the sound energy in the room is allowed to
build up and decay constitutes the acoustics of the room."
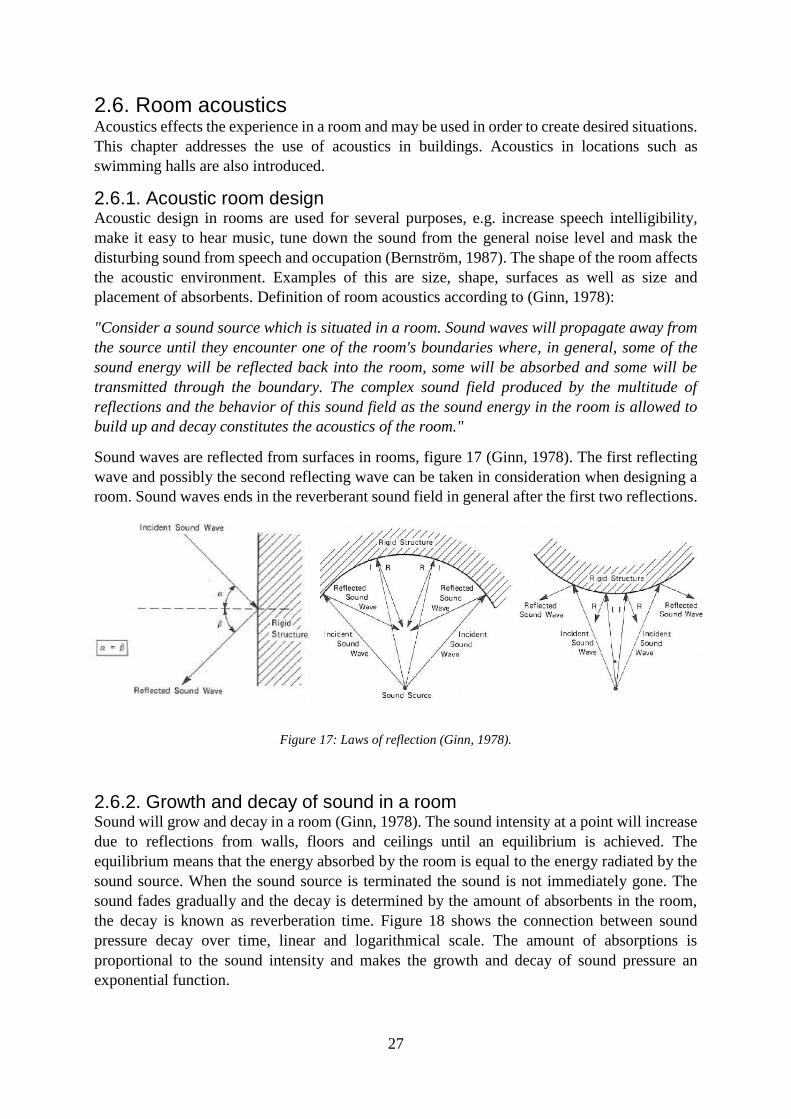
Sound waves are reflected from surfaces in rooms, figure 17 (Ginn, 1978). The first reflecting
wave and possibly the second reflecting wave can be taken in consideration when designing a
room. Sound waves ends in the reverberant sound field in general after the first two reflections.
Figure 17: Laws of reflection (Ginn, 1978).
2.6.2. Growth and decay of sound in a room Sound will grow and decay in a room (Ginn, 1978). The sound intensity at a point will increase
due to reflections from walls, floors and ceilings until an equilibrium is achieved. The
equilibrium means that the energy absorbed by the room is equal to the energy radiated by the
sound source. When the sound source is terminated the sound is not immediately gone. The
sound fades gradually and the decay is determined by the amount of absorbents in the room,
the decay is known as reverberation time. Figure 18 shows the connection between sound
pressure decay over time, linear and logarithmical scale. The amount of absorptions is
proportional to the sound intensity and makes the growth and decay of sound pressure an
exponential function.

28
Figure 18: Growth and decay of sound in a reverberant room (Ginn, 1978).
2.6.3. Principles for design of rooms and auditoria The volume of the room is a crucial factor for the acoustic result (Ginn, 1978). Reverberation
time is an essential design factor but the subjective part is making it even harder. Perfect
reverberation time may vary between persons but some guidelines for different types of rooms
exist, see figure 19. In general, for speech the reverberation time should be as short as possible
and for concert and church music it should be long. By measurement the reverberation time and
the volume in rooms considered having good acoustics a relationship can be detected, see figure
19. The curves are a guideline and due to different opinions of good acoustical environment
there is a big variety to consider. The expectations on the room are also effecting the experience
of the acoustics (Åkerlöf, 2001). For example, libraries are expected to be quiet and in churches
long reverberation time is expected even if the acoustic environment would be improved with
more absorbing surfaces.
Figure 19: Typical variation of reverberation time with volume for auditoria considered to have good acoustical
properties (Ginn, 1978).

29
Except for the reverberation time there are other factors to consider (Ginn, 1978). The size and
shape of the room as well as the placing of absorbents and sources are effecting the acoustic
environment. The size may create echoes, dead spots and flutter. Echo is sound reflections later
than 0.05 seconds after the sound is sent, perceived as later reflections and thereby disturbing.
Dead spots are places in a room where sound only reaches after it has passed a particularly
absorbing surface. Flutter emerges from parallel hard surfaces where the sound will bounce
between the surfaces, decaying slowly and therefore create noise.
2.6.4. Design of room for speech Rooms designed for specific purposes can be shaped for a good acoustic environment (Ginn,
1978). For speech the speaker needs to be heard clearly by everyone. Factors effecting the
ability to interpreted speech are background sound level, reverberation time and the shape of
the room. Noise from the background may mask the speech and should therefore be kept under
30 dB. Reverberation time should be in a specific interval in order to make a good acoustic
environment. Too long reverberation time will mask following speech due to slow decay time.
Too short reverberation time isn’t good either since reflections are necessary to spread the sound
enough. The shape of the room should avoid echoes, dead spots and flutter. The amount of
absorbents are connected to the volume of the room and the desired reverberation time. For
rooms made for music it is harder to get a good acoustic environment since it is very subjective.
Often aesthetics and other criterions are effecting the shape as well.
2.6.5. Room design The purpose of room acoustic design is to create a good acoustic environment adapted to the
disposal of the room (Rosenberg, 1992). For rooms with several using areas a perfect acoustic
environment is hard to achieve. In order to know if the acoustic environment is good a definition
of the function of the room is necessary. It is important to know if people in small groups are
talking to each other or if there will be for example lectures. The first example can be called
non-communicative and the second communicative. For the non-communicative room the
demands are easy to define. The room needs to be toned down in order to allow talks in smaller
groups. In other words, a short reverberant time is desired. Example of non-communicative
room are entrance halls, restaurants and corridors. For the communicative room is it more
difficult, and different types of purposes demands different acoustic environment. The volume
of the room is a crucial factor, for a speaker it gets harder to be heard with a greater volume.
The sound waves are reflected when it reaches surfaces. Early reflections help us receive the
information but later reflections creates echoes. Early reflections reach the ear of the listener
within 50 milliseconds. More and stronger early reflections creates a clearer speech. Later
reflections are better for music events. The architectural design of the room affects the acoustic
environment, for example a low ceiling results in less late reflections. The source of the sound
is crucial, a source placed in the middle of the room is generally a bad acoustic solution.
2.6.6. Shape The acoustic environment in a room is depending on the shape of the room (Dyrssen, 2014).
The dimensions, materials, boundaries and openings are effecting the acoustic outcome.
Besides this, the individual expectations and attitudes are essential for the experience of the
room. Social and cultural reasons for spending time in the particular room are soft value factors
that also contributes to the result. Sound can be a way to identify a room with lingering sound
that creates a specific acoustic environment for the room. By this we can recognize a room by
the way it sounds.

30
2.6.7. Sound isolation Noise from the outside should be minimized in favor for the acoustic environment (Rosenberg,
1992). Sound isolation is important in order to achieve the desired acoustic environment within
a building (Kinsler, 2000). Otherwise noise from outside will disturb and impair. Noise from
inside the building, for example air conditioners, should be considered in the design and
contribute to a low background sound pressure level. Noise from the occupation affects speech
intelligibility and is reduced by for example absorbents, i.e. low reverberation time (Rosenberg,
1992). The acoustic environment is depending on the design and flexible solutions expands the
possibilities. Curtains, screens and temporary absorbents are some examples.
2.6.8. Design phase The acoustic conscious of an architect can improve the acoustic environment in several ways
(Dyrssen, 2014). It will increase the insight of the room boundaries and transitions as well as
the sound directions and changes in a room and by that increase choices related to acoustics.
The materials, shapes and surfaces affects the way the sound will react and knowledge about
this will improve the acoustic environment. The social perspective may be involved as well.
The way people acts in the room and the way the acoustic environment responds, for example
if its tunes down, enhances or clarifies, will affect the experience. In addition, choice or colours,
visual expression etc. might be related to the sound experience. Aspects to consider while
designing a room from the acoustic point of view are what kind of opportunities that exists,
such as noise, sounds and activities. More specific opportunities are masking effects, special
qualities, social functions, listening requirements and accessibility requirements. An important
aspect is the persons the room is supposed to be designed for.
2.6.9. Sport halls Sports halls should be designed with short reverberation time and reduce sound at a large
distance, increase speech intelligibility at short distance, low noise level and have no reflections
or echoes (Bernström, 1987). In order to be able to give instructions and have education a good
speech intelligibility at short distance is necessary as well as the background noise needs to be
reduced. To achieve this the room should be designed with a small volume, low ceiling height,
absorbents on ceiling and walls, absorbents close to noisy installations and have no big hard
surfaces. This solution is difficult to apply to swimming halls due to function demands and
climate.
2.6.10. Swimming halls Swimming and water activities creates high sound pressure level at the same time as
communication and instructions are an important part of the activities (Saint-Gobain Ecophon
AB, 2002). Safety is also an important aspect to consider while designing swimming halls.
Large spaces make people talk to each other from greater distance which tend to raise to level
of speech in order to be heard above other conversations. This increase the sound pressure level
even more. Hard surfaces create a disturbing increase of sound pressure level and sound
distribution. In swimming halls, sound is allowed to travel far and one sound source disturbs a
lot of people. Hard floors create a high level of structural sound from steps. Figure 20 shows an
example of a swimming hall.
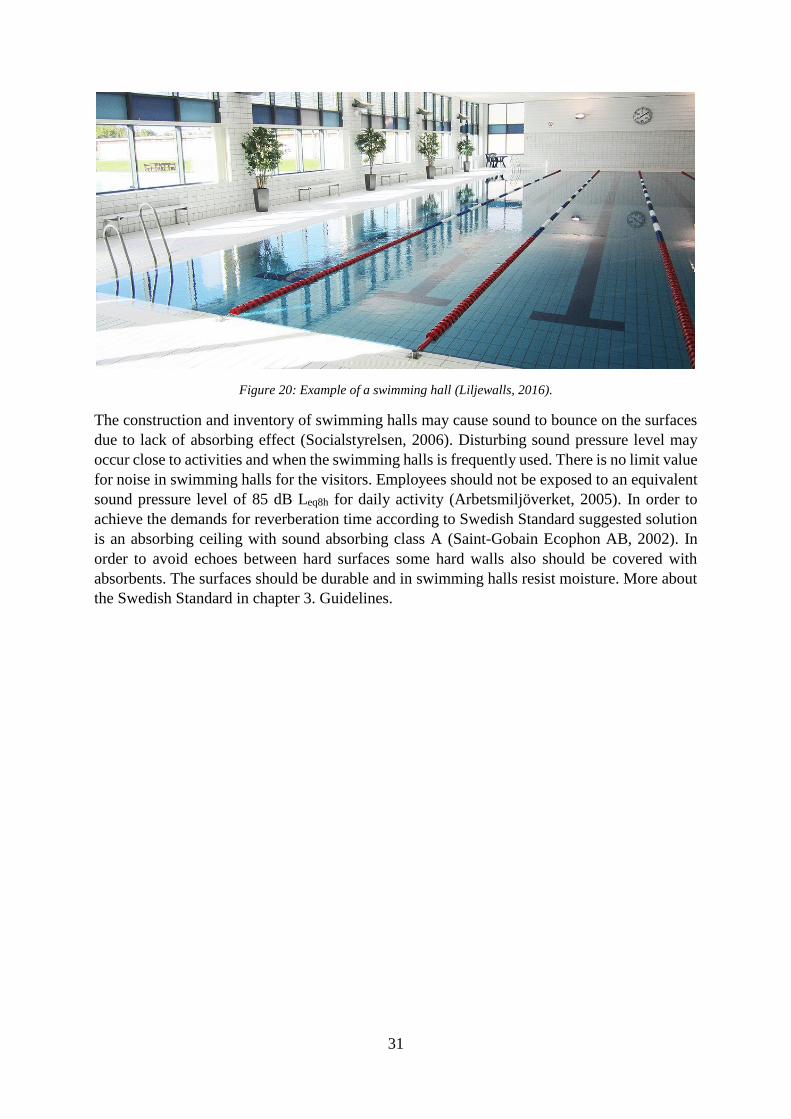
31
Figure 20: Example of a swimming hall (Liljewalls, 2016).
The construction and inventory of swimming halls may cause sound to bounce on the surfaces
due to lack of absorbing effect (Socialstyrelsen, 2006). Disturbing sound pressure level may
occur close to activities and when the swimming halls is frequently used. There is no limit value
for noise in swimming halls for the visitors. Employees should not be exposed to an equivalent
sound pressure level of 85 dB Leq8h for daily activity (Arbetsmiljöverket, 2005). In order to
achieve the demands for reverberation time according to Swedish Standard suggested solution
is an absorbing ceiling with sound absorbing class A (Saint-Gobain Ecophon AB, 2002). In
order to avoid echoes between hard surfaces some hard walls also should be covered with
absorbents. The surfaces should be durable and in swimming halls resist moisture. More about
the Swedish Standard in chapter 3. Guidelines.
32
2.7. Reference projects Three existing projects are used to detect current work and knowledge.
2.7.1. Introduction Existing projects are synoptically studied as a part of the empirical basis. All projects are
renovations where the purpose is to suggest sound standard sketches. In all cases the design is
determined and handed as fundamental information. Standard SS 25268 is used and sound class
C is aimed for. The three projects are listed below. The construction design is not included in
the thesis and focus is at absorbents and design.
2.7.2. Projects Sollentuna sim- och sporthall
Vallentunasimhall och gym
Farsta Sim- och idrottshall
2.7.3. Solutions The three projects have similar conditions. The design is consequently determined, that limits
the possibilities for acoustic solutions. All three has similar solutions, mostly absorbents since
adapted shaping isn’t possible. The suggestions for absorbents are similar for the projects,
summarized below.
Absorbents The two first mentioned projects have suspended ceiling with absorbent class A/Ah for the
whole ceiling area suggested, see 2.1.8 theory. For one of those swimming halls the existing
absorbents in the ceiling is calculated and is not completely fulfilling class A. The existing
ceiling is perforated plate and this decreases the absorption for high frequencies a bit in
comparison with absorbent without perforated plate. The last one suggests absorbents of
mineral wool in class A or perforated plate with at least 30 % open area and mineral wool
behind. The second alternative gives an experience of a sound reminding of a can. At least
absorbent of class B should be used for 70 % of the available wall area, suggested for one
project. For a wall separating two rooms with swimming pools the area above glass should be
provided with absorbents on both sides in the suggestion.
Other aspects One project accentuates that an existing problem in an educational swimming pool room is that
the sound pressure level is mainly caused by sound from the drain as well as from a loud
ventilation fan, and that these two needs to be altered in order to achieve a good acoustic
environment. Interesting aspects in the projects are as following:
“In the following, suggestions of sound demands are presented in consideration of room
acoustics, sound isolation and installation noise in order to achieve a, for the existing space,
good acoustic environment. The demands in the standard concerns only new constructions.”
”For description of room acoustical qualities a large number of parameters are available. Out
of these the reverberation time is the most common and at the same time easiest to subjectively
experience. In the proposal of sound standard the amount of absorbents and sound class is also
given.”

33
3. Guidelines
3.1. Demands Acoustic planning needs guidelines in order to reach a sufficient standard. Demands from
Swedish Standard and BBR for acoustics in swimming halls are presented below. Values for
reverberation time and sound pressure level are received.
Swedish Standard In the Swedish Standard SS 25268 ”Acoustics - Sound classification of spaces in buildings -
Institutional premises, rooms for education, preschools and leisure-time centers, rooms for
office work and hotels” demands for different kinds of spaces are presented (Swedish Standards
Institute, 2007). The standard is also used for the design of swimming halls. Demands for
reverberation time for swimming halls are presented, see table 4, but otherwise demands for
schools are used.
Table 4: Summary of demands from the Swedish Standard 25268:2007.
Space / Sound class A B C D
Higher level of education 1.2 1.5 1.5 2.0
Schools and pre-schools 1.0 1.2 1.2 2.0
Table 4 is a summary of demands for reverberation time in seconds from the Swedish Standard
25268:2007 for educational spaces, first higher education and then schools and pre-schools.
The demands are for large spaces for sports, for example sports hall and swimming hall.
The table above shows that a reverberation time of 1.2 s for elementary schools and 1.5 s for
high school is the longest reverberation time accepted for swimming halls in order to achieve
the demands of BBR. The background sound pressure level from installations is attached in
appendix for high schools, which is almost the same demands as for elementary schools. The
reverberation time is measured with T20 where the decay of 60 dB is evaluated from -5 dB to
-25 dB (Swedish Standards Institute, 2007). The Swedish standard 025268 recommends a
reverberation time of 1.0 or 1.2 seconds for swimming halls depending on the choice of quality
level (Saint-Gobain Ecophon AB, 2002). This is for frequencies from 250 to 4000 Hz but 125
Hz is allowed to be 20 percentages higher. For volumes above 1500 m3 an increased
reverberation time should be expected.
The standard contains guidelines for the design of spaces (Swedish Standards Institute, 2007).
Where speech intelligibility is important absorbents needs to be placed at more surfaces than
the roof when there are parallel surfaces. In that case, at least one of the opposite surfaces needs
to have absorbents or be heavy diffusing surfaces. At the height of the ear of the users of the
space is a preferred height to place absorbents. In a large space with a high ceiling height and
weak diffusing environment it is necessary to apply a sound diffusing or absorbing design of
several plane surfaces. The amount of absorbents should be distributed at roof and at least one
of two parallel surfaces. Spaces with a high contribution to the sound pressure level, such as
cafeteria and playroom, needs arrangements to reduce the sound source and should be designed

34
with a maximum amount of absorbents on several of the room’s boundaries. The increased
amount of absorbents will contribute to a lower sound pressure level.
BBR Boverkets byggregler, BBR, (Boverket, 2015) provides demands and general advices regarding
acoustics in buildings but also refers to The Swedish Standard SS 25268. Sound class C is
enough to reach the demands of BBR. The constitution states that buildings with locals such as
preschools, schools and office work spaces should be designed in order to limit disturbing noise.
This will avoid inconvenience and health issues for the users. Installations and elevators in the
building should be design to prevent noise, both from the object itself and from outside. This
should be done in consideration with the occupation so that it won’t be disturbing for people in
the building. Reverberation time should be chosen in consideration with the use of the space.
3.2. Certification Projects today are often designed with environmental certifications. Several certifications are
used, for example EU GreenBuilding, BREEAM, LEED and Miljöbyggnad (Sweden Green
Building Council, 2016). Miljöbyggnad is commonly used in Sweden and demands for the
acoustic environment are included, see extract in Table 5 and complete information in appendix
1. Miljöbyggnad considers structural sound, airborne sound, sound from installations and sound
from the outside, but not reverberation time. For a higher value the acoustic parameters, two
for silver and all for gold, needs to exceed class C and swimming halls are already difficult in
an acoustic perspective.
Table 5: Demands for acoustic environment in all kinds of new buildings for the levels Bronze, Silver and Gold
(Sweden Green Building Council, 2016). Sound classes according to SS 25267 or SS 25268.
Demand Bronze Silver Gold
Acoustic
environment
Sound class C for the
four parameters
At least two out of the
four parameters fulfills
Sound class B
At least Sound class B
on all four parameters
BREEAM uses a system with points, and demands for acoustics exists where more points are
distributed for class B for example. The total amount of points for the project decides the
certification, and therefore acoustic demands are not necessary to use if other parameters may
fulfill the necessary points together.
3.3. Target values for sound pressure level Folkhälsomyndigheten gives some target values of maximum sound pressure level in order to
avoid hearing damages and inconvenience. The highest sound pressure level recommended for
areas where children and adults are staying is LAmax 110 dB and LAeq 97 dB
(Folkhälsomyndigheten, 2014B). Target values for noise levels are presented below in Table
6 and are recommendations to avoid inconvenience, followed by target values for low frequency
sound in Table 7 (Folkhälsomyndigheten, 2014A).

35
Table 6: Noise (Folkhälsomyndigheten, 2014A).
Maximal sound pressure level LAmax 45 dB
Equivalent sound pressure level LAeq 30 dB
Sound with hearable tones LAeq 25 dB
Sound from music systems LAeq 25 dB
Table 7: Low frequency sound (Folkhälsomyndigheten, 2014A).
f (Hz) SPL (dB)
31.5 56
40 49
50 43
63 42
80 40
100 38
125 36
160 34
200 32


37
4. Methodology
4.1. Description The research is conducted with the methodologies described below. In order to reach satisfying
information a literature study, interviews, questionnaires, measurements and simulations are
performed. More about the motivation further down in the chapter.
4.1.1. Literature study New research needs to take existing published material into consideration (Merrian, 1994). The
purpose of the research is to contribute with new knowledge and therefore useful existing
information needs to be considered. A literature search summarizes the available information
about a subject and the purpose is to show the “state of the art”, which means the current
situation. This is a basis for improvements of the area and continued research. All published
materials are usable for research (Ejvegård, 2009). Key words are important to use in the search
of relevant information. The search for information is done at databases, libraries etc. and
documents, publications and books are examples of information sources. A whole essay may
be collected literature since the research is rapidly increasing and overviews are more important
nowadays. Documents not produced for research is a source reflecting the reality and is useful
for qualitative studies (Merrian, 1994). They contain phenomena about the pre-defined
problems and provides an empirical basis.
4.1.2. Case studies Research can be done in a lot of different ways, for example case studies where the methodology
consists of interviews, questionnaires, focus groups, document analysis etc. (Gibson, 2009). A
case study can involve a person, an institution or other categories. The design of the research
contains a few fundamental steps: specify questions, choosing sites and participants and
deciding how to analyze the data. Case studies examines one or several cases about a particular
problem (Merrian, 1994). Case studies are anchored in reality and gives a holistic statement of
the phenomena.
Two examples of approaches are non-experimental studies and experiments (Gibson, 2009).
Non-experimental studies consists of one or several cases studied in detailed and compared to
each other when several cases are used. The data is sampled from both quantitative and
qualitative research. The result is a description or an explanation of a phenomenon (Merrian,
1994). The result is analyzed qualitatively. Experiments are examining a phenomenon with a
broad use of data collecting; interviews, questionnaire and observations (Gibson, 2009). The
purpose is to study the relationship between cause and effect (Merrian, 1994).
4.1.3. Qualitative and quantitative methods In order to collect opinions, knowledge and information qualitative and quantitative methods
can be applied. Qualitative research is a flexible method and results in a lot of data reflecting
the design of the research (Gibson, 2009). The researcher affects the outcome of the qualitative
research when constructing the research, called reflexivity. The purpose of the methods is
according to the author:

38
“Analysis involves deciding what counts as variables in the first place, on making sense of any
relations that may be found between variables, and on relating statistical findings to research
questions and concepts”.
Interviews and questionnaires study a few pre-defined variables with a great number of search
units (Merrian, 1994). Variables are chosen from theory and models. This may produce
quantitative results. Interviews can be used for qualitative research as well (Holme & Solvang,
1997). Quantitative methods produce results in numbers and qualitative methods are expressed
in writing (Merrian, 1994).
4.2. Questionnaire and interviews In order to find out the opinion, idea and knowledge of people questionnaires and interviews
may be used (Ejvegård, 2009). Interviews are verbal and questionnaires are written. A
questionnaire consists of several printed questions handed out to a number of persons in order
to collect opinions. Interviews may be used to evaluate the expert’s knowledge and experience.
Different kinds of questions may be used for interviews, structural and non-structural, but for
questionnaires only structural questions are used. Structural questions are pre-defined, both the
content and formulation. It can be open or closed answers, where closed is constructed with
different options to choose from. Participants should not be totally transparent (Gibson, 2009).
A certain visibility is necessary. Sometimes the participant’s wants anonymity and pseudonyms
can be used, but often the identity or a lot of information of the participant is necessary for the
analysis. Anonymity can be hard to achieve because a lot of information can be essential and it
can be difficult for the researcher to know what kind of information that is easy to recognize.
The purpose of interviews and questionnaires is to create data of a specific topic and the
participant’s insight in this particular subject.
4.2.1. Interviews Interviews are executed with one expert at a time (Ejvegård, 2009). These often take a lot of
time and the people should be chosen with consideration. The selection of respondents is
important (Holme & Solvang, 1997). The selection is systematically and not randomly from
chosen criteria. The respondents need to contain sufficient knowledge of the subject in order to
contribute to enlarged information content in the research. One problem that may appear is that
experts may bring a mispresented picture of the matter and may be very persuasive. The method
demands a lot of effort from the researcher, who needs to be involved in the subject. The
identities should not be disclosed without consent and the report should be written so that
answers may not be apparently belonging to someone (Ejvegård, 2009). In order to do this
several interviews are necessary. It is important for the researcher to know the purpose of the
study in order to get relevant answers and ask the important questions. Interviews can be
performed in different ways. Structured interviews consist of questions that are asked to all the
participants in the same sequence (Gibson, 2009). The questions are predefined and carefully
developed to be precise and relevant for the research. Semi-structured are adapted after the
outcome of the conversation. It contains several predefined questions but can be asked without
order and with a different emphasis and formulation. The questions need to be asked at
appropriate times and the researcher have to be able to listen to the answers and adapt the
following questions. Unstructured interviews has no predefined questions and the interview will
develop subsequently.
39
4.2.2. Questionnaire Easier, cheaper and less time demanding than interviews are questionnaires (Ejvegård, 2009).
This will collect opinions from a large number of people in writing. Response rate and response
loss is essential to address. Response loss is when people hand the questionnaire back
unanswered or when answers to questions are missing. The number of answered questionnaires
must be large in comparison to the asked crowed, with 80 percent being an appropriate limit.
Questionnaires with at least 40 answers are meaningful to process statistical. The same
questions are asked to everyone and the answers are easy to compile. The questionnaire should
not be too large and he questions must be easy to interpret. Questions cannot be guided in this
case either. Closed answers must exclude each other in order to be possible to answer correctly.
Closed answers are easy to process statistical. Questions with open answers are useful to detect
missing parts or get valuable comments. Questions regarding opinions should always have an
odd number of answers in order to have an answer without any statement, an answer for
“neither”. A problem with questionnaires is that for example the scale from bad to good may
be interpreted different to people.
4.2.3. Reliability and validity Reliability of a measurement method is important in order to judge the usefulness (Ejvegård,
2009). Reliability of questionnaires is depending on how the questions are asked and how they
may be interpreted. In order to evaluate the reliability of the questionnaire is to see if
contradictions within one answer occur. Contradictions indicate low level of reliability.
Validity considers if the method is measuring the pre-defined question (Ejvegård, 2009). The
measurements can be created from by pre-defined criteria and if these aren’t sufficient the result
may be deceptive. Questionnaires are difficult to test for this. If there is a reference to the
measurements results comparison may be performed. Reliability is necessary in order to be able
to achieve validity, but sufficient reliability isn’t always providing validity.
4.2.4. Analyze The data is translated in order to represent the results (Gibson, 2009). In this process decisions
about relevance and analyzing discernment is done by the researcher. The result represents the
processed data. The aim of the result is to present an analytic focus of the data. Analysis of the
data is performed to find similarities, differences and themes. Three basic studies are
commonality, differences and relationships. Commonality is defined as similarities that can be
categorized, differences are the contrast in the data and relationships are relations between
different variables and phenomena. A relation might be defined as a hypothesis in the study.
4.3. Motivation Literature is collected mainly from the University of Lund’s library and database. Keywords
such as fundamental acoustics, room acoustics and swimming halls where used. The literature
is critically chosen. During the literature search the absence of published work within the
chosen subject was obvious. The presented literature is used to explain important parts of the
subject in order to complete the thesis as well as to be a basis for problem formulation, choice
of method and analyzes.
The chosen method is experimental case studies consisting of interviews, questionnaires,
measurements and simulations. The interviews treat the subject widely in order to collect the
existing knowledge within the subject. Since there isn’t a lot published work about this topic it

40
was necessary to examine current knowledge and work procedure. Measurements and
simulations on a specific case were performed as well and together all these parts creates new
information. Smaller studies on existing documents of swimming hall projects were performed
as a cross case study in order to increase the knowledge of the state of the art.
The existing knowledge base, work procedure and view of the acoustic part in the design phase
of swimming halls was visualized by the interviews. This contributes to the thesis with a
qualitative analyze. The selection of respondents was focused on the involvement in swimming
hall projects and the knowledge. In order to find answers to the problem a broad view was
desired. Respondents are chosen to present several sides of the involved persons in the projects.
Out of the asked persons the majority are acousticians with great experience in the subject, as
well as entrepreneurs, architects and other experts are included. This is necessary since the
acoustician’s focuses on sound and to only ask them will probably bring a misleading view of
the current situation. The collaboration between the different parties is also of interest and in
order to examine this all views must be represented.
The interviews were performed one by one, either in person or by phone. Four standardized
questions were used in order to compare the answers. They were asked in the same way and
they are structural questions. Other questions asked were semi-structural, pre-defined in order
to suit the specific expert but asked depending on the outcome of the interview. Some persons
talked a lot on their own and some interviews consisted of many pre-defined questions. The
interviews were successfully performed. As many interviewed experts as possible was desired
but since interviews are very time consuming the total number of people is limited although
sufficient to bring a lot of knowledge to the study. Overall the collected information is a large
amount and circumstantial to analyze.
Questionnaires are performed in order to collect the opinion of the visitors. Since the experience
of the sound environment is subjective the opinion of a larger number of people is of interest.
The target group was chosen to represent the experience of a visit to a swimming hall and
questionnaires were handed out to leaving visitors at particular occasions. This limits the
number of respondents but every questionnaire is answered by a relevant person with the
experience still in mind. On occasion was at an exercise swimming pool during calm hours and
the other one at a large swimming hall with several pools as well as adventure baths during rush
hours. The purpose is to find themes and relations between variables and the experience. The
questionnaire was handed out to as many visitors as possible and only a few declined. The asked
persons were limited by age, where children were not asked.
The questions are handed out on a questionnaire, see appendix 2. The questionnaire consists of
pre-defined closed questions with alternatives where the “neither” is included where needed.
At the end one open question exists in order to give the respondents an opportunity to give
comments. The questionnaire was available in Swedish and English. Overall the questionnaires
went well. Out of the target group many people answered and the total amount is enough to
process statistically. The questionnaire consisted of both front and back and in some cases the
back was missed. The first English questionnaires handed out seemed to be in too advanced
language, this was altered for the second round.
The questionnaires yield results that are possible to do quantitative analyzes on. This is used in
the thesis in order to represent the experience of the sound environment in order to fulfill two
purposes.
41
1. Map the subjective attitude to the experience of sound environment.
2. Compare to the actual sound environment and measured values
The first purpose is used to see the opinion among people. For example, if the sound
environment affects the experience and if the sound environment affects the choice of
swimming halls. The second purpose is to be able to compare the environment in a particular
swimming hall to the experience. In the swimming hall measurements were performed and the
answers in the questionnaires are related to the measurement values. The first one was not
measured but the situation is known to be calmer.
Employees at the swimming hall where the measurements were performed were handed a small
questionnaire with open questions. These were performed as a sample of the experience of the
people working in the swimming halls. They were able to answer the questions anonymously
without influence from the researcher. These are analyzed qualitatively.

43
5. Interviews and questionnaires
5.1. Interviews In order to collect sufficient information interviews have been conducted. Circumstantial
interviews with professionals are presented below and questionnaires with visitors and
employees in the swimming hall are presented further down in 5.2.
5.1.1. Execution In order to investigate the current work and view on acoustics in swimming halls eleven people
with great experience of the topic was interviewed. The group exists of persons involved in
swimming halls in Sweden, from developers and entrepreneurs to architects and acousticians.
The largest group consist of acousticians, five out of eleven respondents. All respondents
possess necessary knowledge and expertise of the field. Four identical questions were asked to
everyone in order to compare the opinions, listed below. Two exceptions were made, one
respondent had a different knowledge base and the questions was not relevant and one
respondent focused on experience from working on a particular project since the standard
questions were already asked to a colleague of the respondent. Otherwise the interviews were
performed similar and the standard questions asked in the same way, as structural questions.
Other questions asked were written ahead and based on the knowledge of the particular person,
then asked depending on the outcomes, as semi-structural interviews. The interviews were
performed one at the time on a meeting in person or by phone.
The 4 standard questions:
How do you work in order to achieve a good acoustical environment in swimming halls?
What kind of solutions are used?
What kind of compromises regarding other demands comes up at the design phase of
swimming halls?
How prioritized would you say acoustics are general at the early design phase of swimming
halls?
What are the general factors of success in a swimming hall?
5.1.2. Overview standard questions The four standard questions are summarized one by one. The summarize represent the answers
given to the specific question during the interviews. The answers are represented quantitatively.
Question 1 How do you work in order to achieve a good acoustical environment in swimming halls?
What kind of solutions are used?
Summary
Calculations, models and sometimes measurements are the used methods. The most common
solutions are absorbents in the ceiling, partly on the walls and inclined walls. Absorbents in the
ceiling are used every time according to the respondents. Wall absorbents are used in varied
44
extent. Inclined walls are an acoustic solution effecting the fundamental design. The answers
are more detailed described below.
Methods
In order to achieve a good acoustic environment in swimming halls methods as calculations,
models and measurements are applied. One respondent says that for existing swimming halls
in need to be altered, measurements regarding reverberation time are performed and then a
sufficient amount absorbent is calculated, while new swimming halls should be calculated from
the beginning. The second statement is also mentioned by other respondents who say that a
planning with calculations of amount of absorbents is used to receive the desired reverberation
time, and that models are made in a software. The acoustic solutions are then determined from
the calculations. Measurements may be performed in order to control the results but are not
always performed.
Ceiling absorbents
Absorbents in the ceiling are used to absorb sound and reduce reflections. Absorbents in the
ceiling are always a solution to achieve a desired acoustic environment in swimming halls and
are directly mentioned by seven of the nine respondents that answered this question.
Wall absorbents
Wall absorbents are mentioned as a solution by six of the nine asked people. Common wall
absorbents are both soft and wooden hard absorbents, and it is important to cover them from
damage. Soft absorbents are hung high on the wall, usually at 3 meters height, and hard
absorbents may be placed lower, down to 60 centimeters above the floor. Since people may
reach these absorbents they need to be resistant. These absorbents usually have a durable outer
layer and an absorbent behind. The attachment to the wall is crucial to avoid moisture problems.
Inclined walls
Inclined walls are used to make the sound waves reach the ceiling absorbents earlier and thereby
reduce the reflections, as a more efficient solution. Most common is to tilt one wall, usually the
one that is easiest and cheapest to angle. Inclined walls aren’t always appreciated by the
architect, according to one acoustician, and one way to compensate for this is to use absorbents
lower down on the wall instead of tilting the wall. Another example, mentioned by two
respondents, of a compromise are walls that are impossible to use absorbents on, for example
if it is glass, holds equipment or needs to be easily cleaned, then to tilt the wall is a solution.
Inclined glass walls have been proven to be a successful solution according to one respondent.
Wall absorbents was in one example tilted in order to make up for lack of total cover of
absorbents in the ceiling. Inclined walls are mentioned as a used solution by six of the nine
respondents and all of these three solutions seems to be applied as standard solutions in
swimming hall projects today.
Question 2 What kind of compromises regarding other demands comes up at the design phase of
swimming halls?
Summary
Moisture, cost and aesthetics are the main compromises in relation to acoustics. Moisture is an
issue expressed by five, cost by two and design by six out of nine. Moisture is necessary to
consider, especially with the climate in a swimming hall. Cost is often a factor but it seems that
swimming halls are project where acoustic solutions are prioritized and cost is not a big
45
obstacle. Compromises may occur in the choice of material and absorbents but according to the
respondents this is not a main issue. Aesthetics and design seems to be the biggest issue, partly
because the design may be decided before the acoustician comes in and partly because acoustic
solutions affects the design vision. Acoustic solutions are often invisible and without a distinct
purpose for the visitors, and therefore may create confusing visuals. The architects have design
as an issue, and problems may be a more boring design and to find different designs for each
swimming hall when the solutions are similar. Moisture is a divided issue, five respondents say
that it is an issue and important to consider and one thinks that it is not interfering since
absorbents is made to resist moisture etc., and the three others doesn’t mention moisture as a
compromise.
Other compromises expressed are resistance and hygiene, mentioned by five respectively one.
Resistance as in durable hard absorbents as well as a sustainable building. Hygiene puts
demands on surfaces and makes it harder to apply acoustic solutions. Compromises with the
construction solutions occurs according to one respondent since it is crucial to build a sealed
building. This is especially crucial with inclined walls. In order to success with this easy
solutions and easy connections are preferable, and easy connections are mentioned by two.
Glass is mentioned as a problem by four respondents, for example the difficulty to lean glass
walls and that rooms with a lot of glass surfaces creates high sound pressure levels.
Question 3
How prioritized would you say acoustics are general at the early design phase of swimming
halls?
Summary
The respondents has different views about the priority. The opinions vary from that it is very
prioritized to that acousticians are involved too late. Out of nine respondents five says that it is
very prioritized and considered initially. One says mediocre and one says that it is getting more
and more prioritized. One respondent say that it depends on the project team and another
respondent thinks that the acousticians are involved too late and that the consequence of that is
expensive arrangements afterwards.
The respondents who thinks that it is very prioritized says that there is a consciousness about
the risk for bad acoustic environment in swimming halls, the loud working environment and
that alterations later on are expensive. Also classification, such as Miljöbyggnad, puts demands
on the acoustics. One of the other respondents says that acoustics isn’t a main issue with new
constructions. Two of these respondents says that the acousticians are involved in the initial
phase. Acoustic solutions are crucial for the design, for example inclined walls, and therefore
it is necessary to discuss this at an early stage in order to avoid problems further on. Two
respondents express an issue with architects who prioritizes design or think they have enough
experience to re-use solutions. One respondent says that it varies a lot between teams and where
persons with experience from swimming halls are involved the result is better. The respondent
that thinks acousticians comes in too late says that the solutions could be improved otherwise
and that the acoustic environment is crucial also for safety reasons. The common opinion is that
acousticians must be involved initially.
46
Question 4 What are the factors of success in a swimming hall?
Summary
The fourth standard question is a general question where all the different professionals got an
opportunity to focus on desired factors, not only acoustics aspects. The answers are therefore
scattered and a lot of different aspects are presented. By the acousticians four out of five has
the acoustic environment as an aspect. Three of them connects that to wellbeing, and those two
aspects are the factors of success. The other two also mentions the logistical planning, the
prestige in swimming halls that will make it a better building and that the result is better if
architects and acousticians develop the solutions together. Acoustic solutions should contribute
to the design and not be an obstacle. The architects mentions attraction, good maintenance and
that every user should feel included. Other respondents state the importance of initial studies
and analyzes of other swimming halls, include the opinions from performers and use
experienced persons during construction. Several of the mentioned respondent mentions
wellbeing, including all users, teaching the municipality to swim, a successful layout and room
planning, and attraction. One respondent says that experience and knowledge among the
involved persons during the project is crucial for a successful result due to the complexity of
swimming halls.
5.1.3. Miscellaneous The interviews resulted in a large amount of information. The part above presents the standard
questions common for all respondents. Moreover, information about a lot of topics were
collected. The most relevant parameters regarding the acoustic environment in swimming halls
are presented below.
Collaboration between architects and acousticians One aspect mentioned by several respondents is the collaboration between architects and
acousticians. Two respondents say that it is important for the acoustician to work together with
the architect and together create solutions. Acoustic solutions should in order to be successful
contribute to the architectural experience, and not the opposite. According to one respondent
there are cases when the architects has a vision about the design from the beginning, and then
the acousticians needs to implement this and make suitable solutions. The architects view is
that it is possible to make good compromises. It is important for them to combine demands with
the visual. Undesired acoustic solutions may be compromised by add more absorbents at
another place or tilt another part for example. For the architect it also is a difficulty to work
with acoustic solutions in order to find new aesthetical appealing solutions for each project.
Safety
The safety in swimming halls should be a big acoustic discussion. In this thesis this is outside
the margins but reflections about this are still made. The respondents say that it is a safety risk
with high sound pressure levels. Evacuation and to hear teachers and children from a distance
is obstructed.
Work environment The acoustic environment is effecting the working environment. The employees at swimming
halls may suffer from the consequences. The opinion from the respondents is that it is an
environment with high sound pressure level and due to this it is an exhausting working
environment. Other aspects are impulse sounds from whistle blows or shouting children, as well
as the high temperature and moisture level. Two respondents say that the discussion about

47
working environment increases the prioritizing of acoustics and that the discussion is included
in the design phase. One respondent says that the sound pressure level will be too high without
sufficient acoustic planning and thereby effect the work environment badly. On the other hand,
one respondent says that it is not widely discussed now but is a growing topic.
Experience
The importance of experience also became a discussion with the respondents. Five respondents
say that it is important and three of those five claims it to be fundamental in order to success.
Experience is important because the more involved you are in a project, the more you know
about good solutions etc. according to one respondent. Swimming halls seems to be a
challenging project to do for the first time but experience in the project team and shared
knowledge is a key to handle that, but that it might be hard to collect the knowledge without
support. Since the client often is a municipality, with few swimming hall projects during a long
time, lack of experience is likely to be a problem. This can be handled by a good relationship
between the client and entrepreneur so that they will take part of the knowledge. One way to
achieve this are partnering projects. Experienced consults in different areas are of great
importance.
Education
Educational spaces should enhance consonants and diminish vowels in order to increase the
speech intelligibility. Office spaces should be made the opposite way since you don’t want to
hear each other. In order to achieve a good educational room, the vowels should be reduced,
since it is harder to increase the energy in consonants in speech. Signal-to-noise will affect the
speech intelligibility and C50 are a measures of that. The Lombard effect is important in
educational areas, and means that people will speak 10 dB higher than the background noise.
In swimming halls, the background noise should be reduced in order to reduce the speech sound
pressure level. According to three respondents speech intelligibility is an important factor in
swimming halls. It will affect the educational situations. Another respondent thinks that the
environments might be loud but that education often is working well, depending on the teacher.
In educational situations screens seems to be a desired solution according to several
respondents. One respondent says that the sight is crucial for guards and that sufficient passages
is necessary which may limit the possible use of screens.
Suggested solutions During the interviews a lot of different sound related aspects came up. This is summarized
below and will show a general view of the important aspects of acoustics related to swimming
halls.
The most desired solution seems to vary between the respondents, where four respondents gave
strict answers during discussion. Two respondents mention that it is more effective to tilt a wall
than to use a lot of absorbents. Another respondent says that it is better to absorb than to diffuse
and one respondent prefers high frequency absorbents instead of inclined walls, except from
glass walls where diffusing is the only option. According to one respondent diffusion is
important in swimming halls due to the limited possibility to use absorbents. Overall it seems
that most respondents prefer to use an inclined wall when possible. Inclined walls are used only
for acoustical reasons. According to one respondent diffusion is important to create a desirable
acoustic environment since it makes the sound softer. Not only the sound pressure level is
important, if the sound is intrusive or pleasant makes a difference.

48
In general, the purpose is to alter hard parallel surfaces, either by absorbents or by tilting a wall.
The most common solution seems to be one inclined wall and one or more walls with
absorbents. The ceiling is always covered in absorbents and the mission is to as quick as
possible bring the reflections to the ceiling. Successful solutions are, according to one
respondent, hard absorbents, diffusing surfaces and to hide the low frequency absorbents in the
ceiling. One respondent says that absorbent should be maximized where possible and two
respondents says that the swimming hall never will be too sound absorbing.
The angled of inclined walls was discussed more deeply with two respondents with great
knowledge. The angel needs to be at least 3-4 degrees to be sufficient. More degrees will
provide a better result. 5 and 7 degrees seems to be common and the interval stretches up to 10
degrees, although the trend might be moving towards the lower angles. Two inclined walls
opposite each other will need less inclination but according to all the respondents the most used
solution is to tilt one wall. According to one respondent problems may occur with inclined walls
due to accessibility demands where passage can’t be too narrow and fixed installation areas for
example.
A debated topic during the interviews is the use of glass. As mentioned before several
respondents experienced glass as a problem, due to the contribution to a worse acoustic
environment and the difficulties with tilting it. One respondent had an example where a glass
wall was exchanged during the design phase in favour for the acoustic environment. One
respondent says that one way to reach a good acoustic environment as well as energy
performance is to reduce the glass areas. The same respondent also says that large glass walls
has been a tradition in Sweden and maybe it is time to re-evaluate the use of glass walls in
Swedish swimming halls.
A lot of other aspects are also affecting the acoustic environment. One large sound source in
swimming halls is the water, particularly the drains by the pool edge. These generates a high
background level and people will raise their voice to be heard. Solutions to reduce this sound
source are existing, for example plastic or tilted drains, according to one respondent. One
respondent say that an improvement would be to include an acoustician while designing the
things that creates large volumes, for example attractions in adventure baths. Vegetation is
commonly used in adventure baths and according to two respondents it makes a difference.
Vegetation isn’t directly effecting the acoustic environment but helps to diffuse the sound and
also experienced as soothing. One important aspect to consider while designing the construction
mentioned by two respondents is crosstalk, when sound escapes through installation etc.,
between rooms.
Opinions regarding demands The reverberation time is related to the room volume. High ceiling height creates longer
reverberation time and may be a problem in swimming halls according to several respondents.
According to one respondent reverberation time is the measure most effecting the experience
of the sound in every type of building, not only swimming halls. The reverberation time seems
to be a target instead of a demand due to the limitations of acoustic solutions. The desired values
are 1.5 in large rooms and lower, 1.2 or less, in smaller room and adventure baths. One example
according to one respondent when the reverberation time was higher than desired where when
walls couldn’t be as inclined as desired by the acoustician and the room is large with high
ceiling height. In adventure baths the interior design makes it hard to calculate the reverberation
time in advance with walls, levels, bridges etc. One way to address the acoustic aspect within

49
the design according to two respondents is to use rounded figures that sends the sound upwards.
It is also important to avoid plane surfaces reflection the sound waves back and forth.
The regulation used for designing swimming halls is SS 025268. The demands are directed to
school locals and is not adapted to swimming halls. The overall view is that the regulation is a
support for the acoustician but experience is more important. One respondent thinks that the
regulation isn’t working at all and that other aspects than reverberation time is important, such
as impulse sounds from screams etc., but the regulations may be used for supporting the
acoustician. Two respondents say that improvements of the standard isn’t necessary since
swimming halls is such a special type of building and experience is sufficient. Besides
experience visits to other swimming halls seems to be a useful source to make a successful
swimming hall.
Environmental certification is an aspect mentioned by three respondents. Two respondents say
that it limits the possible solutions. One example of a problem that occurs is that structural
sound needs to be altered in order to achieve the higher demand but it won’t affect the acoustic
environment a lot and will provide a less sustainable solution. One respondent mention that it
is making the acoustic environment more prioritized in the design phase.
Design phase The design phase holds a lot of decisions creating the final result. All respondents think that it
is important to consider acoustics from the very beginning. Following are some quotes about
this, translated from Swedish.
“In the initial phase a lot of decisions are made, things appearing later on creates problems. If
the (acoustic) demands isn’t considered from the beginning, it will be problems afterwards.”
“Make as much acoustic work as possible as early as possible”
“Unspecific demands in documents creates problems later on where they are harder to solve
and more compromises are needed. It is better to have the problems at an early phase, in order
to be able to work together”
All quotes can be applied to the design phase of all projects and empathizes the importance of
early solutions. One respondent says that acoustics is considered already during the sketching
in swimming hall projects and a design that will work with acoustic demands needs to be
chosen. One way to work with acoustic demands at an early stage is to do study visits and map
the sound sources in swimming halls. According to one respondent it is important to write
descriptions about the acoustic environment in the different locations in words before values in
order to reach the client. Another respondent says that experienced persons should explain the
difficulties with acoustics to the client and be clear about what they want to create. One
respondent says that the acoustician needs to be included in the initial phase and look at what
can be done and how to do it. Experienced people will provide solutions proven to work and
the solutions should be included from the start.
One aspect that occurred during interviews is that acoustic solutions isn’t the factor of success
for architects. Acoustic solutions aren’t placing the architects in architectural magazines or
winning a competition. Acoustic solutions are, according to the respondents, invisible. As
mentioned before, acoustic solutions should contribute to the design and not decrease the
50
visuals. The solutions aren’t always logical to the viewer, an example of this is inclined walls
that may seem strange for the visitors and therefore disturbing the architectural entirety.
51
5.2. Questionnaire visitors Questionnaires was handed out to visitors in swimming halls in order to detect the subjective
aspect of the subject. The result is analyzed statistically and compared to measurement values.
5.2.1. Execution The questionnaire consists of closed questions and one open question for comments. The
detailed responses from the questionnaires are attached in appendix 2, followed by the
questionnaire in both Swedish and English versions.
Occasions
The questionnaires was handed out at two occasions. The first occasion was at an exercise
swimming pool divided in two sessions of about two hours each. The first one was during
daytime when it was calm and without children. The later one was during an event with low
music, candles and without splashing sounds etc. The second occasion was at a large swimming
hall at the time it usually is as busiest. The questionnaires were handed out during 2.5 h and at
the same time as measurements of sound pressure level was executed. The target group was
people leaving the swimming hall and at both times the position was nearby the exit from the
swimming hall.
Kockums Fritid
Friday 26/2
Occasion 1: 14.15-17.00
Occasion 2: 18.30-20.30
Hylliebadet
Sunday 24/4
Occasion 3: 14.10-16.40
The total number of filled out questionnaires is 133, where the different occasions contributes
with 43, 43 and 47 each. The question with least amount of answers is at 126 due to missed
questions on the back, so in general all questions are well represented. The total amount is
analyzed as a general opinion as well as the different occasions are used to find a connection
between variables and experience. The amount of answers is enough to statistically analyze it
together as well as separated. Out of the target groups the majority was asked to fill out the
form, some was missed due to full occupation and only a few people declined in both cases.
The amount of answers is well representing the opinion of the visitors during the chosen time.
Observations During the occasions observations of the swimming halls was performed. The first occasion
was describing as calm by the respondents and the visitors was there for exercise and hardly
any children where present. At the second occasion the main sources are the water and children
shouting and the sound pressure level reaches high levels, see Chapter 6. Measurements.
5.2.2. Response The responses are presented below. First as a summary of the response to all of the questions.
The summary is followed by graphics for three chosen questions and further down each
question is presented one by one.
Summary The majority had a good experience and the respondents are assumed to be positive to the
swimming hall. The majority also rated the acoustic environment as good, especially in the
calmer swimming hall. About the effect of the acoustic environment the opinions are scattered,
but the trend is increasing along the scale and the majority thinks that it does affects.
Communication is rated well and the aesthetics is also appreciated. The two swimming halls

52
are rated to be better than other swimming halls in general, as well as many people also
answered “don’t know”. The opinion of if the acoustic environment affects the choice of
swimming hall is scattered, 40 % on each side and 20 % is neutral. Tiredness is very seldom
experienced as a consequence of a visit in a swimming hall by the respondents. This is
comparable to the opinion of the employees.
The total distribution of responses for the three occasions and total value for the most interesting
questions are included below in figures 21-23. Occasion 3 is related to performed
measurements.
Figure 21: Response rate question 1
Figure 22: Response rate question 2
0
10
20
30
40
50
60
70
1 2 3 4 5
Nu
mb
er
Opinion
How do you experience the acoustic environment?
Occasion 1 Occasion 2 Occasion 3 Total
0
5
10
15
20
25
30
35
40
1 2 3 4 5
Nu
mb
er
Opinion
How does the sound environment affect your experience?
Occasion 1 Occasion 2 Occasion 3 Total
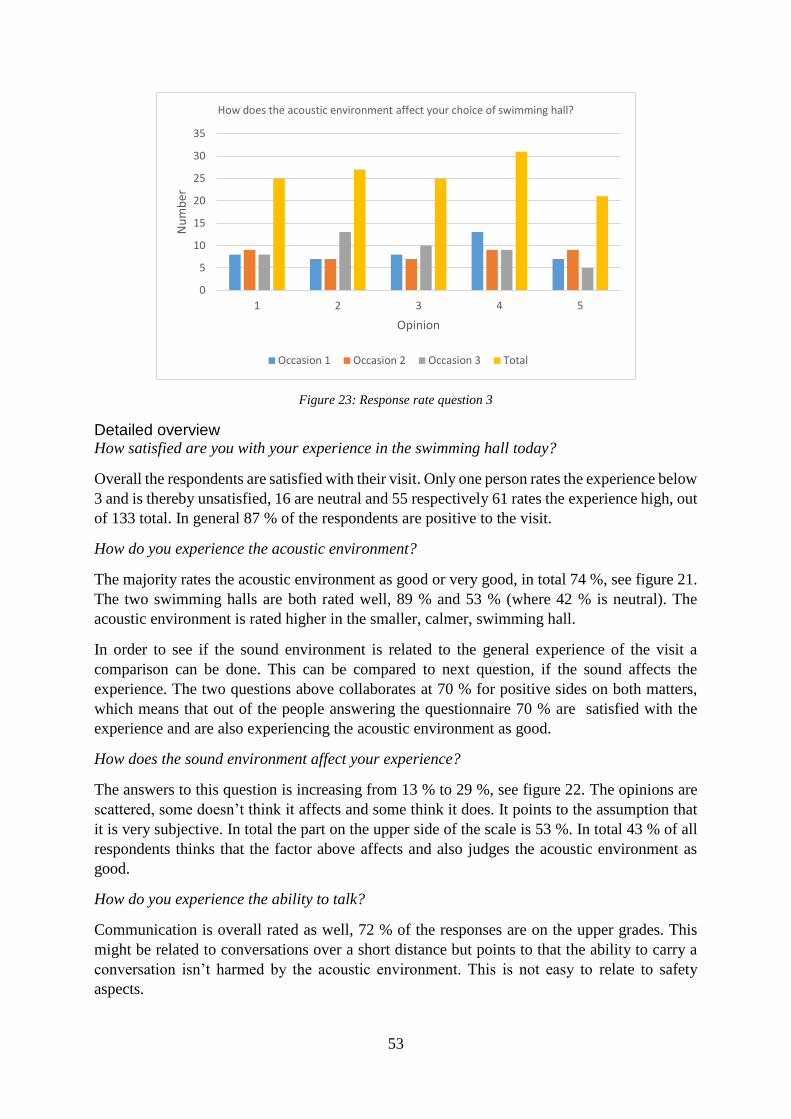
53
Figure 23: Response rate question 3
Detailed overview How satisfied are you with your experience in the swimming hall today?
Overall the respondents are satisfied with their visit. Only one person rates the experience below
3 and is thereby unsatisfied, 16 are neutral and 55 respectively 61 rates the experience high, out
of 133 total. In general 87 % of the respondents are positive to the visit.
How do you experience the acoustic environment?
The majority rates the acoustic environment as good or very good, in total 74 %, see figure 21.
The two swimming halls are both rated well, 89 % and 53 % (where 42 % is neutral). The
acoustic environment is rated higher in the smaller, calmer, swimming hall.
In order to see if the sound environment is related to the general experience of the visit a
comparison can be done. This can be compared to next question, if the sound affects the
experience. The two questions above collaborates at 70 % for positive sides on both matters,
which means that out of the people answering the questionnaire 70 % are satisfied with the
experience and are also experiencing the acoustic environment as good.
How does the sound environment affect your experience?
The answers to this question is increasing from 13 % to 29 %, see figure 22. The opinions are
scattered, some doesn’t think it affects and some think it does. It points to the assumption that
it is very subjective. In total the part on the upper side of the scale is 53 %. In total 43 % of all
respondents thinks that the factor above affects and also judges the acoustic environment as
good.
How do you experience the ability to talk?
Communication is overall rated as well, 72 % of the responses are on the upper grades. This
might be related to conversations over a short distance but points to that the ability to carry a
conversation isn’t harmed by the acoustic environment. This is not easy to relate to safety
aspects.
0
5
10
15
20
25
30
35
1 2 3 4 5
Nu
mb
er
Opinion
How does the acoustic environment affect your choice of swimming hall?
Occasion 1 Occasion 2 Occasion 3 Total
54
How do you experience the ability to have oversight over for example kids?
The answer rate on this question is too low to judge. It is excluded from the attached detailed
response as well.
How do you experience the look of the swimming hall on the inside?
In general, both swimming halls are rated as appealing. Most answers are at level 3 and 4 on
the scale.
How do you experience the sound level in this swimming hall compared to other swimming
halls?
Both swimming halls are rated as better than other swimming halls in general, as well as the
number on "don’t know" is quit high, which may depend on that people often visit the closest
swimming hall.
How does the acoustic environment effect your choice of swimming hall?
This question addresses the subjective relation to the effect of acoustic environment and the
answers are scattered, see figure 23. It is the same amount of answers on both positive and
negative side on the scale. Both sides have 40 % representation and 20 % is unaffected. This
strengthen the theory that it is very subjective.
This question is relatable to if the acoustic environment affects the experience. Out of the
respondents 30 % thinks that both the statement above and that the acoustic environment affects
the experience much or a lot. This may show contradictions which makes the questionnaire less
reliable but the low collaboration seems to depend on the scattered view of the affect the
acoustic environment has on the choice of swimming hall. A lot of people are probably choosing
swimming hall by distance and attraction regardless of the acoustic environment.
How often do you experience mental tiredness, headache etc. after a visit in a swimming hall?
The general opinion is that it seldom arises, 72 % thinks that it seldom or never happens. The
target group is visiting during a shorter period of time.
55
5.3. Questionnaire employees Questionnaires are also handed out to the employees in swimming halls. These are analyzed
qualitatively and compared to measurement values.
5.3.1. Execution A small questionnaire was handed out to the employees at Hylliebadet at the same time as
measurements and questionnaires to visitors was performed, Sunday 24th of April around 3
o’clock. The questionnaire consisted of four questions and was handed out to seven randomly
chosen persons as a cluster sample. The purpose is to receive an overview of the work
environment.
5.3.2. Response The collected opinions are summarized for each question below.
How do you experience the sound environment in the swimming hall?
Everyone claims that the sound pressure level is high. One says that it varies a lot depending
on the amount of visitors and another says that it is low most days but very high at weekends.
Ear plugs are necessary according to two of the asked employees. Two persons describes the
sound environment as noisy and one mention screaming, loud talking and music as sound
sources contributing to the high sound pressure level.
How does the sound environment affect your work performance?
All seven consulted employees say that the acoustic environment affects the work performance
negative in one or other ways. Two mentions tiredness and headache. One person says that the
sound environment makes it harder to focus on the work assignments, one says that it impairs
the ability to keep attention and one says that it is hard to hear colleagues in the radio. According
to one person the sound environment together with the other strenuous work environment
aspects such as heath, moisture and poor air quality, are strongly affecting the desired length of
time spent in the swimming pool area.
Are there any aspects where the sound pressure level is an obstacle? For example safety,
education, communication
Communication is mentioned by everyone and safety by four out of seven. According to several
persons the safety is at risk because of the reduced ability to communicate, for example to hear
difference between play and panic or to hear colleagues if there is an accident or similar. The
communication may suffer when you can’t be sure that the verbal communication reaches the
receiver, says one person.
Do you feel mental tiredness, headache or similar after a work pass?
The homogenous answer to the question is yes. Everyone experience tiredness and headache
after a shift in the swimming hall, but two of them suffers from headaches less often. According
to one person, shorter exposure in the environment is improving the consequences and two
claims that ear plugs are helping.


57
6. Measurements
6.1. Execution Measurements were performed in a Swimming hall in Malmö, Hylliebadet. This is a new
swimming hall opened in 2015. Since the study focused on the larger rooms in the swimming
halls the measurements were performed in the space with 50 meter long pool, in a space with a
smaller pool and in the adventure bath, see figure 24. Measurements of reverberation time and
background noise were performed before the swimming hall opened for the day. Sound pressure
level during activity was performed during daytime. Those measurements were performed at
the time of the week when most people usually visit the swimming hall in order to receive the
maximum values. The measurements were performed according to the Swedish Standard SS-
EN ISO 3382-2:2008 and SS-EN 16032.
STI is an interesting value to measure but in this thesis it was not performed. Several values are
important in order to evaluate a room, especially as complex as swimming halls. Only
reverberation time and sound pressure level is not enough to make a statement about the
swimming hall in general but it is a good value for discussion. The purpose of the measurements
is to have a basis for analysis of relevant values for the acoustic environment and to be able to
compare these with the subjective opinion.
6.1.1. Swimming pools The measurements were mainly performed in two rooms, referred to as the large and small
swimming pool, see figure 24 and 25. The large swimming pool is a 50 meter long pool for
exercise and practice with a small platform for audience along one of the long walls. The small
pool is an educational pool and surrounded only by an edge to walk on. A sketch further down
shows the position and below are pictures from the measurement occasion. Both rooms were
empty and quiet, except from water noise. The pictures are taken during the measurements on
the 22th of April around 6 o’clock in the morning. The sound pressure level is also measured
in the adventure bath since it is possible that the volume is at the highest there but since the
design is very specific for this swimming hall the other locations are better as references.
One wall is a façade and has windows on a part of the wall. Several acoustic solutions are used,
for example are the walls made of perforated sheets, some of the yellow parts on the pictures,
and absorbents on some parts. The ceiling is completely covered by absorbents. The wall
between the two rooms is mostly made of glass. All walls are straight in vertical direction, but
a bit irregular in horizontal direction, as shown on the sketch.

58
Figure 24: Large swimming pool
Figure 25: Small swimming pool
6.1.2. Equipment The measurements are performed with a Sound Level Meter Type 2270 from Brüel & Kjaer.
The sound pressure level is measured with the Sound Level Meter but measurements for
reverberation time were performed with more equipment as well. An omnidirectional
loudspeaker and a power amplifier are connected to the Sound Level Meter, see figure 26.
Reverberation time can be measured in several ways. The room can be acoustically excited by
various sources of sound, in this case a loudspeaker since the volume is large and the lower
frequencies are important.
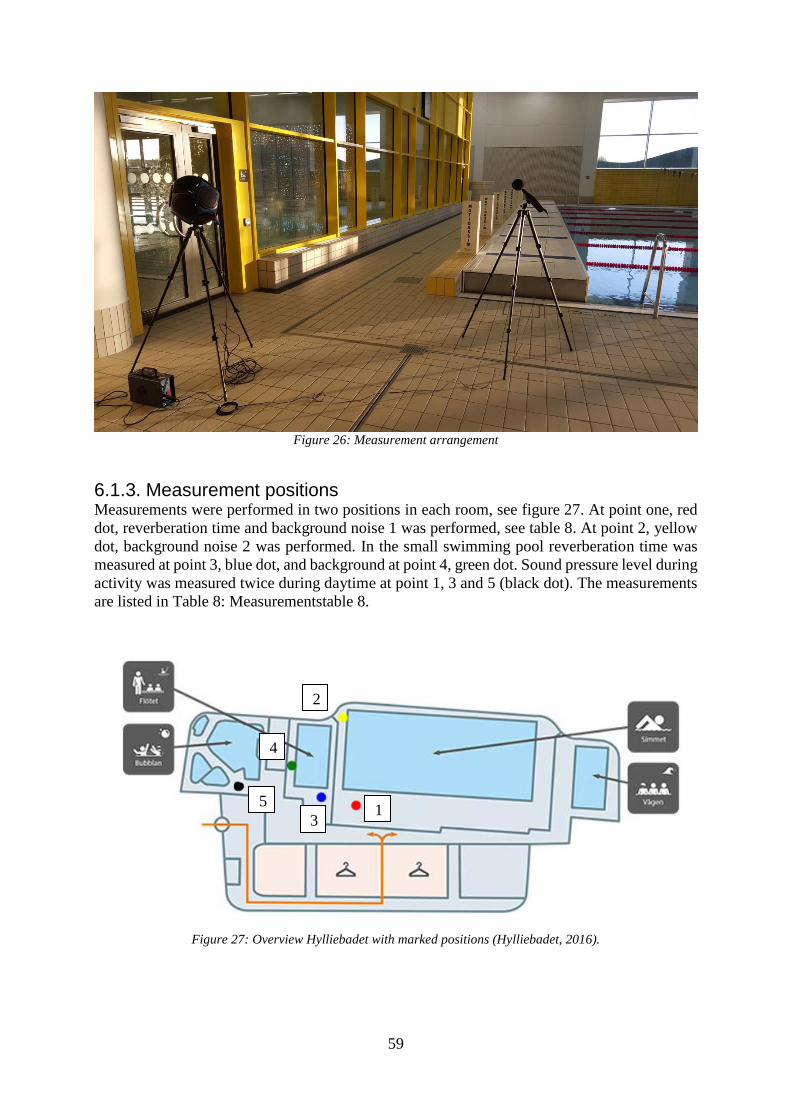
59
Figure 26: Measurement arrangement
6.1.3. Measurement positions Measurements were performed in two positions in each room, see figure 27. At point one, red
dot, reverberation time and background noise 1 was performed, see table 8. At point 2, yellow
dot, background noise 2 was performed. In the small swimming pool reverberation time was
measured at point 3, blue dot, and background at point 4, green dot. Sound pressure level during
activity was measured twice during daytime at point 1, 3 and 5 (black dot). The measurements
are listed in Table 8: Measurementstable 8.
1
2
3
1
4
5
Figure 27: Overview Hylliebadet with marked positions (Hylliebadet, 2016).

60
Table 8: Measurements
No Type Location, position
1 Reverberation time Large swimming pool, 1
2 Reverberation time Small swimming pool, 3
3 Background noise Large swimming pool, 1
4 Background noise Large swimming pool, 2
5 Background noise Small swimming pool, 4
6 Activity noise Large swimming pool, 1
7 Activity noise Small swimming pool, 3
8 Activity noise Adventure bath, 5
6.1.4. Reverberation time Reverberation time was measured in the two rooms between 6 and 7 in the morning, Friday
22nd of April, the measurements are illustrated in figure 28. During the measurements only the
measurement operator was present. The major source of sound was the water, mostly due to the
drains. Except for this no other sound sources were dominant. The sound pressure level is
estimated to be at a high level.
Measurement 1 Location: Large swimming pool, point 1
Positions: 3
Measurements: 6 (2 on each)
Measurement 2 Location: Small swimming pool, point 3
Positions: 2
Measurements: 6 (3 on each)
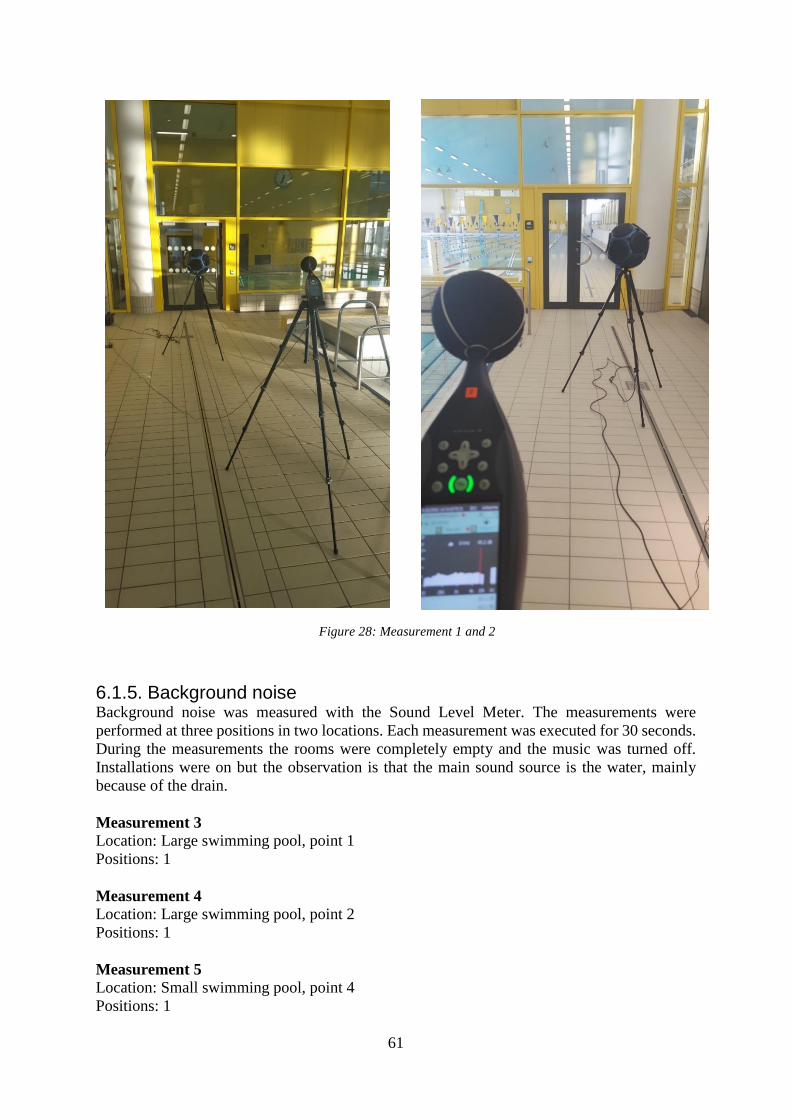
61
6.1.5. Background noise Background noise was measured with the Sound Level Meter. The measurements were
performed at three positions in two locations. Each measurement was executed for 30 seconds.
During the measurements the rooms were completely empty and the music was turned off.
Installations were on but the observation is that the main sound source is the water, mainly
because of the drain.
Measurement 3 Location: Large swimming pool, point 1
Positions: 1
Measurement 4 Location: Large swimming pool, point 2
Positions: 1
Measurement 5 Location: Small swimming pool, point 4
Positions: 1
Figure 28: Measurement 1 and 2
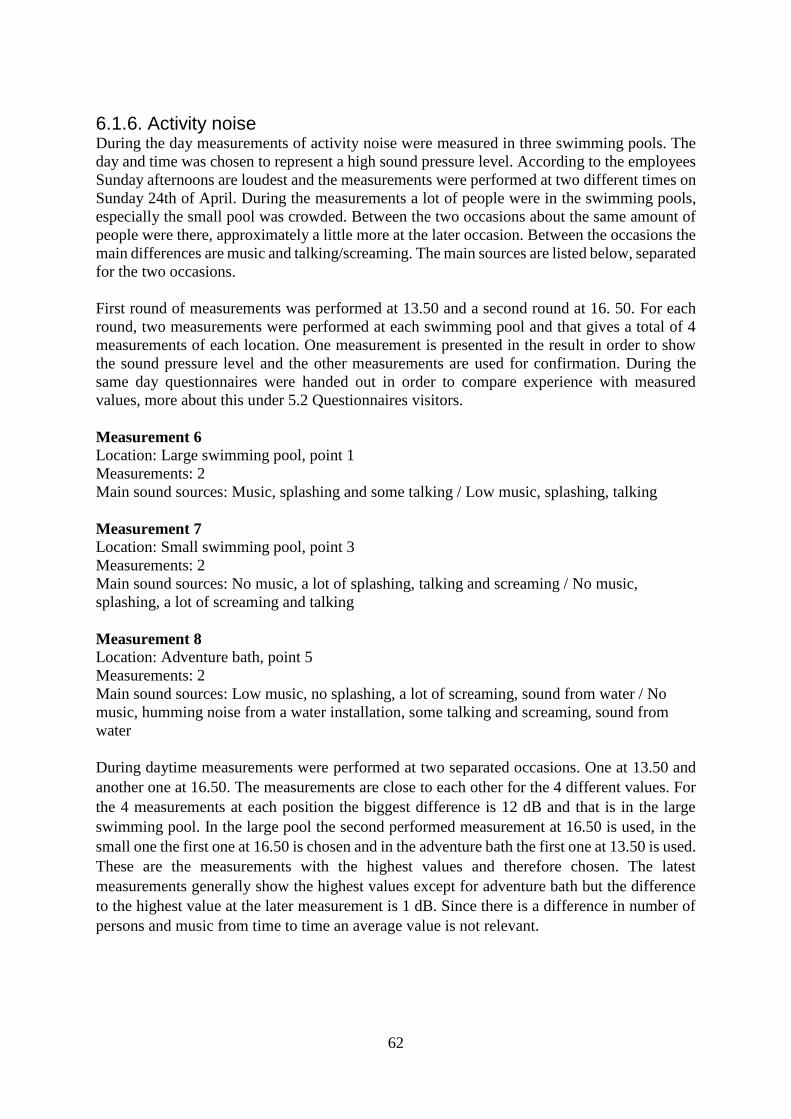
62
6.1.6. Activity noise During the day measurements of activity noise were measured in three swimming pools. The
day and time was chosen to represent a high sound pressure level. According to the employees
Sunday afternoons are loudest and the measurements were performed at two different times on
Sunday 24th of April. During the measurements a lot of people were in the swimming pools,
especially the small pool was crowded. Between the two occasions about the same amount of
people were there, approximately a little more at the later occasion. Between the occasions the
main differences are music and talking/screaming. The main sources are listed below, separated
for the two occasions.
First round of measurements was performed at 13.50 and a second round at 16. 50. For each
round, two measurements were performed at each swimming pool and that gives a total of 4
measurements of each location. One measurement is presented in the result in order to show
the sound pressure level and the other measurements are used for confirmation. During the
same day questionnaires were handed out in order to compare experience with measured
values, more about this under 5.2 Questionnaires visitors.
Measurement 6 Location: Large swimming pool, point 1
Measurements: 2
Main sound sources: Music, splashing and some talking / Low music, splashing, talking
Measurement 7 Location: Small swimming pool, point 3
Measurements: 2
Main sound sources: No music, a lot of splashing, talking and screaming / No music,
splashing, a lot of screaming and talking
Measurement 8 Location: Adventure bath, point 5
Measurements: 2
Main sound sources: Low music, no splashing, a lot of screaming, sound from water / No
music, humming noise from a water installation, some talking and screaming, sound from
water
During daytime measurements were performed at two separated occasions. One at 13.50 and
another one at 16.50. The measurements are close to each other for the 4 different values. For
the 4 measurements at each position the biggest difference is 12 dB and that is in the large
swimming pool. In the large pool the second performed measurement at 16.50 is used, in the
small one the first one at 16.50 is chosen and in the adventure bath the first one at 13.50 is used.
These are the measurements with the highest values and therefore chosen. The latest
measurements generally show the highest values except for adventure bath but the difference
to the highest value at the later measurement is 1 dB. Since there is a difference in number of
persons and music from time to time an average value is not relevant.
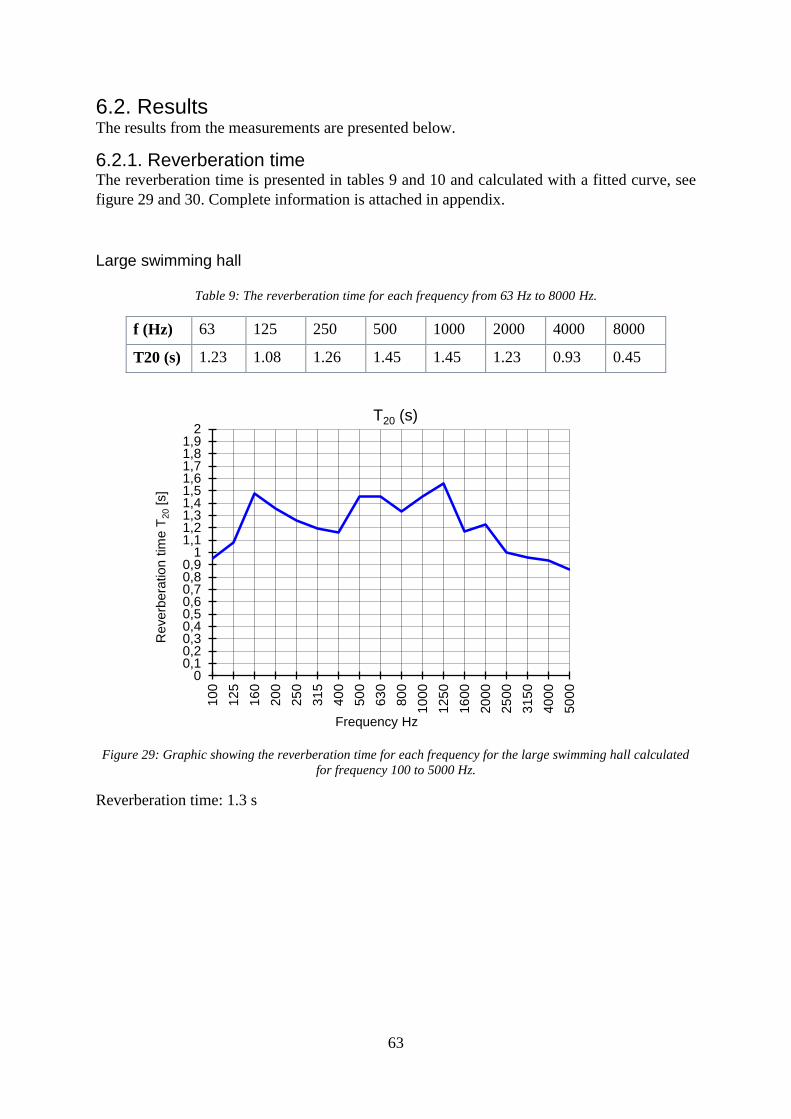
63
6.2. Results The results from the measurements are presented below.
6.2.1. Reverberation time The reverberation time is presented in tables 9 and 10 and calculated with a fitted curve, see
figure 29 and 30. Complete information is attached in appendix.
Large swimming hall
Table 9: The reverberation time for each frequency from 63 Hz to 8000 Hz.
f (Hz) 63 125 250 500 1000 2000 4000 8000
T20 (s) 1.23 1.08 1.26 1.45 1.45 1.23 0.93 0.45
Figure 29: Graphic showing the reverberation time for each frequency for the large swimming hall calculated
for frequency 100 to 5000 Hz.
Reverberation time: 1.3 s
00,10,20,30,40,50,60,70,80,9
11,11,21,31,41,51,61,71,81,9
2
10
0
12
5
16
0
20
0
25
0
31
5
40
0
50
0
63
0
80
0
10
00
12
50
16
00
20
00
25
00
31
50
40
00
50
00
Reverb
era
tion t
ime T
20
[s]
Frequency Hz
T20 (s)

64
Small swimming hall
Table 10: The reverberation time for each frequency from 63 Hz to 8000 Hz.
f (Hz) 63 125 250 500 1000 2000 4000 8000
T20 (s) 1.48 0.75 0.73 0.77 1.19 1.52 1.48 1.28
Figure 30: Graphic showing the reverberation time for each frequency for the small swimming hall
Reverberation time: 1.1 s
00,10,20,30,40,50,60,70,80,9
11,11,21,31,41,51,61,71,81,9
2
10
0
12
5
16
0
20
0
25
0
31
5
40
0
50
0
63
0
80
0
10
00
12
50
16
00
20
00
25
00
31
50
40
00
50
00
Reverb
era
tion t
ime T
20
[s]
Frequency Hz
T20 (s)

65
6.2.2. Sound pressure level Background noise and activity during daytime is presented in Table 11 below for LZeq and LAeq
for 30 seconds. LZeq for the 6 measurements for each third octave band from 125 to 5k Hz is
attached in appendix since it may be interesting to analyze the specific third octave band. LZeq
for background noise is also presented for frequencies 31.5 to 200 Hz in order to be comparable
to the target values for lower frequencies, see chapter 3. Guidelines.
Table 11: Sound pressure level in dB(A) and dB(Z) for measurement 3-8.
Frequency (Hz) LAeq LZeq
Empty
3, Large 47.61 49.69
4, Large 45.10 49.05
5, Small 57.45 56.62
Activity
6, Large 68.20 71.65
7, Small 72.89 72.66
8, Adventure 75.05 70.98
Summary
Reverberation time was measured in the large and small swimming pool and the result was 1.3
s respectively 1.1 s, comparable to the guidelines. The sound pressure level was measured
before and during activity. The large swimming pool has a background noise level of around
45-47 dB(A) and an activity noise of around 68 dB(A). The small pool values are 57 dB(A)
and 73 dB(A). The adventure bath is only measured for activity noise and the level exceeds 75
dB(A).


67
7. Simulations
7.1. Purpose Simulations in Odeon Software are conducted in order to value the different parameters
effecting the sound environment. Two simulations are made in order to explore the impact of
an inclined wall. The results are also compared to performed measurements and used as an
empirical basis for analyzes. The simulations are consisting of a model in two versions, both
simulated regarding acoustical parameters.
7.2. Model The model is made in Sketch Up and exported to Odeon software where materials are added to
the surfaces. The model is designed with consideration of the swimming hall where
measurements were performed. Simplifications are made where places for audiences are
excluded for example. The model is representing an idealistic swimming hall and therefore
good as reference but may differ from many swimming pools in reality. In order to create a
general case dimensions are chosen from Svensk simidrott (2016) for a 50 meter long
swimming pool. The length of the model is 60 meters and the width 30 meters. The pool is
made to imitate a 50 meters pool but the measurements has a certain deviation. Since the floor
and water surface are both hard surfaces this difference is acceptable. All walking edges are 4
meters. The height is 8 meters and the pool is immersed 0.2 meters. The model is divided in
surfaces where different materials are attached, see figure 31 and 32. The upper parts of the
walls are separated from the lower parts of a height of 3 meters in order to be able to put
different type of materials, as in reality.
Figure 31: The model with and without the ceiling visible.
Figure 32: The division of surfaces.

68
7.3. Execution Simulations are performed in order to analyze values of reverberation time and STI first and
foremost. Other parameters are also received in the calculations, such as EDT. The
reverberation time is comparable to executed measurements. The software contains several
functions. Global estimate is an estimation of reverberation time depending on room shape,
position of absorbing materials and sources (Odeon, 2016). A quick estimate is possible to do
initially where diffuse field assumptions are used for quick calculation of the reverberation
time with consideration of absorbents. The grid function creates a grid map of room-acoustical
parameters and statistics. Ray-tracing is a dynamic display of raytracing from selected source.
3D billiard is an interactive display for visualization of wave fronts to demonstrate scattering,
flutter echoes, focusing and coupling effects. All above mentioned functions are used in the
simulations.
Materials are addressed to the model in Odeon software. Some material exists in the database
and some are added from other sources. The ceiling is covered with absorbents as in reality.
The pool area is set as a water surface. The floor and pool edge are set as tile, for specific
material chosen see below. The lower parts of both short and long walls are set as tile since this
area is vulnerable for contact. The upper parts are set as absorbents. The used absorbent is
adapted to be similar to an existing hygiene absorbent and added manually. For the window an
option form the database is chosen, see below. For this simulations the glass itself isn’t of
interest as much as the impact of the amount of glass. For the simulation the glass is 40 times
3 meters big and is included since swimming halls often has more or less glass surfaces.
Materials
Ceiling: 91 absorbent Hygiene
Floor: 2001 Marble and glazed tile
Pool edge: 2001 Marble and glazed tile
Pool: 9000 Water surface swimming pool
Window: 10005 Glass, large panes of heavy plate glass
Long walls top: 91 absorbent Hygiene
Long walls bottom: 2001 Marble and glazed tile
Short walls top: 91 absorbent Hygiene
Short walls bottom: 2001 Marble and glazed tile
The absorbent in figure 33 below is used and adapted to the material database manually. The
absorbent is adapted for hygiene spaces and should be a good choice for the simulation.
Simplifications of the absorbent coefficient is made at the lowest and highest frequency, 63
and 8000 Hz, as below, see figure 34. The absorption for tile and water is visible in figure 35
and 33.
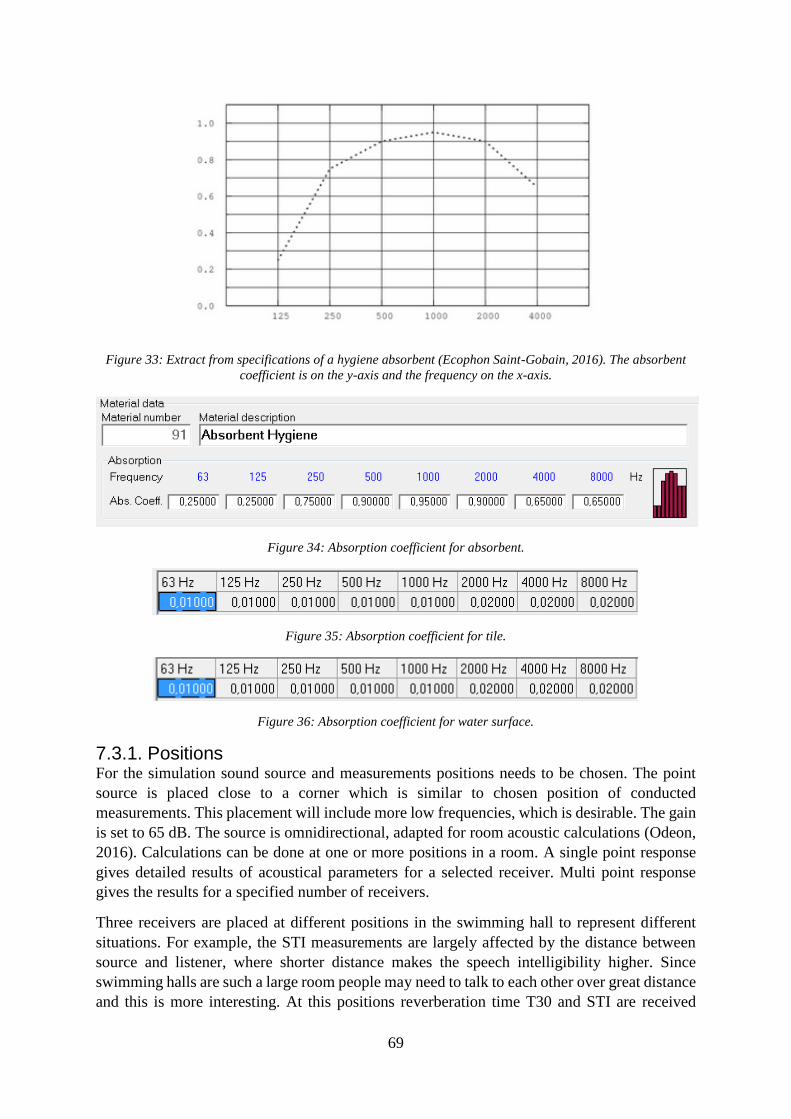
69
Figure 33: Extract from specifications of a hygiene absorbent (Ecophon Saint-Gobain, 2016). The absorbent
coefficient is on the y-axis and the frequency on the x-axis.
Figure 34: Absorption coefficient for absorbent.
Figure 35: Absorption coefficient for tile.
Figure 36: Absorption coefficient for water surface.
7.3.1. Positions For the simulation sound source and measurements positions needs to be chosen. The point
source is placed close to a corner which is similar to chosen position of conducted
measurements. This placement will include more low frequencies, which is desirable. The gain
is set to 65 dB. The source is omnidirectional, adapted for room acoustic calculations (Odeon,
2016). Calculations can be done at one or more positions in a room. A single point response
gives detailed results of acoustical parameters for a selected receiver. Multi point response
gives the results for a specified number of receivers.
Three receivers are placed at different positions in the swimming hall to represent different
situations. For example, the STI measurements are largely affected by the distance between
source and listener, where shorter distance makes the speech intelligibility higher. Since
swimming halls are such a large room people may need to talk to each other over great distance
and this is more interesting. At this positions reverberation time T30 and STI are received

70
among several other parameters. The positions are listed in table 12, where the values are the
distance in meter from origo, se figure 31, at the form x,y,z.
Table 12: The positions for source and receivers described.
Object Positions
Point source 2, 2, 1.2
Receiver 1 2, 50, 1.2
Receiver 2 15, 30, 0.5
Receiver 3 20, 2, 1.2
The three positions are visible in figure 37 and the exact positions are described in Table 12.
They are placed in order to represent the division in the room and not too close to the source.
Receiver 1 and 3 are placed on the edges where people may walk. They are placed 2 meters
from the walls in order to avoid reflections, and 1.2 meters above ground to be similar to a
person and measurements. Receiver 2 is placed above the water surface since this also is an
important place to analyze STI etc. since a lot of visitors spends the most time in the water.
The receiver is placed 0.5 meters above ground level to be closer to the surface since people in
water are lower, but not too close to catch a lot of reflections.
Figure 37: Positions of point source and receivers.
7.3.2. Simulation 1 The first simulation is as the model above without alterations. Different types of calculation
functions are used. A simulation with the three receivers and the point source is simulated
together and values for the three different positions are received. A global estimate is also
performed, which is a simulation ongoing for hours. This gives a value for T30 for the whole
room and not related to a position. The functions grid and 3D billiard are used to present the
sound distribution in the room. In order to check if the model is sealed 3D rays are used, see
figure 38.

71
Figure 38: 3D rays illustrated
The figure above shows that the model is sealed and that the simulation is good. In order to
visualize the sound distribution 3D Billiard is used. Below the sequence is illustrated.
Figure 39: Picture 1-6 showing the development during the 3D billiard simulation.
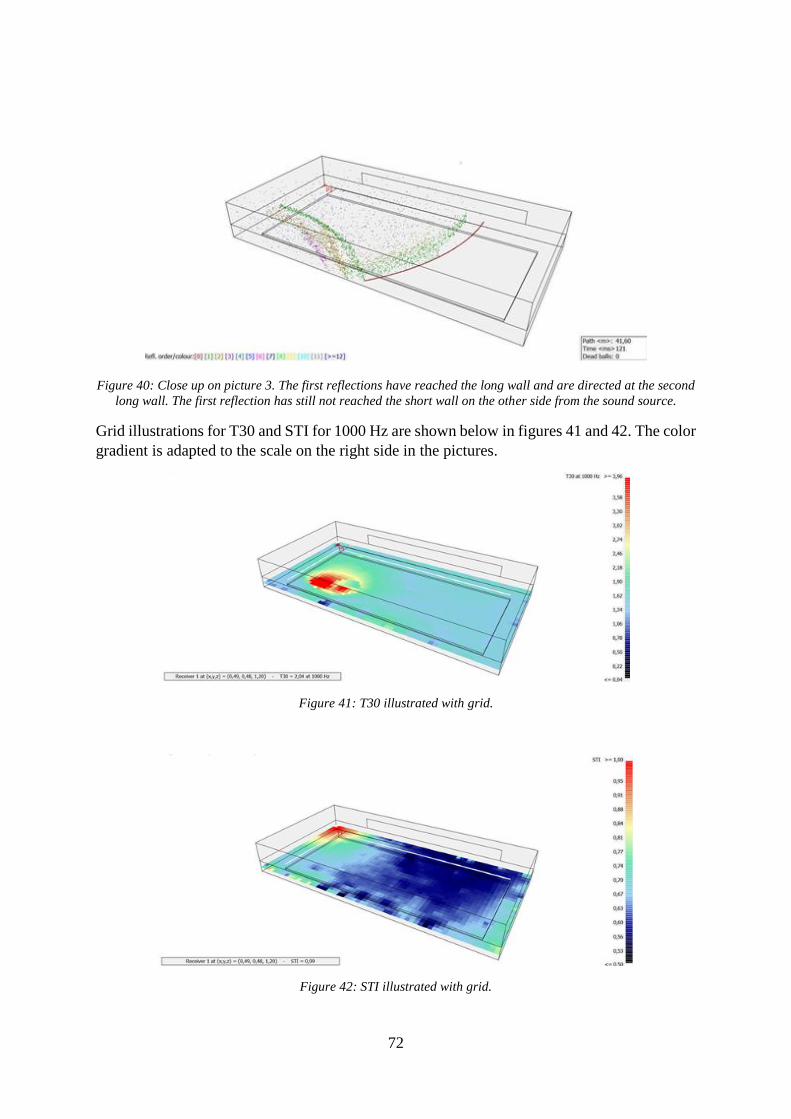
72
Figure 40: Close up on picture 3. The first reflections have reached the long wall and are directed at the second
long wall. The first reflection has still not reached the short wall on the other side from the sound source.
Grid illustrations for T30 and STI for 1000 Hz are shown below in figures 41 and 42. The color
gradient is adapted to the scale on the right side in the pictures.
Figure 41: T30 illustrated with grid.
Figure 42: STI illustrated with grid.

73
The quick simulation returns values immediately, below T30 is visualized for each receiver in
figure 43 and the values for each parameter are listed. The complete information is also attached
in appendix 4. Global estimate is included in Table 13 and in appendix 4 with more information.
The estimated volume is 13890.62 m3 according to the global estimate.
Figure 43: Reverberation time for the calculated frequencies. The scale is to the left and the lower frequencies
are at a very high level.
Table 13: Results for reverberation time for the three positions and for the global estimate.
f (Hz) 63 125 250 500 1000 2000 4000 8000
R1 3.34 3.37 1.63 1.55 1.62 1.45 1.24 0.81
R2 3.16 3.13 1.68 1.75 1.75 1.64 1.41 0.82
R3 3.22 3.21 1.75 1.94 1.96 1.67 1.44 0.95
Global 3.32 3.29 1.73 1.57 1.54 1.39 1.28 0.79
Table 14: Results for STI.
Receiver STI
R1 0.57
R2 0.62
R3 0.70

74
7.3.3. Simulation 2 In order to examine the impact of an inclined wall the second simulation is similar to the first
one in materials etc. but with one tilted wall. The volume increases as well, which adds some
more absorbents in total and creates a larger space. The wall is inclined 7 degrees, which is a
common angle to use according to interviews. This creates a difference in volume of around
600 m3 between the simulations.
Figure 45: The altered model in Odeon software.
The altered model was exported to Odeon Software and same parameters as for simulation 1
are used. The same positions, see below, and the same materials are applied. The alteration
created new surfaces by dividing existing surfaces in two, but this makes no difference since
the surfaces are addressed to the same materials as before.
Figure 44: Showing the model after alteration. One long wall is tilted 1 meter at the top edge.

75
Figure 46: Positions for simulation 2.
Ray tracing shows that this model is sealed, same as for simulation 1. The result for simulation
2 is attached in appendix. The sound waves distribution is illustrated in 3D billiard, where
interesting paths appears. The difference made by the inclined wall is visible, see figure 47.
The grid calculations show the division for T30 and STI, see figure 48 and 49.
Figure 47: Sound waves distribution after the first reflection at the tilted wall, corresponding to Figure 37. The
sound waves distribution is also showed from the side where the altered direction is visible.
Figure 48: Grid over T30 distribution.

76
Figure 49: Grid over STI distribution.
Multi point response calculation for the three receiver positions and Global estimate produces
results as following. In the global estimate the estimated change of volume is increased from
13890.62 m3 to 14528.46 m3, a difference of about 600 m3.
Figure 50: Reverberation time for each calculated frequency. The lower frequencies are at a very high level.
Table 15: Results for reverberation time for the three positions and for the global estimate.
f (Hz) 63 125 250 500 1000 2000 4000 8000
R1 3.18 3.16 1.31 1.02 0.86 0.92 1.06 0.70
R2 3.13 3.07 1.23 0.95 0.94 0.87 1.07 0.76
R3 3.19 3.16 1.35 1.16 1.05 1.08 1.19 0.96
Global 3.22 3.20 1.37 1.05 0.94 0.97 1.17 0.78
Table 16: Results for STI for the three positions.
Receiver STI
R1 0.59
R2 0.66
R3 0.77

77
7.3.4. Reliability The simulations produce plausible values and the sound waves distribution etc. are reliable.
The model is simplified but in a way that imitates a general case for swimming halls. Places
for audience etc. are excluded. The material of the window is chosen from existing data base
and another material may be more adapted for swimming halls, but since the window is a small
part of the total surfaces it will not make a big impact on the result. The glass is important to
represent existing swimming halls according to the state of the art. The simplification of the
lowest and highest frequency of absorbent is also a source of error, especially the lowest
frequency.
7.4. Sabine’s formula The reverberation time for the model can also be calculated manually with Sabine’s formula.
The volume and the area of all materials is necessary to know. With the same model as used
for simulations the reverberation time is calculated for the model with straight walls. Some
simplifications are made, the floor is calculated as one big area with tile instead of divided in
pool and floor. The absorbent for each frequency is the same for the two materials tile and
water according to Odeon database. The used dimensions, see below, is the same as the model
was made after, but the model has some margins that creates a larger volume, the difference is
around 510 m3, an increase of around 4 %. The reverberation time for each frequency from 125
Hz to 4000 Hz is calculated with Sabine’s formula and the result is a sum of the contribution
from each surface. The result is illustrated in figure 51 and included together with the
simulations in Table 17 since it is comparable to simulation 1.
Dimensions
Length: 60 m
Width: 30 m
Height: 8 m
Volume: 14400 m3
Table 17: Reverberation time
F (Hz) T (s)
125 4.56
250 1.56
500 1.31
1000 1.24
2000 1.25
4000 1.56
Figure 51: Reverberation time calculated with Sabine’s formula.

78
7.5. Results The total results from chapter 7 are presented below. Table 18 shows the results for STI from
simulations 1 and 2. Results for reverberation time for simulation 1 and 2, both receivers and
global estimate from Odeon Software, and reverberation time calculated with Sabine’s formula
are presented in table 19. In order to compare the results graphics are created, see figure 52-56.
The lowest frequency is deviating. A complete set of graphics is also attached in appendix 4.
Table 18: Results for speech intelligibility for the two simulations.
Receiver STI Simulation 1 STI Simulation 2
R1 0.57 0.59
R2 0.62 0.66
R3 0.70 0.75
Table 19: Compiled results for reverberation time.
f (Hz) 63 125 250 500 1000 2000 4000 8000
Simulation 1
R1 3.34 3.37 1.63 1.55 1.62 1.45 1.24 0.81
R2 3.16 3.13 1.68 1.75 1.75 1.64 1.41 0.82
R3 3.22 3.21 1.75 1.94 1.96 1.67 1.44 0.95
Global 3.32 3.29 1.73 1.57 1.54 1.39 1.28 0.79
Sabine - 4.56 1.56 1.31 1.24 1.25 1.56 -
Simulation 2
R1 3.18 3.16 1.31 1.02 0.86 0.92 1.06 0.70
R2 3.13 3.07 1.23 0.95 0.94 0.87 1.07 0.76
R3 3.19 3.16 1.35 1.16 1.05 1.08 1.19 0.96
Global 3.22 3.20 1.37 1.05 0.94 0.97 1.17 0.78

79
Graphics:
Figure 52: The simulation result for the three receivers and the global estimate.
Figure 53: Shows the results for Simulation 1 and related calculations with Sabine’s formula. The frequencies is
limited do to the calculations with Sabine’s, from 125 Hz to 4k Hz is illustrated.
0
0,5
1
1,5
2
2,5
3
3,5
4
0 1000 2000 3000 4000 5000 6000 7000 8000
T3
0
Frequency Hz
Simulation 1
R1 R2 R3 Global 1
0
0,5
1
1,5
2
2,5
3
3,5
4
4,5
5
0 500 1000 1500 2000 2500 3000 3500 4000
T3
0
Frequency Hz
Simulation 1 Sabines
R1 R2 R3 Global 1 Sabine

80
Figure 54: Simulation 2 illustrated .
Figure 55: Comparison between global estimate for Simulation 1 and 2.
0
0,5
1
1,5
2
2,5
3
3,5
4
0 1000 2000 3000 4000 5000 6000 7000 8000
T3
0
Frequency Hz
Simulation 2
R1 R2 R3 Global 2
0
0,5
1
1,5
2
2,5
3
3,5
4
0 1000 2000 3000 4000 5000 6000 7000 8000
T3
0
Frequency Hz
Global estimate
Global 1 Global 2

81
Figure 56: Comparison between the results from global estimate for simulation 1 and the measurements
performed in similar swimming hall.
Summary The simulations provide results for reverberation time and STI. The reverberation time is also
calculated with Sabine’s formula and measured in Chapter 6. The STI value varies from 0.57
to 0.75. The reverberation time is illustrated in graphics where all the calculated frequencies
are visible. The graphics shows the results for the simulations compared to each other, to
Sabine’s formula and to measurements.
0
0,5
1
1,5
2
2,5
3
3,5
4
0 1000 2000 3000 4000 5000 6000 7000 8000
T2
0/3
0
Frequency Hz
Measurements versus Simulation
Global 1 Measurements


83
8. Discussion
8.1. Parameters In order to reach a conclusion and answer the problem formulation the different parts of the
thesis need to be compared and the results discussed. The theory is a basis for the evaluation
of the executed parts; interviews, measurements and simulations. The theoretical parameters
are discussed first, followed by the more practical parts.
8.1.1. How to create a successful swimming hall According to theory it is important to include acousticians in the early design phase in order to
create a cost effective project with a satisfying acoustic environment. The interviews support
the theory. The respondents emphasize the importance of including acoustic questions in the
initial phase of a project in order to be successful. According to the interviews experience is
important in order to be successful with a swimming hall. Another way to improve the result
is to have architects and acousticians collaborate and make solutions together. It is important
that the acoustic environment is sufficient as well as it shouldn’t affect the design in a negative
way. Design is one of the biggest compromises that occurs in swimming halls where
collaboration is a solution. Cost is not a big issue and with acoustics included early in the design
phase this problem would be even more reduced. Moisture is a factor to consider but not
necessarily a problem regarding acoustic solutions. Acoustics is more and more prioritized in
the design of swimming halls and is getting included earlier in the project. This is a good trend
that should keep increasing, which it seems to be by the higher importance of work environment
and the increased knowledge about the sounds impact on our health. As all other projects one
main goal is to be cost efficient and at the same time create an appreciated building. For
swimming halls the acoustic environment has been more included in this the past years. Factors
of success is that the swimming halls should be adapted for everyone, fulfill the need of the
municipality, be attractive and also have a good acoustic environment. To prevent health
consequences, it is important to have strategic actions planned and to have control over the
noise level.
8.1.2. Demands The demands existing for swimming halls are found in the Swedish Standard and gives some
guidance for reverberation time and sound from installations. According to the interviews the
demands are not sufficient for swimming halls but experience and already known solutions are
more important. According to reference projects the demands applies for new constructions
and are used more as an aim than a demand for renovations, and also for new buildings but are
of a greater importance then. The reverberation time should be 1.2 s or 1.5 s at the highest
according to the standard and most respondents seems to aim for 1.5 s in large rooms and 1.2
s in smaller rooms. It seems to be a guideline and the results aren’t always verified. The values
for reverberation time are assumed to be sufficient for swimming halls. The measurements
show that the demands are possible to achieve.
8.1.3. Work environment The work environment is important for the performance. The acoustic environment is a part of
that where tiredness, decreased performance and consequences such as higher level of stress
hormones occurs according to the theory chapter. This is best discussed with the opinions of

84
the employees at the swimming hall but the consulted visitors and professionals also
contributes to the topic. The general opinion of the interviewed persons is that it is an
exhausting work environment and that it is of increasing importance during the design of
swimming halls. The visitors seldom experience tiredness and that is connected with the time
spent in the swimming hall, since the employees who spends longer time in the swimming halls
suffers from tiredness and headaches. The consulted employees agree on that the sound
pressure level is high and that it is having a negative impact on their work, especially
communication and safety. This shows that the work environment is important to consider in
the design of swimming halls in order to achieve sufficient circumstances for the employees
and to avoid the possible consequences. At a worksite noise from the occupancy is less
disturbing than extraneous noise and the sound pressure level needs to be controlled.
Temperature may cause a decreased quality might be compensated by raised vocal level which
creates even higher sound pressure levels. Sound, climate, air quality, ergonomic, light and
lightning are examples of factors contributing to the indoor environment and should all be
considered in the design phase.
8.1.4. Swimming halls In order to achieve a good acoustic environment in swimming halls they should be designed
with short reverberation time, increased speech intelligibility, low sound pressure level and
have no reflections or echoes. The sound pressure level should also decline with increasing
distance. Ideal design to achieve this is a small volume, low ceiling height, low background
noise level, absorbents on ceiling and walls, no hard surfaces and inclined walls. This is
difficult to achieve in a swimming hall. The purpose of a swimming hall needs larger volumes
to fit the pool and hard surfaces are necessary due to the climate and functions. The ceiling
height is adjustable and this may be a factor to work with. The water creates a high level of
background noise, which is also measured in the thesis and the background level is already at
the level for inconvenience. Absorbents in the ceiling is already implemented according to state
of the art. The measurements provides results for two rooms where the result differs. The
smaller room has a lower reverberation time and this shows that the volume is important.
8.1.5. Speech intelligibility Speech intelligibility in a swimming hall may be hard to achieve. According to the interviews
speech intelligibility is an important factor in swimming halls, and it will affect the educational
situation. The desired speech intelligibility is at a high level where conversations and screams
should be easily heard. The most important parameters are the background noise and the
acoustic characteristics of the room. The background noise is high in swimming halls and the
sound pressure level reaches even higher levels with full activity. The background noise masks
speech and alarm signals and makes it harder to understand conversations and hear warnings.
Echoes and late reflections are also masking speech and reverberation times over 1 second will
lead to impaired speech intelligibility. Swimming halls often has a reverberation time above 1
s and the speech intelligibility is harmed, see STI related to simulations. Since a value of STI
seldom is reached over 0.8, the SNR value above 15 dB(A) is a useful demand to achieve,
further more about this under 8.2.2. Sound pressure level.
The human speech is mostly between 100 Hz and 8000 Hz, vowels being in the lower frequency
range and consonants in the higher. The simulations calculate values for these frequencies and
the reverberation time is generally decreasing with the frequency, which strengthens the vowels
and reduces the consonants. This is the case for simulation 1. For simulation 2 the lower range

85
of frequencies is more reduced by the inclined wall and the speech intelligibility is improved
since consonants are more important for the ability to understand speech. More about the STI
values for the simulations are discussed further down.
One problem is that people tend to raise the voice level when talking in large spaces such as
swimming halls and in order to be heard over the high background level that occurs in
swimming halls according to theory parts and interviews. The hard surfaces create more echoes
and allows the sound to travel a long distance and disturb a lot of people, and these are examples
of when sound creates more sound. Solutions for this are primarily shorter reverberation time
and lowered background noise.
8.1.6. Solutions The design of swimming halls is complex due to the climate and function demands. According
to the interviews the most common solutions to reach a desired acoustic environment are
absorbents and to tilt a wall. The measurements are used to evaluate some solutions and
inclined walls are tested in the simulations.
In order to achieve a good acoustic environment in a large space such as swimming halls
absorbents needs to be applied to ceiling and walls to avoid hard parallel surfaces. In swimming
halls, the amount of absorbents should be maximized on the available surfaces. Absorbents
should be placed at the height of the ear, which makes panel absorbents important in swimming
halls since absorbents at this height needs to be resistant. Soft absorbents are placed higher on
the wall, from 3 meters and up. Ceiling absorbents covering as much as possible of the area are
always used in swimming halls according to interviews. As mentioned in chapter 2.1.3
absorbents are divided in classes. According to the reference projects the highest class is chosen
for alternations of ceiling absorbents in existing swimming halls. Since the swimming hall
never can be too acoustic altered according to interviews this class is assumed to be preferable
for all cases. Porous absorbents seem to be preferable, at least at the ceiling. In order to reduce
more frequencies different types of absorbents should be used in swimming halls. Porous
absorbents for higher frequencies and panel absorbents for lower. Perforations are also
effective but might lead to a less convenient sound. In order to create a comfortable sound
diffusing solutions are also important.
Inclined walls are a suggested solution since it is diffusing and solves problems with for
example walls of glass, where absorbents aren’t a possibility. According to the interviews
inclined walls are a good and used solution. Inclined walls are improving the acoustic
environment according to the simulations. The inclination may differ and a higher angle is
more effective. The simulations use 7 degrees and the difference is noticeable. The acoustic
environment is affected by noise from the outside but this doesn’t seem to be a current problem
with swimming halls. Air conditioner etc. needs to be chosen with consideration of the acoustic
aspect but since the water is producing a high sound pressure level this isn’t a problem for now.
Colours and visual expression should be considered while choosing the acoustic solutions.
The use of glass creates troubles and less amount of windows would improve the acoustic
environment in swimming halls. The use of glass is common and traditional and has good
qualities, such as a better view out or between rooms. When constructing a new swimming
hall, the amount of glass should be discussed where positive and negative aspects should be
weighted against each other. If a larger amount of glass is to be used compromises are likely
to be necessary. The swimming hall where measurements were performed has some of the
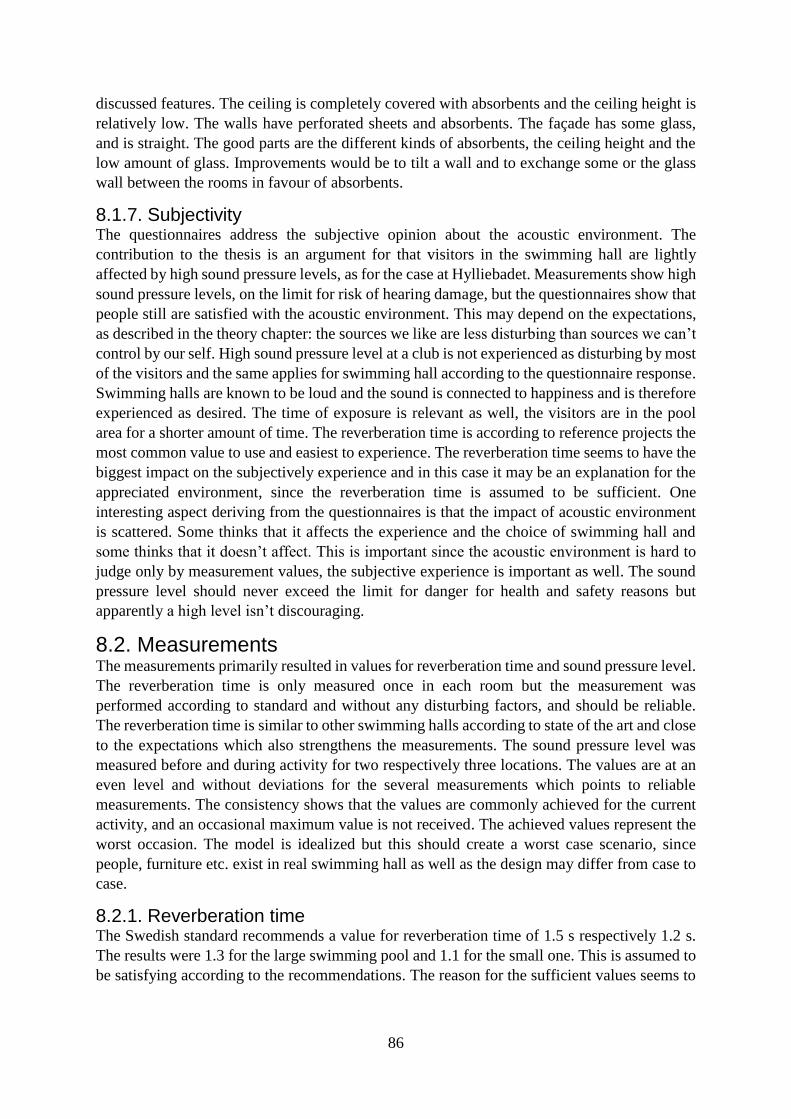
86
discussed features. The ceiling is completely covered with absorbents and the ceiling height is
relatively low. The walls have perforated sheets and absorbents. The façade has some glass,
and is straight. The good parts are the different kinds of absorbents, the ceiling height and the
low amount of glass. Improvements would be to tilt a wall and to exchange some or the glass
wall between the rooms in favour of absorbents.
8.1.7. Subjectivity The questionnaires address the subjective opinion about the acoustic environment. The
contribution to the thesis is an argument for that visitors in the swimming hall are lightly
affected by high sound pressure levels, as for the case at Hylliebadet. Measurements show high
sound pressure levels, on the limit for risk of hearing damage, but the questionnaires show that
people still are satisfied with the acoustic environment. This may depend on the expectations,
as described in the theory chapter: the sources we like are less disturbing than sources we can’t
control by our self. High sound pressure level at a club is not experienced as disturbing by most
of the visitors and the same applies for swimming hall according to the questionnaire response.
Swimming halls are known to be loud and the sound is connected to happiness and is therefore
experienced as desired. The time of exposure is relevant as well, the visitors are in the pool
area for a shorter amount of time. The reverberation time is according to reference projects the
most common value to use and easiest to experience. The reverberation time seems to have the
biggest impact on the subjectively experience and in this case it may be an explanation for the
appreciated environment, since the reverberation time is assumed to be sufficient. One
interesting aspect deriving from the questionnaires is that the impact of acoustic environment
is scattered. Some thinks that it affects the experience and the choice of swimming hall and
some thinks that it doesn’t affect. This is important since the acoustic environment is hard to
judge only by measurement values, the subjective experience is important as well. The sound
pressure level should never exceed the limit for danger for health and safety reasons but
apparently a high level isn’t discouraging.
8.2. Measurements The measurements primarily resulted in values for reverberation time and sound pressure level.
The reverberation time is only measured once in each room but the measurement was
performed according to standard and without any disturbing factors, and should be reliable.
The reverberation time is similar to other swimming halls according to state of the art and close
to the expectations which also strengthens the measurements. The sound pressure level was
measured before and during activity for two respectively three locations. The values are at an
even level and without deviations for the several measurements which points to reliable
measurements. The consistency shows that the values are commonly achieved for the current
activity, and an occasional maximum value is not received. The achieved values represent the
worst occasion. The model is idealized but this should create a worst case scenario, since
people, furniture etc. exist in real swimming hall as well as the design may differ from case to
case.
8.2.1. Reverberation time The Swedish standard recommends a value for reverberation time of 1.5 s respectively 1.2 s.
The results were 1.3 for the large swimming pool and 1.1 for the small one. This is assumed to
be satisfying according to the recommendations. The reason for the sufficient values seems to

87
be great consideration with acoustics where a lot of absorbents are used and the amount of glass
is restricted.
8.2.2. Sound pressure level The background noise sound pressure level was 47.6 and 57.5 dB(A) at the highest for the large
receptively small swimming hall. The sound pressure level was around 68-75 dB(A) during
activity for the three measured rooms. According to Arbetsmiljöverket the maximum level
before risk for hearing damage is 85 dB(A) during a longer period of time, but from 75 dB(A)
there is a risk for more sensitive people. Target values in order to avoid inconvenience
according to Folkhälsomyndigheten is LAeq 30 dB(A) which is exceeded already by the
background sound pressure level. The highest measured level is 75 dB(A) and this is on the
limit for damage.
The low frequencies are compared to target values according to Folkhälsomyndigheten and the
sound pressure level exceeds the target values for the small swimming pool for frequencies 50-
200 Hz. Sound consisting of a large amount of low frequencies are known to affect people
more. The large swimming pool is under the target values for the background noise. This means
that the background level for the small swimming hall may be experienced as uncomfortable
already when it is empty and this should be considered in the design of swimming halls in order
to achieve a good acoustic environment.
In order to achieve a good level of speech intelligibility the Signal to Noise rate should exceed
15 dB(A). This is the difference between for example speech and the noise level from people’s
activities. During activity the measured sound pressure exceeds 68 dB(A) and a normal voice
level in public is at 52 dB(A) and maximum shouting at 77 dB(A). This is not a sufficient
Signal to Noise level for speech and conversations are therefore hard to practice. Alarm signals
etc. may exceed the necessary of 15 dB(A). This is crucial for safety reasons, but the signal
need to be at a very high level, about 90 dB(A), which also is a danger. This would be improved
with a lower sound pressure level.
According to the questionnaires the visitors during the time for the measurements of sound
pressure level were still satisfied with the acoustic environment. This shows the importance of
the subjectively of the subject. People visiting a swimming hall are expecting higher sound
pressure levels and the duration is short. Employees in the swimming hall are exposed to the
sound pressure level for longer time and the work environment needs to be considered.
8.3. Simulations The simulations provide values for STI and reverberation time. These are discussed separated
and the reverberation time is connected to the measurement and calculations with Sabine’s
formula. STI is also discussed more qualitative above.
8.3.1. STI The speech intelligibility is investigated in simulations where three different positions are
calculated for two scenarios, straight and inclined wall. The results are included below, same
as table 18.
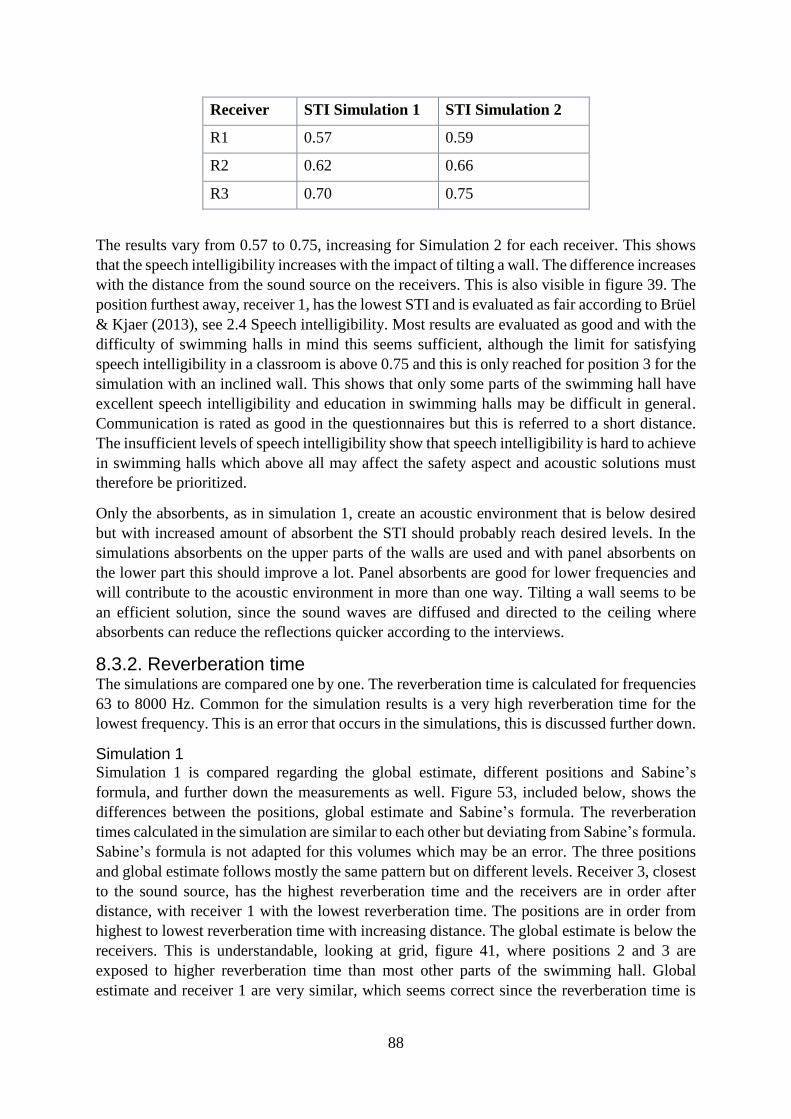
88
The results vary from 0.57 to 0.75, increasing for Simulation 2 for each receiver. This shows
that the speech intelligibility increases with the impact of tilting a wall. The difference increases
with the distance from the sound source on the receivers. This is also visible in figure 39. The
position furthest away, receiver 1, has the lowest STI and is evaluated as fair according to Brüel
& Kjaer (2013), see 2.4 Speech intelligibility. Most results are evaluated as good and with the
difficulty of swimming halls in mind this seems sufficient, although the limit for satisfying
speech intelligibility in a classroom is above 0.75 and this is only reached for position 3 for the
simulation with an inclined wall. This shows that only some parts of the swimming hall have
excellent speech intelligibility and education in swimming halls may be difficult in general.
Communication is rated as good in the questionnaires but this is referred to a short distance.
The insufficient levels of speech intelligibility show that speech intelligibility is hard to achieve
in swimming halls which above all may affect the safety aspect and acoustic solutions must
therefore be prioritized.
Only the absorbents, as in simulation 1, create an acoustic environment that is below desired
but with increased amount of absorbent the STI should probably reach desired levels. In the
simulations absorbents on the upper parts of the walls are used and with panel absorbents on
the lower part this should improve a lot. Panel absorbents are good for lower frequencies and
will contribute to the acoustic environment in more than one way. Tilting a wall seems to be
an efficient solution, since the sound waves are diffused and directed to the ceiling where
absorbents can reduce the reflections quicker according to the interviews.
8.3.2. Reverberation time The simulations are compared one by one. The reverberation time is calculated for frequencies
63 to 8000 Hz. Common for the simulation results is a very high reverberation time for the
lowest frequency. This is an error that occurs in the simulations, this is discussed further down.
Simulation 1 Simulation 1 is compared regarding the global estimate, different positions and Sabine’s
formula, and further down the measurements as well. Figure 53, included below, shows the
differences between the positions, global estimate and Sabine’s formula. The reverberation
times calculated in the simulation are similar to each other but deviating from Sabine’s formula.
Sabine’s formula is not adapted for this volumes which may be an error. The three positions
and global estimate follows mostly the same pattern but on different levels. Receiver 3, closest
to the sound source, has the highest reverberation time and the receivers are in order after
distance, with receiver 1 with the lowest reverberation time. The positions are in order from
highest to lowest reverberation time with increasing distance. The global estimate is below the
receivers. This is understandable, looking at grid, figure 41, where positions 2 and 3 are
exposed to higher reverberation time than most other parts of the swimming hall. Global
estimate and receiver 1 are very similar, which seems correct since the reverberation time is
Receiver STI Simulation 1 STI Simulation 2
R1 0.57 0.59
R2 0.62 0.66
R3 0.70 0.75

89
quite even in the hall except for one spot and the overall value should be close to the most
common value.
The reverberation time would be improved if the spot is reduced and if the curves is lowered
at the mid frequencies. This would probably be improved with an addition of panel absorbents
as well as a larger amount of absorbents in general. In order to reduce the spot, the first
reflections needs to be reduced, this would be achieved with absorbents all over the wall since
the source and receivers are below current absorbents and a lot of sound is bounced back
immediately. This is also possible to achieve with a diffuse field such as an inclined wall.
Simulation 2 Simulation 2 is compared with the three positions and global estimate in figure 54 included
below. The curves are similar to each other, as for simulation 1. This strengthens the simulation.
Position 3 has the highest reverberation time, same as for simulation 1. Position 1 and 2 is close
to each other, varied for each frequency. This points to that the inclined wall is diffusing the
sound and the reflections are reduced earlier. This makes the diffuse sound field bigger and the
difference between positions in the swimming hall less, see figure 57 further down where the
grids for reverberation time are compared.
0
0,5
1
1,5
2
2,5
3
3,5
4
4,5
5
0 500 1000 1500 2000 2500 3000 3500 4000
T3
0
Frequency Hz
Simulation 1 Sabines
R1 R2 R3 Global 1 Sabine

90
Figure 57: Comparison between reverberation time for simulation 1 and simulation 2.
Global estimate The simulations are compared to each other regarding global estimate. The curves are similar
at the beginning and at the end but a deviation occurs quite early. The difference is largest at
1000 Hz where simulation 1 is at approximately 1.5 and simulation 2 at 0.9 s. This depends on
the impact of the inclined wall since that is the difference between the simulations. The curves
are not shaped similar, simulation 1 is straighter and simulation 2 has a dip at the mid
frequencies. Lower frequencies are harder to reduce and the longer wavelengths are less
effected by the inclined wall. Simulation 2 is better since it has a more preferable movement
pattern and reaches better levels of reverberation time, which shows that tilting a wall is a good
alteration.
0
0,5
1
1,5
2
2,5
3
3,5
4
0 1000 2000 3000 4000 5000 6000 7000 8000
T3
0
Frequency Hz
Simulation 2
R1 R2 R3 Global 2

91
Simulation versus measurements The simulations are made to be similar to the measurements. Simulation 1 with the straight
wall is compared to performed measurements. Expect for the lowest frequency the curves are
similar and the simulation seems to be accurate, see figure 56 included below. The simulation
has a higher reverberation time. The difference between measurements and simulations is that
the simulation is simplified, the platform for audiences is excluded and the only absorbents are
soft ones on the upper part of the walls. The measurements were performed at a swimming hall
with great consideration of the acoustic environment and absorbents covered large parts of the
wall in probably an effective way. The real case is better than the simulated swimming hall,
probably due to better absorbents and different types. One improvement of the real case would
have been to tilt a wall but the measurement values shows a relatively good reverberation time
The comparison is between T20 and T30, which is different ways to calculate reverberation
time. T20 is comparable to the Swedish standard.
0
0,5
1
1,5
2
2,5
3
3,5
4
0 1000 2000 3000 4000 5000 6000 7000 8000
T3
0
Frequency Hz
Global estimate
Global 1 Global 2

92
Lowest frequency The comparison is made for frequencies 63 to 8000 Hz. Common for all simulations are the
peak at 63 Hz. The absorption coefficient is assumed at that frequency and that is an error. But
the very high value implies that something else is wrong as well. The low frequencies are
generally harder to measure and calculate as well as to reduce in reality. Most likely the
simulation builds on theory where the lower frequencies are not calculated in a sufficient way
and deviates from the way the lower frequency waves behave in the current room. Lower
frequencies are usually higher in a room but this seems excessive.
0
0,5
1
1,5
2
2,5
3
3,5
4
0 1000 2000 3000 4000 5000 6000 7000 8000
T2
0/3
0
Frequency Hz
Measurements versus Simulation
Global 1 Measurements

93
9. Conclusion
Swimming halls are complex buildings and it is a challenges to achieve a desired acoustic
environment. In order to create a swimming hall with proper acoustic environment important
parameters are reverberation time, background noise and speech intelligibility. The conclusion
is also presented in terms of guidelines below.
The aim is to shorten the reverberation time closer to 1 s and to lower the background noise in
order to avoid inconvenience and to increase the speech intelligibility. A reverberation time
around 1.3 s for a large space and 1.1 s for a small space is still experienced as good acoustic
environment for visitors. The subjective factor is important to consider. The swimming hall
should be designed for sound pressure levels below the recommended limit but the visitors are
not highly affected. The employees are exposed for an exhausting work environment and this
is an incitement to work for a lower sound pressure level. Speech intelligibility is important for
safety mainly. Conversations at small distances are still easy but communication between the
employees are disturbed.
There are several solutions existing to achieve a desired acoustic environment. The ceiling
height should be considered and lowered when possible in order to receive a shorter
reverberation time. Absorbents should be used for the whole ceiling and on large parts of the
wall, no parallel hard surfaces can exist. Different types of absorbents are necessary to create
a better acoustic environment and to protect the absorbent from damage from people and
climate. One wall should be inclined if possible in order to achieve a better situation with lower
reverberation time and increased speech intelligibility. The disadvantages with tilting a wall,
such as construction complexity and visual confusion, are small in comparison with the
acoustic improvement. Education is simplified with the above mentioned solutions but screens
are also useful. At last the drain and water solutions should be studied in order to find more
quiet solutions. If the background level can be lowered, it would improve the acoustic
environment a lot and increase the speech intelligibility. This is also achieved by less hard
surfaces and shorter reverberation time but the sound source is important to adjust.
In order to achieve a good acoustic environment, the way of work needs to be considered. The
design phase is crucial for the result and hence an acoustician should be included as early as
possible in the project, before the design is determined. A lot of acoustic solutions are
depending on the shape of the room and a lot of improvements can be done during the design
phase. Experience is important in order to know useful solutions since guidelines are
insufficient and also in order to handle the complexity of swimming halls. Collaboration
between acousticians and architects would be a factor of success with sufficient acoustic
solutions as well as an appreciated visual expression.

94
Guidelines Goals:
o Reverberation time closer to 1 s.
o Lower background level.
o Excellent speech intelligibility.
Suggested solutions:
o Low ceiling height.
o Inclined wall.
o Absorbents, maximized amount and different types.
o Water as sound source, find more quiet solutions.
o Screens, for educational purposes.
How to succeed:
o Design phase, consider acoustics.
o Utilize experience.
o Collaboration between architects and acousticians.

95
10. References
Ando, Y. (1998). Architectural acoustics, Blending Sound Sources, Sound Fields, and
Listeners. New York: Springer-Verlag.
Arbetsmiljöverket. (2005). Buller (AFS 2005:16), föreskrifter. Stockholm: Arbetsmiljöverket.
Arbetsmiljöverket. (2014). Arbetsmiljön 2013, The Work Environment 2013.
Arbetsmiljöstatistisk rapport 2014:3. Arbetsmiljöverket.
Arbetsmiljöverket. (2015). Arbetsskador 2014, Arbetsmiljöstatistisk Rapport 2015:1.
Arbetsmiljöverket.
Bernström, R. (1987). Akustikhandbok för arkitekter och byggnadsprojektörer. Stockholm:
K-konsult.
Boverket. (2015). Boverkets byggregler - föreskrifter och allmänna råd, BBR Konsoliderad
version, senast ändrad genomBFS 2015:3 BBR 22. Boverket.
Brüel & Kjaer. (2013). Application note, Measuring Speech Intelligibility using DIRAC Type
7841. Naerum, Danmark: Brüel & Kjaer Sound and Vibration Measurements A/S.
Dyrssen, C. (2014). Ljud och andra rum/Sound and other spaces. Göteborg: Bo Ejeby
Förlag.
Ecophon Saint-Gobain. (2016, February 9). Ecophon Hygiene Advance™. Retrieved from
Ecophon: http://www.ecophon.com/PIM/Hygiene%20Advance%20Wall%20C3-
PRODUCT-SE.pdf
Ejvegård, R. (2009). Vetenskaplig metod. Lund: Studentlitteratur.
Folkhälsomyndigheten. (2014A). FoHMFS 2014:13 Folkhälsomyndighetens allmänna råd
om buller inomhus. Stockholm: Elanders Sverige AB.
Folkhälsomyndigheten. (2014B). FoHMFS 2014:15 Folkhälsomyndighetens allmänna råd
om höga ljudnivåer. Stockholm: Elanders Sverige AB.
Gibson, W. B. (2009). Working with Qualitative Data. London: Sage Publications Ltd.
Ginn, K. (1978). Architectural acoustics. Denmark: Brüel & Kjaer.
Holme, I. M., & Solvang, B. K. (1997). Forskningmetodik. Om kvalitativa och kvantitativa
metoder. Lund: Studentlitteratur.
Kinsler, L. F. (2000). Fundamentals of Acoustics, 4th edition. United States of America :
John Wiley and Sons, Inc. .
Liljewalls. (2016, May 22). Liljewalls. Retrieved from Rosengårdsbadet:
http://www.liljewall.se/#!rosengrdsbadet/c11nt
Ljung, R. (2010). Room Acoustics and Cognetive Load when Listening to Speech. Luleå:
Universitetstryckeriet.

96
Merrian, B. S. (1994). Fallstudien som forskningsmetodik. Lund: Studentlitteratur.
Nilsson, M. (2013). Buller. In I. I. KI Karolinska Institutet, Miljöhälsorapport 2013 (pp. 179-
193). Mölnycke: Elanders.
Nordstrand, U. (2009). Byggprocessen. Stockholm: Liber AB.
Odeon. (2016, May 11). Specifications. Retrieved from Odeon:
http://www.odeon.dk/specifications
Rosenberg, U. (1992). Akustik i stora rum. Göteborg: Ingemansson Akustik.
Saint-Gobain Ecophon AB. (2002). Begränsa inte dina sinnen. Klippan: Ljungbergs
Tryckeri.
Sakonnet Associates . (2016, May 19). Sakonnet Associates. Retrieved from Construction
Management & Design/Build Construction Management:
http://sakonnetassociates.com/services/construction-management-and-design/
Socialstyrelsen. (2006). Bassängbad. Häslorisker, regler och skötsel. Lindesberg:
Bergslagens grafiska.
Socialstyrelsen. (2008). Buller, Höga ljudnivåer och buller inomhus. Artikelnr 2008-101-4.
Edita Västra Aros.
Sweden Green Building Council. (2016, April 7). Sweden Green Building Council. Retrieved
from Sweden Green Building Council: https://www.sgbc.se
Swedish Standards Institute. (2007). SS 25268:2007, Acoustics - Sound classification of
spaces in buildings - Institutional premises, rooms for education, preschools and
leisure-time centres, rooms for office work and hotels. Stockholm: SIS Förlag AB.
Svensk simidrott. (2016, May 11). Svensk simidrott. Retrieved from 50 meters bassänger -
långbanor: http://www.simarena.se/50-m-bassaenger-laangbanor.html
World Health Organization. (1999). Guidelines for community noise. Geneva: World Health
Organization.
Åkerlöf, L. (2001). Byggnadsakustik, En praktisk handbok. Stockholm: AB Svensk
Byggtjänst.

Appendix 1: SS 25268:2007 and Certification (Swedish)


Sam
manfa
ttnin
g a
v b
ed
öm
nin
gsk
rite
rier
för
nyp
rod
uce
rad b
yggna
d, M
iljöb
ygg
nad 2
.2,
141
001
vers
141
104
M
iljö
byg
gn
ad
ve
rsio
n 2
.2,
1410
01,
ve
rs 1
4110
4
Sam
man
fatt
nin
g a
v b
ety
gsk
rite
rier
för
nyp
rod
ucera
de b
yg
gn
ad
er
O
m d
et sk
ulle
fin
nas
skill
nader
mella
n o
lika d
oku
me
nt så
är
det kr
iteriern
a i
manuale
n o
ch s
var
från t
ekn
iska
rådet so
m g
älle
r.
Ind
ikato
r B
RO
NS
S
ILV
ER
G
UL
D
Ko
mm
en
tare
r o
ch
tip
s
1
En
erg
ian
-v
än
dn
ing
Alla
byg
gn
ader
≤ B
BR
≤ 7
5 %
av
BB
R
≤ 6
5 %
av
BB
R
Inge
n s
killn
ad m
ella
n e
l-vä
rmda o
ch ic
ke-e
lvärm
da
byg
gna
der.
Hand
els
- och
lo-
kalb
ygg
nad
er
med h
all
där
myc
ket sp
illen
erg
i genere
ras
Energ
ianvä
nd
nin
g v
id r
efe
rensd
rift
≤ B
BR
E
nerg
ianvä
nd
nin
g ≤
75%
av
BB
R
Energ
itekn
iska
egensk
aper
hos
byg
gnad
med in
stalla
tioner
är
ej s
äm
re B
RO
NS
E
nerg
irutin
er
ska f
innas.
Energ
ianvä
nd
nin
g ≤
50%
av
BB
R
Energ
itekn
iska
egensk
aper
hos
byg
gnad
med in
-st
alla
tioner
är
ej s
äm
re B
RO
NS
E
nerg
irutin
er
ska f
innas.
2
Värm
eeff
ekt-
beh
ov
W/m
2A
tem
p
I II
III
I II
III
I II
III
Nyt
t fö
r 2.2
är
att
bety
gsk
rite
-riern
a h
ar
just
era
ts e
fter
var
i la
ndet so
m b
yggna
den li
g-
ger.
Ej e
lvärm
da
≤ 8
4
≤ 7
2
≤ 6
0
≤ 5
6
≤ 4
8
≤ 4
0
≤ 3
4
≤ 2
9
≤ 2
5
Elv
ärm
da
≤ 5
6
≤ 4
8
≤ 4
0
≤ 4
2
≤ 3
6
≤ 3
0
≤ 2
8
≤ 2
4
≤ 2
0
3
So
lvärm
ela
st
Loka
ler
SV
L <
48 W
/m2golv
S
VL <
43 W
/m2golv
S
VL <
32 W
/m2golv
Bost
äd
er
SV
L <
38 W
/m2golv
S
VL <
29 W
/m2golv
S
VL <
18 W
/m2golv
4
En
erg
isla
g
Bost
äd
er
Loka
ler
> 5
0 %
av
byg
gn
ade
ns
ene
rgib
eho
v h
ör
till M
iljöka
tego
-riern
a 1
, 2 o
ch 3
.
> 1
0 %
av
byg
gn
ade
ns
ene
rgib
eho
v h
ör
till M
iljöka
tego
ri 1
och <
25 %
Milj
öka
tegori 4
Alte
rnativ
t: >
50
% h
ör
till M
iljöka
tegori
2 och
< 2
5 %
Milj
ö-
kate
gori 4
.
> 2
0 %
av
byg
gn
ade
ns
ene
rgib
eho
v h
ör
till M
iljöka
-te
gori
1 och
< 2
0 %
vard
era
Milj
öka
tegori 3
och
4
Alte
rnativ
t >
50 %
hör
till M
iljöka
tegori 2
och
< 2
0 %
til
l Milj
öka
tegori
3 o
ch 4
.
Gör
fjärr
värm
ele
vera
ntö
rer
uppm
ärk
sam
ma p
å a
tt u
pp-
gift
ern
a o
m b
ränsl
esl
ag i
be-
tygsv
erk
tyg
et ka
n u
ppda
te-
ras.
5
Lju
dm
iljö
Bost
äd
er
Loka
ler
Lju
dkl
ass
C p
å d
e f
yra b
ed
öm
da lj
udpara
metr
arn
a e
nlig
t S
S 2
52
67 e
ller
SS
252
68.
Min
st t
vå a
v de
fyr
a b
edöm
da lj
udpara
metr
arn
a i
SS
25267
elle
r S
S 2
526
8 s
ka u
ppfy
lla lj
udkl
ass
B e
ller
högre
.
Övr
iga
be
döm
da till
min
st lj
udkl
ass
C.
Min
st lj
udkl
ass
B p
å a
lla d
e b
ed
öm
da lj
udpara
met-
rarn
a e
nlig
t S
S 2
52
67 e
ller
SS
252
68.
Godkä
nt enkä
tresu
ltat
Inge
n ä
ndrin
g:
Bed
öm
nin
gen
i MB
om
fattar
steglju
d,
luft
-lju
d,
ljud u
tifrå
n o
ch f
rån in
-st
alla
tioner,
inte
eft
erk
langs-
tid.
6
Rad
on
Bost
äd
er
Loka
ler
≤ 2
00 B
q/m
3
≤ 1
00 B
q/m
3
≤ 5
0 B
q/m
3
Om
konst
rukt
ionen
utf
orm
as
”radonsä
ker”
är
det in
te n
öd-
vän
dig
t att
mäta
radon
ha
lten
i mark
en.
7
Ven
tila
tio
ns-
sta
nd
ard
Loka
ler
Ute
luft
sflö
de ≥
7 l/
s,pers
on +
0,3
5 l/
s,m
2golv
elle
r e
nlig
t rå
d i
AF
S 2
009:2
B
RO
NS
+
Möjli
ghe
t til
l forc
ering a
v ve
ntil
atio
nsf
löd
e i
möte
srum
, ko
n-
fere
nsr
um
, sa
mlin
gss
ala
r e
ller
mots
vara
nd
e m
ed v
ari
e-
rande b
ela
stn
ing.
Oft
a b
enäm
nt ”C
AV
-sys
tem
med m
öjli
ghet til
l forc
ering i
en-
staka
vis
tels
eru
m”.
Manu
ell
styr
nin
g a
cce
pte
ras.
BR
ON
S +
A
uto
matis
kt b
eho
vsst
yrt a
v ve
ntil
atio
nsf
löd
e i
vist
el-
seru
m m
ed v
ari
era
nd
e b
ela
stnin
g.
Oft
a b
enäm
nt ”V
AV
-sys
tem
”.
Godkä
nt enkä
tresu
ltat
elle
r egen
dekl
ara
tion.
Bety
gsk
rite
riern
a ä
r in
te ä
nd-
rade m
en ä
r ty
dlig
are
förk
la-
rade.
Bost
äd
er
U
telu
ftsf
löde ≥
0,3
5 l/
s,m
2 g
olv
B
RO
NS
+
Möjli
ghe
t til
l forc
ering a
v fr
ånlu
ftsf
löde i
kök
en
ligt
BF
S
1998
:38.
Ko
lfilte
rflä
kt ä
r in
te a
ccepte
rat so
m a
ltern
ativ
.
SIL
VE
R +
Frå
nlu
ftsf
löde i
ba
d-,
dusc
h-
elle
r tv
ättru
m e
nlig
t B
FS
199
8:3
8.
Godkä
nt enkä
tresu
ltat
8
Kv
äv
ed
ioxid
Bost
äd
er
Loka
ler
> 4
0 µ
g/m
3
≤ 4
0 µ
g/m
3
≤ 2
0 µ
g/m
3
Alte
rnativ
t: B
yggn
ad u
tanfö
r tä
tort
om
avs
tån
det
till
kraft
igt tr
afik
era
de v
ägar
(fle
r än 1
0 0
00 f
or-
don/d
ygn)
är
störr
e ä
n 2
50 m
.
Fört
ydlig
at
att d
et
inte
är
nöd
vän
dig
t att
mäta
kvä
ved
i-oxi
dh
alte
n v
id v
erifie
ring o
m
BR
ON
S s
öks
.
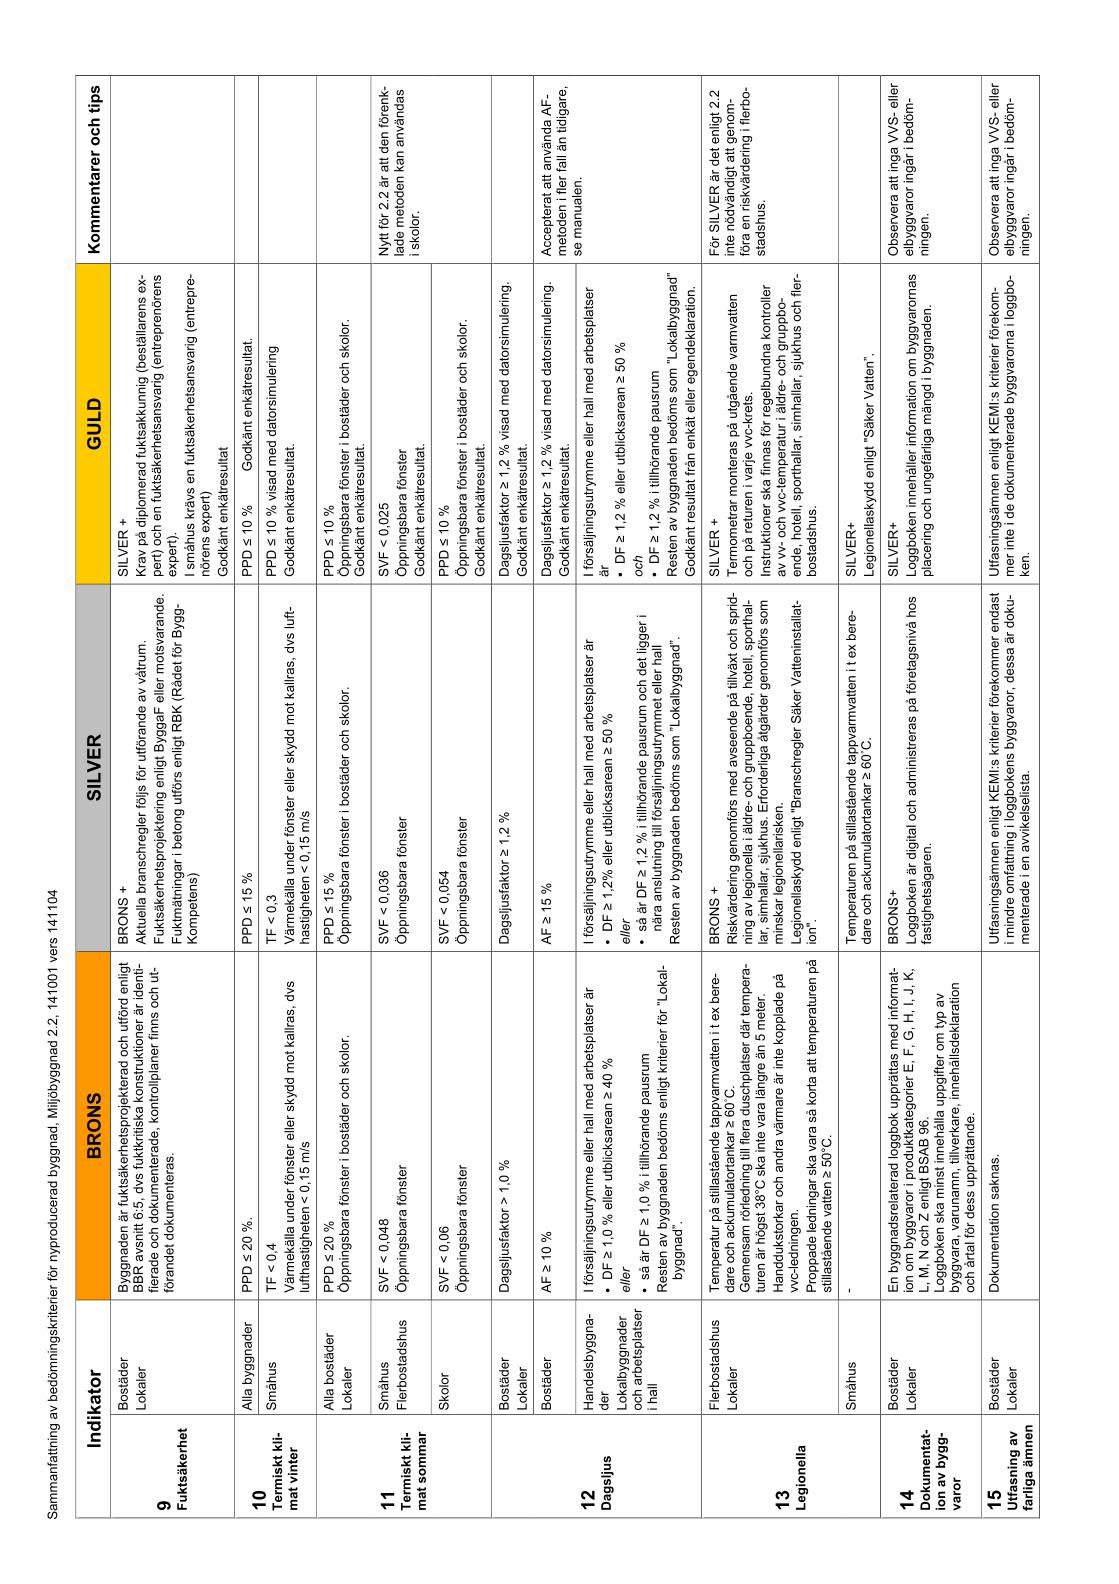
Sam
manfa
ttnin
g a
v b
ed
öm
nin
gsk
rite
rier
för
nyp
rod
uce
rad b
yggna
d, M
iljöb
ygg
nad 2
.2,
141
001
vers
141
104
Ind
ikato
r B
RO
NS
S
ILV
ER
G
UL
D
Ko
mm
en
tare
r o
ch
tip
s
9
Fu
kts
äke
rhet
Bost
äd
er
Loka
ler
Byg
gn
ade
n ä
r fu
ktsä
kerh
ets
pro
jekt
era
d o
ch u
tförd
en
ligt
BB
R a
vsnitt
6:5
, d
vs f
ukt
kriti
ska k
onst
rukt
ioner
är
ide
nti-
fiera
de o
ch d
oku
mente
rade
, ko
ntr
ollp
laner
finns
och
ut-
föra
ndet d
oku
mente
ras.
BR
ON
S +
Akt
uella
bra
nsc
hre
gle
r fö
ljs f
ör
utf
öra
nde a
v vå
trum
.
Fukt
säke
rhets
pro
jekt
ering e
nlig
t B
ygg
aF
elle
r m
ots
vara
nde
.
Fukt
mätn
ingar
i beto
ng
utf
örs
enlig
t R
BK
(R
åde
t fö
r B
ygg-
Kom
pete
ns)
SIL
VE
R +
Kra
v på d
iplo
mera
d f
ukt
sakk
unnig
(best
älla
rens
ex-
pert
) och
en f
ukt
säke
rhets
ansv
ari
g (
entr
epre
nöre
ns
exp
ert
).
I sm
åhus
krävs
en f
ukt
säke
rhets
ansv
arig (
entr
epre
-nöre
ns
exp
ert
)
Godkä
nt enkä
tresu
ltat
10
Term
iskt
kli-
mat
vin
ter
Alla
byg
gn
ader
PP
D ≤
20 %
. P
PD
≤ 1
5 %
P
PD
≤ 1
0 %
Godkä
nt
enkä
tresu
ltat.
Sm
åhus
TF
< 0
,4
Värm
ekä
lla u
nder
fönst
er
elle
r sk
ydd
mot ka
llras,
dvs
lu
fthast
ighete
n <
0,1
5 m
/s
TF
< 0
,3
Värm
ekä
lla u
nder
fönst
er
elle
r sk
ydd
mot ka
llras,
dvs
luft
-hast
ighete
n <
0,1
5 m
/s
PP
D ≤
10 %
vis
ad m
ed d
ato
rsim
ule
ring
Godkä
nt enkä
tresu
ltat.
11
T
erm
iskt
kli-
mat
so
mm
ar
Alla
bost
äd
er
Loka
ler
PP
D ≤
20 %
Ö
ppnin
gsb
ara
fönst
er
i bost
äder
och
sko
lor.
P
PD
≤ 1
5 %
Ö
ppnin
gsb
ara
fönst
er
i bost
äder
och
sko
lor.
P
PD
≤ 1
0 %
Ö
ppnin
gsb
ara
fönst
er
i bost
äder
och
sko
lor.
G
odkä
nt enkä
tresu
ltat.
Sm
åhus
Fle
rbost
adsh
us
SV
F <
0,0
48
Öppnin
gsb
ara
fönst
er
SV
F <
0,0
36
Öppnin
gsb
ara
fönst
er
SV
F <
0,0
25
Öppnin
gsb
ara
fönst
er
Godkä
nt enkä
tresu
ltat.
Nyt
t fö
r 2.2
är
att
den f
öre
nk-
lad
e m
eto
den k
an a
nvä
nda
s i s
kolo
r.
Sko
lor
SV
F <
0,0
6
Öppnin
gsb
ara
fönst
er
SV
F <
0,0
54
Öppnin
gsb
ara
fönst
er
PP
D ≤
10 %
Öppnin
gsb
ara
fönst
er
i bost
äder
och
sko
lor.
Godkä
nt enkä
tresu
ltat.
12
D
ag
slju
s
Bost
äd
er
Loka
ler
Dagsl
jusf
akt
or
> 1
,0 %
D
agsl
jusf
akt
or
≥ 1
,2 %
D
agsl
jusf
akt
or
≥ 1
,2 %
vis
ad m
ed d
ato
rsim
ule
rin
g.
Godkä
nt enkä
tresu
ltat.
Bost
äd
er
AF
≥ 1
0 %
A
F ≥
15 %
D
agsl
jusf
akt
or
≥ 1
,2 %
vis
ad m
ed d
ato
rsim
ule
rin
g.
Godkä
nt enkä
tresu
ltat.
Acc
epte
rat
att a
nvä
nda A
F-
meto
den i
fler
fall
än
tid
igare
, se
manuale
n.
Hand
els
byg
gna-
der
Loka
lbyg
gn
ader
och
arb
ets
pla
tser
i ha
ll
I fö
rsäljn
ingsu
trym
me e
ller
hall
med a
rbets
pla
tser
är
• D
F ≥
1,0
% e
ller
utb
licks
are
an ≥
40
%
eller
• så
är
DF
≥ 1
,0 %
i til
lhöra
nde p
ausr
um
Rest
en a
v b
yggn
ad
en b
edö
ms
enlig
t kr
iterier
för
”Lo
kal-
byg
gna
d”.
I fö
rsäljn
ingsu
trym
me e
ller
hall
med a
rbets
pla
tser
är
• D
F ≥
1,2
% e
ller
utb
licks
are
an ≥
50
%
eller
•
så ä
r D
F ≥
1,2
% i
tillh
öra
nde p
ausr
um
och
det lig
ger
i nära
ansl
utn
ing t
ill f
örs
äljn
ingsu
trym
met elle
r ha
ll
Rest
en a
v b
yggn
ad
en b
edö
ms
som
”Loka
lbyg
gna
d”.
I fö
rsäljn
ingsu
trym
me e
ller
hall
med a
rbets
pla
tser
är
•
DF
≥ 1
,2 %
elle
r u
tblic
ksare
an ≥
50
%
och
• D
F ≥
1,2
% i
tillh
öra
nd
e p
ausr
um
Rest
en a
v b
yggn
ad
en b
edö
ms
som
”Loka
lbyg
gna
d”
Godkä
nt re
sulta
t fr
ån e
nkä
t elle
r eg
en
dekl
ara
tion.
13
Leg
ion
ella
Fle
rbost
adsh
us
Loka
ler
Tem
pera
tur
på s
tilla
stående ta
ppva
rmva
tten i
t ex
bere
-dare
och
ack
um
ula
tort
anka
r ≥ 6
0˚C
. G
em
ensa
m r
örle
dnin
g till
fle
ra d
usc
hpla
tser
där
tem
pera
-tu
ren ä
r högst
38°C
ska
inte
vara
längre
än 5
mete
r.
Handduks
tork
ar
och
andra
värm
are
är
inte
koppla
de p
å
vvc-
lednin
gen.
Pro
ppade le
dnin
gar
ska v
ara
så k
ort
a a
tt te
mpera
ture
n p
å
still
ast
ående v
atten ≥
50°C
.
BR
ON
S +
Ris
kvärd
ering g
enom
förs
med a
vseende p
å till
växt
och
sprid
-nin
g a
v le
gio
nella
i äld
re-
och
gru
ppboende, hote
ll, s
port
hal-
lar,
sim
halla
r, s
jukh
us.
Erf
ord
erlig
a å
tgärd
er
genom
förs
som
m
insk
ar
legio
nella
risk
en.
Legio
nella
skyd
d e
nlig
t "B
ransc
hre
gle
r S
äke
r V
atte
nin
stalla
t-io
n".
SIL
VE
R +
Term
om
etr
ar
monte
ras
på u
tgå
end
e v
arm
vatten
och
på r
etu
ren
i va
rje v
vc-k
rets
.
Inst
rukt
ioner
ska f
innas
för
regelb
un
dna
kontr
olle
r av
vv-
och
vvc
-tem
pera
tur
i äld
re-
och
gru
ppb
o-
ende
, ho
tell,
sp
ort
ha
llar,
sim
halla
r, s
jukh
us
och
fle
r-bost
adsh
us.
För
SIL
VE
R ä
r d
et e
nlig
t 2.2
in
te n
ödvä
nd
igt
att g
en
om
-fö
ra e
n r
iskv
ärd
erin
g i
flerb
o-
stadsh
us.
Sm
åhus
- T
empera
ture
n p
å s
tilla
stående tappva
rmva
tten i
t ex
bere
-dare
och
ack
um
ula
tort
anka
r ≥ 6
0˚C
. S
ILV
ER
+
Leg
ion
ella
skyd
d e
nlig
t "S
äke
r V
att
en”.
14
D
oku
men
tat-
ion
av
byg
g-
varo
r
Bost
äd
er
Loka
ler
En b
yggn
adsr
ela
tera
d lo
gg
bok
upprä
ttas
med in
form
at-
ion o
m b
ygg
varo
r i p
rodukt
kate
gorier
E,
F, G
, H
, I, J
, K
, L, M
, N
och
Z e
nlig
t B
SA
B 9
6.
Logg
boke
n s
ka m
inst
inne
hålla
uppg
ifter
om
typ
av
byg
gva
ra,
varu
nam
n, til
lverk
are
, in
neh
ålls
dekl
ara
tion
och
årt
al f
ör
dess
upprä
tta
nde.
BR
ON
S+
Logg
boke
n ä
r d
igita
l och
adm
inis
trera
s på f
öre
tagsn
ivå h
os
fast
ighets
äg
are
n.
SIL
VE
R+
Logg
boke
n in
ne
hålle
r in
form
atio
n o
m b
ygg
varo
rnas
pla
ceri
ng o
ch u
ngefä
rlig
a m
ängd i
byg
gnad
en.
Obse
rvera
att in
ga V
VS
- elle
r elb
yggva
ror
ingår
i be
döm
-nin
gen.
15
U
tfasn
ing
av
fa
rlig
a ä
mn
en
Bost
äd
er
Loka
ler
Doku
menta
tion s
akn
as.
U
tfasn
ingsä
mnen e
nlig
t K
EM
I:s
krite
rier
före
kom
mer
endast
i m
indre
om
fattnin
g i
loggb
oke
ns
byg
gva
ror,
dess
a ä
r doku
-m
ente
rade i
en a
vvik
els
elis
ta.
Utf
asn
ingsä
mnen e
nlig
t K
EM
I:s
krite
rier
före
kom
-m
er
inte
i d
e d
oku
mente
rad
e b
ygg
varo
rna i
logg
bo-
ken.
Obse
rvera
att in
ga V
VS
- elle
r elb
yggva
ror
ingår
i be
döm
-nin
gen.

Appendix 2: Questionnaire
Questionnaire response. Number is sometimes representing values, see questionnaire. Thick
numbers is a sum. The response rate is illustrated further down and followed by the
questionnaires in English and Swedish.
Age
Below 18 18-25 26-40 41-65 Above 65
Occasion 1 3 1 14 22 3 43
Occasion 2 3 5 6 11 18 43
Occasion 3 4 4 25 14 0 47
Total 10 10 45 47 21 133
How often do you visit swimming halls?
1 2 3 4 5
Occasion 1 0 4 1 24 14 43
Occasion 2 1 6 11 12 12 42
Occasion 3 8 17 13 4 5 47
Total 1 10 12 36 26 132
In what purpose do you visit the swimming hall today?
1 2 3 4 5
Occasion 1 30 3 0 0 4 37
Occasion 2 28 7 0 0 2 37
Occasion 3 5 9 2 21 2 39
Total 63 19 2 21 8 113
How satisfied are you with your experience in the swimming hall today?
Not pleased at all 1 2 3 4 5 Very pleased
Occasion 1 0 0 2 17 24 43
Occasion 2 0 0 3 16 24 43
Occasion 3 0 1 11 22 13 47
Total 0 1 16 55 61 133

How do you experience the acoustic environment?
Noisy 1 2 3 4 5 Comfortable
Occasion 1 1 1 1 13 23 39
Occasion 2 0 2 4 15 22 43
Occasion 3 1 3 20 8 15 47
Total 2 6 25 36 60 129
How does the sound environment affect your experience?
Not at all 1 2 3 4 5 A lot
Occasion 1 7 5 10 14 7 43
Occasion 2 3 5 6 11 18 43
Occasion 3 7 7 13 7 13 47
Total 17 17 29 32 38 133
How do you experience the acoustic environment?
Hard 1 2 3 4 5 Easy
Occasion 1 0 2 10 13 16 41
Occasion 2 0 2 8 22 11 43
Occasion 3 0 4 11 15 17 47
Total 0 8 29 50 44 131
How do you experience the look of the swimming hall on the inside?
Bad 1 2 3 4 5 Good
Occasion 1 1 5 14 16 7 43
Occasion 2 0 3 16 18 5 42
Occasion 3 1 2 15 19 8 45
Total 2 10 45 53 20 130

How do you experience the sound level in this swimming hall compared to other swimming halls?
A lot worse 1 2 3 4 5 A lot better 6 Don’t know
Occasion 1 0 3 4 10 12 13
Occasion 2 0 0 2 19 7 13
Occasion 3 2 3 11 11 9 9
Total 2 6 17 40 28 35
126
How does the acoustic environment effect your choice of swimming hall?
Not at all 1 2 3 4 5 A lot
Occasion 1 8 7 8 13 7 43
Occasion 2 9 7 7 9 9 41
Occasion 3 8 13 10 9 5 45
Total 25 27 25 31 21 129
How often do you experience mental tiredness, headache etc. after a visit in a swimming hall?
Never 1 2 3 4 5 Always
Occasion 1 23 17 3 0 0 43
Occasion 2 14 15 8 4 0 41
Occasion 3 14 9 12 8 2 45
Total 51 41 23 12 2 129

0
5
10
15
20
25
30
35
40
45
50
Below 18 18-25 26-40 41-65 Above 65
Age
Occasion 1 Occasion 2 Occasion 3 Total
0
5
10
15
20
25
30
35
40
1 2 3 4 5
How often do you visit swimming halls?
Occasion 1 Occasion 2 Occasion 3 Total
0
10
20
30
40
50
60
70
1 2 3 4 5
In what purpose do you visit the swimming hall today?
Occasion 1 Occasion 2 Occasion 3 Total

0
10
20
30
40
50
60
70
1 2 3 4 5
How satisfied are you with your experience in the swimming hall today?
Occasion 1 Occasion 2 Occasion 3 Total
0
10
20
30
40
50
60
70
1 2 3 4 5
How do you experience the acoustic environment?
Occasion 1 Occasion 2 Occasion 3 Total
0
5
10
15
20
25
30
35
40
1 2 3 4 5
How does the sound environment affect your experience?
Occasion 1 Occasion 2 Occasion 3 Total
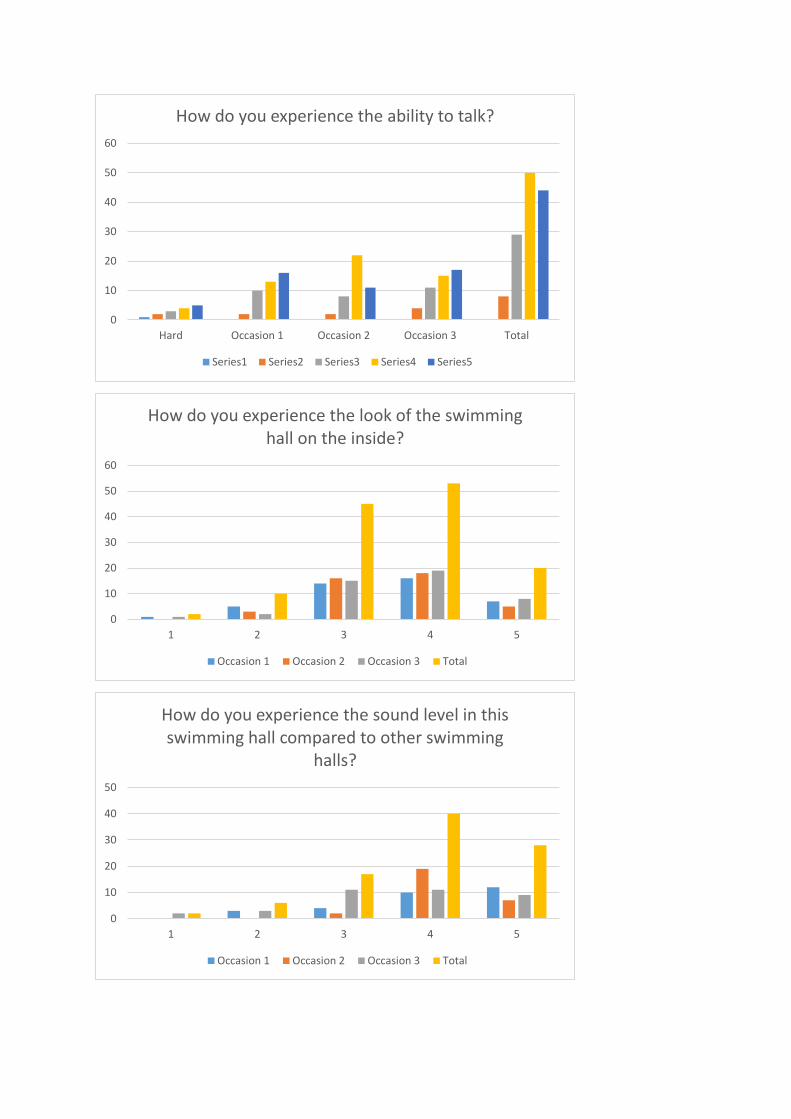
0
10
20
30
40
50
60
Hard Occasion 1 Occasion 2 Occasion 3 Total
How do you experience the ability to talk?
Series1 Series2 Series3 Series4 Series5
0
10
20
30
40
50
60
1 2 3 4 5
How do you experience the look of the swimming hall on the inside?
Occasion 1 Occasion 2 Occasion 3 Total
0
10
20
30
40
50
1 2 3 4 5
How do you experience the sound level in this swimming hall compared to other swimming
halls?
Occasion 1 Occasion 2 Occasion 3 Total

0
5
10
15
20
25
30
35
1 2 3 4 5
How does the acoustic environment effect your choice of swimming hall?
Occasion 1 Occasion 2 Occasion 3 Total
0
10
20
30
40
50
60
1 2 3 4 5
How often do you experience mental tiredness, headache etc. after a visit in a swimming hall?
Occasion 1 Occasion 2 Occasion 3 Total
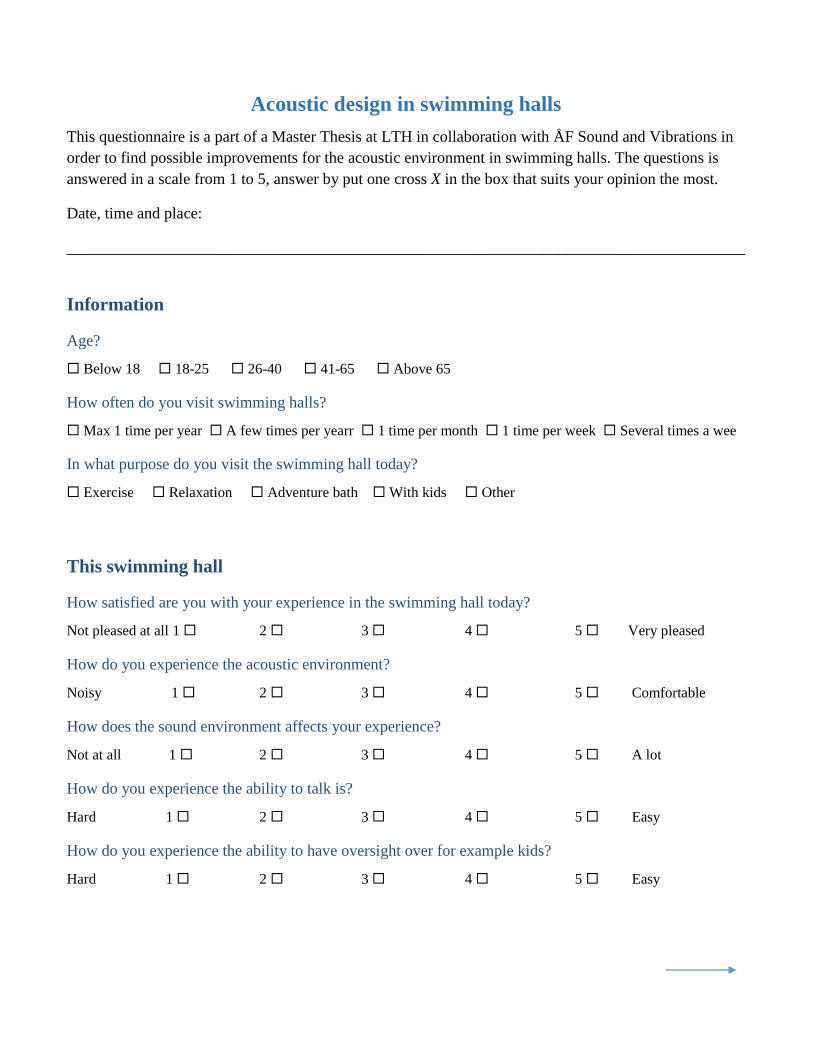
Acoustic design in swimming halls
This questionnaire is a part of a Master Thesis at LTH in collaboration with ÅF Sound and Vibrations in
order to find possible improvements for the acoustic environment in swimming halls. The questions is
answered in a scale from 1 to 5, answer by put one cross X in the box that suits your opinion the most.
Date, time and place:
_____________________________________________________________________________________
Information
Age?
Below 18 18-25 26-40 41-65 Above 65
How often do you visit swimming halls?
Max 1 time per year A few times per yearr 1 time per month 1 time per week Several times a wee
In what purpose do you visit the swimming hall today?
Exercise Relaxation Adventure bath With kids Other
This swimming hall
How satisfied are you with your experience in the swimming hall today?
Not pleased at all 1 2 3 4 5 Very pleased
How do you experience the acoustic environment?
Noisy 1 2 3 4 5 Comfortable
How does the sound environment affects your experience?
Not at all 1 2 3 4 5 A lot
How do you experience the ability to talk is?
Hard 1 2 3 4 5 Easy
How do you experience the ability to have oversight over for example kids?
Hard 1 2 3 4 5 Easy

How do you experience the look of the swimming hall on the inside?
Bad 1 2 3 4 5 Good
How do you experience the sound level in this swimming hall compared to other swimming halls?
A lot worse 1 2 3 4 5 A lot better Don't know
All swimming halls
How does the acoustic environment effect your choice of swimming hall?
Not at all 1 2 3 4 5 A lot
How often do you experience mental tiredness, headache etc. after a visit in a swimming hall?
Never 1 2 3 4 5 Always
Other comments:
_____________________________________________________________________________________
_____________________________________________________________________________________
_____________________________________________________________________________________
_____________________________________________________________________________________
_____________________________________________________________________________________
_____________________________________________________________________________________
_____________________________________________________________________________________
Thanks for your coorperation!
Best regards Malin Hall

Akustisk utformning av simhallar
Denna enkät utförs som en del i ett examensarbete på LTH i samarbete med ÅF Ljud och Vibrationer för
att hitta förbättringar av ljudmiljön i simhallar. Svarsalternativen anges i skala 1-5, svara genom att kryssa
i den ruta som överensstämmer bäst med din åsikt.
Datum, tid och plats:
_____________________________________________________________________________________
Personuppgifter
Ålder?
Under 18 18-25 26-40 41-65 Över 65
Hur ofta besöker du simhallar?
Max 1 gång per år Några gånger per år 1 gång i månaden 1 gång i veckan Flera gånger i veckan
I vilket syfte besöker du simhallen idag?
Motion Relax Äventyrsbad Här med barn Annat
Specifikt för simhallen
Hur nöjd är du med din upplevelse i simhallen idag?
Inte nöjd alls 1 2 3 4 5 Jättenöjd
Hur upplever du ljudmiljön?
Bullrig 1 2 3 4 5 Behaglig
Hur påverkar ljudmiljön din upplevelse av besöket?
Inte alls 1 2 3 4 5 Väldigt mycket
Hur upplever du att det är att kommunicera?
Svårt 1 2 3 4 5 Lätt
Hur upplever du att det är att ha översikt över t.ex. barn?
Svårt 1 2 3 4 5 Lätt

Hur estetiskt tilltalande är simhallen invändigt?
Inte alls 1 2 3 4 5 Väldigt
Hur är ljudmiljön i denna simhall jämfört med andra simhallar generellt?
Mycket sämre 1 2 3 4 5 Mycket bättre Vet ej
Generellt i simhallar
Hur påverkar ljudmiljön ditt val av simhall?
Inte alls 1 2 3 4 5 Jättemycket
Hur ofta upplever du mental trötthet, huvudvärk m.m efter besök i simhallar?
Aldrig 1 2 3 4 5 Alltid
Övriga kommentarer:
_____________________________________________________________________________________
_____________________________________________________________________________________
_____________________________________________________________________________________
_____________________________________________________________________________________
_____________________________________________________________________________________
_____________________________________________________________________________________
_____________________________________________________________________________________
Tack för din medverkan!
Med vänlig hälsning Malin Hall
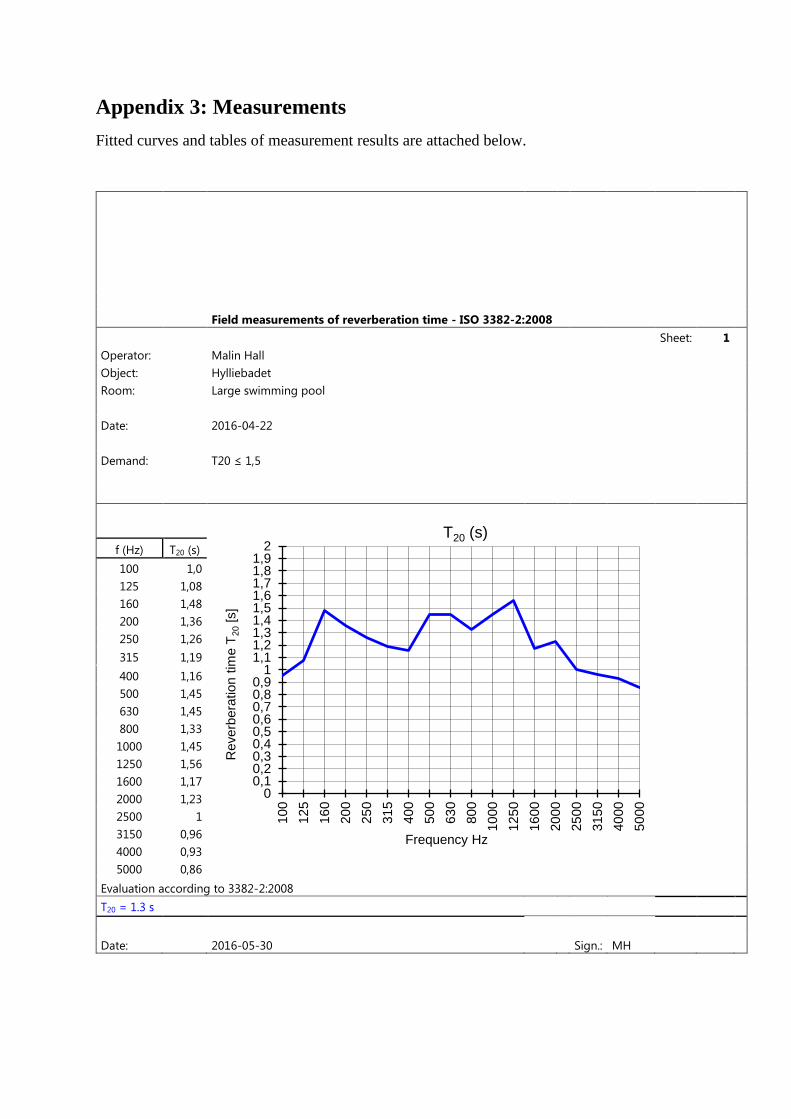
Appendix 3: Measurements
Fitted curves and tables of measurement results are attached below.
Field measurements of reverberation time - ISO 3382-2:2008
Sheet: 1
Operator: Malin Hall
Object: Hylliebadet
Room: Large swimming pool
Date: 2016-04-22
Demand: T20 ≤ 1,5
f (Hz) T20 (s)
100 1,0
125 1,08
160 1,48
200 1,36
250 1,26
315 1,19
400 1,16
500 1,45
630 1,45
800 1,33
1000 1,45
1250 1,56
1600 1,17 #NUM! ####
2000 1,23
2500 1 #NUM! ####
3150 0,96
4000 0,93
5000 0,86
Evaluation according to 3382-2:2008
T20 = 1.3 s
Date: 2016-05-30 Sign.: MH
00,10,20,30,40,50,60,70,80,9
11,11,21,31,41,51,61,71,81,9
2
10
0
12
5
16
0
20
0
25
0
31
5
40
0
50
0
63
0
80
0
10
00
12
50
16
00
20
00
25
00
31
50
40
00
50
00
Reverb
era
tion t
ime T
20
[s]
Frequency Hz
T20 (s)

Field measurement of reverberation time - ISO 3382-2:2008
Sheet: 2
Operator: Malin Hall
Object: Hylliebadet
Room: Small swimming pool
Date: 2016-04-22
Demand: T20 ≤ 1,2
f (Hz) T20 (s)
100 0,7
125 0,75
160 0,79
200 0,65
250 0,73
315 0,65
400 0,71
500 0,77
630 0,96
800 1,25
1000 1,19
1250 1,29
1600 1,44 #NUM! ####
2000 1,52
2500 1,38 #NUM! ####
3150 1,36
4000 1,48
5000 1,49
Evaluation according to 3382-2:2008
T20 = 1.1 s
Date: 2016-05-30 Sign.: MH
00,10,20,30,40,50,60,70,80,9
11,11,21,31,41,51,61,71,81,9
2
10
0
12
5
16
0
20
0
25
0
31
5
40
0
50
0
63
0
80
0
10
00
12
50
16
00
20
00
25
00
31
50
40
00
50
00
Reverb
era
tion t
ime T
20
[s]
Frequency Hz
T20 (s)
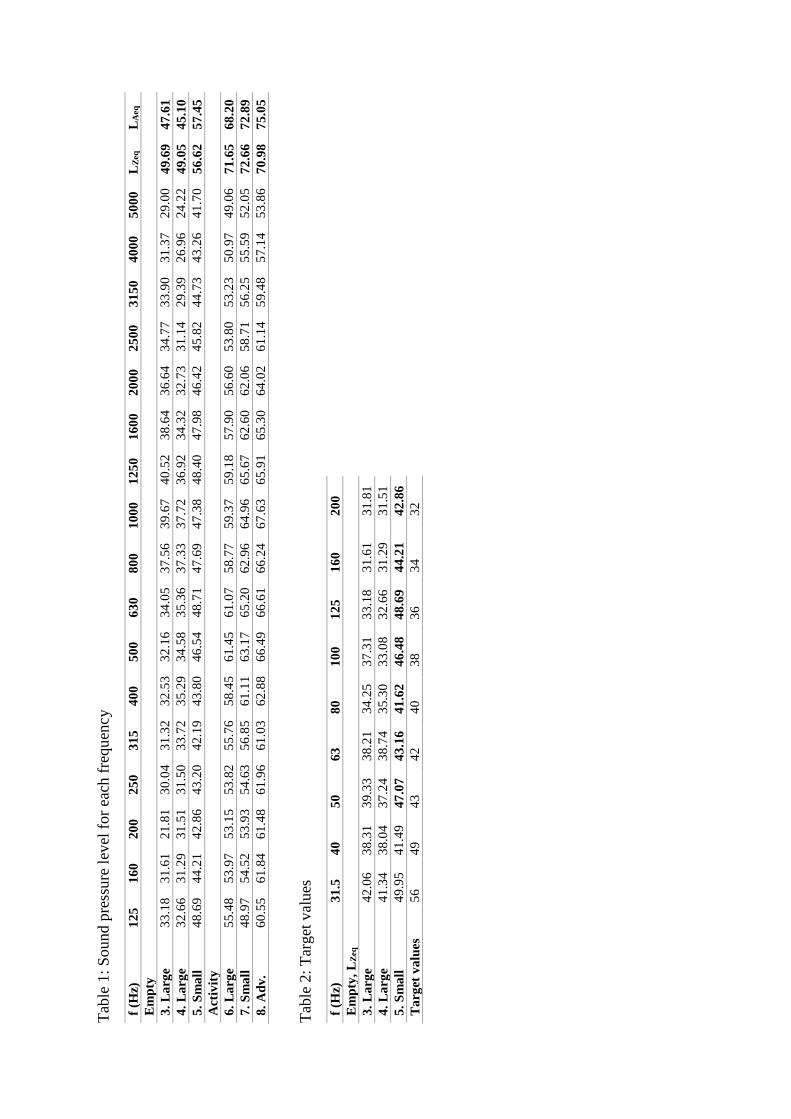
Tab
le 1
: S
ound p
ress
ure
lev
el f
or
each
fre
qu
ency
f (H
z)
12
5
16
0
20
0
25
0
31
5
40
0
50
0
63
0
80
0
10
00
12
50
16
00
20
00
25
00
31
50
40
00
50
00
LZ
eq
L
Aeq
Em
pty
3.
La
rge
33
.18
31
.61
21
.81
30
.04
31
.32
32
.53
32
.16
34
.05
37
.56
39
.67
40
.52
38
.64
36
.64
34
.77
33
.90
31
.37
29
.00
49
.69
47
.61
4.
La
rge
32
.66
31
.29
31
.51
31
.50
33
.72
3
5.2
9
34
.58
35
.36
37
.33
37
.72
36
.92
34
.32
32
.73
31
.14
29
.39
26
.96
2
4.2
2
49
.05
45
.10
5.
Sm
all
4
8.6
9
44
.21
42
.86
43
.20
42
.19
4
3.8
0
46
.54
48
.71
47
.69
47
.38
48
.40
47
.98
46
.42
45
.82
44
.73
43
.26
4
1.7
0
56
.62
57
.45
Act
ivit
y
6.
La
rge
55
.48
53
.97
53
.15
53
.82
55
.76
5
8.4
5
61
.45
61
.07
58
.77
59
.37
59
.18
57
.90
56
.60
53
.80
53
.23
50
.97
4
9.0
6
71
.65
68
.20
7.
Sm
all
4
8.9
7
54
.52
53
.93
54
.63
56
.85
6
1.1
1
63
.17
65
.20
62
.96
64
.96
65
.67
62
.60
62
.06
58
.71
56
.25
55
.59
5
2.0
5
72
.66
72
.89
8.
Ad
v.
60
.55
61
.84
61
.48
61
.96
61
.03
6
2.8
8
66
.49
66
.61
66
.24
67
.63
65
.91
65
.30
64
.02
61
.14
59
.48
57
.14
5
3.8
6
70
.98
75
.05
Tab
le 2
: T
arget
val
ues
f (H
z)
31
.5
40
50
63
80
10
0
12
5
16
0
20
0
Em
pty
, L
Zeq
3.
La
rge
42
.06
38
.31
39
.33
38
.21
3
4.2
5
37
.31
33
.18
31
.61
31
.81
4.
La
rge
41
.34
38
.04
37
.24
38
.74
3
5.3
0
33
.08
32
.66
31
.29
31
.51
5.
Sm
all
4
9.9
5
41
.49
47
.07
43
.16
4
1.6
2
46
.48
48
.69
44
.21
42
.86
Ta
rget
va
lues
5
6
49
43
42
40
38
36
34
32

Appendix 4: Simulations
Results from Global estimate, where 100000000 rays are used, followed by textfiles for
simulation 1 and 2 including complete results for the three receivers.
Global estimate for Simulation 1:

Global estimate for Simulation 2:

Simulation 1:


Simulation 2:
