acoustic assessment of stress level and potential wood ... · acoustic assessment of stress level...
TRANSCRIPT

PBe-GTR–SRS–101Proceedings of the 15th Central Hardwood Forest Conference
Acoustic Assessment of stress LeveL And PotentiAL Wood QuALity of Logs Affected by oAk decLine
Xiping Wang, Henry e. stelzer, Jan Wiedenbeck, and robert J. ross�
Abstract—Large numbers of black oak (Quercus velutina Lam.) and scarlet oak (Q. coccinea Muenchh.) trees are declining and dying in the Missouri Ozark forest as a result of oak decline. Infested trees produce low-grade logs that become extremely problematic to merchandize as the level of insect attack increases in the forest stand. The objective of this study was to investigate the use of a resonance acoustic technique to assess the stress or infestation level of logs affected by oak decline and evaluate potential grade yield of boards obtained from those logs. Following the acoustical testing of 400 black and scarlet oak butt logs obtained from four different stands, the majority of the logs were sawn into 4/4 boards and visually graded based on the local mill standards. A sub-sample of the logs were sawn into 8/4 boards, inspected for defects, and then computer–graded according to the National Hardwood Lumber Association Rules. The results of this study showed a positive relationship between acoustic velocity and grade yield of borer infested logs, suggesting that the resonance acoustic tool can be effectively used to segregate borer infested logs for efficient operation. The poor grade out projected by the computer program is evidence of the poor quality of the oak-decline affected trees in the region. However, the grades imposed by the local mill graders indicate that some of the material could be used for flooring, and virtually all of the material could be used to make pallet and industrial blocking grade products.
introduction Oak decline in the Missouri Ozarks has severely impacted over 200,000 acres of forest land. Black oaks (Quercus velutina Lam.) and scarlet oaks (Q. coccinea Muenchh.),collectively referred to as red oak in the region, that are commonly found along ridge-tops and south- and west-facing aspects have been the hardest hit. The number of red oak borer attacks, an indicator of the level of stress of trees, has increased to unprecedented levels of 300 to 500 attacks per tree, compared to a typical rate of less than 10 for healthy trees (Lawrence and others 2002). While oak decline occurs naturally throughout the region, it is expected to further increase as the oak forest matures.
Oak decline caused damage, as characterized by borer tunnels and decay inside the tree stem, poses a major problem in the utilization of this oak timber resource. Borer-infested trees produce low grade wood that may not be marketable. If the extent of damage is too severe the most cost efficient decision often is to leave the tree in the woods rather than harvest and process it. But, this decision is usually made after considerable logging costs have been incurred. Technologies are needed in both the forest and sawmill to quantify wood borer damage in affected trees or logs suspected of having excessive infestation. With information on the extent of damage, better decisions can be made in both managing the forest stand and utilizing individual trees and logs.
The objective of this study was to investigate the use of a resonance acoustic technique to assess the amount of damage in logs affected by oak decline and evaluate grade yield of the boards obtained from those logs.
1 Xiping Wang, Research Associate, University of Minnesota Duluth and Research General Engineer, Natural Resources Research Institute, USDA Forest Products Laboratory, Madison, WI 52726–2398; Henry E. Stelzer, Associate Professor, University of Missouri, Forestry Department, Columbia, MO 65211; Jan Wiedenbeck, Project Leader, USDA Forest Service, Northeastern Research Station, Princeton, WV 24740; and Robert J. Ross, Project Leader, USDA Forest Service, Forest Products Laboratory, Madison, WI 53593–2398.
Proceedings of the 15th Central Hardwood Forest Conference e-GTR–SRS–101 513

515e-GTR–SRS–101Proceedings of the 15th Central Hardwood Forest Conference
515e-GTR–SRS–101Proceedings of the 15th Central Hardwood Forest Conference
mAteriALs And metHods tree samples The sample for this study was part of a larger study design centered around Salem, MO that was developed for obtaining random, stratified samples representative of timber in the region that would be used to assess the potential utilization of small-diameter (6 to 12 inches dbh) trees. In each of ten stands, 100 trees were selected that represented the species and diameter (> 6 inches d.b.h.) distribution for that stand. The sample trees were then harvested and the tree-length stems were delivered to the mill yard. Each stem was labeled and numbered. The stem number remained with the tree and each log cut from the tree during the entire test.
Due to oak decline being more problematic in the red oak sub-group and the higher incidence of insect attack on the more xeric sites, only red oak species from the four south- and west-facing stands were used in the current study.
Log measurement By stand, the stems were delivered to a portable, three-dimensional laser scanner that was used to acquire three-dimensional geometric profile images of the stems. The images were used in simulation runs of the larger mill utilization study to calculate the most valuable solutions for bucking the stem into sawlogs as well as cutting the sawlogs into lumber.
Once the stems were scanned, they were moved to a manual bucking station in which a chainsaw operator cut the stems into 8- to 10-foot long logs. After bucking, the logs from each stem were delivered together to a manual measuring area where tags were placed on each individual log. During this part of the test, bark measurements were taken, log lengths were recorded, and acoustical test data for predicting lumber quality were obtained on the butt logs.
A resonance based acoustic method was used to measure longitudinal wave velocity in the butt logs. Resonance data were obtained from each log using a resonance acoustic tool (Director HM200) and a build-in Fast Fourier Transformation (FFT) program analyzed the acoustic signals following an impact (Harris and others 2002). The log acoustic velocity is determined based on the equation:
C � 2 f L (1)L 0
where
CL = acoustic velocity of logs (m per second)
f 0
= the fundamental natural frequency of an acoustic wave signal (Hz) L = the log length (end-to-end) (m)
After log testing, we selected a sub sample of red oak butt logs (40), 10 from each stand, for characterizing the borer damage, examining the effects of oak decline on grade yield, and determining the mechanical properties.
mill Process After the individual logs were measured and tagged, they were stockpiled until they could be processed. All logs were sawn into 4/4 (1 inch thick) boards, targeting at wood flooring products, except the logs selected for defect inspection and future mechanical testing, which were sawn into 8/4 (2 inches thick) boards. The boards from each log were kept together in a stack through edging and grading so that each board could be associated with the appropriate log number.
Because some of the aluminum tags were lost in transportation, sawn through at sawmill, or for a variety of other reasons, not legible when the boards were graded, lumber grade data for some of the logs was not obtainable. Lumber grade data was collected on 333 of the 400 or 83 percent of the butt logs included in
PrProceedings of the 15th Centroceedings of the 15th Central Haral Hardwdwood Food Fororest Confest Conferer e-GTR–SRS–101enceence e-GTR–SRS–101 514514
514e-GTR–SRS–101Proceedings of the 15th Central Hardwood Forest Conference
514e-GTR–SRS–101Proceedings of the 15th Central Hardwood Forest Conference
the study. The analysis assumes that omission of a log from the test due to loss or destruction of the tag was a random event.
All of the lumber was graded by employees of the local mill based on grade criteria used in their production operations. The local mill grades (Canoak, Inc., Salem, MO) were as follows:
• Select: 2 clear faces with few knots and defects • #1: 2 clear faces with some knots and defects allowed • #2: 1 clear face with some knots and defects allowed • #3: No clear faces with several defects. This grade is sometimes noted as grade “0” since it has zero
clear faces • Pallet: low grade, rough material suitable for pallets or industrial blocking material
Generally, the local mill sells all select grades as molding or cabinet stock and uses grades #1, #2, and #3 in the flooring operation. Pallet grade material is sold for pallet and industrial uses.
mapping and characterization of defects From the 40 log sub-samples, a total of one hundred and forty 2-inch-thick boards were recovered. These boards were shipped to the USDA Forest Products Laboratory (FPL) in Madison, WS and kiln dried to a target moisture content of 12 percent. The boards were then visually inspected at the Northeast Research Station in Princeton, WV where the defects on each board were digitally mapped using an x-y coordinate system and a digitizing unit adapted for lumber (Anderson and others 1993). This digitized board description allows defect-type summaries to be generated for groups of boards. The defect characteristics for these boards were compared with the defect characteristics of the northern red oak boards in the 1998 red oak lumber data bank (Gatchell and others 1998) to determine if any differences that might be attributable to the oak decline condition were evident.
computer re-grading After mapping and digitizing the defects, these boards were computer-graded using the Ultimate Grading and Remanufacturing System (UGRS) program (Moody and others 1998), which is an automated routine for determining grade under the National Hardwood Lumber Association Rules (1998) that are established for purposes of estimating the utility and value of lumber for use in appearance-type products (e.g., lumber, kitchen cabinets, flooring). The boards were re-graded four times to determine the effect of various sizes of wood borer holes and related defects on the grade of the lumber. In the first re-grade, all pin worm holes (≤ 1/16 inches in diameter) were eliminated to examine the effect of the smallest borer holes on lumber grade. In the second re-grade, both pin worm holes and shot worm holes (≤ 1/4 inches in diameter) were eliminated. In the third re-grade, pin, shot, and grub worm holes (> 1/4 inches in diameter) were eliminated. Finally, the boards were re-graded with all worm holes eliminated as well as incipient decay, mineral streak, and sap stain – defects that may have arisen after and as a result of the borer infestation.
yield simulation The potential value of the wood material removed from the Missouri logs was also evaluated in terms of its suitability for production of higher value appearance-grade products, in this case furniture parts. The cut-up of the 140 digitized boards into furniture parts was simulated using the ROugh MILL Simulator (ROMI-3) (Weiss and Thomas 2005). The number and sizes of the parts used in conducting the simulation study were based on the distribution of 8/4-thick rough-part width and length requirements for solid furniture reported by several manufacturers (Araman 1982). The specific quantities and sizes of parts needed to fulfill a production order are referred to in the industry as a cutting bill. The cutting bill created for this simulation study not only used the distribution information from Araman (1982), but also the Buehlmann cutting bill part group scheme (Buehlmann and others 2003). The assumption was made, based on previous part yield studies conducted for low-grade lumber (Wiedenbeck and others 2004,
PrProceedings of the 15th Centroceedings of the 15th Central Haral Hardwdwood Food Fororest Confest Conferer e-GTR–SRS–101enceence e-GTR–SRS–101 515515

517e-GTR–SRS–101Proceedings of the 15th Central Hardwood Forest Conference
517e-GTR–SRS–101Proceedings of the 15th Central Hardwood Forest Conference
Shepley and others 2004), that the surface-measure based yield of parts that might be reasonably expected from the Missouri sample was 24 percent.
Since the majority of rough mills cutting lumber into parts use rip-first systems, ROMI-3 (Weiss and Thomas 2005) was setup to conduct a rip-first simulation. The “selective ripsaw” type was used because it produces high yields without requiring that the user be familiar with the detailed information required to optimally specify the operating parameters for the other types of ripsaws available in the ROMI-3 program. In order to estimate not only the potential recovery of parts of required sizes that might be obtained from the Missouri sample, but also to estimate the additional area of wood surface that might yield useable parts for use in edge-glued panels, the ROMI-3 simulation was set up so that random-width sections could be recovered after all available specified sizes were extracted from each piece of lumber. Two quality classes of furniture parts were cut in the study. First, parts that were clear on both faces (i.e., front and back) were required. In the second instance, parts were allowed to included pin, shot, and grub worm holes as well as mineral streak, sap stain, and incipient decay. The second instance was simulated in order to get a ballpark idea of how much impact the quality factors that are most directly associated with red oak decline have on yield. By allowing these defects we are effectively approximating the yield potential of the Missouri lumber for clear face parts if the defects did not exist.
resuLts And discussion Log Acoustic velocity Acoustic velocity is a nondestructive measure that has been proved to be related to the basic wood and fiber properties such as stiffness, density, and microfibril angle etc. (Wang and others 2001, 2004; Carter and others 2005). It has also been recognized as a predicting parameter for wood deterioration caused by any wood decay mechanism (Ross and others 2005). For red oak trees that have suffered from oak decline, physical damages such as warm holes, grub holes, decay are the typical symptoms associated with the borer infestation. It is possible that these physical and chemical changes, in both macro- and microstructure level, could affect the acoustic wave behavior in the trees and logs. It is therefore important to examine the acoustic characteristics of the red oak logs harvested from infested stands and determine if this nondestructive measure is effective in assessing the stress level and potential quality of the wood.
Table 1 summarizes the d.b.h. and acoustic velocity data of the butt logs sampled in this study. It should be pointed out that the acoustic velocity was measured not long after harvesting and therefore referred to green condition.
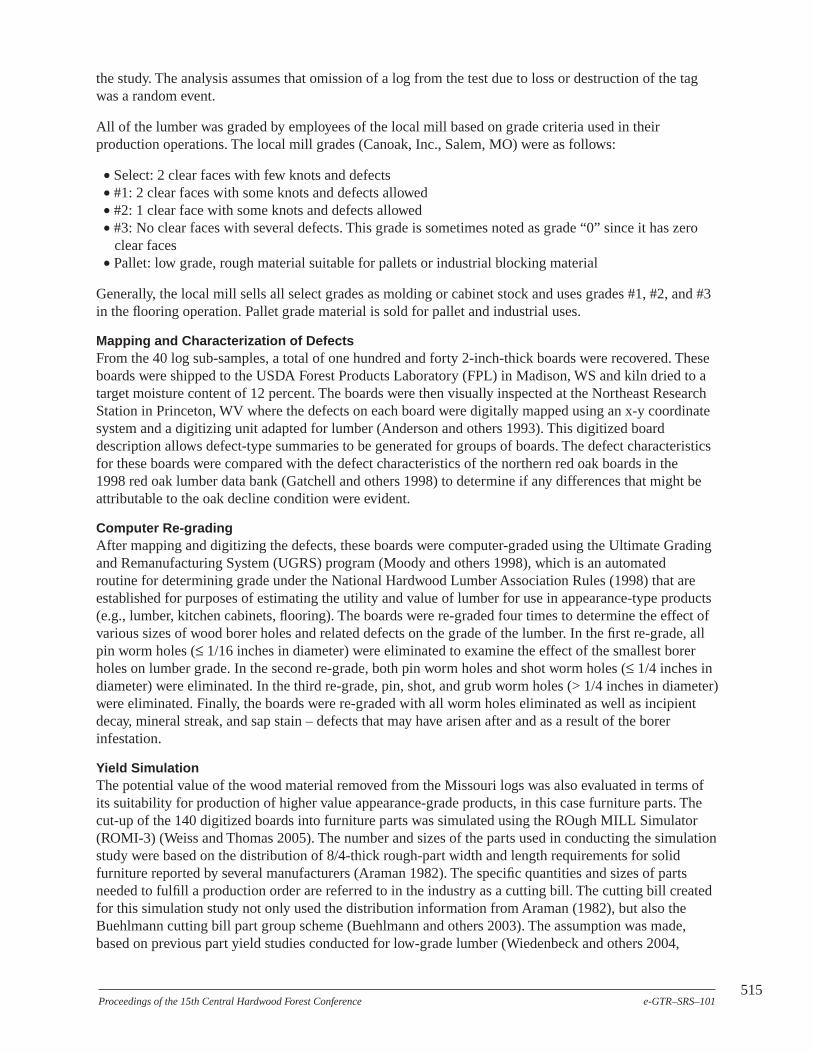
Figure 1 shows the distribution of log acoustic velocity data for the four stands investigated. The distribution patterns are similar and appear to be normally distributed. This is to be expected since the four sites represent the same xeric, south- or west-facing aspects. Analysis of variance did, however, reveal
table �—d.b.h. of the tree samples and acoustic velocity of the butt logs cut from the trees
Stand D.b.h. of tree samples Acoustic velocity of butt logs number Mean Std. dev. Min. Max. Mean Std. dev. Min. Max.
- - - - - - - - - inches - - - - - - - - - - - - - - - - - km/second - - - - - - - -
1 8.20 0.964 6 10 3.07 0.264 2.54 3.63 2 8.09 1.615 5 12 2.99 0.317 2.15 3.76 3 8.45 1.690 6 12 2.89 0.237 2.07 3.26 4 8.30 1.784 5 12 3.01 0.340 2.04 3.84
D.b.h. = diameter at breast height; Std. dev. = standard deviation.
PrProceedings of the 15th Centroceedings of the 15th Central Haral Hardwdwood Food Fororest Confest Conferer e-GTR–SRS–101enceence e-GTR–SRS–101 516516
516e-GTR–SRS–101Proceedings of the 15th Central Hardwood Forest Conference
516e-GTR–SRS–101Proceedings of the 15th Central Hardwood Forest Conference
(B) Stand 2 (A) Stand 1
(C) Stand 3 (D) Stand 4
Figure 1—Distribution of log acoustic velocity within each stand.
a significantly lower mean acoustic velocity in Stand 3, suggesting that this stand could have been more severely affected by oak decline than the other stands.
Figure 1 also shows significant variation in acoustic velocity within each stand, implying a wide range of wood properties and quality levels for each stand. If a direct relationship exists between acoustic velocity and stress level of the logs, then acoustic data could be used to segregate good, healthy stems/logs from severely infested stems/logs.
Log Acoustic velocity in relation to board grade One way to quantify the effectiveness of acoustic measure as a quality criterion is to determine the relationships between acoustic velocity of the logs and the grade levels of the boards cut from the logs. For this purpose, we pooled the log data of all four stands and divided the logs into six groups based on acoustic velocity of the logs. The six groups of logs have the following acoustic velocity ranges:
• G1: < 2.6 km per second • G2: 2.6 – 2.8 km per second • G3: 2.8 – 3.0 km per second • G4: 3.0 – 3.2 km per second • G5: 3.2 – 3.4 km per second • G6: > 3.4 km per second
PrProceedings of the 15th Centroceedings of the 15th Central Haral Hardwdwood Food Fororest Confest Conferer e-GTR–SRS–101enceence e-GTR–SRS–101 517517
519e-GTR–SRS–101Proceedings of the 15th Central Hardwood Forest Conference
519e-GTR–SRS–101Proceedings of the 15th Central Hardwood Forest Conference
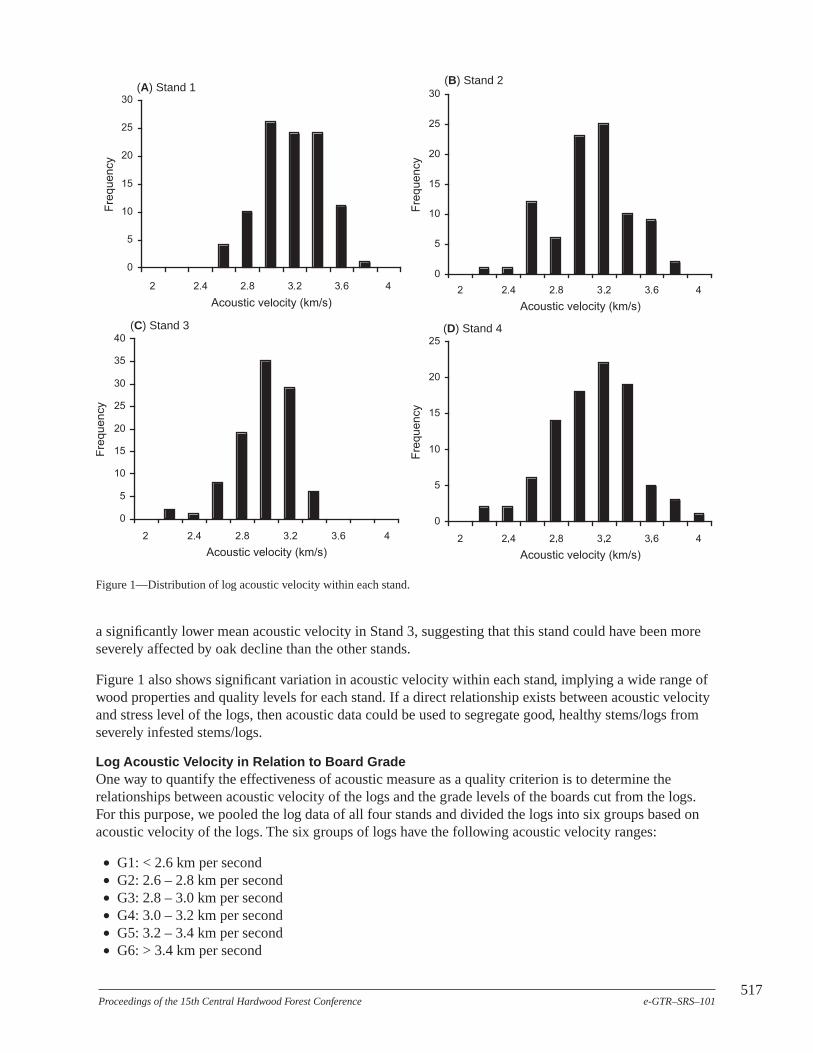
The group acoustic velocity of the logs was then correlated to the board grade levels as determined based on the grading rules of the local mill - Select, #1, #2, #3, and Pallet. The grade distribution of the red oak boards is illustrated in figure 2. The grades imposed by the local mill graders indicate that some of the material could be used for flooring and virtually all of the material could be used to make pallet and industrial blocking grade products.
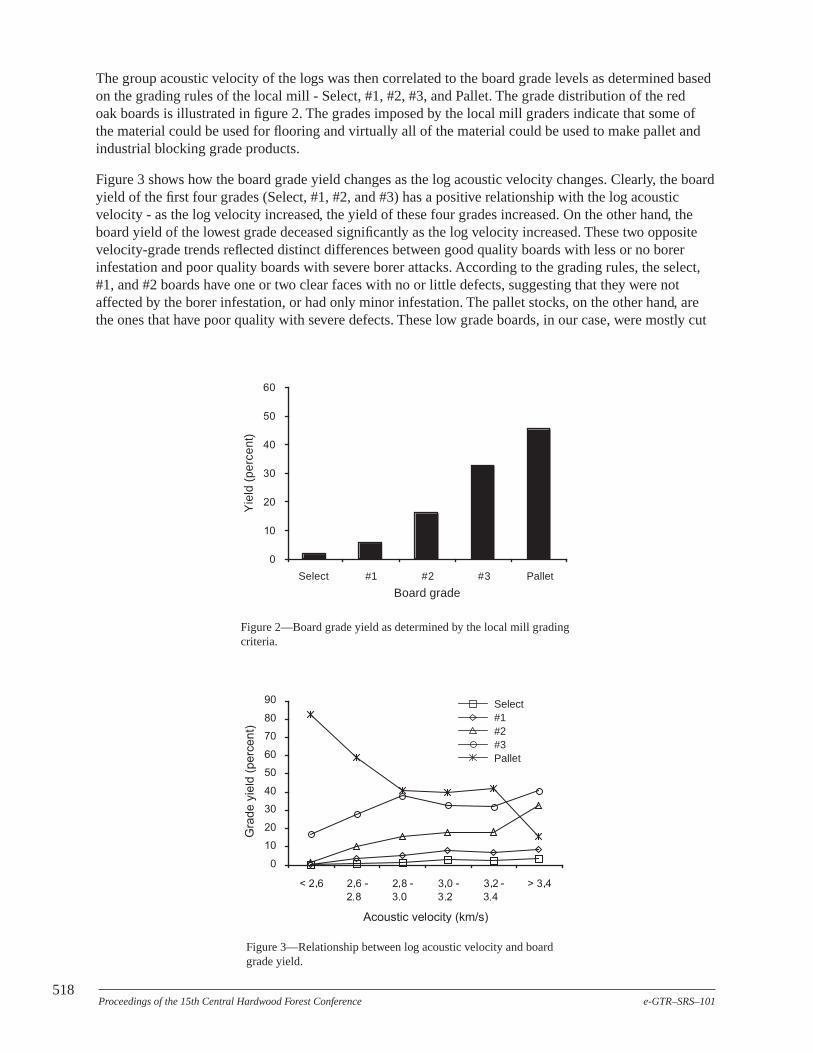
Figure 3 shows how the board grade yield changes as the log acoustic velocity changes. Clearly, the board yield of the first four grades (Select, #1, #2, and #3) has a positive relationship with the log acoustic velocity - as the log velocity increased, the yield of these four grades increased. On the other hand, the board yield of the lowest grade deceased significantly as the log velocity increased. These two opposite velocity-grade trends reflected distinct differences between good quality boards with less or no borer infestation and poor quality boards with severe borer attacks. According to the grading rules, the select, #1, and #2 boards have one or two clear faces with no or little defects, suggesting that they were not affected by the borer infestation, or had only minor infestation. The pallet stocks, on the other hand, are the ones that have poor quality with severe defects. These low grade boards, in our case, were mostly cut
Yie
ld (
pe
rcen
t)
Select #1 #2 #3 Pallet
Board grade
Figure 2—Board grade yield as determined by the local mill grading criteria.
Select #1 #2 #3 Pallet
Figure 3—Relationship between log acoustic velocity and board grade yield.
PrProceedings of the 15th Centroceedings of the 15th Central Haral Hardwdwood Food Fororest Confest Conferer e-GTR–SRS–101enceence e-GTR–SRS–101 518518
518e-GTR–SRS–101Proceedings of the 15th Central Hardwood Forest Conference
518e-GTR–SRS–101Proceedings of the 15th Central Hardwood Forest Conference
from the red oak butt logs that had suffered medium and severe borer attacks. The yield results showed that about 45 percent of the total boards were actually in pallet stock (fig. 2). This reflects the quality problem associated with the oak decline in the region. The velocity-grade trends shown in figure 3 suggest that log acoustic velocity could be effectively used to segregate severely infested stems/logs from good and healthy stems/logs.
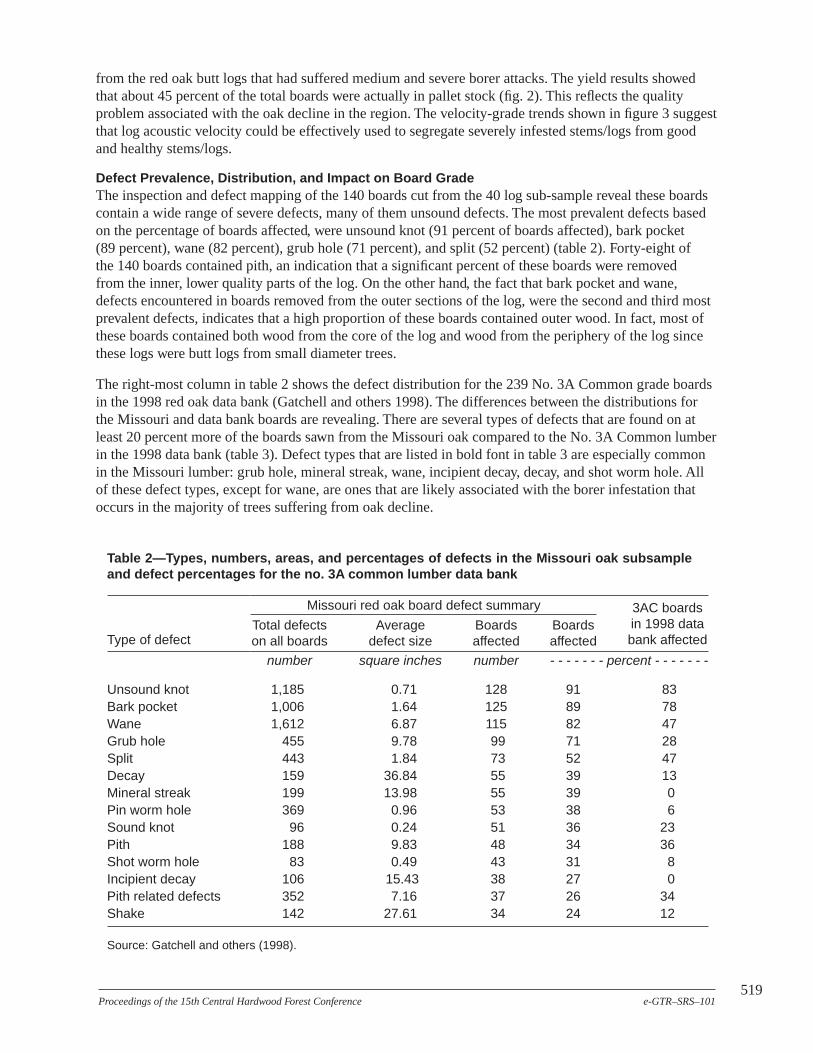
defect Prevalence, distribution, and impact on board grade The inspection and defect mapping of the 140 boards cut from the 40 log sub-sample reveal these boards contain a wide range of severe defects, many of them unsound defects. The most prevalent defects based on the percentage of boards affected, were unsound knot (91 percent of boards affected), bark pocket (89 percent), wane (82 percent), grub hole (71 percent), and split (52 percent) (table 2). Forty-eight of the 140 boards contained pith, an indication that a significant percent of these boards were removed from the inner, lower quality parts of the log. On the other hand, the fact that bark pocket and wane, defects encountered in boards removed from the outer sections of the log, were the second and third most prevalent defects, indicates that a high proportion of these boards contained outer wood. In fact, most of these boards contained both wood from the core of the log and wood from the periphery of the log since these logs were butt logs from small diameter trees.
The right-most column in table 2 shows the defect distribution for the 239 No. 3A Common grade boards in the 1998 red oak data bank (Gatchell and others 1998). The differences between the distributions for the Missouri and data bank boards are revealing. There are several types of defects that are found on at least 20 percent more of the boards sawn from the Missouri oak compared to the No. 3A Common lumber in the 1998 data bank (table 3). Defect types that are listed in bold font in table 3 are especially common in the Missouri lumber: grub hole, mineral streak, wane, incipient decay, decay, and shot worm hole. All of these defect types, except for wane, are ones that are likely associated with the borer infestation that occurs in the majority of trees suffering from oak decline.
table 2—types, numbers, areas, and percentages of defects in the missouri oak subsample and defect percentages for the no. 3A common lumber data bank
Missouri red oak board defect summary 3AC boards Total defects Average Boards Boards in 1998 data
Type of defect on all boards defect size affected affected bank affected
number square inches number - - - - - - - percent - - - - - - -
Unsound knot 1,185 0.71 128 91 83 Bark pocket 1,006 1.64 125 89 78 Wane 1,612 6.87 115 82 47 Grub hole 455 9.78 99 71 28 Split 443 1.84 73 52 47 Decay 159 36.84 55 39 13 Mineral streak 199 13.98 55 39 0 Pin worm hole 369 0.96 53 38 6 Sound knot 96 0.24 51 36 23 Pith 188 9.83 48 34 36 Shot worm hole 83 0.49 43 31 8 Incipient decay 106 15.43 38 27 0 Pith related defects 352 7.16 37 26 34 Shake 142 27.61 34 24 12
Source: Gatchell and others (1998).
PrProceedings of the 15th Centroceedings of the 15th Central Haral Hardwdwood Food Fororest Confest Conferer e-GTR–SRS–101enceence e-GTR–SRS–101 519519
521e-GTR–SRS–101Proceedings of the 15th Central Hardwood Forest Conference
521e-GTR–SRS–101Proceedings of the 15th Central Hardwood Forest Conference
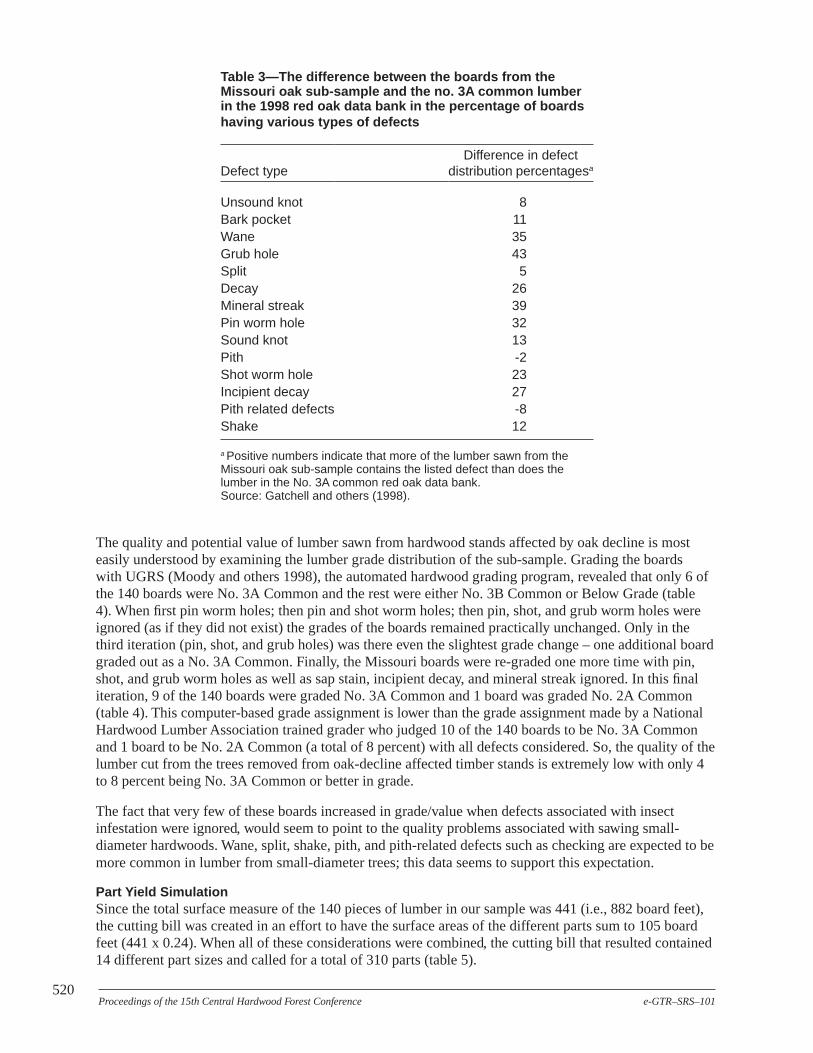
table 3—the difference between the boards from the missouri oak sub-sample and the no. 3A common lumber in the �998 red oak data bank in the percentage of boards having various types of defects
Difference in defect Defect type distribution percentagesa
Unsound knot 8 Bark pocket 11 Wane 35 Grub hole 43 Split 5 Decay 26 Mineral streak 39 Pin worm hole 32 Sound knot 13 Pith -2 Shot worm hole 23 Incipient decay 27 Pith related defects -8 Shake 12
a Positive numbers indicate that more of the lumber sawn from the Missouri oak sub-sample contains the listed defect than does the lumber in the No. 3A common red oak data bank. Source: Gatchell and others (1998).
The quality and potential value of lumber sawn from hardwood stands affected by oak decline is most easily understood by examining the lumber grade distribution of the sub-sample. Grading the boards with UGRS (Moody and others 1998), the automated hardwood grading program, revealed that only 6 of the 140 boards were No. 3A Common and the rest were either No. 3B Common or Below Grade (table 4). When first pin worm holes; then pin and shot worm holes; then pin, shot, and grub worm holes were ignored (as if they did not exist) the grades of the boards remained practically unchanged. Only in the third iteration (pin, shot, and grub holes) was there even the slightest grade change – one additional board graded out as a No. 3A Common. Finally, the Missouri boards were re-graded one more time with pin, shot, and grub worm holes as well as sap stain, incipient decay, and mineral streak ignored. In this final iteration, 9 of the 140 boards were graded No. 3A Common and 1 board was graded No. 2A Common (table 4). This computer-based grade assignment is lower than the grade assignment made by a National Hardwood Lumber Association trained grader who judged 10 of the 140 boards to be No. 3A Common and 1 board to be No. 2A Common (a total of 8 percent) with all defects considered. So, the quality of the lumber cut from the trees removed from oak-decline affected timber stands is extremely low with only 4 to 8 percent being No. 3A Common or better in grade.
The fact that very few of these boards increased in grade/value when defects associated with insect infestation were ignored, would seem to point to the quality problems associated with sawing small-diameter hardwoods. Wane, split, shake, pith, and pith-related defects such as checking are expected to be more common in lumber from small-diameter trees; this data seems to support this expectation.
Part yield simulation Since the total surface measure of the 140 pieces of lumber in our sample was 441 (i.e., 882 board feet), the cutting bill was created in an effort to have the surface areas of the different parts sum to 105 board feet (441 x 0.24). When all of these considerations were combined, the cutting bill that resulted contained 14 different part sizes and called for a total of 310 parts (table 5).
PrProceedings of the 15th Centroceedings of the 15th Central Haral Hardwdwood Food Fororest Confest Conferer e-GTR–SRS–101enceence e-GTR–SRS–101 520520

520e-GTR–SRS–101Proceedings of the 15th Central Hardwood Forest Conference
520e-GTR–SRS–101Proceedings of the 15th Central Hardwood Forest Conference
table 4—comparison of lumber grades and furniture part yields for lumber sawn from 40 log subsample of missouri logs and no. 3A common red oak lumber
Missouri lumber Red oak data bank lumber
All defects Ignoring six All defects Ignoring six Grade/part considered defect types considered defect types
- - - - - - - - - - - - - - - - percent - - - - - - - - - - - - - - - -
No. 3A common and better board proportion 4 6 100 100
Furniture part yield 20 26 38 40
Source: Gatchell and others (1998).
table 5—number of parts required by the cutting bill used in the yield simulation studya
Part size Part size length width 10 17.5 27.5 47.5 72.5
- - - - - - - - - - - - - - - - - - - - - - inches - - - - - - - - - - - - - - - - - - - - -
1.5 10 127 29 28 1 2.5 — 48 13 11 — 3.5 — 15 5 4 — 4.25 — 12 4 3 —
— = data not measured. a Based on the Buehlmann and others (2003), structure and the part size requirements recorded by Araman (1982).
The results of the current yield were directly compared with yield results from a duplicate simulation study conducted on previously digitized No. 3A Common northern red oak lumber (Gatchell and others 1998). There are some differences between these lumber sets: (1) the sub-sample of Missouri oak was 8/4 (2-inch) thickness while the 1998 red oak data bank sample was 4/4 (1-inch) thickness material, (2) all of the Missouri oak lumber was 8-feet long while the sample used for comparison ranged from 6 to 10 feet in length, and (3) the Missouri oak lumber ranged from 3 to 6 inches in width while the comparison data ranged in width from 3 to 7 inches. The differences in the defect data sets were minimized by randomly selecting boards with relatively similar lengths and widths from those available in the 1998 data bank (Gatchell and others 1998); boards wider than 7 inches and longer than 10 feet were excluded from the comparison study.
As for the thickness difference between the two samples, there is a dearth of information on the impact of lumber thickness on yield. Based on a basic understanding of defect propagation through the log, it is logical that the location of through-defects in thicker lumber will be more variable from the face to the back side while through-defects in thinner lumber will be more closely aligned from face to back. When the cutting bill calls for parts that are clear on both faces, the defect offset in the thicker lumber may occasionally lead to reduction in yield. However, the defect location offset from face to face is not likely to be more than fractions of an inch. Given that it is rare that a required fixed part length (or width) fits exactly inside a clear area without there being excess clear wood on the ends or edges of the part, it would only be a rare case when the defect offset would cause a part recovery opportunity to be lost. In the yield
PrProceedings of the 15th Centroceedings of the 15th Central Haral Hardwdwood Food Fororest Confest Conferer e-GTR–SRS–101enceence e-GTR–SRS–101 521521

523e-GTR–SRS–101Proceedings of the 15th Central Hardwood Forest Conference
523e-GTR–SRS–101Proceedings of the 15th Central Hardwood Forest Conference
estimation work by Englerth and Schumann (1969) the statement was made “no yield reduction [from those obtained in cutting 4/4 lumber] was necessary for determining yields from 5/4 lumber.”
With the ROMI-3 lumber cut-up simulation program (Weiss and Thomas 2005) setup to maximize yield from clear areas, the yield measured when the 140 boards in our sample were cut into furniture parts was only 20 percent (table 4). When the defects most closely associated with oak decline (pin, spot, and grub worm holes, sap stain, mineral streak, and incipient decay) were allowed in the cuttings (simulating the situation in which these defects are nonexistent), the furniture part yield obtained from the Missouri lumber went up to 26 percent – still a low yield (table 4). By comparison, the yield from a random sample of No. 3A Common boards (Gatchell and others 1998) was 38 percent with all defects included. When the holes, incipient decay, and mineral/stain defects were ignored, the furniture part yield for this comparison group of lumber went up to 40 percent. Part yield improved by 6 percent for the Missouri lumber but only by 2 percent for the data bank boards when specific defect types were ignored in the analysis – an expected result given the defect occurrence patterns discussed previously.
concLusions The acoustic velocity measured on logs had a significant variation within each stand, which shows the advantages of using acoustic velocity to segregate logs. The acoustic velocity of the red oak logs has a positive relationship with the grade yield as determined based on the local mill standard. This indicates that log acoustic velocity could be effectively used to segregate borer infested logs for efficient mill operation.
Of the most prevalent defects found on the red oak boards, grub hole, mineral streak, incipient decay, decay, and shot worm hole are ones that are likely associated with the borer infestation. The computer re-grading of the boards indicated that very few of the boards increased in grade/value when defects associated with insect infestation were ignored. This seems to point to the quality problems associated with sawing small-diameter hardwoods.
The poor grade out projected by the NHLA lumber grader is evidence of the poor quality of the small diameter timber in the region compared to areas where NHLA grades are more commonly used. In most areas of the country, this material would be sold as pulpwood and would have very little value as saw timber. However, the grades imposed by the local mill graders indicate that some of the material could be used for flooring and virtually all of the material could be used to make pallet and industrial blocking grade products.
LiterAture cited Anderson, R.B.; Thomas, R.E.; Gatchell, C.J.; Bennett, N.D. 1993. Computerized technique for recording board defect data.
Research Paper. NE-671. Radnor, PA.: U.S. Department of Agriculture, Forest Service, Northeastern Research Station. 17 p.
Araman, P.A. 1982. Rough-part sizes needed from lumber for manufacturing furniture and kitchen cabinets. Research Paper. NE-503, Broomall, PA: U.S. Department of Agriculture, Forest Service, Northeastern Research Station. 8 p.
Buehlmann, U.; Wiedenbeck, J.K.; Kline, D.E. 2003. Effect of cutting bill requirements on lumber yield in a rip-first rough mill. Wood and Fiber Science. 35(2):187-200.
Carter, P.; Briggs, D.; Ross, R.J.; Wang, X. 2005. Acoustic testing to enhance western forest values and meet customer wood quality needs. PNW-GTR-642. Portland, OR.: U.S. Department of Agriculture, Forest Service, Pacific Northwest Research Station. 121-129.
Englerth, G.H.; Schumann, D.R. 1969. Charts for calculating dimension yields from hard maple lumber. Research Paper. FPL-118, Madison, WI.: U.S. Department of Agriculture, Forest Service, Forest Products Laboratory. 11 p.
Gatchell, C.J.; Thomas, R.E.; Walker, E.S. 1998. 1998 data bank for kiln-dried red oak lumber. General Technical Report. NE245. Radnor, PA: U.S. Department of Agriculture, Forest Service, Northeastern Research Station. 60 p.
PrProceedings of the 15th Centroceedings of the 15th Central Haral Hardwdwood Food Fororest Confest Conferer e-GTR–SRS–101enceence e-GTR–SRS–101 522522
522e-GTR–SRS–101Proceedings of the 15th Central Hardwood Forest Conference
522e-GTR–SRS–101Proceedings of the 15th Central Hardwood Forest Conference
Harris, P.; Petherick, R.; Andrews, M. 2002. Acoustic resonance tools. In: Proceedings, 13th International Symposium on Nondestructive Testing of Wood, August 19-21, 2002. Berkeley, CA. 195-201.
Lawrence, R.; Moltzan, B.; Moser, K. 2002. Oak decline and the future of Missouri’s forests – drought, old age, insects and disease threaten State woodlands. Missouri Conservationist. July 2002.
Moody, J.; Gatchell, C.J; Walker, E.S.; Klinkhachorn, P. 1998. User’s guide to UGRS: the ultimate grading and remanufacturng system. (version 5.0). General Technical Report. NE-254, Radnor, PA.: U.S. Department of Agriculture, Forest Service, Northeastern Research Station. 40 p.
National Hardwood Lumber Association. 1998. Rules for the measurement & inspection of hardwood & cypress. National Hardwood Lumber Association, Memphis, TN. 136 p.
Ross, R.J.; Wang, X.; Brashaw, B.K. 2005. Inspection and monitoring techniques for bridges and civil structures. Chapter 5. Detecting decay in wood component. Woodhead Publishing Limited, Cambridge, England. 100-114.
Shepley, B.P.; Wiedenbeck, J.; Smith, R.L. 2004. Opportunities for expanded and higher value utilization of no. 3A common hardwood lumber. Forest Products Journal. 54(9): 77-85.
Wang, X.; Ross, R.J.; Brashaw, B.K. [and others]. 2004. Diameter effect on stress-wave evaluation of modulus of elasticity of small-diameter logs. Wood and Fiber Science. 36(3): 368-377.
Wang, X.; Ross, R.J.; McClellan, M. [and others]. 2001. Nondestructive evaluation of standing trees with a stress wave method. Wood and Fiber Science. 33(4): 522-533.
Weiss, J.M.; Thomas, R.E. 2005. ROMI-3: rough-mill simulator version 3.0: user’s guide. General Technical Report. NE-328, Newtown Square, PA. U.S. Department of Agriculture, Forest Service, Northeastern Research Station. 75 p.
Wiedenbeck, J.; Shepley, B.P.; Smith, R.L. 2004. Rough-mill yield and cutting efficiency for no. 3A common lumber compared to other lumber grade mix options. Forest Products Journal. 54(12):132-140.
PrProceedings of the 15th Centroceedings of the 15th Central Haral Hardwdwood Food Fororest Confest Conferer e-GTR–SRS–101enceence e-GTR–SRS–101 523523

United States Department of Agriculture
Forest Service
Southern Research Station
e-General Technical Report SRS-101
Proceedings
15th Central Hardwood Forest Conference
Knoxville, TN February 27-March 1, 2006
This document is being published in electronic format only (Web and CD). Any corrections or additions will be posted to the Web site (www.srs.fs.usda.gov/oubs).
Cover photo by: David J. Moorhead, University of Georgia, www.forestryimages.org.
The use of trade, firm, or corporation names in this publication is for the information and convenience of the reader. Such use does not constitute an official endorsement or approval by the U.S. Department of Agriculture Forest Service or the University of Tennessee of any product or service to the exclusion of others that may be suitable. Statements by contributors from outside the U.S. Department of Agriculture Forest Service or the University of Tennessee may not necessarily reflect the policy of the Department or the University.
All articles were received in digital format and were edited for uniform type and style; each author is responsible for the accuracy and content of his or her own paper. Statements of contributors from outside the U.S. Department of Agriculture may not necessarily reflect the policy of the Department.
Remarks about pesticides appear in some technical papers contained in these proceedings. Publication of these statements does not constitute endorsement or recommendation of them by the conference sponsors, nor does it imply that uses discussed have been registered. Use of most pesticides is regulated by
State and Federal law. Applicable regulations must be obtained from the appropriate regulatory agencies.
CAUTION: Pesticides can be injurious to humans, domestic animals, desirable plants, and fish and other wildlife-if they are not handled and applied properly. Use all pesticides selectively and carefUlly. Follow recommended practices given on the label for use and disposal of pesticides and pesticide containers.
April 2007
Southern Research Station 200 w.T. Weaver Blvd. Asheville, NC 28804

Proceedings 15th Central Hardwood
Forest Conference
Proceedings of a Conference held at the University of Tennessee, Knoxville, TN
February 27 March 1, 2006
Edited David S. Buckley
Wayne K. Clatterbuck
Sponsored by: University ofTennessee, Department of Forestry,
Wildlife and Fisheries, Knoxville, TN, and U.S. Department ofAgriculture Forest Service,
Southern Research Station, Asheville, NC
Program Committee: David S. Buckley
Stacy L. Clark Wayne K. Clatterbuck Callie J. Schweitzer
Published by: U.S. Depamnent ofAgriculture Forest Service
Southern Research Station Asheville, NC