acoem g uidance statement · acoem g uidance statement spirometry in the occupational health...
TRANSCRIPT

ACOEM GUIDANCE STATEMENT
Spirometry in the Occupational Health Setting—2011 Update
Mary C. Townsend, DrPH, and the Occupational and Environmental Lung Disorders Committee
S pirometry, the most frequently per-formed pulmonary function test (PFT),
is the cornerstone of occupational respira-tory evaluation programs. In the occupa-tional health setting, spirometry plays a crit-ical role in the primary, secondary, and ter-tiary prevention of workplace-related lungdisease.1 Used for both screening and clin-ical evaluations, spirometry tests are per-formed in a variety of venues ranging fromsmall clinical practices to large testing fa-cilities and multiple plant medical depart-ments within an industry. Physicians andother health care professionals may con-duct spirometry tests themselves or super-vise others conducting the tests, or theymay be involved only in interpreting testresults. Whatever their level of involvementin the actual testing, spirometry users needto be aware that spirometry differs frommany other medical measurements, since itdepends on multiple factors for its resultsto be valid. If any of these factors mal-functions, for example, if subject effort isflawed, equipment is not accurate, or tech-nicians fail to elicit maximal cooperationand effort, results can be falsely elevated orreduced. These problems may profoundlyimpact conclusions that are drawn about aworker’s pulmonary function, and will likelyrender the interpretations incorrect.
Recognizing the central role ofspirometry in workplace respiratory pro-grams, the American College of Oc-cupational and Environmental Medicine(ACOEM) developed two spirometry po-sition statements in the past decade whichsummarize advances of particular relevanceto occupational health practice.1,2 However,since these statements were published, sev-eral important changes have occurred inthe field of pulmonary function testing thatsignificantly affect occupational spirome-try testing. First, the American ThoracicSociety (ATS) and the European Respira-tory Society (ERS) issued a series of joint
This article was prepared by the American Collegeof Occupational and Environmental Medicine’sOccupational and Environmental Lung Disor-ders Committee that comprised lead authorMary Townsend, DrPH; William Eschenbacher,MD, Committee Chair; William Beckett, MD;Bruce Bohnker, MD; Carl Brodkin, MD; Clay-ton Cowl, MD; Tee Guidotti, MD; Athena Jolly,MD; Francesca Litow, MD; James Lockey, MD;Edward Petsonk, MD; Larry Raymond, MD;Paul Scanlon, MD; Thomas Truncale, MD; andStephen Wintermeyer, MD.
Copyright C© 2011 by American College of Occupa-tional and Environmental Medicine
DOI: 10.1097/JOM.0b013e31821aa964
official statements on standardization oflung function testing.3–5 Second, the Inter-national Organization for Standardization(ISO) issued a standard, ISO 26782, cov-ering essential technical operating charac-teristics of spirometers.6 Third, the impactof real-world spirometry errors caused byimproper use of some flow-type spirome-ters was documented and published.7 Andfourth, attention has been increasingly paidto the interpretation of change in lung func-tion over time.8–11 To incorporate these im-portant pulmonary function-testing changesinto its recommendations, ACOEM has de-veloped this 2011 update. The goal of thisstatement is to provide useful current infor-mation for all users of spirometry test re-sults, from those who perform or supervisetesting to those who only interpret or reviewresults. The document is presented in a man-ner that allows those with specific intereststo review those sections that are relevant tothem. Four major topics are covered in thisstatement: (1) equipment performance, (2)conducting tests, (3) comparing results withreference values, and (4) evaluating resultsover time. To meet the varying needs of allspirometry users, Table 1 outlines the state-ment so that readers can turn immediatelyto sections that are most applicable to theirinterests. To assist readers in understandingthe material, particularly in Sections 1 and2, Fig. 1 presents spirograms from a validtest to compare with the flawed test resultsshown in Fig. 2 to 12 as discussed later.
EQUIPMENT PERFORMANCESince spirometers are not certified by
the Occupational Safety and Health Ad-ministration (OSHA) or the National In-stitute for Occupational Safety and Health(NIOSH), health care professionals need tobe aware of the four elements that contributeto accurate spirometer performance: (1)ATS/ERS and ISO recommend minimumperformance-based standards for spirome-ters of all types; (2) prototype spirome-ters and their software undergo validationtesting, preferably by an independent test-ing laboratory, to demonstrate that theymeet these specifications; (3) spirometerusers perform daily accuracy checks ofthe spirometer calibration so that defectivespirometers can be removed from serviceuntil they are repaired; and (4) if sensor er-rors develop during subject testing, usersneed to recognize the errors and delete theresulting invalid tests even if not labeled aserrors by the spirometer’s software.
The American College of Occupa-tional and Environmental Medicine recom-mends that facilities performing occupa-tional spirometry tests maintain a proceduremanual documenting the details of equip-ment type, spirometer configuration, manu-facturer’s guidelines, calibration log, serviceand repair records, personnel training, andstandard operating procedures. Such a man-ual will permit troubleshooting if problemswith anomalous test results arise.
Spirometer SpecificationsIn 2009, ISO issued specifications
for technical aspects of spirometer perfor-mance, and many ISO requirements areidentical to the 2005 ATS/ERS specifica-tions. However, while the ISO standardfocuses exclusively on spirometer perfor-mance, ATS/ERS provides additional im-portant recommendations on the need forreal-time displays to permit effective tech-nician coaching and on user protocols forperforming daily checks of spirometer ac-curacy. When ATS/ERS makes recommen-dations on spirometer design or calibrationcheck protocols that are not addressed in theISO standard, occupational spirometry usersare advised to follow ATS/ERS guidelines.This particularly applies to the need for real-time graphical displays in the occupationalhealth setting.
In 2005, the ATS/ERS restated, butdid not change, its minimal performance-based recommendations for spirometer op-erating characteristics, including accuracy,precision, resistance and back pressure, andhard-copy graph size.4 However, for thefirst time, ATS/ERS also explicitly recom-mended that both flow-volume and volume-time curves of sufficient size be made avail-able as tests are performed to enable effec-tive coaching during the maneuver. In addi-tion to a minimum instrument display size,ATS/ERS also recommended a standardspirometer electronic output, so that com-plete test results are saved and tracings canlater be reconstructed electronically. TheAmerican Thoracic Society/European Res-piratory Society minimum recommendeddisplay and hard copy graph sizes, whichalso comply with the ISO recommendedgraph aspect ratios, are shown in theAppendix.
The American College of Occupa-tional and Environmental Medicine stronglyrecommends that spirometers used for oc-cupational spirometry tests provide: (1) areal-time display of both flow-volume and
Copyright © 2011 Lippincott Williams & Wilkins. Unauthorized reproduction of this article is prohibited.
JOEM � Volume 53, Number 5, May 2011 569

Spirometry in Occupational Health JOEM � Volume 53, Number 5, May 2011
TABLE 1. Spirometry in theOccupational Setting—2011 UpdateTopics
Equipment Performance
Spirometer specifications
Validation testing of spirometers
Spirometer accuracy checks
Avoiding sensor errors during subject tests
Conducting Tests
Technician training
Conducting the test
Testing goal for a valid test
Reporting results
Quality assurance reviews
Comparing Results With Reference Values
Reference values
Race adjustment of predicted values and
LLNs
Interpretation algorithm
Evaluating Results Over Time
Longitudinal interpretation
Pre- to post-bronchodilator changes in
pulmonary function
LLN, lower limits of normal
volume-time curves which meets or exceedsATS/ERS minimum size and ISO minimumaspect ratio standards; (2) graphs in hard-copy printouts that meet or exceed ATS/ERSminimum size standards; and (3) standardelectronic spirometer output of results andcurves.
Beyond meeting these ATS/ERSminimum recommendations and ISO min-imum requirements, ACOEM also recom-mends that spirometers used for occupa-tional spirometry tests (1) save all infor-mation from up to eight maneuvers in asubject test session; (2) permit later editingand deletion of earlier flawed test results;(3) provide a complete spirometry test re-port for review of technical quality, whichincludes all flow-volume and volume-time
FIGURE 1. Valid test. Flow-volume curve (left) emphasizes start of test, rising im-mediately to a sharp peak and smoothly descending to zero flow. Volume-timecurve (right) emphasizes end of test, initially rising rapidly, and then gradually flat-tening out and reaching 1 second of no visible volume change, at the FVC plateau.To permit effective subject coaching, the American Thoracic Society/European Res-piratory Society recommends using spirometers that show both graphical displaysas the test is performed and in sufficient size to clearly reveal technical errors.
curves, and test results from at least the3 best maneuvers, and preferably from allsaved efforts; (4) optionally provide a sep-arate final spirometry summary report forinterpretation of the best test results; (5)provide computer-derived technical qualityindicators; (6) provide a dedicated routinefor verifying spirometer calibration; and(7) save indefinitely a comprehensive elec-tronic record of all calibration and calibra-tion verification results. These ACOEM andATS/ERS recommendations and ISO re-quirements apply to both volume- and flow-type spirometers.
Validation Testing ofSpirometers
The ATS/ERS 2005 statement andthe 2009 ISO 26782 Standard6 includewaveforms for validation testing of spirom-eters. Manufacturers submit a prototypespirometer and software for validation test-ing, which is preferably administered byan independent testing laboratory, or some-times by the manufacturer. A letter or cer-tificate is generated if the spirometer passesthe testing. In addition to passing validationtesting of a spirometer’s operating character-istics, users in the occupational setting alsoneed to determine whether the spirometermeets ATS/ERS specifications of adequatereal-time displays and hard-copy graphs,and standard spirometer electronic output4
(see the Appendix).If spirometers are purchased for use
in the occupational health setting, ACOEMstrongly recommends that (1) the manufac-turer needs to provide written verificationthat the spirometer successfully passed itsvalidation testing, preferably conducted byan independent testing laboratory, and thatthe tested spirometer and software versioncorrespond with the model and software ver-sion being purchased; and (2) the spirometerneeds to meet the ATS/ERS recommendedminimum real-time display and hard-copygraph sizes for flow-volume and volume-
time curves and ISO minimum aspect ratiosfor these displays, as well as providing astandard spirometer electronic output (seethe Appendix).
Spirometer Accuracy ChecksThe 2005 ATS/ERS Spirometry
Statement recommends that the accuracy ofboth volume- and flow-type spirometers ischecked at least daily when a spirometer is inuse. The acceptable spirometer response toa standard 3-L calibration syringe injectionhas been expanded to ±3.5% of the injectedvolume, or 2.90 to 3.10 L.4
Flow-type spirometer calibration ischecked by injecting the 3-L calibrationsyringe at three different speeds to verifyspirometer accuracy as varying flow ratesenter the spirometer.4 The AmericanThoracic Society/European RespiratorySociety-recommended injection speeds areapproximately 6 L/s, 1 L/s, and 0.5 L/s,produced by injecting 3 L over approxi-mately 0.5, 3, and 6 or more seconds. Anacceptable spirometer response to eachinjection is a value between 2.90 and3.10 L. If disposable sensors are used,it is recommended that a new sensor bedrawn from the patient supply each timethe calibration is checked. This frequentsampling and evaluation of sensors used forsubject testing will help prevent erroneoussubject test results caused by deterioratingaccuracy of the sensor supplies over time.
Volume spirometers are checked forleaks daily and each time a breathing hoseis changed (leaks are acceptable if they aresmaller than 30 mL/min), as well as for theresponse to a single injection of a 3-L cali-bration syringe. Quarterly checks of volumespirometer linearity are also recommendedby ATS/ERS.
Calibration syringes are checked forleakage on a monthly basis.4 Syringes are re-calibrated periodically by the manufacturerusing a method traceable to the National In-stitute of Standards and Technology. Recali-bration is also needed whenever the syringestops are reset or become loose. Syringesare stored near the spirometer so that bothare stored and used under the same environ-mental conditions.
Before performing accuracy checks,spirometer users need to determine whethera 3-L syringe injection simply verifiesthe spirometer’s accuracy or whether, infact, it resets the spirometer’s calibra-tion. Many currently available spirome-ters permit users only to check the cali-bration; that is, the calibration itself can-not be altered. However, some spirome-ters’ settings are changed when a calibra-tion syringe is injected, and other spirom-eters’ settings are automatically changedif the spirometer fails to pass its accu-racy check. When altering the calibration,
Copyright © 2011 Lippincott Williams & Wilkins. Unauthorized reproduction of this article is prohibited.
570 C© 2011 American College of Occupational and Environmental Medicine

JOEM � Volume 53, Number 5, May 2011 ACOEM Guidance Statement
FIGURE 2. Sensor contaminated or blocked (by condensation, mucus, or fingers).Test results will be falsely increased and invalid and may produce erroneously “nor-mal” automated interpretations. This problem often causes FVC and FEV1 repeata-bility to exceed 0.50 L, as values increase with each successive test, and the per-centage of predicted values may also be unrealistically elevated. The entire testmust be deleted and the sensor replaced if it becomes contaminated during a test.Reprinted with permission from Townsend et al.7
users need to carefully follow manufacturerinstructions and then check the spirometer’saccuracy using a different routine and fol-lowing the instructions outlined earlier.
The American College of Occupa-tional and Environmental Medicine stronglyendorses daily performance of accuracychecks when spirometers are in use, asrecommended by ATS/ERS. The AmericanCollege of Occupational and Environmen-tal Medicine recommends saving calibra-tion tracings and records indefinitely andkeeping a log of technical problems foundand solved, as well as all changes in pro-tocol, computer software, or equipment. Asnoted earlier, ACOEM also recommends thepurchase of spirometers with dedicated cal-ibration check routines for use in the occu-pational setting.
Avoid Sensor Errors DuringSubject Tests
Even though a spirometer passes itscheck of calibration accuracy, subject testresults can be invalidated by equipment er-rors occurring during subject tests in clinicalpractice.7 Two major types of errors are notinfrequent during subject testing: contami-nation or blockage of a flow-type spirome-ter’s sensor and flawed setting of the zero-flow reference point. First, if a subject’s fin-gers, secretions, or water vapor block or con-taminate a flow-type spirometer’s sensor, in-creasing its resistance, the test results will befalsely increased and become invalid. Theimpact of this problem is seen by comparinga valid test (Fig. 1) with a test having sensorcontamination (Fig. 2). Such contaminatedsensor problems are not identified as errorsby currently available spirometers, and usersneed to visually recognize and delete thesetests.
Second, most flow-type spirometersset a zero-flow reference point before eachmaneuver, or before each set of maneuvers.All flows during a subject’s subsequent ex-piration(s) are measured relative to this ref-erence point. If a low level of airflow passesthrough the sensor in either direction while“zeroing” is in progress, the “zero” flow ref-erence point will be incorrect. Such low-level airflow might be caused by slight sen-sor motion, or by background fans or forcedair ventilation. Unless a zero-flow error islarge, most spirometers do not alert the userto this problem.
If a low level of airflow movesthrough the sensor toward the subject duringzeroing, in the direction opposite to the sub-ject’s airflow during expiration, the spirom-eter will set a negative flow as “zero-flow.”This negative flow will not be reached dur-ing the subsequent expiration, and so theexpiratory volume-time curves climb at aconstant rate (never reaching “zero”) andthe expiratory flow-volume curve draws along limb to the right, showing increasing“volume” at a constant, very small flow rate.These patterns can be seen in both Fig. 3 and4. The important difference between thesetwo figures is that the zero-flow referencepoint is reset before each maneuver in Fig.3, causing the error in the zero-flow refer-ence points to vary among the curves. Incontrast, in Fig. 4, the zero-flow referencepoint is set only once before a set of maneu-vers, producing curves that are consistent,but erroneous, and making the error moredifficult to recognize. Occluding the sensorduring “zeroing” will prevent this problem.
In contrast, if a low level of airflowmoves through the sensor away from thesubject during zeroing, in the same directionas the subject’s air will move during expi-
ration, the spirometer will set a small posi-tive flow as “zero-flow.” This positive flowwill be reached during the subsequent expi-ration before the subject actually exhales tozero flow; the expiratory volume-time curvewill plateau early and begin to descend asthe subject’s slowing airflow becomes in-creasingly negative relative to the erroneous“zero-flow” point, drawing a pattern muchlike a leak in a volume spirometer as shownin Fig. 5. Occluding the sensor during “ze-roing” will prevent this problem.
Zero-flow errors can also be causedby motion of a gravity-sensitive pressure-transducer during the subject test, discon-nected or loose pressure tubing, a degrad-ing sensor, or unstable electronics. If thezero-flow reference point is not set accu-rately, subsequent test results will be falselyincreased or decreased and become invalidas shown in Figs. 3 to 5. It is important forthe user to understand that no error messagewas generated for the tests shown in Figs. 3to 5, and unless a zero-flow error is large,most spirometers do not identify this error.
Since these errors typically are notdetected by spirometer software, health careprofessionals need to recognize the effectsof contaminated sensors and zero-flow er-rors on test results and curve shapes. Bothtypes of errors may produce very incon-sistent results (failing to meet repeatabil-ity criteria, as discussed later), sometimesalong with very large percent of predictedvalues, exceeding 130% to 140%. Such er-roneous curves need to be deleted immedi-ately (not saved), so that their results are notreported as the largest results from the testsession. Figures 2 to 5 present examples ofspirograms affected by these problems, andthough not shown here, visual recognitionof zero-flow errors may be improved if in-spiratory as well as expiratory flow-volumecurves are recorded.
The American College of Occupa-tional and Environmental Medicine stronglyrecommends that users of flow-type spirom-eters become thoroughly familiar with theflawed patterns shown in Figures 2 to 5 andinstitute protocols of preventive actions aswell as corrective actions if those patternsare observed. Such protocols might includeoccluding sensors during pre-maneuver sen-sor “zeroing,” frequent checks for sensormoisture and mucus deposits, maintainingsensors in an upright position to minimizeaccumulation of condensation, and keepingsubjects’ fingers far from the sensor outlet.
CONDUCTING TESTSTechnician Training
In 1978, the OSHA Cotton Dust Stan-dard stated that the goal of spirometry train-ing courses is to provide technicians with thebasic knowledge required to produce
Copyright © 2011 Lippincott Williams & Wilkins. Unauthorized reproduction of this article is prohibited.
C© 2011 American College of Occupational and Environmental Medicine 571

Spirometry in Occupational Health JOEM � Volume 53, Number 5, May 2011
FIGURE 3. Zero-flow error No. 1—Flows are over-recorded and highly variable.This spirometer’s zero-flow reference point was reset to a different level beforeeach maneuver, causing the volume-time curves to be splayed apart. No errormessage was indicated by the spirometer. FVC is much more increased than FEV1,falsely reducing the FEV1/FVC. This problem usually produces erroneous “obstruc-tive impairment” patterns. Occlude sensor whenever the sensor is being zeroed toavoid this problem. See the text for further details. Reprinted with permission fromTownsend et al.7
meaningful test results. The OSHA notedthat technicians need to be both motivatedto do the very best test on every employeeand also capable of judging the subject’sdegree of effort and cooperation.12
The National Institute for Occupa-tional Safety and Health was designated asthe agency responsible for reviewing andapproving occupational spirometry train-ing courses, based on the content speci-fied by OSHA. In 2005, ATS/ERS endorsedNIOSH-approved courses as prototypes fortechnician training.3 Although most UScompanies are not involved in the cottonprocessing industry, successful completionof a NIOSH-approved spirometry coursehas been regarded as a benchmark and the
best practice in the occupational health set-ting for many years. The National Institutefor Occupational Safety and Health Webpage lists available courses in the UnitedStates.13 The National Institute for Occu-pational Safety and Health conducts on-site course audits and periodic reviews ofcourse approval status, thereby monitoringthe quality of its approved courses on anongoing basis.
In 2009, NIOSH took additional stepsto improve the technical quality of occupa-tional spirometry testing, announcing thatcertificates of spirometry course comple-tion now expire after 5 years, and initiatinga program to review and approve spirom-etry refresher courses. The National Insti-
tute for Occupational Safety and Health-approved spirometry refresher courses fo-cus on practical screening spirometry is-sues, and periodic refresher courses updateknowledge, review testing problems, andhelp maintain technician enthusiasm dur-ing occupational spirometry testing.1,14,15
Technicians who successfully completed aninitial NIOSH-approved spirometry coursein 2000 or later can extend their coursecompletion certificate by 5 additional yearswhen they complete a NIOSH-approvedspirometry refresher course, while thosecompleting their initial course prior to 2000are not eligible for this certificate exten-sion. Those individuals must repeat theinitial NIOSH-approved course. AvailableNIOSH-approved refreshers are also listedon the NIOSH Web page.13
The American College of Occupa-tional and Environmental Medicine contin-ues to strongly recommend that all techni-cians conducting occupational spirometrytests should successfully complete an ini-tial NIOSH-approved spirometry course aswell as a NIOSH-approved refresher courseevery 5 years.
Conducting the TestThe ATS/ERS continues to empha-
size that technicians explain, demonstrate,and coach subjects throughout their maneu-vers, even when workers have performed thetest previously. Technicians need to empha-size maximal inhalations, hard initial blasts,and complete exhalations.
Occupational spirometry tests tradi-tionally have been conducted with workersin the standing posture, permitting maximalinspirations and blasts on expiration, andyielding maximal forced expiratory volume
FIGURE 4. Zero-flow error No. 2—Flows are over-recorded but consistent. These tests were recorded byone subject: the valid test on the right has an accuratezero-flow reference point while the zero-error test onthe left has an inaccurate zero-flow reference point. Thisspirometer’s zero-flow reference is set only once, beforethe complete set of maneuvers, causing the curves onthe left to be consistent but erroneous. No error mes-sage was indicated by the spirometer. FVC is much moreincreased than FEV1, falsely reducing the FEV1/FVC. Thisusually produces erroneous “obstructive impairment”patterns. Occlude the sensor whenever it is zeroed toavoid this problem. See the text for further details.
Copyright © 2011 Lippincott Williams & Wilkins. Unauthorized reproduction of this article is prohibited.
572 C© 2011 American College of Occupational and Environmental Medicine

JOEM � Volume 53, Number 5, May 2011 ACOEM Guidance Statement
FIGURE 5. Zero-flow error No. 3—Flows are under-recorded. No error messagewas indicated by the spirometer. FVC is much more reduced than FEV1, falsely in-creasing the FEV1/FVC. This may produce erroneous “restrictive impairment” pat-terns and may mask true airways obstruction. Occlude sensor whenever the sensoris being zeroed to avoid this problem. See the text for further details.
in 1 second (FEV1) and forced vital ca-pacity (FVC).1 The ATS/ERS particularlynotes that subjects with “excessive weight atthe midsection” achieve larger inspirationswhen standing.3 A chair without wheels is tobe placed behind the subject, and the tech-nician needs to be ready to assist the subjectinto the chair if they begin to feel faint. Ifthere is a history of fainting or clinical ill-ness, the test should be conducted in thesitting position. In all cases, the test pos-ture needs to be documented and should bekept consistent over time whenever possible.Changes in test posture need to be taken intoaccount when interpreting results over time.
The subject’s head is to be slightlyelevated and he or she needs to sit or standupright. The tongue cannot block the mouth-piece, and lips are to be tightly sealed aroundit. The ATS/ERS recommends that noseclips be used for all spirometry tests, whichprevents extra breaths through the nose, atechnical error that invalidates results but isnot detected by most available spirometrysoftware (see Fig. 12).
The American College of Occupa-tional and Environmental Medicine contin-ues to recommend that technicians needto explain, demonstrate, and actively coachworkers to perform maximal inspirations,hard and fast expiratory blasts, and completeexpirations. Testing should be conductedstanding, unless workers have experiencedproblems with fainting in the past. Testingposture should be recorded on the spirome-try record and the same posture needs to beused for serial tests over time. Disposablenose clips are recommended.
Testing Goal for a Valid TestThe ATS/ERS 2005 continues to de-
fine a valid spirometry test as having two
components: (1) at least three curves thatare free of technical flaws (such curves arecalled “acceptable”) and (2) results for theFVC and FEV1 that are consistent amongthe curves (such results are called “repeat-able”), as defined later. Most healthy work-ers can achieve this testing goal, and up toeight maneuvers can be attempted.
Acceptable curvesThe components of “acceptable”
maneuvers—maximal inhalations, hard ini-tial blasts, and complete exhalations—havenot been changed. However, since some sub-jects experience difficulty in fully recordingtheir FVCs, ATS/ERS now recognizes thatcurves that do not completely record theexhalation may be usable for FEV1 mea-surement if they are free of hesitation andcough in the first second (shown in Figs. 6and 7). The goal for an acceptable end oftest is still to reach a 1-second FVC plateauand to try to exhale for 6 or more secondsof expiration.4 Figure. 10 shows the impactof early termination of the maneuver for aworker with airways obstruction. However,it is recommended that subjects stop ex-haling at any time if they cannot continue,and not perform multiple exhalations thatare more than 15-second long, since suchlengthy exhalations will not affect clinicaldecisions made about the subject.4 Spirom-etry users need to be aware that some work-ers, particularly young women and somemen with small lung volumes, may reachtheir plateaus in less than 6 seconds—thesetests are valid because they have reached theFVC plateau (Fig. 11), even if the spirometeris programmed to label all curves with exha-lations less than 6 seconds as unacceptable.Examples of unacceptable curves caused byflawed testing technique, and a valid test
with an exhalation of less than 6 seconds inlength are shown in Figs. 6 to 12.
Repeatable FVC and FEV1In 2005, ATS/ERS tightened the level
of consistency to be achieved among testresults: additional maneuvers should be at-tempted if the difference between the largestand second largest values of the FVC orFEV1 exceeds 0.15 L (150 mL) amongthe acceptable curves. This difference be-tween the largest and second largest val-ues is now called “repeatability,” it was for-merly termed “reproducibility,” and manyspirometers label it “variability.” It is rec-ommended that technicians strive to meetthis goal during testing, attempting up toeight efforts, unless the subject is unable tocontinue with the test. Failure to achieve re-peatability needs to be taken into accountduring the interpretation of results.
In the screening spirometry setting,lack of repeatability is often caused by afailure to inhale maximally to total lung ca-pacity before each maneuver (Fig. 9). How-ever, when FVC or FEV1 repeatability isvery poor, for example, more than 0.50 L(500 mL), sensor contamination or zero-flow errors are also likely (Figs. 2 and 3).In the absence of these technical problems,failure to achieve repeatability does not ruleout interpretation of results, since it mayalso be caused by hyperresponsive airwaysor other respiratory disorders. The lack ofrepeatability needs to be documented andtaken into account during the interpretationprocess.
The American College of Occupa-tional and Environmental Medicine recom-mends that occupational spirometry testsstrive to meet ATS/ERS criteria for a validtest, that is, recording three or more accept-able curves, with FVC and FEV1 repeata-bility of 0.15 L (150 mL) or less. Failure toachieve repeatability in screening spirome-try tests is often caused by inhalations thatare not maximal. However, when flow-typespirometers are in use, very poor repeata-bility may indicate sensor contamination orzero-flow errors.
Reporting ResultsThe largest FVC and largest FEV1
from all acceptable curves are reported asthe test results even if they are drawn fromdifferent curves.4 The FEV1/FVC is calcu-lated using these two values. To permit athorough review of a spirometry test, it isrecommended that complete results fromall acceptable curves also be shown onthe spirometry report. As discussed later,ATS/ERS continues to strongly discourageevaluating the forced expiratory flow (FEF)rates, but if reported, all FEF, except forthe peak expiratory flow, are to be drawnfrom one acceptable curve with the highest
Copyright © 2011 Lippincott Williams & Wilkins. Unauthorized reproduction of this article is prohibited.
C© 2011 American College of Occupational and Environmental Medicine 573

Spirometry in Occupational Health JOEM � Volume 53, Number 5, May 2011
FIGURE 6. Excessive hesitation— invalid test,which must be deleted. Excessive hesitationmoves the flow-volume peak to the right anddraws a gradually climbing tail at the startof the volume-time curve. Large hesitationsoften increase the FEV1 since the 1-secondmeasurement point moves far to the right.Coach “blast out right away, as soon as youare ready” to solve this problem.
sum of (FEV1 + FVC). The highest peakexpiratory flow recorded from among all ac-ceptable curves is to be reported.
The American College of Occupa-tional and Environmental Medicine recom-mends that occupational spirometry test re-ports include values and curves from all ac-ceptable curves and that the largest FVCand largest FEV1 be interpreted, even if theycome from different curves. Default spirom-eter configurations need to be examined and,if possible, adjusted to meet these recom-mendations.
Quality Assurance ReviewsIn addition to emphasizing technician
training, recent ATS/ERS and ATS spirome-
FIGURE 7. Cough in first second—Invalid test, which must be deleted. Cough inthe first second produces steep interruptions in the flow-volume curve and subtlesteps in the first second of the volume-time curve. Coughs often reduce the FEV1.Try offering a drink of water to solve this problem.
try standardization statements strongly rec-ommend that spirograms be reviewed pe-riodically to provide regular feedback onthe quality of each technician’s testing.3,14
Quality assurance reviews can be performedon electronically saved tracings or on copiesof spirograms. It is recommended that sam-ples of randomly selected tests, all invalidtests, and tests with abnormally low or im-probably high results (FEV1 or FVC >130% of predicted) be reviewed. Becauseof their profound impact on test results, fig-ures illustrating some of the technical er-rors that can affect spirometry test resultsare presented in the 1994 ATS spirometryupdate16 and included in Figs. 2 to 12 in thisstatement.
The American College of Occupa-tional and Environmental Medicine highlyrecommends that facilities performing oc-cupational spirometry tests establish on-going programs that provide quality assur-ance review of spirograms on a regular ba-sis. The frequency of such reviews needs tobe at least quarterly, and more often if tech-nicians are inexperienced or if poor techni-cal quality is observed. As recommended bythe California Department of Public Health,the goal of such reviews is to maintain thetechnical quality of spirometry tests at ahigh level, assuring that 80% or more ofan occupational health program’s spirom-etry tests are technically acceptable. It isrecommended that reviews be conducted bythose experienced in recognizing and cor-recting flawed spirometry tests results.11
COMPARING RESULTS WITHREFERENCE VALUES
After establishing the technical valid-ity of a test, spirometry results are usuallyevaluated at each measurement date as wellas longitudinally, comparing a worker’s cur-rent results with previous test results. Mostavailable spirometer software performs atraditional (“cross-sectional”) evaluation atthe time of the test, comparing the worker’sresults with the reference range expectedfor his/her current demographic characteris-tics. Recommendations for this approach aresummarized in this section. Fewer spirome-ters evaluate change over time or “trending,”and criteria for longitudinal abnormality areless well established. Recommendations forlongitudinal interpretation are summarizedin the following section.
Three critical aspects of tradi-tional pulmonary function evaluation in-fluence the interpretation: (1) the sourceof the reference values used; (2) how the
Copyright © 2011 Lippincott Williams & Wilkins. Unauthorized reproduction of this article is prohibited.
574 C© 2011 American College of Occupational and Environmental Medicine

JOEM � Volume 53, Number 5, May 2011 ACOEM Guidance Statement
FIGURE 8. No blast—reduced FEV1. No blast pro-duces a flow-volume curve with no sharp peak—the weaker the push, the less peaked the flow-volume curve. A weak push (or no blast at all, asshown here) reduces the FEV1 significantly andmay be caused by a subject trying to “save” theirair so that they can exhale for many seconds. Thiserror will cause erroneous “obstructive impair-ment” patterns. Coach “blast out hard and fast,and keep that initial push going” to solve thisproblem.
FIGURE 9. Submaximal inspiration—reducedFEV1 and FVC. Failure to maximally inhale to totallung capacity may be the most common screen-ing spirometry error. It often occurs when tech-nicians feel the need to rush the inhalation sothat the spirometer will record the subject’s ex-piration before “timing out.” Since it is difficultfor untrained subjects to achieve repeatabilitywhen inspirations are not maximal, the test maybe flagged as invalid due to lack of repeatability.This error may cause erroneous “restrictive im-pairment” patterns. Coach “fill your lungs” tosolve this problem.
FIGURE 10. Early termination at 5 seconds (solidlines)—reduced FVC and increased FEV1/FVC.The dashed line shows how much the “FVC”would have increased with only 5 more secondsof expiration. This error may cause true airwaysobstruction to go undetected. Coach the patientto “Keep exhaling until I tell you to stop” to solvethis problem.
Copyright © 2011 Lippincott Williams & Wilkins. Unauthorized reproduction of this article is prohibited.
C© 2011 American College of Occupational and Environmental Medicine 575

Spirometry in Occupational Health JOEM � Volume 53, Number 5, May 2011
FIGURE 11. Valid test—FVC plateauachieved in less than 6 seconds. Subject hasrecorded a 1 second FVC plateau, so thetest is valid, though most spirometers willdisplay an error message because the exha-lation is less than 6 seconds. Ignore the er-ror message in this case, since reaching theFVC plateau is the first criterion for a validend-of-test.
FIGURE 12. Extra breaths through thenose—invalid test. The flow-volumecurve shows multiple maneuvers and thevolume-time curve shows increasing stepsat the end of the test. Delete the test sincethe FVC is erroneously elevated and will bereported as the highest value for the FVC.The resulting falsely reduced FEV1/FVC willproduce an erroneous “obstructive impair-ment” pattern. This error is not identifiedby most spirometers, so health care pro-fessionals need to visually recognize anddelete it. The best solution is to have thesubject wear nose clips.
reference values are adjusted when aworker’s race/ethnicity differs from the ref-erence study subjects’; and (3) selection ofthe interpretation algorithm used to catego-rize pulmonary function as normal or ab-normal, that is, the choice of lung functionparameters to be evaluated and the sequencein which they are examined.
The American College of Occupa-tional and Environmental Medicine’s 2000spirometry statement identified normal, ob-structive, and restrictive impairment pat-terns, as well as grading the severity ofthose impairments. However, since 2005,several conflicting schemes are now rec-ommended for grading severity.5,17,18 Sincethe most critical concern of occupationalscreening spirometry is to separate abnor-mal from normal, this ACOEM statementfocuses only on that task, for which thereis strong consensus. Choice of a severity-grading scheme will be left to the practi-tioner’s discretion, depending upon the cir-
cumstances in which they are conductingspirometry tests.
Reference ValuesReference values define the expected
average and lower boundary of the refer-ence range for individuals with the samedemographic characteristics as the workerbeing tested. Reference values are gen-erated from research studies of asymp-tomatic never smokers of varying ages andheights, both genders, and sometimes vary-ing ethnic/racial backgrounds. Subject eth-nic/racial group is based on self-report, andheight in stocking feet needs to be mea-sured periodically. The relationships of pul-monary function parameters with these fourdemographic variables are summarized inregression equations, which produce aver-age “predicted” values and fifth percentilelower limits of normal (LLN). Since pre-dicted values and LLNs describe the aver-age and the bottom of the reference range
based on a single research study, both in-dices need to be drawn from a single sourceof reference values.5,19
Many reference value studies havebeen conducted in a single geographicallocation,20,21 but ATS/ERS,5 ACOEM,1 andthe sixth edition of the American MedicalAssociation (AMA) Guides to the Evalu-ation of Permanent Impairment18 recom-mend using reference values generated fromthe 3rd National Health and Nutrition Ex-amination Survey (NHANES III).22 The 3rdNational Health and Nutrition ExaminationSurvey studied a random sample of neversmokers from across the United States, us-ing spirometry testing of high technicalquality, and including three ethnic/racialgroups. Therefore, race-specific NHANESIII reference equations are available forwhites, African Americans, and Mexican-Americans. If the NHANES III referencevalues are not available on older spirome-ters, the Crapo reference values20 are closer
Copyright © 2011 Lippincott Williams & Wilkins. Unauthorized reproduction of this article is prohibited.
576 C© 2011 American College of Occupational and Environmental Medicine
JOEM � Volume 53, Number 5, May 2011 ACOEM Guidance Statement
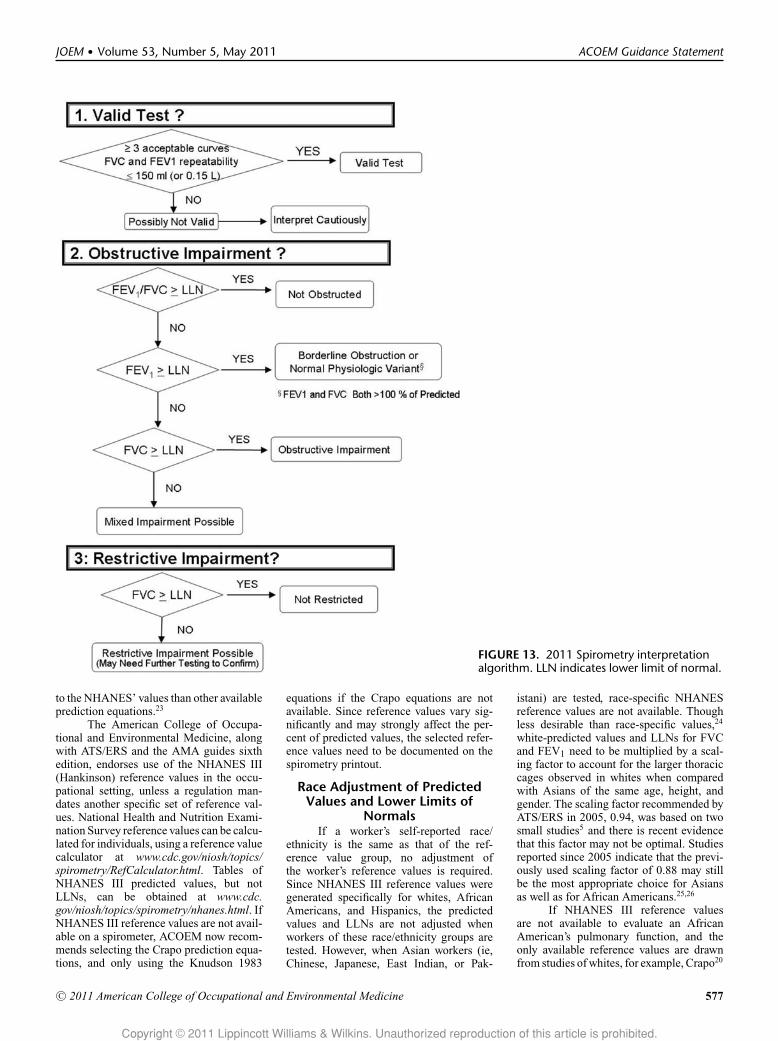
FIGURE 13. 2011 Spirometry interpretationalgorithm. LLN indicates lower limit of normal.
to the NHANES’ values than other availableprediction equations.23
The American College of Occupa-tional and Environmental Medicine, alongwith ATS/ERS and the AMA guides sixthedition, endorses use of the NHANES III(Hankinson) reference values in the occu-pational setting, unless a regulation man-dates another specific set of reference val-ues. National Health and Nutrition Exami-nation Survey reference values can be calcu-lated for individuals, using a reference valuecalculator at www.cdc.gov/niosh/topics/spirometry/RefCalculator.html. Tables ofNHANES III predicted values, but notLLNs, can be obtained at www.cdc.gov/niosh/topics/spirometry/nhanes.html. IfNHANES III reference values are not avail-able on a spirometer, ACOEM now recom-mends selecting the Crapo prediction equa-tions, and only using the Knudson 1983
equations if the Crapo equations are notavailable. Since reference values vary sig-nificantly and may strongly affect the per-cent of predicted values, the selected refer-ence values need to be documented on thespirometry printout.
Race Adjustment of PredictedValues and Lower Limits of
NormalsIf a worker’s self-reported race/
ethnicity is the same as that of the ref-erence value group, no adjustment ofthe worker’s reference values is required.Since NHANES III reference values weregenerated specifically for whites, AfricanAmericans, and Hispanics, the predictedvalues and LLNs are not adjusted whenworkers of these race/ethnicity groups aretested. However, when Asian workers (ie,Chinese, Japanese, East Indian, or Pak-
istani) are tested, race-specific NHANESreference values are not available. Thoughless desirable than race-specific values,24
white-predicted values and LLNs for FVCand FEV1 need to be multiplied by a scal-ing factor to account for the larger thoraciccages observed in whites when comparedwith Asians of the same age, height, andgender. The scaling factor recommended byATS/ERS in 2005, 0.94, was based on twosmall studies5 and there is recent evidencethat this factor may not be optimal. Studiesreported since 2005 indicate that the previ-ously used scaling factor of 0.88 may stillbe the most appropriate choice for Asiansas well as for African Americans.25,26
If NHANES III reference valuesare not available to evaluate an AfricanAmerican’s pulmonary function, and theonly available reference values are drawnfrom studies of whites, for example, Crapo20
Copyright © 2011 Lippincott Williams & Wilkins. Unauthorized reproduction of this article is prohibited.
C© 2011 American College of Occupational and Environmental Medicine 577

Spirometry in Occupational Health JOEM � Volume 53, Number 5, May 2011
or Knudson21 predicted values, the whitepredicted values and LLNs for FVC andFEV1 need to be multiplied by 0.88 to ob-tain appropriate predicted values and LLNsfor the African American employee.1,5 Thesingle exception to this recommendation isfor cotton-exposed workers for whom theKnudson 197627 prediction equations anda scaling factor of 0.85 must be used forAfrican American workers, as mandated byOSHA.12
The American College of Occupa-tional and Environmental Medicine andATS/ERS recommend that race-specificNHANES III reference values be usedwhenever possible, basing the worker’srace/ethnicity on self-report. To evaluateAsian workers, ACOEM continues to rec-ommend that white predicted values andLLNs for FVC and FEV1 be multiplied by ascaling factor of 0.88 to obtain appropriateAsian reference values. If NHANES III ref-erence values are not available when AfricanAmerican workers are tested, and white-predicted values need to be used, ACOEMrecommends applying a scaling factor of0.88 to the white-predicted values and LLNsfor FVC and FEV1, unless other practicesare mandated by an applicable regulation.Note that FEV1/FVC predicted values andLLNs are not race-adjusted.
Interpretation AlgorithmFor two decades, ATS has consis-
tently recommended applying a stepwisealgorithm to three pulmonary function pa-rameters to interpret spirometry results.5,19
The American College of Occupational andEnvironmental Medicine endorsed this ap-proach in its 2000 statement.1 Since con-sensus exists on how to distinguish nor-mal from abnormal results, and which mea-surements identify obstructive or restrictiveimpairment, these determinations are pre-sented in Fig. 13.
In contrast to the determinationof normal/abnormal, recommendations forgrading severity of impairment are nowquite disparate,5,17,18 and so this statement’sinterpretation algorithm shown in Fig. 13does not grade severity of impairment. Asnoted later, practitioners need to choose animpairment-grading scheme that is most ap-propriate for their specific needs.
Lower Limit of Normal DefinesAbnormality
Since 1991, the ATS has officially en-dorsed using the fifth percentile, the pointbelow which 5% of nonexposed asymp-tomatic subjects are expected to fall, as thelower limit of the reference range (LLN).19
Though two older cutoff points for abnor-mality have re-emerged in some chronic ob-structive pulmonary disease screening rec-ommendations, that is, 80% of the pre-
dicted value, and an observed FEV1/FVCratio less than 0.70,28 the ATS/ERS offi-cial recommendations continue to explic-itly discourage use of these definitions.5,19
As pulmonary function declines with age,the fifth percentile LLN also declines, label-ing only 5% of normal individuals in eachage group as “abnormal.” In contrast, as ageincreases, increasing proportions of nonex-posed healthy individuals fall below 80%of predicted or a measured FEV1/FVC ra-tio of 0.70, creating an increasing pool offalse positives in an aging workforce.19,29,30
These fixed definitions of abnormality alsoyield some false negatives in young workers.As recommended by the ATS since 1991,5,19
using the fifth percentile LLN to define ab-normality for the major spirometry mea-surements avoids these problems. As de-scribed later, the LLN is used to identifyboth obstructive and restrictive impairmentpatterns.
Obstructive ImpairmentAs shown in Fig. 13, the first step
in interpreting spirometry test results is todetermine whether a valid test has beenperformed or if more maneuvers may beneeded. Once test validity has been estab-lished, Step 2 shows that the FEV1/FVCis the first measurement to be evaluated, to“distinguish obstructive from nonobstruc-tive patterns.”19 When the FEV1/FVC andFEV1 are both less than their LLNs, air-ways obstruction is present. However, whenFEV1/FVC is less than LLN, but FEV1 ismore than its LLN, borderline obstruction ora normal physiologic variant may exist. TheATS/ERS cautions that an FEV1/FVC be-low the LLN combined with FVC and FEV1more than 100% of predicted is “sometimesseen in healthy subjects, including athletes”and may be due to dysanaptic growth of thealveoli. This pattern is labeled as a possible“normal physiologic variant,”5,19 and is notunusual among physically fit nonsmokingemergency responders, firefighters, and po-lice. However, if these healthy workers areexposed to known hazardous substances, thepossibility of obstructive impairment needsto be considered when a reduced FEV1/FVCis observed.
Though not included in Fig. 13, allgrading schemes for severity of airways ob-struction rely on the FEV1 percent of pre-dicted, applying one of several definitions,whose “number of categories and exact cut-off points are arbitrary.”5,17,18 Widely usedschemes are based on the 1986 ATS res-piratory impairment categories, which de-fine an FEV1 down to 60% of predictedas mild obstruction, an FEV1 between 41%and 59% of predicted as moderate obstruc-tion, and an FEV1 of 40% or less of pre-dicted as severe obstruction, as was donein the 2000 ACOEM statement.1,17 These
cut points from the 1986 ATS statement areconsistent with those used in OSHA’s cot-ton dust standard12 and they largely overlapthose employed in the sixth edition of theAMA guides.18 However, these cut pointsare lower than the sample method presentedby the ATS/ERS in 2005.5
Restrictive ImpairmentIn the absence of airways obstruc-
tion (FEV1/FVC ≥ LLN), Step 3 of Fig. 13evaluates the FVC, to determine whetherrestrictive impairment may exist. If FVC isless than LLN, restrictive impairment is pos-sible, and it may need to be confirmed usingadditional tests of pulmonary function, suchas lung volume measurements. In the pres-ence of airways obstruction (FEV1/FVC <LLN), FVC less than LLN indicates a pos-sible mixed impairment pattern, and its re-strictive component may also need to beconfirmed by additional PFTs.
In 2005, ATS/ERS recommendedgrading restrictive impairment, as well asairways obstruction, using the FEV1% ofpredicted.5 From a practical standpoint, thismay be reasonable since both the FVC andFEV1 are reduced as restrictive impairmentprogresses, and the common technical prob-lems of early termination of maneuvers andzero-flow errors are less likely to impair theaccuracy of the FEV1 than the FVC. How-ever, for workers with mixed impairmentpatterns, grading the restrictive impairmentusing FEV1% of predicted might slightlyoverstate the severity of restriction due tothe coexisting obstructive reduction of theFEV1.
By relying on the FEV1% of pre-dicted, the ATS/ERS 2005 definitions of re-strictive impairment severity now differ sig-nificantly from those presented in the AMAguides sixth edition.18 The AMA guides re-mains closer to the ATS 1986 respiratoryimpairment definitions, labeling mild re-striction as FVC between 60% and 69% ofpredicted, moderate restriction as FVC be-tween 51% and 59% of predicted, and severerestriction as an FVC between 45% and 50%of predicted.
Forced Expiratory Flow RatesBecause of the wide variability of
the FEF25%–75% and the instantaneous flowrates, both within and between healthy sub-jects, ATS/ERS continues to strongly dis-courage their use for diagnosing small air-way disease in individual patients5,19 or forassessing respiratory impairment. Interpre-tation of FEF25%–75% and other flow ratesis not recommended if the FEV1 and theFEV1/FVC are within the reference range,although the flow rates may be used to con-firm the presence of airways obstruction inthe presence of a borderline FEV1/FVC.5,19
Copyright © 2011 Lippincott Williams & Wilkins. Unauthorized reproduction of this article is prohibited.
578 C© 2011 American College of Occupational and Environmental Medicine

JOEM � Volume 53, Number 5, May 2011 ACOEM Guidance Statement
The American College of Occupa-tional and Environmental Medicine con-tinues to strongly recommend that occu-pational medicine practitioners follow theATS/ERS algorithm for separating nor-mal from abnormal test results. Presenceof airways obstruction is indicated by anFEV1/FVC below the worker’s LLN, andpresence of possible restrictive impairmentis indicated by an FVC less than LLN.Practitioners need to remember that anFEV1/FVC that is barely abnormal, in thepresence of both FEV1 and FVC more than100% of predicted, may indicate a normalphysiologic variant pattern in healthy non-smoking populations, such as emergency re-sponders. However, if such healthy workersare exposed to known respiratory hazards, itis recommended that the possibility of air-ways obstruction be also considered whenan abnormal FEV1/FVC is observed.
LONGITUDINALINTERPRETATION
The goal of evaluating change overtime in medical surveillance programs is toidentify pulmonary function that may be de-clining faster than expected over time. Con-firmation of an excessive decline then needsto trigger referral for further medical eval-uation to determine whether possible injuryor harm has been caused by workplace orother exposures. Finding excessive declinesalso needs to prompt interventions such asremoval from hazardous exposures, smok-ing cessation, initiation of appropriate res-piratory protection, or identification of newhazardous exposures. Large short-term de-clines have served as important early indi-cators of respiratory disease in some foodflavorings manufacturing workers.31–36 Incontrast, small short-term lung function de-clines are variable,37–40 though long-termexcessive loss of pulmonary function maypredict increased respiratory disease andmortality.41,42
Longitudinal evaluation is particu-larly important for many healthy work-ers whose baseline pulmonary function isabove average (>100% predicted). Sincesuch workers start off so far above aver-age, they can experience significant lungfunction decline without falling below thecross-sectional LLN and being labeled “ab-normal” on any single PFT. If high-qualityserial spirometry tests are recorded overan adequate length of time, longitudinalevaluation may reveal deterioration ear-lier than repeated traditional cross-sectionalevaluations.2,9,43 Factors other than work-place exposures that influence lung func-tion change over time include technical as-pects of test performance, weight gain,44–46
other lung conditions (eg, asthma), and per-sonal habits (eg, smoking). The AmericanCollege of Occupational and Environmen-
tal Medicine has discussed some of theseissues in detail.2
The importance of conducting validtests, maintaining high technical quality,and using spirometers that exceed minimumstandards for accuracy and precision cannotbe overstated when evaluating change overtime.2,11 As discussed earlier, both over- andunder-recording of results can be caused byerrors in technique, flawed spirometer cali-bration, or sensor problems that occur dur-ing the subject test. Such problems can biasthe estimates of change, for example, mak-ing declines appear “excessive” if a baselineis falsely elevated, or conversely, masking atrue loss if the baseline is under-recorded orfollow-up results are over-recorded.
Of particular concern in the occu-pational setting is the variation in techni-cal quality and testing protocols that occurswhen occupational health vendors, spirom-eters, or both are changed frequently. Suchinconsistency makes it difficult to accuratelymeasure a worker’s change in pulmonaryfunction over time. On-going quality assur-ance (QA) reviews of spirometry test resultsare critical in such situations. As an ad-junct to a QA program, public domain soft-ware, Spirola (Centers for Disease Controland Prevention/NIOSH, Atlanta, GA),47 isavailable to help users examine the variabil-ity of their serial pulmonary function data,which is often increased by poor technicalquality. However, users need to rememberthat some respiratory diseases also cause in-creased variability over time, and that tech-nical errors, which are consistent over timemay bias spirometry results without increas-ing their variability.
Occupational medicine practitionersneed to determine whether monitoring de-cline in pulmonary function has been shownto be effective in screening for a particularoutcome disease of interest. There is generalconsensus that early detection of acceleratedpulmonary function decline in flavoring andmicrowave-popcorn manufacturing work-ers should trigger comprehensive medicalevaluation and workplace interventions.11
However, the effectiveness of monitoringlongitudinal pulmonary function is lessclearly demonstrated in other occupationalsettings. Therefore, practitioners need to re-gard the finding of a possible excessive de-cline as an opportunity to further assess anindividual’s health, and not use it as a la-bel or to stigmatize a worker. Such inappro-priate labeling may negatively impact theworker’s employment status while not gain-ing him/her any improvement in respiratoryhealth.
Longitudinal interpretationClinicians have accumulated many
decades of experience in the traditional eval-
uation of patient spirometry test results rela-tive to the cross-sectional reference range. Incontrast, relatively little evaluation of lungfunction loss over time has occurred. Since1991, ATS has recommended that a year-to-year change in healthy individuals needs toexceed 15% before it is considered as clini-cally meaningful, so that “changes” in lungfunction are not likely to be caused onlyby measurement variability.5,19 In 1995,NIOSH adopted this definition48 and rec-ommended that an age-adjusted percentdecline from baseline be calculated, withmedical referral if the FEV1 declined by15% or more after taking aging effects intoaccount.
To provide some guidance for oc-cupational medicine practitioners, ACOEMadopted these definitions and approacheswhen it defined its longitudinal normal limitin 2004.2 A worker’s longitudinal normallimit is derived specifically from his/herbaseline results, and corresponds to a 15%drop from the baseline, after allowing for ex-pected average loss due to aging. Falling be-low the longitudinal normal limit means thatthe worker has lost more lung function thanwas expected due to aging and measurementvariability. After a low value is confirmed,medical referral is recommended. In 2007,the California Department of Public Healthrecommended using the cutoff of a 15%decline to trigger a medical evaluation forflavor manufacturing workers.11 This cutoffwas chosen to avoid the false positives thatare likely to occur when pulmonary func-tion is measured in many non-standardized,real-world clinic situations.
And finally, NIOSH researchers havebeen working to expand the practice of lon-gitudinal evaluation of pulmonary function,developing public domain software, Spirola,for this purpose, and analyzing several largestandardized databases, to determine howtightly the longitudinal lower limit of normalmight be set when high quality test resultsare evaluated over time.8,47 The National In-stitute for Occupational Safety and Healthestimates of abnormal longitudinal change,obtained from good quality results for nor-mal healthy workers, are generally smallerthan the 15% recommended by ACOEM,ATS/ERS, and the 1995 NIOSH criteriadocument, and so a range of cutoffs for ex-cessive pulmonary function declines mayemerge as clinical experience with thesemeasurements accumulates. For now, therecommendation of a NIOSH Health Haz-ard Evaluation may be generally appropriatefor longitudinal evaluations of pulmonaryfunction: “. . . workers with FEV1 falls ofabout 10% to 15% (depending on spirome-try quality) [emphasis added] from baselineshould be medically evaluated.”49
The American College of Occupa-tional and Environmental Medicine strongly
Copyright © 2011 Lippincott Williams & Wilkins. Unauthorized reproduction of this article is prohibited.
C© 2011 American College of Occupational and Environmental Medicine 579

Spirometry in Occupational Health JOEM � Volume 53, Number 5, May 2011
recommends that the interpretation of pul-monary function change over time requiresboth an evaluation of the technical quality ofthe tests and an adequate length of follow-up. When high-quality spirometry testingis in place, ACOEM continues to recom-mend medical referral for workers whoseFEV1 losses exceed 15%, after allowing forthe expected loss due to aging. Smaller de-clines of 10% to 15%, after allowing for theexpected loss due to aging, may be impor-tant when the relationship between longi-tudinal results and the endpoint disease isclear. These smaller declines must first beconfirmed, and then, if the technical qualityof the pulmonary function measurement isadequate, acted upon.
Pre- to Postbronchodilator Changesin Pulmonary Function
There is general agreement that apre- to postbronchodilator increase in FEV1(and/or FVC) needs to be at least 12% ofthe initial value and 0.2 L to be calledsignificant, that is, a bronchodilator re-sponse that is suggestive of airways hyperre-activity.5,50–52 Percent change from the ini-tial value is calculated as [(initial value –postbronchodilator value)/initial value] ×100. However, failure to achieve such a re-sponse to bronchodilators does not com-pletely exclude the possibility of reversibleairways disease, and testing may have to berepeated more than once. Attention focusesfirst on changes in the FEV1 and then, sec-ondly, on the FVC because changes in theFVC may be produced by varying lengthsof expiration recorded before or after thebronchodilator.
The American College of Occupa-tional and Environmental Medicine contin-ues to recommend that a pre- to postbron-chodilator increase in FEV1 (and/or FVC)be 12% or more of the initial value andat least 0.2 L to be considered sugges-tive of reversible obstructive airways dis-ease. The American College of Occupa-tional and Environmental Medicine alsoconcurs with the ATS and the AMA thatdeterminations of permanent impairmentneed to use a worker’s best values for FVCand FEV1, whether recorded before or afterbronchodilator administration.
ACOEMRECOMMENDATIONS–2011
1. Equipment PerformanceThe American College of Occupa-
tional and Environmental Medicine rec-ommends that facilities performing occu-pational spirometry tests maintain a pro-cedure manual documenting equipmenttype, spirometer configuration, manufac-turer’s guidelines, calibration log, serviceand repair records, personnel training, and
standard operating procedures. Such a man-ual will permit troubleshooting if problemsarise with test results.
a. Spirometer specifications1. The American College of Occu-
pational and Environmental Medicine rec-ommends that spirometers of all typesmeet or exceed recommendations made byATS/ERS 2005 and, eventually, by ISO26782:
� Performance-based criteria for spirome-ter operation, including, for example, ac-curacy, precision, linearity, frequency re-sponse, expiratory flow impedance, andother factors;
� Minimum sizes and aspect ratios forreal-time displays of flow-volume andvolume-time curves and graphs in hard-copy printouts (see the Appendix); and
� Standard electronic spirometer output ofresults and curves.
2. It is also recommended thatspirometers which will be used in the oc-cupational setting:
� Store all information from up to eight ma-neuvers in a subject test session;
� Permit later editing and deletion of earlierflawed test results;
� Be capable of including all flow-volumeand volume-time curves and all test re-sults from at least the three best maneu-vers, and preferably from all saved ef-forts, in the spirometry test report;
� Provide computer-derived technical qual-ity indicators;
� Provide a dedicated routine for verifyingspirometer calibration; and
� Save indefinitely a comprehensive elec-tronic record of all calibration and cali-bration verification results.
b. Validation testing of spirometersIf spirometers are purchased for use
in the occupational health setting, ACOEMstrongly recommends that:
� The manufacturer needs to provide writ-ten verification that the spirometer suc-cessfully passed its validation testing,preferably conducted by an independenttesting laboratory, and that the testedspirometer and software version corre-spond with the model and software ver-sion being purchased; and
� The spirometer needs to meet theATS/ERS recommended minimum real-time display and hardcopy graph sizesfor flow-volume and volume-time curvesand ISO minimum aspect ratios for thesedisplays, as well as providing a standardspirometer electronic output (see the Ap-pendix).
c. Spirometer accuracy checksThe American College of Occupa-
tional and Environmental Medicine recom-mends that:
� Spirometer accuracy be checked dailywhen in use, following the steps outlinedin this document;
� Tracings and records from these checksbe saved indefinitely;
� A log is kept of technical problems foundand solved, as well as all changes in pro-tocol, computer software, or equipment;and
� Spirometers purchased for use in the oc-cupational setting have dedicated calibra-tion check routines (as noted earlier).
d. Avoiding sensor errors during sub-ject tests� Users of flow-type spirometers need to
recognize the flawed curves and test re-sults that may be caused by sensor con-tamination or zero-flow errors (Figs. 2 to5); and
� Protocols need to be established and usedto prevent these errors from occurring andto correct the errors if they do occur. Seethe text for specific suggestions.
2. Conducting Tests
a. Technician trainingAll technicians conducting occupa-
tional spirometry tests should successfullycomplete a NIOSH-approved spirometrycourse initially, and a NIOSH-approved re-fresher course every 5 years.
b. Conducting the test� Technicians need to explain, demonstrate,
and actively coach workers to performmaximal inspirations, hard and fast ex-piratory blasts, and complete expirations.
� Testing should be conducted standing,positioning a sturdy chair without wheelsbehind the subject, unless the subject haspreviously experienced a problem withfainting.
� Record test posture on the spirometryrecord and use the same posture for allserial tests over time.
� Disposable nose clips are recommended.
c. Testing goal for a valid test� To achieve a valid test, occupational
spirometry should attempt to record 3 ormore acceptable curves, with FVC andFEV1 repeatability of 0.15 L (150 mL) orless. A poster portraying many unaccept-able curves has recently been publishedby NIOSH.53 See the text for definitionsof terms.
� Failure to achieve repeatability is of-ten caused by submaximal inhalations,though very poor repeatability (eg,
Copyright © 2011 Lippincott Williams & Wilkins. Unauthorized reproduction of this article is prohibited.
580 C© 2011 American College of Occupational and Environmental Medicine

JOEM � Volume 53, Number 5, May 2011 ACOEM Guidance Statement
> 0.50 L) may indicate sensor contami-nation or zero-flow errors.
� Failure to achieve repeatability needs tobe taken into account during the interpre-tation of results.
d. Reporting results� Spirometry test reports need to present re-
sults and curves from all acceptable ma-neuvers to permit technical quality to befully evaluated.
� The largest FVC and largest FEV1 areinterpreted, even if they come from dif-ferent curves. Note that many currentlyavailable spirometers fail to meet thisATS/ERS and OSHA requirement.
� Test reports need to list the source of thereference values used as well as display-ing the LLNs for clinician evaluation.
� Default spirometer configurations need tobe examined and often adjusted, if possi-ble, to meet these requirements and rec-ommendations.
e. Quality assurance reviews� The American College of Occupational
and Environmental Medicine recom-mends that facilities performing occupa-tional spirometry tests need to establishon-going programs providing QA reviewsof spirograms.
� Reviews need to be conducted at leastquarterly, and more often if techniciansare inexperienced or if poor technicalquality is observed.
� The goal of such reviews is to assure that80% or more of an occupational healthprogram’s spirometry tests are technicallyacceptable.
� It is recommended that QA reviewers beexperienced in recognizing and correct-ing flawed spirometry test results.
3. Comparing Results WithReference Values
a. Reference values� The American College of Occupational
and Environmental Medicine recom-mends that the NHANES III (Hankinson)reference values be used unless a regula-tion mandates another specific set of ref-erence values.
� If NHANES III reference values are notavailable on older spirometers, ACOEMrecommends using the Crapo predictionequations, and only using the Knudson1983 equations if neither NHANES norCrapo equations are available.
b. Race-adjustment of predictedvalues and lower limits of normal� Use NHANES III race-specific reference
values, basing a worker’s race/ethnicityon self-report.
� Apply a scaling (“race-adjustment”) fac-tor of 0.88 to white-predicted values andLLNs for FVC and FEV1 to obtain appro-priate reference values for Asian workers.
� If NHANES III reference values are notavailable when testing African Americanworkers, apply a scaling factor of 0.88to white-predicted values and LLNs forFVC and FEV1, unless other practices aremandated by an applicable regulation.
� The predicted FEV1/FVC and its LLNare not race adjusted.
c. Interpretation algorithm� To separate normal from abnormal test re-
sults, first examine the FEV1/FVC to de-termine whether obstructive impairmentis present, and then evaluate the FVC todetermine whether restrictive impairmentmay exist. The FEV1 is examined if theFEV1/FVC indicates possible obstructiveimpairment, as shown in Fig. 13.
� All three indices of pulmonary functionare considered abnormal if they fall be-low their fifth percentile LLN. Fixed cut-off points for abnormality such as 80%of the predicted value or an observedFEV1/FVC ratio less than 0.70 should notbe used in the occupational health setting.
� An FEV1/FVC that is barely abnormal, inthe presence of FEV1 and FVC more than100% of predicted, may indicate a nor-mal physiologic variant pattern in healthynonsmokers. However, if such healthyworkers are exposed to known respira-tory hazards, clinical judgment is neededto evaluate the possibility of early airwaysobstruction.
4. Evaluating Results Over Time
a. Longitudinal interpretation� Evaluate technical quality of the spirom-
etry tests and the adequacy of the follow-up period before interpreting change inpulmonary function over time.
� The American College of Occupationaland Environmental Medicine recom-mends that FEV1 losses exceeding 15%since baseline, after allowing for the ex-pected loss due to aging, trigger furthermedical evaluation when spirometry is ofhigh technical quality.
� The American College of Occupationaland Environmental Medicine recom-mends that a confirmed FEV1 decline of10% to 15% since baseline, after allow-ing for the expected loss due to aging,would trigger further medical evaluation,when loss of FEV1 is known to be relatedto an endpoint disease and test quality isadequate.
b. Pre- to postbronchodilator changesin pulmonary function� A pre- to postbronchodilator FEV1 or
FVC increase of 12% of the initial valueand 0.2 L is suggestive of reversible ob-structive airways disease.
� Determinations of permanent impair-ment need to be based on a worker’sbest values for FVC and FEV1, whetherrecorded before or after a bronchodilator.
ACKNOWLEDGMENTSThe committee thanks, first and fore-
most, the many members of the occupationalhealth community who for decades havegenerously shared their interest, questions,and perspectives on occupational spirom-etry testing. Second, the committee thanksDrs John Hankinson and Philip Harber fortheir support and insightful comments dur-ing the development of this position state-ment. This guidance statement was reviewedby ACOEM Council of Scientific Advisors,and approved by ACOEM Board of Direc-tors on January 23, 2010.
REFERENCES1. American College of Occupational and En-
vironmental Medicine. Spirometry in the oc-cupational setting. J Occup Environ Med.2000;42:228–245.
2. American College of Occupational and Environ-mental Medicine. Evaluating pulmonary func-tion change over time. J Occup Environ Med.2005;47:1307–1316. Available at: http://www.acoem.org/EvaluatingPulmonaryFunctionChange.aspx. Accessed April 17, 2011.
3. American Thoracic Society/European Respira-tory Society. General considerations for lungfunction testing. Eur Respir J. 2005;26:153–161. Available at: http://www.thoracic.org/statements/resources/pfet/PFT1.pdf. AccessedApril 17, 2011.
4. American Thoracic Society/European Respi-ratory Society. Standardisation of spirome-try. Eur Respir J. 2005;26:319–338. Avail-able at: http://www.thoracic.org/statements/resources/pfet/PFT2.pdf. Accessed April 17,2011.
5. Pellegrino R, Viegi G, Brusasco V et al.Interpretative strategies for lung function tests.Eur Respir J. 2005;26:948–968. Available at:http://www.thoracic.org/statements/resources/pfet/pft5.pdf. Accessed April 17, 2011.
6. International Organization for Standardization.ISO 26782:2009 Anaesthetic and respiratoryequipment—spirometers intended for themeasurement of time forced expired volumes inhumans. Available at: http://webstore.ansi.org/RecordDetail.aspx?sku=ISO+26782%3A2009.Accessed April 17, 2011.
7. Townsend MC, Hankinson JL, Lindesmith LA,Slivka WA, Stiver G, Ayres GT. Is my lungfunction really that good? Flow-type spirom-eter problems that elevate test results. Chest.2004;125:1902–1909. Available at: www.chestjournal.org/cgi/reprint/125/5/1902.pdf.Accessed April 17, 2011.
8. Hnizdo E, Sircar K, Glindmeyer HW, PetsonkEL. Longitudinal limits of normal decline inlung function in an individual. J Occup Envi-ron Med. 2006;48:625–634.
Copyright © 2011 Lippincott Williams & Wilkins. Unauthorized reproduction of this article is prohibited.
C© 2011 American College of Occupational and Environmental Medicine 581

Spirometry in Occupational Health JOEM � Volume 53, Number 5, May 2011
9. Hnizdo E, Sircar K, Yan T, Harber P, FlemingJ, Glindmeyer HW. Limits of longitudinal de-cline for the interpretation of annual changesin FEV1 in individuals. Occup Environ Med.2007;64:701–707.
10. Wang ML, Avashia BH, Petsonk EL. Interpret-ing periodic lung function tests in individuals:the relationship between 1- to 5-year and long-term FEV1 changes. Chest. 2006;130:493–499.
11. Hazard Evaluation System and InformationService, Occupational Health Branch, Califor-nia Department of Public Health, Division ofRespiratory Disease Studies, National Institutefor Occupational Safety and Health. MedicalSurveillance for Flavorings: Related LungDisease among Flavor Manufacturing Workersin California 08/07. Available at: www.cdph.ca.gov/programs/ohb/Documents/flavor-guidelines.pdf. Accessed April 17, 2011.
12. U.S. Code of Federal Regulations. Title 29, Part1910.1043, Cotton Dust, revised 1985.
13. Centers for Disease Control and Prevention.Spirometry. National Institute for Occupa-tional Safety and Health Spirometry TrainingProgram Web page. Available at: http://www.cdc.gov/niosh/topics/spirometry/training.html.Accessed April 17, 2011.
14. Enright PL, Johnson LR, Connett JE, Voelker H,Buist AS. Spirometry in the Lung Health Study.1. Methods and quality control. Am Rev RespirDis. 1991;143:1215–1223.
15. Hankinson JL, Bang KM. Acceptability and re-producibility criteria of the American ThoracicSociety as observed in a sample of the generalpopulation. Am Rev Respir Dis. 1991;143:516–521.
16. American Thoracic Society. Standardiza-tion of spirometry, 1994 update. Am JRespir Crit Care Med. 1995;152:1107–1136.http://www.thoracic.org/statements/resources/archive/201.pdf. Accessed April 17, 2011.
17. American Thoracic Society. Evaluation of im-pairment/disability secondary to respiratorydisorders. Am Rev Respir Dis. 1986;133:1205–1209.
18. American Medical Association. Guides to theEvaluation of Permanent Impairment. 6th ed.Chicago, IL: American Medical Association;2008.
19. American Thoracic Society. Lung function test-ing: selection of reference values and in-terpretative strategies. Am Rev Respir Dis.1991;144:1202–1218.
20. Crapo RO, Morris AH, Gardner RM. Referencespirometric values using techniques and equip-ment that meet ATS recommendations. Am RevRespir Dis. 1981;123:659–664.
21. Knudson RJ, Lebowitz MD, Holberg CJ, Bur-rows B. Changes in the normal maximal expira-tory flow-volume curve with growth and aging.Am Rev Respir Dis. 1983;127:725–734.
22. Hankinson JL, Odencrantz JR, Fedan KB. Spiro-metric reference values from a sample of thegeneral U.S. population. Am J Respir Crit CareMed. 1999;159:179–187.
23. Collen J, Greenburg D, Holley A, King CS,Hnatiuk O. Discordance in spirometric inter-pretations using three commonly used referenceequations vs. national health and nutrition exam-ination study III. Chest. 2008;134:1009–1016.
24. Aggarwal AN, Gupta D, Behera D, Jindal SK.Applicability of commonly used Caucasian pre-diction equations for spirometry interpretationin India. Indian J Med Res. 2005;122:153–164.
25. Hankinson JL, Kawut SM, Shahar E, Smith LJ,Stukovsky KH, Barr RG. Performance of Amer-ican Thoracic Society-recommended spirometryreference values in a multiethnic sample ofadults: the multi-ethnic study of atherosclerosis(MESA) lung study. Chest. 2010;137:138–145.Available at: http://www.ncbi.nlm.nih.gov/pmc/articles/PMC2803123/pdf/chest.09-0919.pdf.Accessed April 17, 2011.
26. Ip MS, Ko FW, Lau AC, Hong AC et al. KongThoracic Society; American College of ChestPhysicians (Hong Kong and Macau Chapter).Updated spirometric reference values for adultChinese in Hong Kong and implications on clin-ical utilization. Chest. 2006;129:384–392.
27. Knudson RJ, Slatin RC, Lebowitz MD, BurrowsB. The maximal expiratory flow-volume curve.Normal standards, variability, and effects of age.Am Rev Respir Dis. 1976;113:587–600.
28. Rabe K, Hurd S, Anzueto A et al. GlobalInitiative for Chronic Obstructive Lung Dis-ease. Global Strategy for the Diagnosis, Man-agement, and Prevention of Chronic Obstruc-tive Pulmonary Disease: GOLD Executive Sum-mary. Am J Respir Crit Care Med. 2007;176:532–555.
29. Hansen JE, Sun XG, Wasserman K. Spirometriccriteria for airway obstruction: use percentage ofFEV1/FVC ratio below the fifth percentile, not<70%. Chest. 2007;131:349–355.
30. Townsend MC. Conflicting definitions ofairways obstruction: drawing the line be-tween normal and abnormal. Chest. 2007;131:335–336.
31. Parmet AJ, Von Essen S. Rapidly progres-sive, fixed airway obstructive disease in pop-corn workers: a new occupational pulmonaryillness? J Occup Environ Med. 2002;44:216–218.
32. Lockey J, McKay R, Barth E, et al. Bronchi-olitis obliterans in the food flavoring manufac-turing industry. Am J Respir Crit Care Med.2002;165:A461.
33. Kreiss K, Gomaa A, Kullman G, Fedan K,Simoes EJ, Enright PL. Clinical bronchiolitisobliterans in workers at a microwave popcornplant. N Engl J Med. 2002;5:330–338.
34. Harber P, Saechao K, Boomus C. Diacetyl-induced lung disease. Toxicol Rev. 2006;25:261–272.
35. Kanwal R. Bronchiolitis obliterans in workersexposed to flavoring chemicals. Curr Opin PulmMed. 2008;14:141–146.
36. Israel L, Kim T, Prudhomme J, Bailey R, Har-ber P. Workplace Spirometry: Early DetectionBenefits Individuals, Worker Groups and Em-ployers. April 1, 2009. Available at: http://www.thoracic.org/clinical/ats-clinical-cases/pages/workplace-spirometry-early-detection-benefits-individuals,-worker-groups-and-employers.php.Accessed April 17, 2011.
37. Berry G. Longitudinal observations: their use-fulness and limitations with special reference tothe forced expiratory volume. Bull PhysiopatholRespir (Nancy). 1974;10:643–656.
38. Hankinson JL. Pulmonary function testing in thescreening of workers: guidelines for instrumen-tation, performance, and interpretation. J OccupMed. 1986;28:1081–1092.
39. Hankinson JL, Hodous TK. Short-term prospec-tive spirometric study of new coal miners (ab-stract). Am Rev Respir Dis. 1983;127:159.
40. Wang ML, Wu ZE, Du QG, et al. A prospectivecohort study among new Chinese coal miners:
the early pattern of lung function change. OccupEnviron Med. 2005;62:800–805.
41. Beeckman LA, Wang ML, Petsonk EL, et al.Rapid declines in FEV1 and subsequent respira-tory symptoms, illnesses, and mortality in coalminers in the United States. Am J Respir CritCare Med. 2001;163:633–639.
42. Sircar K, Hnizdo E, Petsonk E, Attfield M. De-cline in lung function and mortality: implica-tions for medical monitoring. Occup EnvironMed. 2007;64:461–466.
43. Hankinson JL, Wagner GR. Medical screen-ing using periodic spirometry for detection ofchronic lung disease. Occup Med. 1993;8:353–361.
44. Leone N, Courbon D, Thomas F, et al. Lungfunction impairment and metabolic syndrome:the critical role of abdominal obesity. Am JRespir Crit Care Med. 2009;179:509–516.
45. Wang ML, McCabe L, Petsonk EL, HankinsonJL, Banks DE. Weight gain and longitudinalchanges in lung function in steel workers. Chest.1997;111:1526–1532.
46. Thyagarajan B, Jacobs DR, Jr, Apostol GG, et al.Longitudinal association of body mass indexwith lung function: the CARDIA study. RespirRes. 2008;9:31.
47. US Department of Health and Human Ser-vices, Centers for Disease Control and Preven-tion, National Institute for Occupational Safetyand Health. Spirometry Longitudinal Data Anal-ysis (SPIROLA) Software. 2011. Availableat: http://www.cdc.gov/niosh/topics/spirometry/spirola-software.html. Accessed April 17, 2011.
48. United States Department of Health and Hu-man Services, United States Public Health Ser-vice, Center for Disease Control, National Insti-tute of Occupational Safety and Health. Criteriafor a recommended standard: occupational ex-posure to respirable coalmine dust. September1995.
49. Department of Health & Human Services, Cen-ters for Disease Control, National Institute forOccupational Safety and Health. HETA 2007–0033 Interim Report March 29, 2007. Availableat: www.cdc.gov/niosh/hhe/reports/pdfs/2007-0033-letter.pdf.
50. Tarlo SM, Balmes J, Balkissoon R, et al. Diag-nosis and management of work-related asthma:American College of Chest Physicians consen-sus statement. Chest. 2008;134(suppl 3):1S–41S.
51. United States Department of Health and HumanServices, National Institute of Health, NationalHeart, Lung and, Blood Institute. NationalAsthma Education and Prevention Program.Expert panel report 3 (EPR3): guidelines forthe diagnosis and management of asthma.2007. NIH Publication No. 08-4051. Availableat: http://www.nhlbi.nih.gov/guidelines/asthma/asthgdln.htm. Accessed April 17, 2011.
52. GINA Workshop Report, Global Strategy forAsthma Management and Prevention. Availableat: http://www.ginasthma.com/Guidelineitem.asp??l1=2&l2=1&intId=1561. Updated De-cember 2009.
53. Beeckman-Wagner LF, Freeland DL, Shah DasM, Thomas KC. Get Valid Spirometry ResultsEvery Time. Atlanta, GA: US Department ofHealth and Human Services, Centers for DiseaseControl and Prevention, National Institute forOccupational Safety and Health; 2011. DHHS(NIOSH) Publication No. 2011-135. Availableat: http://www.cdc.gov/niosh/docs/2011-135/pdfs/2011-135.pdf. Accessed April 18, 2011.
Copyright © 2011 Lippincott Williams & Wilkins. Unauthorized reproduction of this article is prohibited.
582 C© 2011 American College of Occupational and Environmental Medicine

JOEM � Volume 53, Number 5, May 2011 ACOEM Guidance Statement
Copyright © 2011 Lippincott Williams & Wilkins. Unauthorized reproduction of this article is prohibited.
C© 2011 American College of Occupational and Environmental Medicine 583

Spirometry in Occupational Health JOEM � Volume 53, Number 5, May 2011
Copyright © 2011 Lippincott Williams & Wilkins. Unauthorized reproduction of this article is prohibited.
584 C© 2011 American College of Occupational and Environmental Medicine