acn 125 931 964 financial report 30 june 20152015/09/14 · 2 the directors of chrysalis resources...
TRANSCRIPT

ACN 125 931 964
FINANCIAL REPORT
30 JUNE 2015
For
per
sona
l use
onl
y
COMPANY DIRECTORY
DIRECTORS
Dr Neale Fong Non-Executive Chairman
Mr Jian Hua Sang Non-Executive Director
Mr Leigh Ryan Managing Director
COMPANY SECRETARY Mr Kevin Hart
REGISTERED OFFICE
Suite 20 7 The Esplanade Mt Pleasant WA 6153
Telephone: +61(8) 6180 9290 Facsimile: +61(8) 9316 1314 Website: www.chrysalisresources.com.au
SHARE REGISTRY
Computershare Investor Services Pty Ltd Level 11 172 St Georges Terrace
PERTH WA 6000 GPO Box D182 Perth WA 6840
Telephone: +61(8) 9323 2000 Facsimile: +61(8) 9323 2033
AUDITORS
HLB Mann Judd Level 4, 130 Stirling Street PERTH WA 6000
Telephone: +61(8) 9227 7500 Facsimile: +61(8) 9227 7533
AUSTRALIAN SECURITIES EXCHANGE
Chrysalis Resources Limited shares (CYS) are listed on the Australian Securities Exchange.
The home exchange is Perth, Western Australia.
For
per
sona
l use
onl
y

CONTENTS
DIRECTORS’ REPORT 2 AUDITOR’S INDEPENDENCE DECLARATION 23 STATEMENT OF PROFIT OR LOSS AND OTHER COMPREHENSIVE INCOME 24 STATEMENT OF FINANCIAL POSITION 25 STATEMENT OF CHANGES IN EQUITY 26 STATEMENT OF CASH FLOWS 27 NOTES TO THE FINANCIAL STATEMENTS 28 DIRECTORS’ DECLARATION 53 INDEPENDENT AUDITOR’S REPORT 54
For
per
sona
l use
onl
y

DIRECTORS’ REPORT
2
The Directors of Chrysalis Resources Limited (“the Company”) present their report for the financial year ended 30 June 2015. In order to comply with the provisions of the Corporations Act 2001, the directors report as follows: Directors
The names of directors, who held office during or, since the end of the year and up until the date of this report, are as follows:
Dr Neale Fong Non-Executive Chairman
Mr Leigh Ryan1 Managing Director Appointed 23 September 2014
Mr Jian Hua Sang Non-Executive Director
Mr Michael Griffiths2 Non-Executive Director Resigned 23 September 2014
Ms Jing Wang3 Executive Director Resigned 23 September 2014 Notes: 1. Mr Leigh Ryan was appointed as Managing Director on 23 September 2014.
2. Mr Michael Griffiths was appointed as Alternate Director to Mr Bradley Marwood on 5 April 2013, subsequently appointed as Non-
Executive director on 26 July 2013 and resigned on 23 September 2014.
3. Ms Jing Wang was appointed Executive Director on the 1 November 2013 and resigned on the 23 September 2014.
Directors were in office for this entire period unless otherwise stated.
The particulars of the qualifications, experience and special responsibilities of each director as at year end and until the date of this report are as follows: Dr Neale Fong – MBBS Dip CS MTS MBA FAICD FACHSM (Hon) Non-Executive Chairman
Dr Fong has extensive experience in management of large and complex organisations, especially in the health and human services field. He is a qualified medical practitioner holding Bachelors Degrees in Medicine and Surgery from the University of Western Australia as well as a Masters in Business Administration from the UWA Business School. He also holds a Masters Degree in Theological Studies from Regent College, University of British Columbia.
Dr Fong is a Fellow of the Australian Institute of Company Directors and is an experienced chairman and director. He is also a non-executive director of Sleep Studies Australia Pty Ltd and Chairman of Bethesda Hospital Inc.
Dr Fong has served as a director and chairman of the West Australian Football Commission and acts as adviser and consultant to a number of other companies.
During the past three years, Dr Fong has served as a Director of the following listed companies.
Company Date appointed Date ceased
Realm Resources Limited 10 December 2009 17 September 2013 Mr Leigh Ryan – BSc Geology, MAIG Managing Director (Appointed 23 September 2014)
Mr Ryan is a highly qualified geologist with 28 years of experience in the exploration and resources industry, specifically in project management and executive management throughout Australia and Africa. He has been involved in the targeting, evaluation, discovery and resource definition of numerous gold and base metal deposits and has successfully negotiated many purchase option and joint venture agreements. Mr Ryan was previously the Managing Director of Boss Resources Limited, and prior to that was employed by Resolute Mining Limited as the Group Exploration Manager for Africa and Australia. He has worked extensively in Queensland, WA, Tanzania, Burkina Faso, Mali, and Cote d’Ivoire. On the 2 December 2013 Mr Ryan was appointed as Chief Executive Officer of the Company, which preceded his appointment as Managing Director.
For
per
sona
l use
onl
y
DIRECTORS’ REPORT (continued)
3
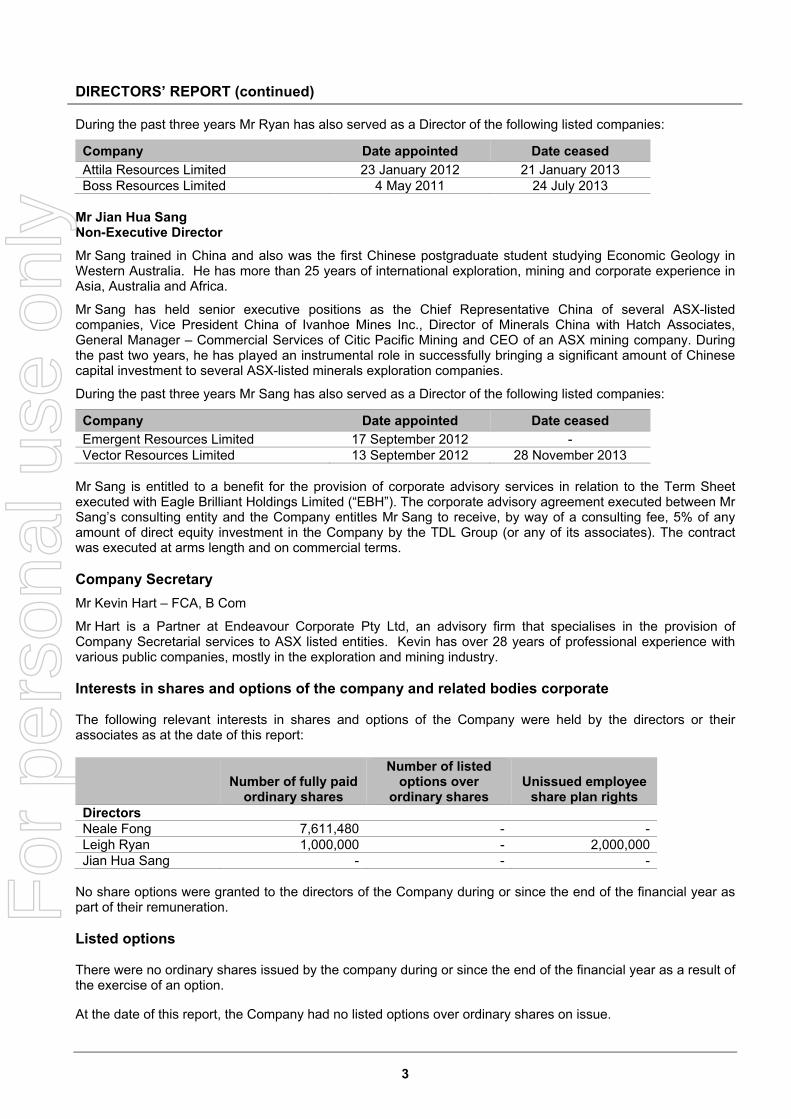
During the past three years Mr Ryan has also served as a Director of the following listed companies:
Company Date appointed Date ceased
Attila Resources Limited 23 January 2012 21 January 2013 Boss Resources Limited 4 May 2011 24 July 2013
Mr Jian Hua Sang Non-Executive Director
Mr Sang trained in China and also was the first Chinese postgraduate student studying Economic Geology in Western Australia. He has more than 25 years of international exploration, mining and corporate experience in Asia, Australia and Africa.
Mr Sang has held senior executive positions as the Chief Representative China of several ASX-listed companies, Vice President China of Ivanhoe Mines Inc., Director of Minerals China with Hatch Associates, General Manager – Commercial Services of Citic Pacific Mining and CEO of an ASX mining company. During the past two years, he has played an instrumental role in successfully bringing a significant amount of Chinese capital investment to several ASX-listed minerals exploration companies.
During the past three years Mr Sang has also served as a Director of the following listed companies:
Company Date appointed Date ceased
Emergent Resources Limited 17 September 2012 - Vector Resources Limited 13 September 2012 28 November 2013
Mr Sang is entitled to a benefit for the provision of corporate advisory services in relation to the Term Sheet executed with Eagle Brilliant Holdings Limited (“EBH”). The corporate advisory agreement executed between Mr Sang’s consulting entity and the Company entitles Mr Sang to receive, by way of a consulting fee, 5% of any amount of direct equity investment in the Company by the TDL Group (or any of its associates). The contract was executed at arms length and on commercial terms. Company Secretary
Mr Kevin Hart – FCA, B Com
Mr Hart is a Partner at Endeavour Corporate Pty Ltd, an advisory firm that specialises in the provision of Company Secretarial services to ASX listed entities. Kevin has over 28 years of professional experience with various public companies, mostly in the exploration and mining industry. Interests in shares and options of the company and related bodies corporate The following relevant interests in shares and options of the Company were held by the directors or their associates as at the date of this report:
Number of fully paid
ordinary shares
Number of listed options over
ordinary shares Unissued employee
share plan rights Directors Neale Fong 7,611,480 - - Leigh Ryan 1,000,000 - 2,000,000 Jian Hua Sang - - -
No share options were granted to the directors of the Company during or since the end of the financial year as part of their remuneration. Listed options There were no ordinary shares issued by the company during or since the end of the financial year as a result of the exercise of an option. At the date of this report, the Company had no listed options over ordinary shares on issue.
For
per
sona
l use
onl
y
DIRECTORS’ REPORT (continued)
4
Dividends No dividends were paid during the year and no recommendation is made as to dividends. Principal Activity The principal activity of the Group was exploration for minerals. Review of Operations Zambian Copper Projects Exploration continued in Zambia throughout the year, with the company entering into a legally binding Letter Agreement with FQM Exploration (Zambia) Limited (“FQM”) whereby FQM agreed to fund exploration across Chrysalis’ Shikila and Kabwima Projects for a minimum 6 month period prior to earning the right to enter an Earn-in phase, and subsequent Joint Venture, Put/Call and/or Net Smelter Royalty options. The Letter Agreement includes licences 8194-HQ-LPL, 13404-HQ-LPL, and 13405-HQ-LPL (Kabwima and Shikila projects).
Kabwima Project
During the year exploration within the Kabwima Project included one trench and an additional 13 pits excavated within the Kimabwe Prospect returning maximum copper results of 1m @ 266ppm Cu from the trench, and 0.5m@359ppm Cu, 0.5m@346ppm Cu and 0.5m @ 483ppm Cu from pits KIPT007, KIPT008 and KIPT014 respectively (refer to ASX release dated 31 July 2014, June Quarterly Activities Report and 27 October 2014, September Quarterly Activities Report).
A 122 hole, 5,234m aircore (AC) drilling program was then completed at the Kimabwe Prospect in order to identify the potential for economic copper mineralisation within the >200ppm areas of the Kimabwe Prospect 5.5 kilometre long, up to 1.6km wide, continuous >100ppm copper-in-soil anomaly. Significant intercepts from the aircore program included (refer to ASX release dated 10 November 2014):
• 44m @ 0.7% Cu from 6m (KIAC108) incl. 6m @ 2.15% Cu, 1.1g/t Ag from 44m • 28m @ 0.26% Cu, 0.034% Co from 12m (KIAC021) • 16m @ 0.29% Cu from 25m to EOH (KIAC105) incl. 4m @ 0.43% Cu, 0.033% Co from 33m • 24m @ 0.18% Cu from 2m (KIAC107) • 17m @ 0.20% Cu from 14m (KIWB001)
The holes intercepted gabbro intrusives at the northern edge of the Cu-in-soil anomaly, and interbedded black shale, grey shale, silicified siltstone and biotite-muscovite-quartz schist to the south. Significant amounts of quartz veining and gossan development was encountered both at the gabbro / sediment and sediment / mica- quartz schist contacts. Lithologies and mineralised structures appear to dip at ~400 to the north-northwest and with all holes drilled at -600 all intercepts are interpreted to be close to true widths. Nine aircore holes ended in Cu mineralisation at <50m (down hole) depth, with saprolitic and gossanous mineralised zones suggesting surficial copper leaching and better copper grades at depth possible.
A regional 500m x 500m spaced soil sampling program was completed during the year as part of the FQM Joint Venture Option Agreement with a total of 7,140 samples collected plus an additional 314 laboratory standards and blank samples inserted into the sample submission. All samples were sieved to a -80# fraction and submitted for 4 acid digest and ICP-MS analysis in order to obtain low detection limits for 48 elements. Final multi-element soil sample results confirmed previous copper in soil anomalies identified by Chrysalis and have identified several new significant copper in soil anomalies, including one very large anomaly located ~6km NNE of the previously drilled Kimabwe Prospect in the south-western part of the Kabwima Project (Fig. 1), (refer to ASX announcement dated 23rd July 2015).
For
per
sona
l use
onl
y

DIRECTORS’ REPORT (continued)
5
Review of Operations (continued) The regional soil results included 30 soil samples >200ppm Cu, to a maximum of 500ppm Cu from a sample collected ~17 kilometres along strike to the NW of the Mutenda prospect. The largest and most significant Cu-in-soil anomaly from within the Kabwima Project (Target H) is up to 2 kilometres wide and runs discontinuously for a distance of more than 10 kilometres. Apart from checking the residual nature of the soil in the area, the anomaly has been confirmed and characterised by plotting the Cu/Sc ratio in soil which removes the effect of Cu anomalism due to naturally elevated copper levels in mafic rock types (e.g. gabbro which are very common in this region). Figure 1 shows an image produced from the Kabwima soils Cu/Sc ratio data and confirms the Cu-in-soil anomalism associated with Target H, and various other areas including Target B, Target D, and the previously identified and drilled Kimabwe Prospect. Elevated Fe and Ti levels (typically high in soils derived from mafic rock types) have also been used to discriminate between true Cu-in-soil anomalism and rock type related elevated copper (e.g. the strong linear anomaly in the NW corner of the project appears to be gabbro related, but ground checking is obviously required).
FQM are planning to drill the Target H anomaly and also conduct additional drilling at the Kimabwe Prospect. Drilling preparation is underway.
Figure 1: Kabwima Project 500m x 500m spaced soil sample results (Cu ppm) over Cu/Sc ratio image.
For
per
sona
l use
onl
y
DIRECTORS’ REPORT (continued)
6
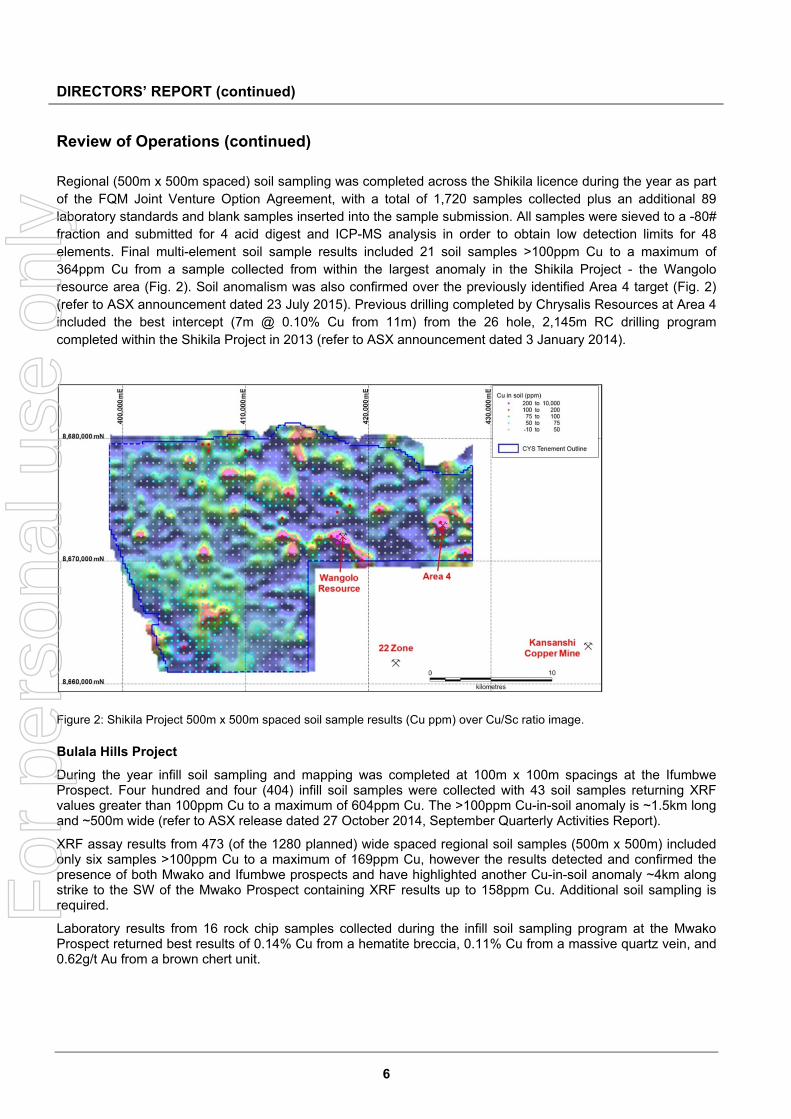
Review of Operations (continued) Regional (500m x 500m spaced) soil sampling was completed across the Shikila licence during the year as part of the FQM Joint Venture Option Agreement, with a total of 1,720 samples collected plus an additional 89 laboratory standards and blank samples inserted into the sample submission. All samples were sieved to a -80# fraction and submitted for 4 acid digest and ICP-MS analysis in order to obtain low detection limits for 48 elements. Final multi-element soil sample results included 21 soil samples >100ppm Cu to a maximum of 364ppm Cu from a sample collected from within the largest anomaly in the Shikila Project - the Wangolo resource area (Fig. 2). Soil anomalism was also confirmed over the previously identified Area 4 target (Fig. 2) (refer to ASX announcement dated 23 July 2015). Previous drilling completed by Chrysalis Resources at Area 4 included the best intercept (7m @ 0.10% Cu from 11m) from the 26 hole, 2,145m RC drilling program completed within the Shikila Project in 2013 (refer to ASX announcement dated 3 January 2014).
Figure 2: Shikila Project 500m x 500m spaced soil sample results (Cu ppm) over Cu/Sc ratio image.
Bulala Hills Project
During the year infill soil sampling and mapping was completed at 100m x 100m spacings at the Ifumbwe Prospect. Four hundred and four (404) infill soil samples were collected with 43 soil samples returning XRF values greater than 100ppm Cu to a maximum of 604ppm Cu. The >100ppm Cu-in-soil anomaly is ~1.5km long and ~500m wide (refer to ASX release dated 27 October 2014, September Quarterly Activities Report).
XRF assay results from 473 (of the 1280 planned) wide spaced regional soil samples (500m x 500m) included only six samples >100ppm Cu to a maximum of 169ppm Cu, however the results detected and confirmed the presence of both Mwako and Ifumbwe prospects and have highlighted another Cu-in-soil anomaly ~4km along strike to the SW of the Mwako Prospect containing XRF results up to 158ppm Cu. Additional soil sampling is required.
Laboratory results from 16 rock chip samples collected during the infill soil sampling program at the Mwako Prospect returned best results of 0.14% Cu from a hematite breccia, 0.11% Cu from a massive quartz vein, and 0.62g/t Au from a brown chert unit.
For
per
sona
l use
onl
y

DIRECTORS’ REPORT (continued)
7
Review of Operations (continued) A nine hole, 1,634m reverse circulation (RC) drilling program was completed at the Mwako Prospect. The program was aimed at identifying the potential for economic copper mineralisation beneath >200ppm copper-in-soil XRF results within a semi-continuous 1km wide x 4.5km long >100ppm Cu-in-soil anomaly containing 107 >200ppm Cu-in-soil XRF values, including 1100ppm Cu, 1066ppm Cu, 971ppm and 818ppm Cu (Fig. 3).
Drilling results included three broad low grade copper intercepts including 39m @ 0.28% Cu from 97m (including 17m @ 0.32% Cu from 114m) in hole MKRC003, 36m @ 0.26% Cu from 150m in MKRC007, and 38m @ 0.19% Cu from 174m to EOH in MKRC008, all from the northern zone of copper mineralisation and all associated with an intensely silica altered sedimentary “chert” unit. Two of these holes (MKRC007 and MKRC008) ended in copper mineralisation. Disseminated pyrite, minor malachite staining and minor disseminated chalcopyrite was observed within the chert unit. The chert is located immediately above an interpreted structural contact with a strongly altered (argillic) felsic quartz-porphyry unit. The porphyry is interpreted to have intruded into a steep (~800) SE-dipping NE-striking shear zone which contains a hematite ironstone breccia unit on its northern contact (refer to ASX release dated 13 November 2014).
Gold analysis was only conducted on samples that looked prospective for gold mineralisation. Of the fifty one 1m samples selected, six returned values >0.1g/t Au to a maximum of 0.28g/t Au from a hematite ironstone breccia with minor pyrite from 104m to 105m in MKRC001. Other elevated gold values included 0.24g/t Au in a hematitic chert from 76m to 77m in MKRC004, 0.12g/t Au in magnetic chert from 25m to 26m in MKRC009, and 0.20g/t Au in magnetic chert from 184m to 185m in MKRC008. Additional gold analysis is required in order to determine the average width and grade of gold within the zones of Cu mineralisation. This will enable copper equivalent (CuEq) intercepts to be calculated.
Figure 3: Mwako Prospect RC drilling location plan with copper intercepts, major structures, and >100ppm and >200ppm Cu-in-soil anomaly contours over grey scale 1st Vertical Derivative (1VD) aeromagnetic image.
For
per
sona
l use
onl
y

DIRECTORS’ REPORT (continued)
8
Review of Operations (continued) During the year 435 infill soil samples were collected at 50m x 100m spacings at the Kasonkomona Prospect in the central north of the Project (refer to ASX release dated 27 October 2014, September Quarterly Activities Report). XRF analysis of the soil samples included only 3 samples >90ppm Cu to a maximum of 126ppm Cu (Fig. 4). No further work is currently planned for this area.
Infill soil sampling was also completed at the Chitampira Prospect as a follow-up to anomalous regional soil sampling results. Three hundred and sixty seven (367) soil samples were collected at a 100m x 100m spacing. XRF analysis of the soil samples included 27 samples >100ppm Cu to a maximum of 147ppm Cu (Fig. 4). Further infill sampling will be required over the Cu-in-soil anomaly in the NE of the prospect area.
XRF assay results from 753 (100m x 100m spaced) infill soil samples collected during the last quarter from the area surrounding the workings and trenches at the Mulyongo Prospect included 18 samples >100ppm Cu to a maximum of 182ppm Cu (Fig. 4). Additional work is required at Mulyongo to more closely determine the residual or transported nature of the soils in the area. Reverse circulation (RC) drilling to test for sulphide copper mineralisation at depth beneath the Mulyongo gossan and Cu-Au workings is warranted.
Three hundred and sixty six (366) infill soil samples were collected at 100m x 100m spacings at the Kaporoso Prospect in the southern corner of the Project. XRF analysis of the soil samples included only 3 samples >100ppm Cu to a maximum of 325ppm Cu (Fig. 4). The program is not complete with an additional 235 infill samples planned for the eastern side of the prospect area.
Figure 4: Mwongo Project infill soil sample locations (coloured dots), rock chip samples (coloured triangles), tracks, drainage and prospects.
For
per
sona
l use
onl
y

DIRECTORS’ REPORT (continued)
9
Review of Operations (continued) During the year licence renewals for all 5 Zambian large-scale prospecting licences were approved without reduction for a further 2 years commencing 1st July 2014. The total area covered by the Zambian prospecting licences remains at 3,023km2.
Corporate Social Responsibility
During the year a motorbike was purchased for the Mumbwa District Hospital (Mwongo Project) for medical deliveries, water sampling, child growth/health monitoring and supervision of community volunteers, and paint, sports equipment and writing materials were supplied to the Mulyango Primary School (Mwongo Project).
Australian Projects
During the 12 month period to 30 June 2015, Chrysalis continued its divestment push on the Australian Exploration Projects.
Halloween West Project (Cu/Au)
No field work was completed on this project, and after a thorough review of the Halloween West exploration data the Halloween West 37% Joint Venture equity in the project (E52/2275) was sold to the new Joint Venture farm-in partner Sandfire Resources NL for a consideration of $85,000.
Pioneer Project (Au)
No field work was completed on this project during the year. After a thorough review of the Pioneer exploration data exploration licences E63/1413 and E63/1413 were relinquished due to a perceived lack of prospectivity, and the remaining licences (E63/1117, M63/329, M63/368, P63/1429 and P63/1468) were sold to Metals-X Limited for a consideration of $30,000.
Gregory Range (U/Fe/Base Metals)
No field work was completed on this project during the year. After another thorough review of the Gregory Range exploration data and as part of the Company’s exploration divestment strategy, exploration licences E45/3120, 3E45/3313 and E45/3313 were surrendered.
West Angelas Project (Fe)
During the year Chrysalis Resources (“Chrysalis”) entered a legally binding agreement with FMG Pilbara Pty Ltd (“Fortescue”) whereby Chrysalis agreed to grant Fortescue exclusive exploration access to, and an option to purchase, the West Angelas Project Tenements (E47/1838-I and P47/1538).
In consideration, Fortescue paid Chrysalis $100,000 on the Commencement Date, and if not terminated beforehand, were to pay the sum of $100,000 on the first and second anniversaries of the Commencement Date; and if Fortescue exercised the Purchase Option, Fortescue agreed to pay Chrysalis a 1% Gross Revenue Royalty which reduces to a 0.1% GR Royalty after 10 million tonnes were mined and sold.
On 3 June 2015, Fortescue withdrew from the West Angelas Iron Ore Project Purchase Option Agreement. Prior to withdrawal all environmental rehabilitation was completed by Fortescue and the two tenements are now free of any environmental liability or any other encumbrances. Chrysalis will resume management of the project going forward. F
or p
erso
nal u
se o
nly

DIRECTORS’ REPORT (continued)
10
Corporate
Fully Underwritten Non-Renounceable Entitlement Issue (NREI)
On 8 July 2014 the company announced a fully underwritten Non-Renounceable Entitlement Issue on the basis of one new share for every two shares held on 15 July 2014 (the record date) at one cent each.
A total of 114,494,709 shares were allotted under the NREI which comprised:
• 26,200,957 shares to existing shareholders; and
• 88,293,752 shares to the Underwriter (Mr Adrian Paul), being the balance of the NREI shortfall.
Total funds raised from the NREI were $1,144,947 (before costs).
The capital raised was used to fund the costs associated with further exploration across the Zambian Copper Projects, together with meeting general working capital requirements.
First Quantum Joint Venture Option Agreement (Zambia)
On 23 October 2014 Chrysalis entered a legally binding Letter Agreement (“Agreement”) with FQM Exploration (Zambia) Limited (“FQM”) whereby FQM agreed to fund exploration across Chrysalis’ Shikila and Kabwima Projects for a 6 month period prior to earning the right to enter a two stage Earn-in phase, and subsequent Joint Venture, Put/Call and/or Net Smelter Royalty options (refer to ASX announcement dated 18 November 2014). The Letter Agreement includes licences 8194-HQ-LPL, 13404-HQ-LPL, and 13405-HQ-LPL) and includes the following terms:
• 6 month “Option Period” whereby FQM shall sole fund regional soil sampling programs across the Shikila and Kabwima Projects with a minimum spend of US$450,000. The 6 months can be shortened by completion of the soil programs and receipt of results, or extended if the wet season delays the completion of soil sampling.
• Chrysalis to manage Option Period exploration program in conjunction with technical input from FQM.
• If FQM spends $450,000 or more, and are satisfied with the soil sampling results, FQM can advance to a “First Earn-in” period.
• During the “First Earn-in” period FQM may spend an additional US$5 million within 2 years in order to earn a 51% interest and enter a formal Joint Venture Agreement.
• The Farm-in Manager will be responsible for maintaining the Licenses, including ensuring compliance with all related statutory and compliance obligations.
• FQM can then advance to a “Second Earn-in” period to earn a total 80% interest by generating an NI 43-101 compliant resource report (at FQM’s cost) for the purpose of making an application for a large scale mining licence under the Zambian Mines Act, and obtaining the successful grant of one or more large scale mining licence(s).
• Chrysalis will be carried through to production with all development costs to be paid back from production cash-flow (at LIBOR+4%).
• Within 30 days of the completion of the Second Earn-in Requirements a Put/Call option will allow FQM to force Chrysalis to sell their Joint Venture interest, or enable Chrysalis to force FQM to buy Chrysalis’ Joint Venture interest, at US$0.04c/lb. CuEq multiplied by the amount of Cu in the combined Measured, Indicated & Inferred (MII) Resource multiplied by the Joint Venture percentage of the seller.
• If either party are unable or unwilling to contribute to prorata share of cash requirements then the Joint Venture interest is diluted by an industry standard dilution formula.
• If diluted below 15% the diluting parties interest will be converted to a 1% net smelter royalty subject to a US$20,000,000 cap.
• A first right of refusal will apply to both FQM and Chrysalis.
• The Agreement was subject to due diligence on the 3 licences involved. On 12 January 2015 Chrysalis announced that it had received notification from FQM that the Due Diligence condition had been satisfied.
For
per
sona
l use
onl
y

DIRECTORS’ REPORT (continued)
11
Corporate (continued)
On the 17 July 2015, FQM Exploration (Zambia) Limited (“FQM”) satisfied all conditions associated with the Agreement and, subsequent to reviewing the final multi-element soil sample results from the Kabwima and Shikila projects in Zambia, have elected to execute the Option and advance to the “Earn-in” period (refer to ASX announcement dated 23 July 2015). The following modifications to the “Letter Agreement” have been accepted by both parties via the execution of the “Earn-in Notice”:
• A formal drafting of the joint venture agreement may be postponed for up to 12 months whilst initial drill testing is carried out. During this time all aspects of the joint venture will continue to be governed by the Letter Agreement.
• The parties are agreed that the “First Earn-In” stage of the letter agreement will be removed altogether leaving FQM with the right to earn an undivided interest of 80% in the project by completing all necessary conditions defined as the “Second Earn-In” (clause 3d of the Letter Agreement) within four years of the Earn-in Notice, dated 17 July 2015.
• The parties acknowledge that FQM will act as Farm-in Manager and carry out all exploration activities itself (by its employees, agents or contractors) as Farm-in Manager.
Peppermint Innovation Limited Acquisition
During the year Chrysalis Resources Limited was granted an option to acquire all the issued share capital in Peppermint Innovation Limited ("Peppermint") subject to due diligence and shareholder approval. Peppermint operates a Mobile Banking, Payments and Remittance Platform (“Platform”) in the Philippines which it intends to expand throughout Asia, Australia, the Middle East, Europe and Tunisia (refer to ASX announcement dated 21 May 2015).
The Mobile Banking, Payments and Remittance market is a rapidly expanding industry with significant market potential as the prevalence and reliance on mobile telecommunication continues to increase. Peppermint operate an established Platform and develop new and innovative mobile phone applications aimed at improving business efficiency and deriving revenue for commercial clients and agent networks. A key aspect of the Platform is to provide a mechanism, via a mobile phone, to the global unbanked population to bridge the financial inclusion gap. Peppermint already have a highly qualified and experienced technical development and management team in place.
On 23 July 2015 Chrysalis announced that the Due Diligence requirements had been satisfied and the Option to Acquire was exercised. On 21 July 2015 both Chrysalis and Peppermint elected not to enter into a Definitive Agreement as originally stated in the Binding Term Sheet (BTS) dated 20 May 2015, instead using the terms and conditions of an amended BTS. The key acquisition terms and conditions precedent including the recent amendments to the BTS include:
• Chrysalis is to obtain all regulatory approvals for the Acquisition, including in particular ASX approval for the readmission of Chrysalis to the official list of the ASX in connection with its change in nature and scale of activities.
• the removal of the 1 for 5 consolidation of Chrysalis share capital prior to the Acquisition. The parties agree that subject to Chrysalis obtaining a waiver from Listing Rule 2.1, Condition 2 (20c Rule Waiver) in respect of Chrysalis’ proposed recompliance with Chapters 1 and 2 of the ASX Listing Rules, Chrysalis will not undertake a consolidation of its share capital in respect of the Acquisition of all the Peppermint shares.
• the allotment and issue of 350,000,000 Acquisition Shares by Chrysalis to the Vendors (the Peppermint Shareholders) in consideration for the Acquisition.
• the issue of 100,000,000 Performance Shares. Performance Shares shall not vest until the Milestones to which they attach are achieved and the Acquisition Shares shall be escrowed in accordance with ASX requirements. Each (1) Performance Share shall be issued on completion and is convertible into one (1) ordinary share in the capital of Chrysalis, upon the following milestones being achieved.
o Milestone 1: 50 million Performance shares will vest upon Chrysalis or its subsidiaries generating cumulative revenue of $15,000,000 from the Mobile Banking, Payments and Remittance Business operated by Peppermint (MBPRB) or in the event of a Change of Control within 5 years of the date of the Term Sheet.
For
per
sona
l use
onl
y

DIRECTORS’ REPORT (continued)
12
Corporate (continued)
o Milestone 2: 50 million Performance shares will vest upon Chrysalis or its subsidiaries generating cumulative revenue of $50,000,000 from the MBPRB or in the event of a Change of Control within 5 years of the date of the Term Sheet.
o Conversion is subject to the following:
- the issue of Shares on conversion of Performance Shares on a Change of Control shall at all times be limited to 10% of the total shares on issue at the date of the Change of Control; and
- a “Change of Control” occurs where a third party becomes entitled to more than 50% of the Chrysalis shares or where all those shares are either cancelled or transferred to a third party under Court Order.
• the replacement of the Transaction Timetable with the following clause; “The parties agree they will use their best endeavours to ensure that the transaction proceeds and completes as soon as possible.”
• Chrysalis must successfully complete a capital raising under a prospectus to raise sufficient funds to meet the ASX Chapter 1 and 2 readmission requirements and satisfactorily deliver the business plan and objectives of PEP in connection with its readmission. The capital required is currently estimated at $3,500,000.
The Acquisition remains subject to the necessary shareholder and regulatory approvals, and satisfaction of the remaining conditions precedent under the BTS. A general meeting has been convened for 2 October 2015 at which shareholders will have the opportunity to vote on the Acquisition and other related matters.
In light of the above, the updated indicative effect of the Acquisition on the capital structure of Chrysalis is expected to be as follows:
Ordinary Shares
Performance Shares
Existing Shares 345,484,128 Ordinary Shares as Consideration 350,000,000 Performance Shares as Consideration - 100,000,000Shares issued under Prospectus* 175,000,000 TOTAL 870,484,128 100,000,000
* Assumes a minimum capital raise of $3.5m at an issue price of $0.02 per Share.
Subject to the receipt of shareholder approval, Chrysalis will undertake a capital raising under a prospectus to raise sufficient funds to meet the ASX Chapter 1 and 2 readmission requirements and deliver the business plan and objectives of Peppermint in connection with its readmission. The current estimated funding required is $3,500,000. The majority of the funds will be used to establish and expand the existing Peppermint subscriber base.
On completion of the Acquisition of Peppermint and readmission of Chrysalis, the Board of Chrysalis shall comprise three directors nominated by PEP and a maximum of one existing director of Chrysalis.
ASX Listing Rules Re-compliance and Financial Information
The Acquisition of Peppermint will result in a change to the nature and scale of Chrysalis (“the Company”) and will require shareholder approval under Chapter 11 of the ASX Listing Rules and will also require the Company to re-comply with Chapters 1 and 2 of the ASX Listing Rules. The Company has dispatched a notice of meeting to shareholders seeking all of the relevant approvals. F
or p
erso
nal u
se o
nly

DIRECTORS’ REPORT (continued)
13
Corporate (continued)
DJ Carmichael Corporate Advisors and Lead Manager
Chrysalis has announced that DJ Carmichael Pty Ltd (DJC) have been appointed as Corporate Advisors for Chrysalis in order to assist in raising up to $3.5 million of additional equity funding as part of the Company’s proposed re-compliance with Chapters 1 and 2 of the ASX Listing Rules (Re-listing). As disclosed above Chrysalis proposes to place 175 million ordinary fully paid shares at an issue price of $0.02 pursuant to a Re-Listing prospectus to be lodged with the Australian Securities and Investments Commission as soon as practicable. DJC will assist the Company in meeting its objectives on a best endeavours basis with regards to the issue of new Shares pursuant to the Re-Listing, and are named as Lead Manager, on the terms and conditions set out in the Corporate Advisory Services Mandate signed by Chrysalis and DJC.
Board Changes
Mr Michael Griffiths and Ms Jing Wang resigned as Non-Executive and Executive Director respectively on 23 of September 2014. Mr Leigh Ryan assumed the role of Managing Director on 23 of September 2014. Financial At 30 June 2015, the Company had cash reserves of $159,446 (2014: $694,497). Capitalised exploration and evaluation expenditure is $1,059,896 (2014: $3,772,954). Exploration expenditure during the year was $1,224,011 (2014: $1,448,713). The net loss for the year was $4,353,904 (2014: $2,788,971) which included a Zambian loss of $3,744,821 (2014: $819,014) which supports the delivery of the exploration program in Zambia. Included in the net loss for the year is an impairment of exploration assets for $3,938,589 following a Board review of existing tenements as detailed in Note 8.
In the past year there has been a strong focus on reducing administration costs with reductions in director and employee costs $543,707 (2014: $1,139,207), other expenses $391,343 (2014: $756,847) and accounting fees $61,615 (2014: $135,250). Significant changes in the state of affairs In the opinion of the directors, there were no other significant changes in the state of affairs of the Group that occurred during the financial year not otherwise disclosed in this report or in the financial report. Matters Subsequent to the End of the Financial Year
There has not been any matter or circumstance that has arisen after balance date that has significantly affected, or may significantly affect, the operations of the Group, the results of those operations, or the state of affairs of the Group in future financial years, other than those detailed below:
• Further to the announcement on 21 May 2015 in which the Company announced that it had been granted an option to acquire all the issued capital in Peppermint Innovation Limited (“Peppermint”), the following events have been announced.
o On 3 July 2015 the Company advised that it had agreed with Peppermint to extend the Due Diligence period for the acquisition of Peppermint to 18 July 2015.
o On 23 July 2015 the Company announced that the Due Diligence requirements had been satisfied and that the Company had exercised the Option to acquire Peppermint. DJ Carmichael Pty Ltd had been appointed Corporate Advisors and Lead Manager to assist in raising up to $3,500,000 of additional equity funding. The acquisition remains conditional upon the Company obtaining necessary shareholder and regulatory approvals, together with satisfaction of the remaining conditions precedent under the binding term sheet.
• On 23 July 2015 the Company advised that FQM Exploration (Zambia) Limited (“FQM”) had satisfied all conditions associated with the exclusive option period within the “Letter Agreement” dated 23 October 2014, (refer to ASX announcement dated 18th November 2014), and have elected to execute the Option and advance to the “Earn-in” period.
• On 11 September 2015 the Company executed a short-term unsecured loan agreement for up to $200,000 to complete the Peppermint transaction pursuant to the binding term sheet between the Company and Peppermint dated 20 May 2015.
For
per
sona
l use
onl
y

DIRECTORS’ REPORT (continued)
14
Financial (continued) Likely developments and expected results
The Group will undertake a capital raising under a prospectus to raise sufficient funds to meet the ASX Chapter 1 and 2 readmission requirements and deliver the business plan and objectives of Peppermint in connection with its readmission. Environmental legislation
The Group’s exploration activities are subject to environmental regulations under both Commonwealth of Australia and Western Australian State legislation as well as Zambian Government legislation.
The Board believes the Group has adequate systems in place for the management of its environmental requirements and is not aware of any breach of those environmental requirements as they apply to the Group during 2015 and up until the date of this report. Remuneration Report
This report outlines the remuneration arrangements in place for key management personnel of the Company and its controlled entities for the financial year ended 30 June 2015. The information provided in this remuneration report has been audited as required by Section 308(3C) of the Corporations Act 2001.
The remuneration report details remuneration arrangements for key management personnel (“KMP”) who are defined as those persons having authority and responsibility for planning, directing and controlling the major activities of the Company and its controlled entities, directly or indirectly, including any director (whether executive or otherwise) of the Company. Key Management Personnel Directors
Dr Neale Fong Non-Executive Chairman
Mr Leigh Ryan1 Managing Director Appointed 23 September 2014
Mr Jian Hua Sang2 Non-Executive Director
Mr Michael Griffiths3 Non-Executive Director Resigned 23 September 2014
Ms Jing Wang Executive Director Resigned 23 September 2014 Notes: 1. Mr Leigh Ryan was appointed as Managing Director on 23 September 2014.
2. Mr Michael Griffiths was appointed as Alternate Director to Mr Bradley Marwood on 5 April 2013, subsequently appointed as Non-
Executive director on 26 July 2013 and resigned 23 September 2014.
3. Ms Jing Wang was appointed Executive Director on the 1 November 2013 and resigned on the 23 September 2014.
Executives
Mr Kevin Hart Company Secretary
Mr Patrick Soh Chief Financial Officer
Mr John Noakes Director (Sedgwick Resources Limited)
Mr Christopher Simasiku Director / Company Secretary (Sedgwick Resources Limited)
Mr Jeremy Hawksworth Exploration Manager Resigned 31 January 2014
For
per
sona
l use
onl
y

DIRECTORS’ REPORT (continued)
15
Financial (continued) Details of KMP remuneration are set out under the following main headings: A Principles used to determine the nature and amount of remuneration B Details of remuneration including share-based compensation remuneration C Employment contracts of key management personnel D Remuneration of key management personnel E Shareholdings of key management personnel F Share-based compensation - share plan shares G Option holdings of key management personnel H Transactions with related parties of key management personnel A Principles used to determine the nature and amount of remuneration The objective of the Company’s reward framework is to ensure reward for performance is competitive and appropriate for the results delivered. The framework aims to align reward with the creation of value for shareholders. The Board ensures that employee reward satisfies the following key criteria for good reward governance practices: • competitiveness and reasonableness • acceptability to shareholders • performance incentives • transparency • capital management The framework provides a mix of fixed fee, consultancy agreement based remuneration, and share-based incentives. Company performance and link to remuneration Mr Ryan has been granted 3,000,000 performance shares of which 2,000,000 of these relate to market performance as detailed in the performance rights holdings table. Below is a table showing the Group’s performance and EPS over the last 4 financial years.
30 June 2012 30 June 2013 30 June 2014 30 June 2015
Financial year profit / (loss) - $ (1,207,470) (3,905,006) (2,788,971) (4,353,904)
EPS / (Loss per share) - cents (2.13) (2.90) (1.29) (1.35)
Share price - cents 8 5.5 1.5 3.5
B Details of remuneration
Remuneration structure In accordance with best practice corporate governance, the structure of non-executive director and executive remuneration is separate and distinct.
Non-executive directors The Board seeks to set aggregate remuneration at a level that provides the Company with the ability to attract and retain directors of the highest calibre, whilst incurring a cost that is acceptable to shareholders.
For
per
sona
l use
onl
y
DIRECTORS’ REPORT (continued)
16
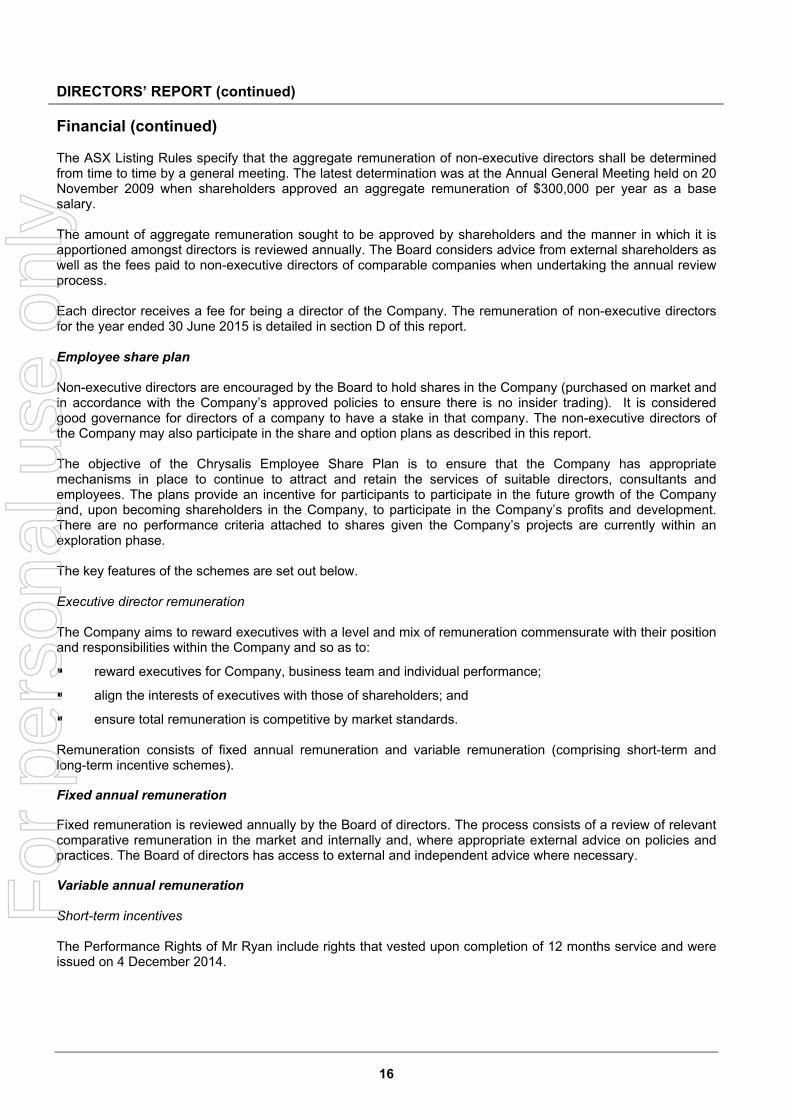
Financial (continued) The ASX Listing Rules specify that the aggregate remuneration of non-executive directors shall be determined from time to time by a general meeting. The latest determination was at the Annual General Meeting held on 20 November 2009 when shareholders approved an aggregate remuneration of $300,000 per year as a base salary. The amount of aggregate remuneration sought to be approved by shareholders and the manner in which it is apportioned amongst directors is reviewed annually. The Board considers advice from external shareholders as well as the fees paid to non-executive directors of comparable companies when undertaking the annual review process. Each director receives a fee for being a director of the Company. The remuneration of non-executive directors for the year ended 30 June 2015 is detailed in section D of this report. Employee share plan Non-executive directors are encouraged by the Board to hold shares in the Company (purchased on market and in accordance with the Company’s approved policies to ensure there is no insider trading). It is considered good governance for directors of a company to have a stake in that company. The non-executive directors of the Company may also participate in the share and option plans as described in this report. The objective of the Chrysalis Employee Share Plan is to ensure that the Company has appropriate mechanisms in place to continue to attract and retain the services of suitable directors, consultants and employees. The plans provide an incentive for participants to participate in the future growth of the Company and, upon becoming shareholders in the Company, to participate in the Company’s profits and development. There are no performance criteria attached to shares given the Company’s projects are currently within an exploration phase. The key features of the schemes are set out below. Executive director remuneration The Company aims to reward executives with a level and mix of remuneration commensurate with their position and responsibilities within the Company and so as to:
reward executives for Company, business team and individual performance;
align the interests of executives with those of shareholders; and
ensure total remuneration is competitive by market standards. Remuneration consists of fixed annual remuneration and variable remuneration (comprising short-term and long-term incentive schemes). Fixed annual remuneration Fixed remuneration is reviewed annually by the Board of directors. The process consists of a review of relevant comparative remuneration in the market and internally and, where appropriate external advice on policies and practices. The Board of directors has access to external and independent advice where necessary. Variable annual remuneration Short-term incentives The Performance Rights of Mr Ryan include rights that vested upon completion of 12 months service and were issued on 4 December 2014.
For
per
sona
l use
onl
y

DIRECTORS’ REPORT (continued)
17
Financial (continued) Long-term incentives Retirement allowances for directors Apart from superannuation payments paid on base director fees there are no retirement allowances for directors. Employee share plan To ensure that the Company has appropriate mechanisms in place to continue to attract and retain the services of suitable directors, consultants and employees, the Company established an Employee Share Plan (the “Plan”), which was approved by the Shareholders on 20 November 2009 at the Company’s Annual General Meeting. The Plan was not renewed at the Company’s 2012 Annual General Meeting and as such should the Company issue shares to directors, consultants and employees under the Plan, the issue will impact the Company’s 15% placement capacity under ASX listing rule 7.1.
The number of Ordinary Shares that may be offered to a Participant is entirely within the discretion of the Board. The Company does not intend to offer more than 5% of the issued share capital of the Company under the Plan.
The Board’s policy is to remunerate directors at market rates for time, commitment and responsibilities. The board determines payments to the directors and reviews their remuneration annually, based on market practice, duties and accountability. During the year no independent external advice was utilised, but it is sought when required. The maximum aggregate amount of directors’ fees that can be paid is subject to approval by shareholders in general meeting, from time to time. Fees for non-executive directors are not linked to the performance of the Company. However, to align directors’ interests with shareholders’ interests, the directors are encouraged to hold securities in the Company.
The Company’s aim is to remunerate at a level that will attract and retain high-calibre directors and employees. Company officers and directors are remunerated to a level consistent with the size of the company. All remuneration paid to directors and executives is valued at the cost to the Company and expensed.
Participants of the Plan are determined by the Board and can be employees and directors of, or consultants to, the Company or a controlled entity. The Board considers length of service, seniority, responsibilities, potential contribution and any other relevant matters in determining eligibility of potential participants.
The issue price for the shares issued under the Plan are not less than the weighted average share price for the last five trading days immediately preceding the offer to the participant.
A participant who is invited to subscribe for shares under the Plan may also be invited to apply for a loan up to the amount payable in respect of the shares accepted by the participant. These loans are to be made on the following terms:
• Applied directly against the issue price of the shares to be acquired under the Plan; • For a term to be determined by the Board; • Repayable to the extent of the lesser of the issue price of the relevant shares issued, less any cash
dividends applied against the outstanding principal; and the last market sale price of the shares on the date of repayment of the loan;
• The loan must be repaid in full prior to expiry of the loan; and • The Company will have a lien over the shares in respect of which a loan is outstanding. The market value of the option implicit in the share issued under the Plan (funded by way of a loan on the conditions noted above), measured using the Black and Scholes option pricing model, is recognised in the financial statements as an equity benefit reserve and as employee benefit costs in the period over which the shares vest. The Employee Share Plan shares were issued by the Company during the year ended 30 June 2014 and are detailed in section F of the Remuneration Report.
For
per
sona
l use
onl
y

DIRECTORS’ REPORT (continued)
18
Financial (continued) C Employment contracts of key management personnel Agreements with Directors The employment arrangements of the non-executive directors are formalised in a contract for services. Agreements with Executives The employment arrangements of executives formalised in a contract of employment are listed below: Chief Executive Officer
On 10 December 2013 the Company announced the appointment of Mr Leigh Ryan as Chief Executive Officer effective from the 2 December 2013.
An agreement executed on the 6 December 2013 does not have a fixed contract period. It requires that:
i) the Company may terminate the employment contract at any time by giving three months notice; or
ii) Mr Ryan may terminate the employment contract at any time by providing the Company with three months notice.
iii) Fixed remuneration in the form of a base salary at $220,000 plus superannuation which was reduced by 25% from December 2014 and reduced by a further 25% from May 2015.
iv) Employee Share Plan Participation
a. 1,000,000 plan shares vesting on completion of 12 month’s service in the role of Chief Executive Officer were issued on the 4 December 2014.
b. 1,000,000 plan shares will vest upon the Company achieving a Market Capitalisation of equal to or greater than $30,000,000.
c. 1,000,000 plan shares will vest upon the Company achieving a Market Capitalisation of equal to or greater than $50,000,000.
Contracted key management personnel are engaged on standard commercial terms. D Remuneration of key management personnel
Key management personnel remuneration for the year ended 30 June 2015 and 30 June 2014
Short-term employee benefits
Post-employment
benefits
Other long-term benefits
Share-based
payments
Salary & Fees
$
Bonuses
$
Other
$
Super-annuation
$
Long-service leave
$
Equity-settled
$
Total
$
Perform-ance
Related
% 2015 Directors
Dr Neale Fong 49,584 - - 4,710 - - 54,294 -
Mr Leigh Ryan1 180,563 - - 17,154 - 25,851 223,568 11.6%
Mr Jian Hua Sang 35,416 - 2,000 3,365 - - 40,781 -
Mr Michael Griffiths2 12,500 - - 1,188 - - 13,688 -
Ms Jing Wang3 33,333 - 900 3,167 - - 37,400 -
Key Management Personnel
Mr Kevin Hart 58,864 - - - - - 58,864 -
Mr Patrick Soh 56,250 - - - - - 56,250 -
Mr John Noakes - - - - - - - -
Mr Christopher Simasiku 50,472 - - - - - 50,472 -
For
per
sona
l use
onl
y

DIRECTORS’ REPORT (continued)
19
Financial (continued)
Short-term employee benefits
Post-employment
benefits
Other long-term benefits
Share-based
payments
Salary & Fees
$
Bonuses
$
Other
$
Super-annuation
$
Long-service leave
$
Equity-settled
$
Total
$
Perform-ance
Related
% 2014 Directors
Dr Neale Fong 82,500 - - 7,631 - - 90,131 -
Mr Jian Hua Sang 133,765 - 6,386 2,698 - - 142,849 -
Mr Trevor Benson4 21,331 - - 1,973 - - 23,304 -
Mr Michael Griffiths2 48,316 - - 4,469 - - 52,785 -
Mr Grant Kidner5 41,667 - - 3,854 - - 45,521 -
Mr Bradley Marwood6 50,328 - - - - - 50,328 -
Mr Adrian Paul7 22,917 - - 2,120 - - 25,037 -
Ms Jing Wang3 62,917 - 9,118 5,820 - - 77,855 -
Key Management Personnel
Mr Leigh Ryan1 188,923 - - 11,740 - 40,254 240,917 16.7%
Mr Kevin Hart 24,524 - - - - - 24,524 -
Mr Patrick Soh 39,500 - - - - - 39,500 -
Mr John Noakes - - - - - - - -
Mr Christopher Simasiku 62,052 - 7,462 - - - 69,514 -
Ms Melanie Cotterell8 12,500 - - 1,156 - - 13,656 -
Mr Jeremy Hawksworth9 154,493 - - - - - 154,493 - Notes: 1. Appointed as Chief Executive Officer from 2 December 2013 and subsequently appointed as Managing Director on 23 September 2014. 2. Appointed as Alternate Director to Mr Bradley Marwood on 5 April 2013, subsequently appointed as Non-Executive director on
26 July 2013. 3. Appointed as Executive Director from 1 November 2013 and resigned on the 23 September 2014. 4. Resigned 29 November 2013 5. Resigned 29 November 2013 6. Resigned 29 July 2013 7. Resigned 29 November 2013 8. Resigned as Company Secretary 2 December 2013 9. Resigned 31 January 2014 E Shareholdings of key management personnel
Balance at beginning of
period Granted as
remuneration On exercise of options
On market acquisitions /
(disposals) Balance at
end of period 2015 Directors
Dr Neale Fong 6,934,320 - - 677,160 7,611,480
Mr Leigh Ryan - 1,000,000 - - 1,000,000
Mr Jian Hua Sang - - - - -
Mr Michael Griffiths - - - - 2 -
Ms Jing Wang - - - - 2 -
Key Management Personnel
Mr Kevin Hart - - - - -
Mr Patrick Soh - - - - -
Mr John Noakes 666,187 - - (333,095) 333,092
Mr Christopher Simasiku - - - - -
7,600,507 1,000,000 - 344,065 8,944,572
For
per
sona
l use
onl
y
DIRECTORS’ REPORT (continued)
20
Financial (continued)
Balance at beginning of
period Granted as
remuneration On exercise of options
On market acquisitions /
(disposals) Balance at
end of period 2014 Directors
Dr Neale Fong 6,934,320 - - - 6,934,320
Mr Jian Hua Sang 1 - - - - -
Mr Trevor Benson 6,750,000 - - - 2 6,750,000
Mr Michael Griffiths - - - - -
Mr Grant Kidner 6,447,104 - - - 2 6,447,104
Mr Bradley Marwood - - - - 2 -
Mr Adrian Paul 12,481,820 - - - 2 12,481,820
Ms Jing Wang 1 - - - - -
Key Management Personnel
Mr Leigh Ryan 1 - - - - -
Mr Kevin Hart 1 - - - - -
Mr Patrick Soh 1 - - - - -
Mr John Noakes 1,425,000 - - (758,813) 666,187
Mr Christopher Simasiku - - - - -
Ms Melanie Cotterell 360,000 - - - 2 360,000
Mr Jeremy Hawksworth - - - - 2 -
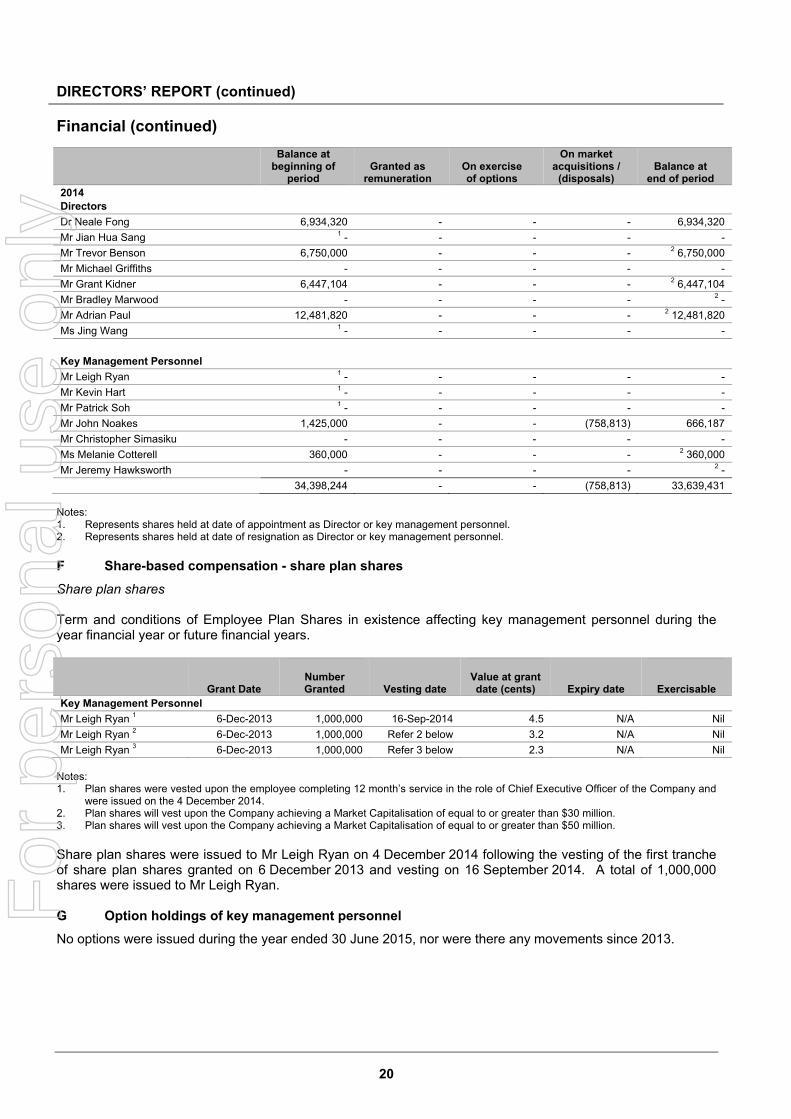
34,398,244 - - (758,813) 33,639,431 Notes: 1. Represents shares held at date of appointment as Director or key management personnel. 2. Represents shares held at date of resignation as Director or key management personnel. F Share-based compensation - share plan shares
Share plan shares Term and conditions of Employee Plan Shares in existence affecting key management personnel during the year financial year or future financial years.
Grant Date
Number Granted
Vesting date
Value at grant date (cents)
Expiry date
Exercisable Key Management Personnel
Mr Leigh Ryan 1 6-Dec-2013 1,000,000 16-Sep-2014 4.5 N/A Nil
Mr Leigh Ryan 2 6-Dec-2013 1,000,000 Refer 2 below 3.2 N/A Nil
Mr Leigh Ryan 3 6-Dec-2013 1,000,000 Refer 3 below 2.3 N/A Nil Notes: 1. Plan shares were vested upon the employee completing 12 month’s service in the role of Chief Executive Officer of the Company and
were issued on the 4 December 2014. 2. Plan shares will vest upon the Company achieving a Market Capitalisation of equal to or greater than $30 million. 3. Plan shares will vest upon the Company achieving a Market Capitalisation of equal to or greater than $50 million. Share plan shares were issued to Mr Leigh Ryan on 4 December 2014 following the vesting of the first tranche of share plan shares granted on 6 December 2013 and vesting on 16 September 2014. A total of 1,000,000 shares were issued to Mr Leigh Ryan. G Option holdings of key management personnel
No options were issued during the year ended 30 June 2015, nor were there any movements since 2013.
For
per
sona
l use
onl
y

DIRECTORS’ REPORT (continued)
21
Financial (continued) H Transactions with related parties of key management personnel
The following table provides the total amount of transactions that were entered into with related parties for the relevant financial year:
Income from
Related Parties Expenditure to Related Parties
Amounts Owed by Related
parties at year end
Amounts Owed to Related
parties at year end
$ $ $ $
Craigstone Pty Ltd 1 2015 - - - -
2014 - 64,906 - 78,000
Equiti partners 2 2015 - - - -
2014 - 138,429 - 30,430
Yangtze Trust 3 2015 - 2,000 - -
2014 - 165,356 - - Notes: 1. Mr J Noakes, a director of Sedgwick Resources Limited, is a director of Craigstone Pty Ltd. During the financial year 2014, Mr Noakes
received geological exploration consultancy fees from the Company. 2. Mr G Kidner was an Executive director, is a director of Equiti Partners. During the 2014 financial year, Equiti Partners received fees for
accounting, secretarial, executive consultancy fees, administration services and reimbursement of car parking facilities from the Company.
3. Mr Jian Hua Sang, a Non-Executive directors is a beneficiary of Yangtze Trust. During the financial year Mr Sang received a consulting fee and in 2014 received a commission on funds raised from EBH.
For the year ended 30 June 2015, the Group has not made any allowance for doubtful debts relating to amounts owed by related parties due to solid payment history (2013: $nil). An impairment assessment is undertaken each financial year by examining the financial position of the related party and the market in which the related party operates to determine whether there is objective evidence that a related party receivable is impaired. When such objective evidence exists, the Group recognises an allowance for the impairment loss. End of Remuneration Report Directors’ Meetings
The Board has not established separate committees and performs the roles of these committees in separately identified meetings.
The number of meetings of directors (including meetings of committees of directors) held during the year and the number of meetings attended by each director was as follows:
Directors’ meetings Audit committee
Nomination and remuneration
committee
Attended Held Attended Held Attended Held
Number of meetings attended:
Dr Neale Fong 7 7 2 2 1 1
Mr Leigh Ryan1 4 4 2 2 1 1
Mr Jian Hua Sang 6 7 2 2 1 1
Mr Michael Griffiths2 3 3 - - - -
Ms Jing Wang3 2 3 - - - -
Notes: 1. Appointed as Chief Executive Officer from 2 December 2013 and subsequently appointed as Managing Director on 23 September 2014. 2. Appointed as Alternate Director to Mr Bradley Marwood on 5 April 2013, subsequently appointed as Non-Executive director on
26 July 2013. 3. Appointed as Executive Director from 1 November 2013 and resigned on the 23 September 2014.
For
per
sona
l use
onl
y

DIRECTORS’ REPORT (continued)
22
Directors’ Meetings (continued)
Indemnification and insurance of Directors and Officers The Company has agreed to indemnify all the directors of the Company for any liabilities to another person (other than the Company or related body corporate) that may arise from their position as directors of the Company, except where the liability arises out of conduct involving a lack of good faith. During the financial year the Company paid a premium in respect of a contract insuring the directors and officers of the company and its controlled entities against any liability incurred in the course of their duties to the extent permitted by the Corporations Act 2001. The contract of insurance prohibits disclosure of the nature of the liability and the amount of the premium. Proceedings on behalf of the company No person has applied for leave to the Court to bring proceedings on behalf of the Company or intervene in any proceedings to which the Company is a party for the purpose of taking responsibility on behalf of the Company for all or any part of those proceedings. The Company was not a party to any such proceedings during the year. Auditor Independence and Non-Audit Services Section 307C of the Corporations Act 2001 requires our auditors, HLB Mann Judd, to provide the directors of the Company with an Independence Declaration in relation to the audit of the annual report. This Independence Declaration is set out on page 22 and forms part of this Directors’ Report for the year ended 30 June 2015. Non-Audit Services The Company’s auditors provided tax compliance services during the financial year ended 30 June 2015. The directors are satisfied that the provision of non-audit services by the auditor did not compromise the auditor independence requirements of the Corporations Act 2001. Signed in accordance with a resolution of the directors.
Dr Neale Fong Non-Executive Chairman Perth, 14 September 2015 Competent Person’s Statement The information in this report that relates to exploration results is based on information compiled by Mr Leigh Ryan, CEO employed by Chrysalis, who is a Member of the Australian Institute of Geoscientists (MAIG). Mr Ryan has sufficient experience relevant to the style of mineralisation and type of deposit under consideration and to the activity he is undertaking to qualify as a Competent Person as defined in the 2012 Edition of the “Australasian Code for Reporting of Exploration Results, Mineral Resources and Ore Reserves”. Mr Ryan consents to the inclusion in the report of the matters based on information in the form and context in which it appears. Mr Ryan participates in the Company’s Employee Share Plan. The Company confirms that it is not aware of any new information or data that materially affects the information included in the original market announcement and, in the case of estimates of Mineral Resources that all material assumptions and technical parameters underpinning the estimate in the relevant market announcement continue to apply and have not materially changed. The Company confirms that the form and context in which the Competent Person’s findings are presented have not materially modified from the original market announcement.
For
per
sona
l use
onl
y

AUDITORS INDEPENDENCE DECLARATION
23
For
per
sona
l use
onl
y

STATEMENT OF PROFIT OR LOSS AND OTHER COMPREHENSIVE INCOME FOR THE YEAR ENDED 30 JUNE 2015
24
Consolidated
Note 2015
$ 2014
$ Interest income 2 11,054 43,943 Gain from sale of tenements 2 100,000 Other income 2 630,064 2,002 Accounting fees (61,615) (135,250) Audit fees (44,937) (35,258) Depreciation and amortisation (54,473) (65,749) Directors’ remuneration (143,263) (449,590) Employee benefits expense (400,444) (689,617) Stock exchange and registry fees (40,774) (44,968) Corporate social responsibility (19,584) (28,740) Tenement management fees - (6,304) Costs associated with Zambian Copper Project - (26,159) Impairment of exploration costs 8 (3,938,589) (596,434) Other expenses 2 (391,343) (756,847) Loss before income tax expense (4,353,904) (2,788,971)Income tax expense 3 - - Net loss for the year
(4,353,904)
(2,788,971)
Other comprehensive income / (loss) Items that may be reclassified to profit or loss Exchange difference on translation of foreign operations 87,509 (396,731) Total comprehensive loss for the year (4,266,395) (3,185,702) Earnings per share Basic loss per share (cents) 5 (1.35) (1.29)Diluted earnings per share (cents) 5 (1.35) (1.29)
The accompanying notes form part of this financial statement.
For
per
sona
l use
onl
y
STATEMENT OF FINANCIAL POSITION AS AT 30 JUNE 2015
25
Consolidated
Note 2015
$ 2014
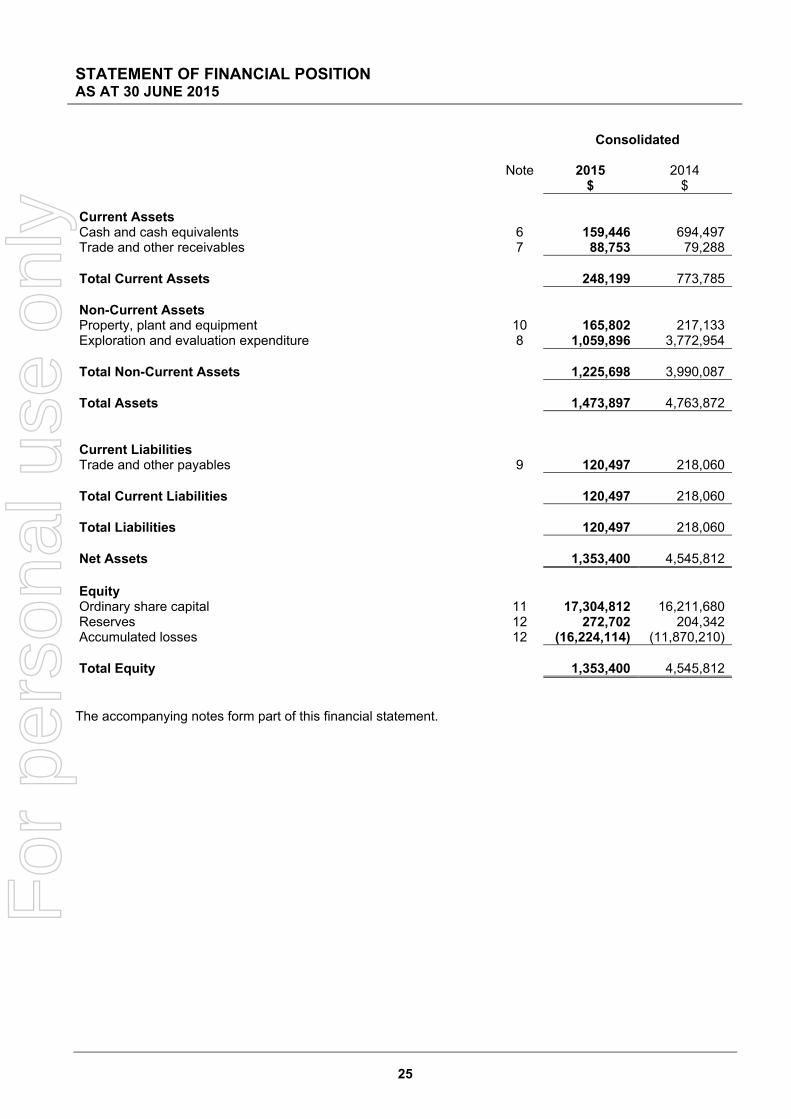
$ Current Assets Cash and cash equivalents 6 159,446 694,497Trade and other receivables 7 88,753 79,288 Total Current Assets 248,199 773,785 Non-Current Assets Property, plant and equipment 10 165,802 217,133Exploration and evaluation expenditure 8 1,059,896 3,772,954 Total Non-Current Assets 1,225,698 3,990,087 Total Assets 1,473,897 4,763,872 Current Liabilities Trade and other payables 9 120,497 218,060 Total Current Liabilities 120,497 218,060 Total Liabilities 120,497 218,060 Net Assets 1,353,400 4,545,812 Equity Ordinary share capital 11 17,304,812 16,211,680Reserves 12 272,702 204,342Accumulated losses 12 (16,224,114) (11,870,210) Total Equity 1,353,400 4,545,812
The accompanying notes form part of this financial statement.
For
per
sona
l use
onl
y
STATEMENT OF CHANGES IN EQUITY FOR THE YEAR ENDED 30 JUNE 2015
26
Consolidated
Ordinary share capital
$ Reserves
$
Accumulated losses
$ Total
$ 1 July 2013
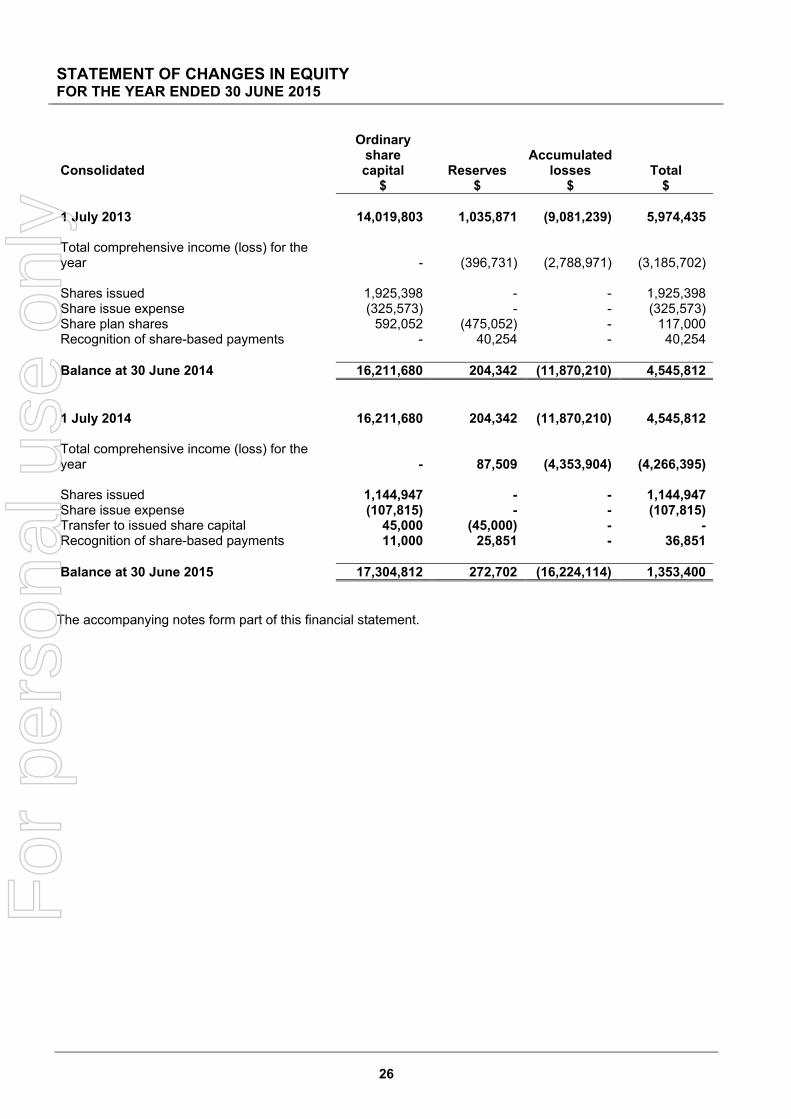
14,019,803 1,035,871 (9,081,239) 5,974,435
Total comprehensive income (loss) for the year - (396,731) (2,788,971) (3,185,702) Shares issued 1,925,398 - - 1,925,398Share issue expense (325,573) - - (325,573)Share plan shares 592,052 (475,052) - 117,000Recognition of share-based payments - 40,254 - 40,254 Balance at 30 June 2014 16,211,680 204,342 (11,870,210) 4,545,812 1 July 2014
16,211,680 204,342 (11,870,210) 4,545,812
Total comprehensive income (loss) for the year - 87,509 (4,353,904) (4,266,395) Shares issued 1,144,947 - - 1,144,947Share issue expense (107,815) - - (107,815)Transfer to issued share capital 45,000 (45,000) - -Recognition of share-based payments 11,000 25,851 - 36,851 Balance at 30 June 2015 17,304,812 272,702 (16,224,114) 1,353,400
The accompanying notes form part of this financial statement.
For
per
sona
l use
onl
y

STATEMENT OF CASH FLOWS FOR THE YEAR ENDED 30 JUNE 2015
27
Consolidated
Note 2015
$
2014 $
Cash flows from operating activities Payments to suppliers and employees (742,214) (1,787,420)Exploration overheads (403,401) (630,641)Proceeds from farm in option 626,246 -Interest received 11,307 43,496GST received 17,385 116,618Interest paid - (164)Net cash (used in) operating activities 6 (490,677) (2,258,111) Cash flows from investing activities Purchase of plant and equipment (560) (127,072)Proceeds from sale of plant and equipment 1,068 -Proceeds from sale of prospects 196,253 -Exploration & evaluation expenditure (1,269,161) (1,448,713)Net cash (used in) investing activities (1,072,400) (1,575,785) Cash flows from financing activities Proceeds from issue of shares 1,144,947 4,405,191Payment of capital raising costs (107,816) (325,573)Net cash provided by financing activities 1,037,131 4,079,618 Net increase/(decrease) in cash held (525,946) 245,722 Cash at beginning of the financial year 694,497 456,885
Effect of exchange fluctuations on cash held (9,105) (8,110)
Cash at end of the financial year 6 159,446 694,497
The accompanying notes form part of this financial statement.
For
per
sona
l use
onl
y

NOTES TO THE FINANCIAL STATEMENTS FOR THE YEAR ENDED 30 JUNE 2015
28
1. SUMMARY OF SIGNIFICANT ACCOUNTING POLICIES (a) Basis of Preparation The financial report is a general purpose financial report, which has been prepared in accordance with the requirements of the Corporations Act 2001, Accounting Standards and Interpretations and complies with other requirements of the law.
The accounting policies detailed below have been consistently applied to all of the years presented unless otherwise stated. The financial statements are for the consolidated entity of Chrysalis Resources Limited and its subsidiaries.
The financial report has also been prepared on a historical cost basis. Cost is based on the fair values of the consideration given in exchange for assets.
The financial report is presented in Australian dollars. The Company is a listed company incorporated in Australia and operating in Australia and the Republic of Zambia. The Group’s principal activities are the exploration for mineral resources. The Company is a for profit entity.
Where appropriate prior year disclosures have been reclassified for consistency with current year classifications. The re-classification has not impacted the net profit / (loss) for the prior year. (b) Adoption of new and revised standards Standards and Interpretations applicable to 30 June 2015 In the year ended 30 June 2015, the Directors have reviewed all the new and revised standards and interpretations issued by the AASB that are relevant to the Group’s operations and effective for the current annual reporting period.
As a result of this review, the directors have determined that there is no material impact of the new and revised Standards and Interpretations on the Company and, therefore, no material change is necessary to Group accounting policies.
Standards and Interpretations in issue not yet adopted The Directors have also reviewed all new Standards and Interpretations that have been issued but are not yet effective for the year ended 30 June 2015. As a result of this review the directors have determined that there is no material impact, of the new and revised Standards and Interpretations on the Group and, therefore, no change is necessary to Group accounting policies. (c) Statement of Compliance The financial report was authorised for issue on 14 September 2015.
The financial report complies with Australian Accounting Standards, which include Australian equivalents to International Financial Reporting Standards (“AIFRS”). Compliance with AIFRS ensures that the financial information, comprising the financial statements and notes thereto, comply with International Financial Reporting Standards (IFRS). (d) Basis of consolidation The consolidated financial statements incorporate the assets and liabilities of all subsidiaries of Chrysalis Resources Limited (“Company”) as at 30 June 2015 and the results of all subsidiaries for the year then ended. Chrysalis Resources Limited and its subsidiaries are referred to in this financial report as the Group or consolidated entity.
The financial statements of the subsidiaries are prepared for the same reporting period as the parent entity, using consistent accounting policies.
In preparing the consolidated financial statements, all intercompany balances and transactions, income and expenses and profit and losses resulting from intra-group transactions have been eliminated in full.
Subsidiaries are fully consolidated from the date on which control is transferred to the Group and cease to be consolidated from the date on which control is transferred out of the Group. Control exists where the Company has the power to govern the financial and operating policies of an entity so as to obtain benefits from its activities. The existence and effect of potential voting rights that are currently exercisable or convertible are considered when assessing when the Group controls another entity.
For
per
sona
l use
onl
y

NOTES TO THE FINANCIAL STATEMENTS (continued) FOR THE YEAR ENDED 30 JUNE 2015
29
Unrealised gains or transactions between the Group and its associates are eliminated to the extent of the Group’s interests in the associates. Unrealised losses are also eliminated unless the transaction provides evidence of an impairment of the asset transferred.
Non-controlling interests represent the portion of profit or loss and net assets in subsidiaries not held by the Group and are presented separately in the Statement of Profit or Loss and Other Comprehensive Income and within equity in the Consolidated Statement of Financial Position. Losses are attributed to the non-controlling interests even if that results in a deficit balance.
The Group treats transactions with non-controlling interests that do not result in a loss of control as transactions with equity owners of the Group. A change in ownership interest results in an adjustment between the carrying amounts of the controlling and non-controlling interests to reflect their relative interests in the subsidiary. Any difference between the amount of the adjustment to the non-controlling interests and any consideration paid or received is recognised within equity attributable to owners of Chrysalis Resources Limited.
When the Group ceases to have control, joint control or significant influence, any retained interest in the entity is remeasured to its fair value with the change in carrying amount recognised in profit or loss. The fair value is the initial carrying amount for the purposes of subsequently accounting for the retained interest as an associated, joint controlled entity or financial asset. In addition, any amounts previously recognised in other comprehensive income in respect of that entity are accounted for as if the Group had directly disposed of the related assets or liabilities. This may mean that amounts previously recognised in other comprehensive income are reclassified to profit or loss. (e) Critical accounting judgements and key sources of estimation uncertainty The application of accounting policies requires the use of judgements, estimates and assumptions about carrying values of assets and liabilities that are not readily apparent from other sources. The estimates and associated assumptions are based on historical experience and other factors that are considered to be relevant. Actual results may differ from these estimates.
The estimates and underlying assumptions are reviewed on an ongoing basis. Revisions are recognised in the period in which the estimate is revised if it affects only that period or in the period of the revision and future periods if the revision affects both current and future periods.
Share-based payment transactions: The Group measures the cost of equity-settled transactions with employees and consultants by reference to the fair value of the equity instruments at the date at which they are granted. The fair value of options and share plan shares with limited recourse loans where applicable is determined by using a Black and Scholes model, using the assumptions detailed in Note 13.
Exploration and evaluation costs carried forward The Group assesses impairment at each reporting date by evaluating conditions specific to the Group that may lead to impairment of assets. Where an impairment trigger exists, the recoverable amount of the asset is determined. Value-in-use calculations performed in assessing recoverable amounts incorporate a number of key estimates. The ultimate recoupment of value is dependent on the successful development and commercial exploitation or sale of the respective areas.
The recoverability of the carrying amount of exploration and evaluation costs carried forward has been reviewed by the directors and an impairment expense of $3,938,589 has been recognised in the Statement of Profit or Loss and Other Comprehensive Income in relation to the Zambian projects, Shikila, Kabwima North, Bulala Hills and Mwongo. Please refer to Note 8 for more details. (f) Foreign currency translation Both the functional and presentation currency of the Company and its Australian controlled entity is Australian dollars (A$). Each entity in the Group determines its own functional currency and items included in the financial statements of each entity are measured using that functional currency.
The functional currency of the foreign operations is Zambian Kwacha (KWA).
Transactions in foreign currencies are initially recorded in the functional currency by applying the exchange rates ruling at the date of the transaction. Monetary assets and liabilities denominated in foreign currencies are retranslated at the rate of exchange ruling at the balance date.
All exchange differences in the consolidated financial report are taken to profit or loss with the exception of differences on foreign currency borrowings that provide a hedge against a net investment in a foreign entity.
For
per
sona
l use
onl
y

NOTES TO THE FINANCIAL STATEMENTS (continued) FOR THE YEAR ENDED 30 JUNE 2015
30
These are taken directly to equity until the disposal of the net investment, at which time they are recognised in profit or loss.
Tax charges and credits attributable to exchange differences on those borrowings are also recognised in equity.
As at the reporting date the assets and liabilities of these subsidiaries are translated into their presentation currency of the Group at the rate of exchange ruling at the balance date and their Statements of Profit or Loss and Other Comprehensive Income are translated at the weighted average exchange rate for the year.
The exchange differences arising on the translation are taken directly to a separate component of equity.
On disposal of a foreign entity, the deferred cumulative amount recognised in equity relating to that particular foreign operation is recognised in profit or loss. (g) Going Concern The Directors have prepared the financial statements on a going concern basis which contemplates the realisation of assets and payment of liabilities in the normal course of business. The Group currently has a short-term unsecured borrowing facility in place of up to $200,000 to complete the Peppermint transaction pursuant to the binding term sheet between the Company and Peppermint dated 20 May 2015. The Group incurred a loss for the year ended 30 June 2015 of $4,353,904 with net cash outflow from operating and investing activities of $1,563,077. The Group has a net cash balance at 30 June 2015 of $159,446. The Company successfully raised capital of $1,144,947 (before costs) in the period and will be required to raise additional capital in order to meet its budgeted expenditure for the next 12 months.
As at the date of this report, no firm funding facilities are in place. Chrysalis will undertake a capital raising under a prospectus to raise sufficient funds to meet the ASX Chapter 1 and 2 readmission requirements and deliver the business plan and objectives of Peppermint in connection with its readmission. The current estimated funding required is A$3,500,000. The majority of the funds will be used to establish and expand the existing Peppermint subscriber base.
Should the Group be unable to raise the required funding, there is a material uncertainty that may cast significant doubt on whether the Group will be able to continue as a going concern and therefore, whether it will be able to realise its assets and extinguish its liabilities in the normal course of business and at the amounts stated in the financial report.
The Directors continue to manage the Group’s activities with due regard to current and future funding requirements. On this basis, the Directors believe the financial statements should be prepared on a going concern basis. (h) Segment Reporting Operating segments are reported in a manner consistent with the internal reporting provided to the chief operating decision maker. The chief operating decision maker, who is responsible for allocating resources and assessing performance of the operating segments, has been identified as the Board of Directors of Chrysalis Resources Ltd.
During the financial year, the Group operated in the mineral exploration industry within Australia and Zambia. (i) Interest income Interest revenue is recognised as it accrues, taking into account the effective yield on the financial asset. (j) Government grants Grants from the government are recognised at their fair value where there is a reasonable assurance that the grant will be received and the group will comply with all the attached conditions.
Government grants relating to costs are deferred and recognised in the statement of financial position over the period necessary to match them with the direct costs that they are intended to compensate. (k) Income Tax Current tax assets and liabilities for the current period are measured at the amount expected to be recovered from or paid to the taxation authorities. The tax rates and tax laws used to compute the amount are those that are enacted or substantively enacted by the balance date.
Deferred income tax is provided on all temporary differences at the balance date between the tax bases of assets and liabilities and their carrying amounts for financial reporting purposes.
For
per
sona
l use
onl
y

NOTES TO THE FINANCIAL STATEMENTS (continued) FOR THE YEAR ENDED 30 JUNE 2015
31
Deferred income tax liabilities are recognised for all taxable temporary differences except:
• when the deferred income tax liability arises from the initial recognition of goodwill or of an asset or liability in a transaction that is not a business combination and that, at the time of the transaction, affects neither the accounting profit nor taxable profit or loss; or
• when the taxable temporary difference is associated with investments in subsidiaries, associates or interests in joint ventures, and the timing of the reversal of the temporary difference can be controlled and it is probable that the temporary difference will not reverse in the foreseeable future.
Deferred income tax assets are recognised for all deductible temporary differences, carry forward of unused tax assets and unused tax losses, to the extent that it is probable that taxable profit will be available against which the deductible temporary differences and the carry-forward of unused tax credits and unused tax losses can be utilised, except:
• when the deferred income tax asset relating to the deductible temporary difference arises from the initial recognition of an asset or liability in a transaction that is not a business combination and, at the time of the transaction, affects neither the accounting profit nor taxable profit or loss; or
• when the deductible temporary difference is associated with investments in subsidiaries, associates or interests in joint ventures, in which case a deferred tax asset is only recognised to the extent that it is probably that the temporary difference will reverse in the foreseeable future and taxable profit will be available against which the temporary difference can be utilised.
The carrying amount of deferred income tax assets is reviewed at each balance date and reduced to the extent that it is no longer probable that sufficient taxable profit will be available to allow all or part of the deferred income tax asset to be utilised.
Unrecognised deferred income tax assets are reassessed at each balance date and are recognised to the extent that it has become probable that future taxable profit will allow the deferred tax asset to be recovered.
Deferred income tax assets and liabilities are measured at the tax rates that are expected to apply to the year when the asset is realised or the liability is settled, based on tax rates (and tax laws) that have been enacted or substantively enacted at the balance date.
Income taxes relating to items recognised directly in equity are recognised in equity and not in profit or loss.
Deferred tax assets and deferred tax liabilities are offset only if a legally enforceable right exists to set off current tax assets against current tax liabilities and the deferred tax assets and liabilities relate to the same taxable entity and the same taxation authority. (l) Goods and services tax (“GST”) and Value Added Tax (“VAT”) Revenues, expenses and assets are recognised net of the amount of GST and VAT except:
• when the GST or VAT incurred on a purchase of goods and services is not recoverable from the taxation authority, in which case the GST or VAT is recognised as part of the cost of acquisition of the asset or as part of the expense item as applicable; and
• receivables and payables, which are stated with the amount of GST or VAT included.
The net amount of GST or VAT recoverable from, or payable to, the taxation authority is included as part of receivables or payables in the statement of financial position.
Cash flows are included in the Statement of Cash Flows on a gross basis and the GST or VAT component of cash flows arising from investing and financing activities, which is recoverable from, or payable to, the taxation authority are classified as operating cash flows.
Commitments and contingencies are disclosed net of the amount of GST or VAT recoverable from, or payable to, the taxation authority.
For
per
sona
l use
onl
y

NOTES TO THE FINANCIAL STATEMENTS (continued) FOR THE YEAR ENDED 30 JUNE 2015
32
(m) Impairment of assets The Group assesses at each reporting date whether there is an indication that an asset may be impaired. If any such indication exists, or when annual impairment testing for an asset is required, the Group makes an estimate of the asset’s recoverable amount. An asset’s recoverable amount is the higher of its fair value less costs to sell and its value in use and is determined for an individual asset, unless the asset does not generate cash inflows that are largely independent of those from other assets or groups of assets and the asset's value in use cannot be estimated to be close to its fair value. In such cases the asset is tested for impairment as part of the cash-generating unit to which it belongs. When the carrying amount of an asset or cash-generating unit exceeds its recoverable amount, the asset or cash-generating unit is considered impaired and is written down to its recoverable amount.
In assessing value in use, the estimated future cash flows are discounted to their present value using a pre-tax discount rate that reflects current market assessments of the time value of money and the risks specific to the asset. Impairment losses relating to continuing operations are recognised in those expense categories consistent with the function of the impaired asset unless the asset is carried at re-valued amount (in which case the impairment loss is treated as a revaluation decrease).
An assessment is also made at each reporting date as to whether there is any indication that previously recognised impairment losses may no longer exist or may have decreased. If such indication exists, the recoverable amount is estimated. A previously recognised impairment loss is reversed only if there has been a change in the estimates used to determine the asset’s recoverable amount since the last impairment loss was recognised. If that is the case the carrying amount of the asset is increased to its recoverable amount. That increased amount cannot exceed the carrying amount that would have been determined, net of depreciation, had no impairment loss been recognised for the asset in prior years. Such reversal is recognised in the profit or loss unless the asset is carried at re-valued amount, in which case the reversal is treated as a revaluation increase. After such a reversal the depreciation charge is adjusted in future periods to allocate the asset’s revised carrying amount, less any residual value, on a systematic basis over its remaining useful life. (n) Cash and cash equivalents Cash comprises cash at bank and on hand. Cash equivalents are short term, highly liquid investments that are readily convertible to known amounts of cash and which are subject to an insignificant risk of changes in value. Bank overdrafts are shown within borrowings in current liabilities in the Statement of Financial Position.
For the purposes of the Statement of Cash Flows, cash and cash equivalents consist of cash and cash equivalents as defined above, net of outstanding bank overdrafts. (o) Trade and other receivables Trade receivables are measured on initial recognition at fair value and are subsequently measured at amortised cost using the effective interest rate method, less any allowance for impairment. Trade receivables are generally due for settlement within periods ranging from 15 days to 30 days.
Impairment of trade receivables is continually reviewed and those that are considered to be uncollectible are written off by reducing the carrying amount directly. An allowance account is used when there is objective evidence that the Group will not be able to collect all amounts due according to the original contractual terms. Factors considered by the Group in making this determination include known significant financial difficulties of the debtor, review of financial information and significant delinquency in making contractual payments to the Group.
The impairment allowance is set equal to the difference between the carrying amount of the receivable and the present value of estimated future cash flows, discounted at the original effective interest rate. Where receivables are short-term discounting is not applied in determining the allowance.
The amount of the impairment loss is recognised in the Statement of Profit or Loss and Other Comprehensive Income within other expenses. When a trade receivable for which an impairment allowance had been recognised becomes uncollectible in a subsequent period, it is written off in the allowance account. Subsequent recoveries of amounts previously written off are credited against other expenses in the Statement of Profit or Loss and Other Comprehensive Income.
For
per
sona
l use
onl
y

NOTES TO THE FINANCIAL STATEMENTS (continued) FOR THE YEAR ENDED 30 JUNE 2015
33
(p) Financial assets Financial assets in the scope of AASB 139 Financial Instruments: Recognition and Measurement are classified as either financial assets at fair value through profit or loss, loans and receivables, held-to-maturity investments, or available-for-sale investments, as appropriate. When financial assets are recognised initially, they are measured at fair value, plus, in the case of investments not at fair value through profit or loss, directly attributable transaction costs. The Group determines the classification of its financial assets after initial recognition and, when allowed and appropriate, re-evaluates this designation at each financial year-end. All regular way purchases and sales of financial assets are recognised on the trade date i.e. the date that the Group commits to purchase the asset. Regular way purchases or sales are purchases or sales of financial assets under contracts that require delivery of the assets within the period established generally by regulation or convention in the marketplace.
Recognition Financial instruments are initially measured at cost on trade date, which includes transaction costs, when the related contractual rights or obligations exist. Subsequent to initial recognition these instruments are classified as "financial assets at fair value through profit and loss" as they are acquired principally for the purpose of selling in the short term. Realised and unrealised gains and losses arising from changes in the fair value of these assets are included in the Statement of Profit or Loss and Other Comprehensive Income in the period in which they arise.
Fair value Fair value is determined based on current bid prices for all quoted investments. Valuation techniques are applied to determine the fair value for all unlisted securities, including recent arm’s length transactions, reference to similar instruments and option pricing models.
Impairment At each reporting date, the directors assesses whether there is objective evidence that a financial instrument has been impaired. Impairment losses are recognised in the Statement of Profit or Loss and Other Comprehensive Income.
Loans and receivables Loans and receivables are non-derivative financial assets with fixed or determinable payments that are not quoted in an active market. Such assets are carried at amortised cost using the effective interest method. Gains and losses are recognised in the Statement of Profit or Loss and Other Comprehensive Income when the loans and receivables are derecognised or impaired, as well as through the amortisation process. (q) Impairment of financial assets The Company assesses at each balance date whether a financial asset or group of assets is impaired.
(i) Financial assets carried at amortised cost If there is objective evidence that an impairment loss on loans and receivables carried at amortised cost has been incurred, the amount of the loss is measured as the difference between the asset’s carrying amount and the present value of estimated future cash flows (excluding future credit losses that have not been incurred) discounted at the financial asset’s original effective interest rate (i.e. the effective interest rate computed at initial recognition). The carrying amount of the asset is reduced either directly or through use of an allowance account. The amount of the loss is recognised in profit or loss.
The Group first assesses whether objective evidence of impairment exists individually for financial assets that are individually significant, and individually or collectively for financial assets that are not individually significant. If it is determined that no objective evidence of impairment exists for an individually assessed financial asset, whether significant or not, the asset is included in a group of financial assets with similar credit risk characteristics and that group of financial assets is collectively assessed for impairment. Assets that are individually assessed for impairment and for which an impairment loss is or continues to be recognised are not included in a collective assessment of impairment.
If, in a subsequent period, the amount of the impairment loss decreases and the decrease can be related objectively to an event occurring after the impairment was recognised, the previously recognised impairment loss is reversed. Any subsequent reversal of an impairment loss is recognised in profit or loss, to the extent that the carrying value of the asset does not exceed its amortised cost at the reversal date.
For
per
sona
l use
onl
y

NOTES TO THE FINANCIAL STATEMENTS (continued) FOR THE YEAR ENDED 30 JUNE 2015
34
(ii) Financial assets carried at cost If there is objective evidence that an impairment loss has been incurred on an unquoted equity instrument that is not carried at fair value (because its fair value cannot be reliably measured), or on a derivative asset that is linked to and must be settled by delivery of such an unquoted equity instrument, the amount of the loss is measured as the difference between the asset’s carrying amount and the present value of estimated future cash flows, discounted at the current market rate of return for a similar financial asset. (r) Property, plant and equipment Plant and equipment is stated at cost less accumulated depreciation and any accumulated impairment losses. Such cost includes the cost of replacing parts that are eligible for capitalisation when the cost of replacing the parts is incurred. Similarly, when each major inspection is performed, its cost is recognised in the carrying amount of the plant and equipment as a replacement only if it is eligible for capitalisation.
Land and buildings are measured at fair value less accumulated depreciation on buildings and less any impairment losses recognised after the date of revaluation. Depreciation is calculated over the estimated useful life of the assets as follows: Plant and equipment (tangible) – over 3 to 20 years (diminishing value basis) Plant and equipment (intangible) – over 5 to 20 years (straight line basis) The assets’ residual values, useful lives and amortisation methods are reviewed, and adjusted if appropriate, at each financial year end.
Impairment The carrying values of plant and equipment are reviewed for impairment at each balance date, with recoverable amount being estimated when events or changes in circumstances indicate that the carrying value may be impaired. The recoverable amount of plant and equipment is the higher of fair value less cost to sell and value in use. In assessing value in use, the estimated future cash flows are discounted to their present value using a pre-tax discount rate that reflects current market assessments of the time value of money and the risks specific to the asset.
Impairment exists when the carrying value of an asset or cash-generating units exceeds its estimated recoverable amount. The asset or cash-generating unit is then written down to its recoverable amount. For plant and equipment, impairment losses are recognised in the Statement of Profit or Loss and Other Comprehensive Income in the cost of sales line item.
(i) De-recognition and disposal. An item of property, plant and equipment is derecognised upon disposal or when no further future economic benefits are expected from its use or disposal. Any gain or loss arising on de-recognition of the asset (calculated as the difference between the net disposal proceeds and the carrying amount of the asset) is included in the Statement of Profit or Loss and Other Comprehensive Income in the year the asset is derecognised. (s) Trade and other payables Trade payables and other payables are carried at amortised cost and represent liabilities for goods and services provided to the Group prior to the end of the financial year that are unpaid and arise when the Group becomes obliged to make future payments in respect of the purchase of these goods and services. Trade and other payables are presented as current liabilities unless payment is not due within 12 months. (t) Interest-bearing loans and borrowings Borrowings are initially recognised at fair value, net of transaction costs incurred. Borrowings are subsequently measured at amortised cost. Any difference between the proceeds (net of transaction costs) and the redemption amount is recognised in profit or loss over the period of the borrowings using the effective interest method. Fees paid on the establishment of loan facilities are recognised as transaction costs of the loan to the extent that it is probable that some or all of the facility will be drawn down. In this case, the fee is deferred until the draw down occurs.
Borrowings are initially recognised at fair value, net of transaction costs incurred. Borrowings are subsequently measured at amortised cost. Any difference between the proceeds (net of transaction costs) and the redemption amount is recognised in profit or loss over the period of the borrowings using the effective interest method. Fees paid on the establishment of loan facilities are recognised as transaction costs of the loan to the extent that it is probable that some or all of the facility will be drawn down. In this case, the fee is deferred until the draw down occurs.
For
per
sona
l use
onl
y

NOTES TO THE FINANCIAL STATEMENTS (continued) FOR THE YEAR ENDED 30 JUNE 2015
35
To the extent there is no evidence that it is probable that some or all of the facility will be drawn down, the fee is capitalised as a prepayment for liquidity services and amortised over the period of the facility to which it relates. The fair value of the liability portion of a convertible note is determined using a market interest rate for an equivalent non-convertible note. This amount is recorded as a liability on an amortised cost basis until extinguished on conversion or maturity of the note. The remainder of the proceeds is allocated to the conversion option. This is recognised and included in shareholders’ equity, net of income tax effects.
Borrowings are removed from the Statement of Financial Position when the obligation specified in the contract is discharged, cancelled or expired. The difference between the carrying amount of a financial liability that has been extinguished or transferred to another party and the consideration paid, including any non-cash assets transferred or liabilities assumed, is recognised in profit or loss as other income or finance costs. Borrowings are classified as current liabilities unless the Group has an unconditional right to defer settlement of the liability for at least 12 months after the reporting period. (u) Provisions Provisions are recognised when the Group has a present obligation (legal or constructive) as a result of a past event, it is probable that an outflow of resources embodying economic benefits will be required to settle the obligation and a reliable estimate can be made of the amount of the obligation. Provisions are not recognised for future operating losses.
When the Group expects some or all of a provision to be reimbursed, for example under an insurance contract, the reimbursement is recognised as a separate asset but only when the reimbursement is virtually certain. The expense relating to any provision is presented in the Statement of Profit or Loss and Other Comprehensive Income net of any reimbursement.
Provisions are measured at the present value or management’s best estimate of the expenditure required to settle the present obligation at the end of the reporting period. If the effect of the time value of money is material, provisions are discounted using a current pre-tax rate that reflects the risks specific to the liability. When discounting is used, the increase in the provision due to the passage of time is recognised as a borrowing cost. (v) Employee leave benefits
(i) Wages, salaries, annual leave and sick leave Liabilities for wages and salaries, including non-monetary benefits of annual leave expected to be settled within 12 months of the balance date are recognised in other payables in respect of employees’ services up to the balance date. They are measured at the amounts expected to be paid when the liabilities are settled. Liabilities for non-accumulating sick leave are recognised when the leave is taken and are measured at the rates paid or payable.
(ii) Long service leave The liability for long service leave is recognised in the provision for employee benefits where required and measured as the present value of expected future payments to be made in respect of services provided by employees up to the balance date. Consideration is given to expected future wage and salary levels, experience of employee departures, and period of service. Expected future payments are discounted using market yields at the balance date on national government bonds with terms to maturity and currencies that match, as closely as possible, the estimated future cash outflows. (w) Share-based payment transactions
(i) Equity settled transactions: The Group provides benefits to employees (including senior executives) of the Group in the form of share-based payments, whereby employees render services in exchange for shares or rights over shares (equity-settled transactions). There is currently one plan in place to provide these benefits, being the Employee Share Plan (ESP).
The cost of these equity-settled transactions with employees is measured by reference to the fair value of the equity instruments at the date at which they are granted. The fair value is determined using the Black Scholes model, further details of which are given in Note 13.
In valuing equity settled transactions, no account is taken of any performance conditions, other than conditions linked to the price of the shares of the Company (market conditions) if applicable.
For
per
sona
l use
onl
y
NOTES TO THE FINANCIAL STATEMENTS (continued) FOR THE YEAR ENDED 30 JUNE 2015
36
The cost of the equity-settled transactions is recognised, together with a corresponding increase in equity, over the period in which the performance and/or service conditions are fulfilled, ending on the date on which the relevant employees become fully entitled to the award (the vesting period).
The cumulative expense recognised for equity-settled transactions at each balance date until vesting date reflects (i) the extent to which the vesting period has expired and (ii) the Group’s best estimate of the number of equity instruments that will ultimately vest. No adjustment is made for the likelihood of market performance conditions being met as the effect of these conditions is included in the determination of the fair value at grant date. The Statement of Profit or Loss and Other Comprehensive Income charge or credit for a period represents the movement in the cumulative expense recognised as at the beginning and end of that period.
No expense is recognised for awards that do not ultimately vest, except for awards where vesting is only conditional upon a market condition.
If the terms of an equity-settled award are modified, as a minimum an expense is recognised as if the terms had not been modified. In addition, an expense is recognised for any modification that increases the total fair value of the share-based payment arrangement, or is otherwise beneficial to the employee, as measured at the date of modification.
If an equity-settled award is cancelled, it is treated as if it had vested on the date of cancellation, and any expense not yet recognised for the award is recognised immediately. However, if a new award is substituted for the cancelled award and designated as a replacement award on the date that it is granted, the cancelled and new award are treated as if they were a modification of the original award, as described in the previous paragraph.
The dilutive effect, if any, of outstanding options is reflected as additional share dilution in the computation of earnings per share. (x) Ordinary share capital Ordinary shares are classified as equity. Incremental costs directly attributable to the issue of new shares or options are shown in equity as a deduction, net of tax, from the proceeds. Incremental costs directly attributable to the issue of new shares or options for the acquisition of a new business are not included in the cost of acquisition as part of the purchase consideration. (y) Earnings per share Basic earnings per share is calculated as net profit or loss attributable to members of the Company, adjusted to exclude any costs of servicing equity (other than dividends) and preference share dividends, divided by the weighted average number of ordinary shares, adjusted for any bonus element.
Diluted earnings per share are calculated as net profit or loss attributable to members of the Company, adjusted for: • costs of servicing equity (other than dividends) and preference share dividends; • the after tax effect of dividends and interest associated with dilutive potential ordinary shares that have
been recognised as expenses; and • other non-discretionary changes in revenues or expenses during the period that would result from the
dilution of potential ordinary shares; divided by the weighted average number of ordinary shares and dilutive potential ordinary shares, adjusted for any bonus element.
(z) Exploration and evaluation expenditure Exploration and evaluation expenditures in relation to each separate area of interest, is recognised as an exploration and evaluation asset in the year in which they are incurred where the following conditions are satisfied:
(i) the rights to tenure of the area of interest are current; and
(ii) at least one of the following conditions is also met:
• the exploration and evaluation expenditures are expected to be recouped through successful development and exploitation of the area of interest, or alternatively, by its sale; or
• exploration and evaluation activities in the area of interest have not, at the reporting date, reached a stage which permits a reasonable assessment of the existence, or otherwise, of economically recoverable reserves and active and significant operations in, or in relation to, the area of interest are continuing.
For
per
sona
l use
onl
y

NOTES TO THE FINANCIAL STATEMENTS (continued) FOR THE YEAR ENDED 30 JUNE 2015
37
Exploration and evaluation assets are initially measured at cost and include acquisition of rights to explore, studies, exploratory drilling, trenching and sampling and associated activities and an allocation of depreciation and amortised assets used in exploration and evaluation activities. General and administrative costs are only included in the measurement of exploration and evaluation costs where they are related directly to operational activities in a particular area of interest.
Exploration and evaluation expenditure is assessed for impairment when facts and circumstances suggest that their carrying amount exceeds their recoverable amount and where this is the case an impairment loss is recognised. Should a project or area of interest be abandoned, the expenditure will be written off in the period in which the decision is made. Where a decision is made to proceed with development, accumulated expenditure will be amortised over the life of the reserves associated with the area of interest once mining operations have commenced.
Where a decision has been made to proceed with development in respect of a particular area of interest, the relevant exploration and evaluation asset is tested for impairment and the balance is then reclassified to development. (aa) Parent entity financial information The financial information for the parent entity, Chrysalis Resources Limited, disclosed in Note 21 has been prepared on the same basis as the consolidated financial statements, except as set out below.
(i) Investments in subsidiaries, associates and joint venture entities Investments in subsidiaries, associates and joint venture entities are accounted for at cost in the parent entity financial statements of Chrysalis Resources Limited. Dividends received from associates are recognised in the parent entity’s profit or loss, rather than being deducted from the carrying amount of these investments.
(ii) Share-based payments The grant by the Company of options over its equity instruments to the employees of subsidiary undertakings in the group is treated as a capital contribution to that subsidiary undertaking. The fair value of employee services received, measured by reference to the grant date fair value, is recognised over the vesting period as an increase to investment in subsidiary undertakings, with a corresponding credit to equity. (ab) Interests in joint operations A joint operation is a joint arrangement whereby the parties that have joint control of the arrangement have rights to the assets, and obligations for the liabilities, relating to the arrangement. Joint control is the contractually agreed sharing of control of an arrangement, which exists only when decisions about the relevant activities require unanimous consent of the parties sharing control.
When a group entity undertakes its activities under joint operations, the Group as a joint operator recognises in relation to its interests a joint operation:
• Its assets, including its share of any assets held jointly; • Its liabilities, including its share of any liabilities incurred jointly; • Its revenue from the sale of its share of the output arising from the joint operation; • Its share of the revenue from the sale of the output by the joint operation; and • Its expenses, including its share of any expenses incurred jointly.
The Group accounts for the assets, liabilities, revenues and expenses relating to its interest in a joint operation in accordance with AASBs applicable to the particular assets, liabilities, revenues and expenses.
When a group entity transacts with a joint operation in which a group entity is a joint operator (such as a sale or contribution of assets), the Group is considered to be conducting the transaction with the other parties to the joint operation, and gains and losses resulting from the transactions are recognised in the Group’s consolidated financial statements only to the extent of other parties’ interests in the joint operation.
When a group entity transacts with a joint operation in which a group entity is a joint operator (such as a purchase of assets), the Group does not recognise its share of the gains and losses until it resells those assets to a third party.
For
per
sona
l use
onl
y

NOTES TO THE FINANCIAL STATEMENTS (continued) FOR THE YEAR ENDED 30 JUNE 2015
38
2. REVENUE AND EXPENSES Consolidated 2015 2014 $ $ (a) Revenue Bank interest Sale of Tenements Other Income1
11,054 100,000 630,064
43,943 - -
(b) Expenses Travel and accommodation (13,679) (102,280) Motor vehicle expenses (33,105) (52,037) Professional fees (45,628) (152,970) Legal expense (72,720) (51,397)
Note 1: Other income includes income from FQM in Zambia of $626,246 to fund exploration across Chrysalis’ Shikila and Kabwima Projects for a 6 month period prior to earning the right to enter a two stage Earn-in phase. 3. INCOME TAX Consolidated 2015 2014 $ $ (a) Income Tax Expense The prima facie income tax expense on pre-tax accounting result from operations reconciles to the income tax expense in the financial statements as follows:
Accounting loss before tax continuing operations 4,353,904 2,788,971 Income tax benefit calculated at 30% (2014:30%) 1,306,171 836,691 Non-deductible expenses (209,226) 152,741 Non-assessable income - - Other deferred tax assets and tax liabilities not recognised (1,239,610) (1,069,452) Difference in tax rate of subsidiaries operating in other jurisdictions 142,665 80,020 Total income tax expense - - (b) Unrecognised Deferred Tax Balances The following deferred tax assets and liabilities have not been brought to account:
Deferred tax assets comprise: Losses available for offset against future taxable income – revenue 4,344,155 3,555,334 Other deferred tax balances 575,445 141,582 4,919,600 3,696,916 Deferred tax liabilities comprise: Exploration expenditure capitalised - (34,500) Other deferred tax balances (2,947) (74,934) (2,947) (109,434) (c) Income tax expense not recognised direct in equity during the year: Share-issue costs (37,026) (97,672) (37,026) (97,672)
For
per
sona
l use
onl
y

NOTES TO THE FINANCIAL STATEMENTS (continued) FOR THE YEAR ENDED 30 JUNE 2015
39
4. SEGMENT REPORTING Description of segments and related information The Group has based its operating segment on the internal reports that are reviewed and used by the board of directors in assessing performance and in determining the allocation of resources. The Group currently does not have production and is only involved in exploration. As a consequence, activities in the operating segments are identified by the Board based on the manner in which resources are allocated, the nature of the resources provided and the identity of the manager and country of expenditure. Information is reviewed on a whole of entity basis. Australia Zambia Consolidated $ $ $ Consolidated 30 June 2015 Segment revenue 114,873 626,245 741,118 Segment results (609,083) (3,744,821) (4,353,904) Segment assets 247,104 1,226,793 1,473,897 Segment liabilities (81,539) (38,958) (120,497) Capitalised expenditure 34,630 1,189,381 1,224,011 Included within segment results: Depreciation (19,675) (34,798) (54,473)Interest revenue 11,054 - 11,054 Consolidated 30 June 2014 Segment revenue 43,943 - 43,943 Segment results (1,969,957) (819,014) (2,788,971) Segment assets 828,017 3,935,855 4,763,872 Segment liabilities (147,923) (70,137) (218,060) Capitalised expenditure 241,194 1,369,947 1,611,141 Included within segment results: Depreciation (17,748) (48,001) (65,749) Interest revenue 43,943 - 43,943
5. LOSS PER SHARE (EPS) Consolidated 2015 2014 $ $ Basic loss per share (cents) (1.35) (1.29) The earnings and weighted average number of ordinary shares used in the calculation of basic earnings per share is as follows: Earnings – Net loss for the year (4,353,904) (2,788,971) Number Number Weighted average number of ordinary shares used in the calculation of basic EPS 321,958,140 216,111,055 Diluted loss per share is not disclosed as the result is anti-dilutive.
For
per
sona
l use
onl
y

NOTES TO THE FINANCIAL STATEMENTS (continued) FOR THE YEAR ENDED 30 JUNE 2015
40
6. CASH AND CASH EQUIVALENTS Consolidated 2015 2014 $ $ Cash at bank and on hand 68,823 191,366 Short-term deposits 90,623 503,131 159,446 694,497
Cash at bank earns interest at floating interest rates based on daily bank deposit rates. Short-term deposits are made for varying periods of between one day and three months, depending on the immediate cash requirements of the Group and earn interest at the respective short-term interest rates. Reconciliation of loss for the year to net cash flows used in operating activities Consolidated 2015 2014 $ $ Loss for the year (4,353,904) (2,788,971) Impairment of exploration costs 3,938,589 596,434 Loss on sale of asset (683) 14,766 Depreciation 54,473 65,749 Share-based payments 25,851 40,254 Foreign exchange (32,603) 19,574 (Increase) / decrease in prepayments & other debtors (13,757) (39,034) (Increase) / decrease in accrued interest 253 (447) (Increase) / decrease in GST recoverable 4,039 22,442 Increase / (decrease) in trade creditors (35,768) (59,622) Increase / (decrease) in other payables (77,167) (129,256) Net cash flows (used in) operating activities (490,677) (2,258,111)
7. TRADE AND OTHER RECEIVABLES Consolidated 2015 2014 $ $ Current Debtors - 6,624 Prepayments 12,852 21,245 GST receivable 6,493 10,532 Other 69,408 40,887 88,753 79,288
Due to the nature of the Group’s receivables, an ageing schedule is not presented.
For
per
sona
l use
onl
y

NOTES TO THE FINANCIAL STATEMENTS (continued) FOR THE YEAR ENDED 30 JUNE 2015
41
8. EXPLORATION AND EVALUATION EXPENDITURE Costs carried forward in respect of areas of interest in the exploration and evaluation phase:
Consolidated 2015 2014 $ $ Exploration and evaluation phase – at cost Balance at beginning of the year 3,772,954 3,304,788 Expenditure incurred 1,224,011 1,448,713 Carrying value of tenements sold (116,853) - Expenditure impaired / (written off) 1 (3,938,589) (596,434) Foreign currency translation 118,373 (384,113) Total exploration expenditure 1,059,896 3,772,954
Notes: 1. At 30 June 2015 the Company assessed the value of its exploration and evaluation assets. In light of current market
conditions and considering there are no immediate programs of works currently underway on certain projects, the carrying values of the Zambian projects, Shikila, Kabwima North, Bulala Hills and Mwongo were impaired.
2. The recoupment of costs carried forward in relation to areas of interest in the exploration and evaluation phases is dependent on the successful development and commercial exploitation or sale of the respective areas.
9. TRADE AND OTHER PAYABLES Consolidated 2015 2014
$ $ Current Trade payables 19,747 55,515 Other payables 100,750 162,545 120,497 218,060
Trade creditors are non-interest bearing and are normally settled on 30 day terms. 10. PROPERTY, PLANT AND EQUIPMENT Consolidated Furniture and
fittings Plant and equipment Motor vehicle Total
$ $ $ $ Balance at 1 July 2013 26,242 63,753 104,661 194,656 Additions 1,450 160,978 - 162,428 Depreciation charge (4,797) (51,548) (9,404) (65,749) Disposals (12,649) (45,634) - (58,283) Transfers - 33,160 (33,160) - Foreign currency differences (1,329) 20,461 (35,051) (15,919) Balance at 30 June 2014 8,917 181,170 27,046 217,133 Additions - 548 - 548Depreciation charge (2,554) (43,993) (7,926) (54,473)Disposals - - - -Transfers - - - -Foreign currency differences 121 2,065 408 2,594Balance at 30 June 2015 6,484 139,790 19,528 165,802
Consolidated 2015 2014 $ $ Cost 325,729 322,892 Accumulated depreciation (159,927) (105,759) Net carrying amount 165,802 217,133
For
per
sona
l use
onl
y

NOTES TO THE FINANCIAL STATEMENTS (continued) FOR THE YEAR ENDED 30 JUNE 2015
42
11. ORDINARY SHARE CAPITAL
(a) Ordinary share capital
Consolidated 2015 2015 2014 2014 Number $ Number $ (i) Issued and paid up capital Total Issued and paid up capital 345,484,128 17,304,812 228,989,419 16,211,680 (ii) Unissued shares Employee share plan shares 2,000,000 - 3,000,000 - Total Unissued shares 2,000,000 - 3,000,000 - Total Ordinary share capital 347,484,128 17,304,812 231,989,419 16,211,680
(b) Movement in ordinary share capital
Consolidated 2015 2015 2014 2014 Number $ Number $ (i) Issued and paid up capital Balance at the beginning of the year 228,989,419 16,211,680 157,519,564 11,657,010 Issue of shares 114,494,709 1,144,947 - - Shares issued under additional placement to EBH - - 23,575,427 1,414,526 Shares issued under ”Top-up rights” to EBH and Tiger - - 8,514,538 510,872 Transfer from unissued shares 1,000,000 45,000 39,379,890 2,362,793 Issue of shares to consultants 1,000,000 11,000 - - Costs relating to issue of shares - (107,815) - (325,573) Share plan shares - - - 592,052
Balance at end of the year 345,484,128 17,304,812 228,989,419 16,211,680 (ii) Unissued shares Balance at the beginning of the year 3,000,000 - 39,379,890 2,362,793 Unissued employee share plan shares 1 - - 3,000,000 - Transfer to issued shares (1,000,000) - (39,379,890) (2,362,793) Balance at end of the year 2,000,000 - 3,000,000 -
Notes 1. During the 2014 financial year 3,000,000 share plan shares were granted to Mr Ryan as part of his remuneration
package. (c) Movement in options Consolidated 2015 2015 2014 2014 Number $ Number $ Balance at the beginning of the year - 291,190 - 291,190 Options expired – 30 June 2015 - - - - Balance at end of the year - 291,190 - 291,190
(d) Terms and conditions of contributed equity Ordinary shares have the right to receive dividends as declared and, in the event of winding up the Company, to participate in proceeds from the sale of all surplus assets in proportion to the number of and amounts paid up on shares held.
Ordinary shares entitle their holder to one vote, either in person or by proxy, at a meeting of the Company.
For
per
sona
l use
onl
y

NOTES TO THE FINANCIAL STATEMENTS (continued) FOR THE YEAR ENDED 30 JUNE 2015
43
12. RESERVES AND ACCUMULATED LOSSES Consolidated 2015 2014 $ $ Accumulated losses Movements in accumulated losses were as follows: Balance at beginning of financial year 11,870,210 9,081,239 Net loss for the year 4,353,904 2,788,971 Balance at end of financial year 16,224,114 11,870,210
Consolidated
Option premium reserve
Share-based payments reserve
Foreign currency
translation reserve
Total
$ $ $ $ Reserves Movement in reserves were as follows: At 1 July 2013 291,190 627,710 116,971 1,035,871 Loan settlement 117,000 117,000 Transfer to issued share capital (592,052) (592,052) Share-based payment 40,254 40,254 Foreign currency translation - - (396,731) (396,731) At 30 June 2014 291,190 192,912 (279,760) 204,342 At 1 July 2014 291,190 192,912 (279,760) 204,342Transfer to issued share capital (45,000) (45,000)Share based payment 25,851 25,851Foreign currency translation - - 87,509 87,509At 30 June 2015 291,190 173,763 (192,251) 272,702
Nature and purpose of reserves Option issue reserve This reserve is used to accumulate the net proceeds received from the issue of options. Share-based payments reserve This reserve is used to record the value of equity benefits provided to directors, consultants or employees as part of their remuneration. Refer to Note 13 for further details.
Foreign currency translation reserve The foreign currency translation reserve is used to record exchange differences arising from the translation of the financial statements of foreign subsidiaries. 13. SHARE-BASED PAYMENTS Employee share plans Schemes under which shares may be issued by the Company to directors, consultants or employees for no cash consideration were approved by the shareholders at the 2009 Annual General Meeting. The Plan was not renewed at the Company’s 2012 Annual General Meeting and as such should the Company issue shares to directors, consultants and employees under the Plan, the issue will impact the Company’s 15% placement capacity under ASX listing rule 7.1.
For
per
sona
l use
onl
y
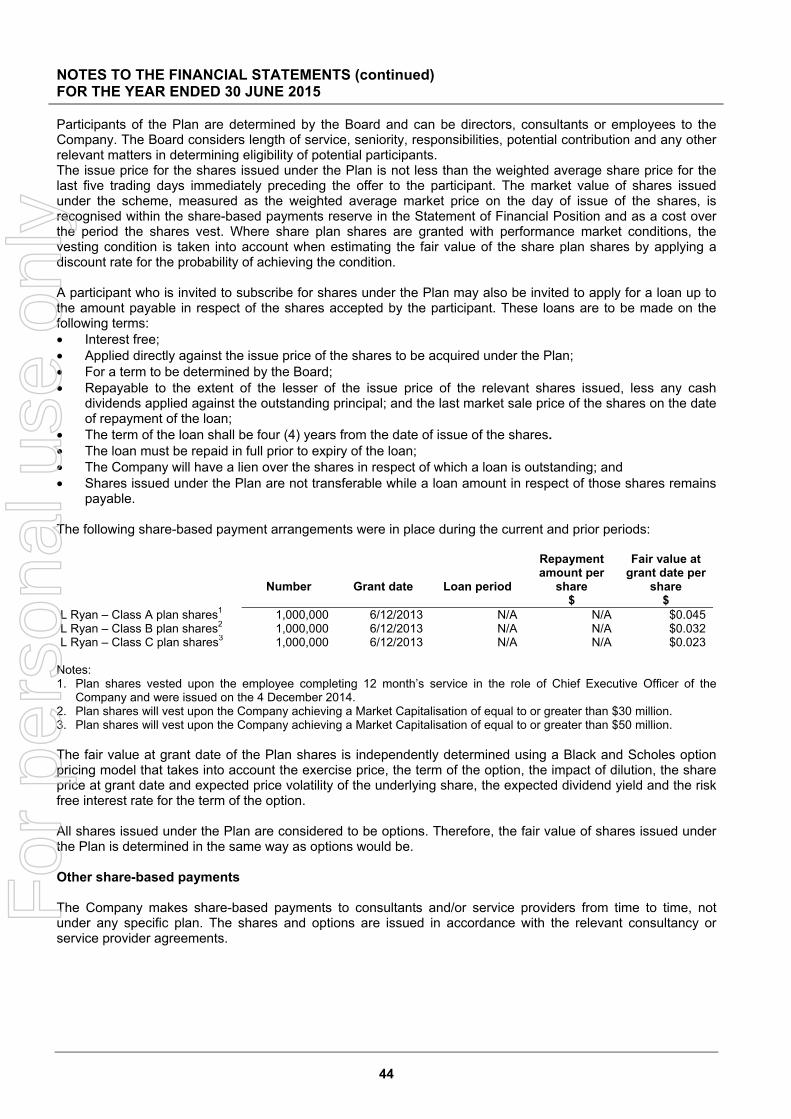
NOTES TO THE FINANCIAL STATEMENTS (continued) FOR THE YEAR ENDED 30 JUNE 2015
44
Participants of the Plan are determined by the Board and can be directors, consultants or employees to the Company. The Board considers length of service, seniority, responsibilities, potential contribution and any other relevant matters in determining eligibility of potential participants. The issue price for the shares issued under the Plan is not less than the weighted average share price for the last five trading days immediately preceding the offer to the participant. The market value of shares issued under the scheme, measured as the weighted average market price on the day of issue of the shares, is recognised within the share-based payments reserve in the Statement of Financial Position and as a cost over the period the shares vest. Where share plan shares are granted with performance market conditions, the vesting condition is taken into account when estimating the fair value of the share plan shares by applying a discount rate for the probability of achieving the condition. A participant who is invited to subscribe for shares under the Plan may also be invited to apply for a loan up to the amount payable in respect of the shares accepted by the participant. These loans are to be made on the following terms: • Interest free; • Applied directly against the issue price of the shares to be acquired under the Plan; • For a term to be determined by the Board; • Repayable to the extent of the lesser of the issue price of the relevant shares issued, less any cash
dividends applied against the outstanding principal; and the last market sale price of the shares on the date of repayment of the loan;
• The term of the loan shall be four (4) years from the date of issue of the shares. • The loan must be repaid in full prior to expiry of the loan; • The Company will have a lien over the shares in respect of which a loan is outstanding; and • Shares issued under the Plan are not transferable while a loan amount in respect of those shares remains
payable. The following share-based payment arrangements were in place during the current and prior periods:
Number Grant date Loan period
Repayment amount per
share
Fair value at grant date per
share $ $
L Ryan – Class A plan shares1 1,000,000 6/12/2013 N/A N/A $0.045 L Ryan – Class B plan shares2 1,000,000 6/12/2013 N/A N/A $0.032 L Ryan – Class C plan shares3 1,000,000 6/12/2013 N/A N/A $0.023
Notes: 1. Plan shares vested upon the employee completing 12 month’s service in the role of Chief Executive Officer of the
Company and were issued on the 4 December 2014. 2. Plan shares will vest upon the Company achieving a Market Capitalisation of equal to or greater than $30 million. 3. Plan shares will vest upon the Company achieving a Market Capitalisation of equal to or greater than $50 million. The fair value at grant date of the Plan shares is independently determined using a Black and Scholes option pricing model that takes into account the exercise price, the term of the option, the impact of dilution, the share price at grant date and expected price volatility of the underlying share, the expected dividend yield and the risk free interest rate for the term of the option. All shares issued under the Plan are considered to be options. Therefore, the fair value of shares issued under the Plan is determined in the same way as options would be. Other share-based payments The Company makes share-based payments to consultants and/or service providers from time to time, not under any specific plan. The shares and options are issued in accordance with the relevant consultancy or service provider agreements.
For
per
sona
l use
onl
y

NOTES TO THE FINANCIAL STATEMENTS (continued) FOR THE YEAR ENDED 30 JUNE 2015
45
14. COMMITMENTS AND CONTINGENCIES Operating lease commitments – Group as lessee The Group has entered into a commercial lease for office premises in the Republic of Zambia and Perth, Western Australia. The Zambian lease has a minimum term of one year with a one month notice period and is renewable every year thereafter, and the Perth lease is with a one month notice period. There are no restrictions placed upon the lessee by entering into this lease. The Group also holds an office equipment lease. Consolidated 2015 2014 $ $ Within one year 13,900 36,153 After one year but not more than five years 2,195 14,377 More than five years - - 16,095 50,530
Exploration commitments The Group has certain obligations to perform minimum exploration work and to expend minimum amounts of money on such work on mining tenements. These obligations may be varied from time to time subject to approval and are expected to be fulfilled in the normal course of the operations of the Group. These commitments have not been provided for in the financial statements.
Included in this commitment is an amount of $1,679,605 relating to the Zambian tenements Shikila, Kabwima South and Kabwima North that have been farmed out to FQM.
Due to the nature of the Group’s operations in exploring and evaluating areas of interest, it is difficult to accurately forecast the nature and amount of future expenditure beyond the next year. Expenditure may be reduced by seeking exemption from individual commitments, by relinquishment of tenure or any new joint venture arrangements. Expenditure may be increased when new tenements are granted or joint venture agreements amended.
The minimum expenditure commitment on the tenements is as follows: Consolidated 2015 2014 $ $ Within one year 2 to 5 years Over 5 years
2,331,562 - -
1,661,492 2,284,552
- Contingencies Native Title It is possible that native title, as defined in the Native Title Act 1993, might exist over land in which the Company has an interest. It is impossible at this stage to quantify the impact (if any) that the existence of native title may have on the operations of the Company. However, at the date of this report, the Directors are aware that applications for native title claims have been accepted by the Native Title Tribunal over tenements held by the Company. 15. RELATED PARTY DISCLOSURE The consolidated financial statements include the financial statements of Chrysalis Resources Limited and the subsidiaries listed in the following table:
Country of % Equity InterestName Incorporation 2015 2014
Horizon Copper Zambia Limited Republic of Zambia Limited 100% 100%
Zambian Copper Pty Ltd Australia 100% 100%
Sedgwick Resources Limited Republic of Zambia Limited 99.99% 99.99%
For
per
sona
l use
onl
y

NOTES TO THE FINANCIAL STATEMENTS (continued) FOR THE YEAR ENDED 30 JUNE 2015
46
Chrysalis Resources Limited is the ultimate Australian parent entity and ultimate parent of the Group. Related party transactions during the year consisted of loan advances and fees paid to related parties of the Group. All intergroup transactions and balances are eliminated on consolidation. The following table provides the total amount of transactions that were entered into with related parties for the relevant financial year:
Income from
Related Parties Expenditure to Related Parties
Amounts Owed by Related
parties at year end
Amounts Owed to Related
parties at year end
$ $ $ $
Craigstone Pty Ltd 1 2015 - - - -
2014 - 64,906 - -
Equiti partners 2 2015 - - - -
2014 - 138,429 - -
Yangtze Trust 3 2015 - - - -
2014 - 165,356 - -
Notes: 1. Mr J Noakes, a director of Sedgwick Resources Limited, is a director of Craigstone Pty Ltd. During the financial year, Mr Noakes
received geological exploration consultancy fees from the Company. 2. Mr G Kidner, a former Executive director, is a director of Equiti Partners. 3. Mr Jian Hua Sang, a Non-Executive director is a beneficiary of Yangtze Trust. In the prior financial year Mr Sang received a
commission on funds raised from EBH. For the year ended 30 June 2015, the Group has not made any allowance for doubtful debts relating to amounts owed by related parties due to solid payment history (2014: $nil). An impairment assessment is undertaken each financial year by examining the financial position of the related party and the market in which the related party operates to determine whether there is objective evidence that a related party receivable is impaired. When such objective evidence exists, the Group recognises an allowance for the impairment loss. 16. FINANCIAL INSTRUMENTS (a) Financial risk management objectives The Group’s financial instruments consist mainly of deposits with banks and current trade and other payables. The main purpose of financial instruments is to finance the Group’s operations. The Group also has other financial instruments such as trade debtors and creditors which arise directly from its operations. The Company does not speculate in the trading of derivative instruments. The main risks the Group is exposed to through its financial instruments are currency risk, interest rate risk and liquidity risk. The Board reviews and agrees policies for managing each of these risks and they are summarised below: (b) Capital risk management objectives The Group manages its capital to ensure it will be able to continue as a going concern while maximising the return to shareholders through the optimisation of the debt and equity balance. The Group’s overall strategy remains unchanged from 2014. The capital structure of the Group consists of debt, cash and cash equivalents and equity attributable to equity holders of the parent, comprising issued capital, reserves and retained earnings. None of the Group’s entities are subject to externally imposed capital requirements. Operating cash flows are used to maintain and expand operations, as well as to make routine expenditures such as general administrative outgoings.
For
per
sona
l use
onl
y

NOTES TO THE FINANCIAL STATEMENTS (continued) FOR THE YEAR ENDED 30 JUNE 2015
47
(c) Categories of financial instruments Consolidated 2015 2014 $ $ Financial assets Cash and cash equivalents 159,446 694,497 Trade and other receivables 88,753 79,288 248,199 773,785 Financial liabilities Trade and other payables 120,497 218,060 120,497 218,060
(d) risk The Group’s activities expose it mainly to the financial risks of changes in foreign currency exchange rates and changes in interest rates. The Company’s subsidiary, Sedgwick Resources Limited, exposes the Group to fluctuations in foreign currency exchange rates by undertaking mineral exploration on tenements within the Republic of Zambia. There have been no changes at the reporting date to the Group’s manner in which it manages and measures the risk from the previous period. (i) Price risk Given the current level of operations, the Group is not exposed to price risk. (ii) Interest rate risk The Group has exposure to the risks of changes in market interest rates relating to its cash and cash equivalents. The Group maintains funds at both fixed and floating interest rates, with the risk managed by the Group maintaining an appropriate mix between fixed and floating rate liquid funds. The Group’s exposure to interest rates on financial assets and financial liabilities are detailed in the liquidity risk management section of this note. Financial assets and liabilities in the form of receivables, payables and current borrowings were non-interest bearing during the year. Unsecured loans and credit cards had floating interest rates during the year. During the year ended 30 June 2015, if interest rates had been 50 basis points higher or lower than the prevailing rates realised, with all other variables held constant, there would have been an immaterial change in the post tax loss for the year. The impact on equity would have been the same. Consolidated 30 June 2015 30 June 2014
Weighted average
interest rate Balance
Weighted average
interest rate Balance % $ % $ Cash balances 2.17% 159,446 2.62% 694,497
F
or p
erso
nal u
se o
nly

NOTES TO THE FINANCIAL STATEMENTS (continued) FOR THE YEAR ENDED 30 JUNE 2015
48
(iii) Foreign currency exchange risk The Group undertakes certain transactions denominated in foreign currencies, hence exposures to exchange rate fluctuations arise. The carrying amount of the Group’s foreign currency denominated monetary assets and monetary liabilities at the reporting date is as follows: Assets Liabilities 2015 2014 2015 2014 $ $ $ $ Zambian Kwacha (KWA) 40,490 100,468 38,958 49,737
Foreign currency sensitivity analysis The Group is exposed to Zambian Kwacha (KWA) currency fluctuations. The following table details the Group’s sensitivity to a 10% increase and decrease in the Australian Dollar (AUD) against the relevant currencies. 10% is the sensitivity rate used when reporting foreign currency risk internally to key management personnel and represents management’s assessment of the possible change in foreign exchange rates. The sensitivity analysis includes only outstanding foreign currency denominated monetary items and adjusts their translation at the period end for a 10% change in foreign currency rates. The sensitivity analysis includes cash balances held in KWA and trade creditors and other payables held in KWA and USD. A positive number indicates an increase in profit and other equity where the AUD strengthens against the relevant currency. For a weakening Australian Dollar against the relevant currency there would be an equal and opposite impact on the profit and other equity and the balances would be negative. Consolidated
2015 2014 Profit / (loss) Equity
increase / (decrease)
Profit / (loss) Equity increase / (decrease)
$ $ $ $ AUD strengthens KWA (153) 153 (5,073) 5,073 AUD weakens KWA 153 (153) 5,073 (5,073)
Note: foreign currency gains or losses on intercompany loans are transferred to equity in accordance with Note 1. Therefore there is no impact on the Group’s loss. (e) Credit risk Credit risk refers to the risk that the counterparty will default on its contractual obligations resulting in financial loss to the Group. The Group has adopted the policy of dealing with creditworthy counterparties and obtaining sufficient collateral or other security where appropriate, as a means of mitigating the risk of financial loss from defaults. The Group measures credit risk on a fair value basis.
The Group’s cash balances are held with a major Australian lending institution. The Group does not have any other significant credit risk exposure to a single counterparty or any group of counterparties having similar characteristics. The credit risk on liquid funds is limited because the counterparty is a bank with high credit ratings assigned by international credit rating agencies.
The carrying amount of financial assets recorded in the financial statements, net of any provisions for losses, represents the Group’s maximum exposure to credit risk without taking account of the fair value of any collateral or other security obtained. F
or p
erso
nal u
se o
nly

NOTES TO THE FINANCIAL STATEMENTS (continued) FOR THE YEAR ENDED 30 JUNE 2015
49
(f) Liquidity risk management The Group manages liquidity risk by continuously monitoring forecast and actual cash flows and ensuring sufficient cash and marketable securities are available to meet current and future commitments of the Group. Due to the nature of the Group’s activities, being mineral exploration, the Group does not have ready access to credit facilities, with the primary source of funding being equity raisings. The Board of Directors constantly monitors the state of equity markets in conjunction with the Group’s current and future funding requirements, with a view to initiating appropriate capital raisings as required.
The financial liabilities of the Group are confined to trade and other payables, joint venture liabilities and unsecured loans as disclosed in the Statement of Financial Position. All trade and other payables are non-interest bearing and due within 12 months of reporting date. Liquidity and interest rate risk tables
Weighted average interest
rate Less than 1 month
1 – 3 months
3 months – 1 year
1 – 5 years 5+ years
% $ $ $ $ $ 2015 Non-interest bearing - - 120,497 - - -Variable interest rate instruments - - - - - -Fixed interest rate instruments - - - - - - 2014 Non-interest bearing - - 218,033 - - - Variable interest rate instruments 18.50% - 27 - - - Fixed interest rate instruments - - - - - -
The above table details the Group’s remaining contractual maturity for its financial liabilities. These are based on the undiscounted cash flows of the financial liabilities based on the earliest date on which the Group can be required to pay.
The following tables detail the Group’s contractual maturity for its financial assets. These are based on the undiscounted cash flows of financial assets.
Weighted average interest
rate Less than 1 month
1 – 3 months
3 months – 1 year
1 – 5 years 5+ years
% $ $ $ $ $ 2015 Non-interest bearing - - 5,829 - - -Variable interest rate instruments 1.50% - 62,994 - - -Fixed interest rate instruments 2.75% - 90,623 - - -Receivables - - 88,753 - - - 2014 Non-interest bearing - - 106,670 - - - Variable interest rate instruments 2.35% - 84,696 - - - Fixed interest rate instruments 2.85%-3.45% - 503,131 - - - Receivables - - 79,288 - - -
(g) Fair value of financial instruments For financial assets and liabilities, the net fair value approximates the carrying value. No financial assets and financial liabilities are readily traded on organised markets in standardised form. The Group has no financial assets where carrying amount exceeds net fair value at reporting date.
For
per
sona
l use
onl
y

NOTES TO THE FINANCIAL STATEMENTS (continued) FOR THE YEAR ENDED 30 JUNE 2015
50
17. AUDITOR REMUNERATION Consolidated 2015 2014 $ $ Remuneration of the auditors of the Company for: - audit and review services HLB Mann Judd Australia 29,500 29,900 HLB Reliance Zambia 16,437 20,897 BDO Zambia - 4,961 - other services HLB Mann Judd Australia (Compliance) 9,100 30,000 HLB Reliance Zambia (Compliance) - 16,501 55,037 102,259
18. KEY MANAGEMENT PERSONNEL DISCLOSURES Refer to the remuneration report contained in the directors’ report for details of the remuneration paid or payable to each member of the Group’s key management personnel (KMP) for the year ended 30 June 2015. The totals of remuneration paid to KMP of the company and the Group during the year are as follows:
Consolidated 2015 2014 $ $ Short-term benefits 479,882 968,699 Post-employment benefits 29,584 41,461 Share-based payments 25,851 40,254 535,317 1,050,414
Short-term employee benefits These amounts include fees and benefits paid to the non-executive Chair and non-executive directors as well as all salary, paid leave benefits, fringe benefits, consultancy fees and cash bonuses awarded to executive directors and other KMP. Post-employment benefits These amounts are the current-year’s superannuation contributions made during the year and termination benefits. Share-based payments These amounts represent the expense related to the participation of KMP in equity-settled benefit schemes as measured by the fair value of the options, rights and shares granted on grant date. 19. EVENTS AFTER THE REPORTING PERIOD Further to the announcement on the 21 May 2015 in which the Company announced that it had been granted an option to acquire all the issued capital in Peppermint Innovation Limited (“Peppermint”), the following events have been announced.
- On 3 July 2015 the Company advised that it had agreed with Peppermint to extend the Due Diligence period for the acquisition of Peppermint to 18 July 2015.
- On 23 July 2015 the Company announced that the Due Diligence requirements had been satisfied and that the Company had exercised the Option to acquire Peppermint. DJ Carmichael Pty Ltd had been appointed Corporate Advisors and Lead Manager to assist in raising up to $3,500,000 of additional equity funding. The acquisition remains conditional upon the Company obtaining necessary shareholder and regulatory approvals, together with satisfaction of the remaining conditions precedent under the binding term sheet.
On 23 July 2015 the Company advised that FQM Exploration (Zambia) Limited (“FQM”) had satisfied all conditions associated with the exclusive option period within the “Letter Agreement” dated 23 October 2014, (refer to ASX announcement dated 18th November 2014), and have elected to execute the Option and advance to the “Earn-in” period.
For
per
sona
l use
onl
y

NOTES TO THE FINANCIAL STATEMENTS (continued) FOR THE YEAR ENDED 30 JUNE 2015
51
On 11 September 2015 the Company executed a short-term unsecured loan agreement for up to $200,000 to complete the Peppermint transaction pursuant to the binding term sheet between the Company and Peppermint dated 20 May 2015.
No other matters or circumstance have arisen since 30 June 2015 which significantly affected or could significantly affect the operations of the consolidated group in future financial years. 20. INTEREST IN JOINTLY CONTROLLED OPERATION During the prior year, no field work was completed on this project, and after a thorough review of the Halloween West exploration data the Halloween West 37% Joint Venture equity in the project (E52/2275) was sold to the new Joint Venture farm-in partner Sandfire Resources NL for a consideration of $85,000. The share of the assets, liabilities, revenue and expenses of the jointly controlled operation, which are included in the consolidated financial statements, are as follows: Consolidated 2015 2014 $ $ Financial Position
Current assets Cash - 18,692 Trade and other receivables - 124 Total current assets - 18,816
Non-current assets Exploration and evaluation expenditure - 86,853 Total non-current assets - 86,853
Current liabilities Trade and other payables - 20,400 Total current liabilities - 20,400
Net 37.3% interest in Joint Venture - 85,269
Financial performance Loss for the year - 269 Total comprehensive loss for the year - 269
21. PARENT ENTITY DISCLOSURES Consolidated 2015 2014 $ $ Financial position
Assets Current assets 207,619 885,101 Non-current assets 224,606 5,784,186 Total assets 432,225 6,669,287
Liabilities Current liabilities 81,539 147,923 Total Liabilities 81,539 147,923
Equity Ordinary share capital 17,304,812 16,211,680 Retained earnings (17,419,079) (10,174,418) Reserves Share-based payments 173,763 192,912 Options issue reserve 291,190 291,190 Total equity 350,686 6,521,364
Financial performance Loss for the year (7,244,661) (1,739,530) Total comprehensive loss for the year (7,244,661) (1,739,530)
For
per
sona
l use
onl
y

NOTES TO THE FINANCIAL STATEMENTS (continued) FOR THE YEAR ENDED 30 JUNE 2015
52
The parent entity has agreed to provide financial support to its subsidiary Sedgwick Resources Limited for the period beyond 30 June 2015. The recoverability of the parent company loans and investment in its subsidiaries is dependent upon the successful development and commercial exploitation or sale of the underlying exploration assets. The parent entity has no contingent liabilities as at 30 June 2015 other than those disclosed in Note 14 above.
For
per
sona
l use
onl
y

DIRECTORS’ DECLARATION
53
1. In the opinion of the directors of Chrysalis Resources Limited (the ‘Company’):
a. the accompanying financial statements and notes are in accordance with the Corporations Act 2001 including:
i. giving a true and fair view of the Group’s financial position as at 30 June 2015 and of its performance for the year then ended; and
ii. complying with Australian Accounting Standards, the Corporations Regulations 2001, professional reporting requirements and other mandatory requirements.
b. there are reasonable grounds to believe that the Company will be able to pay its debts as and when they become due and payable.
c. the financial statements and notes thereto are in accordance with International Financial Reporting Standards issued by the International Accounting Standards Board.
2. This declaration has been made after receiving the declarations required to be made to the directors in accordance with Section 295A of the Corporations Act 2001 for the financial year ended 30 June 2015.
This declaration is signed in accordance with a resolution of the Board of Directors.
Dr Neale Fong Non-Executive Chairman Perth, 14 September 2015
For
per
sona
l use
onl
y

INDEPENDENT AUDIT REPORT
54
For
per
sona
l use
onl
y

INDEPENDENT AUDIT REPORT (continued)
55
For
per
sona
l use
onl
y