acknowledgements - aidc studies/automotiveexportmanual2014 (2).pdf · acknowledgements the...
TRANSCRIPT


1
ACKNOWLEDGEMENTS
The information and analysis in this report were produced and compiled by Dr Norman Lamprecht on behalf of the Automotive Industry Export Council. The contributions and assistance by NAAMSA, NAACAM and the Department of Trade and Industry are hereby gratefully acknowledged. The data processing and editing by Dr Alet Tolmay, design and outlay of the publication by Dr Selma Schiller and photography by Mr Paul Parsons are also acknowledged with appreciation.
AIECP O Box 40611
Arcadia0007
Tel: +27 12 807 0086Fax: +27 12 807 0054
Website: www.aiec.co.za
2
CONTENTS
Foreword ............................................................................................................................... 4
The Automotive Industry Export Council (AIEC) ........................................................................ 5
The South African automotive industry operating environment ................................................ 7
South Africa and its automotive clusters .................................................................................. 9
South Africa’s automotive policy regime ................................................................................ 13
South African new vehicle market features ............................................................................ 17
Automotive exports and imports – methodology .................................................................... 23
Exports to regions ................................................................................................................. 24
Exports to countries .............................................................................................................. 42
Exports of vehicles ................................................................................................................ 46
Automotive components – exports by country ........................................................................ 48
Automotive components – exports by product ....................................................................... 59
Imports by country of origin .................................................................................................. 68
Imports of vehicles ............................................................................................................... 71
Automotive parts and components – imports ......................................................................... 73
Main automotive trading partners ......................................................................................... 75
Automotive industry trade balance ........................................................................................ 79
Potential opportunities via trade and co-operation arrangements .......................................... 82
General information ............................................................................................................. 87
South African automotive industry – prospects and imperatives to grow ................................. 88
Key motor industry addresses ............................................................................................... 91

3
ABBREVIATIONS
AGOA African Growth and Opportunity Act
AIEC Automotive Industry Export Council
AIS Automotive Investment Scheme
APDP Automotive Production Development Programme
BLNS Botswana, Lesotho, Namibia and Swaziland
BRICS Brazil, Russia, India, China and South Africa
CBU Completely Built Up
CKD Completely Knocked Down
COMESA Common Market for Southern and Eastern Africa
CPI Consumer Price Index
DTI The Department of Trade and Industry
EAC East African Community
EU European Union
FDI Foreign Direct Investment
FTA Free Trade Agreement
GDP Gross Domestic Product
IDZ Industrial Development Zone
MERCOSUR Mercado Común del Sur – Common Market of South America
MIDP Motor Industry Development Programme
NAACAM National Association of Automotive Component and Allied Manufacturers
NAAMSA National Association of Automobile Manufacturers of South Africa
NAFTA North American Free Trade Area
OEM Original Equipment Manufacturer (Vehicle Manufacturer)
SADC Southern African Development Community
SARS South African Revenue Service
WTO World Trade Organisation

4
FOREWORD
The Automotive Export Manual – 2014 – South Africa publication is an annual publication produced and compiled by the Automotive Industry Export Council (AIEC) – the key source of South African automotive trade data. The 2014 publication, as well as the previous publications since 2006, represent a comprehensive guide on the export and import performance of the South African automotive industry under the previous Motor Industry Development Programme (MIDP) and current Automotive Production Development Programme (APDP). The aim of the manual is to identify and prioritise the major automotive export destinations, the major countries of origin, the main automotive export trade blocs, the most important automotive products exported and imported, the top growth markets and products as well as the impact of the trade arrangements enjoyed by South Africa.
Over the past two decades the South African automotive industry has been transformed into an internationally more competitive, globally integrated industry supplying high quality automotive products to the domestic and global markets. The South African vehicle manufacturing and associated industries have grown to become the major contributors to manufacturing output in South Africa and currently accounts for about one third of all manufacturing activity in the country. The APDP, which commenced 1st January 2013, is designed to take the industry to the next level by doubling vehicle production in the country to 1,2 million units per annum by 2020.
The value and insight which data has to offer and the role that data plays is absolutely key and integral in formulating policy and defining business strategies. Market intelligence provides companies with a competitive edge. Accurate and timeous data gives insight into current trading conditions, acts as an indicator as to where the market is headed and assists companies to develop better and appropriate strategies. A recent development relating to South African trade statistics is that the Minister of Finance, during 2013, approved that South Africa’s trade statistics should include data in respect of Botswana, Lesotho, Namibia and Swaziland (BLNS) in order to provide a more accurate reflection of South Africa’s trade. BLNS country trade statistics have previously not been included in South Africa’s trade statistics because of the free flow of trade from a customs point of view within the Southern African Customs Union (SACU). The automotive industry’s trade performance has subsequently been revised with BLNS country data in the 2014 publication, and where applicable, with retrospective effect.
The South African automotive industry has enjoyed sustained growth in both domestic sales and exports since the downturn in 2009, despite the uncertain international climate. During 2013, total automotive industry exports increased by R7,8 billion or 8,2% to R102,7 billion from the revised R94,9 billion in 2012. The economic challenges in Europe and the US are forcing South African companies to look at alternative markets and partners to diversify risk and create new avenues for growth. Indicative of this trend, the export value to 21 of the 152 country export destinations more than doubled from 2012 to 2013.
The performance of exports remains a function of the performance and direction of global markets. There are, however, increasing positive signs that economic conditions are improving in important regions for the domestic automotive industry, including Europe and North America. The accelerating recovery in the world’s major developed economies, which, together with a weaker exchange rate, should enhance South Africa’s manufacturing and exports during 2014. The domestic automotive sector’s significance is premised on its contribution to export earnings, employment and GDP growth. In recognition of the importance of the automotive sector to the country’s economy, the South African government remains committed to fast track the growth and development of the domestic automotive industry which it regards as strategically significant.
5
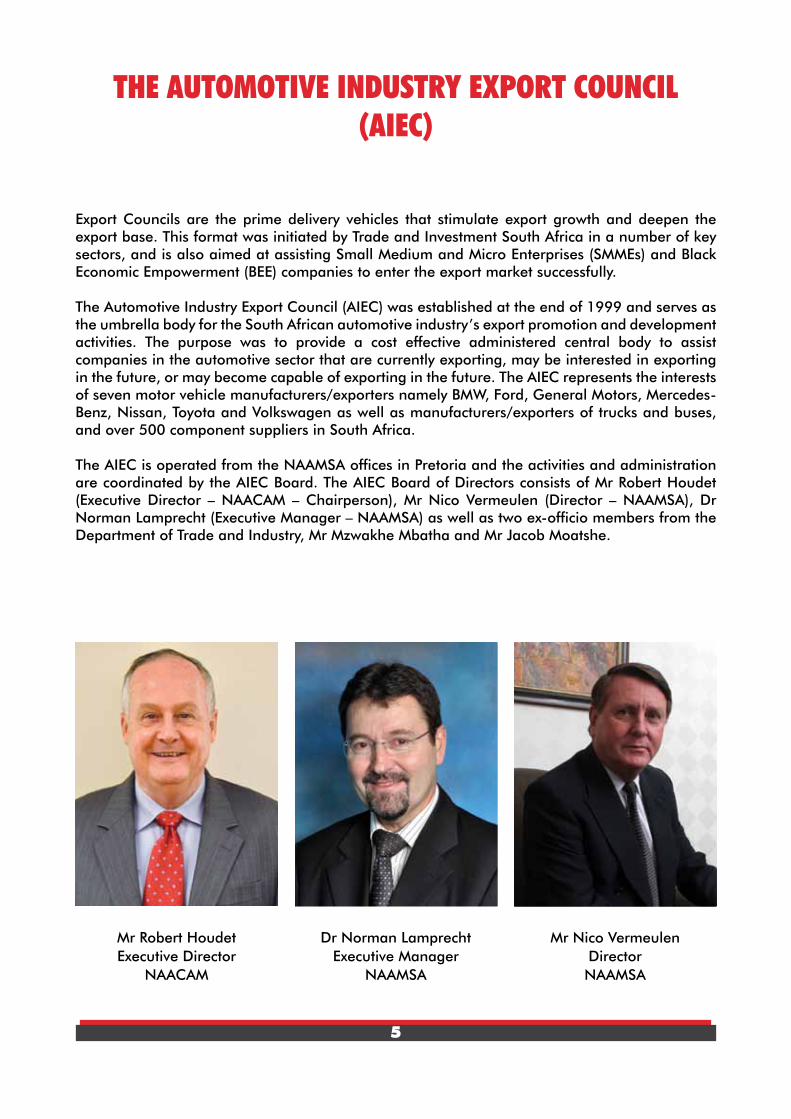
THE AUTOMOTIVE INDUSTRY EXPORT COUNCIL (AIEC)
Export Councils are the prime delivery vehicles that stimulate export growth and deepen the export base. This format was initiated by Trade and Investment South Africa in a number of key sectors, and is also aimed at assisting Small Medium and Micro Enterprises (SMMEs) and Black Economic Empowerment (BEE) companies to enter the export market successfully.
The Automotive Industry Export Council (AIEC) was established at the end of 1999 and serves as the umbrella body for the South African automotive industry’s export promotion and development activities. The purpose was to provide a cost effective administered central body to assist companies in the automotive sector that are currently exporting, may be interested in exporting in the future, or may become capable of exporting in the future. The AIEC represents the interests of seven motor vehicle manufacturers/exporters namely BMW, Ford, General Motors, Mercedes-Benz, Nissan, Toyota and Volkswagen as well as manufacturers/exporters of trucks and buses, and over 500 component suppliers in South Africa.
The AIEC is operated from the NAAMSA offices in Pretoria and the activities and administration are coordinated by the AIEC Board. The AIEC Board of Directors consists of Mr Robert Houdet (Executive Director – NAACAM – Chairperson), Mr Nico Vermeulen (Director – NAAMSA), Dr Norman Lamprecht (Executive Manager – NAAMSA) as well as two ex-officio members from the Department of Trade and Industry, Mr Mzwakhe Mbatha and Mr Jacob Moatshe.
Mr Robert HoudetExecutive Director
NAACAM
Dr Norman LamprechtExecutive Manager
NAAMSA
Mr Nico VermeulenDirectorNAAMSA

6
The domestic automotive industry is a vital contributing element to the success of the national economy and the sustainable growth of the country at large. Manufacturing output accounts for 15% of the country’s GDP and the automotive industry accounts for about 30% of manufacturing output. Continuous efforts to grow the South African automotive industry’s export business are imperative, especially in view of the vision of doubling vehicle production in the country to 1,2 million units per annum by 2020. The focus of the South African automotive industry is to build on existing exports and to explore and exploit new opportunities. The domestic market is generally not large enough to generate sufficient economies of scale for world-class competitiveness/production; consequently exporting needs to be viewed as a necessary step towards international competitiveness. Failure to rise to the challenge by finding new markets and products could result in stagnation of exports. The current global economic environment is dominated by intense competition for export markets, investment and technology. This makes it important to gain and maintain access to these markets.
The Dti plays an important role in the promotion of economic development and meaningful participation in the global economic and trade environment. The Export Promotion Directorate of the Dti is responsible for developing and promoting South African goods and services, including specific technical interventions in the form of Export Marketing and Investment Assistance (EMIA) financial support, matchmaking, market intelligence, trade lead facilitation and in-market support. For the automotive industry, a flagship tool and successful platform to showcase and promote the South African automotive industry’s world-class capabilities is participation by means of National Pavilions at major world events.
During 2013, financial assistance under the EMIA scheme was provided to automotive manufacturing company exhibitors to participate in the Automechanika Middle East, United Arab Emirates (UAE) National Pavilion from 11 to 13 June 2013, the Johannesburg International Motor Show National Pavilion from 16 to 27 October 2013 as well as the South African National Pavilion at Midest, France from 19 to 23 November 2013.
The two automotive National Pavilions approved for 2014 include the Automechanika Middle East, UAE National Pavilion from 3 to 5 June 2014 (www.automechanikadubai.com) and the Automechanika Frankfurt, Germany National Pavilion from 16 to 20 September 2014 (www.automechanika.messefrankfurt.com). Automotive manufacturing companies will also be invited to participate in the Midest, France South African National Pavilion from 4 to 7 November 2014 (www.midest.com). The 2014 national automotive event is the South African Automotive Week (SAAW) scheduled to take place from 13 to 17 October 2014 in Midrand, Johannesburg (www.saaw.co.za).
The customers and stakeholders of the AIEC are all the domestic automotive industry stakeholders as well as the Dti Head Office, Dti foreign economic representatives, and global players abroad. The needs of members are primarily twofold, namely: (i) research and information, and (ii) practical assistance with exhibitions and missions. These needs form the basis for the assistance provided.
More information on the Automotive Industry Export Council can be accessed at www.aiec.co.za.

7
THE SOUTH AFRICAN AUTOMOTIVE INDUSTRY OPERATING ENVIRONMENT
Globally, major automotive manufacturing regions include the North American Free Trade Area (NAFTA), Western Europe, Japan, Asia-Pacific, Eastern Europe, South America and South Africa. 2009 was a pivotal year for the global motor industry. It marked the parting of ways between mature and emerging countries. The latter continued to grow while the global financial crisis hit Europe and the US particularly hard. The next two years saw an improvement in production and sales, especially in Asia, where China became the sector’s driver. The situation again changed in 2012 when the EU car market once more went into crisis, while the US market experienced a rebirth.
In 2013, the automotive industry reached its fourth production record since 2009, with 87,3 million vehicles produced. The year-on-year vehicle production growth of 3,7% was supported for the most part by strong growth in developing countries and the continued recovery of the North American market. The gloomy climate in Western Europe continued with year-on-year vehicle production remaining stagnant. The Triad economies of North America, Europe and Japan, although declining, still comprised 42,3 million or 48,5% of global vehicle production in 2013. Developing countries and regions, providing lower cost manufacturing and huge growth potential for both the global automotive supply and demand sides, are increasingly becoming important focus areas. A case in point is the BRICS coalition which increased its global market share from 35,2% in 2012 to 37,2% in 2013. The year-on-year increases could mainly be attributed to production gains of 14,8% in the case of China and 9,9% in the case of Brazil. China accounted for 25,3% of global vehicle production in 2013 and since 2012 has become the global number 1, both in terms of sales and vehicles produced.
Developing countries have to cope and incorporate not only the direct impact of the major global trends on their automotive operations, but also have to compete with each other for sourcing and outsourcing opportunities. It is within this fast changing environment that many developing countries, such as South Africa, are seeking to create for themselves a role as producer of vehicles and automotive components. When the domestic market is not large enough to absorb the production, the focus is on exports. The South Africa automotive industry possesses unique qualities and a natural ability to add value to global strategies of parent companies and multinationals. The industry has capitalised on the wealth of experience brought about by the presence of all the major European, American, Japanese and other Asian motor vehicle manufacturers in the country. South Africa’s attractiveness as an investment destination of choice and production base for products to be exported to global markets is increasing.
The South African automotive industry, as in many other countries in the world, is strongly influenced by the OEMs. The industry’s structure and evolutionary path are therefore closely aligned with OEMs’ strategies in both domestic and global markets. Key decisions about South Africa’s automotive business are made in Europe, the USA and Japan. South Africa’s participation in the World Trade Organisation (WTO), its competitive advantages and its special relationships with the EU and other trading regions have facilitated the industry’s integration into the global sourcing strategies of the multinational automotive corporations.
On a global stage, an automotive industry must be able to handle industry-wide factors such as social contributions, taxes, currency volatility, market competition, and difficulties in passing raw
8
material costs increases to the end consumer, amongst others. As in the other leading automotive manufacturing countries, public authorities are important partners in South Africa. At a national level, the National Association of Automobile Manufacturers of South Africa (NAAMSA) and the National Association of Automotive Component and Allied Manufacturers (NAACAM) are regularly involved in discussions with government on issues affecting the automotive industry. In this regard, a recent development is the introduction of the Automotive Supply Chain Competitiveness Initiative (ASCCI), a joint initiative between the major national stakeholders, namely NAAMSA, NAACAM, the National Union of Metalworkers of South Africa (NUMSA) and the Department of Trade and Industry (Dti). One main objective is to implement the national strategic imperative of sustained and progressive competitiveness improvement. Other key focus areas of the initiative include: improving component supplier operational capabilities, increasing levels of localisation, achieving increased manufacturing value addition in South Africa as well as other strategic issues affecting local supply chain competitiveness in support of the vision to manufacture 1,2 million vehicles per annum by 2020. The initiative should have a positive impact on employment creation, enabling domestic supplier capabilities and an increase in value addition, thus ensuring the long term sustainability of the South African automotive industry.
9
SOUTH AFRICA AND ITS AUTOMOTIVE CLUSTERS
South Africa is an open and globally integrated market-oriented economy with a Gross Domestic Product (GDP) of R3 385 billion, at current prices, in 2013. As the continent’s most sophisticated economy, South Africa is regarded as one of the most diversified exporting countries in the world and its increasing trade liberalisation is contributing significantly to the country’s growth and future prosperity. South Africa has a substantial mineral resource base to support an economy that generates a third of sub-Saharan Africa GDP. The country has an abundance of natural resources, well developed financial, legal and transport sectors as well as modern infrastructure supporting the distribution of goods throughout the fast developing southern African region.
South Africa is one of the world’s richest countries in mineral reserves and production. With access to large aluminium and steel resources and the world’s largest deposits of platinum group metals (PGMs), the country’s vehicle and parts industry has plenty of growth potential. The Columbus stainless steel facility is the largest in the world as is the Alusaf aluminium-smelting facility at Richards Bay. New manganese smelters are scheduled to be built at Coega. South Africa currently supplies in the order of 10% of the global demand for catalytic converters. The country is also home to over 70% of the world’s chromium, which is an essential ingredient in the stainless steel used to house the catalyst and to produce modern auto exhausts.
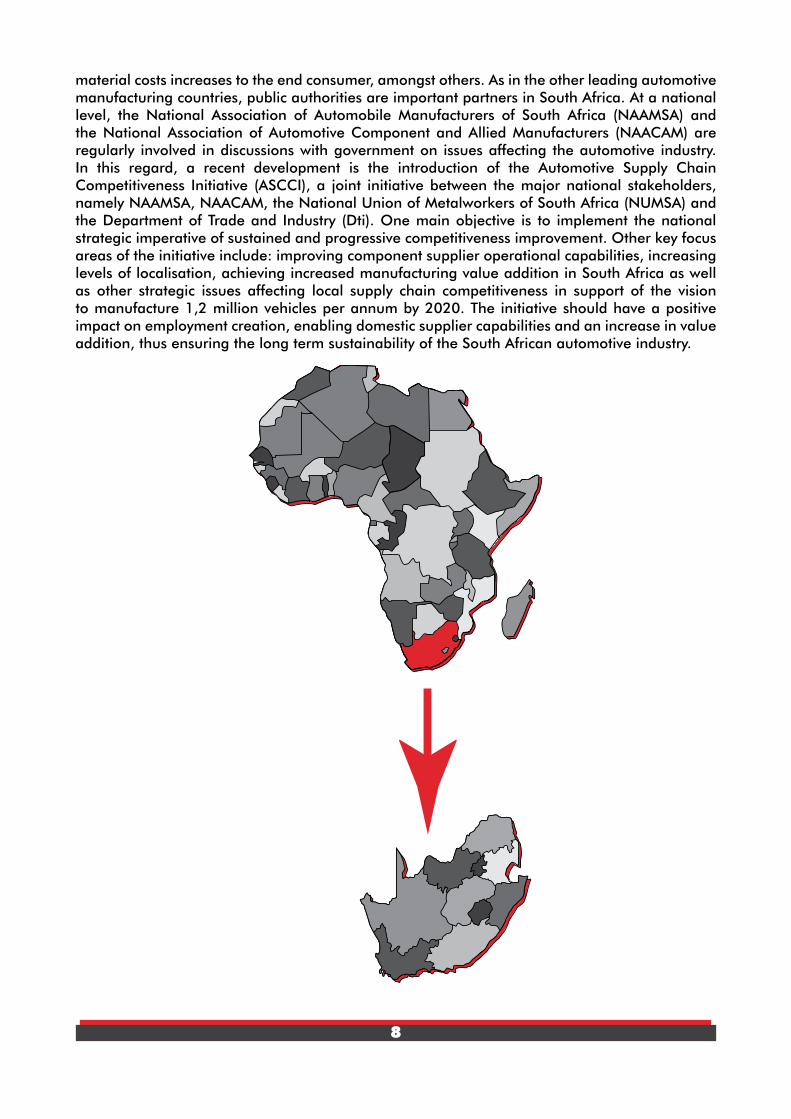
The improving and modernisation of various border systems and processes to facilitate increased trade with South Africa and the sustained investments in refining its infrastructure will no doubt have a significant positive impact on the region’s trade as a whole. The country’s ports provide a natural stopover for shipping to and from Europe, the Americas, Asia, Australia and both coasts of Africa. South Africa is not only an attractive investment destination in its own right but also provides entry to investments in other African countries. The country is ideally positioned for easy access to the countries of the Southern African Development Community (SADC), a free trade area, which consists of 15 countries with a total population of about 280 million. The country’s inclusion in the BRICS economies substantiates its reputation as a globally competitive destination for foreign investment.
South Africa consists of nine provinces, namely Western Cape, Eastern Cape, Northern Cape, North West, Free State, KwaZulu-Natal, Gauteng, Mpumalanga and Limpopo, each with its own premier, executive council and legislature. Cape Town is the legislative capital and is where parliament sits. Pretoria is the executive capital where the government administration is housed while the Constitutional Court of South Africa is based in Bloemfontein, the judicial capital. The country has a population of 52,98 million people with 11 official languages. While most South Africans can communicate in more than one language, English is the most commonly spoken and is the official language in business and commerce. The country occupies the southernmost part of the African continent and shares boundaries with Namibia, Botswana, Zimbabwe, Mozambique, Swaziland and Lesotho.
South Africa’s vehicle manufacturing industry is concentrated in three of the country’s nine provinces, namely Gauteng, the Eastern Cape and KwaZulu-Natal, and in close proximity to its suppliers. However, increasingly, some automotive development is also taking place in the Western Cape and North West provinces. Provincial and local governments have trade, investment and tourism offices to promote economic activity in their regions, many of which have their own Industrial Development Zones (IDZs) and development programmes.
10
Gauteng
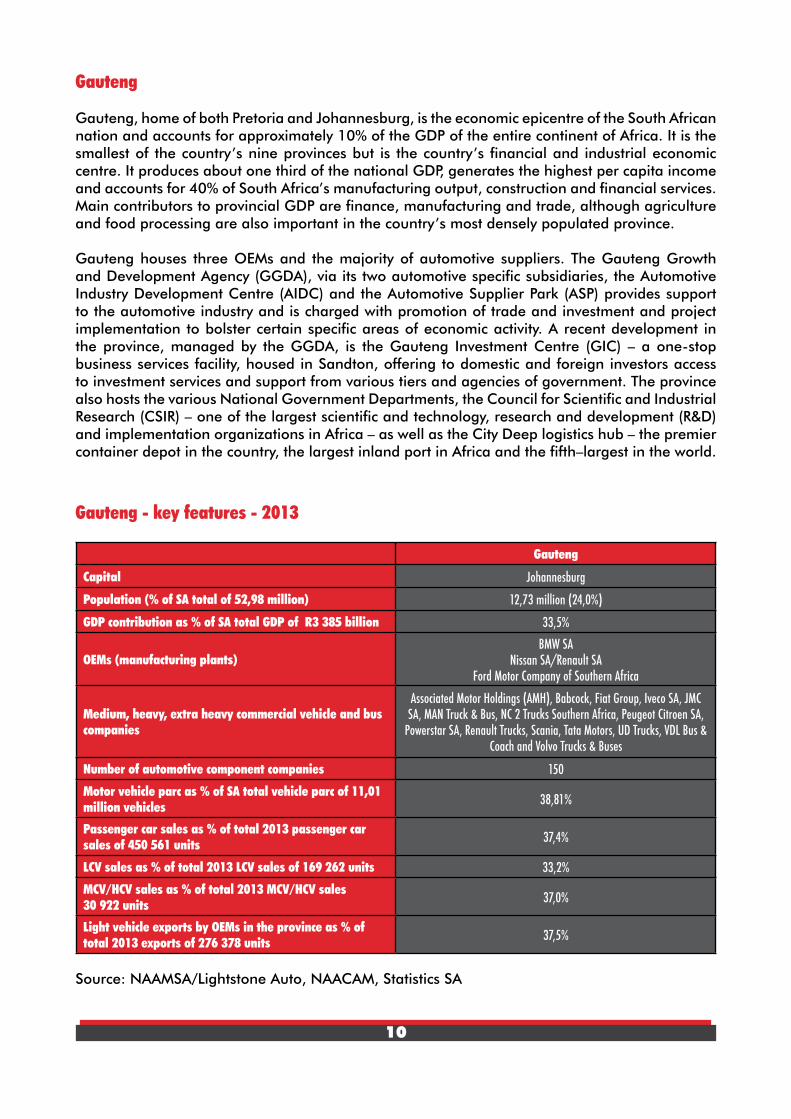
Gauteng, home of both Pretoria and Johannesburg, is the economic epicentre of the South African nation and accounts for approximately 10% of the GDP of the entire continent of Africa. It is the smallest of the country’s nine provinces but is the country’s financial and industrial economic centre. It produces about one third of the national GDP, generates the highest per capita income and accounts for 40% of South Africa’s manufacturing output, construction and financial services. Main contributors to provincial GDP are finance, manufacturing and trade, although agriculture and food processing are also important in the country’s most densely populated province.
Gauteng houses three OEMs and the majority of automotive suppliers. The Gauteng Growth and Development Agency (GGDA), via its two automotive specific subsidiaries, the Automotive Industry Development Centre (AIDC) and the Automotive Supplier Park (ASP) provides support to the automotive industry and is charged with promotion of trade and investment and project implementation to bolster certain specific areas of economic activity. A recent development in the province, managed by the GGDA, is the Gauteng Investment Centre (GIC) – a one-stop business services facility, housed in Sandton, offering to domestic and foreign investors access to investment services and support from various tiers and agencies of government. The province also hosts the various National Government Departments, the Council for Scientific and Industrial Research (CSIR) – one of the largest scientific and technology, research and development (R&D) and implementation organizations in Africa – as well as the City Deep logistics hub – the premier container depot in the country, the largest inland port in Africa and the fifth–largest in the world.
Gauteng - key features - 2013
Gauteng
Capital Johannesburg
Population (% of SA total of 52,98 million) 12,73 million (24,0%)
GDP contribution as % of SA total GDP of R3 385 billion 33,5%
OEMs (manufacturing plants)BMW SA
Nissan SA/Renault SAFord Motor Company of Southern Africa
Medium, heavy, extra heavy commercial vehicle and bus companies
Associated Motor Holdings (AMH), Babcock, Fiat Group, Iveco SA, JMC SA, MAN Truck & Bus, NC 2 Trucks Southern Africa, Peugeot Citroen SA,
Powerstar SA, Renault Trucks, Scania, Tata Motors, UD Trucks, VDL Bus & Coach and Volvo Trucks & Buses
Number of automotive component companies 150
Motor vehicle parc as % of SA total vehicle parc of 11,01 million vehicles 38,81%
Passenger car sales as % of total 2013 passenger car sales of 450 561 units 37,4%
LCV sales as % of total 2013 LCV sales of 169 262 units 33,2%
MCV/HCV sales as % of total 2013 MCV/HCV sales30 922 units 37,0%
Light vehicle exports by OEMs in the province as % of total 2013 exports of 276 378 units 37,5%
Source: NAAMSA/Lightstone Auto, NAACAM, Statistics SA

11
Eastern Cape
The Eastern Cape has a sound manufacturing base, primarily in the automotive sector. Finance, government services and manufacturing are the leading sectors in the Eastern Cape economy. The province is well served logistically, with airports situated in Port Elizabeth, East London, Mthatha and Bisho and with ports in Port Elizabeth, Coega and East London. The allocation of two of South Africa’s five industrial development zones (IDZs) to the province is confirmation of the potential generated by the shipping traffic that operates between Europe, Asia and the Far East. The Coega IDZ is the largest IDZ in the country and is the main catalyst for Eastern Cape socio-economic development and the gateway to global markets. The East London IDZ has also established an Automotive Supplier Park.
The Automotive Industry Development Centre, the Eastern Cape Development Corporation, the Nelson Mandela Bay Metropolitan Municipality and the Cacadu District Municipality are among the several organisations promoting the Eastern Cape as a preferred destination for trade and investment. Three Spatial Development Initiatives (SDIs) – Fish River, Wild Coast and East London/Coega – are also located in the Eastern Cape.
Eastern Cape - key features - 2013
Automotive clusters Eastern Cape
Capital Bisho
Population (% of SA total of 52,98 million) 6,62 million (12,5%)
GDP contribution as % of SA total GDP of R3 385 billion 7,6%
OEMs (manufacturing plants)
Volkswagen Group SAMercedes-Benz SA
General Motors Southern AfricaFord Motor Company of Southern Africa engine plant
Medium, heavy, extra heavy commercial vehicle and bus companies
FAW Trucks, General Motors/Isuzu, Mercedes-Benz SA and Volkswagen Group SA
Number of automotive component companies 100
Motor vehicle parc as % of SA total vehicle parc of 11,01 million vehicles 6,67%
Passenger car sales as % of total 2013 passenger car sales of 450 561 units 3,7%
LCV sales as % of total 2013 LCV sales of 169 262 units 5,1%
MCV/HCV sales as % of total 2013 MCV/HCV sales of 30 922 units 4,0%
Light vehicle exports by OEMs in the province as % of total 2013 exports of 276 378 units 32,7%
Source: NAAMSA/Lightstone Auto, NAACAM, Statistics SA

12
KwaZulu-Natal
KwaZulu-Natal represents the second largest economy in the country after Gauteng. With two of Africa’s busiest ports supported by world-class road and rail infrastructure, the province enjoys the strategic and competitive advantage of being a global gateway for trade into Africa and to the world. Durban is South Africa’s second largest city and busiest port. Richards Bay, originally developed as a coal exporting port, is now South Africa’s busiest bulk port and the centrepiece of the Richards Bay IDZ and Spatial Development Initiative (SDI). Richards Bay and Durban ports handle about 75% of the country’s tonnage. Manufacturing – dominated by pulp and paper, chemicals and food and beverages – is the largest sector in the province, followed by finance, trade, tourism and agriculture. The new King Shaka international airport at La Mercy provides easy access to Durban.
Trade and Investment KwaZulu-Natal, Tourism KwaZulu-Natal, the Durban Investment and Promotion Agency and the Durban Automotive Cluster promote the province’s trade and investment opportunities. These institutions have been supplemented by the new Durban KwaZulu-Natal Convention Bureau which has been established to promote the city and province as top conference destinations in Africa.
KwaZulu-Natal - key features - 2013
Automotive clusters KwaZulu-Natal
Capital Mzunduzi (Pietermaritzburg)
Population (% of SA total of 52,98 million) 10,46 million (19,7%)
GDP contribution as % of SA total GDP of R3 385 billion 16,1%
OEMs (manufacturing plants) Toyota SA Motors
Medium, heavy, extra heavy commercial vehicle and bus companies
Bell Equipment Co SA, Hino, MAN Truck & Bus (SA) and Toyota SA Motors
Number of automotive component companies 80
Motor vehicle parc as % of SA total vehicle parc of 11,01 million vehicles 13,53%
Passenger car sales as % of total 2013 passenger car sales of 450 561 units 12,8%
LCV sales as % of total 2013 LCV sales of 169 262 units 12,5%
MCV/HCV sales as % of total 2013 MCV/HCV sales of 30 922 units 17,0%
Light vehicle exports by OEMs in the province as % of total 2013 exports of 276 378 units 29,0%
Source: NAAMSA/Lightstone Auto, NAACAM, Statistics SA
13
SOUTH AFRICA’S AUTOMOTIVE POLICY REGIME
Most countries with vehicle markets similar to or larger than South Africa protect their automotive industries with significantly higher tariffs and governments provide substantial support to their industries, recognizing the benefits of the sector to a country’s economy. Each job in manufacturing normally supports a multiple of jobs elsewhere in the economy.
The automotive industry in South Africa is regarded as a strategic asset. The Motor Industry Development Programme (MIDP) was implemented with effect from 1 September, 1995 to reshape the future direction of the South African automotive and associated industries. The MIDP was established to entrench the outward orientation of the industry, thereby restructuring it to achieve global competitiveness, whilst at the same time maintaining its employment level and output contributions to the South African economy.
Since the introduction of the MIDP, significant structural changes have taken place in the South African automotive industry. The sector has grown in stature to become the leading manufacturing sector in the country’s economy. Other industries, due to their strong linkages with the automotive industry, have also benefited from the growth in the automotive sector. Input industries include aluminium, chemicals, electronics, leather and textiles, platinum group metals, plastics, rubber, steel, machinery and equipment, as well as service industries such as engineering, logistics, tooling and others such as financial, wholesale, retail and advertising.
The MIDP has to a large extent achieved its stated objectives and, in general, its contribution to the domestic automotive industry has been regarded as positive. Key achievements under the MIDP between 1995 and 2012 may be summarised as follows:
• Totalnominalexportvalueofvehiclesandautomotivecomponents–R772,2billion
• Totalnumberofvehiclesexported–2411376units
• TotalnominalcapitalexpenditurebytheOEMs–R48,6billion
• TotalnominalexpenditureontrainingbytheOEMs–R1,85billion
• Acompoundedannualgrowthrateof19,5%innominalRandvaluetermsforcompletely
built-up vehicles (CBUs) and automotive component exports has been achieved since 1995,
through to 2012
• Totalautomotiveindustryexports(CBUsandcomponents)inRandvaluetermsincreased
more than twenty fold from the R4,2 billion in 1995 to R86,9 billion (excluding BLNS
countries) in 2012.
The MIDP ended on 31 December 2012 and was succeeded by the Automotive Production Development Programme (APDP), with effect from 1st January, 2013.
The vision is to double vehicle production in South Africa by 2020 to 1,2 million vehicles per annum, pushing the country’s automotive industry up to an anticipated global market share of over 1%. The increase in market share will trigger additional interest and investment and generate additional export business. The APDP will seek to shift the emphasis away from an export focus to one that emphasises value addition and scale in the production of vehicles. In

14
addition, the programme is intended to be supportive of the further development of world-class automotive component manufacturing. The APDP will incentivise automotive-related production, investment and large-scale vehicle manufacturing, while the investment incentive will also be accessible to more companies than was the case under the MIDP. The programme should generate a quantum leap in terms of processes, technologies and the scale on which the domestic industry has operated. The APDP focus is to ensure the sector has a greater impact on the economy and on national employment levels by increasing local component manufacturing, and sourcing more semi-finished goods in the domestic market.
The APDP consists of four pillars that will drive the programme:
1. Import Duty
2. Vehicle Assembly Allowance (VAA) (rebate mechanism)
3. Production Incentive (PI) (rebate mechanism)
4. Automotive Investment Scheme (AIS) (cash grant)
The four key elements of the APDP may be described as follows:
Tariffs: Import duties on vehicles and automotive components will remain at 2012 levels (25% on light vehicles and 20% on original equipment components) through to 2020. A preferential agreement will result in imported vehicles from the EU paying only 18% duty. These tariffs are meant to provide just enough protection to justify continued local vehicle manufacturing.
Vehicle Assembly Allowance (VAA): This support will be in the form of duty-free import credits issued to vehicle manufacturers based on 20% of the ex-factory vehicle price in 2013, reducing to 19% in 2014 and in 2015 to 18% of the value of light motor vehicles produced domestically. The equivalent value of this to the OEMs will be the allowance multiplied by the duty rate; so this represents 4% of the ex-factory vehicle price in 2013 and will reduce to 3,6% in 2015. This support is effectively providing a lower duty rate for local vehicle manufacturers and should provide enough encouragement for high volume vehicle production in line with the target of doubling production.
Production Incentive (PI): From 2013 this support will start at 55% reducing progressively by 1% annually to 50% of value added, in the form of duty-free import credits. The equivalent value will be the incentive multiplied by the component duty rate; so this represents 11% of value added in 2013, and will reduce to 10% by 2018. There will be an additional amount for “vulnerable products” which will earn a PI of 80% in 2013 and 2014, reducing thereafter by 5% annually to 50% in 2020. Value added has been defined in simple terms as the manufacturer’s selling price less the value of non-qualifying material and components. The incentive will flow through the supply chain to the end producer, which will be the OEM or, in the case of component exports or replacement parts, the component manufacturer. The value-add support is planned to encourage increasing levels of local value addition along the automotive value chain with positive spin-offs for employment creation. A 25% Standard Value is regarded as local value added on the following qualifying raw materials originating in the Southern African Customs Union (SACU) which have been beneficiated to suit automotive specifications:
• Aluminium • Brass• Leather
• Platinum Group Metals (PGMs)
15
• Stainlesssteel
• Steel
With regard to vulnerable products, these high material content products will receive additional support to avoid a sudden and significant loss of export business. In this regard 40% of the standard materials listed above and applicable to the following list of products will be regarded as local value added:
• Alloywheels
• Aluminiumproducts (engineand transmission components,heat exchangersand tubes,
suspension components and heat shields)
• Alloywheels
• Castironcomponents(engine/axle/brake/transmissionandrelatedtypesofcomponents)
• Catalyticconverters
• Flexiblecouplings
• Leatherinteriors
• Machinedbrasscomponents
• Steeljacks
The 40% level will be reduced by 5 percentage points per annum from 1 January 2015 to reach 25% from 1 January 2017 onwards.
Automotive Investment Scheme (AIS): Effective from July 2009, this assistance replaces the Productive Asset Allowance (PAA) and provides for a taxable cash grant of 20% of the value of qualifying investment in productive assets by light motor vehicle manufactures and 25% of the value of qualifying investment in productive assets by component manufactures and tooling companies as approved by the Dti. In addition, by achieving certain performance objectives, companies will be able to earn an additional 5% or 10%. This support is available to encourage investments by OEMs and component manufacturers in a manner that supports productive capacity upgrading. A competitiveness improvement cost grant of 20% of qualifying costs will also be available for automotive component manufacturers. The objective of this benefit is to enhance the competitiveness of component manufacturers through the improvement of processes, products, quality standards and related skills development through the use of business development services. The grant is a function of expenditure incurred by component suppliers to improve competitiveness and must be linked to a new or replacement model of a light vehicle manufacturer.
A first review of the APDP has commenced in the first quarter of 2014 to consider the effectiveness of current support measures for the industry and identify shortcomings and recommend possible changes or enhancements to the programme. Recommendations in this regard are expected towards the end of 2014.
The APDP applies to light vehicles (passenger cars and light commercial vehicles) only. In terms of support to the medium and heavy commercial vehicle (MCV/HCV) sector, including the country’s truck, bus, capital equipment and agricultural vehicle manufacturing industries, government acknowledges that the sector has not received adequate policy attention. A review by the Department of Trade and Industry of developmental policy options for the South African
16
medium and heavy truck industry, bus manufacturing and associated sectors has been completed and recommendations in this regard are expected during 2014. There is the potential to enhance bus production in South Africa, as well as the production of other MHCVs, through leveraging opportunities, such as the roll-out of the bus rapid transit system and the growing demand for MHCVs in areas such as infrastructure, construction, mining and, possibly, agriculture. The rationale behind this review is the fact that the MHCV sector is labour intensive in terms of assembly, while a more active sector could also broaden South Africa’s component manufacturing industry. It is believed that this could be an opportunity for the component sector to grow its base and create additional jobs. Components produced for the heavy vehicle sector already receive the same benefits as light vehicle components under the APDP.
The way forward for the South African automotive industry has been indicated clearly under the APDP. There is certainty through to 2020, which will assist long-term strategic planning, while the programme requires each OEM manufacturing plant to produce at least 50 000 units per year, thus bringing reasonable economies of scale. As was the case under the MIDP, those companies able to comply with the new policy regime the quickest will be able to reap the most benefits.

17
SOUTH AFRICAN NEW VEHICLE MARKET FEATURES
For the fourth year in succession, new vehicle sales in South Africa recorded year-on-year gains. Aggregate sales grew by 3,2% in volume terms in 2013 following annual growth in total sales of 24,7% year-on-year in 2010, 16,1% in 2011 and 9,0% in 2012. Industry trading conditions remained intensely competitive in the new car and light commercial vehicle sectors. According to the Lightstone Auto/NAAMSA database, 51 brands and 2 295 passenger car model derivatives and 28 LCV brands and 510 model derivatives were available for consumers to choose from in 2013, the biggest ratio compared to its market size in the world.
Toyota SA Motors has maintained its overall market leadership position in South Africa for 34 consecutive years since 1980. In 2013, Toyota SA Motors had an overall market share of 19,5%, followed by Volkswagen Group of SA, Associated Motor Holdings, Ford Motor Company of Southern Africa and General Motors Southern Africa. The following graph reveals the overall market shares of the top 10 OEMs/Importers in the country in 2013.
Overall new vehicle market share – 2013Source: NAAMSA/Lightstone Auto
Domestic new vehicle sales growth is expected to remain modest at best during 2014. The key factors that contributed to an expansion in domestic sales over the years from 2010 through to 2013 have turned negative. Specifically, economic growth has slowed, with expected growth in real terms of about 2,3% in 2014, new vehicle price inflation has risen largely as a result of the Rand exchange rate depreciation and the interest rate cycle has turned upwards with a 0,5% increase in the repo rate early in 2014. As a result of the unfavourable current macro-environment, the general industry consensus is that the domestic market in 2014 is likely to remain stagnant.

18

19
Vehicle exports should benefit from improving global economic conditions and could well show substantial growth particularly in respect of vehicle exports to Asia, Africa and Europe. Factoring in the expected improvement in exports, total domestic production of motor vehicles in South Africa during 2014 is expected to rise from the 545 913 vehicles produced in 2013 to about 591 000 vehicles in 2014 – an improvement in vehicle production of about 8,3%.
Production of passenger car and light commercial vehicles - 2010 to 2013
PASSENGER CARS LIGHT COMMERCIAL VEHICLES
Market Exports as a % of total
Market Exports as a % of total Domestic Exports Total Domestic Export Total
2010 113 740 181 654 295 394 61,5 96 823 56 950 153 773 37,0
2011 124 736 187 529 312 265 60,1 108 704 84 125 192 829 43,6
2012 120 417 151 659 272 076 55,7 121 638 123 443 245 081 50,4
2013 113 364 151 893 265 257 57,3 127 188 121 345 248 533 48,8
2014* 110 000 160 000 270 000 59,3 127 000 160 000 287 000 55,7
* projected figuresSource: NAAMSA/Lightstone Auto
In 2013, new vehicle sales turnover has grown by about 11%, based on volume increases and a weighted average estimated increase of about 8% in new vehicle prices, to reach R205 billion for the year.
The OEMs in South Africa specialize in one or two high volume models, obtain economies of scale benefits via exports and in turn import those models not manufactured in the country to complement their domestic model mixes. This approach also assisted the component suppliers in obtaining higher volumes. The passenger car models manufactured by the OEMs during 2013 included the following:
Passenger cars (2013):
BMW 3-Series 4-door
General Motors Chevrolet Spark
Mercedes-Benz C-Class 4-door
Nissan Livina and Tiida
Renault Sandero
Toyota Corolla 4-door and Fortuner
Volkswagen Polo new and previous series
Colour is a customer’s most memorable sense, as the first point of interaction is shaped by the vehicle’s colour. According to the 2012 DuPont Automotive Colour Popularity Report, white/white pearl continued to dominate the global automotive colour popularity ranks. Overall, white/white pearl represented 23% of the global market and was in the leading position as the most popular car colour in North America, Japan, South Korea, Russia, South Africa and Mexico. Black/black effect led among vehicle colour popularity in China, but took second place in the global ranks

20
with 21% of the world’s share of automotive colour. Silver rounded off the top three global colour choices, topping the ranks in South America, Brazil and India with a global market share of 18%. South Africa has the world’s highest market share of white/white pearl of any region or country analysed, with those vehicles representing more than 38% of local market share. Silver followed and black/black effect and grey tied in third place.
Colour of passenger cars sold in South Africa – 2013Source: DuPont
The light commercial vehicle models manufactured by the OEMs in 2013 included the following:
Light commercial vehicles (2013):
Ford Ranger
Mazda BT-50
General Motors Chevrolet Utility and Isuzu KB
Nissan NP300 Hardbody, NP200
Toyota Hilux
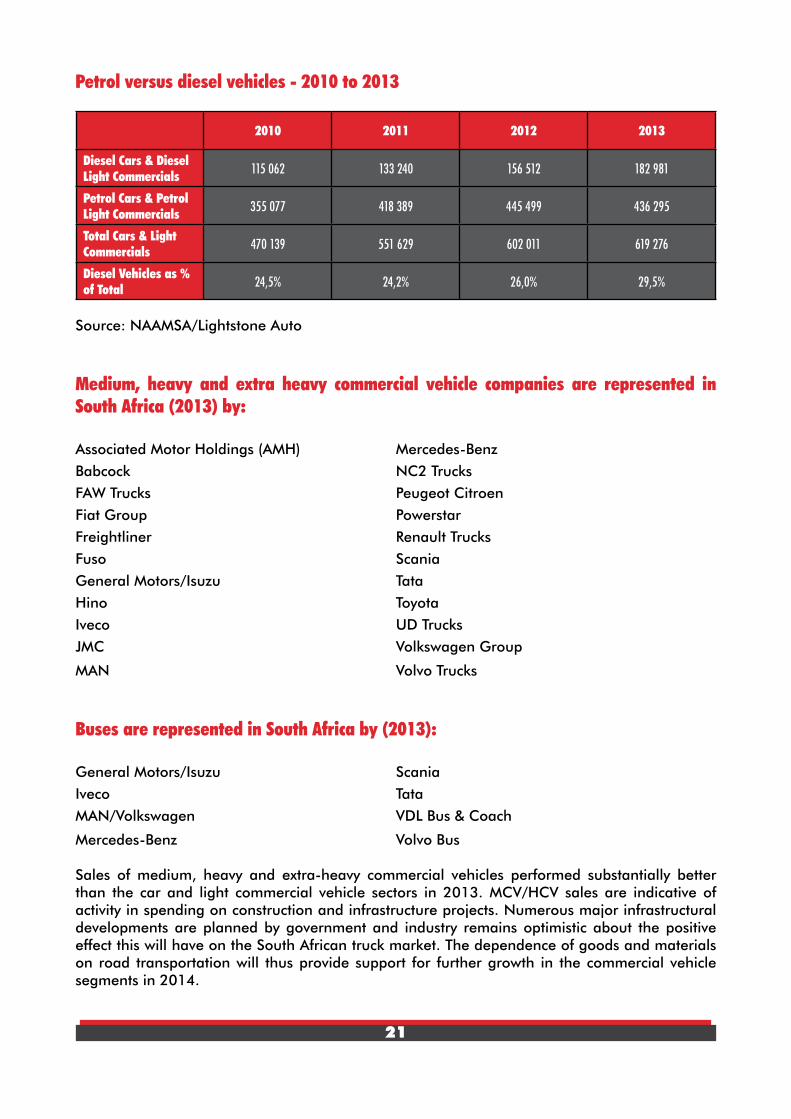
The popularity of diesel engine models has been increasing and in 2013 the market share for new diesel light vehicle (passenger car and light commercial vehicle) sales accounted for 29,5% of total light vehicle sales, up from the 26,0% level in 2012. The following table – showing the split between sales of new petrol and diesel vehicles in South Africa – for 2010 through to 2013 - will prove of interest.
0%
5%
10%
15%
20%
25%
30%
35%
40%
White Silver Black Grey Red Blue Other
38%
20%
13% 13%
5% 5% 6%
21
Petrol versus diesel vehicles - 2010 to 2013
2010 2011 2012 2013
Diesel Cars & Diesel Light Commercials 115 062 133 240 156 512 182 981
Petrol Cars & Petrol Light Commercials 355 077 418 389 445 499 436 295
Total Cars & Light Commercials 470 139 551 629 602 011 619 276
Diesel Vehicles as % of Total 24,5% 24,2% 26,0% 29,5%
Source: NAAMSA/Lightstone Auto
Medium, heavy and extra heavy commercial vehicle companies are represented in South Africa (2013) by:
Associated Motor Holdings (AMH) Mercedes-Benz
Babcock NC2 Trucks
FAW Trucks Peugeot Citroen
Fiat Group Powerstar
Freightliner Renault Trucks
Fuso Scania
General Motors/Isuzu Tata
Hino Toyota
Iveco UD Trucks
JMC Volkswagen Group
MAN Volvo Trucks
Buses are represented in South Africa by (2013):
General Motors/Isuzu Scania
Iveco Tata
MAN/Volkswagen VDL Bus & Coach
Mercedes-Benz Volvo Bus
Sales of medium, heavy and extra-heavy commercial vehicles performed substantially better than the car and light commercial vehicle sectors in 2013. MCV/HCV sales are indicative of activity in spending on construction and infrastructure projects. Numerous major infrastructural developments are planned by government and industry remains optimistic about the positive effect this will have on the South African truck market. The dependence of goods and materials on road transportation will thus provide support for further growth in the commercial vehicle segments in 2014.

22
Assembly of medium and heavy commercial vehicles and buses - 2010 to 2013
MEDIUM AND HEAVY COMMERCIALS
MarketExports as a % of total
Domestic Exports Total
2010 22 021 861 22 882 3,8
2011 26 656 803 27 459 2,9
2012 27 841 1 076 28 917 3,7
2013 30 922 1 201 32 123 3,7
2014* 33 000 1 400 34 400 4,1
* projected figuresSource: NAAMSA/Lightstone Auto
Medium and heavy commercial vehicles are regarded as productive assets and major cost drivers to the entire economy. Therefore the level of protection on these vehicles has been set at 20% ad valorem, which is lower than the level on light commercial vehicles and passenger cars. Assembly operations of these vehicles are characterized by the duty-free importation of all the drive line components, which include the engines, transmissions, drive-axles and gear boxes. Tyres, which are manufactured domestically, are excluded and attract a 15% import duty. The physical transfer of goods exported by a country is a reflection of economic competitiveness. The demand for freight transport is therefore closely linked to the economy of a country and its interactions with other countries.
Automotive parts and accessories
A diverse range of original equipment components, parts and accessories are manufactured in the country by about 500 automotive component suppliers, including 120 first tier suppliers. The profiles and contact details of the major automotive component suppliers in South Africa can be accessed in the NAACAM Directory at www.naacam.co.za.

23
AUTOMOTIVE EXPORTS AND IMPORTS -METHODOLOGY
The trade data in this publication is reflected for South Africa. A significant change in South Africa’s trade statistics, as approved by the Minister of Finance on 14 November 2013, is that South African trade with member countries of the Southern African Customs Union (SACU), namely Botswana, Lesotho, Namibia and Swaziland (BLNS), would now be included in South Africa’s trade data to provide a more accurate reflection of the country’s trade. BLNS country trade data has previously not been included in the country’s trade statistics because of the free interchange of goods between member countries from a customs point of view within SACU. The automotive industry’s trade performance has subsequently been revised with BLNS country data, with retrospective effect to 2010, where applicable.
The trade data in the Automotive Export Manual – 2014 – South Africa publication is based on the detailed Customs and Excise statistics for products eligible under the APDP, obtained from the South African Revenue Service (SARS). The Customs and Excise export values reflect free on board (FOB) values in nominal terms. The export values of the latest year (2013) are used to rank the countries in order of priority, from the most to the least important export country destination. The same principle is applied so as to prioritise the export data regarding regions, vehicles and component categories. Approximately 263 country export destinations are listed by SARS. For purposes of relevance, one million Rand (R1 million) is used in the Automotive Export Manual – 2014 – South Africa publication as a cut off level to determine the top 152 South African export country destinations. For ease of reference and for comparison purposes, the data with respect to the component categories and for countries, where applicable, is placed in alphabetical order. Percentages are rounded off.
The main purpose of this publication is to discern and highlight export and import trends, to prioritise export country destinations, to prioritise countries of origin, to identify opportunities via potential growth country and region destinations as well as to identify growth in products exported to specific country destinations. The publication also serves as a guide to track the export and import performance of the South African automotive industry under the new APDP. Due to certain limitations, Customs and Excise statistics cannot always distinguish between automotive components eligible in terms of the APDP and non-APDP components and certain categories may contain a small percentage of non-APDP components.
24 EXPORTS
EXPORTS TO REGIONS
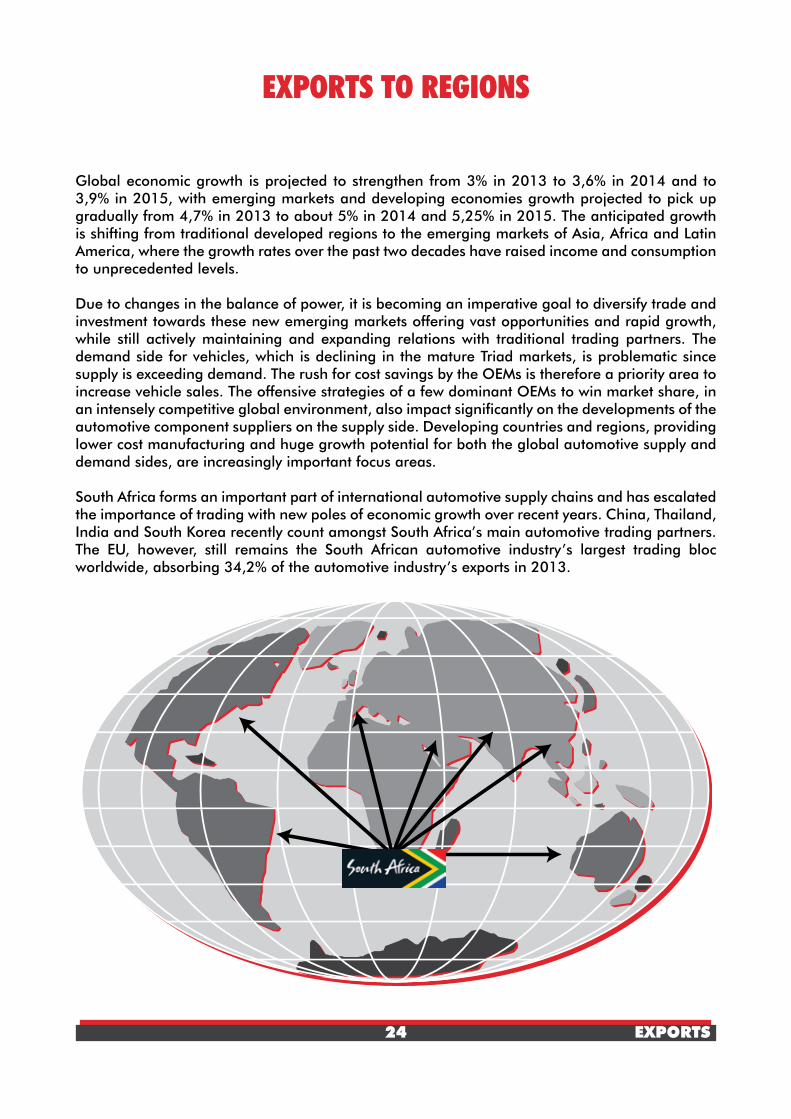
Global economic growth is projected to strengthen from 3% in 2013 to 3,6% in 2014 and to 3,9% in 2015, with emerging markets and developing economies growth projected to pick up gradually from 4,7% in 2013 to about 5% in 2014 and 5,25% in 2015. The anticipated growth is shifting from traditional developed regions to the emerging markets of Asia, Africa and Latin America, where the growth rates over the past two decades have raised income and consumption to unprecedented levels.
Due to changes in the balance of power, it is becoming an imperative goal to diversify trade and investment towards these new emerging markets offering vast opportunities and rapid growth, while still actively maintaining and expanding relations with traditional trading partners. The demand side for vehicles, which is declining in the mature Triad markets, is problematic since supply is exceeding demand. The rush for cost savings by the OEMs is therefore a priority area to increase vehicle sales. The offensive strategies of a few dominant OEMs to win market share, in an intensely competitive global environment, also impact significantly on the developments of the automotive component suppliers on the supply side. Developing countries and regions, providing lower cost manufacturing and huge growth potential for both the global automotive supply and demand sides, are increasingly important focus areas.
South Africa forms an important part of international automotive supply chains and has escalated the importance of trading with new poles of economic growth over recent years. China, Thailand, India and South Korea recently count amongst South Africa’s main automotive trading partners. The EU, however, still remains the South African automotive industry’s largest trading bloc worldwide, absorbing 34,2% of the automotive industry’s exports in 2013.
25 EXPORTS
European Union
Europe remained the South African automotive industry’s most important trading partner, accounting for R35,1 billion or 34,2% of the country’s total automotive exports of R102,7 billion in 2013. Developments in the EU therefore have a direct and measurable impact on the local automotive industry’s overall performance.
South Africa’s trade relations with the EU are governed by the Trade, Development and Co-operation Agreement (TDCA). The main objective of the TDCA was to create a free-trade area between South Africa and the European Union (EU). The SA-EU Free Trade Agreement on trade, development and co-operation became effective on 1 January 2000. The agreement was based on preferential rates of import duties for certain products having been deemed to originate in the partner country. South Africa had granted duty-free status to 86% of its EU imports by 1 January 2012, while the EU had provided duty-free status to 95% of South Africa’s exports since 1 January 2010.
Initially the EU consisted of just six countries: Belgium, Germany, France, Italy, Luxembourg and the Netherlands. Denmark, Ireland and the United Kingdom joined in 1973, Greece in 1981, Spain and Portugal in 1986 and Austria, Finland and Sweden in 1995. In May 2004, the biggest ever enlargement took place with ten countries joining: Czech Republic, Cyprus, Estonia, Hungary, Latvia, Lithuania, Malta, Poland, Slovenia and Slovakia. On 1 January 2007, the EU welcomed its 26th and 27th members, Bulgaria and Romania. These new countries are also bound by the current free trade agreement. The eastern European countries which are significant in terms of vehicle production include the Czech Republic, Poland, Slovakia and Romania.
Passenger cars into the EU attract an import duty of 10% while original equipment components an import duty of 3% and aftermarket automotive parts an import duty of 4,5%. Effectively from 1 January 2000, when the SA-EU Free Trade agreement was signed, the applied tariffs for automotive components into the EU were reduced by 50% below normal EU duty rates. On 1 January 2002, the EU improved the preference extended to South Africa under its Generalised System of Preference (GSP) to 3,5%. This meant that South African passenger car exports into the EU only attracted an import duty of 6,5% while original equipment components as well as aftermarket automotive components could be exported duty-free. As from 15 December 2006, with the finalisation of the automotive part of the SA-EU Free Trade Agreement, the 10% import duty on passenger cars was reduced to 3,5% on 15 December 2006, to 1,5% on 1 January 2007 and fell away completely in January 2008. South African commercial vehicle exports to the EU were already duty-free and unaffected by the agreement. South Africa returned the compliment with a 7% preference to the EU on passenger cars and light commercial vehicles and an 8% preference on medium and heavy commercial vehicles and buses. Original equipment components will get no preference but a large number of aftermarket automotive parts will qualify for lower import duties. In order to qualify for zero tariff into the EU, South African vehicles and components must contain at least 60% local content. The definition of local content includes South African raw materials, labour, parts, transport, manufacturing costs and profit margins, as well as the value of components and subcomponents originally sourced from Europe.
For South Africa, the success of its relationship with the EU has shown the value of a pragmatic, interest-based foreign policy. Total automotive exports (vehicles and components) to the EU increased by R1,07 billion or 3,1% to R35,1 billion in 2013 from the R34,0 billion in 2012,

26 EXPORTS
with notable increases in exports to the UK, Germany, Belgium and Spain. Exports to the 12 new member countries forming part of the expanded EU amounted to R2,60 billion or 7,4% of the R35,1 billion export value in 2013, declining from the R3,41 billion export value in 2012. Total automotive exports in Rand value terms increased by 3,1% year-on-year, but in Euro terms declined by 15,1%, in line with the 21,5% depreciation of the Rand against the Euro during 2013.
Exports to the European Union (EU) - 2010 to 2013
Component 2010 2011 2012 2013TOTAL (R million) 33 116,4 38 577,4 34 030,7 35 096,2TOTAL (average Euro million) 3 410,5 3 827,1 3 225,7 2 737,6Air conditioners 4,4 17,7 22,1 22,1Alarm systems 41,0 35,0 29,6 39,0Automotive tooling 56,7 104,0 160,6 161,5Axles 34,8 125,7 92,5 186,6Batteries 20,8 35,5 28,7 68,8Body parts / panels 28,2 25,8 22,1 30,9Brake parts 31,9 37,4 21,7 21,7Car radios 11,0 30,0 36,1 0,5Catalytic converters 11 886,1 16 013,7 12 389,9 13 288,6Clutches / shaft couplings 198,0 143,8 140,1 169,8Engines 17,6 6,1 16,3 7,5Engine parts 728,1 741,0 834,0 1 019,3Filters 143,0 165,3 131,7 157,0Gaskets 31,5 29,6 34,2 42,7Gauges / instruments / parts 38,1 45,2 42,9 44,7Gear boxes 7,0 68,8 14,8 4,5Glass 284,1 256,0 210,6 324,9Ignition / starting equipment 35,5 22,2 15,4 21,7Jacks 20,4 14,2 22,8 10,6Lighting equipment 137,7 139,2 131,4 154,7Radiators / parts 489,2 642,3 577,3 74,4Road wheels / parts 323,3 401,4 251,5 123,7Seats 0,3 0,6 0,3 0,5Seat belts 0,5 1,1 0,7 0,4Stitched leather seats 2 871,1 2 157,3 1 693,4 1 499,3Shock absorbers / suspension parts 296,6 373,8 366,5 386,6Silencers / exhausts 1 415,9 1 790,4 1 326,8 839,7Springs 21,3 21,5 7,8 7,3Steering wheels / columns 131,0 110,0 123,9 131,8Transmission shafts 159,6 230,5 247,0 217,1Tyres 381,3 624,3 392,5 274,4Wiring harnesses 40,4 61,1 63,9 75,9Other parts 714,2 1 423,5 1 250,0 1 838,9Light vehicles 12 446,2 12 619,2 13 327,2 13 841,6Medium / Heavy vehicles 69,6 64,2 4,4 7,5
Source: AIEC, SARS

27 EXPORTS
Top export destinations in the EU with export value - 2013

28 EXPORTS
NAFTA (North American Free Trade Area)
The North American Free Trade Area consists of the USA, Canada and Mexico and was South Africa’s second largest trading region. Exports amounted to R19,1 billion or 18,6% of total automotive exports of R102,7 billion in 2013.
South Africa is a beneficiary of the USA’s Generalised System of Preference (GSP), which was instituted on 1 January 1976 and grants duty-free status to some goods. Since 2001 trade with the USA has significantly increased under the African Growth and Opportunity Act (AGOA), which is an extension of the GSP and allows duty-free access of additional products into the USA. AGOA represents a non-reciprocal gesture by the USA aimed at liberalizing trade and assisting the growth and development of sub-Saharan African countries by extending duty-free and quota-free access into the USA market in respect of a broad range of products. South Africa, together with 39 other African countries, have been designated as eligible countries in terms of the Act. The effective commencement date of the duty-free access provisions in terms of AGOA was 1 January 2001. The first expiry date was until 30 September 2008, which was subsequently extended until 30 September 2015. AGOA provides three important benefits to sub-Saharan African exporters. Firstly, it extends the duty-free treatment under the GSP programme to September 2015. Secondly, AGOA eliminates most of the limitations of the GSP programme for sub-Saharan African countries. Thirdly, AGOA expands the product coverage of the GSP programme exclusively for products of sub-Saharan Africa. The Rule of Origin requirement is that 35% of the value added on the output should come from the production activities in the country claiming AGOA preference. The 35% value added can be met by including the production of raw materials from other AGOA beneficiaries.
Under AGOA, 98% of South African exports to the US enter the country without tariffs or quotas. Various automotive components and, importantly, motor cars as well as motor vehicles for the transportation of persons and of goods now qualify for a duty-free and quota-free access into the USA. Duty rates into the USA normally range from 2,5% to 25% in respect of various types of vehicles.
Under AGOA, trade in automotive products between the United States and South Africa has grown substantially in recent years as American consumers benefit from the reduced import duties. Imports of vehicles, original equipment components as well as replacement parts into South Africa have also increased substantially. The interests of American automotive corporations are well represented in South Africa. Ford Motor Company and General Motors are long established, leading automotive producing corporations in South Africa. Moreover, most of the top American automotive parts suppliers are represented in South Africa, including Johnson Controls, Lear, TRW Automotive, Tenneco, Federal Mogul, Delphi, Visteon and ArvinMeritor, amongst others. All of these companies have built strong business links between their South African operations and other international stakeholders, including those in the US. AGOA and its extension beyond 2015 will be good for Africa’s growth and development and will also be beneficial to US companies hoping to tap into new growth markets in Africa. It is important for South Africa to share the same treatment under AGOA as all countries in the region otherwise if preferences were to be offered only to certain countries, this could be counterproductive because they would inhibit the natural development of integrated value chains in the region. AGOA needs to be optimised within an investor and exporter friendly long term framework.
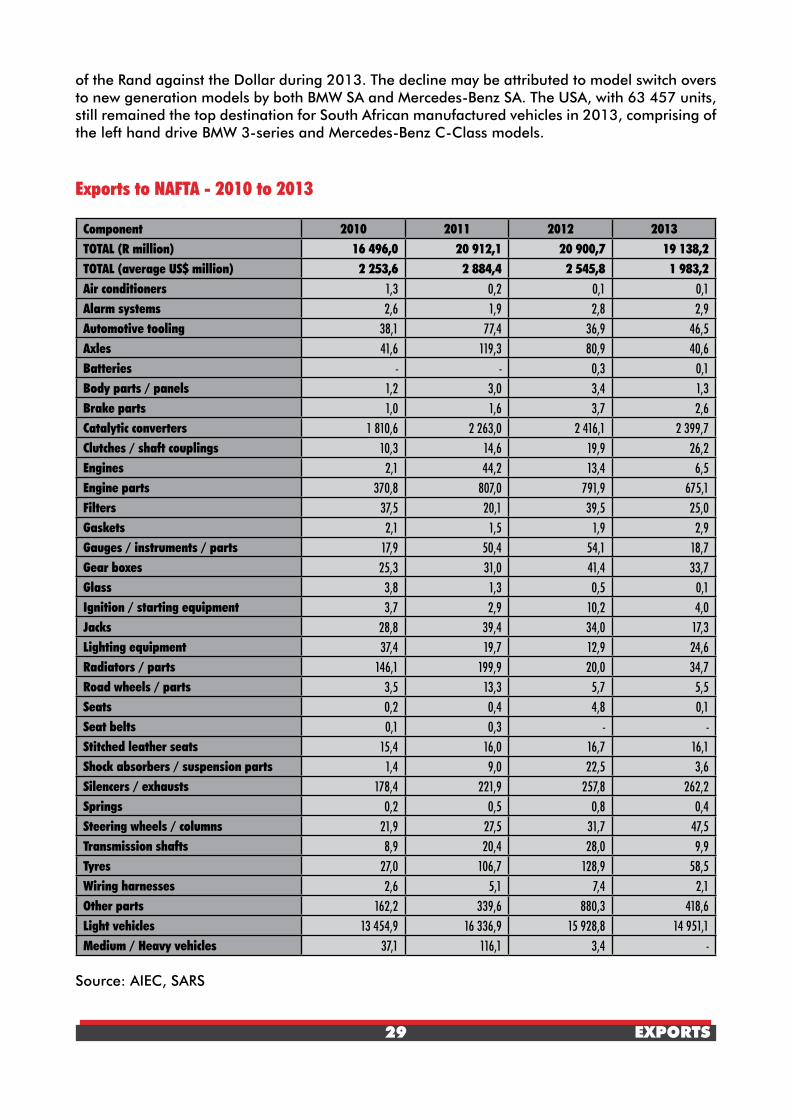
In 2013 exports to NAFTA amounted to R19,1 billion, a decline of 8,4% from the R20,9 billion exported in 2012, and declined by 22,1% in US Dollar terms, in line with the 17,5% depreciation
29 EXPORTS
of the Rand against the Dollar during 2013. The decline may be attributed to model switch overs to new generation models by both BMW SA and Mercedes-Benz SA. The USA, with 63 457 units, still remained the top destination for South African manufactured vehicles in 2013, comprising of the left hand drive BMW 3-series and Mercedes-Benz C-Class models.
Exports to NAFTA - 2010 to 2013
Component 2010 2011 2012 2013TOTAL (R million) 16 496,0 20 912,1 20 900,7 19 138,2TOTAL (average US$ million) 2 253,6 2 884,4 2 545,8 1 983,2Air conditioners 1,3 0,2 0,1 0,1Alarm systems 2,6 1,9 2,8 2,9Automotive tooling 38,1 77,4 36,9 46,5Axles 41,6 119,3 80,9 40,6Batteries - - 0,3 0,1Body parts / panels 1,2 3,0 3,4 1,3Brake parts 1,0 1,6 3,7 2,6Catalytic converters 1 810,6 2 263,0 2 416,1 2 399,7Clutches / shaft couplings 10,3 14,6 19,9 26,2Engines 2,1 44,2 13,4 6,5Engine parts 370,8 807,0 791,9 675,1Filters 37,5 20,1 39,5 25,0Gaskets 2,1 1,5 1,9 2,9Gauges / instruments / parts 17,9 50,4 54,1 18,7Gear boxes 25,3 31,0 41,4 33,7Glass 3,8 1,3 0,5 0,1Ignition / starting equipment 3,7 2,9 10,2 4,0Jacks 28,8 39,4 34,0 17,3Lighting equipment 37,4 19,7 12,9 24,6Radiators / parts 146,1 199,9 20,0 34,7Road wheels / parts 3,5 13,3 5,7 5,5Seats 0,2 0,4 4,8 0,1Seat belts 0,1 0,3 - -Stitched leather seats 15,4 16,0 16,7 16,1Shock absorbers / suspension parts 1,4 9,0 22,5 3,6Silencers / exhausts 178,4 221,9 257,8 262,2Springs 0,2 0,5 0,8 0,4Steering wheels / columns 21,9 27,5 31,7 47,5Transmission shafts 8,9 20,4 28,0 9,9Tyres 27,0 106,7 128,9 58,5Wiring harnesses 2,6 5,1 7,4 2,1Other parts 162,2 339,6 880,3 418,6Light vehicles 13 454,9 16 336,9 15 928,8 14 951,1Medium / Heavy vehicles 37,1 116,1 3,4 -
Source: AIEC, SARS

30 EXPORTS
Top export destinations in NAFTA with export value - 2013

31 EXPORTS
Africa
Africa is the youngest continent in terms of age of its population with more than 50% of the continent’s population being younger than 20, compared with only 28% of China’s population, underlining the continent’s huge comparative advantage and growth potential. African companies are attracting increasing investor attention due to the spending power of the rising middle class and expansion of its natural resources sector. Unsurprisingly, Africa is the second fastest growing continent in the world, after Asia, and offers the highest return on investment than any other region.
Africa’s challenge is to move off an economic growth path built on consumption and commodity exports onto a more sustainable developmental path based on industrialisation. Africa’s ongoing initiatives to advance regional integration and infrastructural development are vital in this respect. With a potential of one billion consumers, Africa’s ascension into one of the fastest growing economies has created massive demand for infrastructure, goods and services. The International Monetary Fund (IMF) predicts that over the next five years, Africa will surpass Asia and seven African nations will be in the top 10 fastest growing economies. These include Ethiopia, Mozambique, Tanzania, Republic of Congo, Ghana, Zambia and Nigeria. Many African countries were in a different state of economic and political development but over the next five to 10 years an increasing number of people on the continent will have sufficient disposable income to purchase a vehicle, which would thus drive industry sales.
South Africa continues to actively participate in African processes and continues to work together with other African countries in pursuing the development of the continent along the lines of the New Partnership for Africa’s Development (Nepad), including the pursuit of an economically integrated Africa. The vision of Nepad is for a self-reliant, innovative and enterprising Africa through the building of export capacity for African companies, attracting new investments from around the world and growing inter-African trade to facilitate faster economic growth on the African continent.
South Africa, as the economic powerhouse of the continent, is well positioned as a base from which investors can access the aggressively growing economies of the rest of Africa. South Africa is a key investment location, both for the market opportunities that lie within its borders and for the possibility to use the country as a gateway to the rest of the continent. Several global companies have accordingly chosen to locate their African headquarters in South Africa and have used the capabilities developed in the country to expand into the region. South Africa therefore serves as a platform to access the broader African opportunity, which underpins the choice of the country as a gateway into the continent.
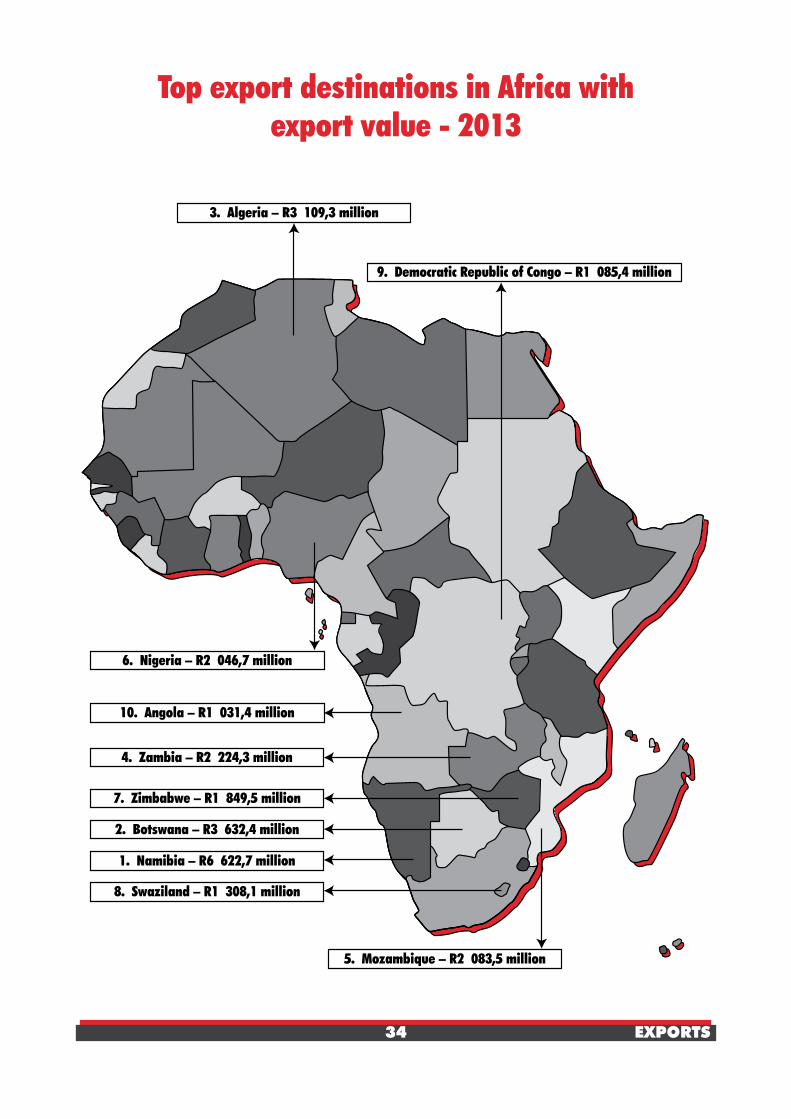
South Africa represented the biggest domestic market for vehicles in Africa and accounted for 72% of the continent’s vehicle production in 2013. Africa remained South Africa’s main export region for commercial vehicles in 2013. Due to the limited levels of vehicle production on the rest of the continent, a diverse range of automotive components are exported by South Africa to the majority of countries in Africa, but the bulk of these exports consists of aftermarket replacement parts.
The following table reflects South African automotive exports to the African continent. Annual comparisons should take account of the following – the 2013 total automotive export data to Africa provides two comparisons: one comparison includes exports to Botswana, Lesotho,
32 EXPORTS
Namibia and Swaziland (BLNS countries) in line with the new publishing format of South African trade data provided by SARS, and the other comparison excludes exports to BLNS countries in order to facilitate historical comparisons. Total automotive exports to Africa, excluding BLNS country data, increased only by 0,5% or R91 million, following the significant 53,6% increase of the previous year. Total automotive exports, including BLNS country data, increased by 16,8% or R4,3 billion, mainly due to an increase in export sales to Namibia and Botswana. Vehicle exports to 42 African countries declined from 80 293 units in 2012 to 78 787 units in 2013.

33 EXPORTS
Exports to Africa - 2010 to 2013
Component 2010 2011 2012 2013 2013TOTAL (R million)Including BLNS country data 17 707,4 19 997,2 25 862,2 30 194,5**
TOTAL (R million) Excluding BLNS country data 8 719,2 11 588,9 17 796,9 17 887,9*
Air conditioners 10,7 12,6 18,6 18,1 30,1Alarm systems 22,3 14,7 21,4 21,6 36,6Automotive tooling 88,5 99,7 314,8 291,1 396,8Axles 13,7 20,9 42,9 61,4 87,3Batteries 94,3 106,3 146,7 166,6 209,8Body parts / panels 26,2 23,6 80,8 77,6 144,9Brake parts 49,1 33,6 54,4 70,6 145,7Car radios 8,6 5,8 9,9 8,2 24,2Catalytic converters 29,2 63,8 90,2 86,1 107,0Clutches / shaft couplings 16,2 20,9 31,9 29,6 72,5Engines 97,8 104,7 194,2 187,3 238,8Engine parts 181,2 182,5 339,5 334,1 585,0Filters 99,1 110,4 162,4 154,7 207,7Gaskets 35,0 33,1 59,1 79,1 106,7Gauges / instruments / parts 126,1 164,6 210,5 244,7 312,8Gear boxes 16,7 19,3 31,6 41,2 74,3Glass 10,8 11,9 13,4 15,7 54,6Ignition / starting equipment 37,1 61,1 73,3 64,5 136,2Jacks 7,8 14,3 15,0 24,0 26,9Lighting equipment 22,7 25,6 34,5 42,6 53,8Radiators / parts 16,4 22,2 32,4 29,5 58,4Road wheels / parts 21,0 21,3 70,8 68,3 110,3Seats 2,9 2,0 3,7 4,3 9,7Seat belts 1,2 1,5 1,5 1,7 4,2Stitched leather seats 3,4 10,0 2,4 4,7 11,0Shock absorbers / suspension parts 19,3 31,7 33,1 33,8 58,5Silencers / exhausts 6,4 4,6 8,7 5,7 15,5Springs 2,2 4,7 6,8 10,2 16,9Steering wheels / columns 7,3 5,9 11,0 12,1 20,1Transmission shafts 172,6 219,7 267,2 322,9 448,6Tyres 583,4 685,6 810,8 725,3 1 352,6Wiring harnesses 2,9 2,8 12,3 12,2 33,2Other parts 1 494,4 1 768,4 2 517,2 2 846.8 5 325,8Light vehicles 4 627,5 6 917,7 10 857,2 10 598,9 16 958,1Medium / Heavy vehicles 765,2 761,4 1 216,7 1 192,7 2 719,9
Source: AIEC, SARS* Comparison excluding BLNS (Botswana, Lesotho, Namibia and Swaziland) country exports** Comparison including BLNS (Botswana, Lesotho, Namibia and Swaziland) country exports
34 EXPORTS
Top export destinations in Africa with export value - 2013

35 EXPORTS
Southern African Development Community (SADC)
Within Africa, automotive exports to SADC comprised 72,4% of the continent’s automotive exports and 21,3% of total South African automotive exports of R102,7 billion in 2013.
Sub-Saharan Africa represents 1,6% of the world’s economy. Over the next 20 to 30 years, sub-Saharan Africa’s urban population is expected to more than double, creating lucrative demand opportunities for domestic and international manufacturers of goods. The region’s growth remains positive on the back of increased investment flows, rising consumer spending and the coming on stream of new mineral exports in a number of countries within the region. It is, however, important for sub-Saharan Africa, as a global growth frontier, to move away from its current economic growth path that relies almost exclusively on resource extraction and exports, towards a more sustainable development path that promotes industrialisation and value addition. Industrialisation offers the best chance for generating jobs and income, creating a middle class and improving individual lives. In this regard, infrastructure development is important, as it is not only an enabler of competitiveness and trade, but also a stimulant of economic growth.
South Africa’s participation in the Southern African Development Community (SADC), comprising of 15 sub-Saharan African countries, allows access to a market of approximately 280 million people and a regional GDP of US$471 billion. SADC operates as a Free Trade Area. The 15 SADC countries include Angola, Botswana, Democratic Republic of Congo, Lesotho, Madagascar, Malawi, Mauritius, Mozambique, Namibia, Seychelles, South Africa, Swaziland, Tanzania, Zambia and Zimbabwe. South Africa joined the SADC in August 1994. The SADC Protocol on Trade was signed on 24 August 1996 and came into force on 25 January 2000. The SADC FTA was launched in 2008 when 85% of tariff lines became duty-free. The remaining 15% tariff lines were deemed sensitive and were accorded a longer liberalisation time frame up to 2012, except for Mozambique, which would complete its tariff phase down with respect to imports from South Africa by 2015. Eleven members implemented the Protocol in September 2000 after ratification. Currently Angola, Seychelles and the Democratic Republic of Congo remain outside the agreement. To date, all signatories except for Zimbabwe have translated their commitments into domestic enabling legislation. Angola has not yet made an offer or implemented the SADC Trade Protocol, while the Democratic Republic of Congo and Seychelles, even though members of SADC, are not party to the SADC Trade Protocol. The Seychelles is in the process of becoming a party to the Trade Protocol. Its tariff offer was recently accepted on a technical level, and will in June 2014 be submitted to the Committee of Ministers of Trade for approval. Thereafter, the Seychelles would be in a position to complete its internal processes to ratify its accession and implement the tariff phase down schedule. The intention is that the agreement encourages economies of scale, creating competitive SADC-wide industries and thereby increasing intra-regional trade and enhancing foreign investment in the region. Given the high level of competition for foreign direct investment among emerging markets, South Africa has placed great importance on forming strong economic trading blocs in order to gain access to key markets. The SADC agreement consists of general objectives rather than specific obligations. The key policy objective is to strengthen trade and development linkages between South Africa and other SADC countries. By 2012, about 98% of SADC merchandise trade will be subject to zero tariffs. The phase-down offers are country-specific, on the principle of reciprocity. For example, tariff preferences will be extended only to member states that have submitted their instruments of implementation.

36 EXPORTS
Several SADC countries have consistently remained amongst the South African automotive industry’s top export destinations over the past two decades. The SADC is a major export region for the country’s commercial vehicles as well as automotive components. Since no vehicles are manufactured from completely disassembled/completely knocked down parts in the SADC region, except for South Africa, a wide range of automotive components are exported from South Africa to the region but the bulk of these exports consists of aftermarket replacement parts.
The following table reflects South Africa’s automotive exports to SADC. Annual comparisons should take account of the following – the 2013 total automotive exports (vehicles and automotive components) to SADC provides two comparisons: one comparison which includes exports to Botswana, Lesotho, Namibia and Swaziland (BLNS countries), in line with the new publishing format of South African trade data provided by SARS, and the other comparison which excludes exports to BLNS countries in order to facilitate historical comparisons. Total automotive exports to SADC, excluding BLNS country data, increased by only 1,1% or R102 million, following the significant 59,5% increase of the previous year. Total automotive exports, including BLNS country data, increased by 24,8% or R4,3 billion, mainly due to an increase in export sales to Namibia and Botswana.

37 EXPORTS
Exports to Southern African Development Community (SADC) - 2010 to 2013
Component 2010 2011 2012 2013 2013
TOTAL (R million)Including BLNS country data 13 880,7 14 331,4 17 521,8 21 865,2**
TOTAL (R million) Excluding BLNS country data 4 907,1 5 930,9 9 456,4 9 558,6*
Air conditioners 3,9 11,8 16,2 12,0 24,0Alarm systems 12,3 10,4 14,5 14,5 29,5Automotive tooling 44,9 68,3 145,3 157,1 262,8Axles 12,9 19,5 40,8 59,5 85,4Batteries 92,9 105,2 145,5 164,2 207,4Body parts / panels 21,9 21,7 74,2 72,7 140,0Brake parts 24,5 28,3 43,5 56,1 131,2Car radios 7,1 5,4 6,6 7,6 23,6Catalytic converters 18,4 57,4 75,6 64,9 85,8Clutches / shaft couplings 14,1 17,1 25,3 24,0 66,9Engines 86,2 79,6 161,6 178,2 229,7Engine parts 157,3 152,8 277,2 277,9 528,8Filters 88,9 101,4 144,5 137,0 190,0Gaskets 29,4 26,7 48,1 70,2 97,8Gauges / instruments / parts 83,8 112,5 159,4 181,9 250,0Gear boxes 14,2 18,6 28,2 38,0 71,1Glass 8,9 9,6 10,4 11,9 50,8Ignition / starting equipment 33,4 55,7 67,0 56,5 128,2Jacks 6,1 11,1 12,6 19,5 22,4Lighting equipment 19,4 20,6 26,0 35,6 46,8Radiators / parts 14,1 18,8 27,9 25,8 54,7Road wheels / parts 19,8 20,3 66,2 65,8 107,8Seats 2,5 1,9 3,2 3,6 9,0Seat belts 1,0 1,4 1,2 1,4 3,9Stitched leather seats 3,3 1,4 2,2 4,2 10,5Shock absorbers / suspension parts 17,8 30,8 31,4 31,5 56,2Silencers / exhausts 5,2 3,9 7,5 5,3 15,1Springs 1,8 4,5 4,4 8,9 15,6Steering wheels / columns 5,6 5,3 9,2 7,8 15,8Transmission shafts 111,9 153,2 198,5 243,1 368,8Tyres 432,5 450,5 596,2 555,0 1 182,3Wiring harnesses 2,2 2,3 10,8 11,6 32,6Other parts 1 204,4 1 438,6 2 093,6 2 386.8 4 865,8Light vehicles 1 561,8 2 130,0 3 724,1 3 440,0 9 799,2Medium / Heavy vehicles 742,7 734,3 1 157,5 1 128,5 2 655,7
Source: AIEC, SARS* Comparison excluding BLNS (Botswana, Lesotho, Namibia and Swaziland) country exports** Comparison including BLNS (Botswana, Lesotho, Namibia and Swaziland) country exports
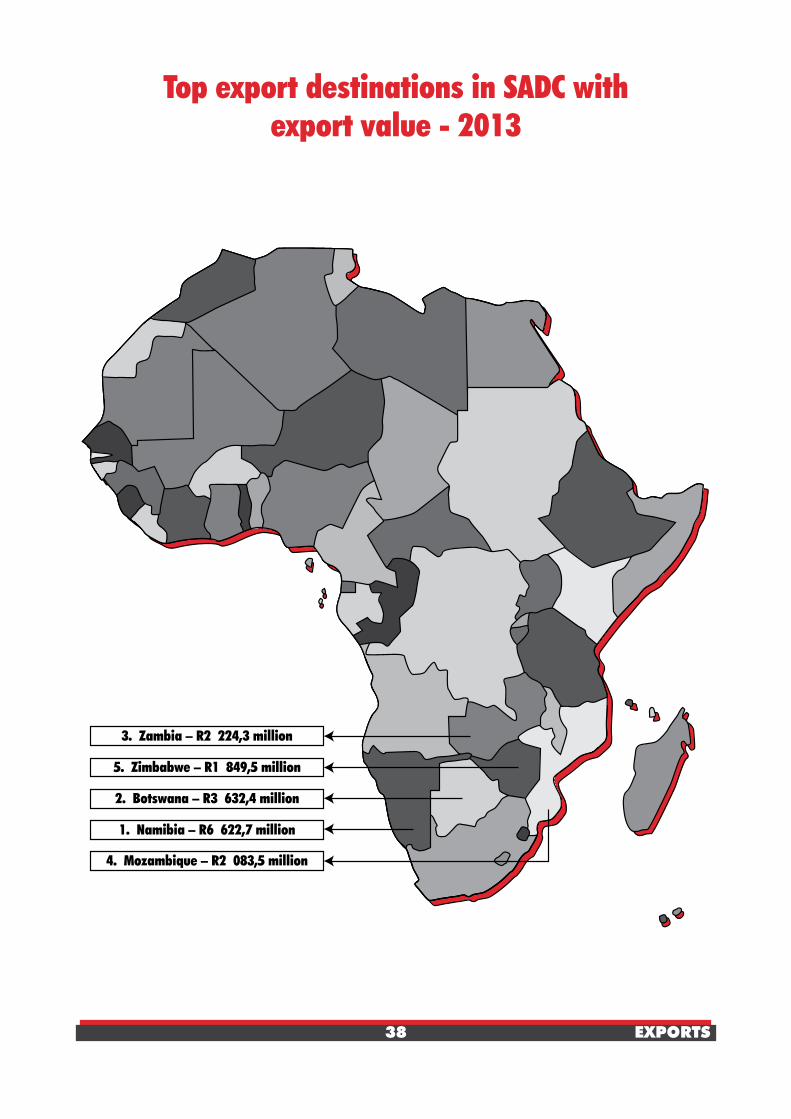
38 EXPORTS
Top export destinations in SADC with export value - 2013
39 EXPORTS
Mercosur (Mercado Común del Sur - Common Market of South America)
Mercosur was created by Argentina, Brazil, Paraguay and Uruguay in 2001, with Mexico and Venezuela recently being accepted to join. Bolivia and Chile have also been accepted, but as associate members. The commercial free trade agreement negotiations between Mercosur and South Africa began formally with the signing of a Framework Agreement in December 2000. Until December 2002, the parties opted to negotiate an Agreement on Fixed Tariff Preferences as an intermediate stage towards a free trade agreement. Since June 2003, the negotiations were expanded to include the other countries under the Southern African Customs Union (SACU). A preferential trade agreement (PTA) between SACU and Mercosur was signed in December 2004. The aim of the agreement was to strengthen existing relations, promote the expansion of trade, and establish the conditions for the creation of a free trade agreement between Mercosur and SACU. The previously concluded “Framework Agreement for the Creation of a Free Trade Area between Mercosur and the Republic of South Africa” provides for actions aimed at increasing trade and the mutual granting of tariff preferences. The understanding also makes provision for, amongst others, additional protocols on the automotive sector, customs cooperation, as well as further negotiations to broaden and deepen the Agreement, including further exchanges of trade preferences. Discussions are continuing on issues such as rules of origin, customs procedures and additional products. Future negotiations may involve the granting and winning of tariff concessions in respect of automotive products.
During 2011, Brazil increased the tax on industrialized products (IPI) to the vast automobile industry by 30 percentage points, thus impacting manufacturers who fail to meet stricter local content rules. To avoid the higher tax, car manufacturers must meet at least 6 of 11 requirements. These include the use of at least 65% of local/regional steel and 80% of local automotive parts content. In addition, car and truck manufacturers must invest in R&D to the equivalent of 0,5% of gross income. The tax rise will be felt the most by manufacturers without plants in Brazil, or those that only assemble vehicles in the country with many imported parts. In October 2012, the Brazilian government approved a new program, “Inovar-Auto,” to encourage vehicle technology innovation. The program fosters industry competitiveness by encouraging OEMs to produce more efficient, safe, and technology-advanced vehicles, while investing in the national automotive industry. Inovar-Auto provides incentives in two ways. It firstly increases a tax on industrialized products (IPI) by 30%, applicable on all light commercial vehicles (LCVs). Secondly, it imposes a series of requirements for OEMs to qualify for up to 30 percent discount in the IPI. In other words, IPI taxes will remain unchanged for those manufacturers that meet the requirements, thus incentivizing investments in vehicle efficiency, national production, research and development (R&D), and automotive technology. The program is limited to vehicles manufactured between 2013 and 2017, after which IPI rates return to pre-2013 levels, unless modifications to the decree are made. As a result of the higher tax regime, South African automotive exports to Brazil have reflected a significant decline since 2012.
Trade with Mercosur remains relatively small in the context of South Africa’s overall trade regime and total automotive exports (vehicles and components) comprised only R2,05 billion or 2,0% of South Africa’s total automotive exports of R102,7 billion in 2013. Argentina became the South African automotive industry’s top export destination in Mercosur in 2013. Exports to the region consisted of a limited range of products.
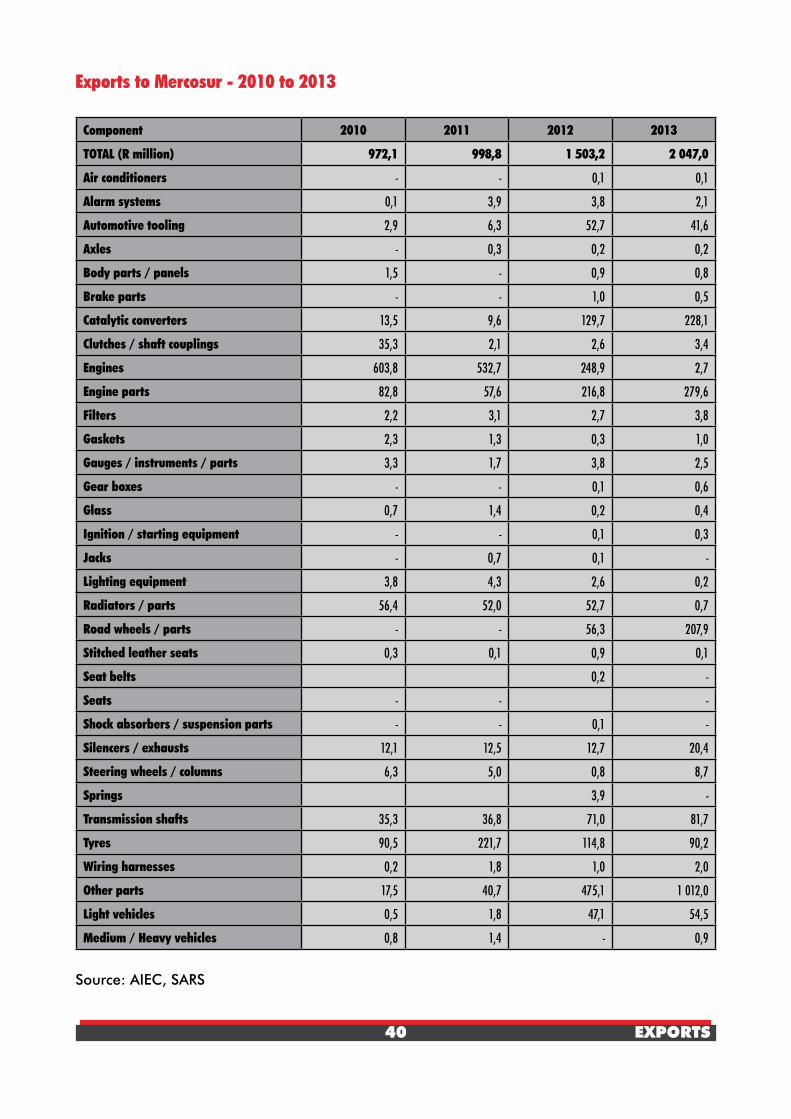
40 EXPORTS
Exports to Mercosur - 2010 to 2013
Component 2010 2011 2012 2013
TOTAL (R million) 972,1 998,8 1 503,2 2 047,0
Air conditioners - - 0,1 0,1
Alarm systems 0,1 3,9 3,8 2,1
Automotive tooling 2,9 6,3 52,7 41,6
Axles - 0,3 0,2 0,2
Body parts / panels 1,5 - 0,9 0,8
Brake parts - - 1,0 0,5
Catalytic converters 13,5 9,6 129,7 228,1
Clutches / shaft couplings 35,3 2,1 2,6 3,4
Engines 603,8 532,7 248,9 2,7
Engine parts 82,8 57,6 216,8 279,6
Filters 2,2 3,1 2,7 3,8
Gaskets 2,3 1,3 0,3 1,0
Gauges / instruments / parts 3,3 1,7 3,8 2,5
Gear boxes - - 0,1 0,6
Glass 0,7 1,4 0,2 0,4
Ignition / starting equipment - - 0,1 0,3
Jacks - 0,7 0,1 -
Lighting equipment 3,8 4,3 2,6 0,2
Radiators / parts 56,4 52,0 52,7 0,7
Road wheels / parts - - 56,3 207,9
Stitched leather seats 0,3 0,1 0,9 0,1
Seat belts 0,2 -
Seats - - -
Shock absorbers / suspension parts - - 0,1 -
Silencers / exhausts 12,1 12,5 12,7 20,4
Steering wheels / columns 6,3 5,0 0,8 8,7
Springs 3,9 -
Transmission shafts 35,3 36,8 71,0 81,7
Tyres 90,5 221,7 114,8 90,2
Wiring harnesses 0,2 1,8 1,0 2,0
Other parts 17,5 40,7 475,1 1 012,0
Light vehicles 0,5 1,8 47,1 54,5
Medium / Heavy vehicles 0,8 1,4 - 0,9
Source: AIEC, SARS

41 EXPORTS
Top export destinations in Mercosur with export value - 2013

42 EXPORTS
EXPORTS TO COUNTRIES
The reach in respect of the number of destinations of total automotive exports (vehicles and automotive components) from South Africa is increasing. The number of export destinations, for values in excess of R1 million, has increased from 62 in 1995 to 152 in 2013. The following table reveals that 21 countries recorded export values in excess of R1 billion in 2013, while 64 countries recorded export values in excess of R100 million. The main destinations for South African vehicles and automotive components remain first-world markets. Diversification into new emerging markets, however, is a continuing trend and underlines the automotive industry’s competitiveness drive and a widening of the country’s traditional trading base. New trade and business links in Africa, Asia, the Middle East, South America and, importantly, the new emerging automotive giants, China and India, are being forged.
For conversion to other currencies, please refer to the currency table on page 81.
Total automotive export value and ranking by country - 2013 vs. 2012
Country 2013R Million
2013Ranking
2012R Million
2012Ranking
Germany 19 138,7 1 18 623,1 2United States 18 660,9 2 19 869,7 1Namibia 6 622,7 3 4 230,9 3Japan 5 160,0 4 3 163,4 5United Kingdom 4 616,5 5 3 540,8 4Botswana 3 632,4 6 2 913,7 6Algeria 3 109,3 7 2 653,1 8Belgium 3 004,7 8 2 692,1 7Australia 2 555,8 9 2 201,0 10Zambia 2 224,3 10 2 283,8 9Mozambique 2 083,5 11 1 580,4 15Nigeria 2 046,7 12 2 138,8 11Zimbabwe 1 849,5 13 1 845,2 13Spain 1 847,5 14 1 595,1 14France 1 796,6 15 1 864,3 12China 1 719,9 16 1 129,5 18Argentina 1 527,0 17 786,8 26Swaziland 1 308,1 18 815,5 25Thailand 1 087,9 19 872,8 24Democratic Republic of Congo 1 085,4 20 1 047,0 20Angola 1 031,4 21 1 138,7 17
21 COUNTRIES ABOVE R1 BILLIONNetherlands 951,0 22 933,5 22Czech Republic 950,0 23 1 056,6 19

43 EXPORTS
Kenya 766,6 24 644,4 27Poland 756,8 25 1 156,6 16Lesotho 743,4 26 613,9 29Russian Federation 723,1 27 940,3 21Ghana 625,8 28 925,7 23Tanzania 519,9 29 457,2 34Malawi 516,0 30 367,9 37Turkey 441,3 31 641,8 28India 440,7 32 421,7 36Taiwan 439,8 33 275,4 40Brazil 410,6 34 594,7 31United Arab Emirates 376,6 35 256,7 42Hungary 364,7 36 607,7 30Saudi Arabia 310,3 37 64,1 76Korea Republic South 305,4 38 219,6 43Sweden 295,8 39 277,7 38Italy 270,7 40 430,0 35Singapore 264,6 41 137,6 57Oman 258,0 42 65,4 75Hong Kong, China 256,9 43 259,9 41Gabon 249,3 44 276,0 39Canada 242,0 45 465,9 33Mexico 235,3 46 565,1 32Bulgaria 222,6 47 186,4 46Mauritius 213,7 48 201,9 45Madagascar 188,0 49 149,2 55New Zealand 180,4 50 177,4 50Afghanistan 178,4 51 212,5 44Norway 171,6 52 149,4 54Romania 167,5 53 182,8 49Ethiopia 158,3 54 121,3 60Malaysia 157,5 55 165,6 53Austria 142,2 56 183,4 48Uganda 139,4 57 174,4 51Gibraltar 125,0 58 97,9 65Trinidad & Tobago 118,3 59 115,6 62Ivory Coast 117,8 60 133,9 58Estonia 117,6 61 165,7 52Chile 108,3 62 117,7 61Kuwait 103,4 63 27,9 93Switzerland 102,1 64 97,8 66
64 COUNTRIES ABOVE R100 MILLIONDjibouti 93,3 65 100,5 63Portugal 86,1 66 72,6 72Honduras 82,2 67 100,0 64Ireland 77,4 68 141,9 56

44 EXPORTS
Panama 73,9 69 66,2 74Greece 73,4 70 46,9 85Republic of Congo 62,4 71 35,8 89Morocco 61,3 72 24,1 97Tunisia 59,9 73 56,7 80Egypt 56,2 74 184,4 47Senegal 55,5 75 89,0 69Liberia 55,3 76 57,1 79Costa Rica 52,6 77 28,7 92Cameroon 48,8 78 22,0 100Mali 48,5 79 52,2 83Mauritania 48,4 80 63,4 77Sierra Leone 47,8 81 85,1 70Haiti 44,0 82 55,4 81Guadeloupe 40,5 83 48,4 84Finland 39,9 84 95,5 67Indonesia 39,6 85 62,4 78Reunion 36,2 86 55,3 82Georgia 36,0 87 130,2 59Burkina Faso 35,6 88 38,3 88Seychelles 34,7 89 25,7 96Rwanda 34,7 90 67,1 73Jordan 34,6 91 19,0 104Guinea 30,3 92 42,4 87Sudan 30,1 93 17,4 107Denmark 28,5 94 30,0 90Libya 25,8 95 8,3 117Qatar 25,6 96 75,9 71Lebanon 25,4 97 4,7 128Martinique 24,6 98 23,7 98Somalia 22,8 99 15,0 108Guatemala 20,7 100 25,9 95French Guiana 20,3 101 27,0 94Surinam 20,1 102 10,4 109Central African Republic 19,2 103 43,1 86Venezuela 18,8 104 93,9 68Iraq 18,1 105 4,2 132Israel 17,1 106 17,7 106Jamaica 16,5 107 22,6 99El Salvador 14,7 108 20,5 101Brunei 14,5 109 4,8 127Antiqua 14,2 110 2,6 141Ukraine 12,6 111 18,0 105Slovenia 11,9 112 29,4 91Benin 10,7 113 7,2 119Peru 9,9 114 7,2 118
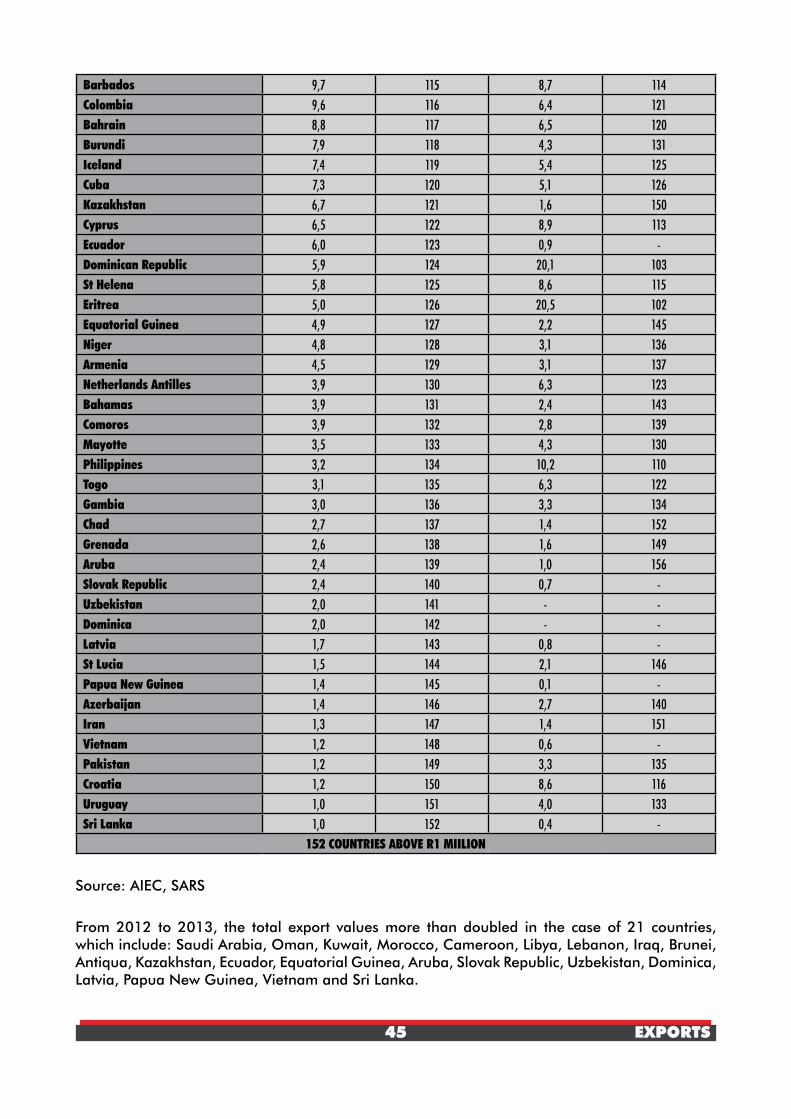
45 EXPORTS
Barbados 9,7 115 8,7 114Colombia 9,6 116 6,4 121Bahrain 8,8 117 6,5 120Burundi 7,9 118 4,3 131Iceland 7,4 119 5,4 125Cuba 7,3 120 5,1 126Kazakhstan 6,7 121 1,6 150Cyprus 6,5 122 8,9 113Ecuador 6,0 123 0,9 -Dominican Republic 5,9 124 20,1 103St Helena 5,8 125 8,6 115Eritrea 5,0 126 20,5 102Equatorial Guinea 4,9 127 2,2 145Niger 4,8 128 3,1 136Armenia 4,5 129 3,1 137Netherlands Antilles 3,9 130 6,3 123Bahamas 3,9 131 2,4 143Comoros 3,9 132 2,8 139Mayotte 3,5 133 4,3 130Philippines 3,2 134 10,2 110Togo 3,1 135 6,3 122Gambia 3,0 136 3,3 134Chad 2,7 137 1,4 152Grenada 2,6 138 1,6 149Aruba 2,4 139 1,0 156Slovak Republic 2,4 140 0,7 -Uzbekistan 2,0 141 - -Dominica 2,0 142 - -Latvia 1,7 143 0,8 -St Lucia 1,5 144 2,1 146Papua New Guinea 1,4 145 0,1 -Azerbaijan 1,4 146 2,7 140Iran 1,3 147 1,4 151Vietnam 1,2 148 0,6 -Pakistan 1,2 149 3,3 135Croatia 1,2 150 8,6 116Uruguay 1,0 151 4,0 133Sri Lanka 1,0 152 0,4 -
152 COUNTRIES ABOVE R1 MIILION
Source: AIEC, SARS
From 2012 to 2013, the total export values more than doubled in the case of 21 countries, which include: Saudi Arabia, Oman, Kuwait, Morocco, Cameroon, Libya, Lebanon, Iraq, Brunei, Antiqua, Kazakhstan, Ecuador, Equatorial Guinea, Aruba, Slovak Republic, Uzbekistan, Dominica, Latvia, Papua New Guinea, Vietnam and Sri Lanka.

46 EXPORTS
EXPORTS OF VEHICLES
The South African automotive industry exported left and right hand drive vehicles to 87 destinations in 2013. The 276 378 completely built-up vehicle (CBU) exports from South Africa comprised of 55,6% or 153 524 passenger cars, of 44,0% or 121 653 light commercial vehicles and of 1 201 or 0,4% medium and heavy commercial vehicles and buses. Passenger car exports as a percentage of passenger car production totaled 57,3% and LCVs as a percentage of LCV production totaled 48,8% in 2013.
The average volumes of passenger cars and light commercial vehicles per model produced by the OEMs has increased from 39 278 units in 2012 to 39 522 units in 2013. Five models achieved production volumes in excess of 40 000 units of which one model achieved a production volume in excess of 100 000 units. A key challenge that remains is to raise local content, particularly in the vehicles being exported in large volumes. Apart from creating additional jobs, higher local content would lend stability to the industry and substantially reduce logistics costs.
Signs are emerging of an improvement in the global economy, while the demand for light commercial vehicles in African markets is also expected to show above average growth. These trends are expected to support vehicle exports in 2014. The following table reflects that the US remained South Africa’s top destination for light vehicle exports in 2013, while Toyota SA, with its Innovative/International Multipurpose Vehicle programme and Corolla sedan, remained the leading exporter in 2013.
Light vehicles (passenger cars and light commercial vehicles) exports - 2010 to 2013
Country 2010 2011 2012 2013TOTAL (R billion) 37,9 42,3 48,7 57,7
RANKING OF EXPORTERSNumber 1 to Number 5
(1) VW, (2) Toyota,(3) MBSA, (4) BMW,
(5) Ford
(1) Toyota, (2) VW,(3) BMW, (4) MBSA,
(5) Nissan
(1) Toyota, (2) VW,(3) MBSA, (4) BMW,
(5) Ford
(1) Toyota, (2) BMW,(3) VW, (4) MBSA,
(5) FordTOTAL (units) 238 604 271 654 276 916 275 177USA 58 370 68 948 66 219 63 457UK 39 865 43 688 41 111 40 763Algeria 11 757 24 191 24 281 29 917Japan 21 348 22 475 17 226 24 869Australia 18 112 8 612 14 325 14 975Nigeria 7 151 11 671 14 874 11 704France 13 389 13 549 11 558 11 461Angola 931 1 911 7 758 7 476China 987 1 202 5 369 6 068Russia 217 1 455 6 082 5 158Other 66 477 73 952 68 113 59 329EU 90 734 98 044 87 620 79 811NAFTA 58 370 68 948 66 219 63 457AFRICA 42 533 67 442 79 228 77 589
Source: NAAMSA/Lightstone Auto
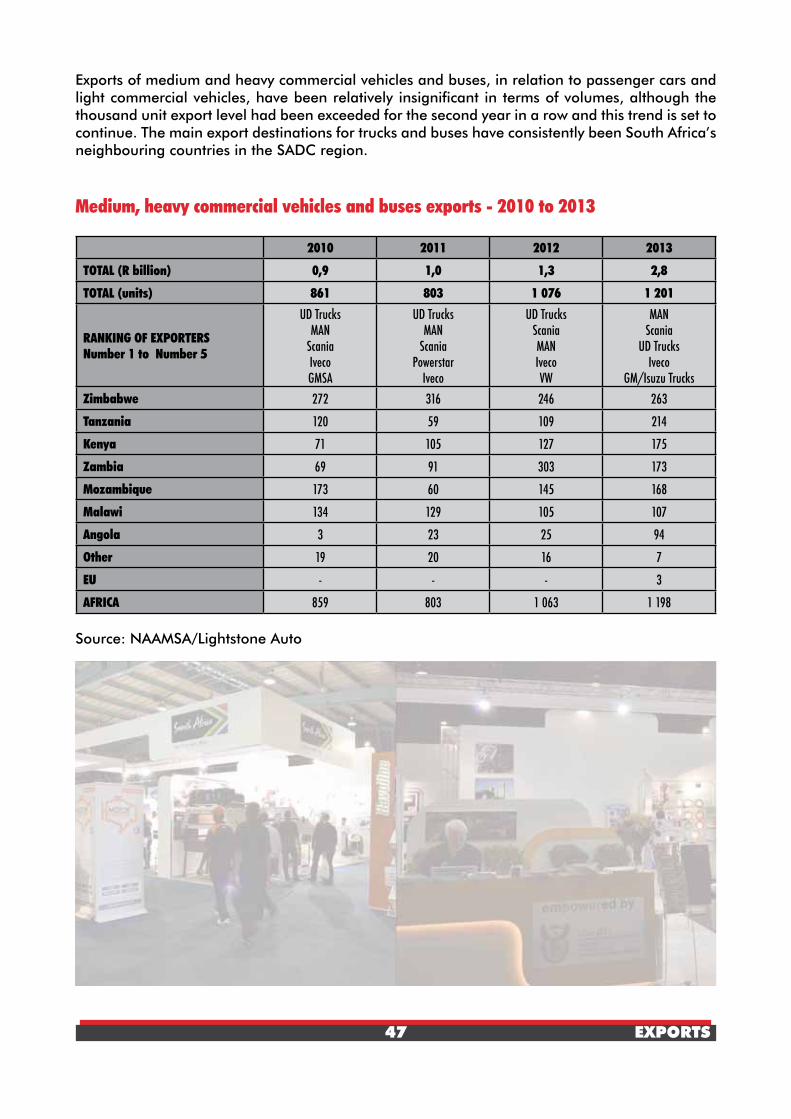
47 EXPORTS
Exports of medium and heavy commercial vehicles and buses, in relation to passenger cars and light commercial vehicles, have been relatively insignificant in terms of volumes, although the thousand unit export level had been exceeded for the second year in a row and this trend is set to continue. The main export destinations for trucks and buses have consistently been South Africa’s neighbouring countries in the SADC region.
Medium, heavy commercial vehicles and buses exports - 2010 to 2013
2010 2011 2012 2013
TOTAL (R billion) 0,9 1,0 1,3 2,8
TOTAL (units) 861 803 1 076 1 201
RANKING OF EXPORTERSNumber 1 to Number 5
UD TrucksMAN
ScaniaIvecoGMSA
UD TrucksMAN
ScaniaPowerstar
Iveco
UD TrucksScaniaMANIvecoVW
MANScania
UD Trucks Iveco
GM/Isuzu TrucksZimbabwe 272 316 246 263
Tanzania 120 59 109 214
Kenya 71 105 127 175
Zambia 69 91 303 173
Mozambique 173 60 145 168
Malawi 134 129 105 107
Angola 3 23 25 94
Other 19 20 16 7
EU - - - 3
AFRICA 859 803 1 063 1 198
Source: NAAMSA/Lightstone Auto

48 EXPORTS
AUTOMOTIVE COMPONENTS - EXPORTS BY COUNTRY
Automotive component exports, including export sales to the BLNS countries (Botswana, Lesotho, Namibia and Swaziland), as incorporated in South Africa’s trade data by SARS since 2013, increased by R2,29 billion or 5,7% to R42,18 billion in 2013, from the revised R39,88 billion in 2012. The focus of exporters tends to be on high value domestically beneficiated automotive components that are logistics friendly. Catalytic converters remained the main component exported under the APDP. This component reduces harmful emissions from vehicles, following increasingly stringent emission legislation in Europe and the USA. South Africa supplies approximately 10% of the global market for these converters.
In view of the South African automotive industry’s expanding trade pattern, many opportunities of mutual benefit exist for foreign companies to collaborate with South African automotive component suppliers. The vision to double vehicle production to 1,2 million vehicles per annum by 2020, with the associated broadening and deepening of the component production basket in the country, will ensure a major increase in business opportunities as well as enhance significantly the viability of projects in the country. The exporting link for the majority of the multinational automotive component manufacturers in South Africa consists of the South African based OEMs and their parent companies. Some of the locally owned component manufacturers have also been successful in obtaining OEM export business, while many others focus on exports of replacement parts. Consequently, component manufacturers using South Africa’s competitive advantages seek contact with outside partners for market access, technology, process know-how, production rationalization and other joint venture benefits. In addition, various other types of industry co-operation to pursue include:
• Technicalcollaboration in design of products, systems or production methods/layouts• Researchanddevelopment• Supplier/customerrelations• Jointproduction• Technologytransfer• Licensesandpatents• Marketingandco-operativepromotionofprojectsandmarketsharing• Commercialrepresentation• Franchising• Financing• Strategicalliance
• Thirdcountry collaboration
The following table reveals the automotive component export ranking by component category from 2010 through to 2013. Annual comparisons should take note of the following – the 2013 total automotive component exports provides two comparisons: one comparison which includes exports to Botswana, Lesotho, Namibia and Swaziland (BLNS countries) in line with the new publishing format of South African trade data provided by SARS, and another comparison which excludes exports to BLNS countries, in order to facilitate historical comparisons.

49 EXPORTS
Automotive component export ranking by component category - 2010 to 2013
COUNTRY 2010 2011 2012 2013* 2013**
% of total
export value
2013Ranking
TOTAL (R million)Including BLNS country data 35 283 42 534 39 883 42 176
TOTAL (R million) Excluding BLNS country data 30 802 38 823 36 867 37 771
Catalytic converters 14 761 19 639 16 347 17 620 17 641 41,8% 1Engine parts 1 505 2 058 2 875 2 938 3 189 7,6% 2Tyres 1 133 1 675 1 522 1 215 1 842 4,4% 3Stitched leather seats 2 898 2 190 1 719 1 524 1 530 3,6% 4Silencers / exhausts 1 696 2 139 1 730 1 214 1 225 2,9% 5Transmission shafts / cranks 415 569 771 800 926 2,2% 6Automotive tooling 447 438 782 671 777 1,8% 7Shock absorbers / suspension parts 329 430 440 449 474 1,1% 8Road wheels / parts 383 494 466 413 455 1,1% 9Gauges / instruments / parts 241 319 401 367 435 1,0% 10Filters 337 312 353 354 407 1,0% 11Automotive glass 305 277 230 347 386 0,9% 12Axles 111 320 252 309 335 0,8% 13Clutches / shaft couplings 270 236 225 267 310 0,7% 14Batteries 116 143 180 237 280 0,7% 15Body parts / panels 75 140 146 196 263 0,6% 16Engines 965 819 559 211 263 0,6% 17Lighting equipment 229 199 198 237 248 0,6% 18Steering wheel / columns 170 155 182 202 210 0,5% 19Brake parts 93 82 97 117 192 0,5% 20Radiators / parts 951 1 118 945 159 188 0,5% 21Ignition / starting equipment 83 103 109 113 185 0,4% 22Gaskets 75 69 100 132 160 0,4% 23Gear boxes 67 69 100 89 122 0,3% 24Wiring harnesses 51 78 94 97 118 0,3% 25Alarm systems 73 61 62 72 87 0,2% 26Jacks 83 92 103 54 57 0,1% 27Air conditioners 35 36 42 43 55 0,1% 28Springs 30 43 33 24 31 0,1% 29Car radios 20 39 47 10 26 0,1% 30Seats 5 6 11 8 13 - 31Seat belts 33 28 24 5 8 - 32Other parts 2 817 4 447 5 722 7 277 9 737 23,1%
Source: AIEC, SARS* Comparison excluding BLNS (Botswana, Lesotho, Namibia and Swaziland) country exports** Comparison including BLNS (Botswana, Lesotho, Namibia and Swaziland) country exports
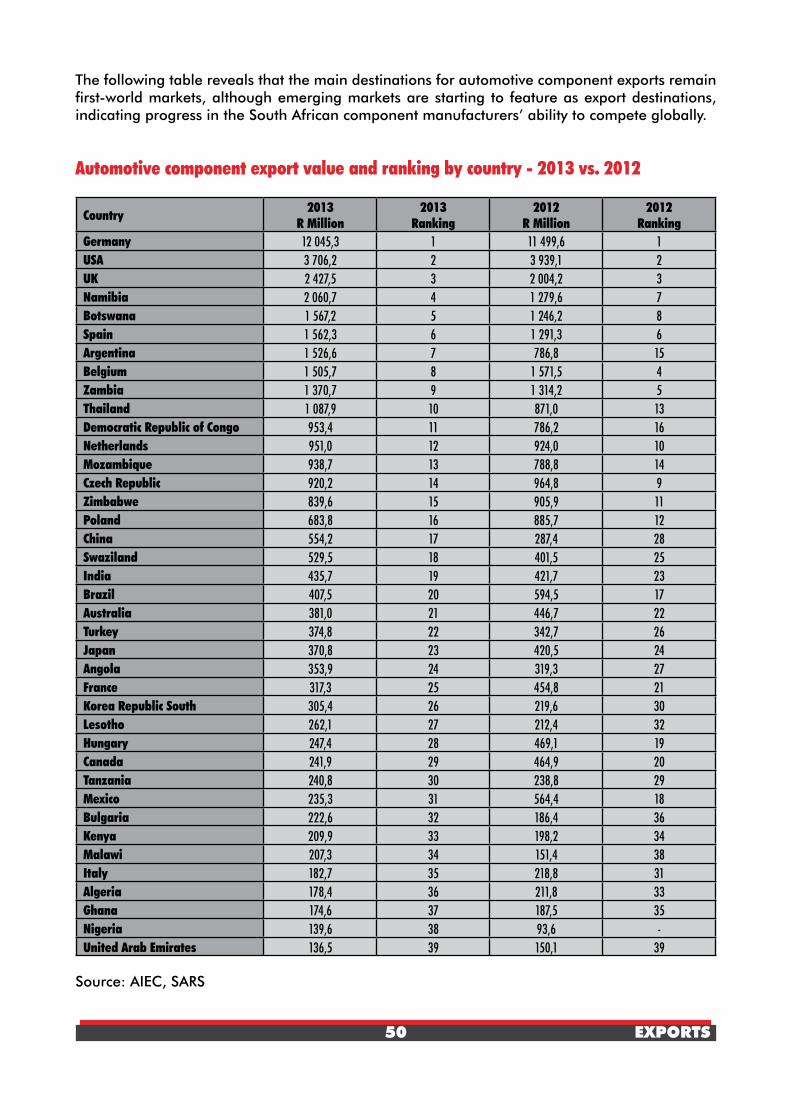
50 EXPORTS
The following table reveals that the main destinations for automotive component exports remain first-world markets, although emerging markets are starting to feature as export destinations, indicating progress in the South African component manufacturers’ ability to compete globally.
Automotive component export value and ranking by country - 2013 vs. 2012
Country 2013R Million
2013Ranking
2012R Million
2012Ranking
Germany 12 045,3 1 11 499,6 1USA 3 706,2 2 3 939,1 2UK 2 427,5 3 2 004,2 3Namibia 2 060,7 4 1 279,6 7Botswana 1 567,2 5 1 246,2 8Spain 1 562,3 6 1 291,3 6Argentina 1 526,6 7 786,8 15Belgium 1 505,7 8 1 571,5 4Zambia 1 370,7 9 1 314,2 5Thailand 1 087,9 10 871,0 13Democratic Republic of Congo 953,4 11 786,2 16Netherlands 951,0 12 924,0 10Mozambique 938,7 13 788,8 14Czech Republic 920,2 14 964,8 9Zimbabwe 839,6 15 905,9 11Poland 683,8 16 885,7 12China 554,2 17 287,4 28Swaziland 529,5 18 401,5 25India 435,7 19 421,7 23Brazil 407,5 20 594,5 17Australia 381,0 21 446,7 22Turkey 374,8 22 342,7 26Japan 370,8 23 420,5 24Angola 353,9 24 319,3 27France 317,3 25 454,8 21Korea Republic South 305,4 26 219,6 30Lesotho 262,1 27 212,4 32Hungary 247,4 28 469,1 19Canada 241,9 29 464,9 20Tanzania 240,8 30 238,8 29Mexico 235,3 31 564,4 18Bulgaria 222,6 32 186,4 36Kenya 209,9 33 198,2 34Malawi 207,3 34 151,4 38Italy 182,7 35 218,8 31Algeria 178,4 36 211,8 33Ghana 174,6 37 187,5 35Nigeria 139,6 38 93,6 -United Arab Emirates 136,5 39 150,1 39
Source: AIEC, SARS

51 EXPORTS
The following tables reveal the automotive component export details for the 39 export destina-tions recording an export value above R100 million or 0,2% of the total automotive component export value of R42,18 billion in 2013.
(1)Country Germany R12 045,3 million
1Catalytic converters
R7 179,8
2Stitched leather seats
R1 033,0
3Engine parts
R775,4
4Silencers & exhausts
R436,1
5Shock absorbers
R383,16
TyresR180,2
7Axles
R177,8
8Transmission shafts
R153,6
9Clutches & shaft
couplingsR152,2
10Lighting equipment
R124,1
(2)Country USA R3 706,2 million
1Catalytic converters
R2 167,0
2Engine parts
R671,5
3Silencers & exhausts
R183,1
4TyresR57,1
5Steering wheels &
columnsR47,4
6AxlesR40,4
7Automotive tooling
R39,4
8Radiators & parts
R34,7
9Gear boxes
R31,1
10FiltersR25,0
(3)Country United Kingdom (UK) R2 427,5 million
1Catalytic converters
R1 629,4
2Engine parts
R210,0
3GlassR89,8
4Batteries
R56,7
5Gauges & instrument
partsR26,5
6Air conditioners
R21,3
7Lighting equipment
R13,6
8Silencers & exhausts
R13,1
9Automotive tooling
R11,6
10Transmission shafts
R10,8
(4)Country Namibia R2 060,7 million
1Tyres
R194,2
2Engine parts
R114,4
3Automotive tooling
R70,2
4Gauges & instrument
partsR34,4
5Transmission shafts
R30,1
6Ignition & starting
equipmentR28,3
7Body parts & panels
R27,0
8FiltersR22,6
9Brake parts
R21,1
10GlassR18,4
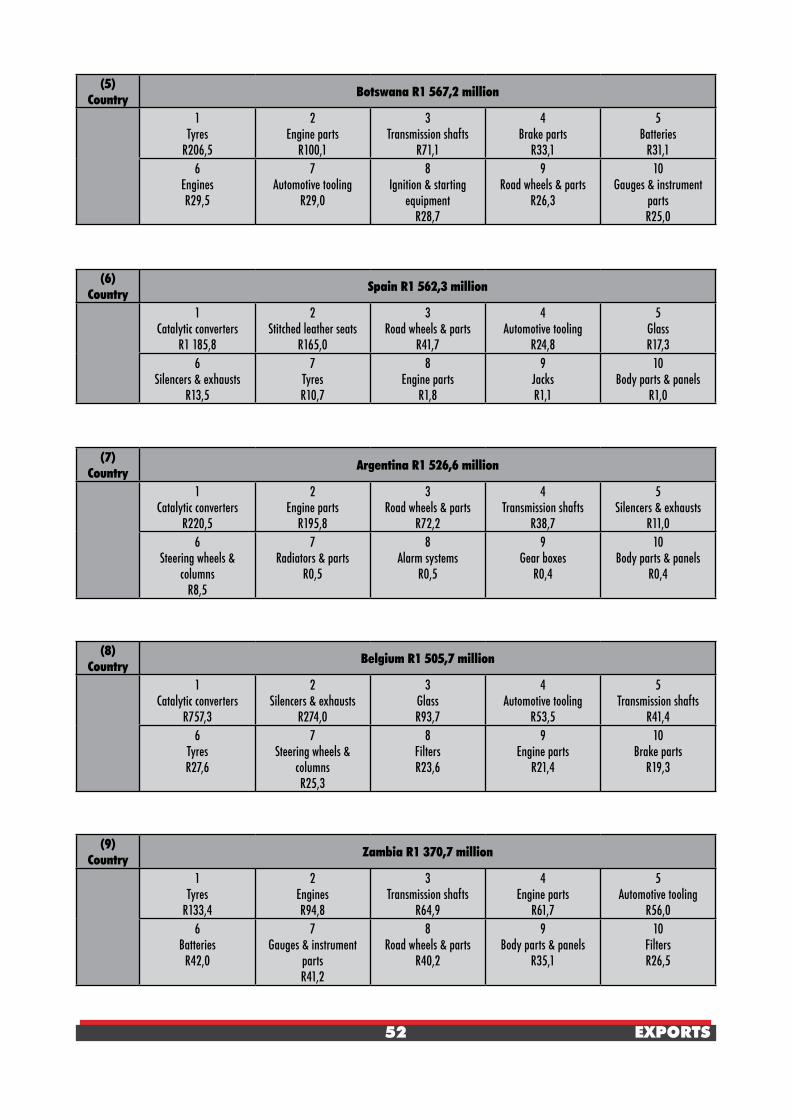
52 EXPORTS
(5)Country Botswana R1 567,2 million
1Tyres
R206,5
2Engine parts
R100,1
3Transmission shafts
R71,1
4Brake parts
R33,1
5Batteries
R31,16
EnginesR29,5
7Automotive tooling
R29,0
8Ignition & starting
equipmentR28,7
9Road wheels & parts
R26,3
10Gauges & instrument
partsR25,0
(6)Country Spain R1 562,3 million
1Catalytic converters
R1 185,8
2Stitched leather seats
R165,0
3Road wheels & parts
R41,7
4Automotive tooling
R24,8
5GlassR17,3
6Silencers & exhausts
R13,5
7TyresR10,7
8Engine parts
R1,8
9JacksR1,1
10Body parts & panels
R1,0
(7)Country Argentina R1 526,6 million
1Catalytic converters
R220,5
2Engine parts
R195,8
3Road wheels & parts
R72,2
4Transmission shafts
R38,7
5Silencers & exhausts
R11,06
Steering wheels & columns
R8,5
7Radiators & parts
R0,5
8Alarm systems
R0,5
9Gear boxes
R0,4
10Body parts & panels
R0,4
(8)Country Belgium R1 505,7 million
1Catalytic converters
R757,3
2Silencers & exhausts
R274,0
3GlassR93,7
4Automotive tooling
R53,5
5Transmission shafts
R41,46
TyresR27,6
7Steering wheels &
columnsR25,3
8FiltersR23,6
9Engine parts
R21,4
10Brake parts
R19,3
(9)Country Zambia R1 370,7 million
1Tyres
R133,4
2EnginesR94,8
3Transmission shafts
R64,9
4Engine parts
R61,7
5Automotive tooling
R56,06
BatteriesR42,0
7Gauges & instrument
partsR41,2
8Road wheels & parts
R40,2
9Body parts & panels
R35,1
10FiltersR26,5
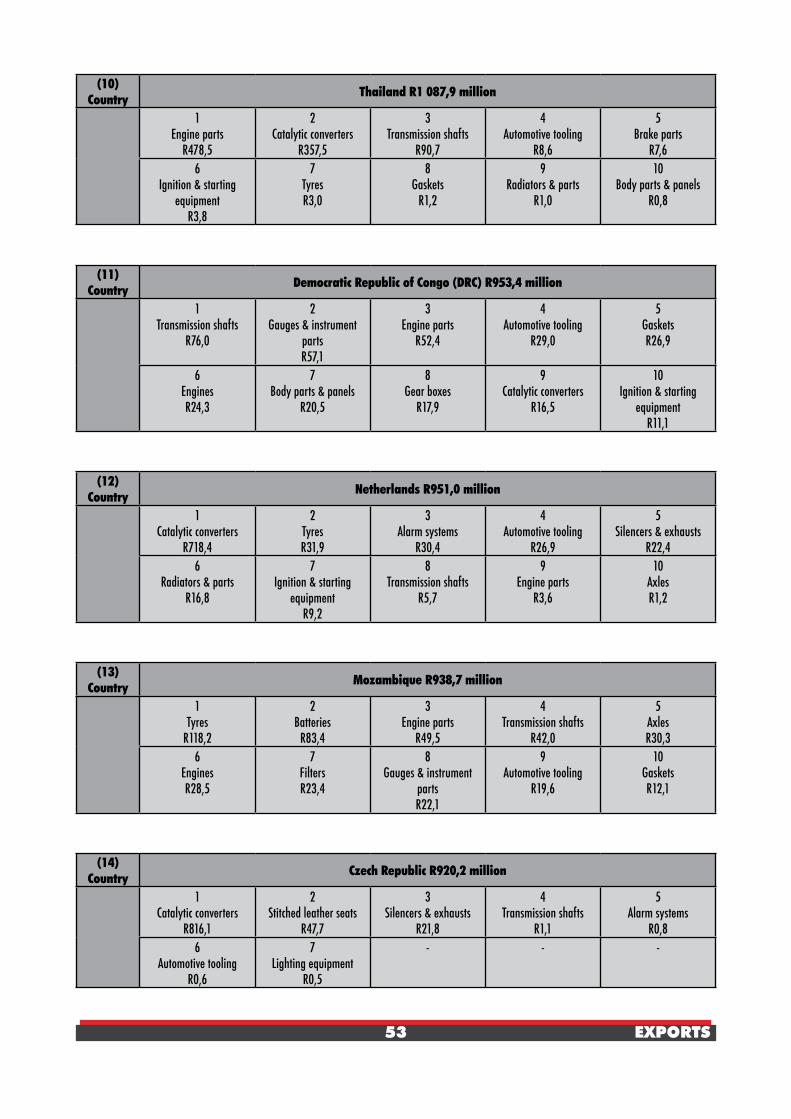
53 EXPORTS
(10) Country Thailand R1 087,9 million
1Engine parts
R478,5
2Catalytic converters
R357,5
3Transmission shafts
R90,7
4Automotive tooling
R8,6
5Brake parts
R7,66
Ignition & starting equipment
R3,8
7TyresR3,0
8Gaskets
R1,2
9Radiators & parts
R1,0
10Body parts & panels
R0,8
(11) Country Democratic Republic of Congo (DRC) R953,4 million
1Transmission shafts
R76,0
2Gauges & instrument
partsR57,1
3Engine parts
R52,4
4Automotive tooling
R29,0
5GasketsR26,9
6EnginesR24,3
7Body parts & panels
R20,5
8Gear boxes
R17,9
9Catalytic converters
R16,5
10 Ignition & starting
equipmentR11,1
(12) Country Netherlands R951,0 million
1Catalytic converters
R718,4
2TyresR31,9
3Alarm systems
R30,4
4Automotive tooling
R26,9
5Silencers & exhausts
R22,46
Radiators & partsR16,8
7Ignition & starting
equipmentR9,2
8Transmission shafts
R5,7
9Engine parts
R3,6
10AxlesR1,2
(13) Country Mozambique R938,7 million
1Tyres
R118,2
2Batteries
R83,4
3Engine parts
R49,5
4Transmission shafts
R42,0
5AxlesR30,3
6EnginesR28,5
7FiltersR23,4
8Gauges & instrument
partsR22,1
9Automotive tooling
R19,6
10GasketsR12,1
(14) Country Czech Republic R920,2 million
1Catalytic converters
R816,1
2Stitched leather seats
R47,7
3Silencers & exhausts
R21,8
4Transmission shafts
R1,1
5Alarm systems
R0,86
Automotive toolingR0,6
7Lighting equipment
R0,5
- - -
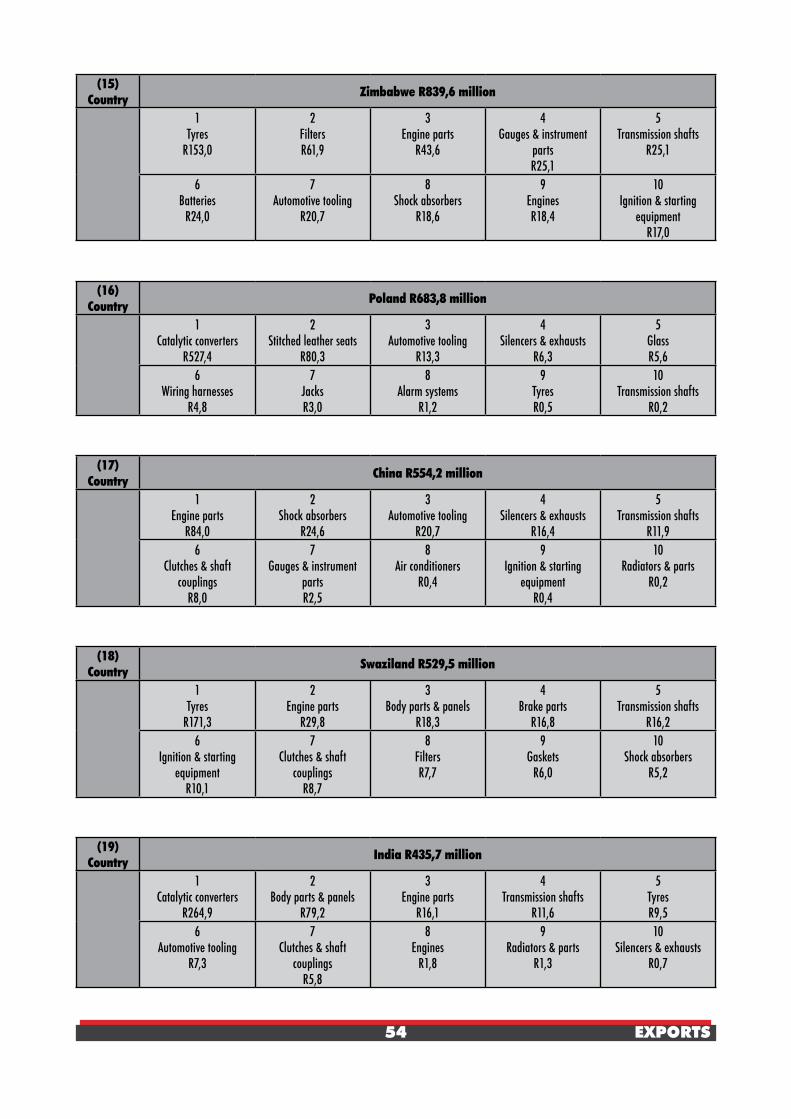
54 EXPORTS
(15) Country Zimbabwe R839,6 million
1Tyres
R153,0
2FiltersR61,9
3Engine parts
R43,6
4Gauges & instrument
partsR25,1
5Transmission shafts
R25,1
6Batteries
R24,0
7Automotive tooling
R20,7
8Shock absorbers
R18,6
9EnginesR18,4
10Ignition & starting
equipmentR17,0
(16) Country Poland R683,8 million
1Catalytic converters
R527,4
2Stitched leather seats
R80,3
3Automotive tooling
R13,3
4Silencers & exhausts
R6,3
5GlassR5,6
6Wiring harnesses
R4,8
7JacksR3,0
8Alarm systems
R1,2
9TyresR0,5
10Transmission shafts
R0,2
(17) Country China R554,2 million
1Engine parts
R84,0
2Shock absorbers
R24,6
3Automotive tooling
R20,7
4Silencers & exhausts
R16,4
5Transmission shafts
R11,96
Clutches & shaft couplings
R8,0
7Gauges & instrument
partsR2,5
8Air conditioners
R0,4
9Ignition & starting
equipmentR0,4
10Radiators & parts
R0,2
(18) Country Swaziland R529,5 million
1Tyres
R171,3
2Engine parts
R29,8
3Body parts & panels
R18,3
4Brake parts
R16,8
5Transmission shafts
R16,26
Ignition & starting equipment
R10,1
7Clutches & shaft
couplingsR8,7
8FiltersR7,7
9Gaskets
R6,0
10Shock absorbers
R5,2
(19) Country India R435,7 million
1Catalytic converters
R264,9
2Body parts & panels
R79,2
3Engine parts
R16,1
4Transmission shafts
R11,6
5TyresR9,5
6Automotive tooling
R7,3
7Clutches & shaft
couplingsR5,8
8Engines
R1,8
9Radiators & parts
R1,3
10Silencers & exhausts
R0,7

55 EXPORTS
(20) Country Brazil R407,5 million
1Road wheels & parts
R134,3
2TyresR90,2
3Engine parts
R83,4
4Automotive tooling
R40,6
5Silencers & exhausts
R9,36
Transmission shaftsR8,6
7Catalytic converters
R7,5
8Clutches & shaft
couplingsR3,4
9FiltersR3,3
10Gauges & instrument
partsR2,3
(21) Country Australia R381,0 million
1Catalytic converters
R78,5
2Transmission shafts
R32,2
3Gauges & instrument
partsR17,1
4Silencers & exhausts
R13,0
5Automotive tooling
R10,3
6Engine parts
R10,0
7FiltersR8,8
8TyresR7,6
9Lighting equipment
R5,9
10Radiators & parts
R5,8
(22) Country Turkey R374,8 million
1Catalytic converters
R330,1
2Silencers & exhausts
R11,0
3Radiators & parts
R5,5
4Engine parts
R4,8
5Gauges & instrument
partsR1,8
6Transmission shafts
R0,8
7Gaskets
R0,6
8TyresR0,6
9Automotive tooling
R0,1
-
(23) Country Japan R370,8 million
1Catalytic converters
R310,7
2Silencers & exhausts
R20,3
3Springs
R4,5
4EnginepartsR4,3
5Stitched leather seats
R1,7
6TyresR1,1
7Brake parts
R1,1
8SeatsR0,5
9Clutches & shaft
couplingsR0,5
10Ignition & starting
equipmentR0,4
(24) Country Angola R353,9 million
1TyresR66,5
2Engine parts
R29,4
3FiltersR15,2
4Gauges & instrument
partsR14,8
5Transmission shafts
R14,4
6Brake parts
R8,1
7Automotive tooling
R7,7
8Engines
R6,6
9Road wheels & parts
R5,7
10Clutches & shaft
couplingsR4,8

56 EXPORTS
(25) Country France R317,3 million
1Catalytic converters
R138,6
2GlassR47,9
3Silencers & exhausts
R12,3
4FiltersR9,7
5TyresR8,9
6Batteries
R8,0
7Road wheels & parts
R7,9
8Gaskets
R6,9
9Automotive tooling
R6,3
10Lighting equipment
R3,1
(26) Country Korea Republic South R305,4 million
1Catalytic convertors
R244,7
2Silencers & exhausts
R21,7
3Automotive tooling
R4,4
4Engine parts
R2,5
5Batteries
R0,4
6Gauges & instrument
partsR0,1
7JacksR0,1
- - -
(27) Country Lesotho R262,1 million
1TyresR55,3
2Transmission shafts
R8,3
3Clutches & shaft
couplingsR6,6
4Batteries
R6,6
5Engine parts
R6,6
6Body parts & panels
R4,8
7Ignition & starting
equipmentR4,6
8Brake parts
R4,1
9Gauges & instrument
partsR3,9
10Automotive tooling
R2,7
(28) Country Hungary R247,4 million
1Catalytic converters
R182,0
2Wiring harnesses
R50,1
3Stitched leather seats
R7,2
4JacksR1,7
5Automotive tooling
R0,26
Alarm systemsR0,1
7Gauges & instrument
parts R0,1
- - -
(29) Country Canada R241,9 million
1Catalytic converters
R168,5
2Gear boxes
R2,2
3Transmission shafts
R1,8
4Stitched leather seats
R1,7
5Engine parts
R1,46
Gauges & instrument partsR1,1
7Alarm systems
R1,0
8TyresR0,6
9Automotive tooling
R0,6
10Lighting equipment
R0,6

57 EXPORTS
(30) Country Tanzania R240,8 million
1TyresR26,3
2Engine parts
R24,0
3Transmission shafts
R14,5
4Gauges & instrument
partsR11,4
5Automotive tooling
R9,5
6Catalytic converters
R4,5
7Gaskets
R2,9
8FiltersR2,7
9Engines
R2,1
10Lighting equipment
R1,5
(31) Country Mexico R235,3 million
1Silencers & exhausts
R79,0
2Catalytic converters
R64,2
3Clutches & shaft
couplingsR8,7
4Automotive tooling
R6,4
5Engine parts
R2,2
6Transmission shafts
R1,2
7Engines
R1,0
8TyresR0,7
9Gear boxes
R0,4
10Steering wheels &
columnsR0,2
(32) Country Bulgaria R222,6 million
1Stitched leather seats
R156,1
2Batteries
R2,2
3Lighting equipment
R1,5
4Transmission shafts
R0,1
-
(33) Country Kenya R209,9 million
1TyresR72,5
2Automotive tooling
R22,4
3Gauges & instrument
partsR9,0
4Engine parts
R6,6
5Transmission shafts
R4,7
6Catalytic converters
R3,9
7Brake parts
R3,4
8FiltersR2,9
9Clutches & shaft
couplingsR1,6
10Lighting equipment
R1,5
(34) Country Malawi R207,3 million
1TyresR44,9
2Automotive tooling
R10,3
3Engine parts
R9,6
4Gauges & instrument
partsR6,6
5Transmission shafts
R5,2
6FiltersR4,2
7Batteries
R3,1
8Engines
R3,0
9Brake parts
R2,3
10Clutches & shaft
couplingsR2,1

58 EXPORTS
(35) Country Italy R182,7 million
1Catalytic converters
R71,3
2Silencers & exhausts
R40,0
3GlassR21,6
4GasketsR10,0
5TyresR4,8
6Wiring harnesses
R3,2
7Automotive tooling
R1,3
8Engine parts
R0,8
9AxlesR0,7
10Gauges & instrument
partsR0,5
(36) Country Algeria R178,4 million
1AxlesR16,6
2Transmission shafts
R7,3
3Wiring harnesses
R3,5
4Engine parts
R2,5
5Gear boxes
R1,96
Air conditionersR1,9
7Silencers & exhausts
R1,7
8Steering wheels &
columnsR1,5
9Body parts & panels
R1,1
10Radiators & parts
R1,0
(37) Country Ghana R174,6 million
1Transmission shafts
R27,5
2TyresR19,8
3Gauges & instrument
partsR14,8
4Automotive tooling
R12,0
5Engine parts
R8,4
6FiltersR4,5
7Air conditioners
R3,8
8Catalytic converters
R2,4
9Ignition & starting
equipmentR2,4
10Brake parts
R2,4
(38) Country Nigeria R139,6 million
1TyresR23,6
2Automotive tooling
R20,8
3Engine parts
R11,3
4Gauges & instrument
partsR10,5
5Transmission shafts
R9,0
6Catalytic converters
R3,1
7Body parts & panels
R2,5
8Engines
R2,4
9Steering wheels &
columnsR2,4
10Brake parts
R2,1
(39) Country United Arab Emirates (UAE) R136,5 million
1Gauges & instrument
partsR17,5
2Ignition & starting
equipmentR13,7
3Clutches & shaft
couplingsR12,8
4TyresR9,8
5Automotive tooling
R7,3
6Engine parts
R3,6
7Catalytic converters
R2,5
8Brake parts
R1,7
9Road wheels & parts
R1,6
10Engines
R1,5

59 EXPORTS
AUTOMOTIVE COMPONENTS - EXPORT BY PRODUCT
As is the case for South African vehicle manufacturers, South African component companies involved in exports must be innovative if they are to maintain their positions in international supply chains, as competition is fierce. South African component suppliers have been able to use their production flexibility as a decisive competitive advantage in penetrating global markets.
South African component suppliers have to compete with world best prices. Component strategies, therefore, depend on aspects such as the individual company’s international links, the need for technology and licenses or sale of equity, the positioning in the aftermarket, the focus on niche markets, the type of product, the volume requirements and the dependence on OEMs. Global suppliers sometimes do assist domestic suppliers to have access to their technology, planning, logistics and systems. The integration of the South African subsidiaries into the global groups provides opportunities for business, produces synergies in several areas and accelerates the exchange of knowledge, which will enable the domestic subsidiary to be more competitive in the global automotive environment.
The Automotive Investment Scheme (AIS) allows suppliers to claim back 25% to 35% of what they had invested and this had led to improvements in the supplier base. The growing vehicle exports have been a spur to many domestic component suppliers to set their sights on increasing their export business too. These component production programmes not only benefit the country in terms of earning foreign exchange, but also bring new technologies to South Africa and create new job opportunities. Cost-saving operational improvements by component firms resulting from greater economies of scale and demanding requirements of export markets as well as lower import protection have been evident.
The following tables reveal the major destinations for the automotive component category exports from South Africa from 2010 through to 2013.
Catalytic converters (1)
COUNTRY 2010 2011 2012 2013
TOTAL (R million) 14 760,7 19 638,9 16 347,0 17 640,9
Germany 36% 39% 40% 41%
USA 10% 8% 11% 12%
UK 8% 10% 8% 9%
Spain 12% 7% 6% 7%
Czech Republic 4% 4% 5% 5%
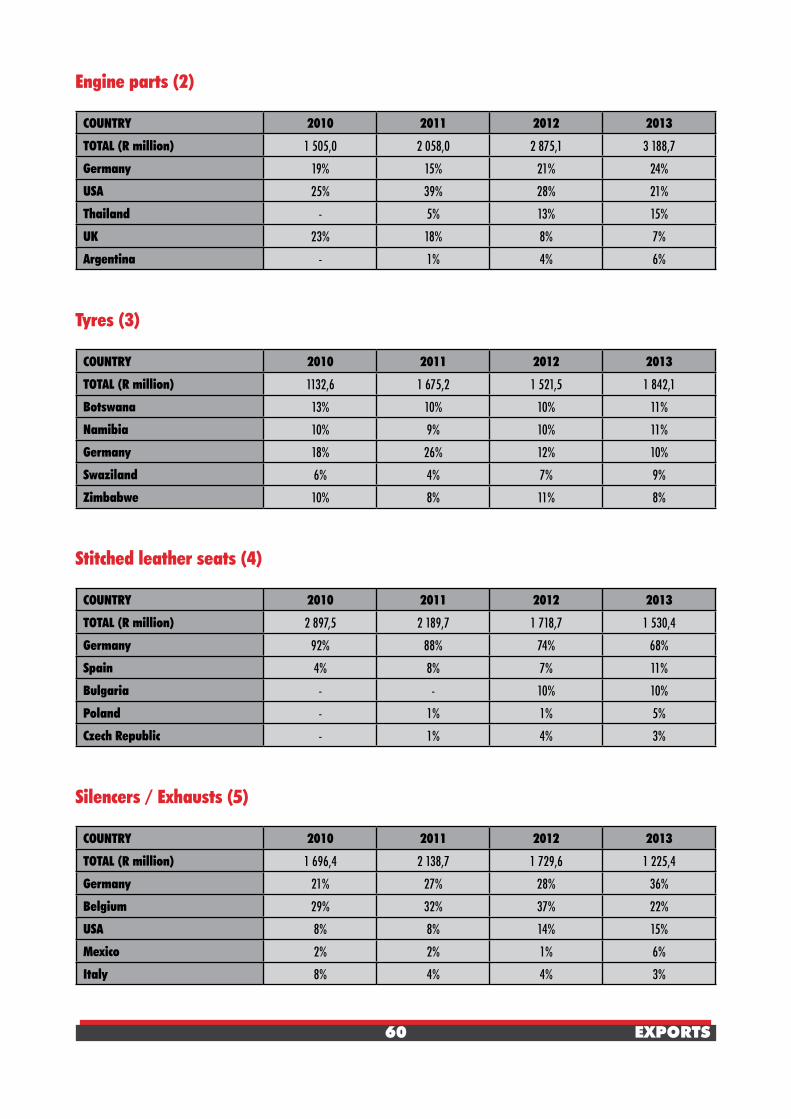
60 EXPORTS
Engine parts (2)
COUNTRY 2010 2011 2012 2013
TOTAL (R million) 1 505,0 2 058,0 2 875,1 3 188,7
Germany 19% 15% 21% 24%
USA 25% 39% 28% 21%
Thailand - 5% 13% 15%
UK 23% 18% 8% 7%
Argentina - 1% 4% 6%
Tyres (3)
COUNTRY 2010 2011 2012 2013
TOTAL (R million) 1132,6 1 675,2 1 521,5 1 842,1
Botswana 13% 10% 10% 11%
Namibia 10% 9% 10% 11%
Germany 18% 26% 12% 10%
Swaziland 6% 4% 7% 9%
Zimbabwe 10% 8% 11% 8%
Stitched leather seats (4)
COUNTRY 2010 2011 2012 2013
TOTAL (R million) 2 897,5 2 189,7 1 718,7 1 530,4
Germany 92% 88% 74% 68%
Spain 4% 8% 7% 11%
Bulgaria - - 10% 10%
Poland - 1% 1% 5%
Czech Republic - 1% 4% 3%
Silencers / Exhausts (5)
COUNTRY 2010 2011 2012 2013
TOTAL (R million) 1 696,4 2 138,7 1 729,6 1 225,4
Germany 21% 27% 28% 36%
Belgium 29% 32% 37% 22%
USA 8% 8% 14% 15%
Mexico 2% 2% 1% 6%
Italy 8% 4% 4% 3%

61 EXPORTS
Transmission shafts and cranks (6)
COUNTRY 2010 2011 2012 2013
TOTAL (R million) 415,1 568,8 770,7 925,6
Germany 31% 27% 23% 17%
Thailand - 3% 9% 10%
Dem Republic of Congo 5% 8% 6% 8%
Botswana 8% 10% 8% 8%
Zambia 9% 7% 7% 7%
Automotive tooling (7)
COUNTRY 2010 2011 2012 2013
TOTAL (R million) 446,9 438,1 782,0 776,8
Namibia 10% 1% 7% 9%
Zambia 2% 4% 5% 7%
Belgium - - 3% 7%
Brazil - 1% 1% 5%
USA 4% 16% 3% 5%
Shock absorbers and suspension parts (8)
COUNTRY 2010 2011 2012 2013
TOTAL (R million) 329,0 430,4 439,6 474,1
Germany 90% 86% 83% 81%
China 3% 3% 4% 5%
Zimbabwe 2% 3% 3% 4%
Namibia 1% 2% 2% 3%
Zambia 2% 3% 2% 1%
Road wheels and parts (9)
COUNTRY 2010 2011 2012 2013
TOTAL (R million) 382,7 494,2 466,0 454,8
Brazil - - 5% 29%
Argentina - - 7% 16%
Germany 71% 52% 29% 13%
Spain 11% 12% 8% 9%
Zambia 2% 1% 9% 9%

62 EXPORTS
Gauges, instruments and parts (10)
COUNTRY 2010 2011 2012 2013
TOTAL (R million) 240,8 319,4 401,4 435,1
Dem Republic of Congo 7% 12% 11% 13%
Zambia 8% 6% 9% 9%
Namibia 5% 5% 5% 8%
UK 11% 10% 6% 6%
Zimbabwe 4% 6% 5% 6%
Filters (11)
COUNTRY 2010 2011 2012 2013
TOTAL (R million) 337,4 312,2 353,0 407,4
Germany 31% 38% 27% 29%
Zimbabwe 11% 14% 18% 15%
Zambia 5% 6% 8% 7%
USA 6% 6% 11% 6%
Belgium 6% 8% 7% 6%
Automotive glass (12)
COUNTRY 2010 2011 2012 2013
TOTAL (R million) 305,4 277,3 230,4 386,4
Belgium 20% 30% 27% 28%
UK 22% 24% 29% 27%
France 12% 10% 13% 14%
Germany 21% 17% 7% 13%
Italy 7% 6% 7% 7%
Axles (13)
COUNTRY 2010 2011 2012 2013
TOTAL (R million) 111,4 319,6 251,7 334,8
Germany 31% 37% 35% 53%
USA 37% 37% 32% 12%
Mozambique 1% 1% 1% 9%
Botswana 4% 2% 4% 6%
Algeria 16% 16% 13% 5%
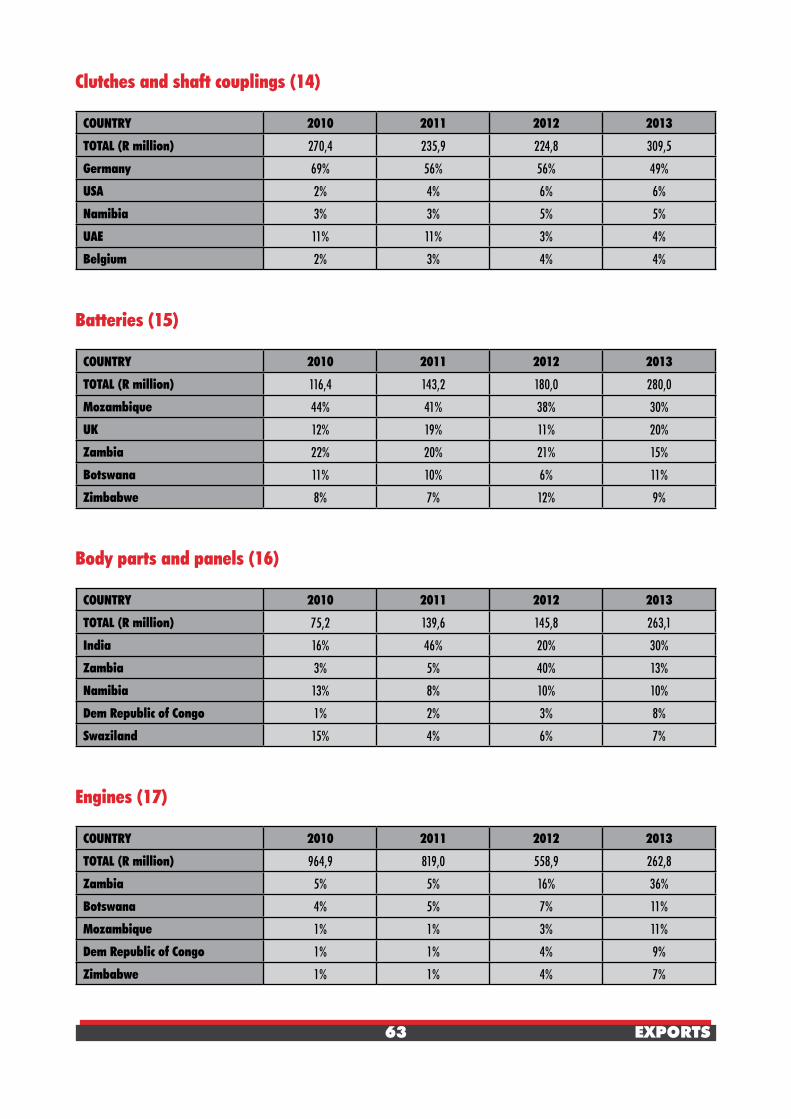
63 EXPORTS
Clutches and shaft couplings (14)
COUNTRY 2010 2011 2012 2013
TOTAL (R million) 270,4 235,9 224,8 309,5
Germany 69% 56% 56% 49%
USA 2% 4% 6% 6%
Namibia 3% 3% 5% 5%
UAE 11% 11% 3% 4%
Belgium 2% 3% 4% 4%
Batteries (15)
COUNTRY 2010 2011 2012 2013
TOTAL (R million) 116,4 143,2 180,0 280,0
Mozambique 44% 41% 38% 30%
UK 12% 19% 11% 20%
Zambia 22% 20% 21% 15%
Botswana 11% 10% 6% 11%
Zimbabwe 8% 7% 12% 9%
Body parts and panels (16)
COUNTRY 2010 2011 2012 2013
TOTAL (R million) 75,2 139,6 145,8 263,1
India 16% 46% 20% 30%
Zambia 3% 5% 40% 13%
Namibia 13% 8% 10% 10%
Dem Republic of Congo 1% 2% 3% 8%
Swaziland 15% 4% 6% 7%
Engines (17)
COUNTRY 2010 2011 2012 2013
TOTAL (R million) 964,9 819,0 558,9 262,8
Zambia 5% 5% 16% 36%
Botswana 4% 5% 7% 11%
Mozambique 1% 1% 3% 11%
Dem Republic of Congo 1% 1% 4% 9%
Zimbabwe 1% 1% 4% 7%
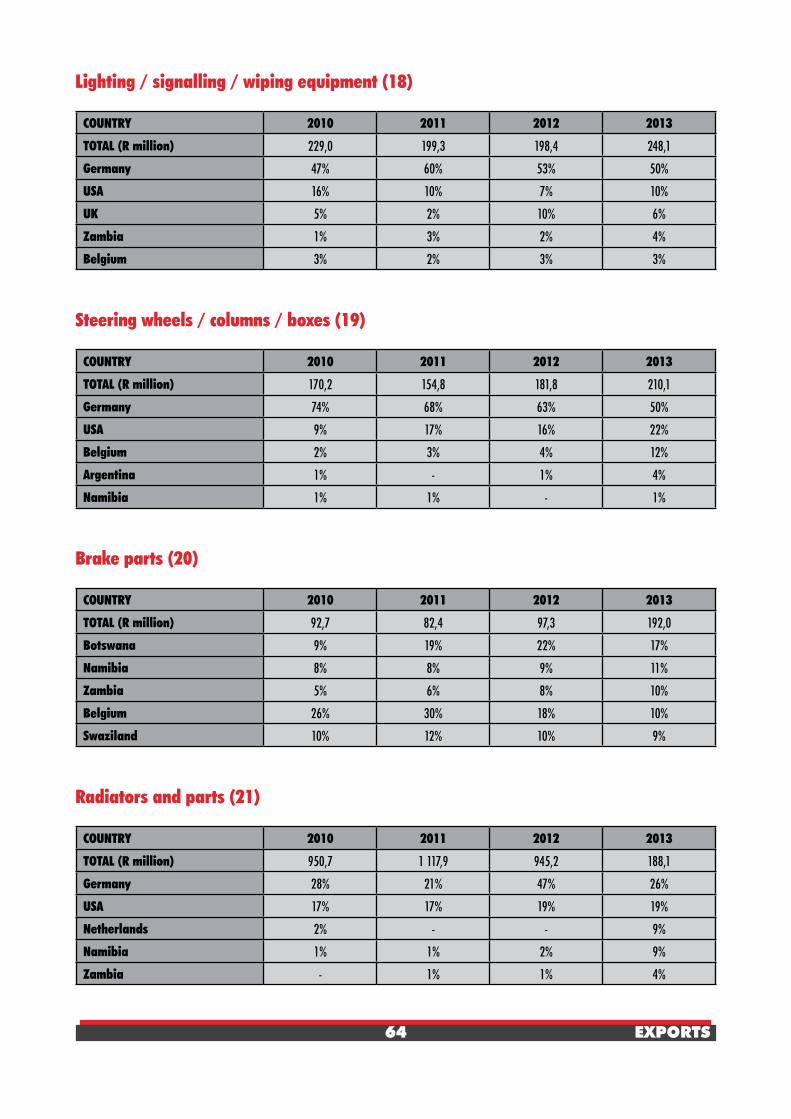
64 EXPORTS
Lighting / signalling / wiping equipment (18)
COUNTRY 2010 2011 2012 2013
TOTAL (R million) 229,0 199,3 198,4 248,1
Germany 47% 60% 53% 50%
USA 16% 10% 7% 10%
UK 5% 2% 10% 6%
Zambia 1% 3% 2% 4%
Belgium 3% 2% 3% 3%
Steering wheels / columns / boxes (19)
COUNTRY 2010 2011 2012 2013
TOTAL (R million) 170,2 154,8 181,8 210,1
Germany 74% 68% 63% 50%
USA 9% 17% 16% 22%
Belgium 2% 3% 4% 12%
Argentina 1% - 1% 4%
Namibia 1% 1% - 1%
Brake parts (20)
COUNTRY 2010 2011 2012 2013
TOTAL (R million) 92,7 82,4 97,3 192,0
Botswana 9% 19% 22% 17%
Namibia 8% 8% 9% 11%
Zambia 5% 6% 8% 10%
Belgium 26% 30% 18% 10%
Swaziland 10% 12% 10% 9%
Radiators and parts (21)
COUNTRY 2010 2011 2012 2013
TOTAL (R million) 950,7 1 117,9 945,2 188,1
Germany 28% 21% 47% 26%
USA 17% 17% 19% 19%
Netherlands 2% - - 9%
Namibia 1% 1% 2% 9%
Zambia - 1% 1% 4%
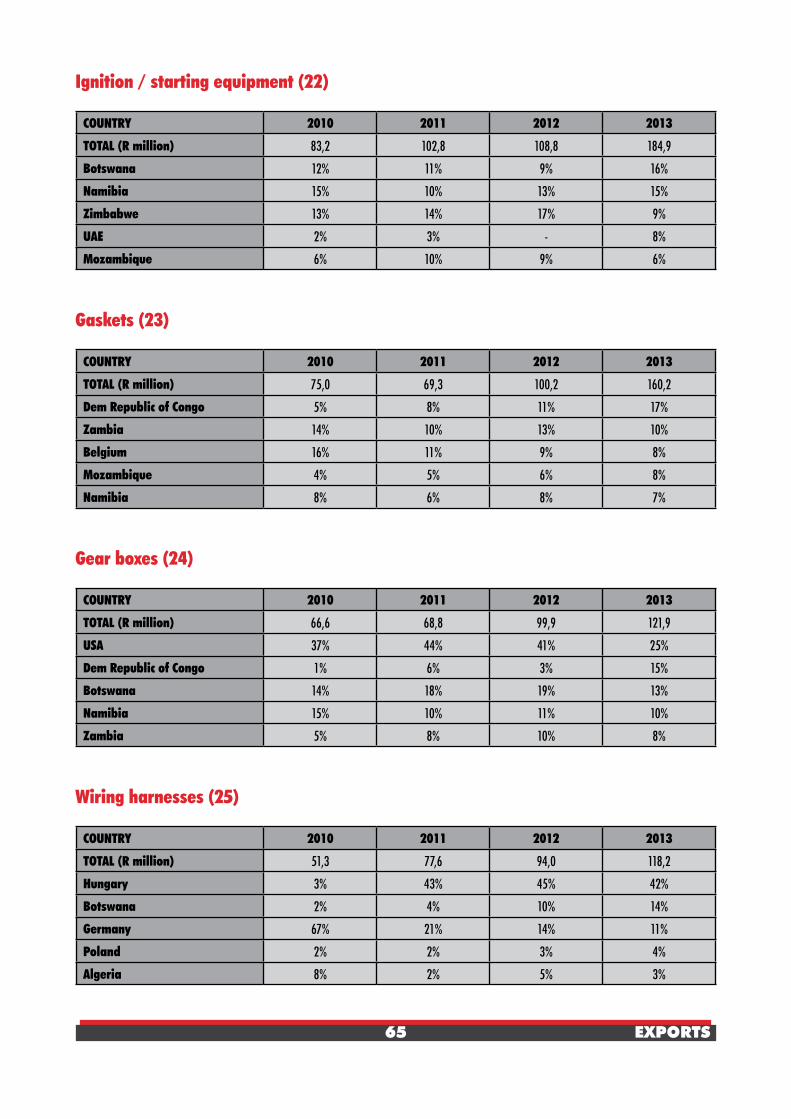
65 EXPORTS
Ignition / starting equipment (22)
COUNTRY 2010 2011 2012 2013
TOTAL (R million) 83,2 102,8 108,8 184,9
Botswana 12% 11% 9% 16%
Namibia 15% 10% 13% 15%
Zimbabwe 13% 14% 17% 9%
UAE 2% 3% - 8%
Mozambique 6% 10% 9% 6%
Gaskets (23)
COUNTRY 2010 2011 2012 2013
TOTAL (R million) 75,0 69,3 100,2 160,2
Dem Republic of Congo 5% 8% 11% 17%
Zambia 14% 10% 13% 10%
Belgium 16% 11% 9% 8%
Mozambique 4% 5% 6% 8%
Namibia 8% 6% 8% 7%
Gear boxes (24)
COUNTRY 2010 2011 2012 2013
TOTAL (R million) 66,6 68,8 99,9 121,9
USA 37% 44% 41% 25%
Dem Republic of Congo 1% 6% 3% 15%
Botswana 14% 18% 19% 13%
Namibia 15% 10% 11% 10%
Zambia 5% 8% 10% 8%
Wiring harnesses (25)
COUNTRY 2010 2011 2012 2013
TOTAL (R million) 51,3 77,6 94,0 118,2
Hungary 3% 43% 45% 42%
Botswana 2% 4% 10% 14%
Germany 67% 21% 14% 11%
Poland 2% 2% 3% 4%
Algeria 8% 2% 5% 3%

66 EXPORTS
Alarm systems (26)
COUNTRY 2010 2011 2012 2013
TOTAL (R million) 73,2 60,7 61,5 86,9
Netherlands 45% 46% 37% 35%
Botswana 9% 10% 9% 9%
Namibia 8% 9% 8% 6%
Dem Republic of Congo 1% 2% 4% 5%
Mozambique 2% 4% 3% 4%
Jacks (27)
COUNTRY 2010 2011 2012 2013
TOTAL (R million) 82,6 92,3 103,3 57,2
USA 35% 43% 33% 30%
Zimbabwe 2% 3% 4% 10%
Zambia 1% 5% 4% 9%
Dem Republic of Congo 1% 1% 3% 7%
Germany 10% 7% 5% 5%
Air conditioners (28)
COUNTRY 2010 2011 2012 2013
TOTAL (R million) 34,5 35,7 42,2 55,4
UK 4% 49% 41% 39%
Botswana 4% 11% 19% 11%
Dem Republic of Congo - 2% 2% 7%
Zambia 1% 5% 9% 7%
Ghana 4% - - 7%
Springs (29)
COUNTRY 2010 2011 2012 2013
TOTAL (R million) 30,0 43,2 32,9 31,1
Japan 3% 8% 8% 14%
Namibia 6% 6% 8% 13%
UK 11% 5% 5% 10%
Zambia - 2% 3% 10%
Zimbabwe 1% 5% 5% 8%

67 EXPORTS
Car radios (30)
COUNTRY 2010 2011 2012 2013
TOTAL (R million) 20,0 39,2 46,7 25,9
Namibia 19% 16% 13% 29%
Botswana 14% 13% 8% 19%
Mozambique 15% 6% 5% 14%
Zambia 5% 3% 3% 5%
Dem Republic of Congo - 2% 2% 5%
Seats (31)
COUNTRY 2010 2011 2012 2013
TOTAL (R million) 5,4 5,7 11,4 13,2
Botswana 20% 20% 24% 25%
Namibia 10% 12% 12% 12%
Zambia 11% 9% 10% 11%
Singapore 10% 15% 10% 11%
Mozambique 5% 7% 9% 9%
Seat belts (32)
COUNTRY 2010 2011 2012 2013
TOTAL (R million) 32,9 27,6 24,1 7,7
Australia 76% 66% 86% 36%
Botswana 6% 3% 4% 15%
Namibia 3% 3% 3% 13%
Zimbabwe 1% 1% 1% 5%
Mozambique - 2% 1% 5%

68 IMPORTS
IMPORTS BY COUNTRY OF ORIGIN
Imports of automotive products into South Africa remain a function of: the success of the APDP, of domestic market demand and of currency movements. South Africa’s trade liberalization has forced domestic companies to adapt to both intensified rivalry and new forms of competition. Growing import competition in the domestic market and that of low-cost products sourced from a global pool are the order of the day. Imports of vehicles, in line with domestic market demand, imports of original equipment components to accommodate vehicle production, as well as imports of replacement parts for the growing vehicle parc (also defined as the number of registered vehicles) of 11,01 million vehicles, remain high. The countries of origin of vehicles and automotive components imported into South Africa generally reflect the global linkages with the head offices of parent companies. The notable exception is China where most of the imports were for replacement parts.
The following table reveals the import values and rankings for the 50 countries of origin for vehicles and automotive component imports into South Africa, above the R20 million threshold, for 2013 versus 2012.

69 IMPORTS
Import value and ranking by country - 2013 vs. 2012
Country 2013R Million
2013Ranking
2012R Million
2012Ranking
Germany 46 024,0 1 37 498,1 1
Japan 21 875,6 2 21 342,0 2
Thailand 13 361,5 3 8 832,0 4
India 10 125,9 4 6 457,1 8
USA 10 020,0 5 9 616,1 3
China 9 705,6 6 8 093,8 6
Korea Republic South 8 699,5 7 8 444,0 5
United Kingdom 8 572,5 8 7 412,0 7
Spain 5 404,3 9 2 650,6 11
Brazil 3 764,7 10 3 574,5 9
Italy 3 243,2 11 2 336,5 12
Czech Republic 2 826,7 12 1 842,8 14
France 2 645,3 13 2 730,2 10
Sweden 2 370,4 14 2 110,6 13
Turkey 1 552,2 15 642,9 22
Poland 1 422,4 16 1 137,8 17
Indonesia 1 371,4 17 1 248,2 16
Mexico 1 362,4 18 850,5 20
Netherlands 1 137,3 19 890,7 19
19 COUNTRIES ABOVE R1 BILLION
Taiwan 981,2 20 807,7 21
Austria 951,8 21 600,4 23
Argentina 834,1 22 956,4 18
Slovak Republic 799,4 23 547,3 25
Belgium 735,1 24 1 257,3 15
Philippines 617,3 25 588,1 24
Portugal 523,8 26 431,1 29
Malaysia 520,6 27 501,5 26
Hungary 501,1 28 446,9 27
Canada 347,8 29 217,8 30
Australia 296,4 30 437,0 28
Switzerland 292,7 31 200,1 31
Romania 268,0 32 187,2 32
Finland 192,2 33 133,4 34
Denmark 134,4 34 143,0 33
Israel 134,2 35 98,7 36
Luxembourg 118,3 36 60,1 41
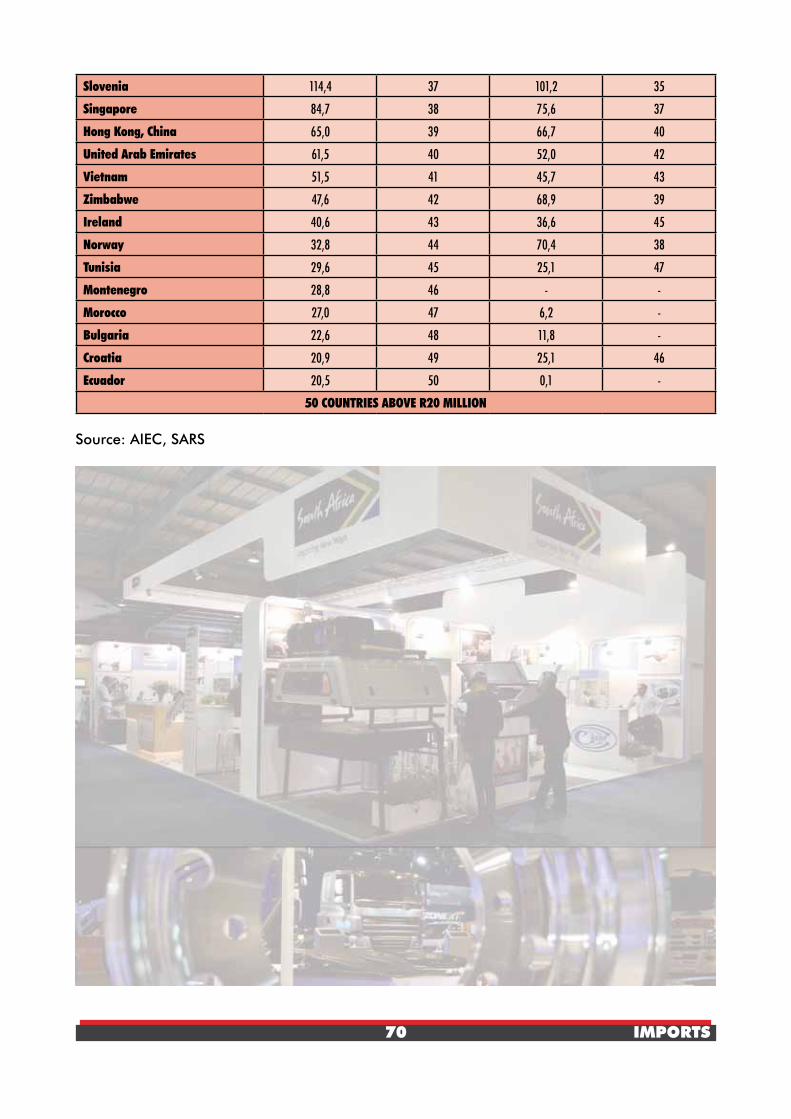
70 IMPORTS
Slovenia 114,4 37 101,2 35
Singapore 84,7 38 75,6 37
Hong Kong, China 65,0 39 66,7 40
United Arab Emirates 61,5 40 52,0 42
Vietnam 51,5 41 45,7 43
Zimbabwe 47,6 42 68,9 39
Ireland 40,6 43 36,6 45
Norway 32,8 44 70,4 38
Tunisia 29,6 45 25,1 47
Montenegro 28,8 46 - -
Morocco 27,0 47 6,2 -
Bulgaria 22,6 48 11,8 -
Croatia 20,9 49 25,1 46
Ecuador 20,5 50 0,1 -
50 COUNTRIES ABOVE R20 MILLION
Source: AIEC, SARS
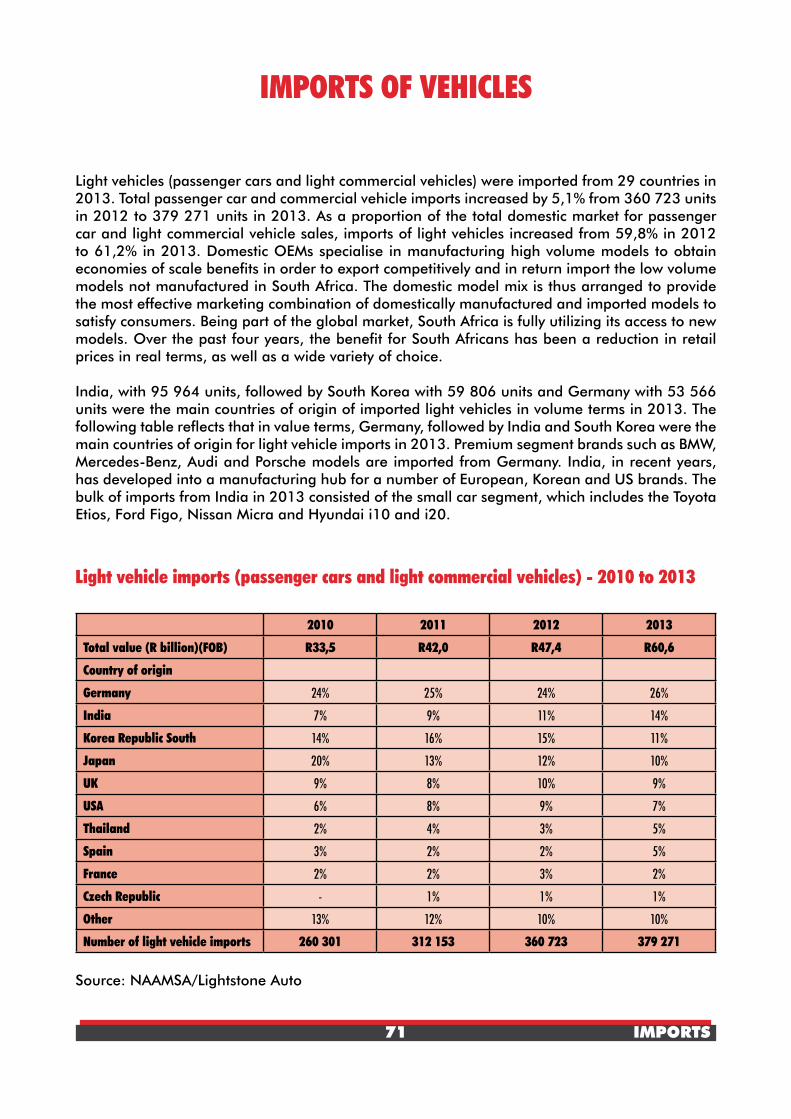
71 IMPORTS
IMPORTS OF VEHICLES
Light vehicles (passenger cars and light commercial vehicles) were imported from 29 countries in 2013. Total passenger car and commercial vehicle imports increased by 5,1% from 360 723 units in 2012 to 379 271 units in 2013. As a proportion of the total domestic market for passenger car and light commercial vehicle sales, imports of light vehicles increased from 59,8% in 2012 to 61,2% in 2013. Domestic OEMs specialise in manufacturing high volume models to obtain economies of scale benefits in order to export competitively and in return import the low volume models not manufactured in South Africa. The domestic model mix is thus arranged to provide the most effective marketing combination of domestically manufactured and imported models to satisfy consumers. Being part of the global market, South Africa is fully utilizing its access to new models. Over the past four years, the benefit for South Africans has been a reduction in retail prices in real terms, as well as a wide variety of choice.
India, with 95 964 units, followed by South Korea with 59 806 units and Germany with 53 566 units were the main countries of origin of imported light vehicles in volume terms in 2013. The following table reflects that in value terms, Germany, followed by India and South Korea were the main countries of origin for light vehicle imports in 2013. Premium segment brands such as BMW, Mercedes-Benz, Audi and Porsche models are imported from Germany. India, in recent years, has developed into a manufacturing hub for a number of European, Korean and US brands. The bulk of imports from India in 2013 consisted of the small car segment, which includes the Toyota Etios, Ford Figo, Nissan Micra and Hyundai i10 and i20.
Light vehicle imports (passenger cars and light commercial vehicles) - 2010 to 2013
2010 2011 2012 2013
Total value (R billion)(FOB) R33,5 R42,0 R47,4 R60,6
Country of origin
Germany 24% 25% 24% 26%
India 7% 9% 11% 14%
Korea Republic South 14% 16% 15% 11%
Japan 20% 13% 12% 10%
UK 9% 8% 10% 9%
USA 6% 8% 9% 7%
Thailand 2% 4% 3% 5%
Spain 3% 2% 2% 5%
France 2% 2% 3% 2%
Czech Republic - 1% 1% 1%
Other 13% 12% 10% 10%
Number of light vehicle imports 260 301 312 153 360 723 379 271
Source: NAAMSA/Lightstone Auto

72 IMPORTS
A process of homologation must be carried out before any motor vehicle model is introduced into the South African market. The South African Bureau of Standards (SABS) homologation is a procedure intended to ensure that all new vehicle models comply with the relevant South African legislation, standards and specifications, as well as codes of practice, before use by the public on public roads. This eliminates the risk of having to withdraw a motor vehicle model from the market and reduces the possibility of resultant legal action against the supplier. A process of homologation is also required for new models of motor vehicle tyres introduced in the South African market.
As far as used vehicle imports are concerned, strict control measures ensure that only a limited number of legal import permits are issued to allow used vehicles into South Africa. In terms of current legislation, used vehicles qualifying for an import permit include those for returning residents and immigrants, vintage cars, racing cars, donated vehicles for welfare organisations and adapted vehicles for persons with physical disabilities. Without a legal import permit, imported used vehicles cannot be registered on the National Transport Information System (NaTIS). The system also combats stolen and non-complying vehicle registrations. All vehicle manufacturing plants in South Africa have been linked on-line to the system to facilitate the collation of data of vehicles produced. Left hand drive vehicles are also not allowed into the country. More information in respect of used vehicle imports and relevant application forms can be accessed at www.itac.gov.za.

73 IMPORTS
AUTOMOTIVE PARTS AND COMPONENTS - IMPORTS
An important objective of the APDP vision of doubling of vehicle production in the country to 1,2 million units per annum by 2020 is the associated deepening and broadening of the component basket in the country. The strong focus on the sourcing of components in the domestic market and the development and deepening of the local component supplier industry is important because it will reduce the risks associated with exchange rate fluctuations and logistics costs. The OEMs perceive increasing local sourcing levels in South African manufactured vehicles as a prerequisite for establishing a more sustainable vehicle production base.
Much of the strategic behaviour of OEMs in expanding market share in South Africa is directed at optimizing their duty position under the APDP. Minimising duty payments can be achieved in a number of ways: firstly, OEMs can limit vehicle imports; secondly, component localisation may be increased; and thirdly, value addition in domestically manufactured vehicles can be adjusted upwards. Moreover, OEMs undertaking specified investments may qualify for a cash grant investment incentive under the Automotive Investment Scheme (AIS). All these considerations have exercised a decisive impact on the strategic choices made by domestic OEMs.
A large portion of the automotive imports comprises original equipment components, which are subsequently exported as completely built-up vehicles after local value adding processes. Original equipment component imports by the OEMs amounted to R59,0 billion in 2013. The following table reveals that imports of original equipment components originated mainly from Germany, Japan and Thailand.
Original equipment component imports (Chapter 98) - 2010 to 2013
COUNTRY 2010 2011 2012 2013TOTAL (R billion) 37,9 43,8 51,4 59,0Germany 38% 37% 35% 35%Japan 22% 24% 25% 22%Thailand 9% 9% 12% 14%Brazil 6% 6% 6% 5%China 1% 1% 2% 3%USA 2% 4% 3% 3%Sweden 3% 3% 3% 3%UK 3% 3% 2% 2%Czech Republic 3% 3% 2% 2%Spain 5% 3% 2% 2%Other 8% 7% 8% 9%
Source: AIEC, SARS
The following table reveals the increasing trend in the import of aftermarket replacement parts to complement the parts not manufactured in the domestic market and more particularly to service the increasing imported vehicle parc for which most parts are imported. The growth of cheaper products, mainly from China, has exacerbated this trend. Replacement parts imports in 2013

74 IMPORTS
increased by 22,8% compared to 2012, in line with exchange rate weakness of over 20% of the Rand against major currencies. With the exception of automotive tooling, which is used in the production processes of vehicles and automotive components, the replacement parts imports are not linked to value addition under the APDP.
Top 10 replacement parts imported (R million) - 2010 to 2013
Part category 2010 2011 2012 2013
Automotive tooling 1 596 2 369 2 798 4 090Tyres 2 900 3 206 3 610 3 990Engine parts 2 549 2 960 3 074 3 546Transmission shafts / cranks 1 076 1 302 1 414 1 774Gauges / Instrument parts 984 1 244 1 303 1 607Stitched leather seats and parts 1 139 1 138 1 206 1 543Engines 705 1 181 1 243 1 361Brake parts 774 918 887 1 116Lighting equipment / parts 746 805 746 933Catalytic converters 903 823 627 892Other 13 946 16 942 18 232 22 295Total 27 318 32 888 35 140 43 147
Source: AIEC, SARS
The following table reveals that the countries of origin for the replacement parts imported were aligned with the main countries of origin for new passenger cars and commercial vehicles. Imports from China, however, have increased, indicating the cost competitiveness of this increasingly dominant automotive force, not just in South Africa, but in the global automotive arena in general.
Top 10 countries of origin for replacement parts imported - 2010 to 2013
Country of origin 2010 2011 2012 2013
Germany 20,4% 24,9% 20,4% 19,9%China 14,0% 14,6% 15,9% 16,0%USA 9,0% 10,0% 10,2% 9,4%Japan 7,5% 8,2% 7,9% 7,1%UK 3,1% 3,5% 4,6% 5,3%Thailand 2,5% 3,8% 4,6% 5,0%Italy 3,5% 3,7% 3,9% 4,0%Korea Republic South 0,1% 0,1% 2,6% 2,5%France 3,0% 2,8% 2,8% 2,5%India 1,8% 2,0% 2,2% 2,2%Other 35,1% 26,4% 24,9% 26,1%
Source: AIEC, SARS

75
MAIN AUTOMOTIVE TRADING PARTNERS
Considering the expanding levels of South African automotive trade over recent years, South Africa forms an important part of international supply chains. South Africa’s main automotive trading partners (exports and imports combined) for 2013 reflected the country’s global linkages with the OEM parent companies in Germany, the USA and Japan. The following tables reveal details and rankings of the South African automotive industry’s top 10 automotive trading partners in 2013, and also reflect the top 10 products exported and imported, where applicable.
1. Germany (Total trade R65 162,7 million) - 2013
Main products ExportsR19 138,7 million Main products Imports
R46 024,0 million
Catalytic converters 7 179,8 Original equipment components 20 679,2Light vehicles 7 084,1 Light vehicles 15 800,5Stitched leather seats 1 033,0 MCV / HCV vehicles 976,1Engine parts 775,4 Engine parts 817,8Silencers / exhausts 436,1 Automotive tooling 546,4Shock absorbers / suspension parts 383,1 Steering wheels / columns 384,3Tyres 180,2 Tyres 377,4Axles 177,8 Transmission shafts / cranks 376,5Transmission shafts / cranks 153,6 Stitched leather seats 357,3Clutches / shaft couplings 152,2 Gauges / instruments / parts 308,7Other 1 583,4 Other 5 399,8
2. USA (Total trade R28 680,9 million) - 2013
Main products Exports R18 660,9 million Main products Imports
R10 020,0 million
Light vehicles 14 951,1 Light vehicles 4 303,0Catalytic converters 2 167,0 Original equipment components 1 638,7Engine parts 671,5 Engine parts 596,7Silencers / exhausts 183,1 Transmission shafts / cranks 390,7Tyres 57,1 Automotive tooling 370,9Steering wheels / columns 47,4 Engines 305,7Axles 40,4 Tyres 240,6Automotive tooling 39,4 Gauges / instruments / parts 212,4Radiators / parts 34,7 Catalytic converters 128,2Gear boxes 31,1 Axles 86,1Other 438,1 Other 1 747,0
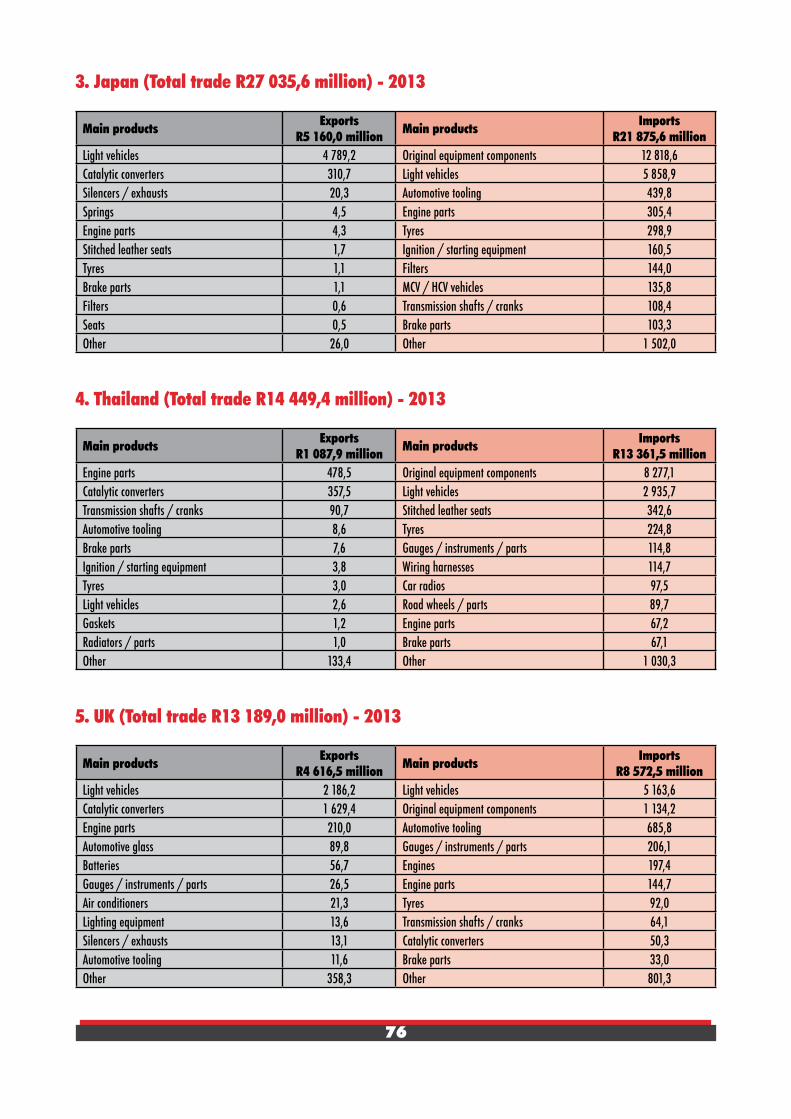
76
3. Japan (Total trade R27 035,6 million) - 2013
Main products Exports R5 160,0 million Main products Imports
R21 875,6 millionLight vehicles 4 789,2 Original equipment components 12 818,6Catalytic converters 310,7 Light vehicles 5 858,9Silencers / exhausts 20,3 Automotive tooling 439,8Springs 4,5 Engine parts 305,4Engine parts 4,3 Tyres 298,9Stitched leather seats 1,7 Ignition / starting equipment 160,5Tyres 1,1 Filters 144,0Brake parts 1,1 MCV / HCV vehicles 135,8Filters 0,6 Transmission shafts / cranks 108,4Seats 0,5 Brake parts 103,3Other 26,0 Other 1 502,0
4. Thailand (Total trade R14 449,4 million) - 2013
Main products Exports R1 087,9 million Main products Imports
R13 361,5 millionEngine parts 478,5 Original equipment components 8 277,1Catalytic converters 357,5 Light vehicles 2 935,7Transmission shafts / cranks 90,7 Stitched leather seats 342,6Automotive tooling 8,6 Tyres 224,8Brake parts 7,6 Gauges / instruments / parts 114,8Ignition / starting equipment 3,8 Wiring harnesses 114,7Tyres 3,0 Car radios 97,5Light vehicles 2,6 Road wheels / parts 89,7Gaskets 1,2 Engine parts 67,2Radiators / parts 1,0 Brake parts 67,1Other 133,4 Other 1 030,3
5. UK (Total trade R13 189,0 million) - 2013
Main products Exports R4 616,5 million Main products Imports
R8 572,5 millionLight vehicles 2 186,2 Light vehicles 5 163,6Catalytic converters 1 629,4 Original equipment components 1 134,2Engine parts 210,0 Automotive tooling 685,8Automotive glass 89,8 Gauges / instruments / parts 206,1Batteries 56,7 Engines 197,4Gauges / instruments / parts 26,5 Engine parts 144,7Air conditioners 21,3 Tyres 92,0Lighting equipment 13,6 Transmission shafts / cranks 64,1Silencers / exhausts 13,1 Catalytic converters 50,3Automotive tooling 11,6 Brake parts 33,0Other 358,3 Other 801,3

77
6. China (Total trade R11 425,5 million) - 2013
Main products Exports R1 719,9 million Main products Imports
R9 705,6 millionLight vehicles 1 156,3 Original equipment components 1 952,7Engine parts 84,0 Tyres 1 177,5Shock absorbers / suspension parts 24,6 Light vehicles 747,3Automotive tooling 20,7 Automotive tooling 673,9Silencers / exhausts 16,4 Engine parts 503,6Transmission shafts / cranks 11,9 Road wheels / parts 248,0Original equipment components 8,3 Stitched leather seats 237,6Clutches / shaft couplings 8,0 Transmission shafts / cranks 218,0Gauges / instruments / parts 2,5 Brake parts 202,8MCV / HCV vehicles 1,1 Lighting equipment 138,1Other 386,1 Other 3 606,1
7. India (Total trade R10 566,6 million) - 2013
Main products Exports R440,7 million Main products Imports
R10 125,9 millionCatalytic converters 264,9 Light vehicles 8 379,8Body parts / panels 79,2 Original equipment components 712,8Engine parts 16,1 Automotive tooling 128,7Transmission shafts / cranks 11,6 Gauges / instruments /parts 100,8Tyres 9,5 Engine parts 91,9Automotive tooling 7,3 MCV / HCV vehicles 51,2Clutches / shaft couplings 5,8 Engines 49,2MCV / HCV vehicles 4,8 Ignition / starting equipment 38,9Engines 1,8 Transmission shafts / cranks 30,2Radiators / parts 1,3 Tyres 30,0Other 38,4 Other 512,4
8. Korea Republic South (Total trade R9 004,9 million) - 2013
Main products Exports R305,4 million Main products Imports
R8 699,5 millionCatalytic converters 244,7 Light vehicles 6 908,1Silencers / exhausts 21,7 Original equipment components 518,1Automotive tooling 4,4 Tyres 255,7Engine parts 2,5 MCV / HCV vehicles 176,4Batteries 0,4 Batteries 167,8Gauges / instruments / parts 0,1 Engines 50,8Jacks 0,1 Engine parts 40,9Other 31,5 Filters 35,9
Automotive tooling 30,0Clutches / shaft couplings 28,3Other 487,5

78
9. Spain (Total trade R7 251,8 million) - 2013
Main products Exports R1 847,5 million Main products Imports
R5 404,3 millionCatalytic converters 1 185,8 Light vehicles 2 931,6Light vehicles 285,2 Original equipment components 1 064,1Stitched leather seats 165,0 MCV / HCV vehicles 525,3Road wheels / parts 41,7 Tyres 183,0Automotive tooling 24,8 Lighting equipment 49,1Automotive glass 17,3 Brake parts 44,1Silencers / exhausts 13,5 Automotive tooling 44,0Tyres 10,7 Engine parts 42,8Engine parts 1,8 Batteries 33,9Jacks 1,1 Transmission shafts / cranks 22,4Other 100,6 Other 464,0
10. France (Total trade R4 441,9 million) - 2013
Main products Exports R1 796,6 million Main products Imports
R2 645,3 millionLight vehicles 1 479,3 Light vehicles 1 176,8Catalytic converters 138,6 Original equipment components 321,6Automotive glass 47,9 Tyres 135,1Silencers / exhausts 12,3 Engine parts 74,5Filters 9,7 MCV / HCV vehicles 73,6Tyres 8,9 Gauges / instruments / parts 67,9Batteries 8,0 Engines 57,1Road wheels / parts 7,9 Transmission shafts / cranks 48,7Gaskets 6,9 Automotive tooling 42,3Automotive tooling 6,3 Brake parts 36,4Other 70,8 Other 611,3

79
AUTOMOTIVE INDUSTRY TRADE BALANCE
As the leading manufacturing sector in the country’s economy, the South African automotive industry’s export value under the APDP in 2013 amounted to R102,7 billion, which comprised 11,1% of total South African exports of R927, 36, while the automotive industry’s imports of R126,7 billion under the APDP comprised 12,7% of total South African imports of R998, 28 billion.
Despite the significant increase in exports of vehicles and automotive components in recent years, the South African automotive industry has remained a net user of foreign exchange. This was as a result of the importation of products not manufactured in the relatively small domestic market where the low volumes make the projects not economically viable. Capital-intensive components such as engines, gear boxes and interior electronic components are mainly imported and the remainder sourced in the domestic market. The industry’s reliance on foreign global designs, technologically sophisticated plant and machinery and of imported high-value automotive components contributes to the outflow of foreign exchange. This situation could well change under the APDP as the higher volumes relating to the doubling of vehicle production in the country by 2020 and various initiatives, such as the Automotive Supply Chain Competitiveness Initiative (ASCCI) project, could improve the viability of investments, export contracts and localisation. Under the MIDP’s import/export complementation scheme, vehicles and identifiable automotive parts and components eligible under the programme were imported and exported. The level of imports remained a function of the success of the programme as the benefits could only be used to rebate the import duties on vehicles and components imported. Under the APDP, the basis for calculating the duty-free import credits is based on value added through the supply chain in the automotive manufacturing industry. There are certain eligibility requirements under the programme to ensure that the beneficiaries are companies producing substantial quantities of components for vehicle manufacturing, and to exclude accessories. In this regard, with the exception of automotive tooling which is used in the production processes of vehicles and automotive components, the replacement parts imports are not linked to value addition in the country under the APDP and are therefore not included in the automotive trade balance to monitor the progress of the APDP.
During the first year of the APDP, the South African automotive industry reflected a trade deficit of R24,0 billion. On the import side, the depreciation, on a trade weighted basis, of over 20% of the Rand against major currencies during the year, affected the trade balance in 2013 while on the export side the trade balance was affected by the ongoing weakness of EU automotive markets, the domestic automotive industry’s main trading partner. Industrial action experienced during the third quarter of 2013 unfortunately also affected vehicle exports and some 58 000 units were lost. Component exports were also affected. This in turn had an impact on the industry’s trade balance. For these reasons, the anticipated higher exports for 2013 did not materialise.
The following table reveals the details in respect of the domestic automotive industry’s trade balance from 2010 through to 2012 under the MIDP and for 2013, the first year under the new APDP.

80
MIDP trade balance for the automotive industry: 2010 - 2012
Year Imports (R billion) Exports (R billion) Net forex usage (R billion)
2010 102,2 79,3 (22,9)
2011 122,1 90,5 (31,6)
2012 137,2 94,9 (42,3)
Source : AIEC, SARSRevised to include BLNS (Botswana, Lesotho, Namibia and Swaziland) country trade data
APDP trade balance for the automotive industry: 2013
Year Imports (R billion) Exports (R billion) Net forex usage (R billion)
2013 126,7 102,7 (24,0)
EU 60,6 35,1 (25,5)
NAFTA 7,5 19,1 11,6
AFRICA (incl. SADC) 0,5 30,2 29,7
MERCOSUR 3,8 2,0 (1,8)
OTHER REGIONS 54,3 16,3 (38,0)
2013 126,7 102,7 (24,0)
Vehicles 63,6 60,5 (3,1)
Automotive components 63,1 42,2 (20,9)
Source: AIEC,SARSIncluding BLNS (Botswana, Lesotho, Namibia and Swaziland) country trade data
A key strategy of the OEMs operating in South Africa is to expand market share. The OEMs seek to achieve this through a combination of domestic production and vehicle imports to complement the domestic mix. The OEMs import models not manufactured in the country and concentrate on the production of one or two relatively high-volume models for the domestic and export markets.
From an import as well as export perspective, currency fluctuations impact on the automotive industry’s domestic operations. The Rand is one of the most actively traded emerging market currencies in the world. While a weaker currency implies a high cost of importing, it also provides an opportunity for exporters. The South African industrial sector, however, has not reaped the full benefits of the currency depreciation on the export side due to weak global demand over recent years. Moreover, currency depreciation was not limited to South Africa, but across emerging markets, thus further strengthening their export competitiveness as well. The following table reveals the movements of the Rand against the currencies of the South African automotive industry’s main automotive trading partners, the EU, the US and Japan from 2010 through to 2013.

81
Currency indices for Rand versus major trading partners (Foreign currency : Rand - annual averages)
Currency 2010 2011 2012 2013
Euro 9.71 10.08 10.55 12.82
Index 2010 100 104 109 132
US ($) 7.32 7.25 8.21 9.65
Index 2010 100 99 112 132
Japan (100 Yen) 8.35 9.12 10.29 9.87
Index 2010 100 109 123 118
Source: South African Reserve Bank
The South African Reserve Bank is responsible for formulating and implementing monetary policy. Its primary objectives are keeping inflation within a targeted rate of 3% to 6% and maintaining a stable, competitive currency. CPI for 2013 was 5,7%. The Bank is opposed to intervention to manipulate the exchange rate. The global recession in 2008 affected South Africa as well. However, sound fiscal and monetary policies minimised the impact on the domestic economy. As a result, inflation and interest rates dropped substantially in 2010 and the Rand gained in strength, although the currency had started to depreciate since 2011.
82
POTENTIAL OPPORTUNITIES VIA TRADE AND CO-OPERATION ARRANGEMENTS
In many countries the automotive sector enjoys iconic status but this is generally only possible behind high tariff and non-tariff barriers. In addition, logistics costs, raw material prices, currency volatility and global developments, amongst others, place further burdens on delivering products to the market place. Globally, more countries are entering into bilateral and multilateral trade agreements, and, as a result, the challenge for the South African automotive industry is how to accommodate its automotive policy regime in such agreements without affecting the integrity of the programme.
In addition to the SA-EU free trade agreement, the SADC free trade agreement and the African Growth and Opportunity Act (AGOA) arrangement with the US, South Africa’s international stature is increasingly being recognised and as a result trade and investment opportunities for the country’s economy in general and for its automotive sector in particular are emerging.
BRICS countries
Over the past few years the global economy’s centre of gravity has been moving away from the developed countries as the emerging economies have become the new global poles. The BRIC countries have become economic powerhouses, providing much of the dynamism to the global economy. South Africa officially became a member nation of BRICS on December 24, 2010. Brazil, Russia, India and China’s decision to extend membership to South Africa is a reflection of the country’s undeniable influence over African economic development and investment. By joining BRICS, South Africa has enhanced the influence and presence of the economic body in Asia, Europe, the Americas and Africa. With South Africa as its additional member, the BRICS countries have emerged as a powerful formation representing 43% of the global population. They have a combined gross domestic product (GDP) estimated at US$13,7 trillion, representing 20-25% of global GDP, as well as combined foreign reserves estimated at US$4 trillion.
The combined growth of BRICS, which had lost momentum since 2010, is expected to remain close to cyclical bottom rates at 3,5% in 2014, below the average 5,5%-a-year growth experienced since 1998. Despite the notable economic slowdown, the BRICS have seen overall output increased by over 60% from $9,5-trillion to $15,5-trillion between 2009 and 2013, with its contribution to global output up from 15% in 2009 to 20% in 2013. This is expected to jump to 25% by 2018.
The involvement of the BRICS countries could contribute to Africa’s development through increasing financial aid to build infrastructure and industrial capacity, and increasing imports of value-added manufactured products from the continent. BRICS members are all emerging economies sharing strong ties with Africa. China has overtaken the US as the largest trading partner of the African continent four years ago. China is the world’s largest developing country and the African continent is home to the largest number of developing countries. China views South Africa as its foremost strategic partner in Africa. South Africa’s trade relations with China over the past 15 years have played a fundamental role in ensuring the nation overcame the economic crisis that had buckled many developed countries in the past few years. China has remained South Africa’s largest trading partner for four consecutive years since 2009 and South

83
Africa is now China’s number one trading partner in Africa. As a gateway to the continent, South Africa is expected to play a unique role in promoting BRICS-African co-operation.
China, with 22,1 million units, was the top vehicle producing country in 2013 with India 6th, Brazil 7th and Russia 11th. China and India were amongst South Africa’s top 10 automotive trading partners in 2013. The following table reveals that the automotive trade balance, however, remains in favour of these countries, except for Russia. In 2013, the automotive import to export value ratio was 5,6 to 1 in favour of China, 23,0 to 1 in favour of India and 9,2 to 1 in favour of Brazil.
Automotive trade balance and ratio 2013 - imports vs. exports
Country 2013 ImportsR million
2013 ExportsR million
China 9 705,6 1 719,9
Ratio 5,6 1
India 10 125,9 440,7
Ratio 23,0 1
Brazil 3 764,7 410,6
Ratio 9,2 1
Russia 12,4 723,1
Ratio 0,02 1
Source: AIEC, SARS
The economic slowdown in the Eurozone, South Africa’s major automotive trading partner, reduced the demand for South Africa’s exports in 2012 and 2013. South Africa therefore will seek to build closer ties, especially with China, India and Brazil in order to pursue new business opportunities. Brazil, hosting the Soccer World Cup in 2014 and the Olympics in 2016; China and South Africa’s comprehensive strategic partnership; increasing vehicle exports to Russia as well as the current preferential trade negotiations between South Africa and India could further enhance trade and investment opportunities for the domestic automotive industry.
SADC - EAC - COMESA Tripartite Alliance
It is an imperative for South Africa to be part of a strong region. South Africa is of the view that the best approach to regional integration is to build on existing regional integration communities and build deeper and wider FTAs in a practical manner. This is the basis for prioritising the consolidation of the FTA in SADC and the need to achieve broader African FTAs, the immediate priority being the Tripartite Free Trade Area (TFTA). The TFTA, launched on 12 June 2011, represents opportunities of a larger market comprising 26 countries, from Egypt in the north to South Africa at the continent’s southern tip, and could be the precursor to an all-Africa agreement. The TFTA will comprise a market of 533 million people, with a combined GDP of US$833 billion, and a GDP per capita of US$1 500. This will equate to 58% of Africa’s GDP and 57% of the continent’s population.
South Africa was pursuing what it had termed “development integration”, which was premised on market integration, infrastructure development and industrialisation. South Africa’s regional
84
trade engagement is important, especially with regard to its diversification strategy since these are major export markets for its manufactured goods and services. South Africa has an interest in the Tripartite FTA for several reasons: firstly, to enable domestic firms to export goods and services, secondly, to reinforce South Africa’s role as a hub for foreign firms seeking to enter African markets, and thirdly, enhanced African integration can assist the continent to compete more effectively in global markets in ways that could provide more opportunities for South Africa. Separately, many countries are still too small to realistically achieve the scale economies required to develop the capability to make significant contributions to value added in the global supply chains. The bargaining power of individual African countries to both accelerate infrastructure delivery and insist upon higher levels of localistion, technology transfers and skills development can only be achieved through united action. For South Africa, an expansion of African supply chains would offer opportunities not only to engage directly by providing inputs and equipment but also indirectly through providing services such as finance, transportation, and logistical coordination.
Trade is a major driving force behind economic development and is poised to improve the living standards and income of Africans. High transport costs in Africa have been found to harm the expansion of trade more than tariff and non-tariff trade restrictions. Infrastructure continues to be Africa’s missing link to developing integrated intra-African trade. Africa’s integration and intra-Africa trade cannot be realised without concerted efforts to invest in Africa’s infrastructure and manufacturing sectors. These investments would go a long way to unlocking some of Africa’s potential.
As far as opportunities for the South African automotive industry are concerned, South Africa produced 72% of Africa’s vehicle production in 2013. Vehicle and automotive component exports to the three individual regional economic communities in 2013 amounted to R21,87 billion in respect of SADC, R1,47 billion in respect of the EAC and R8,74 billion in respect of COMESA. Harmonisation of trade regimes, increased market liberalisation and various other areas of cooperation could present the South African automotive industry with increased export opportunities.
The current membership of the three Regional Economic Communities (RECs) is summarised in the following table. The countries in italic font are the ones to which South Africa does not yet have preferential access.
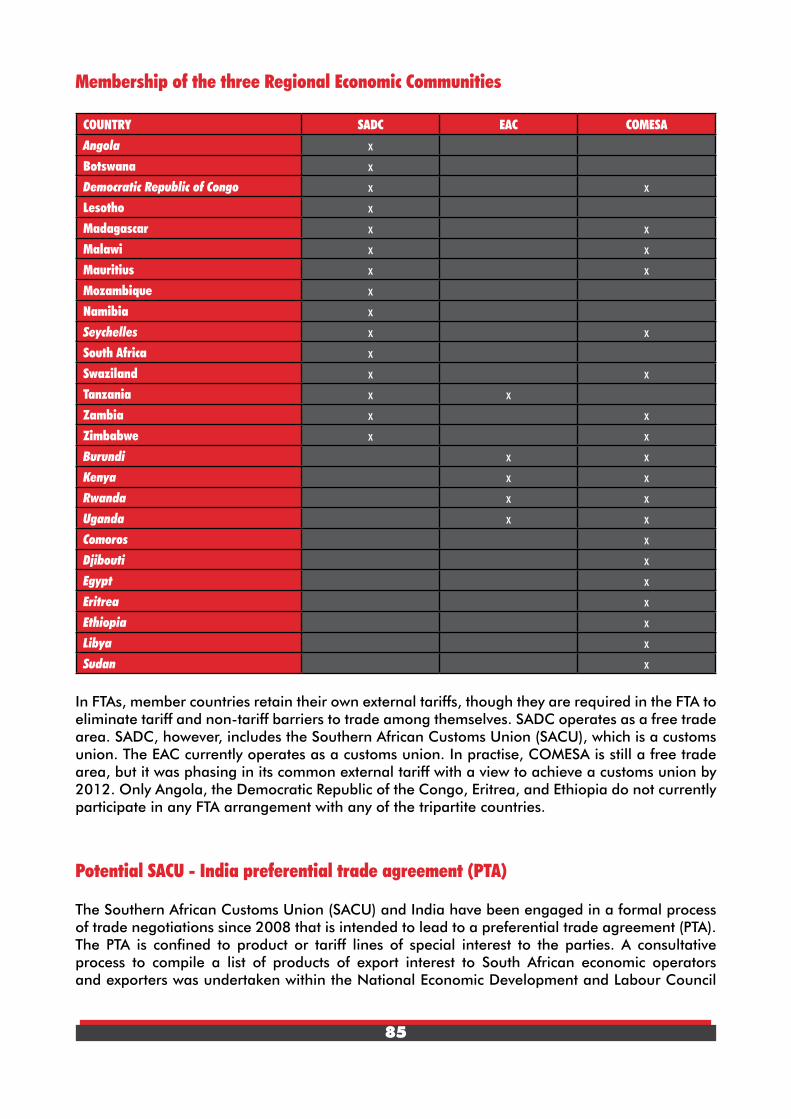
85
Membership of the three Regional Economic Communities
COUNTRY SADC EAC COMESA
Angola xBotswana xDemocratic Republic of Congo x xLesotho xMadagascar x xMalawi x xMauritius x xMozambique xNamibia xSeychelles x xSouth Africa xSwaziland x xTanzania x xZambia x xZimbabwe x xBurundi x xKenya x xRwanda x xUganda x xComoros xDjibouti xEgypt xEritrea xEthiopia xLibya xSudan x
In FTAs, member countries retain their own external tariffs, though they are required in the FTA to eliminate tariff and non-tariff barriers to trade among themselves. SADC operates as a free trade area. SADC, however, includes the Southern African Customs Union (SACU), which is a customs union. The EAC currently operates as a customs union. In practise, COMESA is still a free trade area, but it was phasing in its common external tariff with a view to achieve a customs union by 2012. Only Angola, the Democratic Republic of the Congo, Eritrea, and Ethiopia do not currently participate in any FTA arrangement with any of the tripartite countries.
Potential SACU - India preferential trade agreement (PTA)
The Southern African Customs Union (SACU) and India have been engaged in a formal process of trade negotiations since 2008 that is intended to lead to a preferential trade agreement (PTA). The PTA is confined to product or tariff lines of special interest to the parties. A consultative process to compile a list of products of export interest to South African economic operators and exporters was undertaken within the National Economic Development and Labour Council

86
(NEDLAC). SACU and India have since exchanged their offensive lists of products of export interest and SACU member states, namely Botswana, Lesotho, Namibia, South Africa and Swaziland are in the process of formulating their respective responses and national positions to the request from India. SACU made a request for 730 lines amounting to 6,7% of the India tariff book while India’s request amounted to 1 122 lines amounting to 15% of the SACU tariff book. Automotive products also feature in these offensive lists and could enhance trade and investment opportunities in the domestic automotive sector.
India is home to a number of domestic brands, such as Mahindra and Tata, but has also, in recent years, developed into a manufacturing hub for a number of European, Korean and US brands. Automotive trade between South African and India during 2013 was skewed in favour of India to the extent of 23 to 1 as South Africa exported automotive products to the value of R440,7 million to India and imported automotive products to the value of R10,13 billion from India. The main automotive products exported to India consisted of catalytic converters and body parts and panels and the main products imported from India consisted of light vehicles, original equipment components and automotive tooling.
SACU - EFTA free trade agreement
In 2005 the Southern African Customs Union (SACU) and the European Free Trade Association (EFTA) concluded an agreement to establish a free trade agreement (FTA) between the two regions. Norway and Switzerland were among the founding member states of EFTA in 1960. Iceland joined EFTA in 1970, followed by Liechtenstein in 1991. The free trade agreement provides for reciprocal preferential market access between EFTA and SACU states. The SACU–EFTA FTA, which entered into force on 1 May 2008, provides for South African economic operators to take advantage of trade opportunities offered by the agreement and also for the consolidation of trade relations with Western Europe. In terms of access to EFTA, the latter offered South Africa full duty- and quota-free access and entry for industrial products. For its part, South Africa offered EFTA what it had already offered the EU on both processed agricultural products and industrial products, with some marginal adjustments.
EFTA countries are world leaders in several sectors vital to the global economy. Liechtenstein and Switzerland are internationally renowned financial centres and hosts to major companies and multinationals. The FTA brings about a number of benefits to economic operators which include duty-free and quota-free market access for SACU industrial products, including vehicles and automotive components, into EFTA markets.
The following table reveals the South African automotive industry’s trade balance with EFTA countries in 2013.
Automotive trade balance 2013 - EFTA countries
EFTA countries 2013 ImportsR million
2013 ExportsR million
Switzerland 292,7 102,1
Norway 32,8 171,6
Iceland 0,1 7,4
Liechtenstein 0,3 -
Source: AIEC, SARS

87
GENERAL INFORMATION
The broader automotive industry (manufacturing and retail) contributed about 7,0% to the country’s GDP in 2013 and this could increase to between 8 and 10% under the APDP. South Africa was ranked 24th in respect of global vehicle production with a market share of 0,63% in 2013. Significant investment programmes driven by export plans continue to be implemented by all the OEMs as well as the automotive component suppliers. During 2013, capital expenditure by the seven OEMs amounted to R4,35 billion and investments by the component sector amounted to R2,9 billion. Projections for 2014 reflect record capital expenditure of R7,9 billion by the seven OEMs. Average aggregate monthly employment in the vehicle manufacturing industry amounted to 30 120 persons in 2013 compared to 29 180 persons in 2012. Employment in the component manufacturing industry was of the order of 74 640 employees in 2013. Total employment in the trade area, namely in the vehicle sales and vehicle maintenance and servicing field, amounted to over 200 000 persons. The automotive industry exhibits a high multiplier effect due to the creation of opportunities in automotive and related areas and maintains direct linkages with a large number of support services and SMMEs. Employment ratios vary from country to country, but generally for every worker employed in the manufacture of a motor vehicle there are at least two or more persons employed in the component industry and a further six in the used vehicle sales, servicing and repair sectors.
OEMs, franchise dealers and repair specialists work closely together to provide maintenance and repair services. They also cooperate to ensure warranty service, driver safety, environmental protection, spare parts availability and information about technical improvements. South Africa had a vehicle parc (number of registered vehicles) of 11,01 million at the end of December, 2013, of which 6,38 million or 58% comprised passenger cars. The broader South African automotive industry incorporates the manufacture, distribution, servicing and maintenance of motor vehicles and components. In terms of the trade which supports this industry, there are approximately 4 600 garages and fuel stations (with the majority having service workshops as well) plus a further 1 898 specialist repairers; 1 374 new car dealerships holding specific franchises; an estimated 1 696 used vehicle outlets; 1 508 specialist tyre dealers and retreaders; 483 engine reconditioners; 167 vehicle body builders; 2 907 parts dealers and around 220 farm vehicle and equipment suppliers.

88
SOUTH AFRICAN AUTOMOTIVE INDUSTRY -PROSPECTS AND IMPERATIVES TO GROW
South African automotive companies are increasingly exposed to global market pressures. The real competition is supply chain against supply chain as supply chains compete, not only products or commodities. Transferring costs upstream or downstream does not make companies more competitive as all costs filter down to the final market place and to the price paid by the end user. These pressures force companies to continuously improve their business processes and strategically design and implement processes which can help improve product quality, reduce costs and enhance delivery performance.
The success of the domestic automotive industry is dependent on an efficient business platform which is essential for the industry to become progressively more internationally competitive, grow exports, stimulate economic growth and create more jobs. There has also been a stable policy framework for the automotive industry in South Africa in recent times, a stable economic policy in general, and continued investment flow from automotive component suppliers and vehicle manufacturers into South Africa. The vision under the new Automotive Production Development Programme (APDP) which replaced the MIDP from 1 January 2013, shared by government and industry, is to double vehicle production to 1,2 million units per annum by 2020, with particular focus on development of the automotive component sector.
The development and modernisation of infrastructure is critical to South Africa’s future economic competitiveness, facilitating domestic, regional and international trade, and enhancing South Africa’s integration into the regional and global economy. The South African government has set aside R847 billion for infrastructure development over the next three years. Infrastructure development remains important, not only as an enabler of competitiveness and trade, but also a stimulant of economic growth. One of the major efforts to expedite the process of trading across borders is the Customs Modernisation Programme which was started in 2009. Administered by SARS, the programme aims to speed up the process of clearance through borders by increasing efficiency of documentation delivery and processing. This has included the centralisation of document processing and the introduction of an electronic case management system. Government is currently working on an accreditation system for logistics firms and freight handlers to ensure the screening of materials and the speedy and efficient transport of goods across South African borders.
As far as opportunities are concerned, the South African automotive industry enjoys significant advantages compared with many other exporting countries. Its flexibility in producing short runs, abundance of raw materials combined with expertise, advanced technology and established business multinational links ensure that the South African industry is able to add value to the global strategies of parent companies. South Africa’s eight commercial ports have expanded facilities to handle automotive exports and imports, enabling the country to act as a trading hub in and out of sub-Saharan Africa. In addition, this allows the meeting of logistical requirements to service Europe, Asia and the USA. Trade agreements significantly contribute towards reducing regional barriers, enhancing production networks and increasing market access. In this regard South Africa’s free trade agreements with the European Union, the European Free Trade Association (EFTA), the Southern African Development Community (SADC) as well as the African Growth and Opportunity Act (AGOA) with the USA and the preferential trade agreement
89
with Mercosur enable the country to position itself as the key link between these regions and Africa. The overarching importance of South Africa’s membership of the BRICS should also not be underestimated. The country’s consideration as a sub-contracting hub for the automotive industry includes the following:
• World-classlogisticssuitableforimportandexportoperations
• Excellentinfrastructure
• Internationallycompetitiveincentivesandsupportmeasures
• Policy certainty and predictability with appropriate levels of support and investment
incentives
• Abundantandcostcompetitivelabourpool
• First-worldbusinesssector
• Highqualityofficeandbusinessparkfacilities
• Superiorqualityprivateschools,sophisticatedcosmopolitancitiesandunmatchedqualityof
life
• ThecommonuseofEnglish
• Europeantimezone.
Imperatives for the domestic automotive industry to sustain, develop and grow include the following:
• Averageannualvolumesproducedperplatformtoincreasetogloballycompetitivelevels
(minimum 100 000 units)
• Localcontentlevelstoincreaseto70%plusforhighvolumemodelsand40%-50%forlow
volume models
• Toolinginitiatives
• Preferentialprocurementfromgovernment
• Reinforcementofexistingtradeagreements
• SouthAfricansuppliercompetitivenesstoimproveandalignwithaverageEuropeancosts
• Focused IndustrialisationStrategy tobroadenSouthAfrican supplier chainand increase
manufacturing depth
• Productivitytoimprovefrom18carsto30carsperemployeeperannum
• Massiveinvestmentintrainingandskillsdevelopmentatalllevels
• Substantialimprovementinlogisticscompetitivenessandinfrastructure
• Additional building blocks to support the APDP – beneficiation strategy, infrastructural
development and preferential tariffs, labour stability, containment of wage inflation, new
trade agreements, urgent implementation of fuel quality standards, electric vehicle strategy,
local market growth and collaboration by all stakeholders in terms of the joint vision.
The South African government has been pursuing what it sees as its economic priority – measures to enhance employment in general and job-creating projects in particular. Government

90
supports the economic vision, expressed in the New Growth Plan (NGP) with Industrial Policy Action Plans (IPAPs). Both the NGP and the IPAPs have singled out manufacturing as a crucial driver of growth and employment in the country’s economy. The South African government has therefore prioritized the manufacturing sector for support as it has recognized its crucial role in achieving sustainable growth in the country. The latest Industrial Policy Action Plan (IPAP) places greater emphasis than was the case in the previous five versions on raising the country’s export competitiveness, as part of what the Department of Trade and Industry (Dti) now terms as a “Smart Reindustrialisation” strategy. The other four areas of emphasis, covering the period from 2014/15 through to 2016/17, include - leveraging the infrastructure programme to support industrialisation; further entrenching localisation within public procurement programmes; galvanising further minerals beneficiation; and deploying Industrial Development Corporation (IDC) and governmental financial solutions in a more coordinated way. Business requires a policy framework which enhances certainty and predictability, thus strengthening investor confidence. Government recognizes that the achievement of its objectives for the country will largely depend on the ongoing successes of priority sectors, such as the domestic automotive sector.

91
KEY MOTOR INDUSTRY ADDRESSES
Automotive Industry Export Council (AIEC)P O Box 40611,Arcadia,0007Telephone: +27 12 807 0086/0125Telefax: +27 12 807 0054Website: www.aiec.co.za
Department of Trade & Industry (the dti)Trade and Investment South Africa (TISA)Export Marketing & Investment Assistance Scheme (EMIA)Private Bag X84,Pretoria,0001Telephone: +27 12 394-0000 (International)Telephone: 0861 843 384 (Customer Care Centre)Website: www.thedti.gov.za
National Association of Automotive Component and Allied Manufacturers (NAACAM)P O Box 9558,Edenglen,1613Telephone: +27 11 392 4060Telefax: +27 86 659 0494Website: www.naacam.co.za
National Association of Automobile Manufacturers of South Africa (NAAMSA)P O Box 40611,Arcadia,0007Telephone: +27 12 807 0086/0125Telefax: +27 12 807 0054Website: www.naamsa.co.za
92
Standard disclaimer
The trade data is based on eligible APDP products. The AIEC cannot vouch for the accuracy of the information obtained from the source. Due to certain limitations, Customs and Excise statistics cannot always distinguish between automotive components eligible in terms of the APDP and non-APDP components. The main purpose of this trade data is to discern trends in exports and export destinations as well as imports and countries of origin.
Automotive Export Manual 2014ISBN 978-0-620-59886-6
