acknowledgements: ices baltic fish. assess. wg u. thygesen a. visser
DESCRIPTION
Incorporation of C limate- O cean I nformation in S hort- and M edium T erm S prat P redictions in the Baltic Sea. www.conwoy.ku.dk. Conference on Climate Change and North Atlantic Fish Stocks Bergen, Norway May 11-14, 2004. Acknowledgements: ICES Baltic Fish. Assess. WG - PowerPoint PPT PresentationTRANSCRIPT
Incorporation of Climate-Ocean Information in Short- and Medium Term Sprat Predictions in the Baltic Sea
Acknowledgements:ICES Baltic Fish. Assess. WGU. ThygesenA. Visser
www.conwoy.ku.dk
Conference on Climate Change and North Atlantic Fish StocksBergen, NorwayMay 11-14, 2004
Brian MacKenzie and Fritz KösterDanish Institute for Fisheries ResearchDK-2920 Charlottenlund, Denmark
Background and Objective:
- recruitment appears to be independent of spawner biomass for present range of SSB (ICES 2004)
- recruitment affected by temperature during gonadal, egg and larval development stages

Recruitment – Temperature Relationship for Sprat in the Baltic Sea 1973-1999
Various processes acting !
R2 = 28%, p= 0.0029
MacKenzie & Köster 2004Ecology 85: 784-794

Background and Objective:
- recruitment appears to be independent of spawner biomass for present range of SSB (ICES 2004)
- recruitment affected by temperature during gonadal, egg and larval development stages
- consider whether and how results can be used in stock assessment:
short-term predictions (1 and 2 years ahead)
medium-term projections (10 years ahead)

Desirable Characteristics ofany Prediction
1) Timing of prediction – earlier is better than later
2) Quality of prediction – close to observed data
we now will address both issues

Data Requirements for ICES Short-term Predictions
WG needs estimate of recruitment for 3 years
(current year, next year, following year):
Consider ICES 2003 assessment.
-X, Y from historical estimates, natural and fishing mortality (ICES 2003)
year 2000 2001 2002 2003 2004 2005Age 1 1256814 474304 949243 ?? ?? ??Age 2 209025 799757 292161 575959 ?? ??Age 3 765188 132058 490294 168759 X ??Age 4 107107 461827 77211 279132 X YAge 5 215340 58016 273903 25734 X YAge 6 184383 127247 26365 169018 X YAge 7 28820 106248 73545 11330 X YAge 8+ 30653 24273 111194 118992 X YTotal 2797330 2183730 2293916 1348924 X Y

Data Requirements for ICES Short-term Predictions
year 2000 2001 2002 2003 2004 2005Age 1 1256814 474304 949243 0 ?? ??Age 2 209025 799757 292161 575959 ?? ??Age 3 765188 132058 490294 168759 X ??Age 4 107107 461827 77211 279132 X YAge 5 215340 58016 273903 25734 X YAge 6 184383 127247 26365 169018 X YAge 7 28820 106248 73545 11330 X YAge 8+ 30653 24273 111194 118992 X YTotal 2797330 2183730 2293916 1348924 X Y
= acoustic survey in autumn 2002
= geometric mean for last 10 years
- can we provide a better prediction of recruitment in 2003 and 2004?

Timing Issues Relevant toShort-term Predictions
year 2000 2001 2002 2003 2004 2005Age 1 1256814 474304 949243 0 ?? ??Age 2 209025 799757 292161 575959 ?? ??Age 3 765188 132058 490294 168759 X ??Age 4 107107 461827 77211 279132 X YAge 5 215340 58016 273903 25734 X YAge 6 184383 127247 26365 169018 X YAge 7 28820 106248 73545 11330 X YAge 8+ 30653 24273 111194 118992 X YTotal 2797330 2183730 2293916 1348924 X Y
J F MAM J J A S ON D J F MAM J J A S ON D J F MAM J J A S ON D J F MAM J J A S ON D
200
3
200
4
200
2
WG meets:Estimate required of1-gr. abundancein 2004 (born in 2003)
200
5
Temperature-based 1-gr. prediction available here

Application to Stock Assessment: Short-term Prediction
identify variables that forecast both spring temperatures and recruitment
Would be better if we could provide annual recruit estimates before the assessment WG meeting (pre-April).
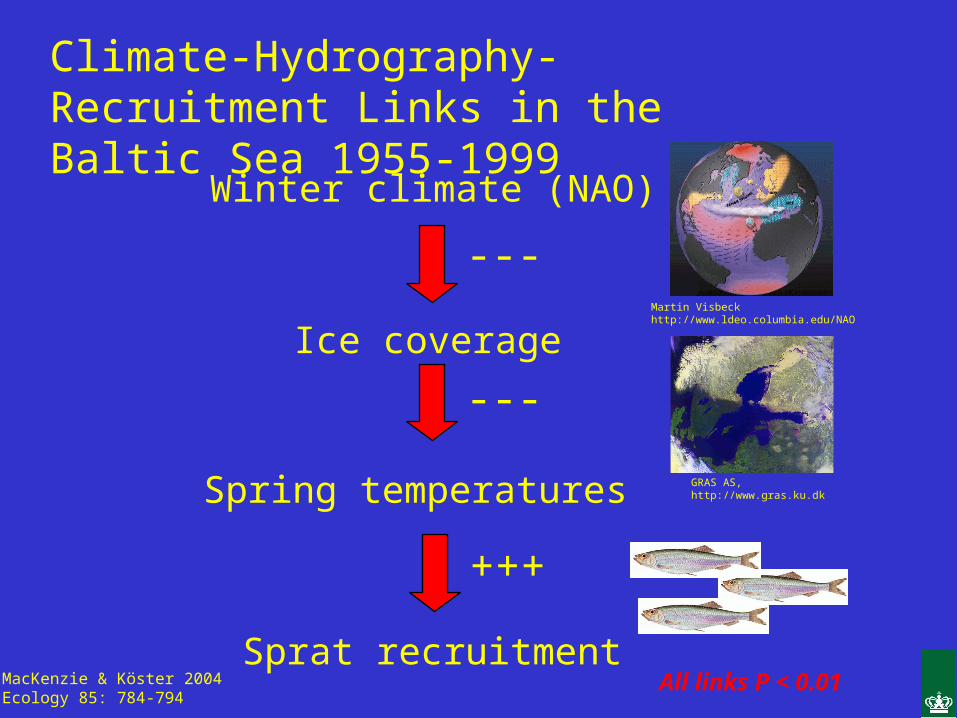
Climate-Hydrography-Recruitment Links in the Baltic Sea 1955-1999
Winter climate (NAO)
Ice coverage
---
MacKenzie & Köster 2004Ecology 85: 784-794
Spring temperatures
---
GRAS AS, http://www.gras.ku.dk
Martin Visbeckhttp://www.ldeo.columbia.edu/NAO
Sprat recruitment
+++
All links P < 0.01

Desirable Characteristics of any Prediction
1) Timing of prediction – earlier is better than later
2) Quality of prediction – close to observed data
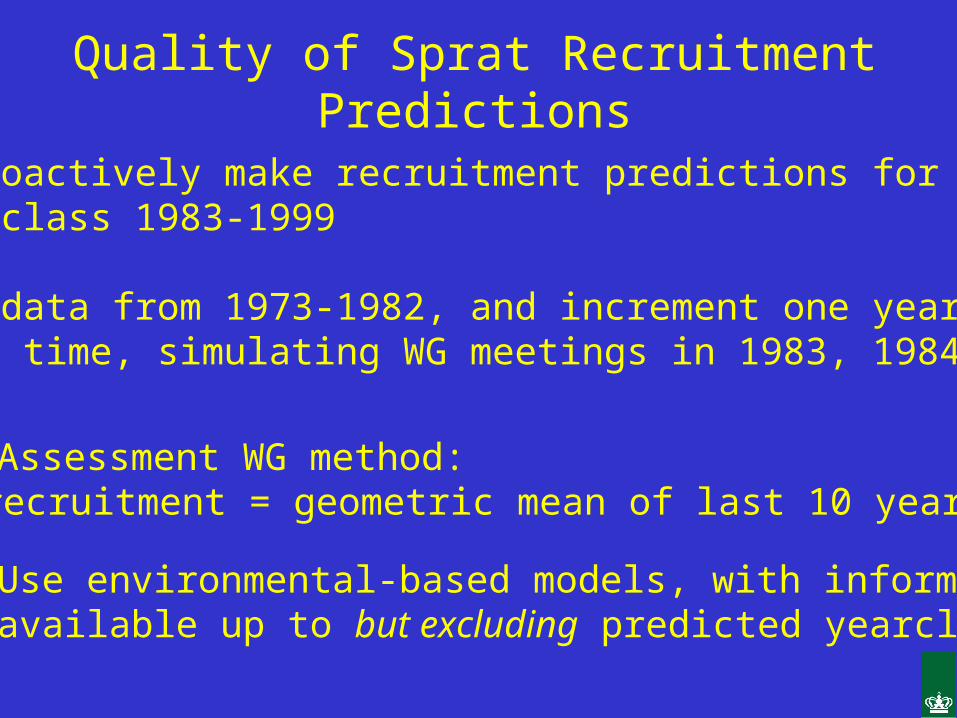
Quality of Sprat Recruitment Predictions
i) ICES Assessment WG method:recruitment = geometric mean of last 10 years
ii) Use environmental-based models, with information available up to but excluding predicted yearclass
- retroactively make recruitment predictions for each yearclass 1983-1999
- use data from 1973-1982, and increment one year at a time, simulating WG meetings in 1983, 1984 …

1972 1976 1980 1984 1988 1992 1996 2000
Ln R
ecru
itmen
t
15
16
17
18
19
20
Observed (VPA)ICES Pred. (10 yr. avg.)
1972 1976 1980 1984 1988 1992 1996 2000
Ln R
ecru
itmen
t
15
16
17
18
19
20
Observed (VPA)ICES Pred. (10 yr. avg.) Temp.-based Pred. ICE-based Pred. NAO-based Pred.
Recruitment Prediction Comparisons – Time Trends
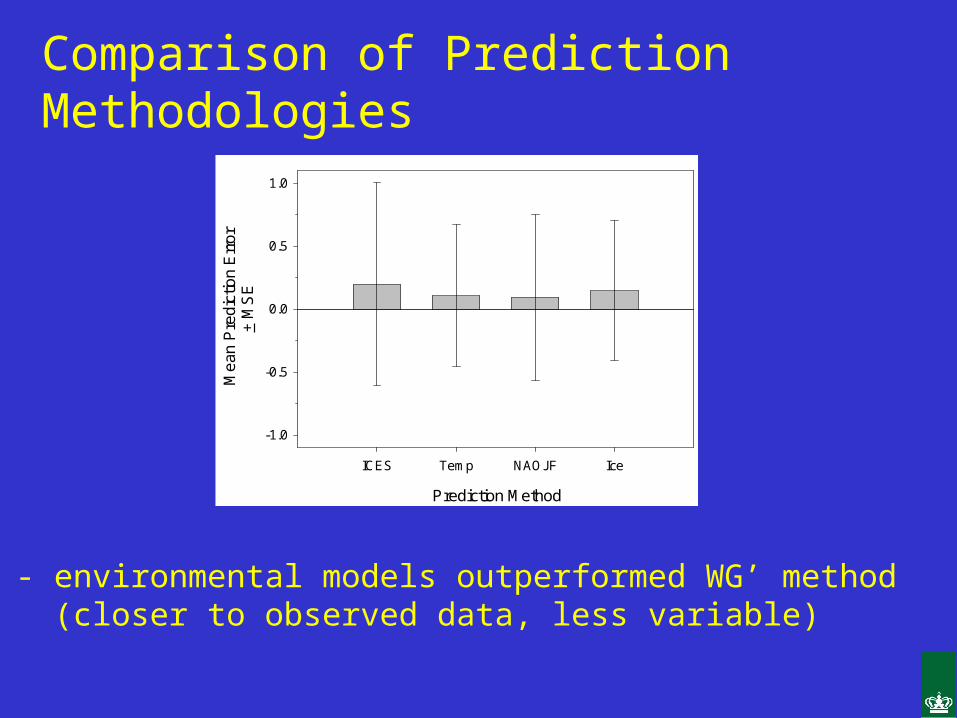
Comparison of Prediction Methodologies
Prediction Method
ICES Temp NAOJF Ice
Mea
n P
redi
ctio
n E
rror
+ M
SE
-1.0
-0.5
0.0
0.5
1.0
- environmental models outperformed WG’ method (closer to observed data, less variable)
Environmentally-Based Short-Term Recruitment Predictions
- had lower prediction error
- were less variable
- available 14 months earlier than ICES’ estimates
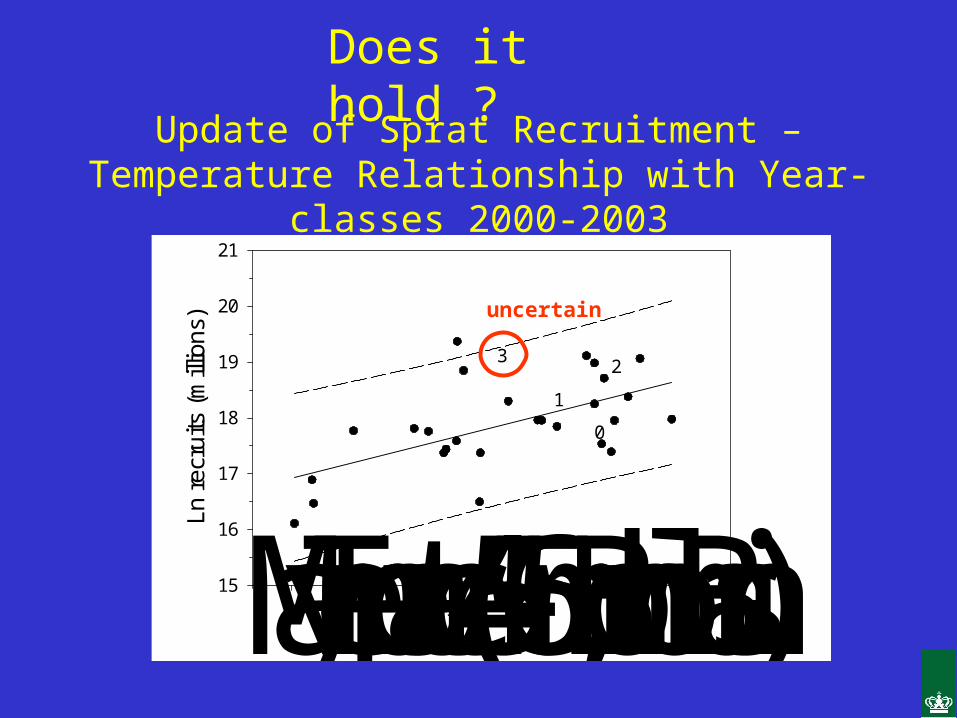
Update of Sprat Recruitment - Temperature Relationship with Yearclasses 2000-2003
May Temperature (45 - 65 m; Bornholm Basin)
1 2 3 4 5 6
Ln r
ecru
its (
mill
ions
)
15
16
17
18
19
20
21
0
1
23
Update of Sprat Recruitment – Temperature Relationship with Year-classes 2000-2003
Does it hold ?
uncertain

Consequences for Landings in 2005 and SSB in 2006
0
400000
800000
1200000
1600000
2005 Landings (t) 2006 SSB (t)
Pro
ject
ed la
ndin
gs in
200
5 an
d S
SB
in 2
006
(t)
SQ
Env.
- as calculated in Baltic WG, April 2004:
Does it matter ?

Scenario 2003 YC 2004 YCWG-SQ 0-grp., RCT3 mean 1989-2003
Env. 1 0-grp., RCT3 NAOJF 2004Env. 2 0-grp., RCT3 Min. NAOJF Env. 3 0-grp., RCT3 Max. NAOJFEnv. 4 0-grp., RCT3 Mean NAOJFEnv. 5 Temp. 2003 NAOJF 2004
Recruitment Scenario
WG-SQ 1 2 3 4 5Spa
wne
r B
iom
ass
in 2
006
0
300000
600000
900000
1200000
1500000
1800000
2100000
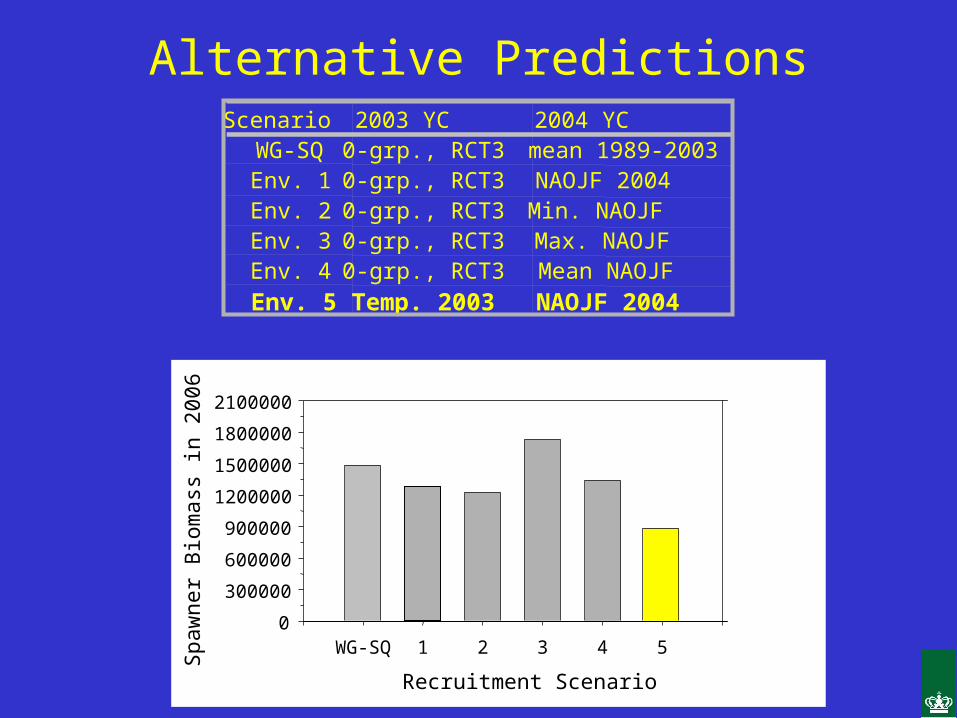
Alternative Predictions

Scenario 2003 YC 2004 YCWG-SQ 0-grp., RCT3 mean 1989-2003Env. 1 0-grp., RCT3 NAOJF 2004Env. 2 0-grp., RCT3 Min. NAOJF Env. 3 0-grp., RCT3 Max. NAOJFEnv. 4 0-grp., RCT3 Mean NAOJFEnv. 5 Temp. 2003 NAOJF 2004
Recruitment Scenario
WG-SQ 1 2 3 4 5Spa
wne
r B
iom
ass
in 2
006
0
300000
600000
900000
1200000
1500000
1800000
2100000
Alternative Predictions
Scenario 2003 YC 2004 YCWG-SQ 0-grp., RCT3 mean 1989-2003Env. 1 0-grp., RCT3 NAOJF 2004Env. 2 0-grp., RCT3 Min. NAOJF Env. 3 0-grp., RCT3 Max. NAOJFEnv. 4 0-grp., RCT3 Mean NAOJF
Env. 5 Temp. 2003 NAOJF 2004
Recruitment Scenario
WG-SQ 1 2 3 4 5Spa
wne
r B
iom
ass
in 2
006
0
300000
600000
900000
1200000
1500000
1800000
2100000
Alternative Predictions
Application to Stock Assessment: Medium-Term Prediction
Assessment WG produces medium-term(10-year) predictions.
used to estimate probability that stock falls below biological reference points (e.g., BPA) under different levels of fishing.
Medium Term Predictions:WG’ Biological Assumptions
- nos.-at-age from tuned VPA- age-specific natural mortality from MSVPA- natural random variation in growth rates- constant maturity ogive- recruits with random variation
from Beverton-Holt model (not signif.)
- constant age-specific relative fishing mortality rates
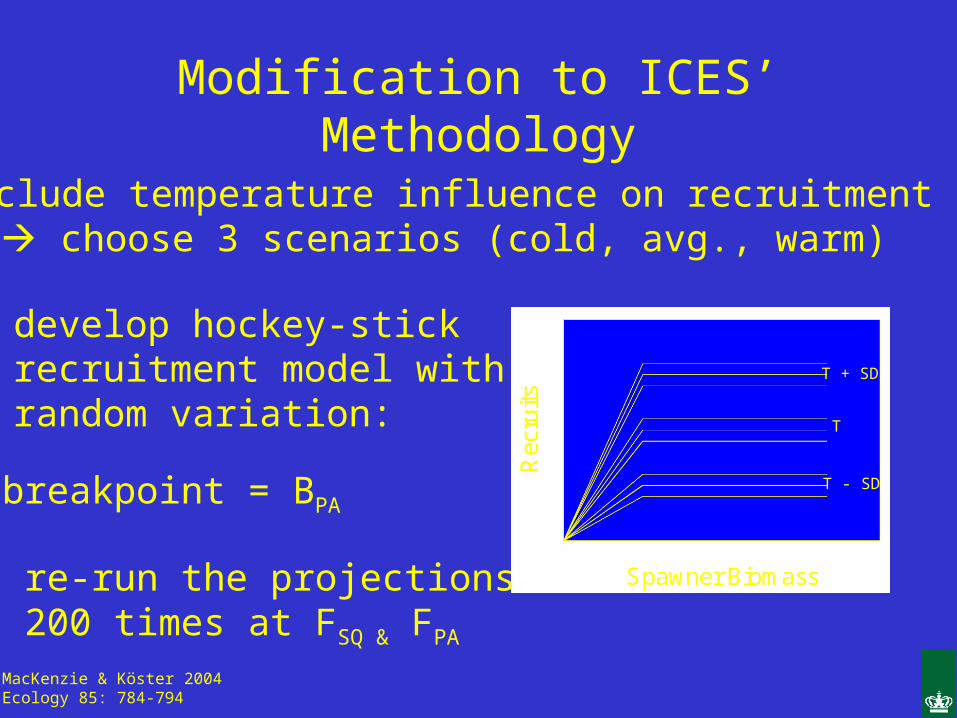
Modification to ICES’ Methodology
- include temperature influence on recruitment choose 3 scenarios (cold, avg., warm)
- develop hockey-stick recruitment model with random variation:
T + SD
T - SD
T
-breakpoint = BPA
- re-run the projections 200 times at FSQ & FPA
MacKenzie & Köster 2004Ecology 85: 784-794

Sprat Stock Prognoses and Biological Reference Points
2002 2004 2006 2008 2010
Proba
bility (Spa
wne
r Biomass < B
PA)
0
5
10
15
20
T = 2.4; F = 1.2*FSQ = FPAT = 2.4; F = FSQT = 3.7; F = FSQ
h:\sprat\med_proj1_results_hockey.jnb
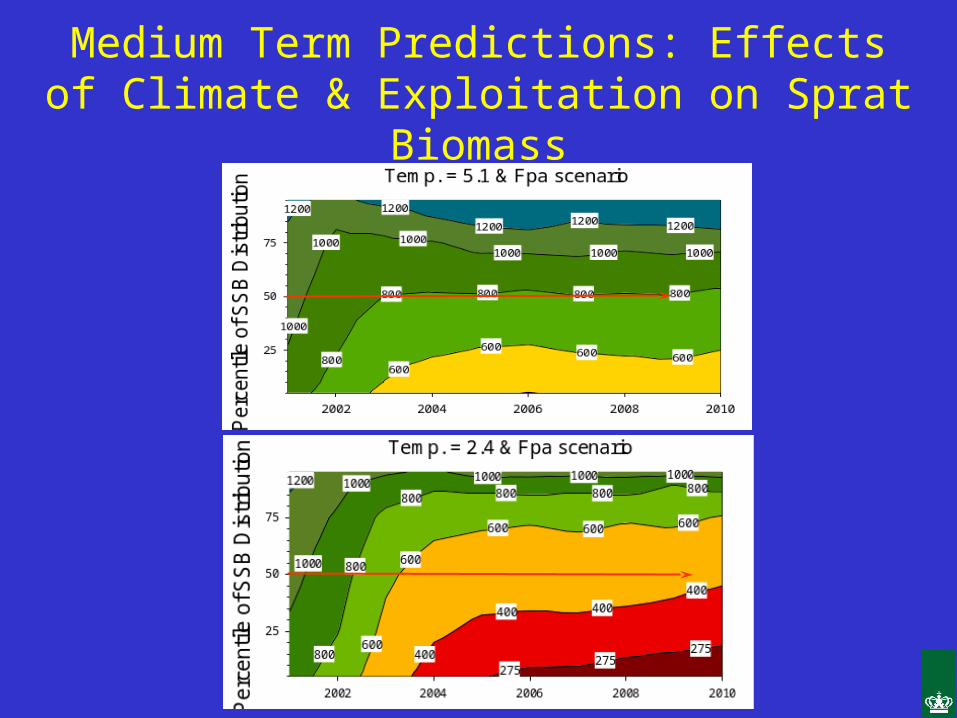
Medium Term Predictions: Effects of Climate & Exploitation on Sprat Biomass

Summary of Medium Term Predictions:
Spawner biomass in warm scenario expectedto be about double that in cold scenario for bothFSQ and FPA.
Spawner biomass will remain above BPA in warmand average temperature situations, given FSQ.
Spawner biomass has ca. 20% chance of fallingbelow BPA under low T, FPA scenario.

Conclusions
1. Environmental information (ocean-climate linkages) can be used to improve quality of recruitment predictions.
2. Environmental information (ocean-climate linkages) can be used to increase prediction leadtime without sacrificing quality of predictions.
3. Environmental information can be useful to include in medium term predictions (e.g., to identify sustainable fishing levels).

Thanks for listening !


Medium Term Predictions: Effects of Climate & Exploitation on Sprat Biomass
Temp. = 2.4; F = 1.0*status quo
2002 2004 2006 2008 2010
Pe
rce
ntil
e o
f SS
B D
istr
ibu
tion
25
50
75
1200120012001200
1000
1000
1000 1000 1000 1000
800
800
800 800 800
600
600600 600
400
400 400
275
1200
Temp. = 3.7; F = 1.0*status quo
2002 2004 2006 2008 2010
Per
cent
ile o
f SS
B D
istr
ibut
ion
25
50
75
1000
1000
1000 1000 10001000
800
800
800 800800
600
600 600 600
400 400 400
12001200
1200 1200 1200
Temp. = 5.0; F = 1.0*status quo
2002 2004 2006 2008 2010
Per
cent
ile o
f SS
B D
istr
ibut
ion
25
50
75 1200120012001200
1000
10001000 1000
1000
800
800 800 800800
600600 600 600
1200
Exploitation
Tem
pera
ture
MacKenzie & Köster2004: Ecology
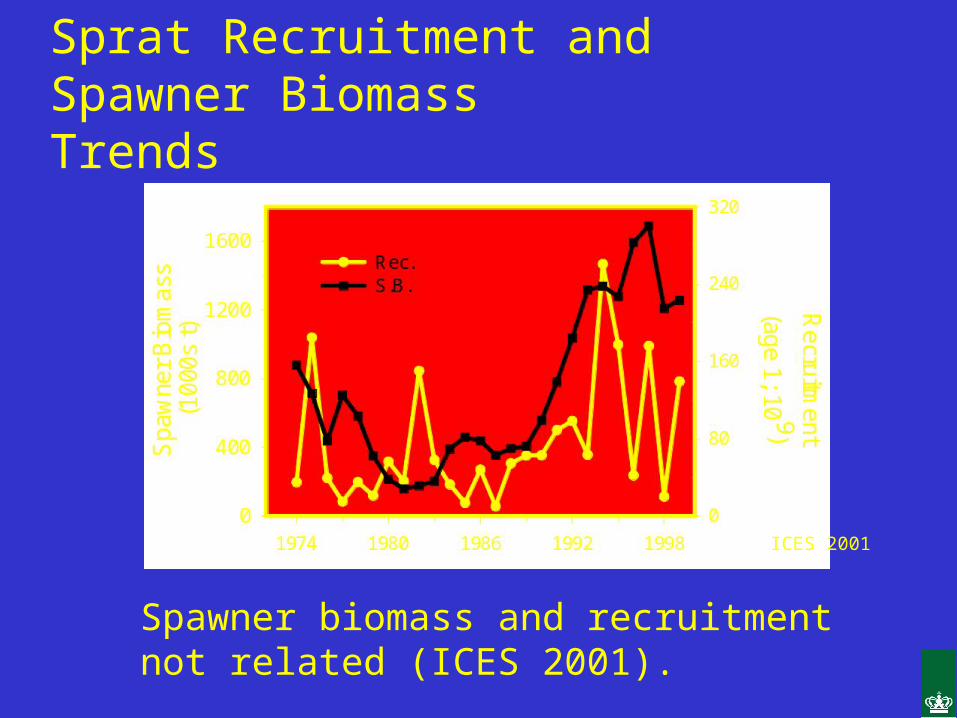
Spawner biomass and recruitment not related (ICES 2001).
ICES 2001
Sprat Recruitment and Spawner Biomass Trends

Effects of Warm Temperature on Sprat Biology
1. Higher egg and larval survival (lower direct mortality;Thompson et al. 1981; Nissling 2004).
2. Faster growth rates in larvae and adults.
3. Higher food supplies for larvae and adults(MacKenzie et al. 1996; Möllmann et al. 2000; Voss et al. 2003).
4. Increased / earlier egg production (Köster et al. 2003).
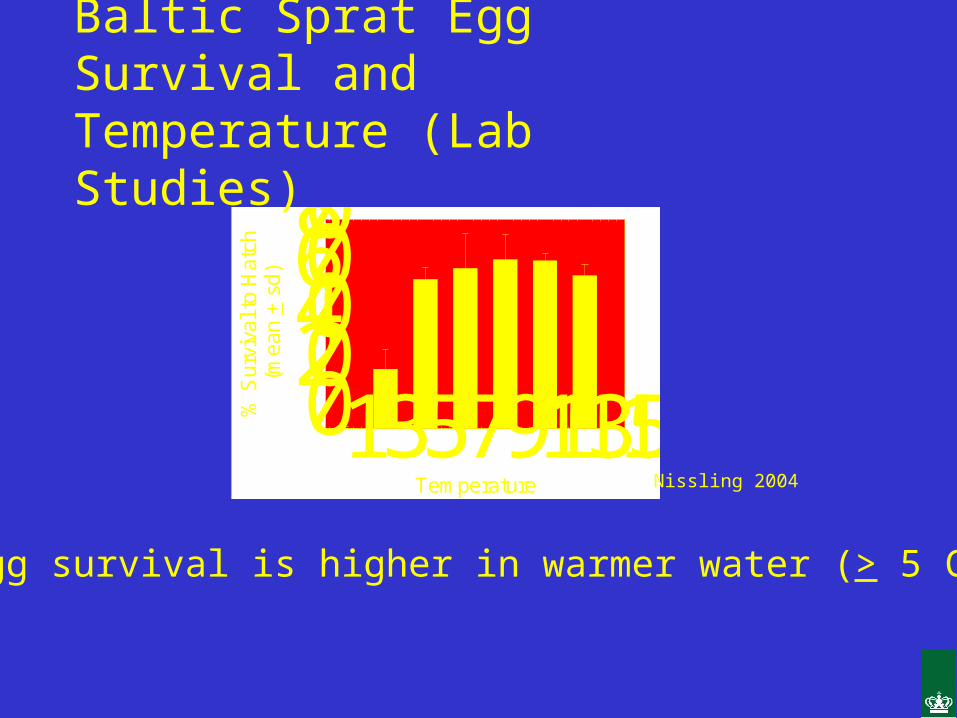
- egg survival is higher in warmer water (> 5 C)
Temperature
1 3 5 7 9 11 13 15
% S
urvi
val t
o H
atch
(mea
n +
sd)
0
20
40
60
80
Baltic Sprat Egg Survival and Temperature (Lab Studies)
Nissling 2004
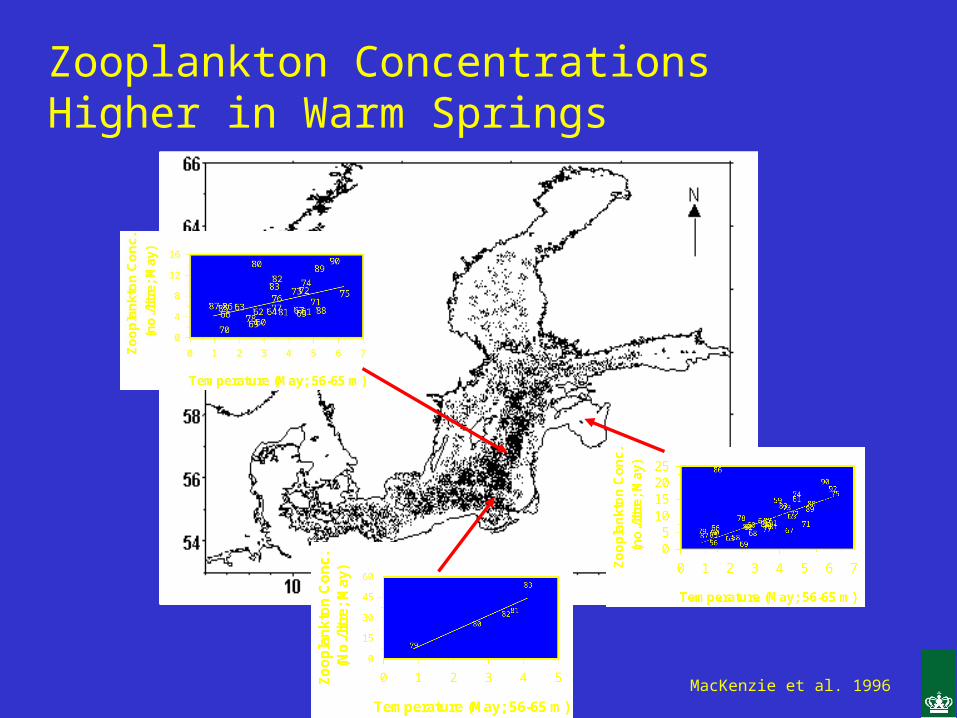
MacKenzie et al. 1996
Zooplankton Concentrations Higher in Warm Springs
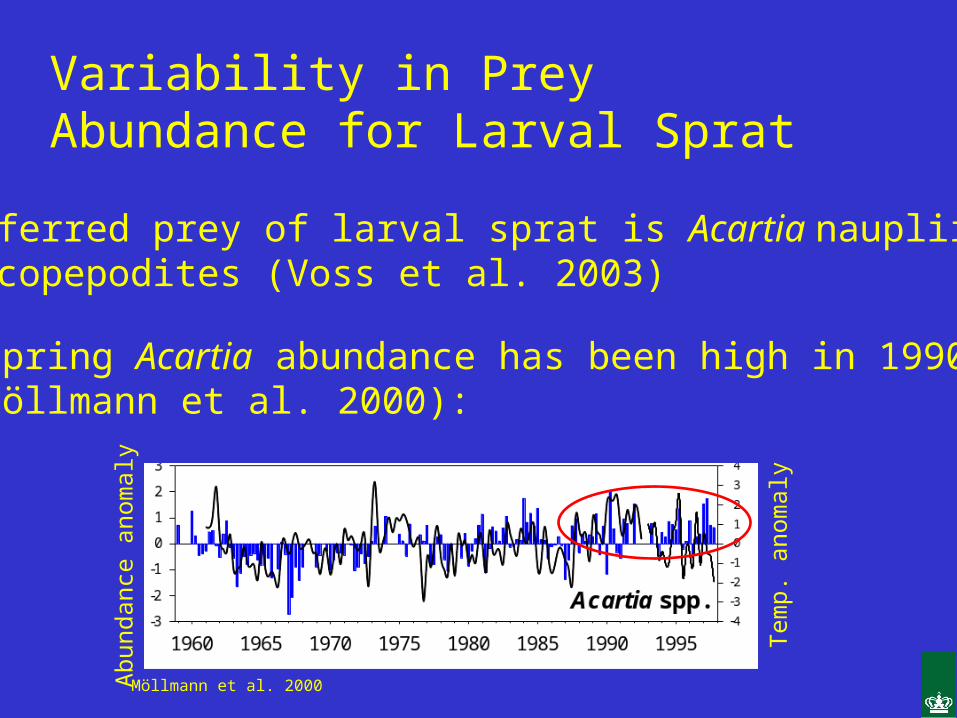
Möllmann et al. 2000
-preferred prey of larval sprat is Acartia naupliiand copepodites (Voss et al. 2003)
-spring Acartia abundance has been high in 1990s(Möllmann et al. 2000):
Tem
p. a
nom
aly
Abu
ndan
ce a
nom
aly
Variability in Prey Abundance for Larval Sprat
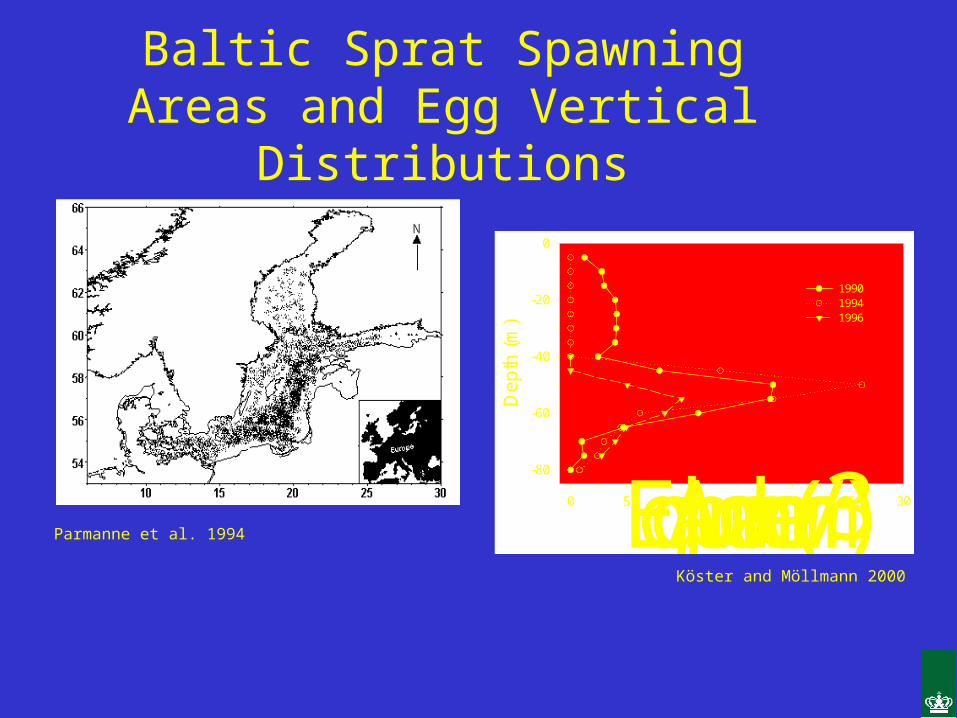
Baltic Sprat Spawning Areas and Egg Vertical Distributions
Parmanne et al. 1994 Egg Abundance (n/m3)
0 5 10 15 20 25 30D
epth
(m
)
-80
-60
-40
-20
0
199019941996
Köster and Möllmann 2000

Spring Water Temperatures in Bornholm Basin 1955-2003
MacKenzie & Köster 2004:Ecology
-warm conditions during 1990s-2000s
1952 1960 1968 1976 1984 1992 2000 2008
May
Tem
pera
ture
(4
5-65
m;
Bor
nhol
m B
asin
)
0
1
2
3
4
5
6

• spring water temperatures(R2
adj = 72%; P < 0.0001)
• sprat recruitment(R2
adj = 24%; P = 0.0054)
Ice Conditions Affect...
MacKenzie & Köster 2004Ecology

•ice conditions(R2
adj = 56%; P < 0.0001)
NAO Affects...
•spring water temperatures(R2
adj = 57%; P < 0.0001)
•sprat recruitment(R2
adj = 22%; P = 0.0081)
MacKenzie & Köster 2004Ecology
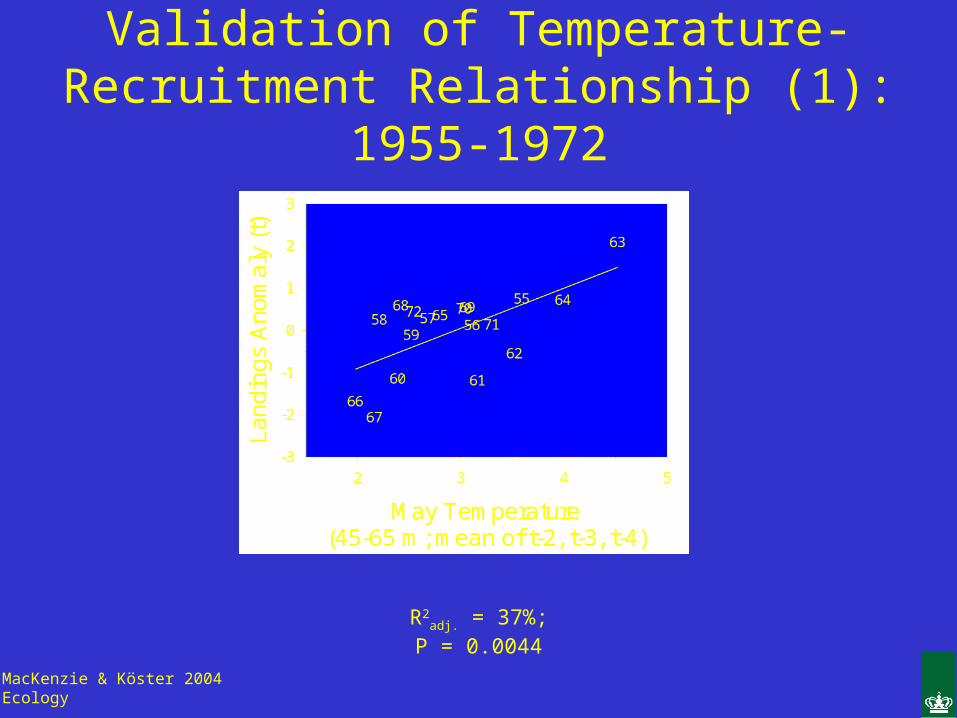
Validation of Temperature-Recruitment Relationship (1): 1955-1972
R2adj. = 37%;
P = 0.0044
MacKenzie & Köster 2004Ecology

Temperature Effects on Sprat Recruitment
-evident in different time periods(1973-1999; 1955-1972)
-geographic evidence (north vs. south of species range) -consistent with results for other species
(e.g., cod, Pacific salmon)