acid placement and coverage in the acid jetting...
TRANSCRIPT
ACID PLACEMENT AND COVERAGE IN THE ACID JETTING PROCESS
A Thesis
by
MIROSLAV I. MIKHAILOV
Submitted to the Office of Graduate Studies of Texas A&M University
in partial fulfillment of the requirements for the degree of
MASTER OF SCIENCE
August 2007
Major Subject: Petroleum Engineering
ACID PLACEMENT AND COVERAGE IN THE ACID JETTING PROCESS
A Thesis
by
MIROSLAV I. MIKHAILOV
Submitted to the Office of Graduate Studies of Texas A&M University
in partial fulfillment of the requirements for the degree of
MASTER OF SCIENCE
Approved by:
Chair of Committee, A. Daniel Hill Committee Members, Ding Zhu
Kumbakonam Rajagopal Head of Department, Stephen A. Holditch
August 2007
Major Subject: Petroleum Engineering
iii
ABSTRACT
Acid Placement and Coverage in the Acid Jetting Process. (August 2007)
Miroslav I. Mikhailov, B.S., Tver State Technical University
Chair of Advisory Committee: Dr. A. Daniel Hill
Many open-hole acid treatments are being conducted by pumping acid through
jetting ports placed at the end of coiled tubing or drill pipe. The filter-cake on the bore-
hole is broken by the jet; the acid-soluble material is dissolved, creating wormholes in the
formation. This combination of two acting factors creates more stimulation beyond the
jetting action area.
Existing papers have mentioned the advantages of using jetting both for damage
removal and as the preliminary stage before further acidizing. Many papers discuss theory
and practical implementation of wormholing during acid jobs and the resulting injectivity
enhancement, too. However, there is no complete research regarding jetting efficiency
with regards to permeability restoration due to filter-cake disruption, and therefore, no
data exists for efficient filter-cake removal by acid jetting just prior to wormholing. My
project objective is to conduct experiments of acid jetting, defining the parameters that aid
to restore injectivity. Based on the parameters obtained from the experiments, I developed
a set of recommendations for acid jetting design and optimization.

iv
DEDICATION
This thesis is dedicated to my family

v
ACKNOWLEDGMENTS
I would like to express my gratitude to Dr. A. Daniel Hill for being very open,
supportive, and patient during my research. His guidance, encouragement, and inspiration
made me complete this work. It has been a great experience.
I also want to thank Dr. Ding Zhu for her input and feedback during this research.
Her kind support helped me a lot.
I am thankful to Dr. Kumbakonam Rajagopal for his ideas and comments during
my research.
I am also thankful to Dr. Yuri F. Makogon who provided me with significant
practical support and advice.
I would like to thank my friends who helped me during my experimental part
significantly. In particular, I am thankful to Saleh Al-Mutairi and Fivman Marpaung who
always had time and hands to help.
I am also thankful to Javier Nevito for his help in designing the acidizing
apparatus and for his advice.

vi
TABLE OF CONTENTS
Page
ABSTRACT .......................................................................................................................iii
DEDICATION ................................................................................................................... iv
ACKNOWLEDGMENTS................................................................................................... v
TABLE OF CONTENTS ................................................................................................... vi
LIST OF TABLES ...........................................................................................................viii
LIST OF FIGURES............................................................................................................ ix
CHAPTER
I INTRODUCTION....................................................................................... 1
1.1 Background ..................................................................................... 1 1.2 Objectives of the Research Work.................................................... 2 1.3 Procedure......................................................................................... 3 1.4 Outline of the Chapters ................................................................... 5
II ACIDIZING, ACID JETTING, AND FORMATION DAMAGE MECHANISMS FUNDAMENTALS...................................... 6
2.1 Overview of Modern Cleanup Techniques .................................... .6 2.2 Acid Jetting Fundamentals ............................................................. .8 2.3 Carbonates Acidizing Fundamentals............................................. 13 2.4 Filter-Cake Buildup Background and Mechanism........................ 14
III MATRIX ACIDIZING, FILTER-CAKE BUILDUP APPARATUS, AND EXPERIMENTAL PARAMETERS..................... .18
3.1 Matrix Acidizing Apparatus.......................................................... 18 3.2 Filter-Cake Buildup Apparatus ..................................................... 30 3.3 Core Cutting .................................................................................. 31 3.4 Drill-In Fluid Composition and Conditioning............................... 33 3.5 Parameters for Filter-Cake Deposition Process ............................ 36 3.6 Parameters for Acid-Jetting Experiment ....................................... 38

vii
CHAPTER Page
IV RESULTS AND DISCUSSIONS ............................................................. 40
4.1 Defining the Jetting Flow Rate...................................................... 40 4.2 Filter-Cake Deposition Experimental Results............................... 41 4.3 Jetting Experimental Results ......................................................... 42 4.4 Variables Influencing Filter-Cake Removal Efficiency................ 43 4.5 Well Performance Comparison after Jetting (Acid vs. Water) ..... 62
V CONCLUSIONS AND RECOMMENDATIONS.................................... 64
5.1 Conclusions ................................................................................... 64 5.2 Recommendations for Acid Jetting Treatment Design ................. 66 5.3 Future Work .................................................................................. 67
REFERENCES.................................................................................................................. 68
APPENDIX A JETTING TREATMENT PRESSURE CURVES ................................. 71
APPENDIX B WORMHOLE INITIATION CT-SCAN PICTURES............................ 73
APPENDIX C CURVES OF MEASURED CORE PERMEABILITY AFTER JETTING .................................................................................. 74
APPENDIX D PICTURES OF DEPOSITED FILTER-CAKE BEFORE JETTING................................................................................ 76
VITA ................................................................................................................................. 77

viii
LIST OF TABLES
Page
Table 2.1: Experiment data for Reynolds numbers calculation ....................................... .10
Table 2.2: Calculated Reynolds numbers for experiments ............................................... 10
Table 3.1: Drill-in fluid composition by MI-Swaco ......................................................... 34
Table 3.2: Drill-in fluid properties by MI-Swaco ............................................................. 34
Table 3.3: Parameters for filter-cake deposition ............................................................... 38
Table 4.1: Flowrate and velocity calculated for the experiment ...................................... .40
Table 4.2: Tests and variables ........................................................................................... 42
ix
LIST OF FIGURES
Page
Figure 2.1: Acid jetting process model schematic ......................................................... 8
Figure 2.2: Filter cakes (external and internal) before and after acid jetting treatment.................................................................................................... 15
Figure 3.1: Schematic of matrix acidizing setup......................................................... 18
Figure 3.2: 4” diameter by 20” long core holder......................................................... 21
Figure 3.3: Spacer rings, providing standoff between core face and jet nozzle .......................................................................................................... 2
Figure 3.4: Brine accumulators, acid accumulator, and PVC refill container ............. 23
Figure 3.5: Mity-Mite model S91-W back pressure regulator..................................... 24
Figure 3.6: FOXBORO pressure transducers .............................................................. 26
Figure 3.7: Data acquisition system LabVIEW program front panel .......................... 27
Figure 3.8: Data acquisition LabVIEW program block diagram................................. 28
Figure 3.9: ENERPAC model P392 hydraulic pump .................................................. 29
Figure 3.10: Mud pump with backpressure nitrogen vessel; mud tank with mud mixer ................................................................................................. 31
Figure 3.11: Heavy duty HILTI DD200 core press and core bit ................................... 32
Figure 3.12: Chalk 4” in diameter, 20” length core cut by 'HILTI' core press .............. 33
Figure 3.13: Halliburton’s BARACARB agent mean particle size distribution............ 35
Figure 4.1: Dynamic fluid loss vs. time....................................................................... 41
Figure 4.2: Dynamic fluid loss vs. time ................................................................... 41

x
Page
Figure 4.3: Combined experimental data of treated core permeability normalized to original vs. acid jetting duration......................................... 44
Figure 4.4: Combined experimental data of treated core permeability normalized to damaged vs. acid jetting duration....................................... 45
Figure 4.5: The upper core was subject to acid jetting (q=100 cc/min, duration 60 second), the lower one was subject to acid for 20 second (q is 100 cc/min)............................................................................ 46
Figure 4.6: Combined experimental data of treated core permeability normalized to original vs. flow rate .......................................................... 47
Figure 4.7: Combined experimental data of treated core permeability normalized to damaged vs. flow rate ........................................................ 48
Figure 4.8: Core with mud cake after acid jetting (q=100 cc/min, duration 60 sec)................................................................ 49
Figure 4.9: Figure 4.9: Core with mud cake after acid jetting (q=140 cc/min, duration 60 sec ................................................................. 49
Figure 4.10: Combined experimental data of treated core permeability normalized to original vs. acid or water flow rate..................................... 50
Figure 4.11: Combined experimental data of treated core permeability normalized to damaged vs. acid or water flow rate................................... 51
Figure 4.12: Core with mid cake after water jetting (q=100 cc/min, duration 90 sec)................................................................ 52
Figure 4.13: Core with mud cake after acid jetting (q=100 cc/min, duration 20 sec)................................................................ 52
Figure 4.14: Combined experimental data of treated core permeability normalized to original vs. acid volume................................ 53
Figure 4.15: Combined experimental data of treated core permeability normalized to damaged vs. acid volume ................................................... 54
Figure 4.16: Combined experimental data of treated core permeability normalized to stimulated vs. water volume............................................... 54

xi
Page
Figure 4.17: Combined experimental data of treated core permeability normalized to damaged vs. water volume............................ 55
Figure 4.18: Dry filter-cake (exposed to the open air for 24 hrs after deposition) ................................................................................................. 56
Figure 4.19: Two acid jetted cores; one jetted immediately, the other after 24 hours of drying out........................................................ 57
Figure 4.20: Core with mud cake after acid jetting (q=140 cc/min, duration 60 sec ................................................................. 59
Figure 4.21: Core with mud cake after acid jetting (q=100 cc/min, duration 90 sec, reverse circulation after jetting) ............ 59
Figure 4.22: Core with mud cake after acid jetting (q=140 cc/min, duration 90 sec)................................................................ 60
Figure 4.23: Core with mud cake after acid jetting (q=100 cc/min, duration 45 sec, reverse circulation after jetting) ............ 60
Figure 4.24: 3-D view of a core jetted with acid (q=100 cc/min for 90 second) ................................................................... 61
Figure 4.25: Angled 3-D view of the same core............................................................ 62
Figure A.1: Pressure during acid jetting for 180 sec at q=140 cc/min ......................... 71
Figure A.2: Pressure during water jetting for180 sec at q=140 cc/min ........................ 71
Figure A.3: Pressure during acid jetting for 60 sec at q=100 cc/min ........................... 72
Figure A.4: Pressure during water jetting for 60 sec at q=100 cc/min ......................... 72
Figure B.1: Slice-by-slice transverse cross section view of the core sections (100 slices)..................................................................... 73
Figure B.2: Side view of the core cross-section along its length ................................. 73
Figure C.1: Permeability after acid jetting with different durations ............................ 74

xii
Page
Figure C.2: Permeability after jetting with acid at different flow rates (durations are 45 sec for both (experiments)............................................. 74
Figure C.3: Comparison of resulting permeability vs. time after jetting with water and acid (q=100 cc/min, duration time 60 sec) ....................... 75
Figure D.1: Core with just formed filter-cake-1........................................................... 76
Figure D.2: Core with just formed filter-cake-2........................................................... 76

1
CHAPTER I
INTRODUCTION
1.1 Background
Acid jetting plays more the important role among wellbore cleanup and injectivity
restoration techniques. It has advantages over conventional acidizing, since it is less time
consuming, more accurate in placement, and does not spend too much acid, and
therefore, is cheaper.
When acid is being pumped into carbonate formation, its etching action creates
highly conductive paths in the formation, referred to as wormholes. Several companies
and research institutions have developed different models of wormholing, predicting
permeability and injectivity enhancement due to wormhole propagation.
Filter-cake removal and wormhole formation are closely related to each other;
once the filter-cake is broken, the formation soaked with acid starts to react, and highly
conductive paths (wormholes) are created. As result of such actions injectivity is
enhanced; however, no company so far has conducted any experiments or research to
find out the best set of parameters to efficiently remove filter cake prior to wormhole
initiation during jetting.
No series of experiments using 4 (four) inch cores and stating optimal parameters
for dynamic filter-cake removal, were previously conducted. It is important, therefore, to
conduct these experiments, and to give a set of recommendations to enhance formation
treatment, linking the relevant parameters together.
_____________ This thesis follows the style of SPE Journal.

2
1.2 Objectives of the Research Work
The present research has the following objectives:
1) Conduct a series of experiments with the existing modified equipment to obtain
experimental data for ascertaining the efficiency of filter-cake removal before
wormhole initiation. The filter-cake on the core is initially deposited dynamically
by drill-in fluid flowing parallel to and across to the core face. The exposure time
of drill-in fluid for the cores is 16-18 hours to provide sufficient deposition and
build-up of sized CaCO3 and drilling cuttings on the core face.
2) Identify the parameters and their values, most relevant for successful filter-cake
removal just before wormhole initiation. According to the previous research
conducted, the most important parameters are:
• Standoff distance, or the distance between core surface and the jet orifice
(rule of thumb: the optimal is 8 of orifice diameter), beyond that distance, the
impact force decreases.
• Jet velocity (should be above 200 ft/sec, according to the previous research).
Related to this is orifice size and number of jets.
• Jet stream profile (refers to the dispersion of the jet stream after leaving the
orifice, larger dispersion of the fluid reduces the effectiveness of the jet
stream).
• Rotation of jets (shows better result because of 360 degrees coverage and
pulsation effect as compared to stationary jets).
• Duration of jetting or exposure time. Increasing the time the formation is
being subject to acid jet treatment, a better filter cake removal is achieved.
• Number of jets.

3
3) Give a set of guidelines to improve the efficiency of the treatment. I discuss the
results, conclusions of the experimental work, and give the guidelines to improve
acid jetting design.
1.3 Procedure
To validate parameters influencing the efficiency of the jetting process, a series of
laboratory experiment were conducted. The procedure is as follows:
• Cut the 4 (four) inch cores using core press; and measure their size.
• Measure core porosity and nitrogen permeability.
• Put the core into the saturator filled with water for at least 24 hours under
vacuum to get rid of any trapped air inside the core.
• After putting the core into the acidizing apparatus, connect the lines, apply
overburden and back pressure, and flow the core with water, determining the
initial (non-damaged) permeability to water.
• Prepare drill-in fluid as per predetermined recipe with sized CaCO3 grains and
stipulated amount of Rev Dust added to imitate drilling damage.
• Hook up the mud pump and the mud line to the coreflood equipment.
• Place the carbonate core into the coreholder and circulate the drilling mud at 500
psi pressure and 0.2-0.5 GPM flowrate for at least 16 hours; make the leakoff
rate measurement and construct a q vs. t, q vs. t plots.
• Disconnect the pump; disassemble the coreholder and lines, aiming not to disturb
the filter cake.

4
• Fit jetting nozzle to the coreholder and hook up acid flow lines.
• Prepare acid and charge it into the container. Charge water to the water container
in the same fashion; pump water into the core first, establish the flow and
measure the damaged permeability.
• Start to inject the acid at high rate for several dozen seconds (initiate jetting);
record the pressure profile vs. time, check the flowrate, and volume injected
using Lab View software.
• After the exposure time is reached, reduce the flow rate, switching to water
injection; continue recording the pressure vs. time profile.
• For some of the experiment where reverse flow is required, bleed off the
pressures, disconnect the coreholder turn it 180 degrees and connect it so the
inlet becomes the outlet and vise versa.
• Switch to the normal rate, continue to read out data and observe the pressure
decline.
• Stop the experiment, lay down the equipment, and clean it up.
• Calculate the parameters necessary (permeability, pressure at the nozzle).
For the experiments:
• I used the flow rate (fluid velocity) as the most important variable.
• I considered the industry recommended optimal standoff distance.
• I investigated jetting duration time influence.
• I used simple drill-in fluid composition with sized calcium carbonate and Rev
Dust to imitate drilling damage. I acid jetted cores of 4 inches diameter with
5
lengths 14 to 18 inches.
• I compared performance of acid jetting vs. water jetting to make the judgment on
which process has more impact: mechanical or chemical.
1.4 Outline of the Chapters
This work addresses optimal parameter for successful filter-cake removal. Chapter II
discusses existing wellbore cleanup technologies including jetting, and gives formation
damage and filter-cake buildup mechanism and background. Chapter III describes matrix
acidizing and filter-cake buildup apparatus, drill-in fluid composition and conditioning,
parameter for filter-cake deposition and acid jetting experiments. Chapter IV explains
results of the experiments conducted and defines the variables for the successful acid jet
treatment. Chapter V gives conclusions and recommendations for optimization of acid
jetting treatment; it also addresses future work considerations.
6
CHAPTER II
ACIDIZING, ACID JETTING, AND FORMATION DAMAGE MECHANISMS
FUNDAMENTALS
2.1 Overview of Modern Cleanup Techniques
• Coiled Tubing Acid Wash. A coiled tubing string with a jetting tool having jets
with a spiral shape covering 360 degree is run to total depth and acid is pumped
through the whole open-hole section. Acid is first pumped through the interval
which is then filled with Foam while reciprocating coil tubing across the treated
zone. Then it is moved to the next interval; the process is repeated to cover the
entire open-hole section. Pumping rates on average are 5-6 barrels per minute for
2 inches coil tubing, and 3-4 barrels per minute for 1 ¾ inch coil tubing at ± 4000
psi pumping pressure. This technique is limited to ±6000 ft of open-hole due to
the limited reach of coil tubing (Aslam, and Al-Salat1).
• Drill Pipe Acid Wash. It is commonly applied when open hole is too long for coil
tubing reach. The advantage of drill pipe acid wash is the possibility to pump
acid at higher rates, for instance, 15 to 25 barrels per minute. The jetting action at
such rate is very effective for removing the filter cake and the drilling fluid
damage. Additionally, good worm-holing action is expected due to higher fluid
velocity of the treatment fluids. The disadvantage is the drill pipe has to be pulled
one-stand at a time which increases the job time; the other problem is that the
well has to be killed before running the completion, which can cause some new
formation damage (Aslam, and Al-Salat1).
• Bull-Heading. Sometimes when it is not possible to run the coiled tubing into the
open hole due to restrictions or when the open-hole is too long for coil tubing
reach, there is only one option possible: to pump all the acid by bull heading. The
major disadvantage of this technique is the acid takes the path of least resistance,

7
and only a small part of the long open- hole may consume all the acid, leaving
the rest of the hole untreated. (Aslam, and Al-Salat1).
• Coiled Tubing with Bull-heading. It is a combination of the two methods i.e. coil
tubing acid wash and bull-heading. A coil tubing string is run to total depth and
acid is pumped through the coil tubing while moving it according to the acid
dosage. Simultaneously the acid is pumped from the coiled tubing X Tubing
annulus at higher rates. Often the acid is allowed to soak in the open hole; later
the remaining acid is pumped from both sides: coiled tubing and the coil tubing
X Tubing.1 annulus. The advantage is the possibility to achieve higher rates and
therefore decrease the total job time (Aslam, and Al-Salat1).
2.1.1 Comparison of the Existing Stimulation Techniques
It is very difficult to perform a comparison of the various stimulation techniques because
the reservoir conditions are different in any of the two wells. It is also difficult to verify
the contribution from a successful stimulation to the final well productivity inasmuch as
the same stimulation treatments often give different results on different wells in the same
field. There are some uncertain factors about the evaluation process to quantify the
degree of success by the current stimulation techniques requiring additional study.
However, there are two major issues that are common to all the stimulation techniques
applicable to horizontal open holes. These are: a) cost and b) stimulation fluid efficiency.
a) Cost. The first and foremost issue attributed to stimulation of horizontal
open-holes is the excessive amounts of acid required and consequently the
associated costs are very high. Usually, vertical or deviated wells are acidized
with 50 to 300 gallons per foot of hydrochloric acid, as well as the dosage for
the horizontal wells has been reduced to 10-50 gals/ft due to economic
reasons. The total cost of the stimulation depends on the pricing structure in
an area, type of additives, and the dosage of acid used. However, there is a

8
need to develop more cost effective methods of stimulation.
b) Stimulation Fluid Efficiency. Although the wells show considerable
improvement after acidizing, the question of efficiency remains unanswered
as the productivity increase calculations show an improvement; however they
do not show whether the entire open hole was treated or only some sections
of the hole received the entire treatment. Post job production logging is the
only way to determine whether the lower permeability sections have been
treated. In many cases, it is not possible to re-enter a particular lateral due to
completion restrictions. The production logging in the open holes is an
expensive option, and the results are difficult to interpret due to many
variables i.e. angle or deviation at a point, density effects and the changes in
the hole size.
2.2 Acid Jetting Fundamentals
Figure 2.1: Acid Jetting Process Model Schematic (Courtesy of Dr. K. Furui2)

9
Jetting was used in many applications, mainly for cleaning different surfaces and
cutting different materials. Water is forced through a small orifice by high pressure,
causing a high velocity jet. The kinetic energy then is focused at the target surface to
achieve the desired outcome. The recent advances in oil and gas technology use open-
hole completions with many feet of damaged formation. The damage removal requires
large amounts of acid.
A schematic of an acid jetting is shown in Figure 2.1. An assumption is made that
the filter cake is impermeable, and the injected acid will not flow back into the annulus.
An acid is injected and the pipe moved a distance of one stand (90 feet), the filter cake is
degraded over this length by the mechanical action of the jets, and injectivity into the
formation at this location is restored. Meanwhile, the entire well bore between the nozzle
location and the toe of the well can also receive additional acid injection. After this stand
of pipe is moved, acid injection is stopped while a stand is removed to the surface. This
cycle is repeated many times until the treatment is accomplished.
The use of jetting offers less expensive alternative to usual methods. Many
service and operator companies use the process for cutting the casing and micro-
fracturing, and cleaning both the damage and scales. They developed some theories that
can be applied to acid jetting in particular.
The jetting process is based on the Bernoulli equation:
CgzPU=++
ρ2
2
(2.1)
We can neglect the third term since it is high pressure high velocity and highly deviated
(or even horizontal) application.
CPU=+
ρ2
2
(2.2)
If the jet is flaring at a distance r from the wellbore then we can predict local pressures,
coupling the Bernoulli equation with a momentum conservation equation:
10
outoutoutout
nininin APUrQAPUrQ
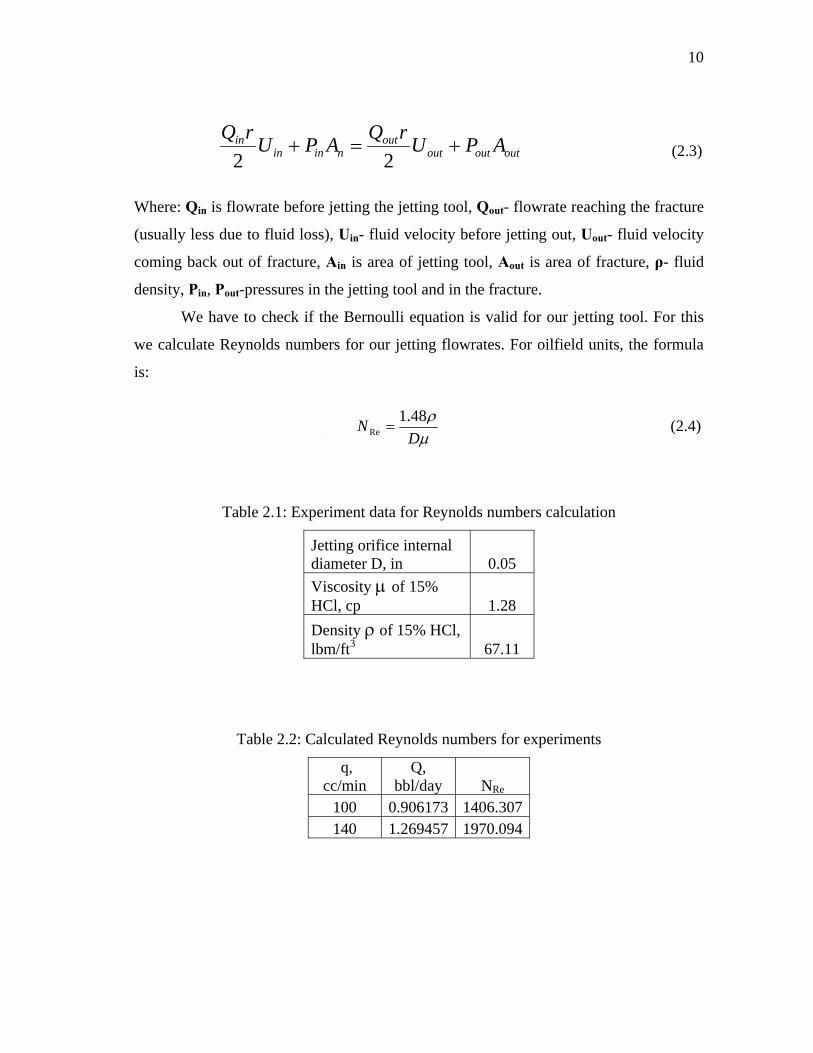
+=+22 (2.3)
Where: Qin is flowrate before jetting the jetting tool, Qout- flowrate reaching the fracture
(usually less due to fluid loss), Uin- fluid velocity before jetting out, Uout- fluid velocity
coming back out of fracture, Ain is area of jetting tool, Aout is area of fracture, ρ- fluid
density, Pin, Pout-pressures in the jetting tool and in the fracture.
We have to check if the Bernoulli equation is valid for our jetting tool. For this
we calculate Reynolds numbers for our jetting flowrates. For oilfield units, the formula
is:
20*rA π=
µρ
DN 48.1
Re = (2.4)
Table 2.1: Experiment data for Reynolds numbers calculation
Jetting orifice internal diameter D, in 0.05 Viscosity µ of 15% HCl, cp 1.28 Density ρ of 15% HCl, lbm/ft3 67.11
Table 2.2: Calculated Reynolds numbers for experiments
q, cc/min
Q, bbl/day NRe
100 0.906173 1406.307140 1.269457 1970.094

11
The calculated NRe values are shown in the Table 2.1 and 2.2. They are lower then 2100
which means that flow is laminar and the Bernoulli equation is valid for acid jetting
experiment parameters.
Surjaatmadja et al.3 stated, that if a jet is flaring at a distance from the wellbore,
then we can predict local pressures, coupling the Bernoulli equation with the momentum
conservation equation. Pressure, flow rate in the annulus and orifice size have large
influence on jet impact force.
The jetting method is simple and cost-effective as compared to other damage
removal methods. Pumping equipment used is available on the rig site (Mud Pumps) and
the major consumable item is acid. Friction reducing additives are being introduced as
an option in accordance to well conditions, drill pipe or coiled tubing dimensions.
The process of jetting has been the topic of many research projects for many
possible applications. Aslam and Al-Salat4 stated that the cake removal effectiveness
depends on the following factors:
1) Standoff Distance: The laboratory tests proved that the impact force decreases
with the increase in stand-off. A rule of thumb for removal moderate to hard
deposits being submerged in a liquid environment is eight times of the orifice
diameter.
2) Fluid Velocity: Another important parameter is fluid velocity and / or the
pressure drop across the orifice. Long and tapered nozzle entry profiles produce
higher fluid velocities. Laboratory studies have stated that fluid velocities above
200 ft/sec are necessary for hard deposit removal.
3) Jet Stream Profile: Jet stream profile is the dispersion of the jet stream after
leaving the orifice. Dispersion of the fluid reduces the effectiveness of the jet-
stream. The shape of nozzles and the friction force reducing additives enhance
the jet stream profile.
4) Rotation: Laboratory studies have stated that the rotating type jetting nozzles

12
yield better results in comparison to stationary ones. The rotational jets benefit
from the pulsation effects. The other advantage provides 360 degree coverage.
The disadvantage is that it tends to jam during long treatments due to the
corrosive environment of the open holes.
5) Number of jets: Obviously larger numbers of jets increase the efficiency of
jetting; however, excessive jet number leads to extra acid spent.
Also the following factors have to be considered when designing a jetting job:
• Well bore fluids. Drilling mud additives as well as drilling cuttings and formation
fluid can react with acid and have impact on job efficiency.
• Jetting fluid composition. Water with or without abrasive content, or
hydrochloric acid should be selected depending on formation hardness and
composition and filter-cake constituents; different acid strength and
concentration also have a large impact on the removal efficiency.
• Filter-cake characteristics. All modern drill-in fluid fluids have complex
composition. Their physical and chemical properties determine filter-cake
features and therefore dictate the particular jetting job design to remove it.
Aslam and Al-Salat4 made a field case study of water jetting treatments; they
pointed out, that high pressure jetting may be efficiently used prior to conventional
acidizing. They also mentioned that in high permeability formations, jetting alone
proved to suffice to restore well performance without conventional acidizing, and
showed limited further improvement after acid treatment.
Dahroug, Brown, and Shaheen5 mentioned that jetting is dependent upon tool
standoff, fluid velocity, jet-stream profile, and rotation. Their field experiments proved
the efficiency of jetting and further formation injectivity improvement using acid
treatments.
Johnson, Eslinger, and Larsen6 conducted research on abrasive jetting scale
13
removal system. They found out, that performance of the jet under atmospheric pressure
was significantly greater (the groove was about 4 times deeper) than under the downhole
pressure conditions. They explained the reason that at atmospheric back pressure
bubbles form in the jet by cavitations, then implode on the target with considerable
destructive force; however under down hole conditions the formation of these cavitations
bubbles are suppressed and the performance of the jet to erode is reduced. The
significance is that jetting system can be built and tested under atmospheric conditions
and may perform very well, but in a situation with a significant back pressure the
performance will be greatly reduced and the jetting system may not work. They also
made significant observation that the use of pure water jets or of sand laden slurry jets is
not commercially effective or acceptable as a cleanout service. The other finding is that
in a water jetting system, if the jet is held stationary for a significant length of time, the
jet can break behind the scale and peel it away from the surface in large chunks. Particles
of this size may cause severe problems, they are difficult to carry out of the well, and
they can become trapped between the tool and the wall of the well, and therefore
preventing it from being circulated out to the surface.
2.3 Carbonates Acidizing Fundamentals
Matrix acidizing is one of the most frequently used stimulations for near wellbore
damage removal. Initially applied in carbonates it has evolved to embrace more complex
mineral composition.
During matrix acid jobs the acid is pumped down at pressures below the formation
parting pressure, hence avoiding fracturing the formation while performing the
treatment, aiming for restoring the permeability near wellbore, not affecting the
reservoir in-depth; usually the acid dissolves the rock up to several feet beyond wellbore
for carbonates (Economides, Hill, and Ehlig-Economides7).
The HCl-soluble minerals are calcite, dolomite, and siderite, they do not generate
precipitates. The reactions are as follows:
14
Calcite 2HCl + CaCO3 ------- CaCl2 + H2O + CO2
Dolomite 4HCl + CaMg(CO3)2 ------- CaCl2 + MgCl2 + 2H2O +2CO2
Siderite 2HCl + FeCO3 ------- FeCl2 + H2O + CO2
2.4 Filter-Cake Buildup Background and Mechanism
As we can see, the drilling damage is very complex. The extent of damage depends on
many factors i.e. formation rock type, drilling fluids type and composition, the filtrates
chemical composition, and the amounts and types of cuttings in the hole. The number
chemical and physical aspects of the drilling damage can be simplified into two main
categories: Surface Damage and Deeper Damage.
• Surface Damage: The main objective of the drilling mud is to form a filter-cake
at the face of the reservoir rock thus avoiding leak-off and minimize the mud
losses. To the contrary, the same filter-cake blocks the production or injection of
the fluids. The filter cake must be removed to restore the productivity or
injectivity of the well. The mud filter-cake consists of mud solids, rock cuttings,
debris and the 'glue', which keeps the solids tied together in the form of a cake.
The ‘glue’ type material comes from the residue of polymers used in the drilling
fluids as viscosifiers.
• Deeper Damage: The formation damage occurs in matrix of the reservoir rock; it
is usually caused by the invasion of mud filtrate. This damage is mainly chemical
in nature and only a few solids are squeezed into the rock-matrix. In the case of
fractures, the mud solids can invade and plug the entire fracture systems
connecting the wellbore to the reservoir rock. The surface damage removal
appears to be easier with the use of acids or other chemical treatments. Some
filter cakes can not be completely soluble in the acid depending on the type of
acid- additives used and the type of filter cake. Also, deeper damage is difficult

15
to remove and in most cases, the well treatments are designed to by-pass the
damaged zone by creating ‘wormholes’ or inducing new fractures.
The acid jetting technology seems to successfully solve the problem, removing
both surface and deeper formation damage.
When a well put back onto production, it usually has an external filter-cake on
the wellbore face and an internal filter-cake (invaded solids and polymers) in the rock.
Internal filter-cake forms during some initial time. As more particles are trapped on the
surface of the rock, a point where very few particles can invade the rock is reached, and
an external cake begins to build. The time at which no more particles invade the rock is
the time at which the initial layer of external is completely formed. Jiao and Sharma8
reported this time as a transition time. If the conditions under which particles form
external and internal filter-cakes, and the time required to form the initial layer of
external filter-cake, then the entire process of filtration can be approximated by applying
the model of internal filter for times less then transition time; and external filter cake for
times more then transition time. Figure 2.2 represents filter-cake before and after acid
treatment.
Figure 2.2: Filter cakes (external and internal) before and after acid jetting treatment

16
It is known, that particle size less than 1/3 or pore throat diameter cause bridging
of the porous media, and more than 1/3 pore throat diameter cause its plugging. Internal
filter-cake forms first and after the particles bridged up enough, external filter-cake starts
to build up. By the making dynamic loss graph, measuring filtrate volume vs. time and
then plotting it vs. square root of time aids to determine when we start external filter-
cake buildup.
Jiao and Sharma8 conduced experiments to find out mechanisms of damage due
to static and dynamic filtration of drilling mud. They discovered that mud particle
invasion usually occurs during initial spurt loss before external mud cake is formed;
therefore to reduce formation damage mud should rapidly form a stable external cake
and salinity of the mud should be above the critical salt concentration of the rock.
Thomas and Sharma9 investigated formation damage and mud cake around
horizontal wells. They have informed that a stable filter cake formed during the first
hour of circulation.
Zain and Sharma10 pointed out that mud cake lift-off is a function of rock
mineralogy and permeability, high flow velocity results in more efficient cleanup, and
mud cake removal is harder for rocks with large internal damage.
In one of the research of drilling fluid composition Suri and Sharma11 concluded
that the main factors influencing damage due to particle invasion are:
1. Particle size distribution in the mud;
2. Formation permeability / pore size distribution;
3. Concentration of mud solids;
4. Over-balance pressure;
5. Mud circulation rate and rheology.
The latest work of Suri and Sharma12, 13 stated once again that both internal and
external cakes are key factors for determining the flow initiation pressure and return

17
permeability ratio. Also, they introduced new methodology for calculating the flowback
differential pressure.
Ryan, Browne, and Burnham14 in their major joint study of different mud cleanup
techniques stated there is no single best technique for the cleanup of open horizontal
wells. Also their conclusions were:
1) Complete external filter-cake removal is not necessary to throughout -
cake oil production;
2) High solids content in the mud system has not adverse effect to effective
oil production throughout filter-cake;
3) Aggressive breakers (acid) are effective for wellbore cleanup but generate
increase in fluid losses;
4) Most breakers reduce damage levels; however, some mud breakers
increase damage.
Jetting acting and wormhole forming improve the injectivity; they reduce the
damage of the formation by combining scouring of filter-cake by acid and dissolving the
carbonates with creation of highly conductive wormholes. In the project I took into
account both mechanisms to come up with recommendations and improvements.

18
CHAPTER III
MATRIX ACIDIZING, FILTER-CAKE BUILDUP APPARATUS, AND
EXPERIMENTAL PARAMETERS
3.1 Matrix Acidizing Apparatus
The components and specifications of the setup necessary to perform the experiment
must be capable to deal with the required conditions for experimentation on different
length core samples at flow rates and temperatures similar to those at field conditions15.
Figure 3.1 is a schematic of the apparatus.
Figure 3.1: Schematic of matrix acidizing setup (Courtesy of J. Nevito15)
As shown in Figure 3.1, brine and acid prepared beforehand and held in the
accumulators, are pumped and heated up, according to the test procedure and particular
Hydraulic Oil
Syringe Pump
Enerpac Pump
Back Pressure Regulator
Data acquisition
Differential Pressure
Transducers
mixed fluid nitrogenhydraulic oil brineacid
High P.
Medium P.
Low P.
A c i dBrine
PVC refill container
Core holder

19
conditions, via the tubing and manifold system and flows through the cores samples
confined inside the core holder. The core sample is confined inside the core holder with
a Viton sleeve by a hydraulic oil pressure created by a hydraulic pump. The acid effluent
is gathered and measured in the beaker at the end of the experiment. The back pressure
supplied via the Teflon diaphragm back pressure regulator maintains the CO2 in solution.
During the experiments, the flow rate, temperature, confining or overburden
pressure, and back pressure are set and kept constant; the differential pressure across the
core during the process is measured by analog pressure transducers and recorded by the
LABVIEW software to construct and analyze the acid response curve. All the
equipment is located inside a laboratory exhaust system to vent the acid fume.
3.1.1 Pumps
In acidizing experimentation, the most important condition for the pump is the flow rate
at which the fluids are to be displaced; in the experiment this flow rate must be constant
during the process to determine the pressure profile in the rock while the fluids are
passing through the core. The pump used is a syringe precision type which is capable of
a wide range of chemical feed applications requiring flow rates up to 200 cc/min at
pressures up to 3,750 psig; its 500 cc cylinder capacity allows delivering a precise 1
cc/min for over 8 hours on a single fill15.
The ISCO D500 has a "Smart Key" controller operating up to three pump
modules, either independently or together. Operating modes include both single/dual
pump independent constant flow or pressure and it additionally comes with a RS-232
serial interface for computer control or monitoring of operating parameters using
commercial Lab VIEW software.

20
The specifications of the pumps are following (J. Nevito15):
• Capacity: 507 cc
• Flow Range: 0. 001 – 204 cc/min
• Flow Accuracy: 0.5% of set point
• Displacement Resolution: 31.7 nl
• Motor Stability: ± 0.001% per year
• Pressure Range: 0- 3,750 psi
• Standard Pressure Accuracy: 0.5% FS
• Optional Pressure Accuracy: 0.1% FS
• Wetted Materials (standard): Nitronic 50, PTFE, Hastelloy C-276
• Plumbing Ports: 1/8" NPT
• Operating Temperature: 0 - 40° C Ambient
• Power required: 100 Vac, 117 Vac, 234 Vac, 50/60 Hz
• Dimensions (HxWxD, cm): 103 x 27 x 45
• Weight: Pump module - 33 kg; controller - 3 kg
The set-up has two pumps utilized in parallel; they use hydraulic oil as a driving
fluid to exclude direct contact with corrosive conditions during testing. Inlet and outlet
ports, that make the refill and dispense lines, are 1/8" NPT female threads connected to
1/8” stainless steel tubing forming the discharge manifold which further on are
connected using “Gyrolok” type compression fittings.
Each pump cylinder must be filled prior to any use; discharge and refill lines are
independent, and the valves in the manifold are operated carefully during any operation
being performed. Once the cylinder is empty after running the pump through a test, the
discharge valve shall be closed and the refill valve shall be open; select the pump in the
controller and push the refill button. The recommended refill flow rate is between 30 and
40 cc/min. After refill is complete, the refill valves should be closed and while discharge
valve is closed, the pump shall be started at 5 to 10 cc/min until reaching the discharge
pressure, then open the valve and equalize the pressure (J. Nevito15).
21
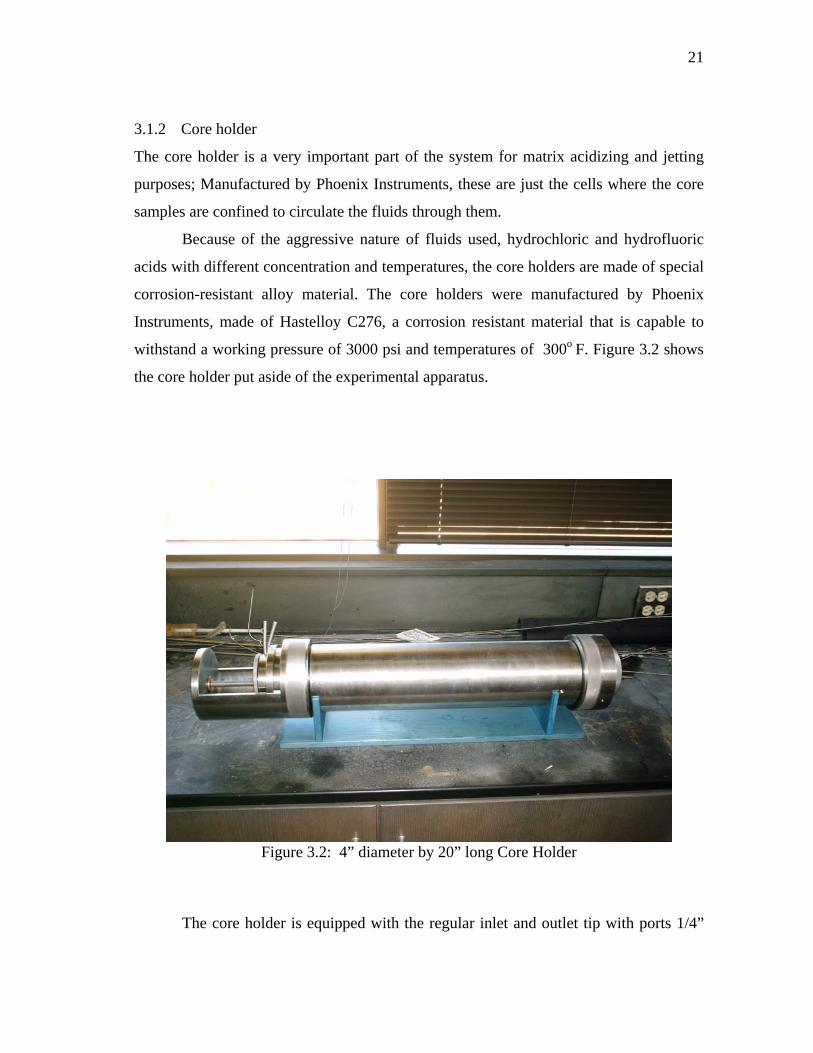
3.1.2 Core holder
The core holder is a very important part of the system for matrix acidizing and jetting
purposes; Manufactured by Phoenix Instruments, these are just the cells where the core
samples are confined to circulate the fluids through them.
Because of the aggressive nature of fluids used, hydrochloric and hydrofluoric
acids with different concentration and temperatures, the core holders are made of special
corrosion-resistant alloy material. The core holders were manufactured by Phoenix
Instruments, made of Hastelloy C276, a corrosion resistant material that is capable to
withstand a working pressure of 3000 psi and temperatures of 300o F. Figure 3.2 shows
the core holder put aside of the experimental apparatus.
Figure 3.2: 4” diameter by 20” long Core Holder
The core holder is equipped with the regular inlet and outlet tip with ports 1/4”

22
and 1/8”, and the distribution pattern to contact the total face area of the core; inside the
cylinder a special rubber Viton sleeve, temperature resistant, has been utilized to confine
the core during experiments. The core holder allows the recirculation of mud and
conduct different type of experiments on jetting acidizing; the additional set of jetting
tips with spacer rings with predetermined stand-offs were made to comply with the
necessity to create a certain filter-cake on the face of the core sample, and then break it
with high pressure and velocity acid jet.
To allow for specific standoff between the core face and jet nozzle, a set of
special spacer ring was designed. They have the same 4 inch external diameter and 3.8
inch internal diameter, with thicknesses varying from 0.2 inch to 2 inches. The standoff
rings are shown on Figure 3.3.
Figure 3.3: Spacer rings, providing standoff between core face and jet nozzle
3.1.3 Accumulator
The accumulators were manufactured by Phoenix Instruments. They are piston type.
They are the vessels where the products to be displaced through the cores during the

23
acidizing experimentation are contained.
These accumulators (Figure 3.4) were designed to be corrosion resistant (special
alloy material, Hastelloy C-276), with capacities of 1000 cc and 2000 cc; there is also
one stainless steel accumulator made for brine containment with capacity of 1500 cc. All
of the accumulators have inlet/outlet ports of 1/8” NPT.
Figure 3.4: Brine accumulators, acid accumulator, and PVC refill container
The displacement of the acid and brine is accomplished by the syringe pumps
pumping the hydraulic oil which in turn acts on the Teflon piston pushing either the acid
or brine out at necessary pressure and flow rate, carrying them to the core via set of
tubing until it hits the core face in the core holder.
To refill the accumulators with acid or brine, a PVC container (Figure 3.4) is
filled first; then air at 100 psi from the laboratory air system pushes it into the
accumulators. It is necessary to vent the oil line on top of the accumulator to allow either
the acid or brine to be entered into the accumulators as the oil inside them is removed.
This operation is done independently for each accumulator.
24
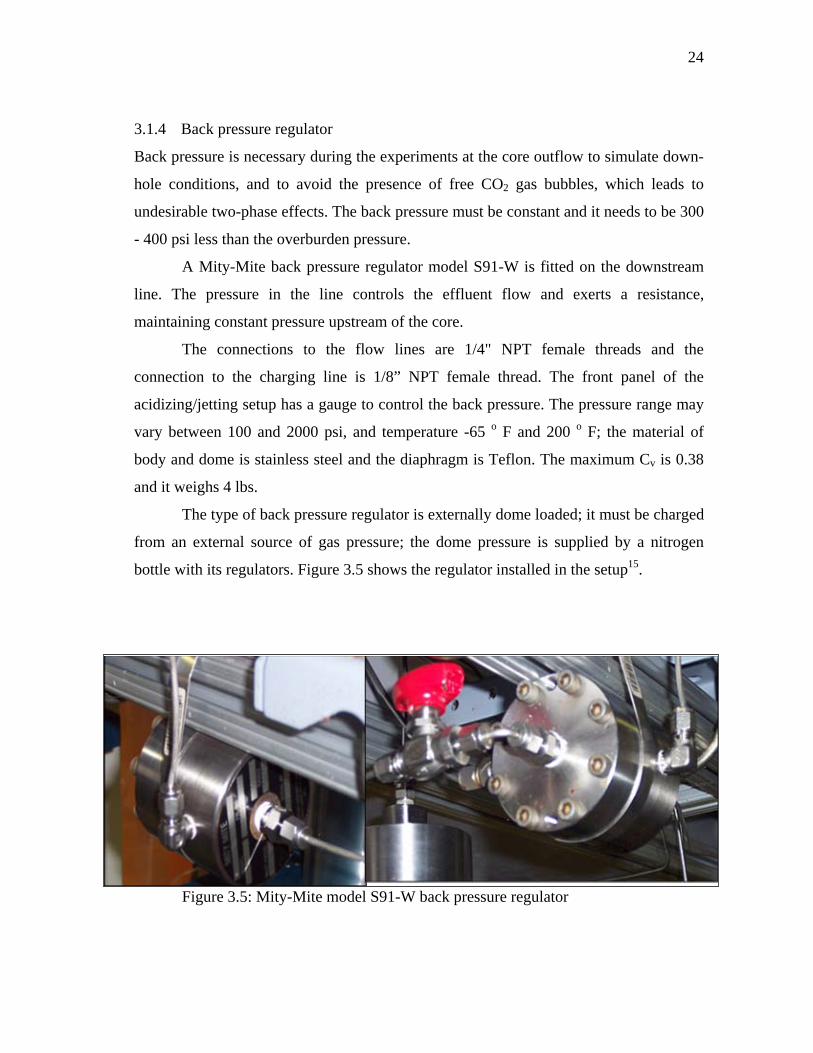
3.1.4 Back pressure regulator
Back pressure is necessary during the experiments at the core outflow to simulate down-
hole conditions, and to avoid the presence of free CO2 gas bubbles, which leads to
undesirable two-phase effects. The back pressure must be constant and it needs to be 300
- 400 psi less than the overburden pressure.
A Mity-Mite back pressure regulator model S91-W is fitted on the downstream
line. The pressure in the line controls the effluent flow and exerts a resistance,
maintaining constant pressure upstream of the core.
The connections to the flow lines are 1/4" NPT female threads and the
connection to the charging line is 1/8” NPT female thread. The front panel of the
acidizing/jetting setup has a gauge to control the back pressure. The pressure range may
vary between 100 and 2000 psi, and temperature -65 o F and 200 o F; the material of
body and dome is stainless steel and the diaphragm is Teflon. The maximum Cv is 0.38
and it weighs 4 lbs.
The type of back pressure regulator is externally dome loaded; it must be charged
from an external source of gas pressure; the dome pressure is supplied by a nitrogen
bottle with its regulators. Figure 3.5 shows the regulator installed in the setup15.
Figure 3.5: Mity-Mite model S91-W back pressure regulator

25
The principle of acting the dome type back pressure regulator is following. The
dome pressure acts over the exposed area of the diaphragm to seat it on the nozzle; when
upstream pressure exceeds the desired level, it pushes the diaphragm up off the nozzle.
The flow of fluid through the regulator relieves the pressure in the upstream system; as
the upstream pressure drops off, the diaphragm moves down to reduce or shut off the
flow, so that upstream line pressure is held constant.
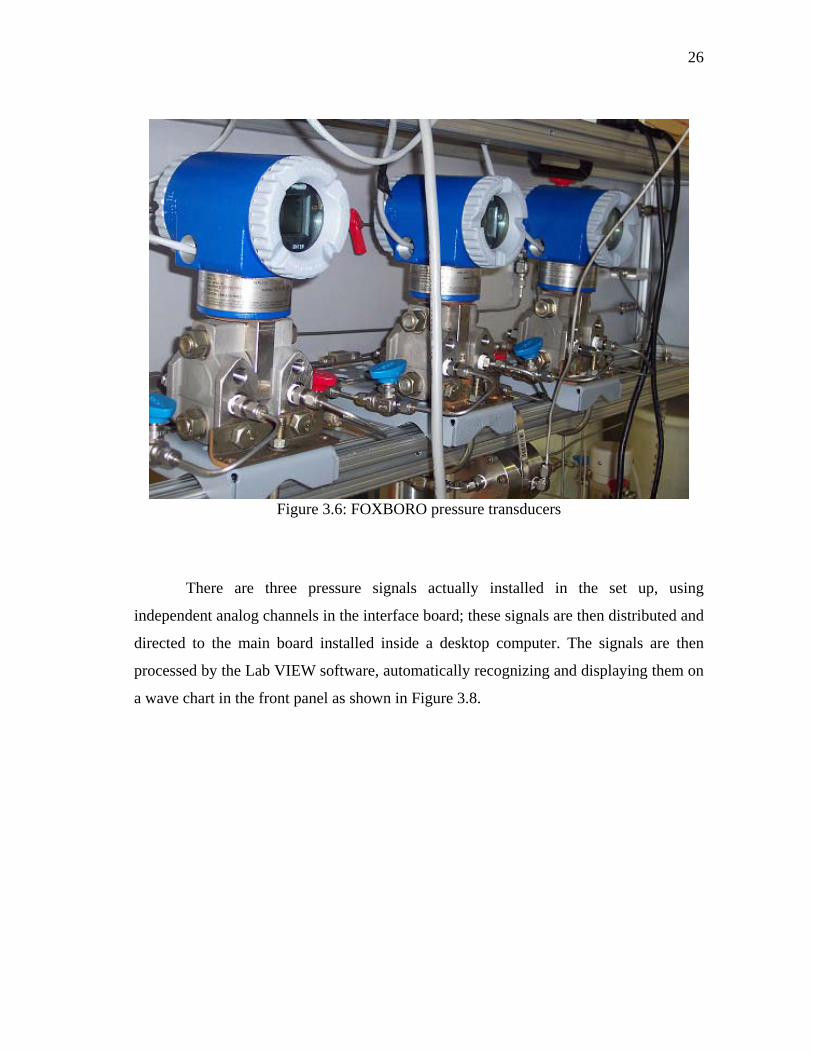
3.1.5 Data acquisition
The flow rate is directly set and controlled by the ISCO syringe pumps controller.
Because the experimentation is mostly carried out at constant flow rate the variable that
changes during process is the discharge pump pressure, determining the pressure at the
inlet face of the core. The pressure drop across the core is read with a set of FOXBORO
differential pressure gauges model IDP10-T26(C-D-E) 21F-M2L1; they measure the
difference between two pressures and transmit a proportional or square root (Flow)
electrical Signal. The differential pressure gages are powered by a 30 volt single DC
power supply and display pressure data on LCD screens and output 4~20 mA DC
current signals that are transmitted to hardware via grade 16AWG electric cable. There
are three different gages installed with ranges 0-30 psi, 0-300 psi, and 0-3000 psi; which
permits choosing the most suitable one according to the expected pressure drop, related
to the rock permeability. The sensor of these devices is made of Hastelloy C276 and
silicone fill fluid. The connections of the transmitters are with 1/8” Hastelloy C276
tubing and Gyrolok compression fitting. Figure 3.6 illustrates the pressure transmitter
setup and Figure 3.7 shows the connection mode to receive the electric signals and
transmit to PC based data acquisition system15.
26
Figure 3.6: FOXBORO pressure transducers
There are three pressure signals actually installed in the set up, using
independent analog channels in the interface board; these signals are then distributed and
directed to the main board installed inside a desktop computer. The signals are then
processed by the Lab VIEW software, automatically recognizing and displaying them on
a wave chart in the front panel as shown in Figure 3.8.
27
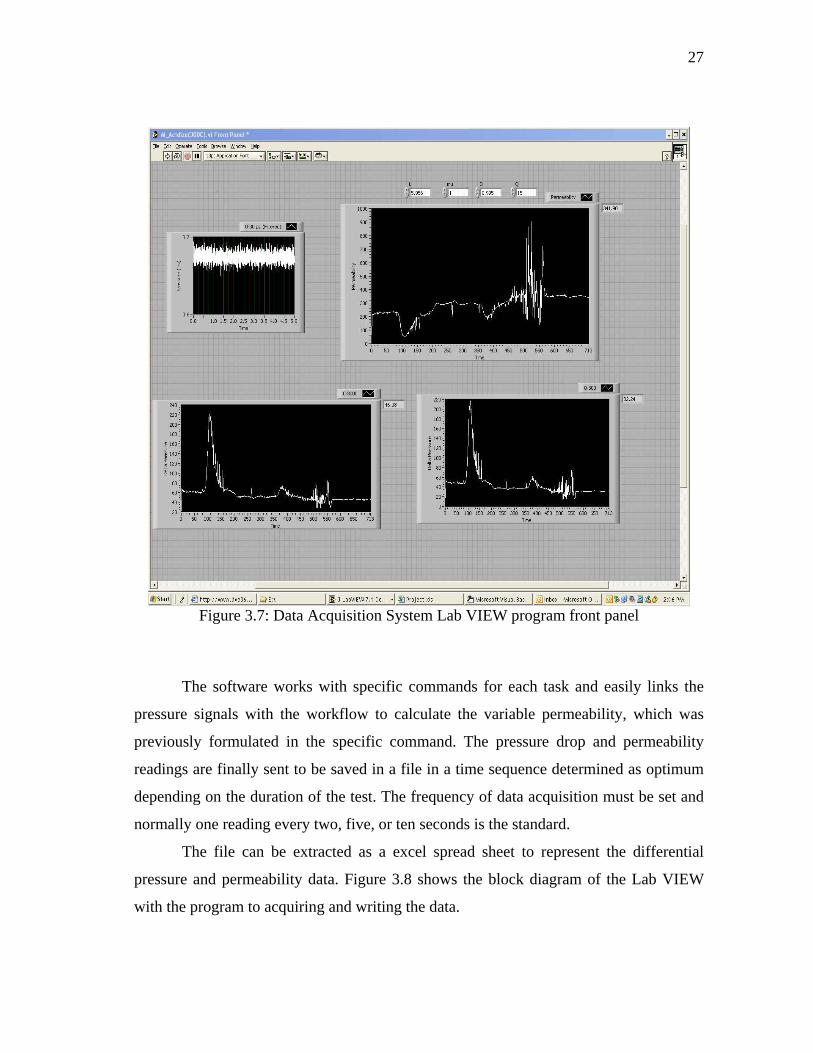
Figure 3.7: Data Acquisition System Lab VIEW program front panel
The software works with specific commands for each task and easily links the
pressure signals with the workflow to calculate the variable permeability, which was
previously formulated in the specific command. The pressure drop and permeability
readings are finally sent to be saved in a file in a time sequence determined as optimum
depending on the duration of the test. The frequency of data acquisition must be set and
normally one reading every two, five, or ten seconds is the standard.
The file can be extracted as a excel spread sheet to represent the differential
pressure and permeability data. Figure 3.8 shows the block diagram of the Lab VIEW
with the program to acquiring and writing the data.

28
Figure 3.8: Data acquisition Lab VIEW program block diagram
3.1.6 Hydraulic pump for overburden pressure
This pump is an ENERPAC hydraulic model P392 that provides the necessary pressure
to confine the core sample inside the core holder to simulate the overburden pressure.
Pressure, commonly 1,000-1,200 psi, acts on the rubber Viton sleeve; which in turn
contact the core sample. It should be 300-400 psi greater than backpressure. Figure 3.9
shows the ENERPAC hydraulic pump.

29
Figure 3.9: ENERPAC model P392 hydraulic pump (J. Nevito15)
3.1.7 Pipe work, valves, and fittings
The tubing pipe installed in the set up to serve as flow line to displace the acids and
brine during the experiments was designed to be 1/8 inch diameter with a wall thickness
of 0.03 inch. Its effective inner diameter allows to flow at the maximum rates provided
by the ISCO D500 pumps that is 204 cc/min; the burst pressure is greater than 7500 psi.
Due to the nature of the fluid we deal with, the tubing is made of Hastelloy C276 to
resist the corrosive environment of HCl-HF mixtures. Regular stainless steel tubing 1/8
inch is used in tubing in which hydraulic oil is the fluid.
Two types of valves are installed in the piping network of the set up; needle
valves with HiP taper seal made of Hastelloy and ball valves. The needle valves are used
for flow lines with acid; their fittings seal metal to metal as a compression fitting by a
sliding sleeve fastened to the tubing. These valves are designed to withstand pressures
up to 15,000 psi and temperatures of 450 o F. The ball valves are made of stainless steel
and are used in lines with either no dynamic flow as those for detecting pressure signals

30
or hydraulic oil lines; they withstand up to 6000 psi and 300 o F.
3.2 Filter-Cake Buildup Apparatus
To create a proper filter-cake imitating conditions after drilling operations, a special
apparatus was designed. After surveys and feedback gathered from the industry we
decided to use a piston pump with variable pump rate and pressure, regulated by a stroke
length adjusting mechanism. The pump is capable of maintaining a flow rate from 0.1 to
4 gallon per minute with pressures to 2000 psi. This pump was chosen due to its ability
to handle high solids content (RevDust, sized calcium carbonate, other drill-in fluid
additives) and variable pump rate with high pressure rating. The pump rate was kept in
the range of 0.2-0.5 gallon per minute which enabled dynamic filter-cake deposition
across the core face. The pulsation dampener installed into the discharge line before
connection to the coreholder smoothes out the pressure jumps and aids to stabilize the
flow. The pump suction and discharge lines are metal-wire braided half-inch rubber
hoses, which allow more flexibility in the system layout and component placement.
Special requirements for power and water supply require that this apparatus be in a
laboratory with the necessary plugs/outlets.
The drill-in fluid is mixed beforehand and stored in a 10 gallon LabWare plastic
barrel with a cover. A port located at the bottom of the barrel connects via rubber hose to
the pump suction. From the line at the pump discharge, after the pulsation dampener,
drill-in fluid flows to the coreholder inlet, and pressure readings are taken from the inlet
pressure gauge. A back pressure regulator is fitted into the coreholder outlet at the same
side of the coreholder to maintain back pressure around 500 psi. The drill-in fluid
passing throughout the back pressure regulator plate then goes to the barrel port at the
top. The drill-in fluid flow-out pressure is read by the outlet pressure gauge. The
overburden pressure imposed on the core is exerted by the same ENERPAC hydraulic
pump model P392. It is kept 300-500 psi higher then back pressure. The coreholder is
positioned vertically to minimize gravitational effect on filter cake deposition process.

31
The core inside the coreholder is given the two inch standoff by the stainless steel spacer
ring inside; it provides essential room for mud circulation and filter-cake deposition. The
opposite side of the core holder has another outlet line; this line leads to the measuring
beaker with scale. During the filter-cake deposition, the line drains brine which was
displaced by the invading drill-in fluid filtrate; its volume versus time measurement
gives understanding of how the filter-cake deposition process is evolving. Figure 3.10
shows the mud pump and the mud tank with mixer.
Figure 3.10: Mud pump with backpressure nitrogen vessel; mud tank with mud mixer
3.3 Core Cutting
Core samples used in jetting experiments are carbonates (mostly Cream Chalk). These
cores are cut using the HILTI model DD200, a heavy duty and portable core cutter. The
cutting is made by 4 inch special design core bit required for use with the core holder. A
special frame was built to install the machine and provide rigidity and stability because
of the lengths of cores used. Also, the cutting process required special power and water
supply to cool the bit and transport the cuttings. The frame with the core drill is built and

32
installed in the laboratory which had to be specially prepared for meeting these demands
beforehand. The core press and the bit are shown on Figure 3.11.
Figure 3.11: Heavy duty HILTI DD200 Core Press and Core Bit (J. Nevito15)
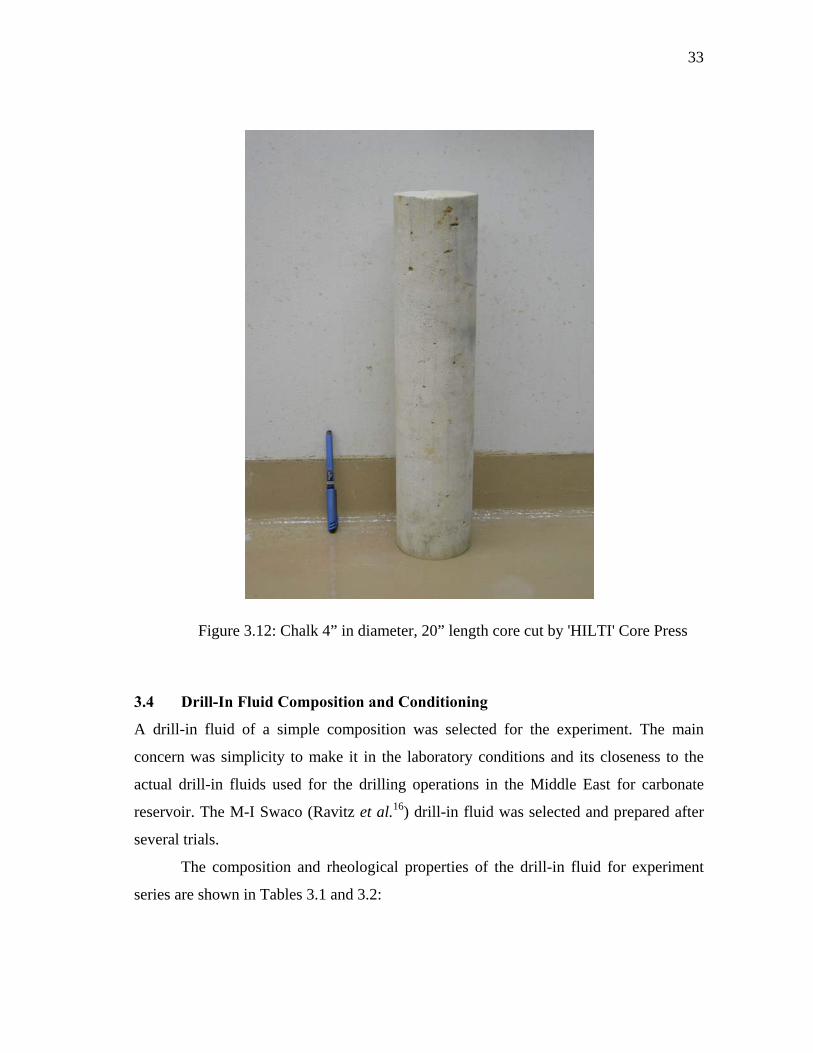
Core bits specially designed for HILTI are used in our application in a non-
standard length 4” diameter by 20” long. Figure 3.12 shows the cores obtained from
Cream Chalk. The time spent for cutting the cores is approximately 45 minutes per core.
The cores are saturated in the vacuum facility already existing in the Department. This
pre-saturation process assures the initial permeability is measured at 100% saturation.
33
Figure 3.12: Chalk 4” in diameter, 20” length core cut by 'HILTI' Core Press
3.4 Drill-In Fluid Composition and Conditioning
A drill-in fluid of a simple composition was selected for the experiment. The main
concern was simplicity to make it in the laboratory conditions and its closeness to the
actual drill-in fluids used for the drilling operations in the Middle East for carbonate
reservoir. The M-I Swaco (Ravitz et al.16) drill-in fluid was selected and prepared after
several trials.
The composition and rheological properties of the drill-in fluid for experiment
series are shown in Tables 3.1 and 3.2:

34
Table 3.1: Drill-in fluid composition by MI-Swaco (Ravitz et al.16)
Table 3.2: Drill-in fluid properties by MI-Swaco (Ravitz et al.16)
The components for the selected drill-in fluid to control the properties17 are as follows:
• Brine base. The brine is chemically compatible with the formation. The brine
base is KCl and NaCl solution.
• Bridging additive. Sized calcium carbonate was used as the most common
bridging agent. It can be dissolved in hydrochloric acid. Since it is available in
different median particle sizes which can be used to match the pore throat and
minimize permeability impairment. The size was selected following the “1/3
rule” (van Vilet and Hassan18): in order to bridge on the outside of a permeable

35
formation, the bridging particles should have a particle size distribution with a
median size (slightly) larger than 1/3 of the median formation pore throat size
diameter. The reliable pore throat size data of the carbonate reservoir cores was
not available; therefore the median pore throat size was estimated according to
the following rule of thumb:
kD 9.050 = (3.1)
Since the measured cores permeability was within the range of 16-25 mD, the
D50 ratio is about 4.5. The closest D50 ratio is 5 for the Halliburton product
Baracarb-5, which was selected as CaCO3 additive. The mean particle size
distribution for different grades of Baracarb product is shown on Figure 3.13.
Figure 3.13: Halliburton’s BARACARB agent mean particle size distribution

36
• Fluid Loss Control Additive. The most common one, starch was used. Its
drawback is easy fermentation by microorganisms (yeasts, molds, bacteria). To
fight it, the mud was saturated with salt and the pH was kept around 12.
• Rheology Control Agent or Biopolymer. Xanthan Gum polymer was used to
control rheological properties such as viscosity and yield point. The effect of pH
on viscosity is negligible within range to 11.
• pH buffers. Caustic soda was used in as a source of hydroxyl ions to control pH.
• Bactericide. The bactericide was used, to kill the bacteria, which destroy organic
additives such as starch or polymers.
• Rev Dust. To reproduce drilling damage, 30-40 ppg of RevDust was introduced
to the active drill-in fluid system. Is did not change rheological properties
significantly, but this concentration, advised by previous researchers, was
successful to plug and invade the formation pores.
The drill-in fluid was prepared, mixed, and conditioned for the purpose of
imitation drilling conditions and drilling damage on carbonate rock reservoir in the
Middle East. Control and adjustment on rheological properties was performed in
accordance to standard API procedure for rheology and fluid loss.
3.5 Parameters for Filter-Cake Deposition Process
Successful filter-cake deposition is the key to the research. After careful investigation
and reference to previous researches, the following parameters were adopted:
• Time of deposition. Previous authors8-12, 14 achieved good sustained filter-cakes
pumping the fluid across the core face during 12 – 16 hours. The maximum
reported time 16 hours was selected due to the core dimensions.

37
• Pressure of deposition. Different researcher reported differential pressure used
within range from 300 to 500 psi19-21 with accordance to permeability. Since the
cores we cut, were Austin Cream Chalk having permeability 15-23 mD, a
maximum 500 psi pressure rating was used. To verify pressure at the core inlet
for drill-in fluid invasion a back pressure of 500 psi was applied to the outlet at
the same side of the core holder.
• Confining or overburden pressure with ENERPAC pump was kept to reach the
desired pressure; it was set 300 psi higher than back pressure.
• Pump rate. At early time, the filtration rate is high. As the cake builds-up, the
filtration rate decreases until an equilibrium filtration rate has been attained. During
cake build-up under dynamic filtration conditions, the force preventing particle
deposition on the surface is proportional to the shear rate. As it was mentioned by
previous authors8-9 external filter-cake starts to build up after bridging is complete. In
the case of sized CaCO3, it takes more significant amount of time than it would be
for fiber agent. Previous experiments showed that the drilling fluid velocity along the
core face does not have serious impact if it is kept within typical wellbore conditions
0.4-1.2 ft/sec. Hence, the pump rate was kept within the range 0.3 to 0.5 gallons per
minute to satisfy this.
• Temperature. Temperature was not expected to differ significantly after filter-
cake formation.

38
The core parameters are stated in the Table 3.3:
Table 3.3: Parameters for filter-cake deposition Core Type Cream Chalk
Permeability, mD 16-25
Porosity, % 19-22
Core dimensions, (diameter, inch x
length, inch)
4 x 18
Saturation fluid water
3.6 Parameters for Acid Jetting Experiment
To properly conduct the jetting procedure the following parameters are to be set:
• Confining or overburden pressure with ENERPAC pump to reach the desired
pressure; it was recommended 1200-1500 psi.
• Back pressure was 300 psi less than overburden pressure; this was the pressure
to be applied on the dome of back pressure regulator; was checked in the gauge
mounted in the front panel.
• Temperature. The same as for filter-cake deposition, an ambient temperature was
used.
• Exposure time. Duration of jetting was the one of variables to be adjusted for
determining what values of them were more efficient for the treatment. The
duration varied for each experiment.

39
• Acid concentration. A permanent hydrochloric acid concentration of 15 per cent
by volume was used while jetting is applied.
• Syringe pump rate. Initial rate was adjusted to 30-40 cc/min, in order to fill the
core with brine first, and having established flow from the outlet, decreased to 2-
5 cc/min for measuring permeability. After measuring the permeability to brine,
for jetting experiment the higher pump rate (100 or 140 cc/min) was used.
40
CHAPTER IV
RESULTS AND DISCUSSIONS
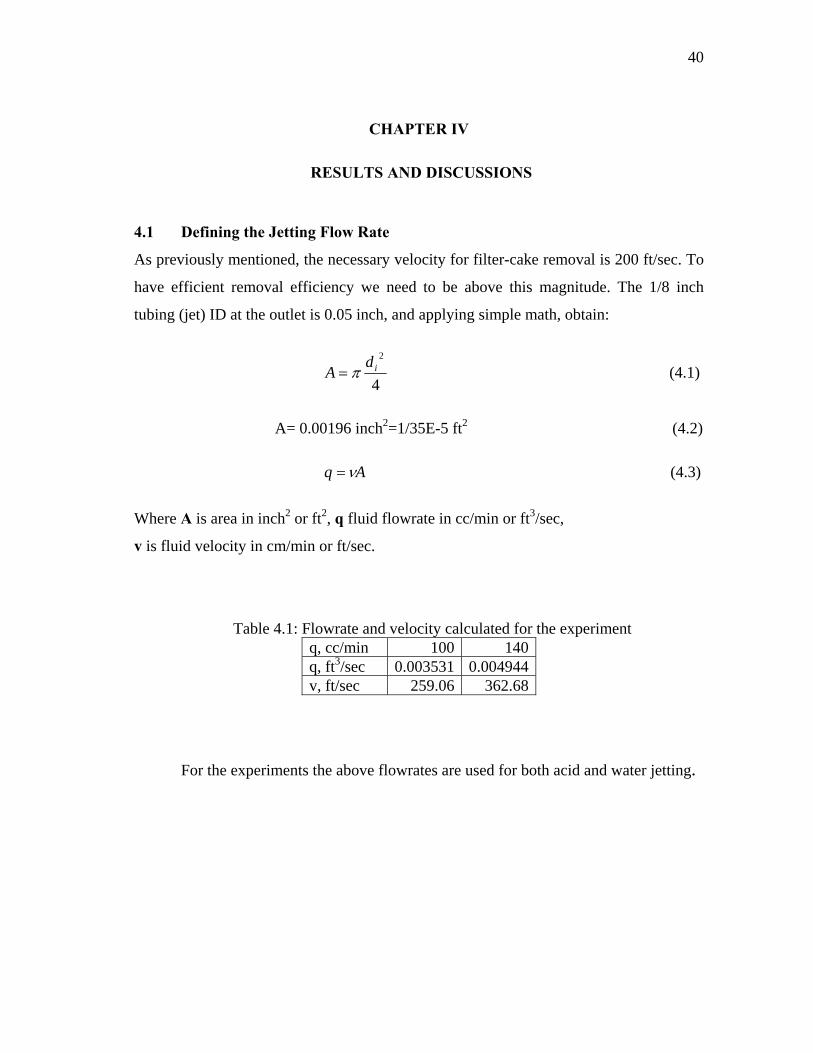
4.1 Defining the Jetting Flow Rate
As previously mentioned, the necessary velocity for filter-cake removal is 200 ft/sec. To
have efficient removal efficiency we need to be above this magnitude. The 1/8 inch
tubing (jet) ID at the outlet is 0.05 inch, and applying simple math, obtain:
4
2id
A π= (4.1)
A= 0.00196 inch2=1/35E-5 ft2 (4.2)
Aq ν= (4.3)
Where A is area in inch2 or ft2, q fluid flowrate in cc/min or ft3/sec,
v is fluid velocity in cm/min or ft/sec.
Table 4.1: Flowrate and velocity calculated for the experiment q, cc/min 100 140q, ft3/sec 0.003531 0.004944v, ft/sec 259.06 362.68
For the experiments the above flowrates are used for both acid and water jetting.

41
4.2 Filter-Cake Deposition Experimental Results
Dynamic fluid Loss Vs Time
0
50
100
150
200
250
300
350
0 200 400 600 800 1000 1200
Time, min
Filtr
ate
Volu
me,
ml
Figure 4.1: Dynamic fluid loss vs. time
Dynamic fluid loss for sized CaCO3 drill in fluid
0
50
100
150
200
250
300
350
0 5 10 15 20 25 30 35
time^(1/2), min^(1/2)
Filtr
ate
volu
me,
ml
Figure 4.2: Dynamic fluid loss vs. time
42
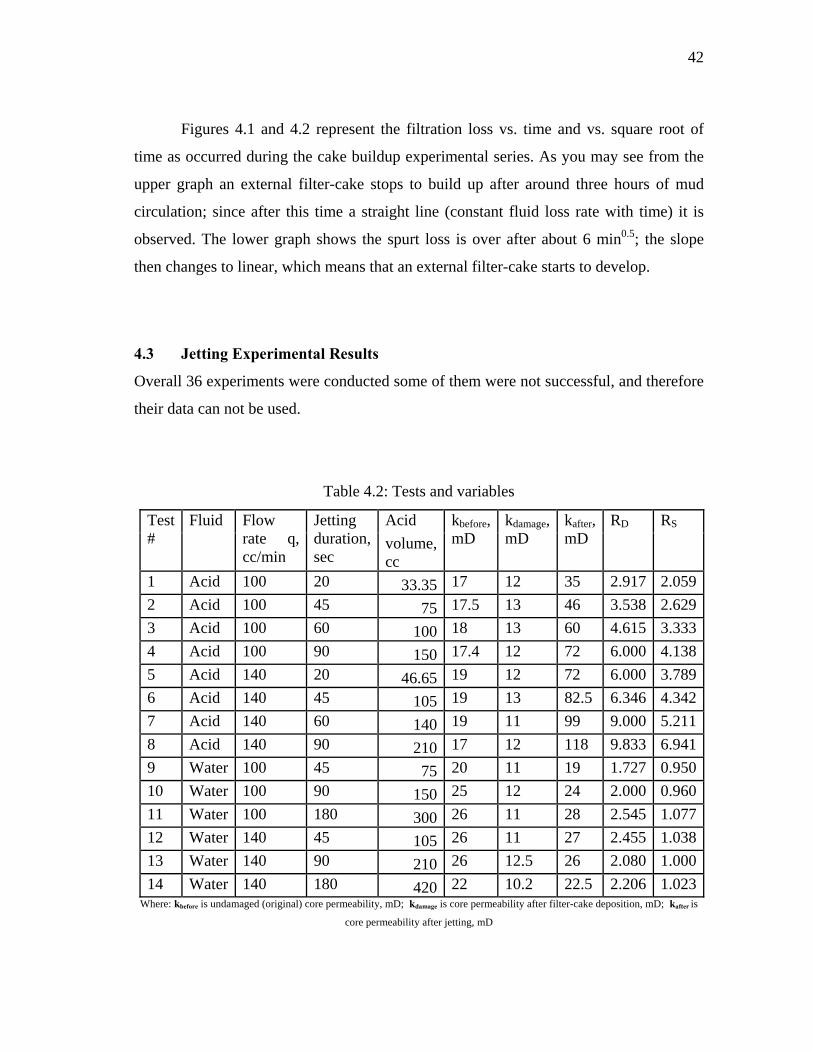
Figures 4.1 and 4.2 represent the filtration loss vs. time and vs. square root of
time as occurred during the cake buildup experimental series. As you may see from the
upper graph an external filter-cake stops to build up after around three hours of mud
circulation; since after this time a straight line (constant fluid loss rate with time) it is
observed. The lower graph shows the spurt loss is over after about 6 min0.5; the slope
then changes to linear, which means that an external filter-cake starts to develop.
4.3 Jetting Experimental Results
Overall 36 experiments were conducted some of them were not successful, and therefore
their data can not be used.
Table 4.2: Tests and variables
Acid Test #
Fluid Flow rate q, cc/min
Jetting duration, sec
volume, cc
kbefore, mD
kdamage, mD
kafter, mD
RD RS
1 Acid 100 20 33.35 17 12 35 2.917 2.0592 Acid 100 45 75 17.5 13 46 3.538 2.6293 Acid 100 60 100 18 13 60 4.615 3.3334 Acid 100 90 150 17.4 12 72 6.000 4.1385 Acid 140 20 46.65 19 12 72 6.000 3.7896 Acid 140 45 105 19 13 82.5 6.346 4.3427 Acid 140 60 140 19 11 99 9.000 5.2118 Acid 140 90 210 17 12 118 9.833 6.9419 Water 100 45 75 20 11 19 1.727 0.95010 Water 100 90 150 25 12 24 2.000 0.96011 Water 100 180 300 26 11 28 2.545 1.07712 Water 140 45 105 26 11 27 2.455 1.03813 Water 140 90 210 26 12.5 26 2.080 1.00014 Water 140 180 420 22 10.2 22.5 2.206 1.023
Where: kbefore is undamaged (original) core permeability, mD; kdamage is core permeability after filter-cake deposition, mD; kafter is
core permeability after jetting, mD
43
The Table 4.2 shows experimental results and variables with jetting duration and
flow rate that were conducted and which data was used for the purpose of this work.
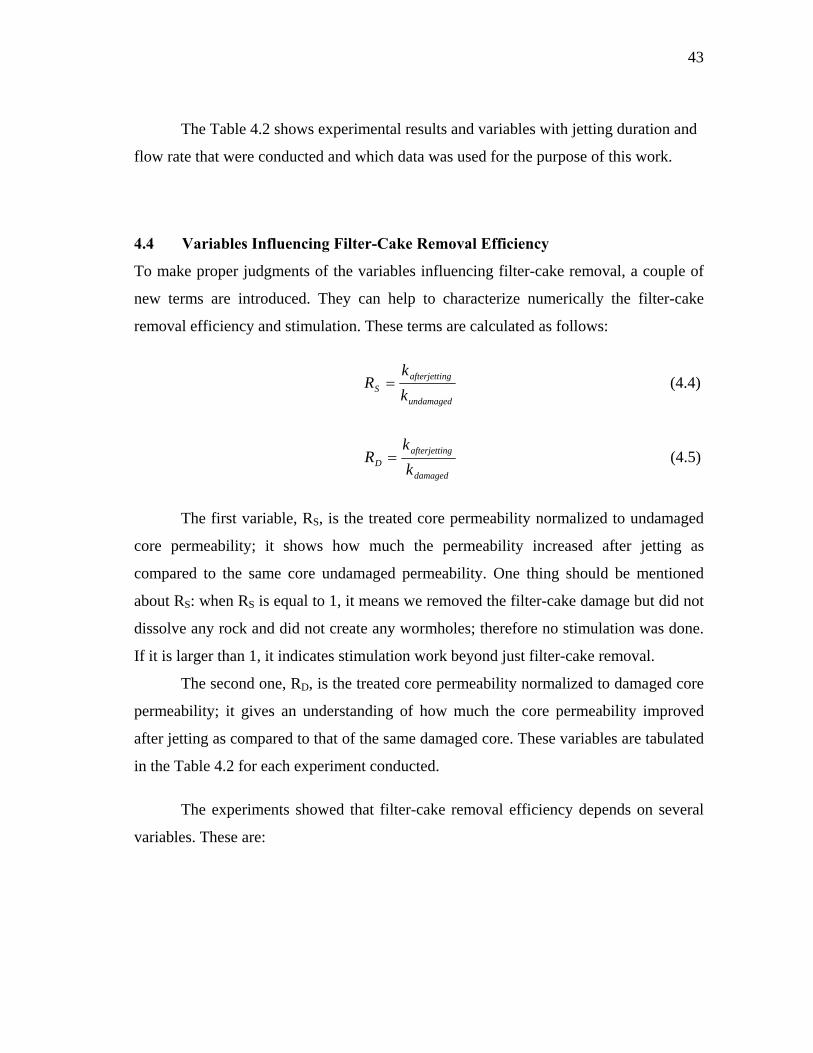
4.4 Variables Influencing Filter-Cake Removal Efficiency
To make proper judgments of the variables influencing filter-cake removal, a couple of
new terms are introduced. They can help to characterize numerically the filter-cake
removal efficiency and stimulation. These terms are calculated as follows:
undamaged
ngafterjettiS k
kR = (4.4)
damaged
ngafterjettiD k
kR = (4.5)
The first variable, RS, is the treated core permeability normalized to undamaged
core permeability; it shows how much the permeability increased after jetting as
compared to the same core undamaged permeability. One thing should be mentioned
about RS: when RS is equal to 1, it means we removed the filter-cake damage but did not
dissolve any rock and did not create any wormholes; therefore no stimulation was done.
If it is larger than 1, it indicates stimulation work beyond just filter-cake removal.
The second one, RD, is the treated core permeability normalized to damaged core
permeability; it gives an understanding of how much the core permeability improved
after jetting as compared to that of the same damaged core. These variables are tabulated
in the Table 4.2 for each experiment conducted.
The experiments showed that filter-cake removal efficiency depends on several
variables. These are:
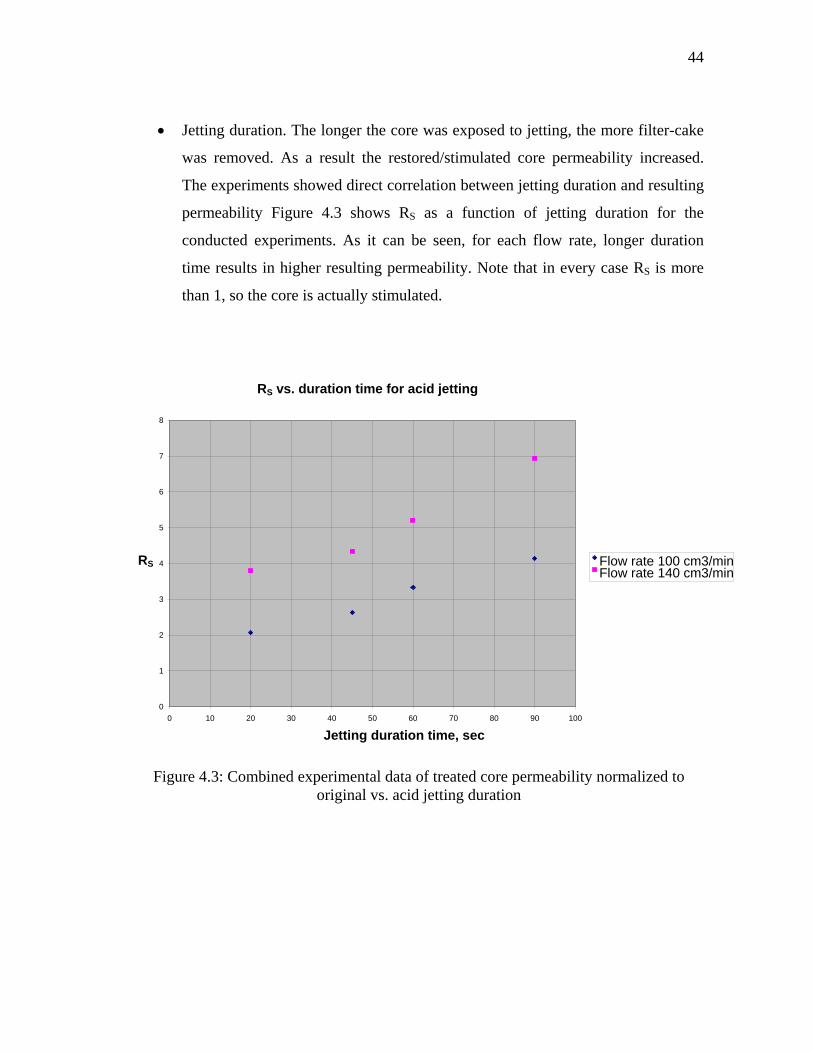
44
• Jetting duration. The longer the core was exposed to jetting, the more filter-cake
was removed. As a result the restored/stimulated core permeability increased.
The experiments showed direct correlation between jetting duration and resulting
permeability Figure 4.3 shows RS as a function of jetting duration for the
conducted experiments. As it can be seen, for each flow rate, longer duration
time results in higher resulting permeability. Note that in every case RS is more
than 1, so the core is actually stimulated.
Figure 4.3: Combined experimental data of treated core permeability normalized to
original vs. acid jetting duration
RS vs. duration time for acid jetting
0
1
2
3
4
5
6
7
8
0 10 20 30 40 50 60 70 80 90 100 Jetting duration time, sec
RS Flow rate 100 cm3/minFlow rate 140 cm3/min

45
Figure 4.4: Combined experimental data of treated core permeability normalized to
damaged vs. acid jetting duration
Figure 4.4 illustrates RD as a function of jetting duration, and the trend remains identical
to RS on Figure 4.3: more duration enhances permeability greater.
Figure 4.5 illustrates that acid jetting duration has significant effect on filter-cake
removal efficiency. It appears for the upper core that a larger portion of the filter-cake
was removed and dissolved from its surface than for the lower one with the same acid
jetting flow rate.
RD vs. acid jetting duration time
0
2
4
6
8
10
12
0 10 20 30 40 50 60 70 80 90 100 Jetting duration time, sec
RD Flow rate 100 cm3/minFlow rate 140 cm3/min
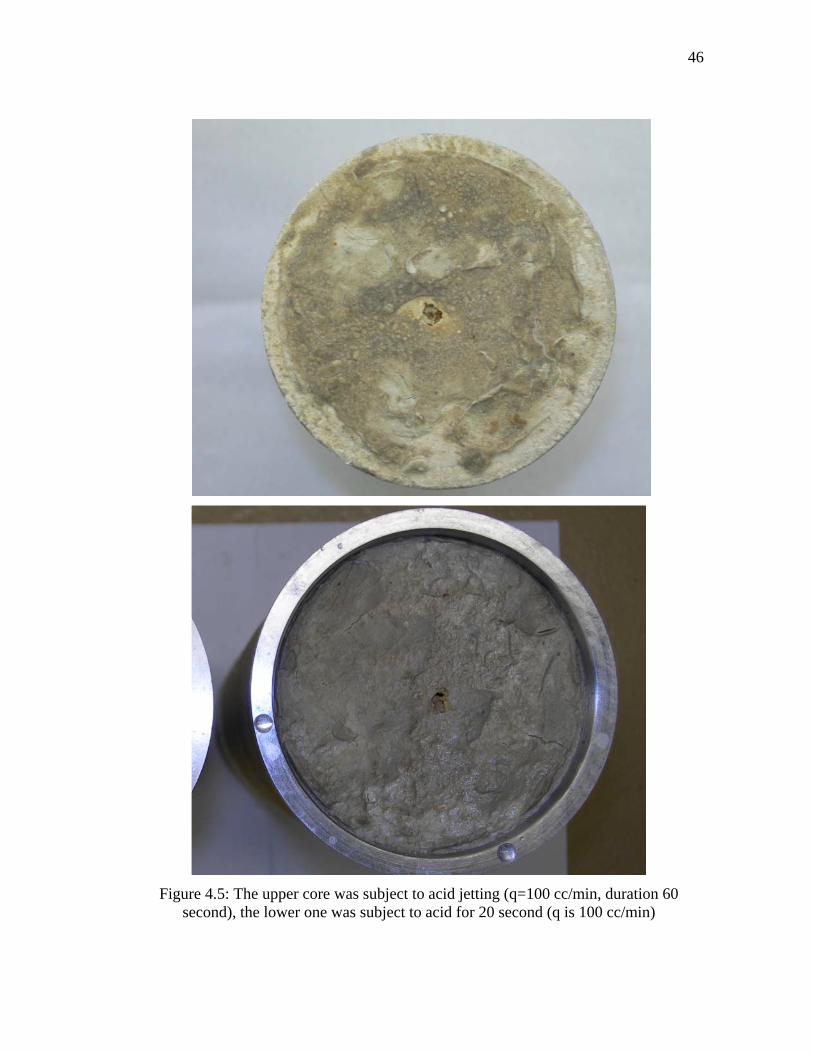
46
Figure 4.5: The upper core was subject to acid jetting (q=100 cc/min, duration 60
second), the lower one was subject to acid for 20 second (q is 100 cc/min)
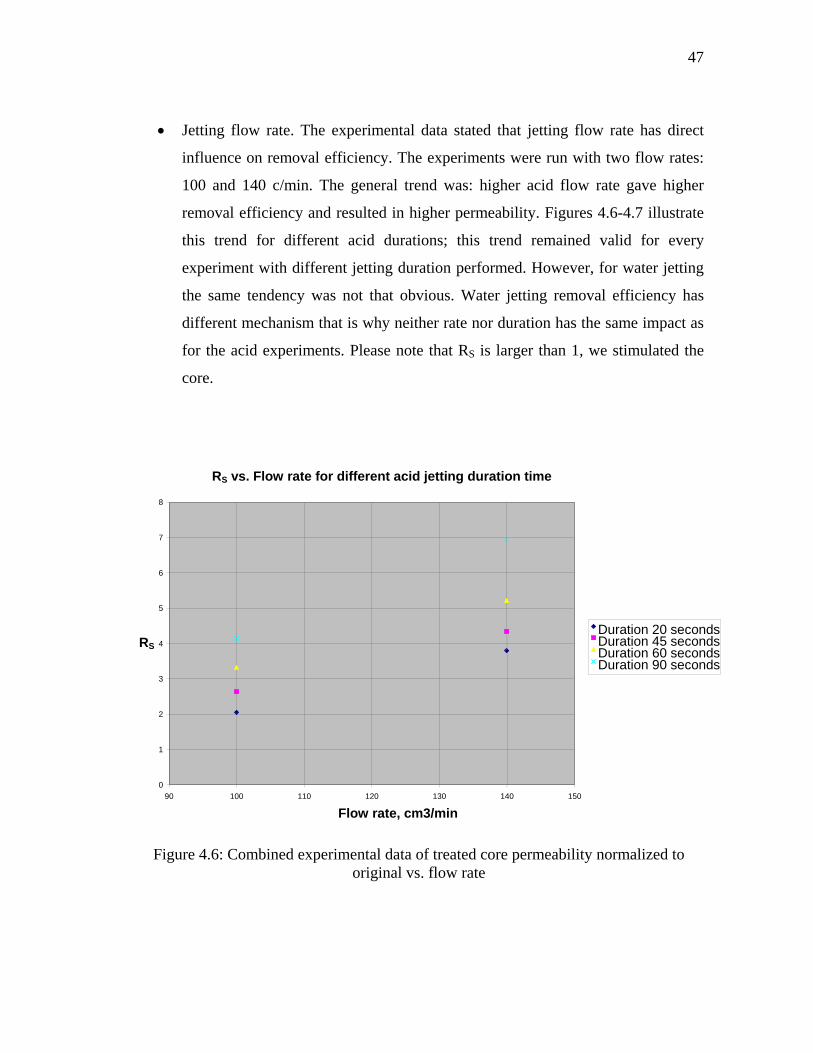
47
• Jetting flow rate. The experimental data stated that jetting flow rate has direct
influence on removal efficiency. The experiments were run with two flow rates:
100 and 140 c/min. The general trend was: higher acid flow rate gave higher
removal efficiency and resulted in higher permeability. Figures 4.6-4.7 illustrate
this trend for different acid durations; this trend remained valid for every
experiment with different jetting duration performed. However, for water jetting
the same tendency was not that obvious. Water jetting removal efficiency has
different mechanism that is why neither rate nor duration has the same impact as
for the acid experiments. Please note that RS is larger than 1, we stimulated the
core.
Figure 4.6: Combined experimental data of treated core permeability normalized to
original vs. flow rate
RS vs. Flow rate for different acid jetting duration time
0
1
2
3
4
5
6
7
8
90 100 110 120 130 140 150 Flow rate, cm3/min
RS Duration 20 secondsDuration 45 secondsDuration 60 secondsDuration 90 seconds

48
Figure 4.7: Combined experimental data of treated core permeability normalized to
damaged vs. flow rate
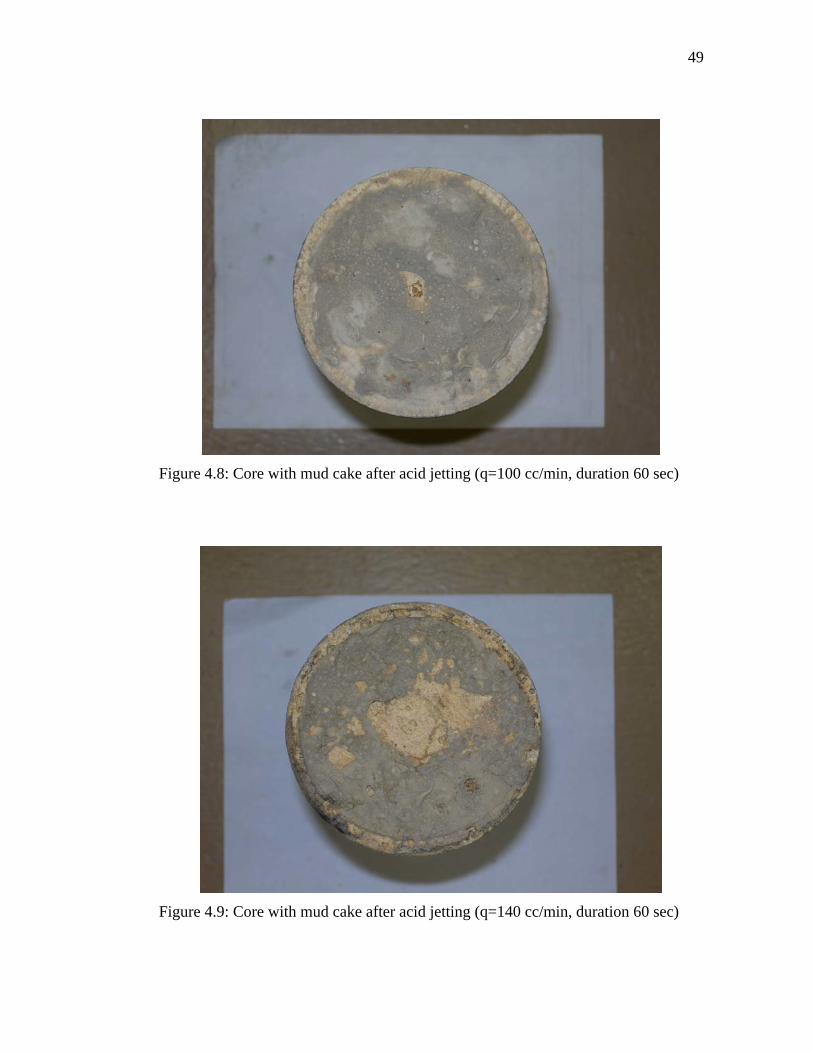
Figures 4.8-4.9 prove that higher jetting flow rate actually removed larger portion
of filter-cake. It can be seen the lower core (Figure 4.9) was subject to higher acid jet
and lost more filter-cake than the upper one (Figure 4.8). Note that the central wormhole
for the lower core was less developed.
RD vs. Flow rate for different acid jetting duration
0
2
4
6
8
10
12
90 100 110 120 130 140 150 Flow rate, cm3/min
RD Duration 20 secondsDuration 45 secondsDuration 60 secondsDuration 90 seconds
49
Figure 4.8: Core with mud cake after acid jetting (q=100 cc/min, duration 60 sec)
Figure 4.9: Core with mud cake after acid jetting (q=140 cc/min, duration 60 sec)

50
• Acid vs. water jetting. As it was inferred from experiments, acid jetting resulted
in higher permeability after treatment, as compared with water jetting. Acid
jetting has combined chemical and mechanical impact on the core face and
damaged zone, while water jetting involves only mechanical scouring action of
the high velocity, high pressure fluid jet. Acid removed filter-cake more
uniformly and even dissolved some portions of it as compared with water. A
further stimulation was achieved due to wormholing and partial carbonate rock
dissolution. Water acted less efficient even with jetting duration of three minutes
as compared even with twenty seconds of acid jetting. Figures 4.10-4.11 show
that acid stimulates the core and dissolves the filter-cake readily while as water in
the best case removes only a lesser portion of it. Notice RS for water is always 1,
however it does not signify complete cake removal, and that for the treatments RS
for acid is higher than 2 to7 times than for water.
Figure 4.10: Combined experimental data of treated core permeability normalized to
original vs. acid or water flow rate
RS vs. duration time for jetting
0
1
2
3
4
5
6
7
8
0 20 40 60 80 100 120 140 160 180 200
Jetting duration time, sec
RS Acid, flow rate 100 cm3/minAcid, flow rate 140 cm3/minWater, flow rate 100 cm3/minWater, flow rate 140 cm3/min

51
Figure 4.11: Combined experimental data of treated core permeability normalized to
damaged vs. acid or water flow rate
On Figure 4.11 one may see that water jetting experiments also showed less resulting
permeability. It is important to note that RD for acid treatment is 1.5-5 times higher than
for water. It is achieved by combined chemical and mechanical processes. Figures 4.12-
4.13 prove better permeability response to acid experiments than that to water. Figure
4.12 shows filter-cake removed by water q=100 cc/min, jetting duration is 90 sec, and
Figure 4.13 shows filter-cake removed by acid with q=100 cc/min, duration of jetting is
20 seconds. It is obvious that filter cake was better removed by acid, despite the job was
not thorough.
It is important to add that since water restores the permeability to its undamaged
level even without dissolution. In case of absence of severe damage and large internal
filter-cake, water jetting proves to be quite efficient and safe.
RD vs. jetting duration time
0
2
4
6
8
10
12
0 20 40 60 80 100 120 140 160 180 200
Jetting duration time, sec
RD Acid, flow rate 100 cm3/minAcid, flow rate 140 cm3/minWater, flow rate 100 cm3/minWater, flow rate 140 cm3/min
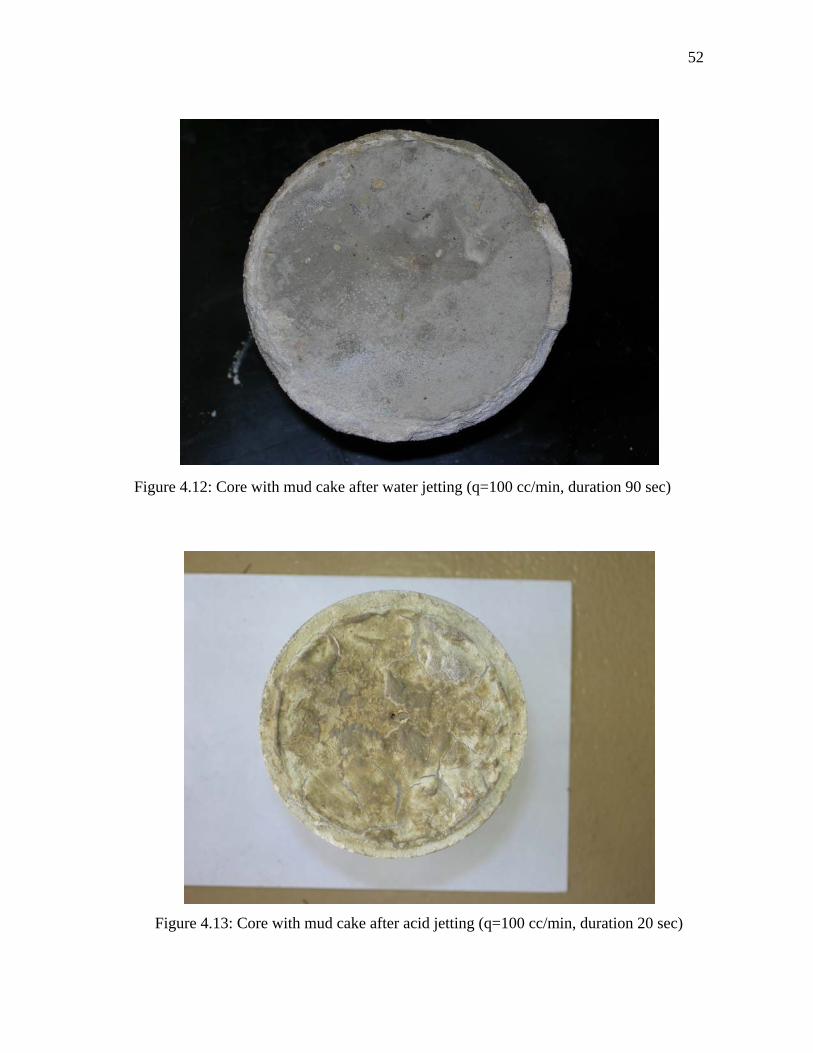
52
Figure 4.12: Core with mud cake after water jetting (q=100 cc/min, duration 90 sec)
Figure 4.13: Core with mud cake after acid jetting (q=100 cc/min, duration 20 sec)

53
• Volumes of jetted acid/water. The acid volume has a direct impact on filter-cake
dissolution, wormhole formation and development. Figure 4.14 shows the direct
influence of acid volume on RS: the more acid volume the larger RS is; it means
larger stimulated permeability. Some data scattering may be attributed to cores
heterogeneity and some pressure fluctuations due to equipment.
Figure 4.14: Combined experimental data of treated core permeability normalized to
original vs. acid volume
Figure 4.15 has the same trend only for RD and supports the idea of importance of acid
volume to acid jetting. The data scattering has the same nature.
RS vs. Acid volume
0
1
2
3
4
5
6
7
8
0 50 100 150 200 250
Acid volume, ml
RS
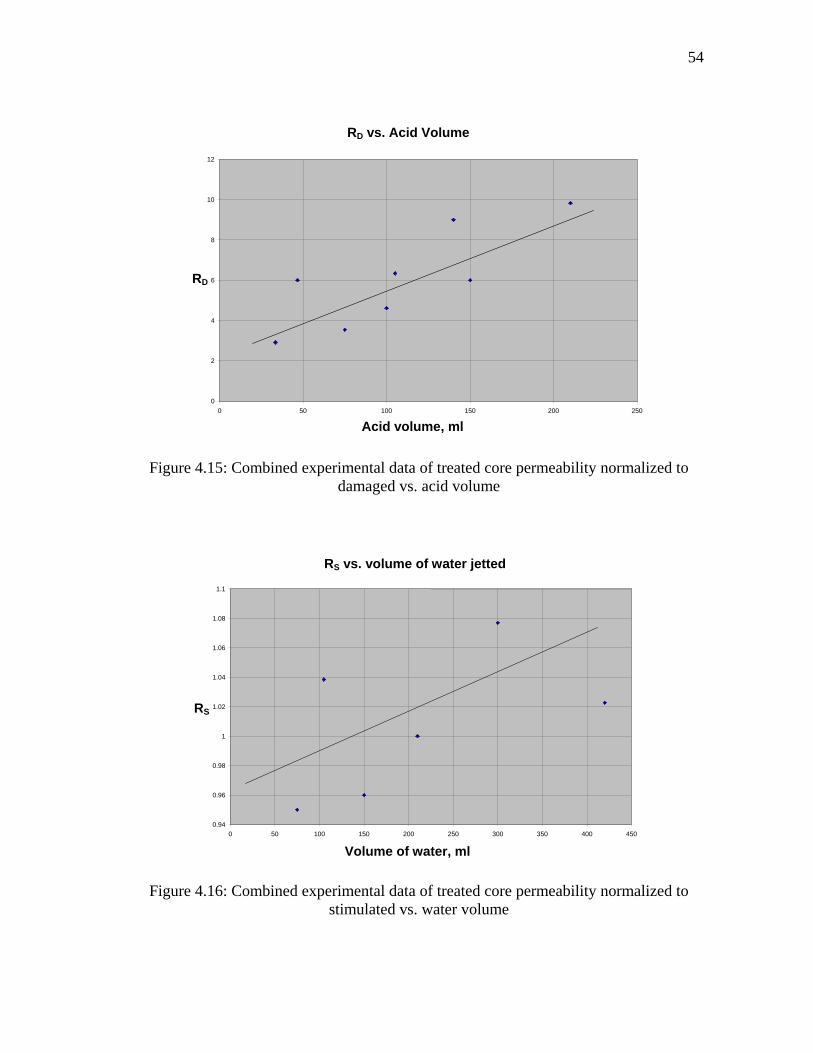
54
Figure 4.15: Combined experimental data of treated core permeability normalized to
damaged vs. acid volume
Figure 4.16: Combined experimental data of treated core permeability normalized to
stimulated vs. water volume
RD vs. Acid Volume
0
2
4
6
8
10
12
0 50 100 150 200 250 Acid volume, ml
RD
0.94
0.96
0.98
1
1.02
1.04
1.06
1.08
1.1
0 50 100 150 200 250 300 350 400 450 Volume of water, ml
RS
RS vs. volume of water jetted

55
Figure 4.17: Combined experimental data of treated core permeability normalized to
damaged vs. water volume
Figures 4.16-4.17 show the trends for water volume. The water volume influence is less
pronounced and has less effect. It verifies assumption that for small number of jets and
low volume jetting mechanical process is less important than chemical. Our water is not
laden with an abrasive substance and its mechanical action is therefore more limited.
And it means that for the jetting in these conditions (one jet, relatively small volumes of
acid/water injected, not rotating jets), the process is basically chemically dominated.
• Filter-cake strength. When jetting was performed one day (24 hours) after filter-
cake deposition procedure, i.e. it had been exposed to the air and became dry; the
resulting removal efficiency was less. Figure 4.18 shows dry filter-cake (24 hour
of the open air exposure after it was formed).
RD vs. volume of water jetted
0
0.5
1
1.5
2
2.5
3
0 50 100 150 200 250 300 350 400 450
Volume of water, ml
RD
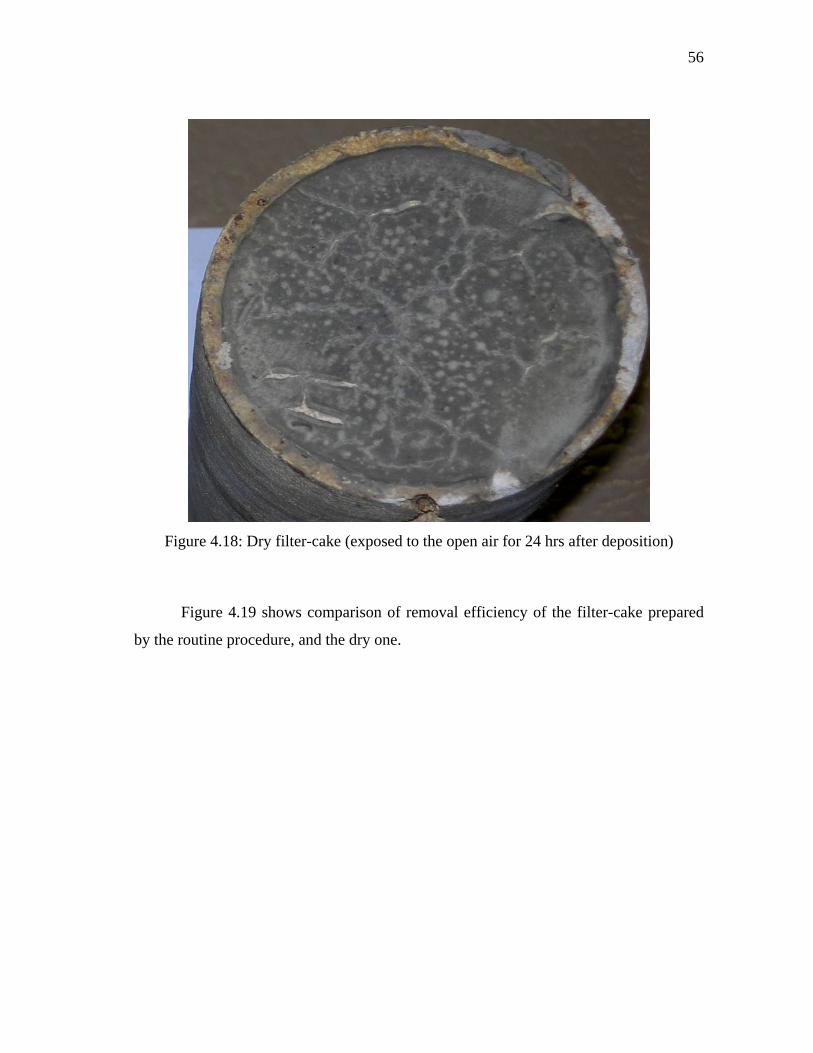
56
Figure 4.18: Dry filter-cake (exposed to the open air for 24 hrs after deposition)
Figure 4.19 shows comparison of removal efficiency of the filter-cake prepared
by the routine procedure, and the dry one.
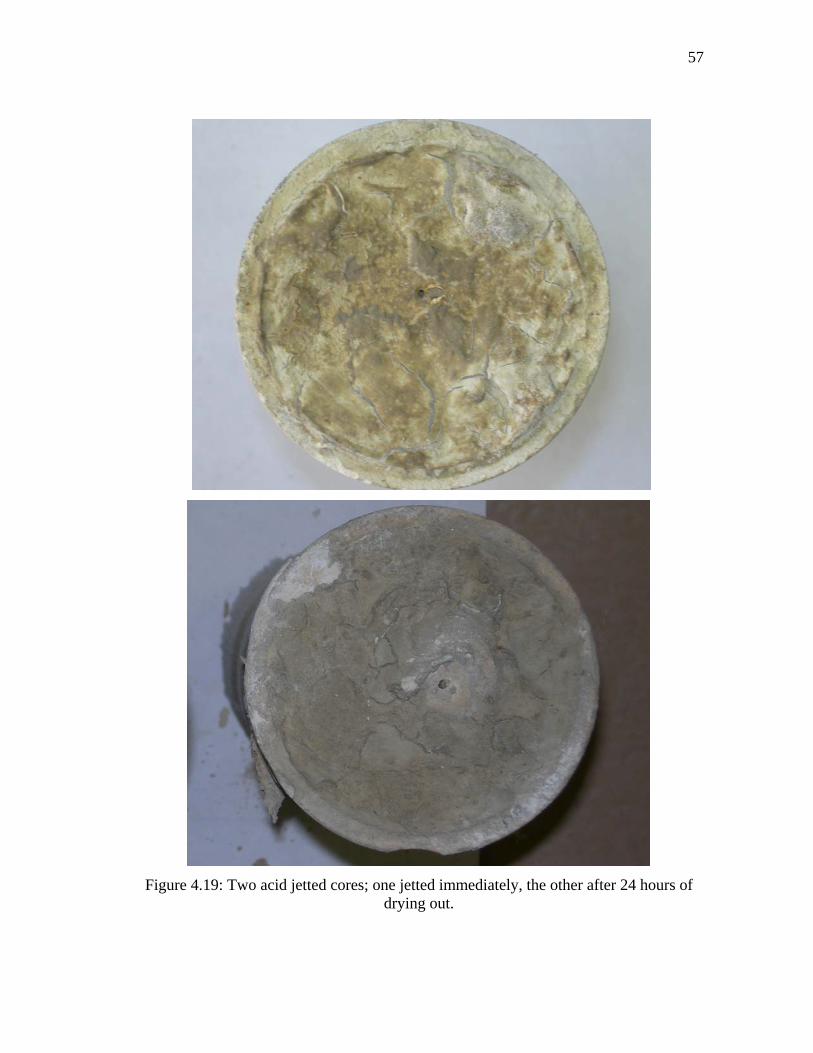
57
Figure 4.19: Two acid jetted cores; one jetted immediately, the other after 24 hours of
drying out.

58
The upper depicted core was exposed to acid jetting immediately after filter-cake
deposition (q=140 cc/min, duration 20 second), right one was acid treated (q=140
cc/min, time=20 sec) after 24 hours of drying out. As it can be seen, the dried up filter-
cake was harder to remove. It adhered to the core rock harder. As a result, it allowed less
portion of filter-cake was to be removed and dissolved.
• Reverse circulation (back flowing) after jetting. As it can be seen from Figures
4.20-4.21, back flowing cores after the jetting removes more filter-cake then
direct flowing. It was valid even when lower flow rate and less jetting duration
was employed prior reverse circulation. One more thing to mention: due to the
recipe of the drill-in fluid and the relatively low permeability of the rock used, no
severe internal damage was caused. It can explain why reverse circulation
removed almost all filter-cake that was applied. However, this fact is not directly
related to the jetting process itself; it can be characterized as after treatment
procedure. Figures 4.22-4.23 show again that even for less jetting duration and
flow rate by reverse flowing after treatments there can be better filter-cake
removal result achieved.
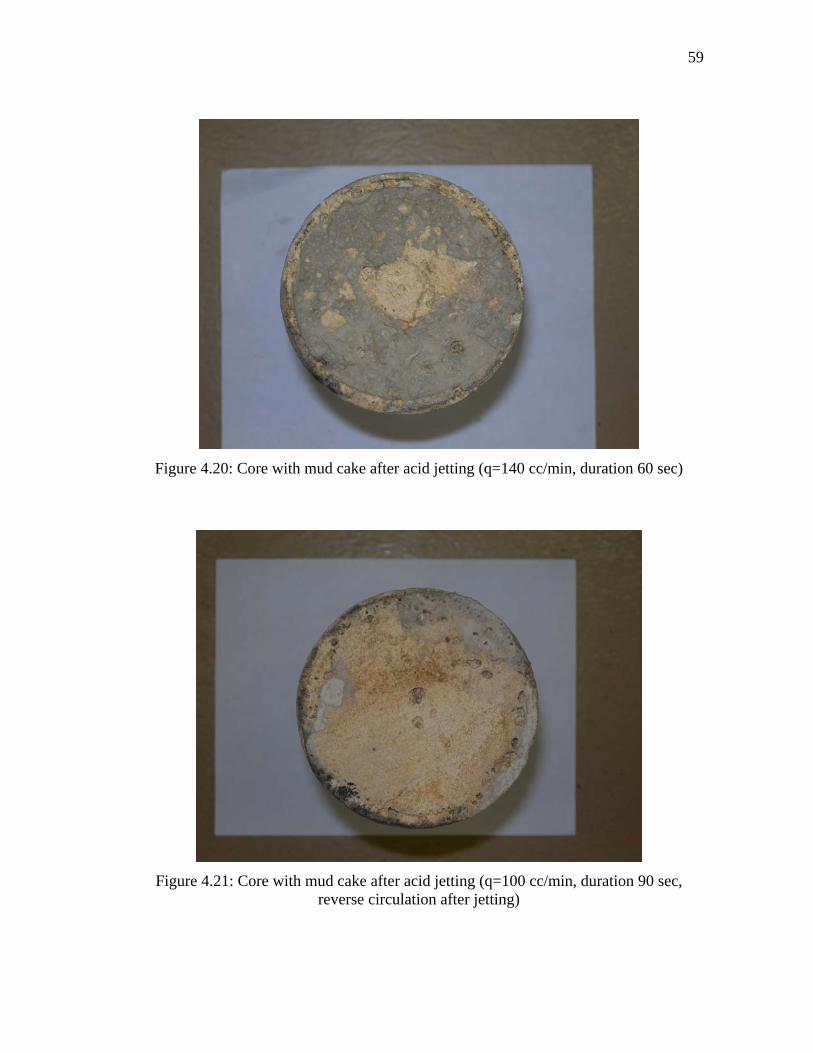
59
Figure 4.20: Core with mud cake after acid jetting (q=140 cc/min, duration 60 sec)
Figure 4.21: Core with mud cake after acid jetting (q=100 cc/min, duration 90 sec,
reverse circulation after jetting)
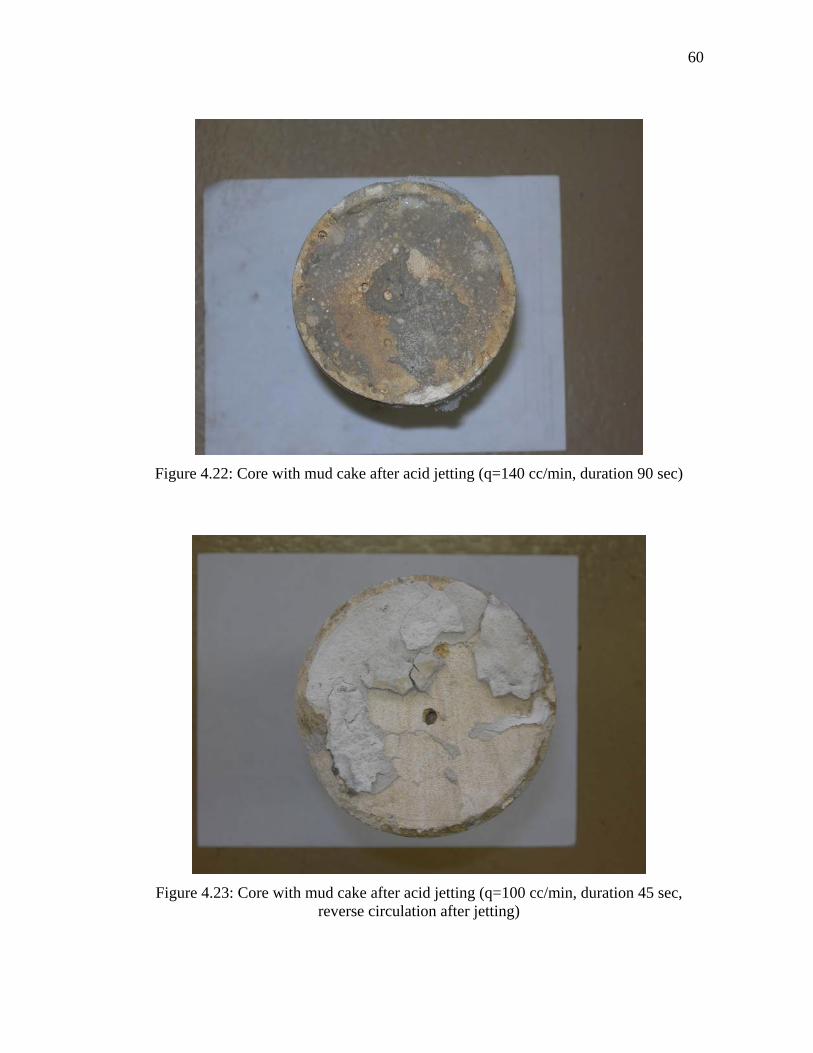
60
Figure 4.22: Core with mud cake after acid jetting (q=140 cc/min, duration 90 sec)
Figure 4.23: Core with mud cake after acid jetting (q=100 cc/min, duration 45 sec,
reverse circulation after jetting)

61
• Wormholing. As it can be seen from CT-Scan pictures of acid jetted core on
Figures 4.24 and 4.25, acid not only did remove and dissolve filter-cake, but also
initiated wormholes. The wormholes in turn have direct influence on
permeability enhancement. As before, the more acid rate or more acid duration is
given, the more filter-cake is dissolved. As one may see, wormholes initiate at
the center of the core cross section: one at the jet, another next to it. It is
however, not a usual situation, for most of the cases a single wormhole initiation
was obtained. This dual wormholing can be explained by rock heterogeneity, the
fact the preferential porosity-permeability distribution encouraged both of
wormholes to initiate simultaneously. Also, initial high jetting flow rate,
relatively low duration time of jetting as compared to overall experiment and
switching to lower water flowrate may have combined influence on multiple
wormholing.
Figure 4.24: 3-D view of a core jetted with acid (q=100 cc/min for 90 second)
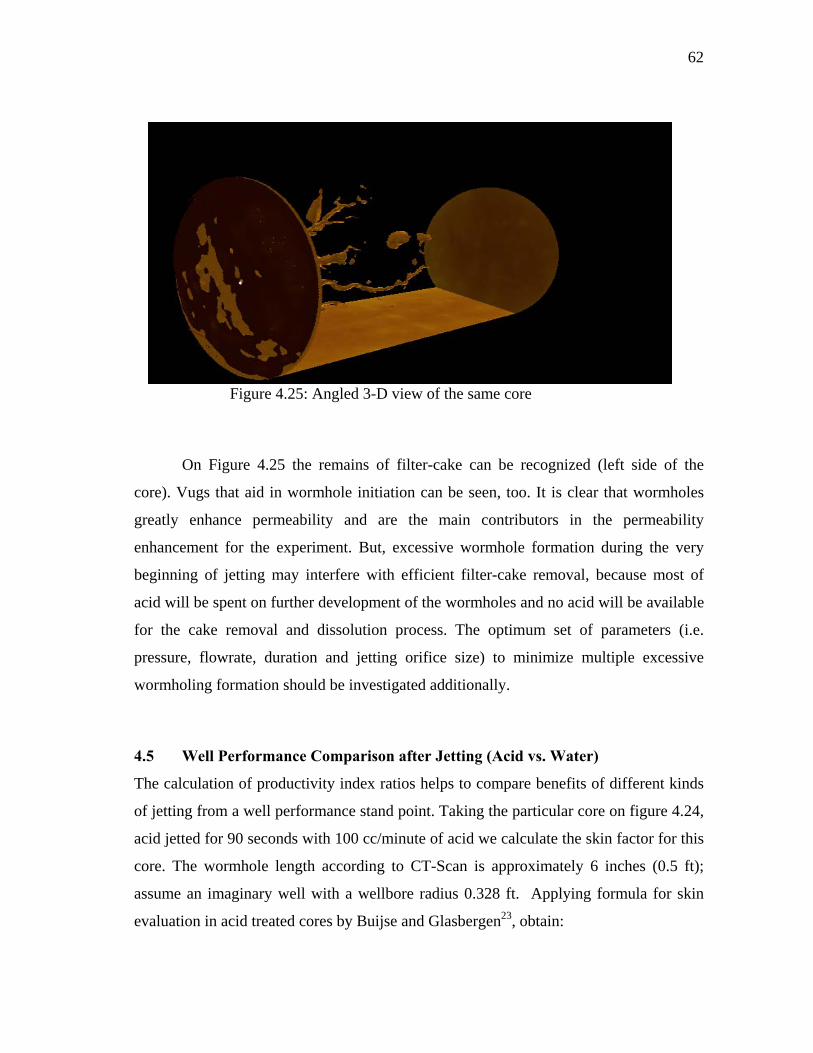
62
Figure 4.25: Angled 3-D view of the same core
On Figure 4.25 the remains of filter-cake can be recognized (left side of the
core). Vugs that aid in wormhole initiation can be seen, too. It is clear that wormholes
greatly enhance permeability and are the main contributors in the permeability
enhancement for the experiment. But, excessive wormhole formation during the very
beginning of jetting may interfere with efficient filter-cake removal, because most of
acid will be spent on further development of the wormholes and no acid will be available
for the cake removal and dissolution process. The optimum set of parameters (i.e.
pressure, flowrate, duration and jetting orifice size) to minimize multiple excessive
wormholing formation should be investigated additionally.
4.5 Well Performance Comparison after Jetting (Acid vs. Water)
The calculation of productivity index ratios helps to compare benefits of different kinds
of jetting from a well performance stand point. Taking the particular core on figure 4.24,
acid jetted for 90 seconds with 100 cc/minute of acid we calculate the skin factor for this
core. The wormhole length according to CT-Scan is approximately 6 inches (0.5 ft);
assume an imaginary well with a wellbore radius 0.328 ft. Applying formula for skin
evaluation in acid treated cores by Buijse and Glasbergen23, obtain:
63
w
whwh r
rs ln−= (4.6)
328.0
328.05.0ln +−=whs (4.7)
The skin after acid jetting is swh= -0.92; the skin for a water jetted core is s=0, since ratio
of prior-to-damage to restored permeability is 1, like was previously mentioned.
The productivity index is:
][ln2.141 s
rr
B
khpp
qJ
w
ewfe +=
−=
µ (4.8)
For the same well chosen the properties like B, µ, h, k are the same, so the productivity
indexes ratio for acid and water treated well after simplification is:
)ln(
ln
whw
e
w
e
water
acid
srr
rr
JJ
+= (4.9)
Accepting drainage radius re=2980 ft, we get:
)92.0
328.02980(ln
328.02980ln
−=
water
acid
JJ
(4.10)
11.119.811.9
==water
acid
JJ
(4.11)
This example calculation illustrates that acid jetting improves the productivity index
compared with water jetting by a small amount (about 11%). Since water restores
permeability to the original level, there should be a lot of consideration given prior to
commencement of an acid jetting.

64
CHAPTER V
CONCLUSIONS AND RECOMMENDATIONS
5.1 Conclusions
Two apparatus (one for filter-cake deposition, another for jetting) were designed, built
up, and modernized. A series of experiments were conducted to determine the most
relevant variables. The resulting conclusions are:
• Acid jetting is more efficient than water jetting due to combination of mechanical
scouring action and chemical dissolution of both filter-cake and core itself. It
implies that not only does acid cleaning job but also provides stimulation,
enhancing original permeability.
• Acid jetting is a chemically dominated process, since most portions of filter-cake
were actually dissolved, not scoured like it would be for mechanically dominated
process.
• Two terms representing ratios of permeability after jetting to damaged (RD) and
original (RS) core permeability aid to estimate acid vs. water jetting. Depending
on acid volume, flowrate and jetting duration RS for acid was 2 to 7 times bigger
than for water, which was about 1 for every treatment.
• Despite water jetting has less pronounced effect on permeability enhancement
and overall leaves more filter-cake on core face as compared to acid, for the low
to moderate permeability reservoirs having shallow invaded zone and no severe
damage observed, it can be safer and cheaper alternative to acid jetting. It
restores permeability to a prior-to-damage level and the difference in resulting
productivity index between the two types of jetting is not great (5-10%). The
other considerations are treatment costs, some possibility to lose the well and
dangers related to acid when performing the job. This should be taken into

65
account during job design.
• Jetting duration has direct impact on filter-cake removal efficiency. It also
enhances permeability, introducing additional stimulation.
• Jetting flow rate shows direct influence on removal efficiency. Higher acid flow
rate removes more mud from the core face. Also, like previously mentioned more
acid volume dissolves more carbonate rock and enhances permeability.
• Acid jetting causes wormholing. Wormholes themselves form following pattern
of the rock. Vugs, different densities and porosity/permeability heterogeneities
have significant impact on its formation. But excessive wormholing may offset
filter-cake removal efficiency, therefore it is should be avoided.
• Reverse flow after treatment helps to remove more remaining mud from the core
face; it proves to be more efficient technology.
• As seen in curves in Figures A.1-A.4, water jetting treatment pressure has higher
rate than acid jetting. It can be attributed to the fact that acid reaction process
dissolves rock and creates wormholes, which in turn enhances injectivity and
permeability in particular. It gives lower pressure readings during the process.
This process should be further investigated.
• As seen on Figures A.1-A.4 long transient was observed during every acid jet
treatment. This can be explained that the acid container outlet diameter was
confined to 1/8’’ as well as lines diameter for the syringe feed pump engaged in
the jetting was ¼”. This guided to pressure build up and such a transient
behavior.
• Lower rock permeability results in shallower invaded zone, therefore thinner
internal filter-cake. No severe damage was observed, which can also be attributed
to less damaging drill-in fluid with sized calcium carbonate content.
66
5.2 Recommendations for Acid Jetting Treatment Design
While designing treatment, the following should be taken care of:
• More acid means more removal efficiency. However, if dissolution and matrix
stimulation is not required, calculation of volume of acid to dissolve only mud
cake is required. The filter-cake obtained in the experiment had thickness 3-4
mm, assumptions of the cake thickness in the field conditions should be defined
based on either experience or logs/cores.
• For low permeability reservoirs with low damage zone and shallow internal
filter-cake, water jetting is cheaper safer alternative since it restores permeability
to its original level and avoids difficulties and dangers typical for acid jetting.
The productivity index increase after acid jetting only 5 to 10 % more as
compared to water treatment.
• Jetting process efficiency depends on flowrate and duration of the treatment.
Higher flowrate gives higher removal efficiency; longer acid jetting duration
yields the same result. The more acid is spent the more dissolution is achieved.
As said above, for only jetting without stimulation, one should more carefully
consider/calculate acid volume to remove mud-cake.
• Treating pressure is important, since it controls amount of acid penetrating rock.
However, the pressure should be lower than the rock fracture gradient.
• Rock geology and lithology should be considered for it may give hints on most
preferential ways wormhole will develop.
• Filter-cake thickness depends on rock properties and permeability in particular. It
also depends on mud type and composition. During design, these parameters also
should be considered.
67
5.3 Future Work
Other variables influencing filter-cake removal efficiency are to be found out. This work
does not consider those variables’ impact on removal efficiency and therefore on success
of jetting job. The variables are:
• Standoff which is a distance between core face and jetting nozzle. As
previously mentioned, the standoff should be equal to magnitude of eight
orifice diameter, according to the industry reports.
• Jets rotation. Industry experiments and field tests report that rotating jets
with 360 degree coverage provides best removal efficiency.
• Number of jets. Bigger jet number gives better coverage and therefore
efficiency.
• Treating fluid. Different acid concentrations and abrasive content need to
be investigated.
• An optimal set of parameters helping to avoid multiple wormholing
during jetting should be experimentally established.
68
REFERENCES
1. Aslam, J., and Al-Salat, T.: “Stimulation of Horizontal Wells in Carbonate
Reservoirs,” paper SPE 49493 presented at the 8th Abu Dhabi International
Petroleum Exhibition and Conference, Abu Dhabi, U.A.E., 11-14 October, 1998.
2. Furui, K., Zhu, D., and Hill, A.D. “Optimization of Horizontal Well Completion
Design,” paper SPE 90579 presented at the SPE Annual Technical Conference
and Exhibition, Houston, 26-29 September, 2004.
3. Surjaatmadja, J. B., et al.: “Hydrajet Fracturing: An Effective Method for Placing
Many Fractures in Openhole Horizontal Wells,” paper SPE 48856 presented at
the 1998 SPE International Conference and Exhibition in China, Beijing, 2-6
November.
4. Aslam, J., and Al-Salat, T.: “High-Pressure Water-Jetting: An Effective Method
to Remove Drilling Damage,” paper SPE 58780 presented at the 2000 SPE
International Symposium on Formation Damage Control, Lafayette, Louisiana,
23-24 February.
5. Dahroug, A., Brown, B., and Shaheen, M.: “Optimizing Acid Treatments with
the Use of Jet Blasting Tool,” paper SPE 68364 presented at the 2001
SPE/ICoTA Coiled Tubing Roundtable, Houston, 7-8 March.
6. Johnson, A., Eslinger, D., and Larsen, H.: “An Abrasive Jetting Scale Removal
System,” paper SPE 46026 presented at the 1996 SPE/ICoTA Coiled Tubing
Roundtable, Houston, Texas, 15-16 April.
7. Economides, M.J., Hill, A.D., and Ehlig-Economides, C.: Petroleum Production
Systems, Prentice Hall PTR, Upper Saddle River, New Jersey (1994).
8. Jiao, D., and Sharma, M. M.: “Formation Damage Due to Static and Dynamic
Filtration of Water-Based Muds,” paper SPE 23823 presented at the SPE
International Symposium on Formation Damage Control, Lafayette, Louisiana,
26-27 February, 1992.
9. Thomas, B., and Sharma M.M.: “Distribution of Mud Induced Damage around

69
Horizontal Wellbore,” paper SPE 39468 presented at the SPE International
Symposium on Formation Damage Control, Lafayette, Louisiana, 18-19
February, 1998.
10. Zain, Z.M., and Sharma, M.M.: “Cleanup of Wall-Building Filter Cakes,” paper
SPE 56635 presented at the 1999 SPE Annual Technical Conference and
Exhibition, Houston, 3–6 October.
11. Suri, A., and Sharma, M.M.: “Strategies for Sizing Particles in Drilling and
Completion Fluids,” paper SPE 87676 presented at the 2001 SPE European
Formation Damage Conference, The Hague, 21-22 May.
12. Suri, A., and Sharma, M.M.: “Cleanup of Water-Based Kill Pills in Laboratory-
Simulated Perforation Tunnels during Flowback,” paper SPE 102177 presented
at the 2006 SPE Annual Technical Conference and Exhibition, San Antonio,
Texas, 24-27 September.
13. Pang, S., and Sharma, M. M.: “A Model for Predicting Injectivity Decline in
Water-Injection Wells,” paper SPE 28489 presented at the 1994 SPE Annual
Technical Conference and Exhibition, New Orleans, 25-28 September.
14. Ryan, D.F., Browne, S.V, and Burnham, M.P.: “Mud Clean-Up in Horizontal
Wells: A Major Joint Industry Study,” paper SPE 30528 presented at the 1995
SPE Annual Technical Conference and Exhibition, Dallas, 22-25 October.
15. Nevito J.G.: “Design, Set-Up, and Testing of a Matrix Acidizing Apparatus”, MS
Thesis, Texas A&M University, College Station, Texas (2006).
16. Ravitz, R., et al.: “Active Filter-Cake Technology: Eliminating the Need for
Post-Completion Cleanup,” paper SPE 94726 presented at the SPE European
Formation Damage Conference, Scheveningen, The Netherlands, 25-27 May,
2005.
17. “Drilling Fluids Manual,” Amoco Production Company, Revision 6, 1994.
18. van Vilet, J.P.M., and Hassan, H.R.H.: “Reservoir Impairment Mitigation:
Successful Use of Graded Carbonate Drilling Fluids,” paper SPE 54284
presented at the 1999 SPE Asia Pacific Oil and Gas Conference and Exhibition,

70
Jakarta, 20-22 April.
19. Zain, Z.M., and Sharma, M.M.: “Mechanisms of Mud Cake Removal during
Flowback,” paper 74972 presented at the 2000 SPE International Symposium on
Formation Damage, Lafayette, Louisiana, 24-24 February.
20. Jiao, D., and Sharma, M.M.: “Investigation of Dynamic Mud Cake Formation:
The Concept of Minimum Overbalance Pressure,” paper SPE 26323 presented at
the 68th Annual Technical Conference and Exhibition of the Society of
Petroleum Engineers, Houston, 5-6 October 1993.
21. Burnett, D.: “Wellbore Cleanup in Horizontal Wells: An Industry-Funded Study
of Drill-In Fluids and Cleanup Methods,” paper SPE 39473 presented at the 1998
SPE International Symposium on Formation Damage, Lafayette, Louisiana, 18-
19 February.
22. Economides, M.J., and Nolte, K.G.: Reservoir Stimulation, Third edition,
Prentice Hall, Englewood Cliffs, New Jersey (2001).
23. Buijse, M., and Glasbergen, G.: “A Semiempirical Model To Calculate
Wormhole Growth in Carbonate Acidizing,” paper SPE 96892 presented at the
2005 SPE Annual Technical Conference and Exhibition held in Dallas, 9-12
October.
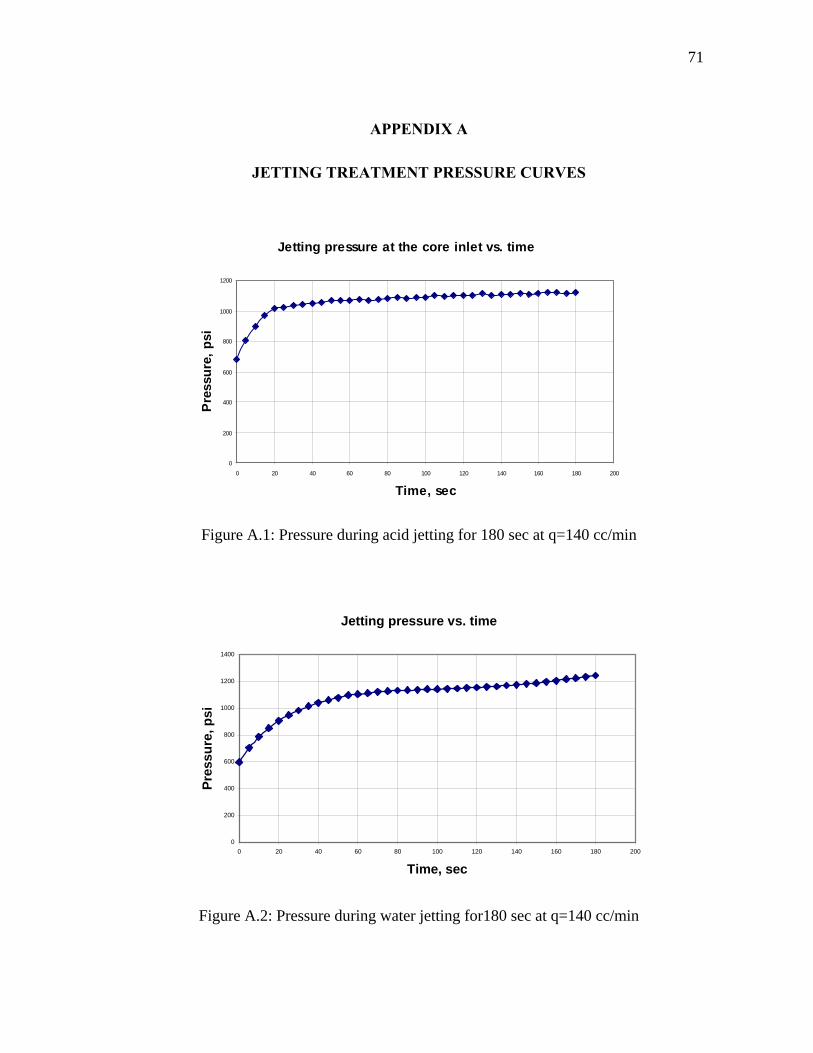
71
APPENDIX A
JETTING TREATMENT PRESSURE CURVES
Figure A.1: Pressure during acid jetting for 180 sec at q=140 cc/min
Jetting pressure vs. time
0
200
400
600
800
1000
1200
1400
0 20 40 60 80 100 120 140 160 180 200
Time, sec
Pres
sure
, psi
Figure A.2: Pressure during water jetting for180 sec at q=140 cc/min
Jetting pressure at the core inlet vs. time
0
200
400
600
800
1000
1200
0 20 40 60 80 100 120 140 160 180 200
Time, sec
Pre
ssur
e, p
si
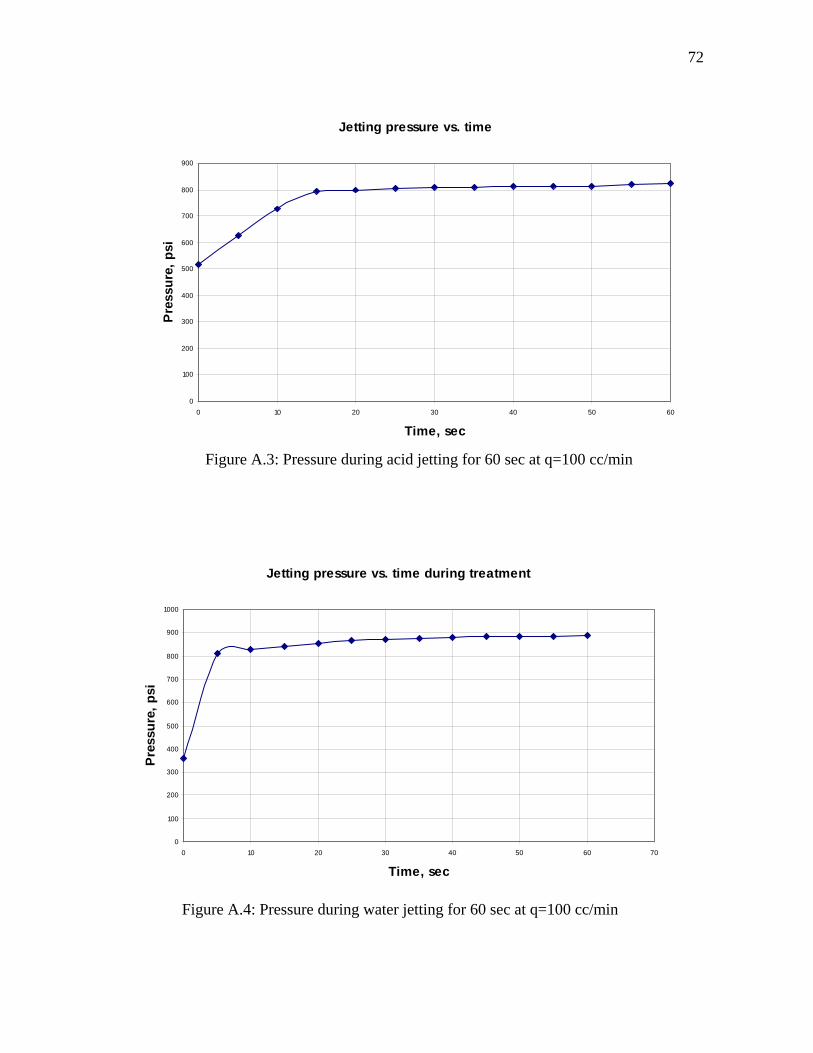
72
Jetting pressure vs. time
0
100
200
300
400
500
600
700
800
900
0 10 20 30 40 50 60
Time, sec
Pre
ssur
e, p
si
Figure A.3: Pressure during acid jetting for 60 sec at q=100 cc/min
Figure A.4: Pressure during water jetting for 60 sec at q=100 cc/min
Jetting pressure vs. time during treatment
0
100
200
300
400
500
600
700
800
900
1000
0 10 20 30 40 50 60 70
Time, sec
Pres
sure
, psi

73
APPENDIX B
WORMHOLE INITIATION CT-SCAN PICTURES
Figure B.1: Slice-by-slice transverse cross section view of the core sections (100 slices)
Figure B.2: Side view of the core cross-section along its length
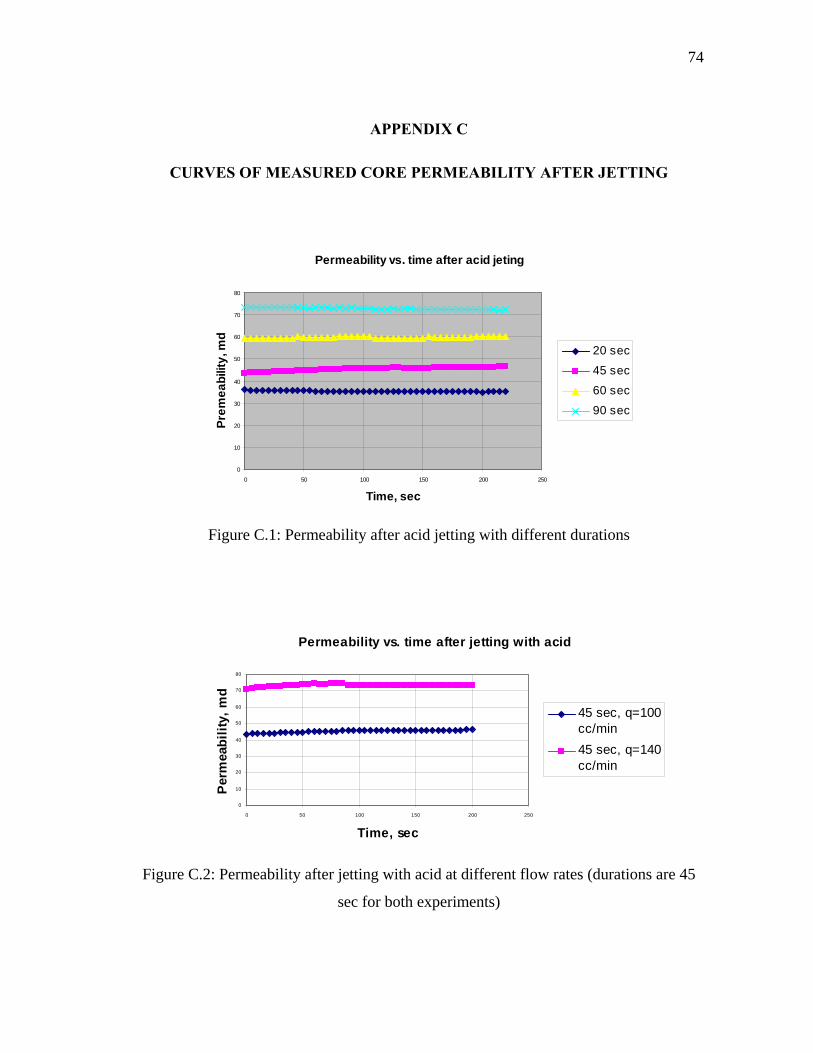
74
APPENDIX C
CURVES OF MEASURED CORE PERMEABILITY AFTER JETTING
Figure C.1: Permeability after acid jetting with different durations
Figure C.2: Permeability after jetting with acid at different flow rates (durations are 45
sec for both experiments)
Permeability vs. time after jetting with acid
0
10
20
30
40
50
60
70
80
0 50 100 150 200 250
Time, sec
Per
mea
bilit
y, m
d
45 sec, q=100cc/min45 sec, q=140cc/min
Permeability vs. time after acid jeting
0
10
20
30
40
50
60
70
80
0 50 100 150 200 250
Time, sec
Prem
eabi
lity,
md
20 sec
45 sec
60 sec
90 sec

75
Figure C.3: Comparison of resulting permeability vs. time after jetting with water and acid (q=100 cc/min, duration time 60 sec)
Permeability after jetting vs. time
0
10
20
30
40
50
60
70
0 50 100 150 200 250
time, sec
Perm
eabi
lity,
md
with acidwith water

76
APPENDIX D
PICTURES OF DEPOSITED FILTER-CAKE BEFORE JETTING
Figure D.1: Core with just formed filter-cake-1
Figure D.2: Core with just formed filter-cake-2
77
VITA
Name: Miroslav I. Mikhailov
Address: 93-35 Oktyabrsky ave, Tver, Russia, 170043
Phone: +7-4822-72-48-64
Email Address: [email protected]
Education: B.S., Mechanical Engineering,
Tver State Technical University, Russia, 1996
Employment History: Tver Energy Company, 1997-2001
Schlumberger Oilfield Services, 2001-2003
KMC-Oiltools (Europe) Limited, 2003-2005
This thesis was typed by the author.