acid fermentation process combined with post ... · decomposed by microorganisms, and can be used...
TRANSCRIPT
water
Article
Acid Fermentation Process Combined with PostDenitrification for the Treatment of Primary Sludgeand Wastewater with High Strength Nitrate
Allen Kurniawan 1,2, Se Young Kwon 1, Jung-Hun Shin 3, Jin Hur 1 and Jinwoo Cho 1,*1 Department of Environment and Energy, Sejong University, 98 Gunja-dong, Gwangjin-gu, Seoul 143-747,
Korea; [email protected] (A.K.); [email protected] (S.Y.K.); [email protected] (J.H.)2 Department of Civil and Environmental Engineering, Bogor Agricultural University, Jl. Kamper, Gedung
FATETA, Kampus IPB Dramaga, Bogor, Jawa Barat 16680, Indonesia3 Taeyoung Engineering and Construction, Yeouigongwon-ro 111, Yeougdeunpo-gu, Seoul 143-747, Korea;
[email protected]* Correspondence: [email protected]; Tel.: +82-2-3408-3970
Academic Editor: Yung-Tse HungReceived: 21 January 2016; Accepted: 17 March 2016; Published: 24 March 2016
Abstract: In this study, an anaerobic baffled reactor (ABR), combined with a post denitrificationprocess, was applied to treat primary sludge from a municipal wastewater treatment plant andwastewater with a high concentration of nitrate. The production of volatile fatty acids (VFAs) wasmaximized with a short hydraulic retention time in the acid fermentation of the ABR process, and thenthe produced VFAs were supplied as an external carbon source for the post denitrification process.The laboratory scale experiment was operated for 160 days to evaluate the VFAs’ production rate,sludge reduction in the ABR type-acid fermentation process, and the specific denitrification rate ofthe post denitrification process. As results, the overall removal rate of total chemical oxygen demand(TCOD), total suspended solids (TSS), and total nitrogen (TN) were found to be 97%, 92%, 73%,respectively, when considering the influent into ABR type-acid fermentation and effluent from postdenitrification. We observed the specific VFAs production rate of 0.074 gVFAs/gVSS/day for the ABRtype-acid fermentation, and an average specific denitrification rate of 0.166 gNO3
´-N/gVSS/day forthe post denitrification. Consequently, we observed that a high production of VFAs from a primarysludge, using application of the ABR type acid fermentation process and the produced VFAs werethen successfully utilized as an external carbon source for the post denitrification process, with a highremoval rate of nitrogen.
Keywords: acid fermentation; anaerobic baffled reactor; nitrate; post denitrification; primary sludge;volatile fatty acids
1. Introduction
Anaerobic digestion is an attractive treatment strategy in the waste management sector, from anenvironmental point of view and for the benefit of society, as it provides clean fuel from renewablefeed stocks [1]. One of the end products of the anaerobic digestion process is a gas mixture,formed mainly of methane and carbon dioxide (CO2) as biogas [2,3]. Anaerobic digestion can becommonly applied to high-load wastewater treatment because anaerobic treatment has the followingbenefits compared with aerobic treatment: not only is excess sludge production at a minimum, butthere is also minimum operation and maintenance requirements, and also a low energy demandwithout aeration and production of biogas with a renewable energy content, which can be used as afuel [4–6]. During the process, organic matter included in sewage is converted to volatile fatty acids(VFAs) through hydrolysis and acidogenesis (the latter is also known as acidogenic fermentation or
Water 2016, 8, 117; doi:10.3390/w8040117 www.mdpi.com/journal/water

Water 2016, 8, 117 2 of 11
dark fermentation [7]). They are then finally converted to methane gas by methanogenic bacteria.The conversion rate from VFAs to acetic acid will affect the methanogenic bacteria quantity and,subsequently, affect the degradation rate of acetic acid and the methane yield [8].
An anaerobic baffled reactor (ABR), which is an anaerobic digestion process, uses a series ofvertical baffles to force the wastewater to flow under and over the baffles as the wastewater travelsfrom the inlet to the outlet. Flow characteristics and gas production in each compartment of the ABRcauses the bacteria to gently rise and, eventually, settle down [6]. In an ABR reactor, acidogenesisand methanogenesis are spatially separated by the baffles installed inside the reactor, allowing thereactor to behave as a two-phase system without associated control problems and high costs [9,10]. Italso maintains a relatively short hydraulic retention time (HRT; 1.3–20 h) for economical operation,a long solid retention time (SRT; 20–100 days) through sludge return, and has a high solid–liquidseparation effect through the baffles [11–14]. It is regarded as an effective method for small-scale,high-loading sewage and wastewater treatment [11], and variable operations are available so thatappropriate performance can be obtained under various conditions.
Recently, overloading has been a frequent problem in anaerobic digestion since it leads toaccumulation of VFAs, which are no longer efficiently removed by the methanogenic bacteria. Thisis because of their low growth rates, which cause the uncoupling of the acidogenic bacteria and themethanogens [15]. Therefore, the process requires a long solid retention time, and also only a smallportion of the degradable organic waste is being synthesized into new cells [16]. On the other hand,acidogenic bacteria have a higher growth rate than methanogenic bacteria, and have no problemwith sludge-loss due to gas production. Thus, it is known that acidogenic bacteria are easier to dealwith in terms of operation. VFAs, which are the products of acidogenesis, can also be more easilycontrolled than methane (i.e., a gas phase), are low-molecular-weight organic matter that can be easilydecomposed by microorganisms, and can be used as useful resources for a microbial fuel cell (MFC)and the denitrification process, which all require organic carbon sources [17,18].
In South Korea, sewage sludge production has increased continuously every year by 5.9%; anddue to the increase in energy cost with the increase in production, the sewage sludge treatment costhas also increased rapidly, from 87.7 billion won in 2006 to 164.5 billion won in 2011 [19]. In this regard,the Ministry of Environment is planning to reduce sludge production and to increase the proportion ofsewage sludge used as energy sources, based on the Renewable Energy Portfolio Standard. However,as for the status of anaerobic digester operation, 58% of the total digestion gas production is used fordigester heating, and 17% is used for air conditioning/heating of treatment facilities other than thedigester heating, power generation, and external supply; however, 25% is combusted as surplus gas.Additionally, the average digestion efficiency of domestic digesters is 35.2%, which falls behind anavailable efficiency of 50% [19]. Considering that the digestion efficiencies in developed countries areabout 65%, the technical skills of domestic digester operation and the perception of anaerobic digestionneed to be improved [19]. Therefore, increasing VFAs production from a sludge treatment process,along with biogas production, for use as useful resources for organic carbon related products, such asexternal carbon sources for biological denitrification, bioplastic manufacturing, and biofuel synthesis,is required.
In this study, we aimed at treating a primary sludge through an ABR type-acid fermentationprocess, which maximized the VFA production and sludge reduction, with a short hydraulic retentiontime to prevent methanogenesis. Then, the produced VFAs were applied as an external carbon sourcefor a post denitrification process to treat a wastewater with high strength nitrate (NO3
´-N) but noorganic carbon. In addition, the produced VFAs would be used as resources for organic carbon relatedproducts, such as bioplastics and biofuels [20,21]. The laboratory scale experiment was operated for160 days in order to evaluate the VFA production rate and sludge reduction in the ABR type-acidfermentation process, and the specific denitrification rate of the post denitrification process. We alsoobserved the overall performances for the removal of total chemical oxygen demand (TCOD), totalsuspended solids (TSS), and total nitrogen (TN) in the proposed process.

Water 2016, 8, 117 3 of 11
2. Materials and Methods
2.1. Feed Characteristics
The primary sludge used as feed was collected from the J domestic treatment plant in Paju,Republic of Korea. To remove the larger particulate solid matter, the collected primary sludge wasfiltered twice using a 5-mm sieve, and again a further five times using a 2-mm sieve. The digestionsludge was collected directly from a conventional single anaerobic digestion reactor, operated in thesame treatment plant, and seeded into the laboratory-scale ABR type-acid fermentation reactor. Thewastewater, including a high concentration of nitrate without any organic carbon, was artificiallysynthesized by dissolving sodium nitrate (NaNO3) reagent powder in tap water at a concentration of100 mg NO3
´-N/L. This synthetic wastewater was introduced into the post denitrification process,along with the effluent from the ABR type-acid fermentation reactor.
2.2. ABR Type Acid Fermentation Reactor Combined with Post Denitrification Process
Figure 1 illustrates the schematic diagram of the ABR type-acid fermentation with a postdenitrification process. The ABR type acid fermentation reactor consisted of a complete mixingzone with a working volume of 80 L for the fermentation process and a baffle zone with a total workingvolume of 20 L for sludge settling. The supernatant in the baffle zone was continuously supplied to thepost denitrification reactor, along with the synthetic wastewater that included high-strength nitrate.The post denitrification reactor consisted of a complete mixing zone with a working volume of 74 L forthe denitrification process and a baffle zone with a total working volume of 22 L for sludge settling.Each reactor had its own internal recycling, sludge settling, and sludge wasting, and therefore eachprocess could be operated independently of each other; additionally, the hydraulic retention time alsocontrolled separately from the solids retention time in each reactor. It should be noted that the processwas operated without any artificial temperature control. The average temperature of the reactor was22–23 ˝C. The average pH of the ABR type-acid fermentation and post denitrification reactor wasmeasured at about 5.1 and 7.3, respectively. Moreover, the average oxidation-reduction potentials(ORPs) of the ABR type-acid fermentation and post denitrification reactor were ´368 mV and ´201mV, respectively. Table 1 summarizes the operation conditions for the laboratory-scale process.
Water 2016, 8, 117 3 of 11
2. Materials and Methods
2.1. Feed Characteristics
The primary sludge used as feed was collected from the J domestic treatment plant in Paju, Republic of Korea. To remove the larger particulate solid matter, the collected primary sludge was filtered twice using a 5-mm sieve, and again a further five times using a 2-mm sieve. The digestion sludge was collected directly from a conventional single anaerobic digestion reactor, operated in the same treatment plant, and seeded into the laboratory-scale ABR type-acid fermentation reactor. The wastewater, including a high concentration of nitrate without any organic carbon, was artificially synthesized by dissolving sodium nitrate (NaNO3) reagent powder in tap water at a concentration of 100 mg NO3−-N/L. This synthetic wastewater was introduced into the post denitrification process, along with the effluent from the ABR type-acid fermentation reactor.
2.2. ABR Type Acid Fermentation Reactor Combined with Post Denitrification Process
Figure 1 illustrates the schematic diagram of the ABR type-acid fermentation with a post denitrification process. The ABR type acid fermentation reactor consisted of a complete mixing zone with a working volume of 80 L for the fermentation process and a baffle zone with a total working volume of 20 L for sludge settling. The supernatant in the baffle zone was continuously supplied to the post denitrification reactor, along with the synthetic wastewater that included high-strength nitrate. The post denitrification reactor consisted of a complete mixing zone with a working volume of 74 L for the denitrification process and a baffle zone with a total working volume of 22 L for sludge settling. Each reactor had its own internal recycling, sludge settling, and sludge wasting, and therefore each process could be operated independently of each other; additionally, the hydraulic retention time also controlled separately from the solids retention time in each reactor. It should be noted that the process was operated without any artificial temperature control. The average temperature of the reactor was 22–23 °C. The average pH of the ABR type-acid fermentation and post denitrification reactor was measured at about 5.1 and 7.3, respectively. Moreover, the average oxidation-reduction potentials (ORPs) of the ABR type-acid fermentation and post denitrification reactor were −368 mV and −201 mV, respectively. Table 1 summarizes the operation conditions for the laboratory-scale process.
Figure 1. Schematic of anaerobic baffled reactor (ABR) type-acid fermentation combined post denitrification reactor.
Figure 1. Schematic of anaerobic baffled reactor (ABR) type-acid fermentation combined postdenitrification reactor.

Water 2016, 8, 117 4 of 11
Table 1. Initial operation conditions for the ABR type-acid fermentation combined with postdenitrification reactor.
Reactor Parameters Unit Initial Operation
ABR type-acidfermentation reactor
HRT (based on the mixing zone) Days 4Primary sludge influent flow rate L/day 15
Sludge discharge (0.1 Q) L/day 1.5Internal return (2 Q) L/day 30
Post denitrificationreactor
HRT (based on the mixing zone) Hours 7Total influent flowrate L/day 163.5
Influent flowrate (effluent from ABR) L/day 13.5High strength nitrate injection L/day 150
Sludge discharge (0.1 Q) L/day 16.35Internal return (2 Q) L/day 327
Note: Total influent flow rate = flowrate of the effluent from ABR + flowrate of high strength nitrate injection.
2.3. Analytical Methods
The wastewater samples were collected daily for 160 days in influent to ABR type-acidfermentation, in influent to post denitrification, and in effluent from post denitrification reactor. Aftersampling, analyses were performed by dividing samples into total and soluble substances. A solublesample was obtained by centrifuging the total sample for 15 minutes (4000 rpm, 4 ˝C) and by filteringthe supernatant using a Whatman Glass microfiber filter (average pore 1.2 µm). General analysisitems, such as total suspended solids (TSS) and volatile suspended solids (VSS), were measured usinggravimetric analysis with a constant temperature at 103–105 ˝C and 550 ˝C, respectively, following thestandard methods for the examination of water and wastewater [22]. TCOD, soluble chemical oxygendemand (SCOD), and TN were analyzed using C-Mac Products with a water quality kit and CODReactor CR-100. Then, pH, ORP, and temperature were frequently measured using a BIK WSP-100Analyzer. Furthermore, nitrite (NO2-N) and NO3
´-N were analyzed using ion chromatography,equipped with a Metrosep A Supp 5 column (Metrohm, 790 Personal IC). The VFAs proportions (aceticacid, propionic acid, iso-butyric acid, n-butyric acid, iso-valeric acid, and n-valeric acid) were analyzedusing gas chromatography (Young Lin 6000 Series) and detected using a flame ionization detector(FID) equipped with an HP-INNOWAX Column (30 m long, 0.32 mm inner diameter, 0.5 µm filmthickness). VFAs concentrations were converted to SCOD by using the following conversion factors:1.066 for acetic acid, 1.514 for propionic acid, 1.818 for butyric acid, and 2.039 for valeric and isovalericacid [23].
Descriptive statistical analyses of the results were carried out for mean comparison. For all data,roughly 68% of the observations lie within one standard error of the sample means. All of the dataobservations were selected to obtain the small standard of error. Experimental error and noise refer tothe fluctuation or discrepancy in replicate observations from one experiment to another. In a statisticalcontext, error does not imply fault, mistake, or blunder. It refers to variation that is often unavoidable,resulting from factors such as measurement fluctuations due to instrument condition, samplingimperfections, variations in ambient conditions, skill of personnel, and many other factors [24]. Suchvariations always exist and, although in certain cases it may have been minimized, it should not beignored entirely [24].
3. Results and Discussion
3.1. COD and VFAs Variation
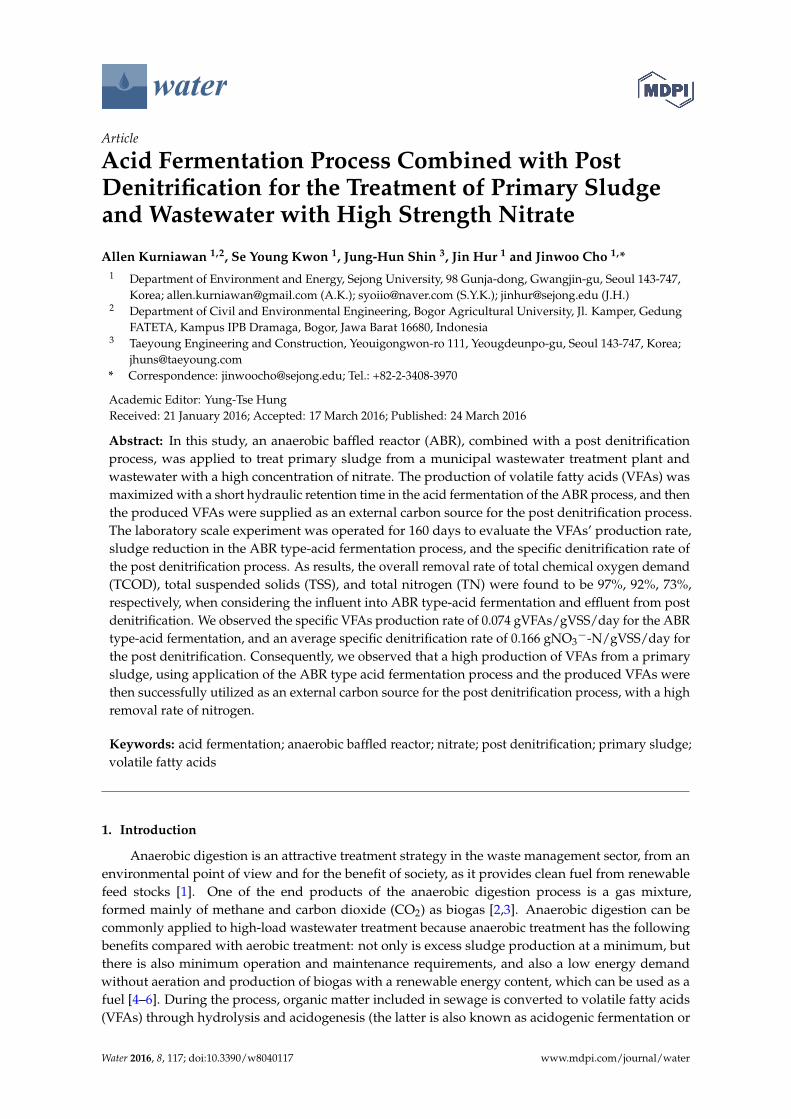
The average influent and effluent TCOD concentrations in the ABR type-acid fermentation reactorwere 18,431 mg/L and 14,546 mg/L, respectively. After the post denitrification process, the averageeffluent TCOD concentration was observed at 455 mg/L (Table 2). Figure 2 illustrates the variation
Water 2016, 8, 117 5 of 11
of TCOD concentrations in both reactors. The effluent TCOD concentrations of the ABR type-acidfermentation and post denitrification reactor decreased by about 21% and 97%, respectively, comparedwith the influent TCOD of each reactor. The TCOD in the effluent from the acid fermentation reactorincluded a large amount of VFAs produced in the acid fermentation process. These VFAs were used asa carbon source for the post denitrification process. Therefore, the high removal of TCOD was achievedin the post denitrification reactor. Our results demonstrated that the final TCOD removal rate of 97%was higher than the TCOD removal observed by Bodkhe et al. [5], which evaluated the performance ofthe modified ABR by applying domestic wastewater to obtain a TCOD removal of 86%.
Table 2. Wastewater quality range in ABR type-acid fermentation combined post denitrification process(with average in parentheses).
Parameters Unit InfluentEffluent of Acid
Fermentation/Influentof Post Denitrification
Effluent of PostDenitrification
TCOD mg¨ COD/L 10,220–37,560 (18,431) 3140–29,360 (14,564) 115–1230 (455)SCOD mg¨ COD/L 972–3528 (1499) 1614–4728 (2422) 21–247 (64)VFAs mg¨ COD/L 241–4058 (1351) 326–4775 (1930) Not measuredTSS mg¨ SS/L 6750–26,225 (14,351) 688–18,630 (9431) 50–1860 (729)VSS mg¨ VSS/L 6700–14,750 (10,694) 663–12,325 (6987) 57–2075 (560)
NO3´ mg¨ N/L 35–97 (68.74) Not measured 1–74 (16.50)
NO2´ mg¨ N/L Not measured Not measured 0–15.88 (3.38)
TN mg¨ N/L 41–124 (74.48) 61–225 (141.76) 10–223 (37.72)
Water 2016, 8, 117 5 of 11
average effluent TCOD concentration was observed at 455 mg/L (Table 2). Figure 2 illustrates the variation of TCOD concentrations in both reactors. The effluent TCOD concentrations of the ABR type-acid fermentation and post denitrification reactor decreased by about 21% and 97%, respectively, compared with the influent TCOD of each reactor. The TCOD in the effluent from the acid fermentation reactor included a large amount of VFAs produced in the acid fermentation process. These VFAs were used as a carbon source for the post denitrification process. Therefore, the high removal of TCOD was achieved in the post denitrification reactor. Our results demonstrated that the final TCOD removal rate of 97% was higher than the TCOD removal observed by Bodkhe et al. [5], which evaluated the performance of the modified ABR by applying domestic wastewater to obtain a TCOD removal of 86%.
Table 2. Wastewater quality range in ABR type-acid fermentation combined post denitrification process (with average in parentheses).
Parameters Unit Influent
Effluent of Acid Fermentation/Influent
of Post Denitrification
Effluent of Post Denitrification
TCOD mg·COD/L 10,220–37,560 (18,431) 3140–29,360 (14,564) 115–1230 (455) SCOD mg·COD/L 972–3528 (1499) 1614–4728 (2422) 21–247 (64) VFAs mg·COD/L 241–4058 (1351) 326–4775 (1930) Not measured TSS mg·SS/L 6750–26,225 (14,351) 688–18,630 (9431) 50–1860 (729) VSS mg·VSS/L 6700–14,750 (10,694) 663–12,325 (6987) 57–2075 (560) NO3− mg·N/L 35–97 (68.74) Not measured 1–74 (16.50) NO2− mg·N/L Not measured Not measured 0–15.88 (3.38) TN mg·N/L 41–124 (74.48) 61–225 (141.76) 10–223 (37.72)
Figure 2. Variation of TCOD concentrations in the ABR type-acid fermentation combined post denitrification reactor.
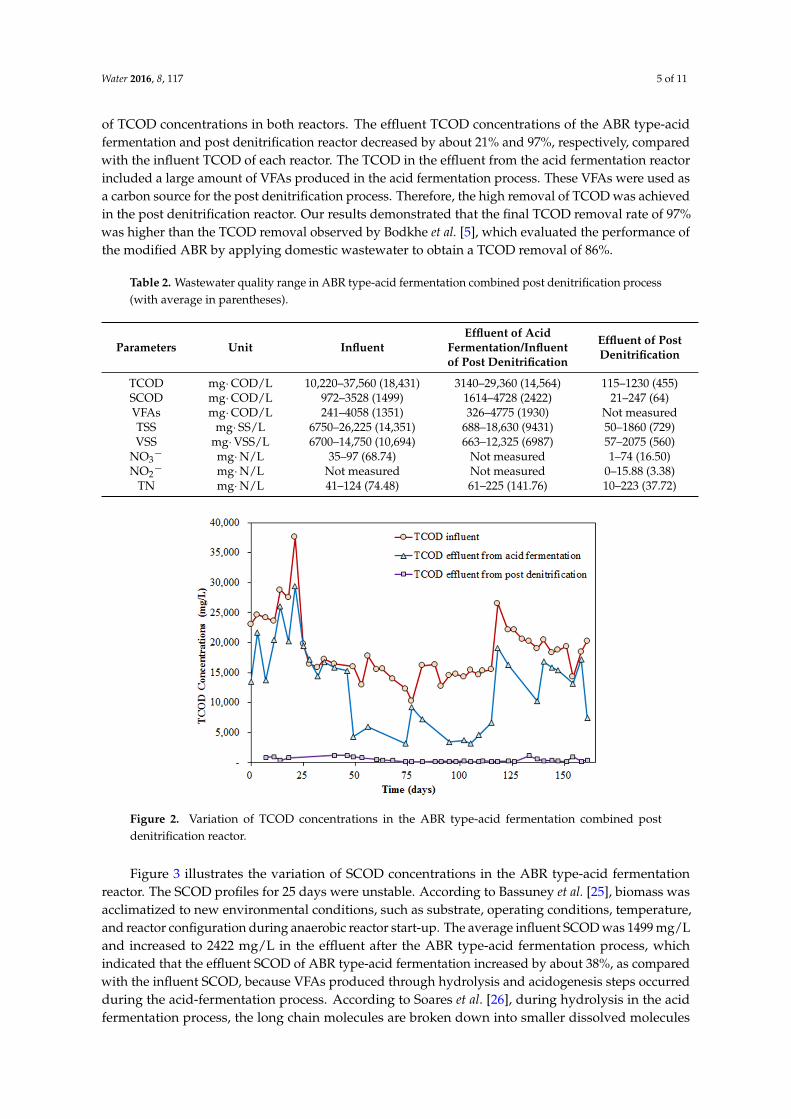
Figure 3 illustrates the variation of SCOD concentrations in the ABR type-acid fermentation reactor. The SCOD profiles for 25 days were unstable. According to Bassuney et al. [25], biomass was acclimatized to new environmental conditions, such as substrate, operating conditions, temperature, and reactor configuration during anaerobic reactor start-up. The average influent SCOD was 1499 mg/L and increased to 2422 mg/L in the effluent after the ABR type-acid fermentation process, which indicated that the effluent SCOD of ABR type-acid fermentation increased by about 38%, as compared
Figure 2. Variation of TCOD concentrations in the ABR type-acid fermentation combined postdenitrification reactor.
Figure 3 illustrates the variation of SCOD concentrations in the ABR type-acid fermentationreactor. The SCOD profiles for 25 days were unstable. According to Bassuney et al. [25], biomass wasacclimatized to new environmental conditions, such as substrate, operating conditions, temperature,and reactor configuration during anaerobic reactor start-up. The average influent SCOD was 1499 mg/Land increased to 2422 mg/L in the effluent after the ABR type-acid fermentation process, whichindicated that the effluent SCOD of ABR type-acid fermentation increased by about 38%, as comparedwith the influent SCOD, because VFAs produced through hydrolysis and acidogenesis steps occurredduring the acid-fermentation process. According to Soares et al. [26], during hydrolysis in the acidfermentation process, the long chain molecules are broken down into smaller dissolved molecules
Water 2016, 8, 117 6 of 11
by extracellular enzymes, which are then converted to VFAs during the acidogenesis step. In oursystem, more particulate solid matter could be retained inside the reactor with long SRT due to thesludge settlement through the baffles, which provided the sufficient time for long chain molecules tobe converted into short chain molecules. In the acidification step, the short chain molecules would beconverted into acetic acid, as the main composition of VFAs. With more accessible degradation, themore VFAs can be produced through the increase in the concentration of SCOD. However, the effluentSCOD decreased drastically by about 97% (from 2422 to 64 mg/L) when combined with high strengthnitrate injection after the post denitrification process (Table 2) due to the amount of organic matterused for the metabolism of denitrifying microorganisms.
Water 2016, 8, 117 6 of 11
with the influent SCOD, because VFAs produced through hydrolysis and acidogenesis steps occurred during the acid-fermentation process. According to Soares et al. [26], during hydrolysis in the acid fermentation process, the long chain molecules are broken down into smaller dissolved molecules by extracellular enzymes, which are then converted to VFAs during the acidogenesis step. In our system, more particulate solid matter could be retained inside the reactor with long SRT due to the sludge settlement through the baffles, which provided the sufficient time for long chain molecules to be converted into short chain molecules. In the acidification step, the short chain molecules would be converted into acetic acid, as the main composition of VFAs. With more accessible degradation, the more VFAs can be produced through the increase in the concentration of SCOD. However, the effluent SCOD decreased drastically by about 97% (from 2422 to 64 mg/L) when combined with high strength nitrate injection after the post denitrification process (Table 2) due to the amount of organic matter used for the metabolism of denitrifying microorganisms.
Figure 3. Variation of SCOD concentrations in the ABR type-acid fermentation reactor.
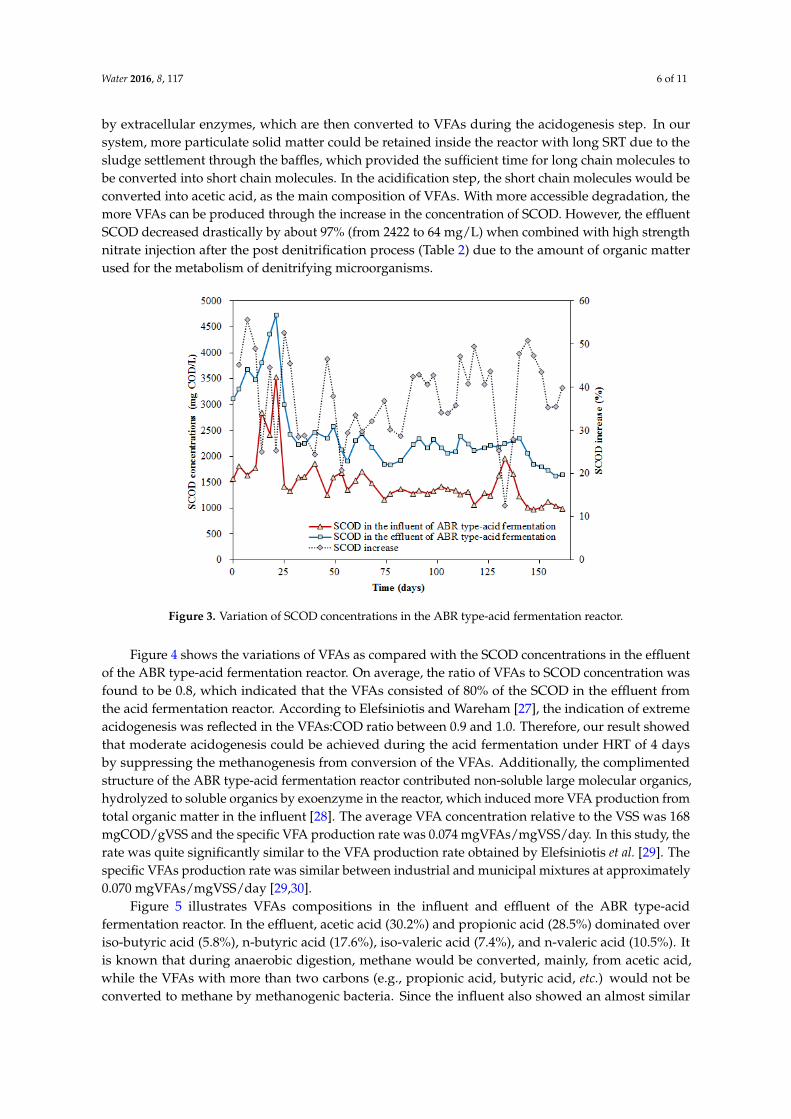
Figure 4 shows the variations of VFAs as compared with the SCOD concentrations in the effluent of the ABR type-acid fermentation reactor. On average, the ratio of VFAs to SCOD concentration was found to be 0.8, which indicated that the VFAs consisted of 80% of the SCOD in the effluent from the acid fermentation reactor. According to Elefsiniotis and Wareham [27], the indication of extreme acidogenesis was reflected in the VFAs:COD ratio between 0.9 and 1.0. Therefore, our result showed that moderate acidogenesis could be achieved during the acid fermentation under HRT of 4 days by suppressing the methanogenesis from conversion of the VFAs. Additionally, the complimented structure of the ABR type-acid fermentation reactor contributed non-soluble large molecular organics, hydrolyzed to soluble organics by exoenzyme in the reactor, which induced more VFA production from total organic matter in the influent [28]. The average VFA concentration relative to the VSS was 168 mgCOD/gVSS and the specific VFA production rate was 0.074 mgVFAs/mgVSS/day. In this study, the rate was quite significantly similar to the VFA production rate obtained by Elefsiniotis et al. [29]. The specific VFAs production rate was similar between industrial and municipal mixtures at approximately 0.070 mgVFAs/mgVSS/day [29,30].
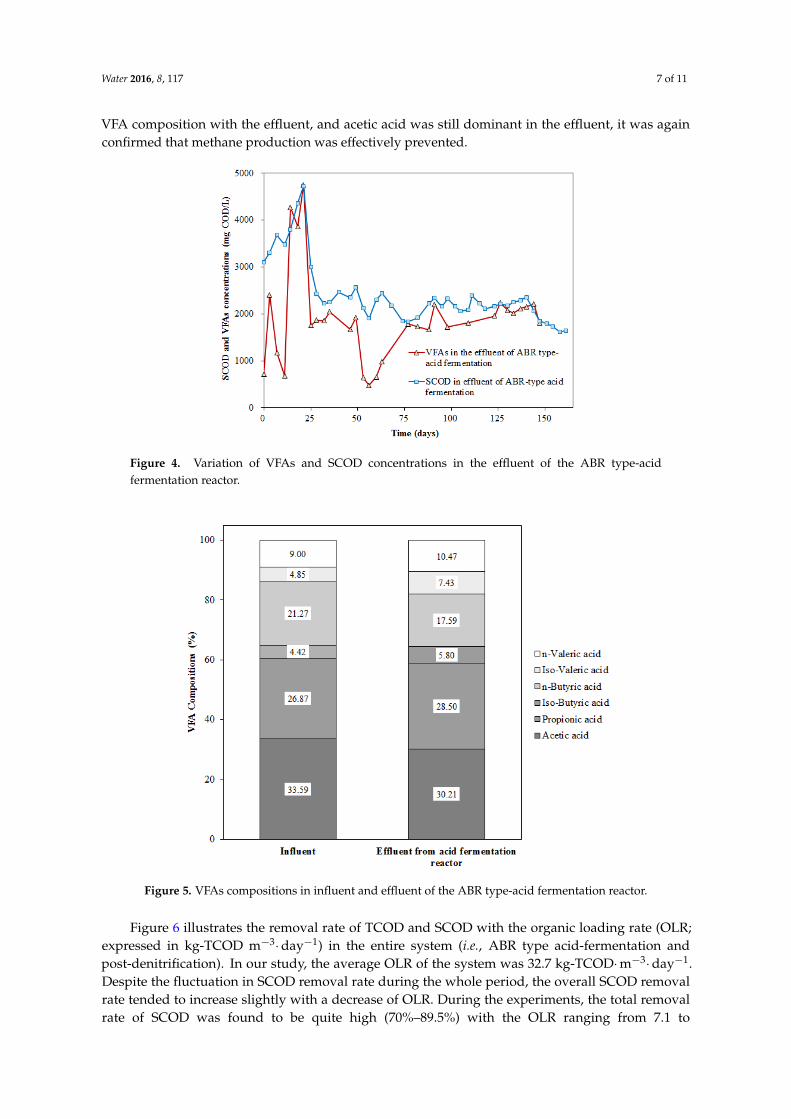
Figure 5 illustrates VFAs compositions in the influent and effluent of the ABR type-acid fermentation reactor. In the effluent, acetic acid (30.2%) and propionic acid (28.5%) dominated over iso-butyric acid (5.8%), n-butyric acid (17.6%), iso-valeric acid (7.4%), and n-valeric acid (10.5%). It is known that during anaerobic digestion, methane would be converted, mainly, from acetic acid, while the VFAs with more than two carbons (e.g., propionic acid, butyric acid, etc.) would not be converted to methane by methanogenic bacteria. Since the influent also showed an almost similar VFA composition with the effluent, and acetic acid was still dominant in the effluent, it was again confirmed that methane production was effectively prevented.
Figure 3. Variation of SCOD concentrations in the ABR type-acid fermentation reactor.
Figure 4 shows the variations of VFAs as compared with the SCOD concentrations in the effluentof the ABR type-acid fermentation reactor. On average, the ratio of VFAs to SCOD concentration wasfound to be 0.8, which indicated that the VFAs consisted of 80% of the SCOD in the effluent fromthe acid fermentation reactor. According to Elefsiniotis and Wareham [27], the indication of extremeacidogenesis was reflected in the VFAs:COD ratio between 0.9 and 1.0. Therefore, our result showedthat moderate acidogenesis could be achieved during the acid fermentation under HRT of 4 daysby suppressing the methanogenesis from conversion of the VFAs. Additionally, the complimentedstructure of the ABR type-acid fermentation reactor contributed non-soluble large molecular organics,hydrolyzed to soluble organics by exoenzyme in the reactor, which induced more VFA production fromtotal organic matter in the influent [28]. The average VFA concentration relative to the VSS was 168mgCOD/gVSS and the specific VFA production rate was 0.074 mgVFAs/mgVSS/day. In this study, therate was quite significantly similar to the VFA production rate obtained by Elefsiniotis et al. [29]. Thespecific VFAs production rate was similar between industrial and municipal mixtures at approximately0.070 mgVFAs/mgVSS/day [29,30].
Figure 5 illustrates VFAs compositions in the influent and effluent of the ABR type-acidfermentation reactor. In the effluent, acetic acid (30.2%) and propionic acid (28.5%) dominated overiso-butyric acid (5.8%), n-butyric acid (17.6%), iso-valeric acid (7.4%), and n-valeric acid (10.5%). Itis known that during anaerobic digestion, methane would be converted, mainly, from acetic acid,while the VFAs with more than two carbons (e.g., propionic acid, butyric acid, etc.) would not beconverted to methane by methanogenic bacteria. Since the influent also showed an almost similar
Water 2016, 8, 117 7 of 11
VFA composition with the effluent, and acetic acid was still dominant in the effluent, it was againconfirmed that methane production was effectively prevented.Water 2016, 8, 117 7 of 11
Figure 4. Variation of VFAs and SCOD concentrations in the effluent of the ABR type-acid fermentation reactor.
Figure 5. VFAs compositions in influent and effluent of the ABR type-acid fermentation reactor.
Figure 6 illustrates the removal rate of TCOD and SCOD with the organic loading rate (OLR; expressed in kg-TCOD m−3·day−1) in the entire system (i.e., ABR type acid-fermentation and post-denitrification). In our study, the average OLR of the system was 32.7 kg-TCOD·m−3·day−1. Despite the fluctuation in SCOD removal rate during the whole period, the overall SCOD removal rate tended to increase slightly with a decrease of OLR. During the experiments, the total removal rate of SCOD was found to be quite high (70%–89.5%) with the OLR ranging from 7.1 to 70.2 kg-TCOD·m−3·day−1. In the case of TCOD, a high rate of removal (90%–92%) also was achieved regardless of the variation of OLR. The COD removal rate would reach a maximum when the microbial biomass sufficiently accumulates in the reactor to handle the additional organic load, i.e., COD removal rate has a certain threshold corresponding to the reactor’s maximum operation capacity [31].
Figure 4. Variation of VFAs and SCOD concentrations in the effluent of the ABR type-acidfermentation reactor.
Water 2016, 8, 117 7 of 11
Figure 4. Variation of VFAs and SCOD concentrations in the effluent of the ABR type-acid fermentation reactor.
Figure 5. VFAs compositions in influent and effluent of the ABR type-acid fermentation reactor.
Figure 6 illustrates the removal rate of TCOD and SCOD with the organic loading rate (OLR; expressed in kg-TCOD m−3·day−1) in the entire system (i.e., ABR type acid-fermentation and post-denitrification). In our study, the average OLR of the system was 32.7 kg-TCOD·m−3·day−1. Despite the fluctuation in SCOD removal rate during the whole period, the overall SCOD removal rate tended to increase slightly with a decrease of OLR. During the experiments, the total removal rate of SCOD was found to be quite high (70%–89.5%) with the OLR ranging from 7.1 to 70.2 kg-TCOD·m−3·day−1. In the case of TCOD, a high rate of removal (90%–92%) also was achieved regardless of the variation of OLR. The COD removal rate would reach a maximum when the microbial biomass sufficiently accumulates in the reactor to handle the additional organic load, i.e., COD removal rate has a certain threshold corresponding to the reactor’s maximum operation capacity [31].
Figure 5. VFAs compositions in influent and effluent of the ABR type-acid fermentation reactor.
Figure 6 illustrates the removal rate of TCOD and SCOD with the organic loading rate (OLR;expressed in kg-TCOD m´3¨ day´1) in the entire system (i.e., ABR type acid-fermentation andpost-denitrification). In our study, the average OLR of the system was 32.7 kg-TCOD¨ m´3¨ day´1.Despite the fluctuation in SCOD removal rate during the whole period, the overall SCOD removalrate tended to increase slightly with a decrease of OLR. During the experiments, the total removalrate of SCOD was found to be quite high (70%–89.5%) with the OLR ranging from 7.1 to

Water 2016, 8, 117 8 of 11
70.2 kg-TCOD¨ m´3¨ day´1. In the case of TCOD, a high rate of removal (90%–92%) also was achievedregardless of the variation of OLR. The COD removal rate would reach a maximum when the microbialbiomass sufficiently accumulates in the reactor to handle the additional organic load, i.e., COD removalrate has a certain threshold corresponding to the reactor’s maximum operation capacity [31].Water 2016, 8, 117 8 of 11
Figure 6. TCOD and SCOD removal rate with various OLRs in ABR type-acid fermentation combined with post denitrification process.
3.2. Nitrogen Variation
The average influent and effluent TN concentrations in the ABR type-acid fermentation reactor were 74.48 mg/L and 141.76 mg/L, respectively (Table 2), indicating that the concentration of TN increased by 47.5% after the ABR type-acid fermentation because dissolved nitrogen was additionally produced during the hydrolysis and autoxidation of the solid part of the influent and the sludge inside the reactor. After the post denitrification process, the average effluent TN concentration was 37.72 mg/L (Table 2), which presented a TN removal rate of 73% as compared with the average influent TN (141.76 mg/L) in the post denitrification reactor. The average NO3−-N concentrations in the influent of the ABR type-acid fermentation reactor and the effluent of the post denitrification reactor were 68.74 mg/L and 16.5 mg/L, respectively (Table 2). The effluent NO3−-N concentrations of the post denitrification process decreased by about 80.8% as compared with the influent NO3−-N. The specific denitrification rate was calculated by considering the amount of NO3−-N removed, the concentration of microorganisms (i.e., VSS), and the influent flow rate for the post denitrification reactor. The average specific denitrification was 0.166 gNO3−-N/gVSS/day. This value was in the range of general denitrification efficiency, considering the results of a study in which a specific denitrification rate of 0.011–0.754 gNO3−-N/gVSS/day was obtained when VFAs were used as the influent carbon source of the denitrification process [29]. However, the maximum and minimum specific denitrification rates were 0.431 and 0.047 gNO3−-N/gVSS/day for the ABR type-acid fermentation-post denitrification reactor. Therefore, even the lowest specific denitrification rate was relatively higher than the minimum value reported by Elefsiniotis et al. [29], and it is thought that a more stable and higher specific denitrification rate could be achieved by maintaining a stable concentration of microorganisms in the post denitrification reactor.
3.3. Total Suspended Solid Variation
The influent TSS concentration in the ABR type-acid fermentation reactor ranged from 6750 to 26,225 mg/L. The high suspended solids were caused by the need to use long HRT for anaerobic treatment of a highly concentrated substrate [32]. In our study, high retention of TSS (13,528 mg/L in the acid fermentation zone and 1997 mg/L in post denitrification) inside both reactors were obtained even by the short HRT of four days because the actual retention time of microorganisms increased due to the sludge settlement in the compartment zone of both reactors and the return of settled sludge
Figure 6. TCOD and SCOD removal rate with various OLRs in ABR type-acid fermentation combinedwith post denitrification process.
3.2. Nitrogen Variation
The average influent and effluent TN concentrations in the ABR type-acid fermentation reactorwere 74.48 mg/L and 141.76 mg/L, respectively (Table 2), indicating that the concentration of TNincreased by 47.5% after the ABR type-acid fermentation because dissolved nitrogen was additionallyproduced during the hydrolysis and autoxidation of the solid part of the influent and the sludgeinside the reactor. After the post denitrification process, the average effluent TN concentration was37.72 mg/L (Table 2), which presented a TN removal rate of 73% as compared with the averageinfluent TN (141.76 mg/L) in the post denitrification reactor. The average NO3
´-N concentrations inthe influent of the ABR type-acid fermentation reactor and the effluent of the post denitrification reactorwere 68.74 mg/L and 16.5 mg/L, respectively (Table 2). The effluent NO3
´-N concentrations of the postdenitrification process decreased by about 80.8% as compared with the influent NO3
´-N. The specificdenitrification rate was calculated by considering the amount of NO3
´-N removed, the concentrationof microorganisms (i.e., VSS), and the influent flow rate for the post denitrification reactor. Theaverage specific denitrification was 0.166 gNO3
´-N/gVSS/day. This value was in the range of generaldenitrification efficiency, considering the results of a study in which a specific denitrification rate of0.011–0.754 gNO3
´-N/gVSS/day was obtained when VFAs were used as the influent carbon source ofthe denitrification process [29]. However, the maximum and minimum specific denitrification rateswere 0.431 and 0.047 gNO3
´-N/gVSS/day for the ABR type-acid fermentation-post denitrificationreactor. Therefore, even the lowest specific denitrification rate was relatively higher than the minimumvalue reported by Elefsiniotis et al. [29], and it is thought that a more stable and higher specificdenitrification rate could be achieved by maintaining a stable concentration of microorganisms in thepost denitrification reactor.

Water 2016, 8, 117 9 of 11
3.3. Total Suspended Solid Variation
The influent TSS concentration in the ABR type-acid fermentation reactor ranged from 6750 to26,225 mg/L. The high suspended solids were caused by the need to use long HRT for anaerobictreatment of a highly concentrated substrate [32]. In our study, high retention of TSS (13,528 mg/L inthe acid fermentation zone and 1997 mg/L in post denitrification) inside both reactors were obtainedeven by the short HRT of four days because the actual retention time of microorganisms increaseddue to the sludge settlement in the compartment zone of both reactors and the return of settled sludgefrom the compartment to the mixing zone. The effective sludge settling in the compartment zoneresulted in a high removal of TSS, as shown in Figure 7. The TSS concentrations of the effluent fromthe post denitrification process were in the range of 50–1860 mg/L, which showed that the removalrate of TSS was 92%. Additionally, the increased retention time of sludge also induced enough timefor the decomposition of particulate organic matters, which resulted in a greater production of VFAs.Foxon et al. [33] also reported that a good settling of sludge could be achieved by the compartmentzone of the ABR process, which resulted in a high removal rate of TSS and enhanced the degradabilityof organic matters with an adequate retention of sludge inside the reactor.
Water 2016, 8, 117 9 of 11
from the compartment to the mixing zone. The effective sludge settling in the compartment zone resulted in a high removal of TSS, as shown in Figure 7. The TSS concentrations of the effluent from the post denitrification process were in the range of 50–1860 mg/L, which showed that the removal rate of TSS was 92%. Additionally, the increased retention time of sludge also induced enough time for the decomposition of particulate organic matters, which resulted in a greater production of VFAs. Foxon et al. [33] also reported that a good settling of sludge could be achieved by the compartment zone of the ABR process, which resulted in a high removal rate of TSS and enhanced the degradability of organic matters with an adequate retention of sludge inside the reactor.
Figure 7. Variation of TSS concentrations in the ABR type-acid fermentation and post denitrification reactors.
4. Conclusions
In this study, we evaluated the performance of ABR type acid-fermentation combined with a post denitrification process to treat primary sludge from a municipal wastewater treatment plant. The produced VFAs were supplied as an external carbon source for the post denitrification process to treat the wastewater containing a high level of nitrate. Laboratory-scale experiments showed that the removal rate of TCOD, TSS, and TN were found to be 97%, 92%, and 73%, respectively, in the effluent of post denitrification reactor. The specific VFA production rate was 0.074 mgVFAs/mgVSS/day and the average specific denitrification rate was 0.166 gNO3−-N/gVSS/day for the ABR type-acid fermentation-post denitrification reactor. This value was in the range of general denitrification efficiency of previous studies. Consequently, a primary sludge was successfully treated by the application of acid fermentation process with a short HRT, even by preventing methanogenesis, and the produced VFAs were then successfully utilized as an external carbon source for the post denitrification process to achieve a high removal of nitrate.
Acknowledgments: This work is supported by a grant from the Waste to Energy and Recycling Human Resource Development Project (YL-WE-15-001) funded by the Korea Ministry of Environment and also from the National Research Foundation (No. 2014R1A2A2A09049496) of Korea funded by the Korea Ministry of Science, ICT and Future Planning.
Author Contributions: Allen Kurniawan analyzed the result and wrote the manuscript while Se Young Kwon and Jung-Hun Shin prepared and conducted the experiments. Jin Hur contributed to revise the manuscript. Jinwoo Cho supervised the research, developed methodology, and revised the manuscript as a corresponding author.
Conflicts of Interest: The authors declare no conflict of interest.
Figure 7. Variation of TSS concentrations in the ABR type-acid fermentation and post denitrification reactors.
4. Conclusions
In this study, we evaluated the performance of ABR type acid-fermentation combined with apost denitrification process to treat primary sludge from a municipal wastewater treatment plant. Theproduced VFAs were supplied as an external carbon source for the post denitrification process totreat the wastewater containing a high level of nitrate. Laboratory-scale experiments showed that theremoval rate of TCOD, TSS, and TN were found to be 97%, 92%, and 73%, respectively, in the effluentof post denitrification reactor. The specific VFA production rate was 0.074 mgVFAs/mgVSS/dayand the average specific denitrification rate was 0.166 gNO3
´-N/gVSS/day for the ABR type-acidfermentation-post denitrification reactor. This value was in the range of general denitrificationefficiency of previous studies. Consequently, a primary sludge was successfully treated by theapplication of acid fermentation process with a short HRT, even by preventing methanogenesis,and the produced VFAs were then successfully utilized as an external carbon source for the postdenitrification process to achieve a high removal of nitrate.
Water 2016, 8, 117 10 of 11
Acknowledgments: This work is supported by a grant from the Waste to Energy and Recycling Human ResourceDevelopment Project (YL-WE-15-001) funded by the Korea Ministry of Environment and also from the NationalResearch Foundation (No. 2014R1A2A2A09049496) of Korea funded by the Korea Ministry of Science, ICT andFuture Planning.
Author Contributions: Allen Kurniawan analyzed the result and wrote the manuscript while Se Young Kwon andJung-Hun Shin prepared and conducted the experiments. Jin Hur contributed to revise the manuscript. Jinwoo Chosupervised the research, developed methodology, and revised the manuscript as a corresponding author.
Conflicts of Interest: The authors declare no conflict of interest.
References
1. Mudhoo, A. Biogas Production: Pretreatment Methods in Anaerobic Digestion; John Willey & Sons: New York,NY, USA, 2012; p. 2.
2. Alvarez, J.M.; Dosta, J.; Güiza, M.S.R.; Fonoll, X.; Peces, M.; Astals, S. A critical review on anaerobicco-digestion achievements between 2010 and 2013. Renew. Sustain. Energy Rev. 2014, 36, 412–427. [CrossRef]
3. Kythreotou, N.; Florides, G.; Tassou, S.A. A review simple to scientific models for anaerobic digestion. Renew.Energy 2014, 71, 701–714. [CrossRef]
4. Basile, A.; Di Paola, L.; Hai, F.I.; Piemonte, V. Membrane Reactors for Energy Applications and Basic ChemicalProduction; Woodhead Publishing: Cambridge, CBE, UK, 2015; p. 345.
5. Bodkhe, S.Y. A modified anaerobic baffled reactor for municipal wastewater treatment. J. Environ. Manag.2009, 90, 2488–2493. [CrossRef] [PubMed]
6. Krishna, G.V.T.P.; Kumar, P.; Kumar, P. Treatment of low-strength soluble wastewater using an anaerobicbaffled reactor (ABR). J. Environ. Manag. 2009, 90, 166–176. [CrossRef] [PubMed]
7. Lee, W.S.; Chua, A.S.M.; Yeoh, H.K.; Ngoh, G.C. A review of the production and applications of waste-derivedvolatile fatty acids. Chem. Eng. J. 2014, 235, 83–89. [CrossRef]
8. Wang, J.; Huang, Y.; Zhao, X. Performance and characteristics of an anaerobic baffled reactor.Bioresour. Technol. 2004, 93, 205–208. [CrossRef] [PubMed]
9. Fang, H.H.P. Environmental Anaerobic Technology: Applications and New Developments; Imperial College Press:London, LND, UK, 2010; p. 164.
10. Wang, Y.; Zhang, Y.; Wang, J.; Meng, L. Effects of volatile fatty acid concentrations on methane yield andmethanogenic bacteria. Biomass Bioenergy 2009, 33, 848–853. [CrossRef]
11. Barber, W.P.; Stuckey, D.C. The use of the anaerobic baffled reactor (ABR) for wastewater treatment: A review.Water Res. 1999, 33, 1559–1578. [CrossRef]
12. Langenhoff, A.A.M.; Intrachandra, N.; Stuckey, A.C. Treatment of dilute soluble and colloidal wastewaterusing an anaerobic baffled reactor: Influence of hydraulic retention time. Water Res. 2000, 34, 1307–1317.[CrossRef]
13. Tawfik, A.; Salem, A.; El-Qelish, M. Two stage anaerobic baffled reactors for bio-hydrogen production frommunicipal food waste. Bioresour. Technol. 2011, 102, 8723–8726. [CrossRef] [PubMed]
14. Xu, S.; Wu, D.; Hu, Z. Impact of hydraulic retention time on organic and nutrient removal in a membranecoupled sequencing batch reactor. Water Res. 2014, 55, 12–20. [CrossRef] [PubMed]
15. Shah, F.A.; Mahmood, Q.; Shah, M.M.; Pervez, A.; Asad, S.A. Microbial ecology of anaerobic digesters:The key players of anaerobiosis. Sci. World J. 2014, 2014, 1–21.
16. Latif, M.A.; Ghufran, R.; Wahid, Z.A.; Ahmad, A. Integrated application of upflow anaerobic sludge blanketreactor for the treatment of wastewaters. Water Res. 2011, 45, 4683–4699. [CrossRef] [PubMed]
17. Hernandez, J.E.; Edyvean, R.G.J. Comparison between a two-stage and single-stage digesters when treatinga synthetic wastewater contaminated with phenol. Water SA 2011, 37, 27–32. [CrossRef]
18. Katuri, K.P.; Enright, A.M.; O’Flaherty, V.; Leech, D. Microbial analysis of anodic biofilm in a microbial fuelcell using slaughterhouse wastewater. Bioelectrochemistry 2011, 87, 164–171. [CrossRef] [PubMed]
19. Korean Ministry of Environment, 2030 Sewarage Sludge Reduction, Biogas Producing and Using Portfolio.Available online: http://m.me.go.kr/home/web/policy_data (accessed on 29 February 2016).
20. Batstone, D.J.; Huelsen, T.; Mehta, C.M.; Keller, J. Platforms for energy and nutrient recovery from domesticwastewater: A review. Chemosphere 2014, 140, 2–11. [CrossRef] [PubMed]
21. Batstone, D.J.; Virdis, B. The role of anaerobic digestion in the emerging energy economy.Curr. Opin. Biotechnol. 2014, 27, 142–149. [CrossRef] [PubMed]
Water 2016, 8, 117 11 of 11
22. American Public Health Association (APHA); American Water Works Association; Water Pollution ControlFederation; Water Environment Federation. Standard Methods for the Examination of Water and Wastewater;American Water Works Assn: Washington, DC, USA, 2012.
23. Barajas, M.G.; Escalas, A.; Mujeriego, R. Fermentation of a low VFA wastewater in an activated primary tank.Water SA 2002, 28, 89–98.
24. Berthouex, P.M.; Brown, L.C. Statistics for Environmental Engineers; Lewis Publishers: Boca Raton, FL, USA,2002; p. 7.
25. Bassuney, D.M.; Ibrahim, W.A.; Moustafa, M.A.E. Performance of an anaerobic baffled reactor (ABR) duringstart-up period. Inter. J. Chem. Environ. Biol. Sci. 2013, 1, 571–575.
26. Soares, A.; Maillard, S.; Kampas, P.; Wood, E.; Calvert, A.; Parsons, S.A.; Cartmell, E. Fermentationand Disintegration of Sludge to Promote Biological Nutrient Removal. In Proceedings of IWAConference-Proceedings of Moving Forward Wastewater Biosolids Sustainability, Technical Managerial andPublic Synergy, Moncton, NB, Canada, 24-27 June 2007; Le Blanc, R.J., Laughton, P.J., Tyagi, R., Eds.
27. Elefsiniotis, P.; Wareham, D.G. Utilization patterns of volatile fatty acids in the denitrification reaction.Enzym. Microb. Technol. 2007, 41, 92–97. [CrossRef]
28. Ji, G.D.; Sun, T.H.; Ni, J.R.; Tong, J.J. Anaerobic baffled reactor (ABR) for treating heavy oil produced waterwith high concentrations of salt and poor nutrient. Bioresour. Technol. 2009, 100, 1108–1114. [CrossRef][PubMed]
29. Elefsiniotis, P.; Wareham, D.G.; Smith, M.O. Effect of a starch-rich industrial wastewater on the acid-phaseanaerobic digestion process. Water Environ. Res. 2005, 77, 366–371. [CrossRef] [PubMed]
30. Lee, S.J. Relationship between Oxidation Reduction Potential (ORP) and Volatile Fatty Acid (VFAs)Production in the Acid-Phase Anaerobic Digestion Process. Master’s Thesis, University of Canterbury,Canterbury, New Zealand, January 2008.
31. Najafpour, G.D.; Zinatizadeh, A.A.L.; Mohamed, A.R.; Isa, M.H.; Nasrollahzadeh, H. High-rate anaerobicdigestion of palm oil mill effluent in an upflow anaerobic sludge-fixed film bioreactor. Process Biochem. 2006,41, 370–379. [CrossRef]
32. Malina, J. Design of Anaerobic Processes for Treatment of Industrial and Municipal Waste; CRC Press: Boca Raton,FL, USA, 1992; p. 93.
33. Foxon, K.M.; Pillay, S.; Lalbahadur, T.; Rodda, N.; Holder, F.; Buckley, C.A. The anaerobic baffled reactor(ABR): An appropriate technology for on-site sanitation. Water SA 2007, 30, 44–50. [CrossRef]
© 2016 by the authors; licensee MDPI, Basel, Switzerland. This article is an open accessarticle distributed under the terms and conditions of the Creative Commons by Attribution(CC-BY) license (http://creativecommons.org/licenses/by/4.0/).