acid-base titrations strong base to weak acid strong base to weak acid consider adding a strong base...
TRANSCRIPT

Acid-Base TitrationsAcid-Base Titrations
Strong Base to Weak AcidStrong Base to Weak Acid• Consider adding a strong base (e.g. NaOH) to a
solution of a weak acid (e.g.KHP).
Acid-Base TitrationsAcid-Base Titrations
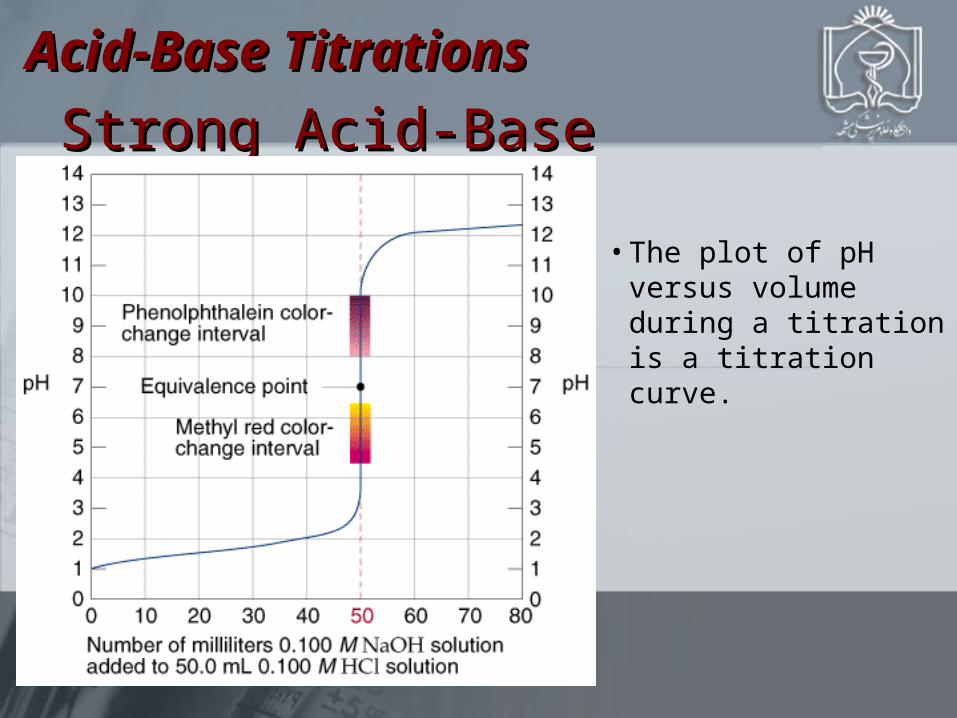
Strong Acid-Base TitrationsStrong Acid-Base Titrations
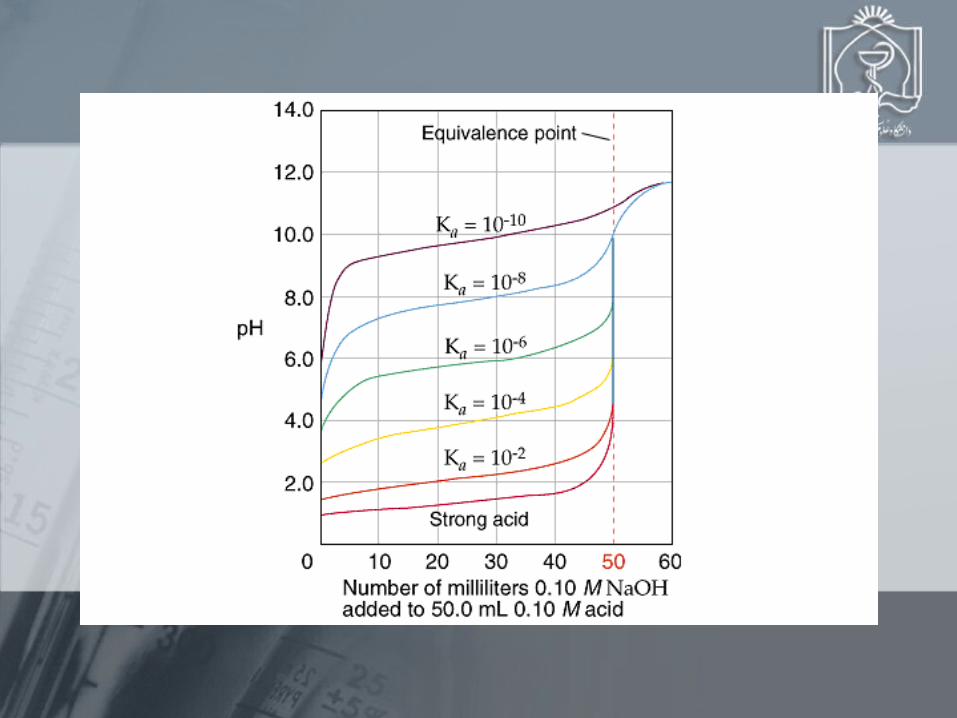
•The plot of pH versus volume during a titration is a titration curve.

Acid-Base TitrationsAcid-Base Titrations
Weak Acid-Strong Base Weak Acid-Strong Base TitrationsTitrations
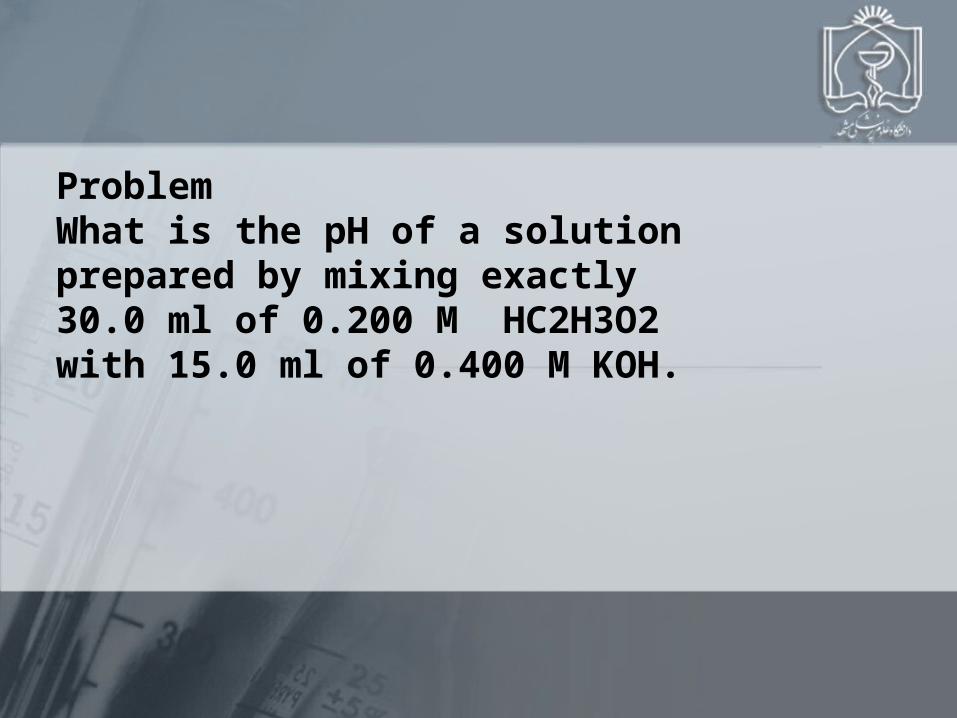
ProblemWhat is the pH of a solution prepared by mixing exactly 30.0 ml of 0.200 M HC2H3O2 with 15.0 ml of 0.400 M KOH.
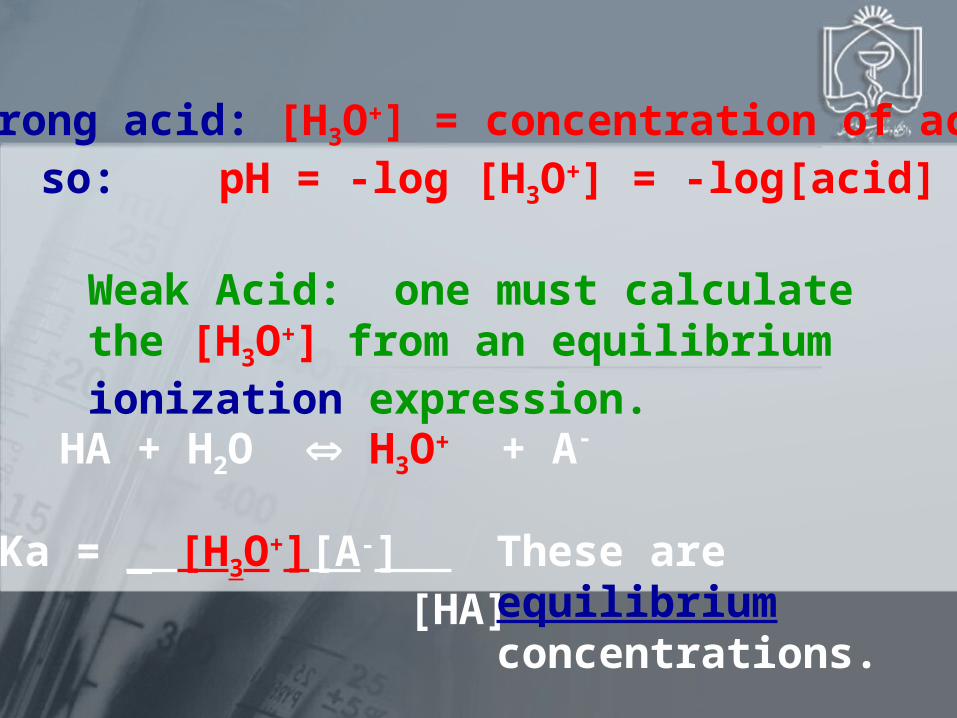
Strong acid: [H3O+] = concentration of acidso: pH = -log [H3O+] = -log[acid]
Weak Acid: one must calculate the [H3O+] from an equilibrium ionization expression.
HA + H2O H3O+ + A-
Ka = _ [H3O+][A-] [HA]
These are equilibrium concentrations.
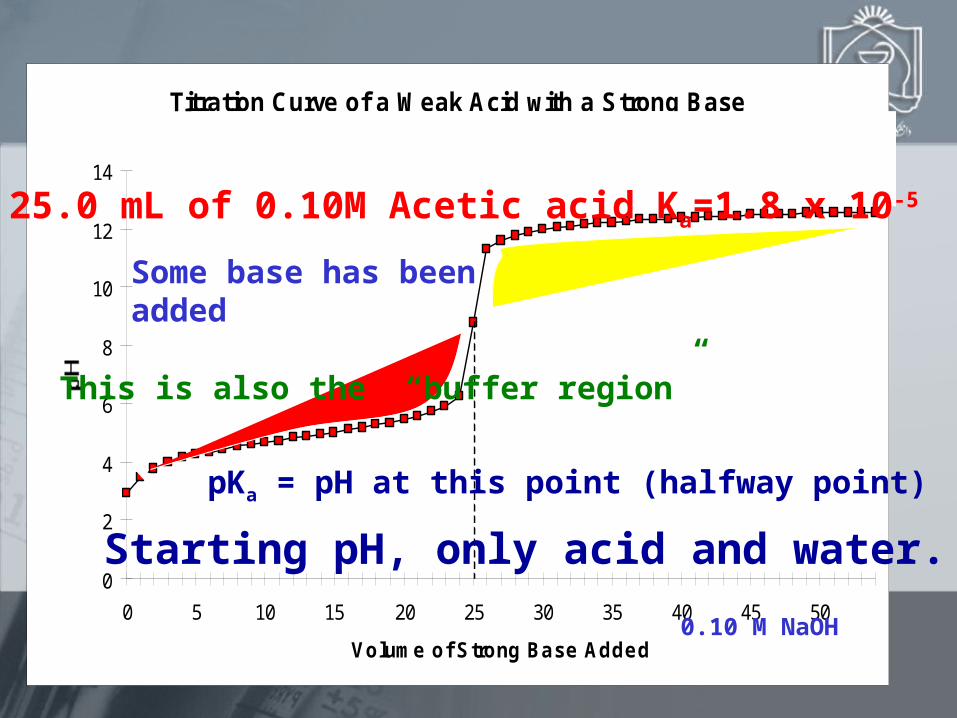
Titration Curve of a Weak Acid with a Strong Base
0
2
4
6
8
10
12
14
0 5 10 15 20 25 30 35 40 45 50
Volume of Strong Base Added
equivalence pointbuffer region note volume ratiobetween these points
25.0 mL of 0.10M Acetic acid Ka=1.8 x 10⁻⁵
0.10 M NaOH
1. Starting pH, only acid and water.
2
34
1. pKa = pH at this point (halfway point)
This is also the “buffer region”
Some base has been added
Titration Curve of a Weak Acid with a Strong Base
0
2
4
6
8
10
12
14
0 5 10 15 20 25 30 35 40 45 50
Volume of Strong Base Added
equivalence pointbuffer region note volume ratiobetween these points
1
2
3
4
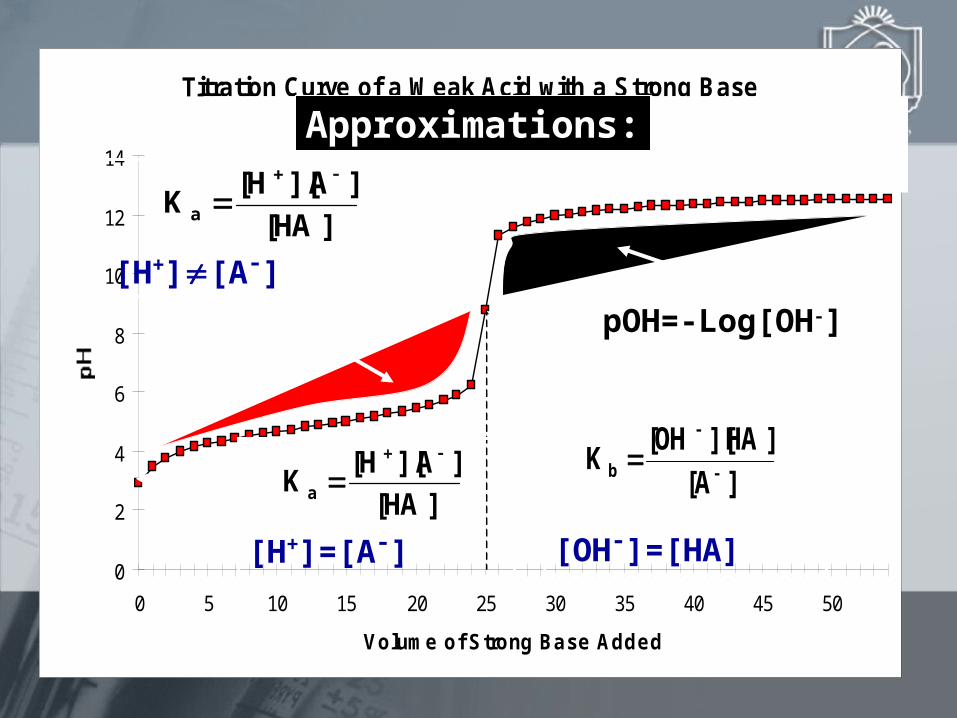
[H+]=[A-]
[H+][A-]
pOH=-Log[OH-]
[OH-]=[HA]
]HA[
]A][H[K a
]HA[
]A][H[K a
]A[
]HA][OH[Kb
Approximations:
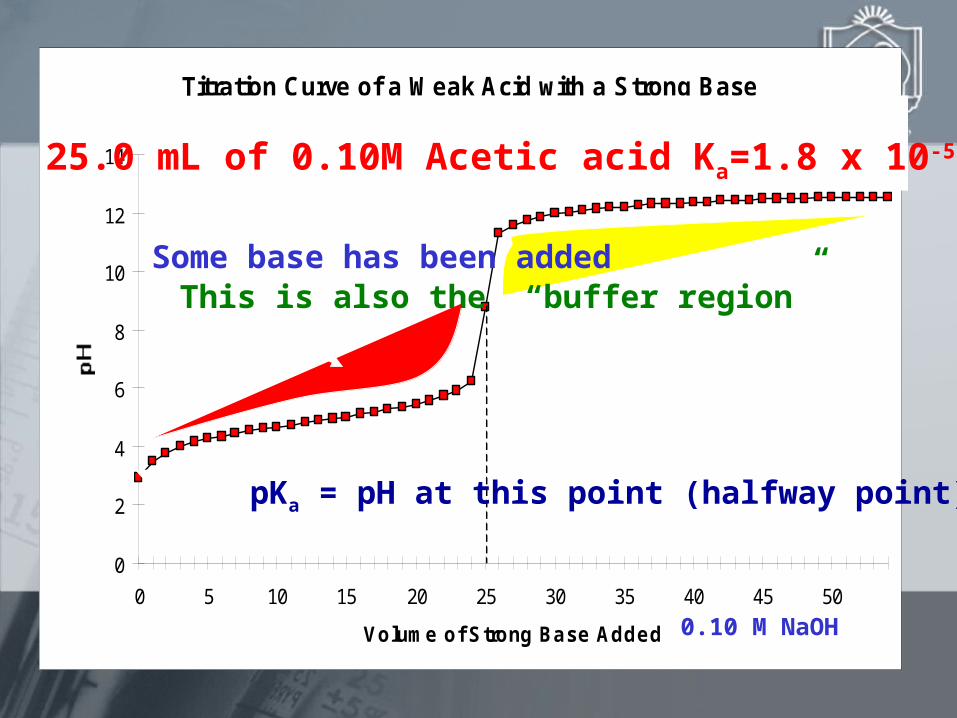
Titration Curve of a Weak Acid with a Strong Base
0
2
4
6
8
10
12
14
0 5 10 15 20 25 30 35 40 45 50
Volume of Strong Base Added
equivalence pointbuffer region note volume ratiobetween these points25.0 mL of 0.10M Acetic acid Ka=1.8 x 10⁻⁵
0.10 M NaOH
1.
2.
34
Some base has been addedThis is also the “buffer region”
pKa = pH at this point (halfway point)
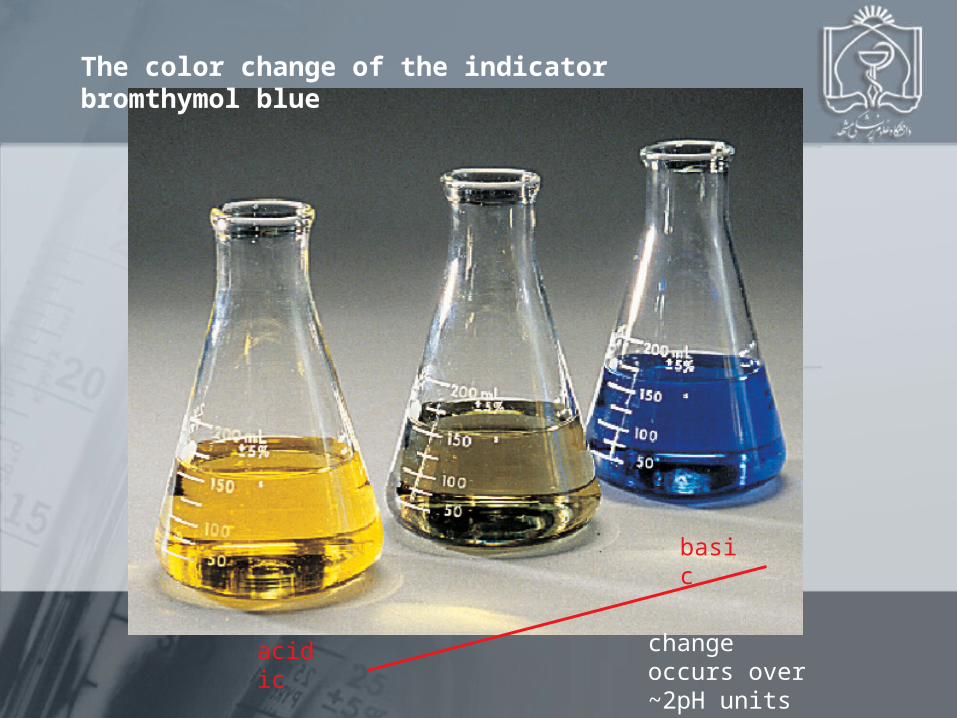
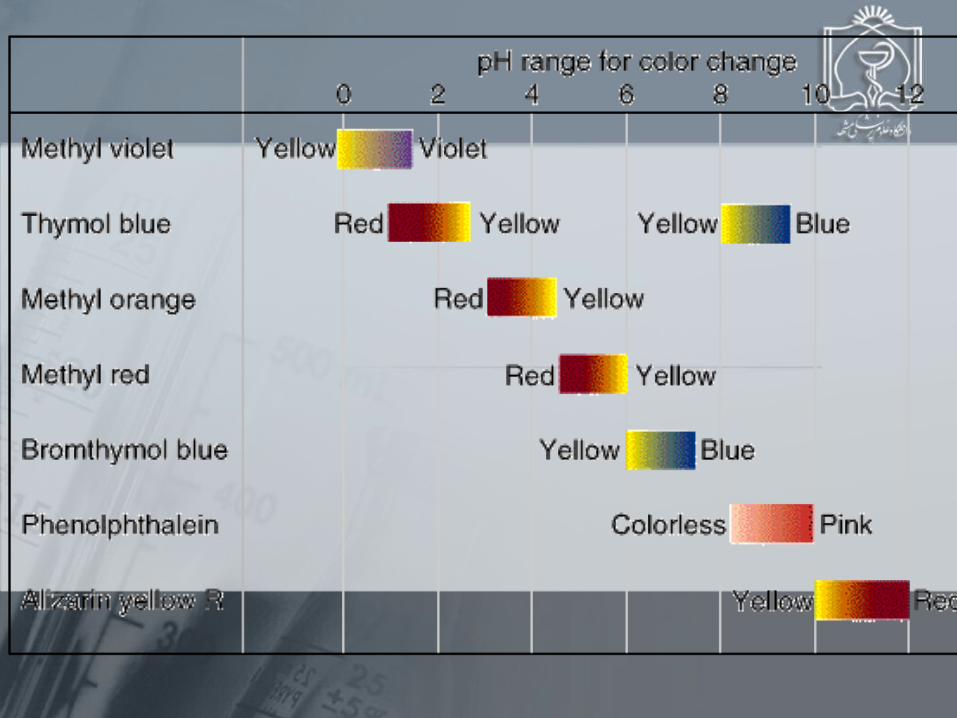
The color change of the indicator bromthymol blue
acidic
basic
change occurs over ~2pH units
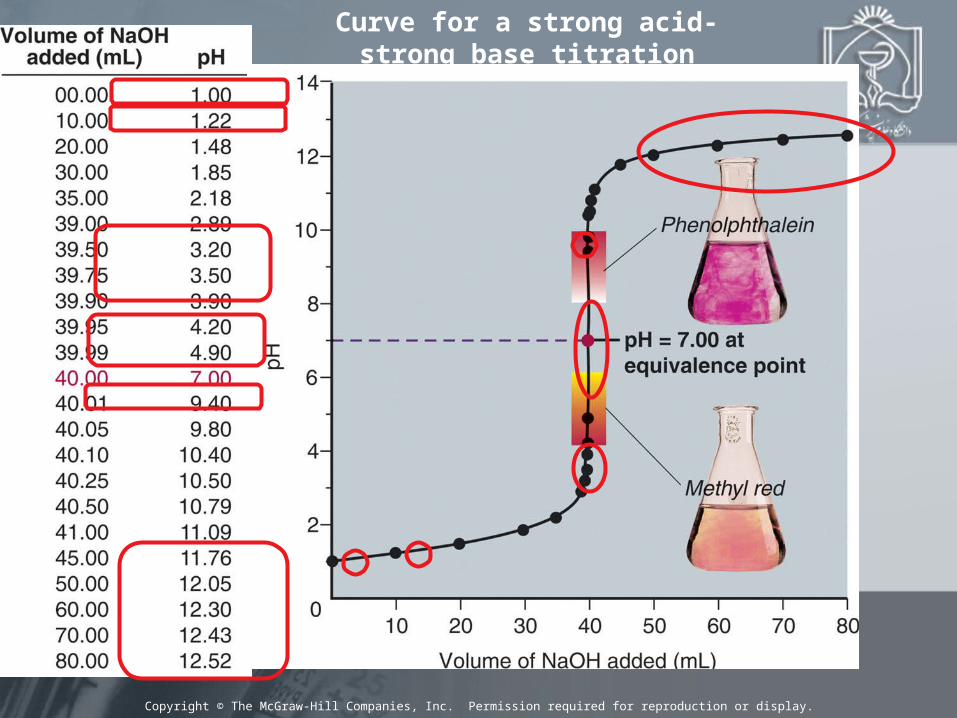
Curve for a strong acid-strong base titration
Copyright © The McGraw-Hill Companies, Inc. Permission required for reproduction or display.
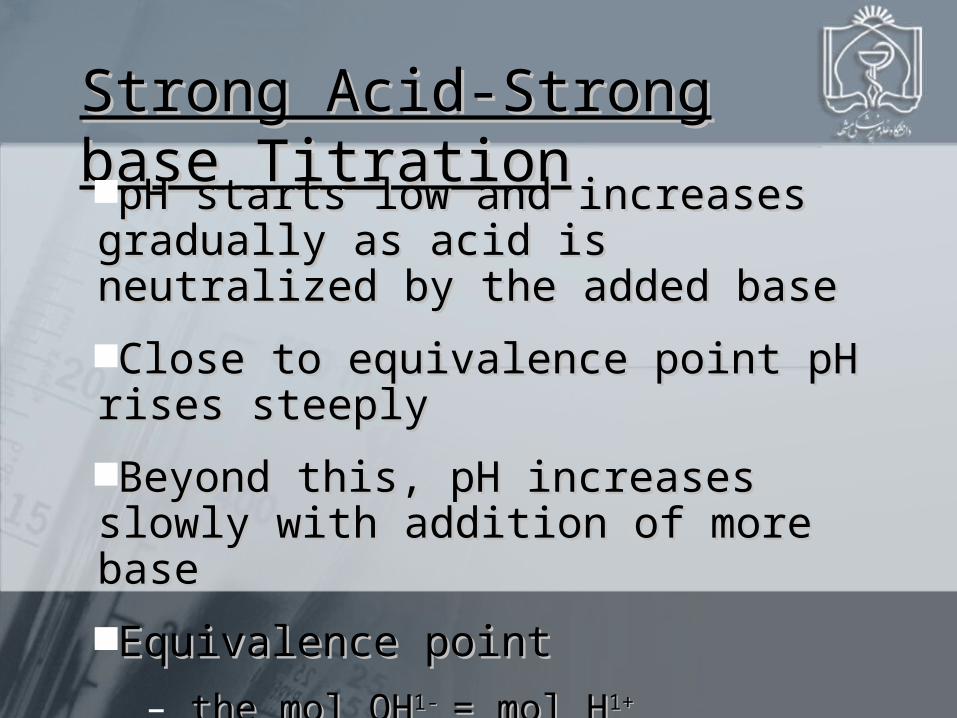
Strong Acid-Strong base Strong Acid-Strong base TitrationTitrationpH starts low and increases gradually as acid pH starts low and increases gradually as acid is neutralized by the added baseis neutralized by the added base
Close to equivalence point pH rises steeplyClose to equivalence point pH rises steeply
Beyond this, pH increases slowly with Beyond this, pH increases slowly with addition of more baseaddition of more base
Equivalence pointEquivalence point
– the mol OHthe mol OH1- 1- = mol H= mol H1+ 1+
–The pH = 7The pH = 7

Curve for a weak acid-
strong base titration
Titration of 40.00mL of 0.1000M HPr with 0.1000M NaOH
[HPr] = [Pr-]
pH = 8.80 at equivalence point
pKa of HPr = 4.89
methyl red
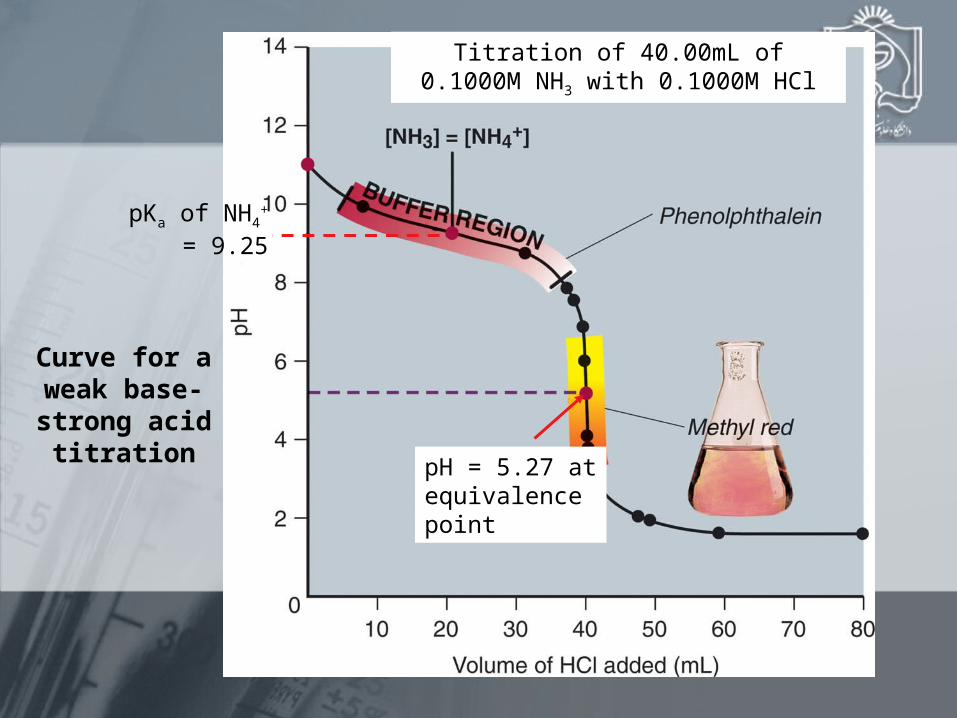
Curve for a weak base-strong acid
titration
Titration of 40.00mL of 0.1000M NH3 with 0.1000M HCl
pH = 5.27 at equivalence point
pKa of NH4+
= 9.25

pKa = 7.19
pKa = 1.85
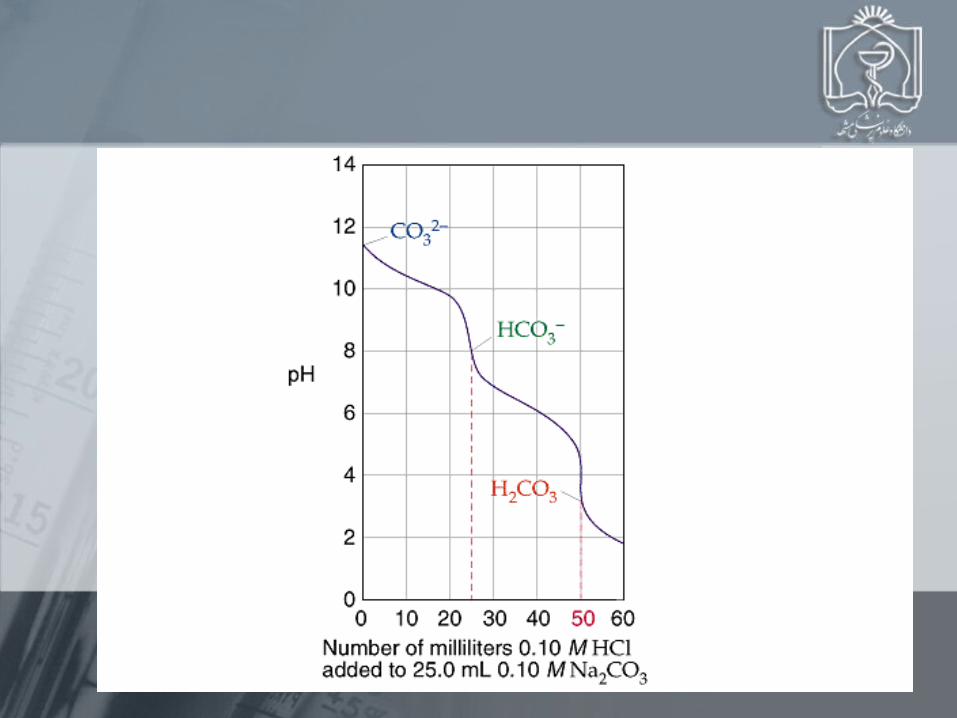
Curve for the titration of a weak polyprotic acid.
Titration of 40.00mL of 0.1000M H2SO3 with 0.1000M NaOH