acid-base metabolism.acid-base metabolism. i 4. methods of [email protected] the urine, na and k were...
TRANSCRIPT

ACID-BASE METABOLISM.
I. DETERMINATION OF BASE BALANCE.*
BY A. T. SHOHL AND A. SATO.
(Prom the Department of Pediatrics, the Johns Hopkins University, Baltimore.)
(Received for publication, August 23, 1923.)
Total acid-base metabolism in two infants has been calculated by chemical analysis of all acid and basic radicals in the food, urine, and feces. Changes in the acid-base content of the body and the mechanism whereby the organism maintains the normal reaction of the blood and tissues can thus be determined. The essentials for such measurements are: (1) to include all sources of acid or base-food, urine, and feces; (2) to quantitate all types of material which produce acids and bases-actual or potential; and (3) to state the results in comparable terms.
1. Sources of Acid and Base.-That the data may have value, every significant source of acids or bases must be included. A sample of the actual food must be analyzed; samples vary so much that accepted standard analyses cannot be used. Analysis of the mineral content of the feces is necessary to determine the total acid-base metabolism. The urine has received most atten- tion as a factor in excretion of acids and salts. Other sources of output might be vomitus or saliva. In our experiments, none occurred. The value of sweat and lacrimation was thought to be so small as to fall within the experimental error.
2. Quantitative Anal&S.-The analyses cover the four basic elements: sodium, potassium, calcium, and magnesium; and the acid radicals: sulfates, phosphates, and chlorides. Sulfur and phosphorus must also be included to the extent to which they are oxidized in the body to form sulfate and phosphate-actual from
* Read before the American Association of Biochemists, December, 1921, at the New Haven meeting.
235
by guest on April 19, 2020
http://ww
w.jbc.org/
Dow
nloaded from
236 Acid-Base Metabolism. I
potential acids. All these analyses can be made with a high degree of accuracy. Iron and other elements were not analyzed because they are present in minute amounts. Organic acids and organic bases are not taken into account. If ingested or formed in the body, they may be utilized or oxidized. If excreted, their effect is shown when the minerals are analyzed. Carbonates and ammonia are omitted for the same reason. Ammonia excretion is repre- sented by an equivalent mineral acid excretion, and carbonates by a corresponding alkali excretion.
8. Terms and Calculation.-Acidity does not refer, in this study, to the true acidity as measured by the hydrogen ion concentra- tion. Milk is alkaline in respect to its minerals, but acid in reac- tion. Acid or base value means the difference between mineral acid radicals (except carbonates) and basic radicals (except am- monia) expressed in cc. of 0.1 N. A plus sign indicates acid, a minus sign indicates base. Sodium, potassium, and chlorine are monovalent; calcium, magnesium, and sulfate are divalent; phos- phate is calculated with a valence of l&--the extent to which it is neutralized in the blood.
The balance is positive when acid or base is retained, negative when they are excreted in excess of intake; when the body neither gains nor loses, it is in acid-base equilibrium. The value of acid- base metabolism is always stated in terms of base balance. Four possibilities thus occur:
1. Base retention = Positive base balance. 2. Acid excretion in excem of intake = “ “ “ 3. Base I‘ “ “ “ “ = Negative “ “ 4. Acid retention = “ “ “
Plan of Experiment.
The investigation was carried out in the Department of Pedi- atrics, the Johns Hopkins University and the wards of the Harriet Lane Home, the Johns Hopkins Hospital.
Normal acid-base metabolism was studied for 3 day periods in three male infants aged 7, 9, and 7 months, who weighed 8.8, 5.5, and 5.7 kilos. Food, urine, and feces were analyzed and the acid- base value was calculated. Then, without alteration of other conditions, in one case acid was added, and in the other two alkali, and the metabolism was again determined.
by guest on April 19, 2020
http://ww
w.jbc.org/
Dow
nloaded from
A. T. Shohl and A. Sato 237
1. Material.-As shown in the protocols, the babies had previously recovered from acute infections. The second baby was also underweight. There is no reason to believe that during the period studied their metab- olism was abnormal. For a study of normals, babies of known history who gain at a normal rate are essential. To avoid daily fluctuations and to permit accurate collections of excreta-especially the feces-the metab- olism periods should be as long as possible. Conditions should be uniform to permit the babies to attain equilibrium. The infants were placed upon the experimental diet 2 days before collection of material was begun. The diet was continued after the period until the last specimen of feces was obtained.
8. Food-The food consisted of whole milk and water mixtures with added cane-sugar-considered suitable for the babies by Dr. John How- land. The food was made up in bulk, sufficient for the whole period of the experiment. The milk was sterilized daily for 3 days and kept on ice. A sample was taken for complete analysis. All food was well taken and no feedings were vomited or regurgitated. Acid or alkali was divided into equal portions for each feeding and was added to the milk immediately before it was fed. At the first and last feedings of the experimental period, ash-free carbon was added to mark the stools. The feeding was continued until the marked stool was obtained.
3. Method of Collection.-During the period of study the babies were on a metabolism bed, similar in principle to that described by Courtney and Fales (5), but slightly modified by Dr. J. L. Gamble. Every effort was made by the nurses to insure not only complete collection of specimens, but also for the best of nursing care. It is a pleasure to acknowledge our indebtedness to Miss Hamer, Miss Vietor, and Miss Ellot for their excellent cooperation. We felt it was important for the baby to be comfortable and not constantly crying and fretting. The mattresses were so devised as to prevent exposure of the baby. The penis and not the whole scrotum was placed in an adapter attached to the collecting bottle. The buttocks were held in place over a small porcelain container and the stools, which were soft and formed, were received in it, without soiling the bed.
There was no known error in collecting the specimens. The urine was received into bottles containing 5 cc. of thymol chloroform and shaken every hour to insure contact with the preservative. The bottles were changed every 6 hours and put on ice. At the end of 24 hours the volume was measured, the bottles were rinsed with distilled water, and the urine was made up to 1,000 cc. The stools were weighed, put on ice as soon as passed, and after the end of the experimental period the baby was continued on the metabolism bed until the marked stool was obtained. The stool for the whole period was then mixed by putting it through a fine siove and made up to 1,000 cc. The container was shaken for a half hour before taking a sample. This gave a thin emulsion which could be readily pipetted and analyses showed that this method gave closely agreeing duplicates. On both the urine and stools, the ammonia, acid titration, and fatty acids were done immediately so as to preclude the gross changes due to decomposition. The ash analyses were done at leisure.
by guest on April 19, 2020
http://ww
w.jbc.org/
Dow
nloaded from

Acid-Base Metabolism. I
4. Methods of [email protected] the urine, Na and K were determined as chlorides and then as the chloroplatinates, Na being calculated by differ- ence (9). Ca and Mg.were determined by McCrudden’s method (18, 19). The Ca was ignited and weighed in platinum as CaO. The Me was precipitated as MgNHdPOb, and weighed as Mg,PtO,. The Cl was deter- mined by McLean and Van Slyke’s method (20); the NH8 by Folin and Macallum’s method (11) with aeration and nesslerization; the total N by. the Folin-Farmer (10) or by the Kjeldahl method; creatinine by Folin’s method (8); the total S by Benedict-Denis’ method (6); and the sulfate and ethereal sulfate by Folin’s method (7). The total phosphorus was ashed by Neumann’s method (21) and precipitated as molybdate and then as MgNHdPOd, and weighed as Mg,PIO, (16). The PO1 was determined by the uranium acetate method (9); the CO2 by Van Slyke’s method (31); organic acid by Black’s method (1) of setting in plaster and extracting with ether; and ash by Stolte’s method (29). The pH was determined by the calorimetric method of Clark (4); total acid excretion by the method of Henderson and Adler (15).
In the food and feces Na, K, Ca, and Mg in the ash were determined as above; NH* as above; Cl as above after ashing with carbonate; total sulfur by Folin’s peroxide method (7)and in the bomb by Sherman’s method (24); total P as above; inorganic P by the micro method of Marriott and Haessler (17); CO2 as above; fatty acid by Saxon’s method (23) and Black’s method (l), and titration value by the method of Shohl and Marriott (28). pH studies by the electrometric method were begun but not completed on ac- count of the war.
All the usual precautions of analytical procedure were used. All analyses were done in duplicate or triplicate. The weights were calibrated against Bureau of Standards weights; the volumetric ware was calibrated, all solutions were standardized, all methods checked against known amounts of pure substances, and blanks run on the materials.
6. Discussion of Methods and Errors.-The value of the deductions de- pends largely upon the sum of the errors of all methods. Calcium is an important example, for in the food it is 517/1,100, and in the stool it is 366/477 of the base. A 25 cc. sample of milk was taken, the probable error of the determination was 0.3 mg. in 43.4 mg., or 0.6 per cent. The total value, 517 cc., is therefore accurate, *3 cc. of 0.1 N. The errors of the other methods have been evaluated in the same way. The square root of the sum of the squares gives the probable error as 8.5 cc. of 0.1 N for the food; 8 cc. of 0.1 N for the urine; and 7 cc. of 0.1 N for the feces. The probable error of the base balance is then 13 cc. of 0.1 N-any value greater than that is outside the experimental error.
To the errors of the analyses must be added those of sampling, of collect- ing specimens, errors inherent in metabolism methods, loss by perspiration, error of feeding, etc. In all probability the largest error is due to individual variation. Such factors can be reckoned only when enough statistics are available. The total error can at present be but roughly approximated.
by guest on April 19, 2020
http://ww
w.jbc.org/
Dow
nloaded from

A. T. Shohl and A. Sato 239
Results.
Of the eight metabolism periods studied, four are here discussed The other four were rejected because the data were not so complete nor accurate and because the sample of milk used was not analyzed. All data are given in Tables VIII and IX.
The data for this study comprise: Period I, Baby A, age 7 months, weight 8.8 kilos, on a normal diet; Period II, Baby A on the same diet, plus 250 cc. of 0.1 N HCl; Period III, Baby B, age 9 months, weight 5.5 kilos, on a normal diet; Period IV, Baby B on the same diet, plus the equivalent of 473 cc. of 0.1 N
NaHC03. Analysis of Food.-That milk is an alkaline food is generally
known from determinations by Sherman and Sinclair (26), and Sherman and Gettler (25). They analyzed the separate acids and bases and calculated their values in terms of normal solutions. They conclude that cow’s milk has an alkali value of 237 cc. of 0.1 N per 1,000 gm. When this is recalculated, with the valence of 1.8 for phosphorus, the value is 422 cc. of 0.1 N per liter. Forbes (12) also calculated the value of milk, using Konig’s analyses, and found a value of 203.1 cc. of 0.1 N alkali per 1,000 gm. of dry substance. Calculated as whole milk, this equals 425 cc. of 0.1 N base per 1,000 gm. of milk.
Table I shows the ash values of the several samples of milk used in our experiments, the values of Konig, referred to above, Sherman’s figures, and the latest figures from Forbes and co- workers (13). Forbes’ are included because they are probably the best extant and also to show how milk analyzed by the same technique in the same laboratory may vary and at times be acid.
The calculation of the ash value of milk raises several questions. Both Sherman and Forbes calculate the valence of phosphate at 2. At the pH of the blood, 7.4, the valence is 1.8, which value has been used in our calculations. In the second place, neither phos- phorus nor sulfur is completely oxidized in the animal body, so it is not correct to assume that they form entirely HzS04 and HsPOr. The exact value to be assigned to them is difficult to ascertain, cer- tainly subject to revision. We have assumed, lacking proper data, that they are burned in the stool in the same proportion as in the urine; the error cannot be large and an approximation is neces-
by guest on April 19, 2020
http://ww
w.jbc.org/
Dow
nloaded from

240 Acid-Base Metabolism. I
TABLE L-Acid-Base Val,
Amount.
Ash. ... .e .... N ............. ca ........... Mg ........... Na ........... K ... ..- .......
Base . . . . . .
P Pb; : : : : : : : : : :
S so; : : : : : : : : : :
Cl. , . . . . .
Acid. . . . . .
Kiinig.
Per 1.000 gm.
om. cc. 0.1 N
1.15 575 0.112 92 0.436 190 1.47 377 --
-1,234 -- 0.825 480
0.072 45
1.00 284 --
+809 -___
Balance.. . . . . . . .I -425
-
I
-
1
-
Sherman.
Per 1,000 gm.
om. cc. 0.1 N
1.24 620 0.11 92 0.69 300 1.54 395
0.92
0.31
0.91
-1,407
535
194
256
+985
-422
._
-
-
Forbes I.
Per 1.000gm.
gm. I cc.o.1 N
1.000 504 0.131 109 0.376 180 1.410 362 -~
-1,155 -- 0.858 498
0.266 163
0.954 268 --
+929
-226
_
-.
-
I
-
1
-
Forbes II. F&m III.
Per 1,000 gm Per 1,000 gm.
um. cc. 0.1 N om. cc. 0.1 I
1.321 660 0.873 43 0.163 136 0.150 12 1.094 475 0.334 14 0.984 252 1.169 29
-- -- -1,523 -1,0a
-- ~- 1.035 603 0.803 46
0.471 295
1.748 491 --
+1,389 ~-
- 134
0.419 26
1.669 47 --
+1,19 --
+1c
* The values are calculated with the valence of phosphorus at 1.8. In determining the value for metabolism periods, the fraction phosphorus burned to phosphates was estimated at 90 per cent and the fraction of sulfur burned at 85 per cent.
t Values not used in calculation of acid value.
sary. Sherman and Gettler have correctly subtracted the non- sulfate sulfur in the urine in calculating the acid value in their metabolism experiments, but do not subtract it in the value assigned to the milk. For our purposes, we have used the propor- tion of inorganic sulfate as determined in our metabolism periods -90 per cent for dhosphorus and 85 per cent for sulfur.
The present analyses agree satisfactorily with those cited. The calcium and phosphorus are each slightly high in one instance. The magnesium, sodium, and potassium are quite average. The sulfur seems high, but is within normal limits. Our figures show that in each 1,000 gm. of milk there are 1,325 cc. of alkali and 1,100 cc. of acid, as burned by the body. Of the alkali, the calcium is 55 per cent; and of the acid, the phosphate is 45 per cent. The value per 1,000 gm. of milk is 233 and 202 cc. of 0.1 N alkali.
by guest on April 19, 2020
http://ww
w.jbc.org/
Dow
nloaded from
A. T. Shohl and A. Sato 241
70~‘s Milk. -
_-
- - Per:od I. Period III. Period II.’ Period I.* Period 111.’ Period IV.*
833 oo. 833 co. 567 00. 567 cc.
0m.
6.202 4.27 1.031 0.123 0.422 1.183
cc. 0.1 N OWL
6.902
co.1 N am. cc. 0.1 N
4.620 2.73 0.775 388 0.072 60 0.310 135 0.785 201 --
-784 -- 0.505 2931
269 0.279 1741
150 0.545 154
+573 ~-
-211
0112. cc.O.1 N
6.760
517 103 183 304
473
--
_ 0.804
0.400
0.788 _
468, 418 250' 212 222 1.65( 250
-- +852
_
- -255 -5
-- -684
Per 1,000 gm. IPer 1,000 gm.
w. cc. 0.1 N
24 620 154 128 508 220 42 366 -
-1,334 -~ 973 565
481 301
945 266 -____
+1,132
_.
- _
-_
-
0m. cc. 0 1 N
1.34 625 0.123 103 0.530 230 1.36 348
0.871
0.478
0.950
-1,306
506
299
268
+1,073
-202 -233
Metabolism of Acids and Bases.
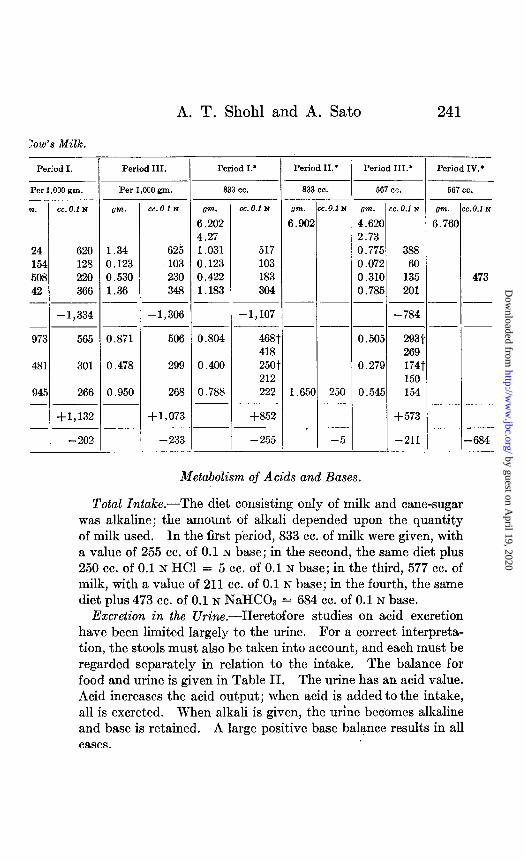
Total Intake.-The diet consisting only of milk and cane-sugar was alkaline; the amount of alkali depended upon the quantity of milk used. In the first period, 833 cc. of milk were given, with a value of 255 cc. of 0.1 N base; in the second, the same diet plus 250 cc. of 0.1 N HCl = 5 cc. of 0.1 N base; in the third, 577 cc. of milk, with a value of 211 cc. of 0.1 N base; in the fourth, the same diet plus 473 cc. of 0.1 N NaHCOz = 684 cc. of 0.1 N base.
Excretion in the Urine.-Heretofore studies on acid excretion have been limited largely to the urine. For a correct interpreta- tion, the stools must also be taken into a.ccount, and each must be regarded separately in relation to the intake. The balance for food and urine is given in Table II. The urine has an acid value. Acid increases the acid output; when acid is added to the intake, all is excreted. When alkali is given, the urine becomes alkaline and base is retained. A large positive base balance results in all cases.
by guest on April 19, 2020
http://ww
w.jbc.org/
Dow
nloaded from
242 Acid-Base Metabolism. I
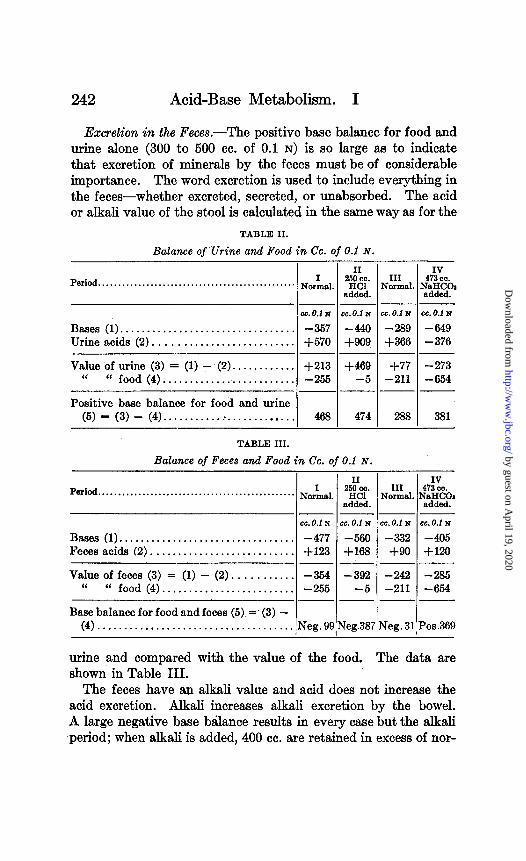
Excretion in the Feces.-The positive base balance for food and urine alone (300 to 500 cc. of 0.1 N) is so large as to indicate that excretion of minerals by the feces must be of considerable importance. The word excretion is used to include everything in the feces-whether excreted, secreted, or unabsorbed. The acid or alkali value of the stool is calculated in the same way as for the
TABLE II.
Balance of Urine and Food in Cc. of 0.1 N. T
Period.. . . . . . . . . . . , . . , . . . . . . . . . . . . . . . . . . . . . . . . . , .. . . . NorLal
cc. 0.1 N
II
“% III
NClrld added.
-- cc.o.1 N cc. 0.1 N
-440 -289 +QOQ +366
Bases (1). . . . . . . . . . . . . . . . . . . . . . . . . . . . . . . . . -357 Urine acids (2) . , . . . . . . . . . . . . . . . . . . . . . . . . +570
Value of urine (3) = (1) - (2). . . . . . . . . . . . +213 “ “ food (p). . . . . . . . . . . . . . . . . . . . . . . . . -255
Positive base balance for food and urine (5) = (3) - (4). . . . . . . . . . . . . . . . . . . . . . . . . . 468
TABLE III.
cc. 0.i N
-649 - 376
+469 +77 -5 -211
--
-273 -654
474 288 381
Balance of Feces and Food in Cc. of 0.1 N.
Pa&d.. . . . . . . . . . . . . . . . . . . . . . . . . . . . . . . . . . . . . . . . . . . . . . .
Bases (1). ................................ Fecesacids (2) ...........................
Value of feces (3) = (1) - (2). .......... “ “ food (4). ........................
NOL
cc. 0.1 i-l cc. 0.f N
-477 -566 +123 +168
-354 -392 -255 -5
II
“% added.
IV III 473 cc.
Normal. N;FIF
-- cc. 0.1 N cc. 0.1 N
-332 -405 +Qo +120
-- -242 -285 -211 -654
Base balance for food and feces (5) =’ (3) - (4). . . . . . . . . . . . . . . . . . . . . . . . . . . . . . . . . Pos.369
urine and compared with the value of the food. The data are shown in Table III.
The feces have an alkali value and acid does not increase the acid excretion. Alkali increases alkali excretion by the bowel. A large negative base balance results in every case but the alkali period; when alkali is added, 400 cc. are retained in excess of nor-
by guest on April 19, 2020
http://ww
w.jbc.org/
Dow
nloaded from

A. T. Shohl and A. Sato 243
ma1 and the balance becomes positive. The action of the bowel is, in the main, just the opposite of that of the kidney. The kidney normally excretes the acid elements in excess. The bowel excretes the alkali in excess. Added acid is excreted almost wholly by the kidney. Added alkali is excreted partly by the kidney and partly by the bowel.
The bowel acts in maintaining neutrality of the body by remov- ing alkalies. When excessive alkali is given, the amount of the output is increased. Whether the bowel can also serve as an emergency factor in excreting excess acid remains yet to be proved. For in the case given above, even after acid was added, the food was still neutral (- 5 cc. of 0.1 N). Analyses of the stool in acidosis give reason to believe that the bowel can also act in excreting acid.
TABLE IV.
Base Balance per Day.
II IV Period.. . . . . . . . . . . . . . . . . . . . . . . . . . . . . . . . . . . . . . . . . . . Not,,,sl, “~~~ N,,ilA,,l. &!&
added. added. ’ --
cc.O.lri cc.O.1i-i CC.O.fN CC.O.lN
Value of urine Q); . . . . . . . . . . . . . . . . . . . . . .,. +213 +469 +77 -273 “ “ feces (2). . . . . . . . . . . . . . . . . . . . . . . -354 -392 -242 -285
-- -- Value of output (3) = (1) - (2). . . . . . . . . . . . -141 ,+77 -165 -553
“ “ food (4). . . . . . . . . . . . . . . . . . . . . . . . -255 -5 -211 -684 --_-
Positive base balance (5) = (3) - (4). . . . . 114 82 46 126
It has been claimed that the main changes taking place in the bowel are due to bacterial action and, therefore, do not represent any adequate picture of what the body has absorbed or excreted. Such reasoning forced us to the present method of study which eliminates organic acids formed by bacteria. Bacteria do not make sodium or sulfur; but they may make sulfate into sulfur, or sulfur into sulfate. Fortunately for the outcome of the work, the proportion due to sulfur and phosphorus in the stool is so small in comparison to the bases that this becomes quantitatively a minor problem. Future work may modify the picture, but cannot greatly change it.
Bme Balance .-The data necessary for determining base bal- ance are given in Table IV. The combined acid excretion of the urine and feces is compared with the value of the food.
by guest on April 19, 2020
http://ww
w.jbc.org/
Dow
nloaded from

244 Acid-Base Metabolism. I
We can draw the conclusions: (1) A positive base balance results in all cases. (2) Acid decreases the positive base balance. When 250 cc. are given, the balance is diminished one-third; 32 cc. of acid are retained, one-seventh of the intake. (3) Alkali increases the positive base balance. When 473 cc. are given, the balance is increased twofold; 80 cc. of alkali are retained, one-sixth of the intake. (4) On the milk diet, the output is alkaline in value; but when acid is added to the milk, the output is acid.
Normally a retention of base must occur. The body fluids are alkaline; if their alkalinity is to be preserved, base must be stored in growth. Depletion of the alkali stores causes acidosis; increase, an alkalosis. As is to be expected, the figures show a smaller base retention when acid is given and a larger retention when alkali is given. The average base retention is approximately 75 cc. of 0.1 N base per baby per day.
TABLE V.
Base Balance per Kilo per Day in Cc. of 0.1 N.
Period. I . . . . . . . . . . . . . . . . . . . . . . . . . . . . . . . . . . . . . . . . . . . . . . . . Normal.
cc. 0.1 N
Value of food (2). . . . . . . . . . . . . . . . . . . . . . -28 u “ output (1). . . . . . . . . . . . . . . . . . . . -16
Positive base balance (3) = (1) - (2). . . 12
II
“%? added.
--
cc. 0.1 N cc. 0.1 N cc. 0.1 N
-0.5 -38 -124 -1;g.o -30 -101
-- 9.5 8 23
A more accurate comparison is made if the retention is calculated in relation to body weight. Baby A weighed 9.0 kilos at the end of the experiment, and Baby B, 5.5 kilos. On the per kilo basis, the values are given in Table V. ‘The positive base balance on a normal diet is in one case 12 cc., and in the other 8 cc. per kilo per day.
This method of computation can be applied to values given in the literature, if the milk, urine, and feces have been analyzed completely and by approved methods. Four studies are available. Blauberg studied a baby on cow’s milk (2). The baby was 7+ months old and weighed 7.15 kilos. He gained 21.9 gm. daily. Negative balances of sodium, sulfur, and chlorine occur, although the baby was gaining in weight. Losses of sulfur and chlorine in ashing the milk probably account for these negative balances.
by guest on April 19, 2020
http://ww
w.jbc.org/
Dow
nloaded from
A. T. Shohl and A. Sato
If Forbes’ or our values for the milk be substituted, the balances become positive. The calcium, too, seems slightly high and the magnesium slightly low. To the value obtained, the values of the negative retention have been added on the assumption that the intake figures are too low, at least by that amount. The results show a retention of 26 cc. of 0.1 N alkali per kilo per day. If a normal retention of phosphorus and sulfur occurred, the retention would be less alkaline, and would approximate that of the follow- ing cases.
The breast-fed baby studied by Blauberg (3) was 42 months old, weighed 6.7 kilos, and gained 10 gm. daily. The results are more uniform and the retention calculated in acid-base value is 52 cc. of 0.1 N base, or 8 cc. of 0.1 N alkali per kilo per day.
The breast-fed baby of Tobler and No11 (30) was 24 months old, weighed 4.0 kilos, and gained 25 gm. daily. The metabolism resulted in a positive base balance of 75 cc., or 18.2 cc. of 0.1 N per kilo. This is larger than for the baby studied by Blauberg; but the gain in weight was proportionally greater. Also, ev,en though the baby was smaller, he took more food. Therefore, it is proba- ble that the difference in the base balance of the two babies repre- sents a corresponding difference in their metabolism.
Sawyer, Baumann, and Stevens (22) have made a metabolism study on two boys aged 5 and 8 years, weighing 22.7 and 23.0 kilos. We have recalculated their figures, not considering NH, as an alkali, and have computed the acid-base value of the food which they analyzed. The figures for the normal periods resolve into a positive base balance of 10.0 and 14.5 cc. of 0.1 N alkali per kilo per day. Of course, the children are older; however, the base balance is nearly the same as for infants.
In our study the base balance was reduced from 12.0 to 9.5 cc. of 0.1 N when 250 cc. of HCl were given. The base balance was increased from 8 to 23 cc. of 0.1 N when 473 cc. of NaHC03 were given. No data are available .with which the acid and alkali periods can be compared. There is, however, the study of Sawyer, Baumann, and Stevens. They have, in the same two children studied during normal periods, determined the effect on mineral metabolism of acidosis produced by high fat feeding. Clinical symptoms of acidosis were produced. The alkali reserve, nor-
by guest on April 19, 2020
http://ww
w.jbc.org/
Dow
nloaded from

246 Acid-Base Metabolism. I
mally 50 and 49 volumes per cent, was reduced to 29 and 37 vol- umes per cent. Calculation of the mineral metabolism shows that in the first case the positive base balance of 10.0 cc. of 0.1 N was changed to a negative base balance of 0.8 cc. of 0.1 N; in the second, the positive base balance was reduced from 14.5 to 6.0 cc. of 0.1 N. The increase or decrease in the base balance shows the development of alkalosis and acidosis.
To calculate the base retention compared to the gain in weight would be desirable. The actual gain, however,-50,33,10, and 20 gm. per day-seems too small in comparison to the errors in weigh- ing and the errors caused by a full bladder or rectum, so that accurate calculation cannot be made. The base balance calculated in relation to ash retention-the number of cc. of 0.1 N base re- tained per gm. of ash retained-is shown in Table VI.
TABLE VI.
Ash Balance.
II IV - Period . . . . . . . . . . . . . . . . . . . . . . . . . . . . . . . . . . . . . Nofmal. 250 cc. III 473 co.
HCI Normal. added. NgBd:?
---- Positive ash balance, p-n.. . . . . . . . . 0.753 0.515 0.565 0.291
“ base balance per gm. of ash balance, ‘cc. . . . . . . . . . . . . . . . . 150 158 82 430
For each gram of ash retained in a normal period, approximately 100 cc. of 0.1 N base are retained. Acid does not change greatly the character of the salt retained, but alkali makes the retention five times as alkaline as normal. The nitrogen metabolism studied in conjunction with the mineral balance is an aid in interpretation. A positive nitrogen balance indicates the extent of protein storage. If we assume that 1 per cent of body protein is sulfur, then daily 0.03 gm. of non-sulfate sulfur is stored. This sulfur has acid value only when it is burned during protein catabolism. Phos- phorus must be similarly stored in non-acid form for nucleotides and phosphatides. Hence in calculating the value of sulfur and phosphorus for retention, the neutral portions must be determined and deducted.
by guest on April 19, 2020
http://ww
w.jbc.org/
Dow
nloaded from

A. T. Shohl and A. Sato 247
Neutral Salt E$ect.- The salts in cow’s milk total more than twice those of breast milk. This has been given .as one of the reasons for diluting milk in infant feeding. The actual retention of salts is nearly the same, but the percentage of retention is much greater for breast milk; therefore, the German pediatricians have tacitly assumed that the salts of milk form a luxus consump- tion and are utilized in respect to their needs. A positive base balance does not imply that no acid radicals are retained, but only that basic radicals are retained in excess. A positive balance results if either alkali is retained or acid excreted: but as salt
TABLE VII.
Alkdi.
Period.. . . . . . . . . . . . . . . . . . . I II III IV I ----- .
,’
i ii. g B 62 1 $3 1 2 a-0
old 8-u s 2 5” B ---
Value of food (1). . . -1,107 -1,107 -784 -1,257 +85: “ “ output (2). -824 -1,000 -621 -1,054 +69:
----- Value of retention
(3) = (1) - (2).. . -283 -107 -163 -203 +15C
Acids.
II I III I IV
fl) 104 +573 +573 j-1,077 +456 +496
--
+27 +117. f77
retention determines the relation of alkali to the neutral salts, or to the osmotic pressure, effect on the body is quite different. The simple statement of this effect is included in Table VII.
In the acid period both fewer acid radicals and fewer alkali radicals are retained than in the normal period (and the sum of the two results in a smaller positive base balance). More neutral salts are therefore excreted and the salt retention is less than normal. In the alkali period, however, more alkali radicals and fewer acid radicals are retained than normal. The alkali radicals replace the acid radicals in the body.
by guest on April 19, 2020
http://ww
w.jbc.org/
Dow
nloaded from

TABL
E VI
II.
Acid
-Bas
e Va
lue
of
Urin
e.
Perio
d..
. . .
. . .
. . .
. . ,
. . .
. I
II IV
NO
IQld.
25
0 oc
. 0.1
N
III NO
rId.
473
oc.
0.1
N H
Cl
adde
d. Na
HCO
aadd
ed.
NOJd
Qn.
cc.
0.1
N Pm
. cc
. 0.1
N
gm.
cc.
0.1
N gm
. cc
.o.1
N gm
. cc
. 0.1
N
Amou
nt.
......
....
495
735
510
500
586
Ash.
. ...
......
...
3.15
3 3.
306
2.18
6 4.
474
3.18
pH
.....
......
.....
6.1
6.0
6.4
8.2
6.f
Tit&
able
ac
id.
...
100
137
38
41
58
NH,
......
......
. 0.
224
160
0.52
4 37
4 0.
174
124
0.05
2 37
0.
146
105
N ...
......
......
.. 3.
40
3.66
1.
89
1.96
1.
88
NH8
- NI
P eT
cen
t.....
5.7
14.3
9.
2 0.
03
8.3
g O
rgan
ic ac
id.
.....
70
co2
......
......
...
5 6
29
309
Cre
atin
ine
......
. .0
.118
0.
129
0.07
8 0.
082
0.07
2 --
--
----
--
Ca
......
......
.. .0
.017
9
0.02
2 11
0.
026
13
0.02
1 10
0.
078
39
Mg
......
......
...
0.01
8 15
0.
018
15
0.02
3 19
0.
005
4 0.
016
14
Na
......
......
...
0.30
0 13
1 0.
475
206
0.30
8 13
4 1.
137
494
0.58
5 25
3 K
......
......
....
.0.7
85
202
0.81
3 20
8 0.
478
123
0.55
0 14
1 0.
475
121
----
---~
--
Base
s (1
). ...
......
-3
57
-440
-2
89
-649
-4
27
.----
----
--
P ...
......
.. PO
;::.
.0.4
57
0.54
4 ...
......
.. 0,
441
256
0.52
2 32
0 0.
270
157
0.26
0 15
0 0.
371
216
S .
Eth&
ea;
SO,.
......
......
.. 0.
241
0.26
0 0.
147
0.15
3 0.
011
0.00
2 0.
006
NO
&d.
VII
VIII
60
0 cc
. 0.
1 N
H
C1
adde
d.
300
cc.
0.1
I N
aEC
Oa
adde
d.
gm.
cc.
0.1
N gm
. cc
.o.1
N gm
. cc
. 0.1
N
510
457
1.77
6 2.
664
2.86
6.
8 8.
4 8.
6 43
18
0 91
).2
40
171
0.43
0 30
1 0.
376
269
..92
2.14
1.
68
.2.4
84
56
I.086
0.
094
0.09
7 ---
__--
1.02
2 11
0.
017
9 0.
033
16
1.01
2 10
0.
015
13
0.01
4 12
1.
182
79
1.52
’ 66
1 0.
731
318
I.539
13
8 0.
515
132
0.52
6 13
5 --
----
-2
38
-815
-4
81
----
--
1.34
7 20
2 0.
3331
95
0.31
6 18
4
,
by guest on April 19, 2020
http://ww
w.jbc.org/
Dow
nloaded from

Inor
gani
c SO
,. .
. . .
0 ,2
08
0.21
4 0.
126
0.13
2 0.
096
0.09
8 0.
096
0.08
0 To
tal
SO,.
. . .
. . .
. . 0
.206
13
0 ox
225
134
0.12
8 79
0.
138
86
60
61
59
50
Cl
. .
. .
. .
. . .
. . .
. . .
0.6
57
184
1.61
5 45
5 0.
454
130
0.52
8 14
0 1.
20
340
0.40
6 11
4 0.
437
123
0.26
7 75
~~
~~-~
__---
-----
Acid
s (2
). . .
. .
. .
. .
+570
+9
09.
+366
-f-
376
+616
+3
77
+377
+3
09
----
-A--
----
----
Bala
nces
(3
) =
(1)
- (2
). . .
. .
. .
j-2
13
+469
+7
7 -2
73
+189
+.
139
-438
-
172
by guest on April 19, 2020
http://ww
w.jbc.org/
Dow
nloaded from

TABL
E IX
.
Acid
-Bas
e Va
lue
of F
eces
an
d Ba
se
Bala
nce.
Perio
d II
IV
NorlL
. !2
33 c
c. 0.1
N
VIII
NEl.1
. V
VI
. . .
. . . .
. . .
. . .
. . .
. . .
. . .
. . .
. . .
473
oe.
0.1
N HC
I ad
ded.
6oo:I
o 1N
Na
FfCO
t ad
ded.
Norm
s’.
Norm
al.
HC
l a.d
&d.
Nt%
k&%
~.
gm.
cc. 0
.1 N
gm.
cc. 0
.1 N
gm.
cc.o
.1
N gm
. cc
. 0.
f N
gm.
o.“l”
;, m
a. &
!3m
. &
gm.
0.Z
Ash
. . .
. .
. . .
. . .
. . .
. . .
. . .
. . 2
.296
3.
081
1.51
3 2.
015
0.89
6 1.
556
2.08
6 1.
899
N . .
. . .
. . .
. . .
. . .
. . .
. . .
. .
. . .
0.28
5 0.
385
0.18
0.
24
Tit&
able
al
kali..
.
. .
. . .
. .
32
93
70
67
80
100
166
126
Fatty
ac
id..
. . .
. . .
. . .
. . .
. . .
250
220
69
100
---
----
--
--
-___
___
Ca
. .
. .
. .
. . .
. . .
. . .
. . .
. . .
. .
0.73
4 36
6 0.
865
434
0.52
5 26
3 0.
702
350
0.65
2 32
60.6
75
3380
.693
34
71.0
22
514
h)M
g .
. .
. . .
. . .
. . .
. . .
. . .
. . .
. .
0.06
0 50
0.
081
67
0.05
2 43
0.
014
11
0.03
0 25
0.04
3 36
0.05
5 46
0.04
0 33
$
Na.
. .
. . .
. . .
. . .
. . .
. .
. . .
. . ,0
.079
34
0.
073
32
0.02
5 11
0.
063
28
0.04
1 18
0.03
3 14
0:06
5 28
0.02
8 12
K
. .
. .
. .
. .
. . .
. . .
. . .
. . .
. . .
.0.1
04
27
0.10
4 27
0.
060
15
0.06
3 16
3.
047
120.
127
330.
165
420.
085
22
----
- ~-
----_
_----
Ba
se
(1).
. .
. . ,
. . .
. . .
. . .
. . .
-477
-5
60
-332
-4
05
-381
-4
21
-463
-5
81
-~--
----
----
--_
_-
P .
. . .
. .
. . .
. . .
. . .
. . .
. . .
. 0.
210
0.14
0 0.
143
0.18
0 PO
;. . .
. .
. .
. . .
. . .
. . .
. . ,
. . .
10
9 73
75
94
10
0 10
0 S
100
100
. .
. . .
. .
. .
. . .
. . .
. . .
. . .
. . .
0.
014
0.01
9 so
, .
. . .
. .
. . .
. . .
. . .
. . .
. . .
. 10
10
10
12
10
10
10
10
C
l .
. .
. . .
. .
. .
. . .
. . .
. . .
. . .
. 0.0
14
4 0.
302
85
0.01
8 5
0.04
9 14
0.
032
90.0
38
110.
040
110.
053
15
-~---
---
-__-
--
---
Acid
(2
). . .
. . .
. . .
. . .
. . .
. . .
+1
23
+168
+9
0 +1
m
+119
+1
21
+121
+m
--
----
----
- --_
_-__
Fe
ces
bala
nce
(3)
= -
cl)
- (2
). .
. .
. .
. . .
. . .
. . .
. . .
-354
-3
92
-242
-2
85
-262
-3
00
-342
-4
56
by guest on April 19, 2020
http://ww
w.jbc.org/
Dow
nloaded from

Sine
ba
lanc
e (4
) (fr
om
Tabl
e VI
II).
. . .
. . .
. . .
. .
Zxcr
etio
n (5
) =
(3)
+ (4
): ‘o
od
valu
e (6
) (fr
om
Tabl
e I).
.
. .
. .
. . .
. . .
. . .
Posit
ive
base
ba
lanc
e =
(6)
- (5
) .
. .
. . .
. * .
. . .
. .
Posit
ive
base
ba
lanc
e pe
r kil
o .
. .
. .
. . .
. . .
. . .
. . .
. .
1213
--
-1
41
-
-I _-
-
-273
--
-
-558
-255
--
-469
i-77 -5
+77
--
-165
-211
--
-6
84
---
114
82
46
126
12.7
9.
1 8.
< 23
.0
I . . _.
- -172
-628
by guest on April 19, 2020
http://ww
w.jbc.org/
Dow
nloaded from

252 Acid-Base Metabolism. I
CONCLUSION.
Base balance defines a new physiological constant. Just as the nitrogen requirement can be definitely calculated, the acid-base requirements can be evaluated and the limits of normal defined. This is especially important in early life when normal growth must require its quota’of alkali. Estimation of the base balance is significant in such diseases of metabolism as acidosis, rickets, and tetany, and should provide us with a new view-point as to their pathological physiology.
SUMMARY.
1. A method of measuring base balance is outlined. 2. In babies under 1 year the normal positive base balance is
10 cc. f 2 cc. of 0.1 N per kilo per day. 3. Acid or alkali when added also affect the character of the salt
retention. Acid causes a smaller salt retention than normal, and alkali causes a salt retention approximately normal in amount, but more alkaiine in substance.
4. Acid or alkali when added are retained to about one-seventh or one-eighth. The excretion of added acid is by way of the kid- ney; of added alkali, partly by the kidney and partly by the bowel. 250 cc. of 0.1 N HCI lower the positive base balance from 12.0 to 9.5 cc. of 0.1 N per kilo; 473 cc. of 0.1 N NaHC03 raise it from 8.0 to 23.0 cc. of 0.1 N per kilo.
It is a pleasure to acknowledge the assistance of Dr. John How- land and Dr. W. McKim Marriott under whose direction this work was conducted.
Protocols.’
Baby A. Period I. Baby received food specially prepared and analyzed in laboratory, beginning Jan. 17. Five feedings of 225 cc. each. The feeding consisted of whole milk, 833 cc., water, 292 cc., and cane-sugar, 56 gm., equivalent to 85 calories per kilo. Baby weighed 8.8 kilos. Put on metabolism bed at 1 p.m., Jan. 10. The carbon was put into the 6 p.m. feeding and th-: urine collected from that time. The stools were obtained as follows: 3 and 8 a.m., rejected; 2 p.m., part containing carbon retained; 4 and 8 p.m., Jan. 20; 4, 6, and 8 p.m., Jan. 21; 6 and 8 a.m. and
1 The clinical histories are omitted at the request of the editors.
by guest on April 19, 2020
http://ww
w.jbc.org/
Dow
nloaded from

A. T. Shohl and A. Sato
5.30 p.m., Jan. 22; 12 and 2 p.m., Jan. 23. The 6 p.m. stool contained the carbon given at 6 p.m. the day before, when the urine sample was complete. The weight of the eleven moist stools was 95 gm. The urine was divided in 24 hour samples: 510, 480, 480, and 510 cc. Average, 495 cc. of urine per day. There were no known errors. Removed from frame 2 p.m., Jan. 23. Weight 8.95 kilos.
Baby A. Period II.-Same baby as in Period I. Weight 8.9 kilos. Jan. 24, 1917 put on frame at 2 p.m. Same feeding as in previous period. To this was added HCl. The feeding was divided in two portions and the equivalent of 50 cc. of 0.1 N acid in 15 cc. of fluid was added to the first por- tion and fed at once to the baby. The second portion was used to rinse the flask in which the acid had been and then given to the baby. The feeding was well taken. There were no signs of hyperpnea. At 6 p.m., Jan. 25, carbon was given and the collection of specimens begun. At 10 p.m. the acid was omitted by mistake, but given at 2 a.m. with half of the morning bottle. Jan. 26, 6 a.m., half the usual feeding, plus 50 cc. of 0.1 N HCl. The baby is pale and the ears are discharging freely. Jan. 27, ears better. Baby in good condition. Respirations 60. Carbon given at 6 p.m. Last marked stool obtained at 11.40 a.m., Jan. 28. At 2 p.m. baby vomited about an ounce of feeding. As the stool had been previously obtained, the experi- ment was stopped and that day’s urine rejected. 8 p.m., temperature 103“ F. Stools obtained at 6 p.m. (partly marked with carbon); Jan. 27,1 a.m., 12 n., 2 and 6 p.m.; Jan. 28, 11.40 a.m., part marked with carbon. Total moist weight 72 gm. Urine Jan.: 570,712, and 760 cc. Weight 9.0 kilos.
Baby B. Period llZ.-The experiments were conducted exactly as in Periods I and II. Mar. 12, baby put on frame at 2 p.m. Weight 5.5 kilos. Feeding consisted of milk, 585 cc., water, 315 cc., cane-sugar, 45 gm. Five feedings of 180 cc. each. Baby off frame at 10 a.m. on Mar. 16. Carbon stool obtained. No known errors. Weight 5.53 kilos.
Baby B. Period IV. This period was begun at 6 p.m., Mar. 16. In this period 3.97 gm. of NaHCOs in 50 cc. solution were given each day- 2 cc. in each feeding. Weight at beginning 5.45 kilos. Mar. 20, carbon stool obtained. Weight 5.5 kilos.
BIBLIOGRAPHY.
1. Black, 0. F., The detection and quantitative determination of & oxybutyric acid in the urine, J. Biol. Chews., 1908-09, v, 207.
2. Blauberg, M., Experimentelle Beitrjige zur Frage tiber den Mineral- stoffwechsel beim kiinstlich ernahrten Siiugling, 2. Biol., 1900, xl, 1.
3. Blauberg, M., Ueber den Mineralstoffwechsel beim natiirlich er&hrten Sliugling, 2. Biol., 1900, xl, 36.
4. Clark, W. M., The determination of hydrogen ions, Baltimore, 1920,317. 5. Courtney, A. M., and Fales, H. L., A comfortable arrangement for the
separate collection of urine and feces of male infants, Am. J. Dis. Child., 1915, x, 410.
by guest on April 19, 2020
http://ww
w.jbc.org/
Dow
nloaded from

Acid-Base Metabolism. I
6. Denis, W., The determination of total sulphur in urine, J. Biol. Chem., 1910, viii, 401.
7. Folin, O., Sulphate and sulphur determinations, J. Biol. Chem., 1905, i, 131.
8. Folin, O., On the determination of creatinine and creatine in urine, J. Biol. Chem., 1914, xvii, 469.
9. Folin, O., Laboratory manual of biological chemistry, New York and London, 2nd edition, 1920, 177.
10. Folin, O., and Farmer, C. J., A new method for the determination of total nitrogen in urine, J. Biol. Chem., 1912, xi, 493.
11. Folin, C., and Macallum, A. B., On the determination of ammonia in urine, J. Biol. Chem., 1912, xi,‘523.
12. Forbes, E. B., The balance between inorganic acids and bases in animal nutrition, Ohio Agric. Exp. Station, Bull. 907, 1909, 23.
13. Forbes, E. B., Schulz, J. A., Hunt, C. H., Winter, A. R., and Remler, R. F., The mineral metabolism of the milch cow, J. Biol. Chem., 1922, lii, 231.
14. Hawk, P. B., Practical physiological chemistry, Philadelphia, 6th edition, 1918, 579.
15. Henderson, L. J., and Adler, H. M., The measurement of the alkali retention of the kidney, J. Biol. Chem., 1909, vi, p. xxxviii.
16. Hibbard, P. L., The Pemberton-Kilgore method for the determination of phosphoric acid, J. 2nd. and Eng. Chem., 1913, v, 998.
17. Marriott, W. McK., and Haessler, F. H., A micro method for the determination of inorganic phosphates in the blood serum, J. Biol. Chem., 1917, xxxii, 241.
18. McCrudden, F. I-I., The quantitative separation of calcium and mag- nesium in the presence of phosphates and small amounts of iron devised especially for the analysis of foods, urine and feces, J. Biol. Chem., 1909-10, vii, 83, 201.
19. McCrudden, F. H., The determination of calcium in the presence of magnesium and phosphates: The determination of calcium in urine, J. Biol. Chem., 1911-12, x, 187.
20. McLean, F. C., and Van Slyke, D. D., A method for the determination of chlorides in small amounts of body fluids, J. Biol. Chem., 1915, xxi, 361.
21. Neumann, A., Einfache Veraschungsmethode (Sliuregemisch-Ver- aschung) und Vereinfachte Bestimmungen von Eisen, Phosphor&ire, Salzsaure und anderen Aschenbestandtheilen unter Benutzung dieser Sauregemisch-veraschung, Z. physiol. Chem., 1902-03, xxxvii, 115.
22. Sawyer, M., Baumann, L., and Stevens, F., Studies of acid production. II. The mineral loss during acidosis, J. Biol. Chem., 1918, xxxiii,lO3.
23. Saxon, G. J., A method for the determination of the total fats of undried feces and other moist masses, J. Biol. Chem., 1914, xvii, 99.
24. Sherman, H. C., The determination of sulphur and phosphorus in or- ganic materials, J. Am. Chem. Sot., 1902, xxiv, 1100.
by guest on April 19, 2020
http://ww
w.jbc.org/
Dow
nloaded from

A. T. Shohl and A. Sat0 255
25. Sherman, H. C., and Gettler, A. O., The balance of acid-forming and base-forming elements in foods, and its relation to ammonia metab- olism, J. Biok Chem., 1912, xi, 323.
26. Sherman, H. C., and Sinclair, J. E., The balance of acid-forming and base-forming elements in foods, J. Biol. Chem.,1907, iii, 307.
27. Shohl, A. T., Mineral metabolism, Physiol. Rev., 1923, iii, 509. 23. Shohl, A. T., and Marriott, W. McK., Titration of the acidity of the
feces, in press. 29. Stolte, K., Eine einfache und zuverlassige Methodik der Aschenanalyse,
Biochem. Z., 1911, xxxv, 104. 30. Tobler, L., and NOB, F., Zur Kenntnis des Mineralstoffwechels beim
gesundern Brustkind, Monatschr. Kindwh., 1910, ix, 210. 31. Van Slyke, D. D., Studies of acidosis. II. A method for the determina-
tion of carbon dioxide and carbonates in solution, J. Biol. Chem., 1917, xxx, 347.
by guest on April 19, 2020
http://ww
w.jbc.org/
Dow
nloaded from

A. T. Shohl and A. SatoDETERMINATION OF BASE BALANCE
ACID-BASE METABOLISM: I.
1923, 58:235-255.J. Biol. Chem.
http://www.jbc.org/content/58/1/235.citation
Access the most updated version of this article at
Alerts:
When a correction for this article is posted•
When this article is cited•
alerts to choose from all of JBC's e-mailClick here
ml#ref-list-1
http://www.jbc.org/content/58/1/235.citation.full.htaccessed free atThis article cites 0 references, 0 of which can be
by guest on April 19, 2020
http://ww
w.jbc.org/
Dow
nloaded from