achieving the millennium development · pdf file · 2015-09-17a fully up-to-date...
TRANSCRIPT
Cover photo: Mara Sylvain
The Economic and Social Commission for Asia and the Pacific (ESCAP) promotes regional cooperation for inclusive and sustainable economic and social development in Asia and the Pacific, a dynamic region characterize by growing wealth, diversity and change, but also challenged with persistent poverty, environmental degradation, inequality and insecurity. ESCAP supports member States with sound strategic analysis, policy options and technical cooperation activities to address key development challenges and to implement innovative solutions for region-wide economic prosperity, social progress and environmental sustainability. ESCAP, through its conference structure, assists member States in forging a stronger, coordinated regional voice on global issues by building capacities to dialogue, negotiate and shape development agenda in an age of globalization, decentralization and problems that transcend borders. A key modality for this strategy is the promotion of intraregional connectivity and regional integration.
ADB’s vision is an Asia and Pacific region free of poverty. Its mission is to help its developing member countries substantially reduce poverty and improve the quality of life of their people. Despite the region’s many successes, it remains home to two-thirds of the world’s poor: 1.8 billion people who live on less than $2 a day, with 903 million struggling on less than $1.25 a day. ADB is committed to reducing poverty through inclusive economic growth, environmentally sustainable growth, and regional integration. Based in Manila, ADB is owned by 67 members, including 48 from the region. Its main instruments for helping its developing member countries are policy dialogue, loans, equity investments, guarantees, grants, and technical assistance.
UNDP is the UN’s global development network, an organization advocating for change and connecting countries to knowledge, experience and resources to help people build a better life. UNDP is on the ground in 166 countries, working with them on their own solutions to global and national development challenges. UNDP’s network links and coordinates global and national efforts to achieve the Millennium Development Goals, including the overarching goal of cutting poverty in half by 2015. UNDP helps developing countries in building national capacities and sharing solutions to the challenges of: Democratic Governance, Poverty Reduction, Crisis Prevention and Recovery, Environment and Energy, and HIV/AIDS. UNDP also helps developing countries attract and use aid effectively.
Achieving the Millennium Development Goals in an Era of Global Uncertainty
Asia-Pacific Regional Report 2009/10

ii
iii
ACHIEVING THE MILLENNIUM DEVELOPMENT GOALS IN AN ERA OF GLOBAL UNCERTAINTY : ASIA-PACIFIC REGIONAL REPORT2009/10
This is the latest in a series of reports for Asia and the Pacific on the achievement of the Millennium Development Goals (MDGs). Coming in the midst of the global financial and economic turmoil, it should offer a unique opportunity to redress the information balance – to register the impact on the poor and the implications for the achievement of the Goals. However, it is difficult to offer a fully up-to-date report since reality has been moving too fast for the MDG data to keep pace. Judgements about whether countries across the region are on or off track to meet the Goals must be based on longer-term trends. This report therefore supplements these trend data with a close analysis of the most recent information and uses this to signal how the crisis is playing out – who is likely to suffer and why.
Just as important, it tries to identify opportunities for action – showing how the countries of Asia and the Pacific can better protect their people from this and future crises. It identifies the most vulnerable countries and the MDGs at greatest risk. As a starting point for action it considers cur-rent fiscal stimulus packages and how these could be reshaped so as not just to boost growth but also better benefit the poor. It also considers the types of social protection that countries of the region could use to protect their most vulnerable people. And it looks at ways of rebalancing Asia’s economies to make them more self-reliant and resilient – and serve as sturdier platforms for inclusive and sustainable development.
Above all, it emphasizes the importance of stronger regional cooperation. This is the world’s most dynamic region. Indeed in the next few years Asia and the Pacific may have to serve as the engine that pulls the global economy out of recession. But as this report shows, hundreds of millions of people are still being left far behind – living on less than $1.25 a day, lacking clean water and sani-tation, their families devastated by the tragic and needless deaths of mothers and children. This need not happen. Between them, the countries of Asia and the Pacific have the skills, the capacity and the resources to fulfil the rights of all their people and meet the Millennium Development Goals – and to work together to deal with any future storm that threatens to blow us off course.
In a corresponding spirit of cooperation, this publication is once again a joint effort by three agen-cies – the United Nations Economic Commission for Asia and the Pacific, the Asian Development Bank and the United Nations Development Programme – each of which has contributed its own particular expertise. We trust that readers will find this a useful and stimulating source of informa-tion and ideas.
Noeleen Heyzer Ursula Schaefer-Preuss Under-Secretary-General of the Vice President United Nations and Asian Development Bank Executive Secretary of ESCAP
orewordF
Ajay ChhibberUN Assistant Secretary-General andUNDP Assistant Administratorand Director for Asia and the Pacific

iv
v
ACHIEVING THE MILLENNIUM DEVELOPMENT GOALS IN AN ERA OF GLOBAL UNCERTAINTY : ASIA-PACIFIC REGIONAL REPORT2009/10
cknowledgementsAThis is the fourth report that has been prepared under the ESCAP/ADB/UNDP regional partnership programme on achieving the Millennium Development Goals in Asia and the Pacific region.
The report has been prepared under the direct supervision and guidance of Dr. Noeleen Heyzer, Under-Secretary-General of the United Nations and Executive Secretary of ESCAP, Ms. Ursula Schaeffer-Preuss, Vice-President, Asian Development Bank and Dr. Ajay Chhibber, UN Assistant Secretary-General and UNDP Assistant Administrator and Director for Asia and the Pacific.
ESCAP-ADB-UNDP team, which coordinated and prepared the report, consisted of following members:
ESCAP: Raj Kumar, Nagesh Kumar, Haishan Fu, Syed Nuruzzaman, Ganesh Kumar Anand, Jan Smit, Srinivas Tata, Clovis Freire, Yichun Wang, Eric Hermouet and Thomas Renault. ADB: Shiladitya Chatterjee and Guanghua Wan.UNDP: Nicholas Rosellini and Thangavel Palanivel.
The report team met periodically to review the draft chapters and engaged in wider consultations with the members of the United Nations Interagency Thematic Group on Poverty and Hunger and the United Nations Interagency Thematic Group on Gender and Empowerment of Women under the Regional Coordination Mechanism.
The report team thanks the following for their support and technical inputs: David Abbott, Artur Andrysiak, Rene Bastiaans, Aniruddha Bonnerjee, Krisana Boonpriroje, C.P. Chandrasekhar, Margaret Chung, Kevin Coffey, Edgar Dante, Michelle N. Domingo, Bart Edes, Carol Flore-Smereczniak, Ruth Francisco, Saad Ahmad Gulzar, Sri Wening Handayani, Rana Hasan, Nongnuch Hiranyapaisansakul, Aina Iiyambo, William James, Jacques Jeugmans, Thelma Kay, Taimur Khilji, Nanda Krairiksh, Huck-Ju Kwon, Marisa Limawongpranee, Nixie Mabanag, Iosefa Maiava, Sanath Manage, Romana Mary Margaret, Elvira Mynbayeva, Cuong Minh Nguyen, Omar Noman, Panyasri Phuvakirivivat, Chiara Romano, Hiren Sarkar, Jouko Sarvi, Indunil De Silva, Christian Stoff, Erik Strong, Panpaka Supakalin, Hirohito Toda, Yuqing Xing, Xianbin Yao and Marin Yari. The team’s appreciation goes to ILO, UNIFEM, UNESCO, UNICEF and WHO for their valuable and substantive inputs for the preparation of the report.
The report was edited by Peter Stalker. It was designed by Marie Ange Holmgren-Sylvain. Wannaporn Sridama provided all administrative support.

vi
vii
ACHIEVING THE MILLENNIUM DEVELOPMENT GOALS IN AN ERA OF GLOBAL UNCERTAINTY : ASIA-PACIFIC REGIONAL REPORT2009/10
Foreword iiiAcknowledgements vAbbreviations xiOverview 1 New threats to the MDGs 2 Fiscal impact of the crisis 3 Protecting the MDGs through fiscal stimuli 3 Securing the MDGs through stronger social protection 4 Opportunities for cooperation 5
CHAPTER I 9Tracking the MDGs – trends and prospects 9 Decades of progress 9 Disparities between countries 17 Disparities within countries 21 Assessing MDGs progress in light of the global financial crisis 31 The impact of the crisis on economic growth and poverty 31 Vulnerability to global economic crisis 32 Risks to the MDGS 33 The effect on women 33 Protecting the gains 36 CHAPTER II 39Protecting the MDGs through fiscal stimuli 39 Fiscal impact of the crisis 40 Current fiscal stimulus packages in major economies 44 Estimating the multiplier effect 45 Biasing stimulus packages towards the MDGs 46 Impact of the fiscal stimulus packages on the MDGs 51 Seeking a double dividend 52 CHAPTER III 55Securing the MDGs through stronger social protection 55 Social protection and the Millennium Development Goals 57 Social protection to reduce the impact of crisis and support MDG achievement 60 Long-term social protection to strengthen Asia’s resilience against future shocks 61
ontentC
viii
CHAPTER IV 69Strength in numbers – opportunities for cooperation 69 Boosting domestic demand 72 Restructuring intra-regional trade 74 Intra-regional investment 76 Monetary coordination 77 Regional cooperation on food 77 Cooperation on labour migration 79 Development cooperation for the least developed countries 84 A more resilient region 87
References 91
Annex 1 – MDG progress classification 96 Estimating the trend 96 Estimating the year of MDG achievement 97 Setting the target value 97 Using cut-off values 97 Regional and country group aggregates 98 Within-country disparities 99
Annex 2 – The number of people trapped in poverty 100Annex 3 – Vulnerability index 102Annex 4 – Pro-MDG and MDG-neutral multipliers 112Annex 5 – Classification of countries 114
Table I-1 – Country groups on and off track for the MDGs 10Table I-2 – Gender implications of failing to attain MDG targets 16Table I-3 – Countries on and off track for selected MDG targets 30Table I-4 – Estimates of economic growth in Asia and the Pacific for 2009 and 2010 32Table II-1 – Impact of the crisis on government budgets, percentage of GDP 41Table II-2 – Impact of the crisis on fiscal balances in selected countries 42Table II-3 – Impact of the crisis on the stock of external debt 42Table II-4 – Change in debt service ratio TE-2007 to FY-2008 43Table II-5 – Social sector spending, percentage of GDP 44Table II-6 – Stimulus packages of some major countries 44Table II-7 – Character of fiscal stimulus packages in Asia-Pacific countries 47Table II-8 – Fiscal stimulus packages and estimates of resulting GDP increase 49Table II-9 – Fiscal stimulus packages and estimates of resulting increase in MDG indicator value 52Table III-1 – Social protection in Asia and the Pacific, selected countries 63Table IV-1 – Export losses in 2008, current prices 71Table IV-2 – Savings and investment rates in selected countries, percentage of GDP 73Table IV-3 – Rates of immigration and emigration, 2005 80Table IV-4 – Remittances to principal Asia-Pacific migrant sending countries. 2008 81Table IV-5 – Debt projections, selected Asia-Pacific countries, percentage of GDP 83Table IV-6 – Post-crisis IMF lending to Asia-Pacific countries, as of August 2009 85
ablesT
ix
ACHIEVING THE MILLENNIUM DEVELOPMENT GOALS IN AN ERA OF GLOBAL UNCERTAINTY : ASIA-PACIFIC REGIONAL REPORT2009/10
Figure I-1 – Asia and the Pacific compared with Sub-Saharan Africa and Latin America and the Caribbean 14Figure I-2 – The Asia-Pacific’s region’s share of the developing world’s deprived people, selected indicators 15Figure I-3 – South and South-West Asia, proportion of reported indicators for which countries are off track 17Figure I-4 – North and Central Asia, proportion of reported indicators for which countries are off track 19Figure I-5 – Pacific Islands, proportion of reported indicators for which countries are off track 19Figure I-6 – South-East Asia, proportion of reported indicators for which countries are off track 20Figure I-7 – East and North-East Asia, proportion of reported indicators for which countries are off track 21Figure I-8 – Under-five mortality – rural-urban rates and ratios, selected countries 23Figure I-9 – India, under-five mortality, by rural and urban areas and by sex, 1998 and 2005, 25Figure I-10 – Child mortality by wealth quintile, selected countries 26Figure I-11 – Relationship between a mother’s education and child survival 27Figure I-12 – Under-five children underweight – rural-urban rates and ratios, selected countries 27Figure I-13 – Under-five children underweight – male and female rates and ratios, selected countries 29Figure II-1 – Fiscal packages, as a percentage of 2008 GDP, selected countries and economy 46Figure III-1 – Proportion of population covered by social protection, selected countries 64 Figure III-2 – Expenditure on social protection as percentage of GDP, selected countries 65 Figure III-3 – Per capita expenditure on social protection, by subregion 65Figure IV-1 – Exports as a proportion of GDP, triennium ending-2007 69Figure IV-2 – Savings minus investments as a percentage of GDP, selected countries 72Figure IV-3 – Domestic savings in selected countries for two periods, as a percentage of GDP 73Figure IV-4 – Trade policy interventions and the price of rice, 2007-08 78Figure IV-5 – Aid as a percentage of gross capital formation, selected countries, 2007 86Figure IV-6 – Aid commitment to social sectors 87
iguresF
x
Box I-1 – Revised poverty estimates 10Box I-2 – Measuring maternal mortality 11Box I-3 – Routes to faster MDG progress in the Pacific 12Box I-4 – Gender equality and its impact on MDG achievement 16Box I-5 – Gender disparities in MDG progress 22Box I-6 – Children at risk 22Box I-7 – Gender and child mortality 24Box I-8 – Asia’s malnutrition enigma 28Box I-9 – Employment impact of the crisis 34Box I-10 – The impact of the economic crisis on women migrant workers 35Box I-11 – Households under pressure rely more on women’s work 36Box II-1 – Gender-responsive stimulus measures 47Box II-2 – Indian budget stimuli for 2009-2010 will benefit the poor 50Box II-3 – Stimulating green growth in the Republic of Korea 51Box III-1 – Social protection terminology 56Box III-2 – Informal mechanisms for social protection 59Box IV-1 – Trade and gender equality 70Box IV-2 – Regional cooperation mechanisms in Asia and the Pacific 75Box IV-3 – Organizing for women’s rights 76Box IV-4 – The SAARC Food Bank 78Box IV-5 – Empowering women migrant workers in Asia 82
oxesB
xi
ACHIEVING THE MILLENNIUM DEVELOPMENT GOALS IN AN ERA OF GLOBAL UNCERTAINTY : ASIA-PACIFIC REGIONAL REPORT2009/10
ADB Asian Development BankAIDS acquired immunodeficiency syndromeASEAN Association of South-East Asian NationsASEAN+3 ASEAN + China, Japan and the Republic of KoreaBIMSTEC Bengal Initiative for Multi-Sectoral Technical and Economic Cooperation BRIC Brazil, Russian Federation, India and ChinaCFC chlorofluorocarbonCIS Commonwealth of Independent StatesCMI Chiang Mai InitiativeCO2 Carbon dioxideDHS demographic and health surveyEPZ Export processing zoneESCAP Economic and Social Commission for Asia and the PacificESF Exogenous Shocks FacilityFDI foreign direct investmentFTA free trade agreementFY fiscal yearGDP gross domestic productGNP gross national productHIV human immunodeficiency virusICP International Comparison Programme ILO International Labour OrganizationIMF International Monetary FundLDCs least developed countriesLLDCs landlocked developing countriesMDB multilateral development bankMDGs Millennium Development GoalsMOU memorandum of understandingNGO non-governmental organizationODA official development assistanceOECD Organisation for Economic Cooperation and DevelopmentPPP purchasing power parityPRGF Poverty Reduction and Growth FacilitySAARC South Asian Association for Regional CooperationSBA Stand-by ArrangementTB TuberculosisTE triennium ending
bbreviationsA
xii
UNDP United Nations Development ProgrammeUNESCO UN Educational, Scientific and Cultural OrganizationUNFPA United Nations Population FundUNICEF United Nations Children's FundUNIFEM United Nations Development Fund for WomenVAT value added taxWDI World Development IndicatorsWHO World Health OrganizationWTO World Trade Organization
1
ACHIEVING THE MILLENNIUM DEVELOPMENT GOALS IN AN ERA OF GLOBAL UNCERTAINTY : ASIA-PACIFIC REGIONAL REPORT2009/10
For selected MDG indicators it places each country or country group into one of four categories: early achiever – already achieved the 2015 target; on track – expected to meet the target by 2015; off track: slow – expected to meet the target, but after 2015; off track: no progress/regressing – stagnating or slipping backwards.
Prior to the economic crisis, Asia and the Pacific had been making impressive gains. The region as a whole is an early achiever for a number of indicators: reducing gender disparities in primary and tertiary education; stopping the spread of HIV and AIDS and tuberculosis; ensuring a proportion of protected area to maintain bio-diversity, reducing consumption of ozone-depleting substances, and halving the proportion of people without access to safe drinking water. The region is also on track to achieve three other important targets: gender parity in secondary education, ensur-ing universal access of children to primary school, and halving the proportion of people living below the $1.25-a-day poverty line.
This progress is heartening, but these region-al aggregates inevitably mask considerable variations between subregions and country groupings. Among the subregions, the great-est advances have been in South-East Asia which has already achieved the targets in 11 out of the 21 assessed indicators, and it is on track for another four. Next come the North and Central Asian countries that as a group have already achieved the targets in nine of the indicators. South Asia has also made
good progress on eight indicators, but it is mov-ing slowly in many others. As a group, the Pacific Island countries have been less successful – re-gressing or making no progress in 11 indicators and advancing only slowly in another two, those for infant and under-five mortality.
There are similar disparities between country groups. The region’s 14 least developed countries have made slow or no progress on most of the indicators – performing well only on gender equality in primary and secondary education and in reducing the prevalence of HIV and TB.
The Asia-Pacific region as a whole has made more progress than Sub-Saharan Africa, but less than Latin America and the Caribbean. It lags behind Sub-Saharan Africa only on under-five children underweight, but is behind Latin America and the Caribbean on most indicators – coming close only for primary enrolment. Despite the progress, Asia and the Pacific is still the home to the largest number – more than 50 per cent – of people, both rural and urban, without basic sanitation, of under-5 children who are underweight, of people infected with TB, of people living on less than $1.25 per day, and of rural people without access to clean water.
Most of the MDG indicators are reported as national averages. To reflect some of the important types of disparity within countries, the report looks more closely at under-five mortality and the proportion of under-five children underweight. One of the most consistent contrasts is between rural and urban areas – and in many countries, even as the overall rates
Overview
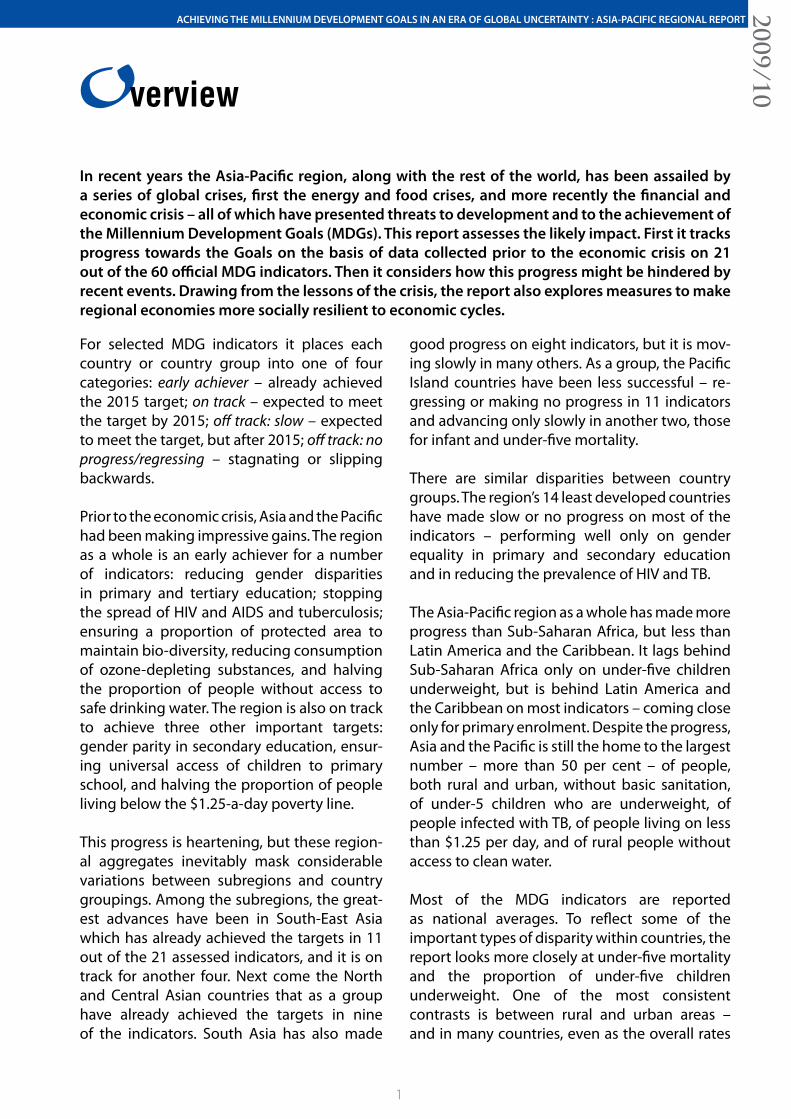
In recent years the Asia-Pacific region, along with the rest of the world, has been assailed by a series of global crises, first the energy and food crises, and more recently the financial and economic crisis – all of which have presented threats to development and to the achievement of the Millennium Development Goals (MDGs). This report assesses the likely impact. First it tracks progress towards the Goals on the basis of data collected prior to the economic crisis on 21 out of the 60 official MDG indicators. Then it considers how this progress might be hindered by recent events. Drawing from the lessons of the crisis, the report also explores measures to make regional economies more socially resilient to economic cycles.
2
are coming down, these disparities are widening, clear evidence that millions of rural children are dying needlessly. Another persistent disparity in under-five mortality is between boys and girls. In rural areas of India, for example, in 2005-06, there were 89 deaths per thousand live births for girls, compared with 76 deaths for boys. Under-five mortality also varies significantly according to household wealth. The largest disparity is in the Philippines – 66 deaths per thousand live births in the poorest quintile compared with 21 in the richest. Mortality rates also vary according to the level of education of the mother. In Viet Nam, for example, for children of mothers with primary education the child mortality rate is 27 deaths per thousand live births, while for those whose mothers had no education the rate is 66.
Similar disparities are evident for the proportion of children under-five who are underweight. Again, there are often sharp rural-urban contrasts, and in some cases disparities have been widening. Malnutrition data also reveal gender disparities – though many countries have made progress. Cambodia, India and Nepal, for example, have managed to reduce disparities, and their rates for girls and boys are now very similar. In Turkey, on the other hand, while the overall malnutrition rate is relatively low, the risk remains higher for girls.
New threats to the MDGs Many countries across Asia and the Pacific have demonstrated that some MDGs are indeed within reach. However, most of the assessments of MDGs progress in this report are based on data gathered before the 2008 global economic crisis. What effect will the crisis have, for example, on poverty? At this stage there are relatively few empirical data that register the impact. Nevertheless, it is possible to make some assessment of the likely damage by starting from projections of lost economic growth. Since economic growth helps reduce poverty, slower growth will correspondingly mean that fewer people will escape from poverty. Data on the differences between estimates of economic growth made before and after the onset of the crisis enable a calculation of the total number of people across Asia and the Pacific who will remain poor. On the basis of the most recent estimates of economic growth, in 2009, the crisis could trap an additional 17 million people on incomes
of less than $1.25 a day, and another 4 million in 2010. This represents a huge opportunity cost – 21 million people are almost equivalent to the entire population of Australia.
This crisis has indicated that the region is still vulnerable to setbacks, which, in an era of globalization, can be transmitted from anywhere in the world. The Asia-Pacific region is connected to the global economy through multiple channels, including trade, tourism, foreign direct investment (FDI), official development assistance (ODA) and remittances. Each country’s vulnerability will depend on two main factors: first, the extent of its integration into the global economy; second, its capacity to cope, which will depend on such issues as macroeconomic stability, institutional strength and level of social development.
Based on these factors, the report calculates for each country a ‘vulnerability index’. Overall, it finds that the Asia-Pacific region has a similar coping capacity to Latin America and the Caribbean but it is less exposed to the crisis. Compared with Africa, Asia and the Pacific is more exposed to the crisis, but it is in a much stronger position in terms of coping capacity.
Among the Asia-Pacific country groups, the Pacific Islands are the most exposed and generally have lower coping capacity. The least developed countries (LDCs) in Asia and the Pacific also have a lower capacity to cope but are less exposed. The landlocked developing countries (LLDCs) in Asia and the Pacific are less exposed as the LDCs, but usually have greater coping capacity. South Asia and South-East Asia have similar exposures, but the latter has greater coping capacity.
The indices of exposure and coping capacity can be combined to derive an overall index of vulnerability. Each country’s vulnerability can then be considered in the context of its MDG achievement to assess how far it is at risk for each goal. For poverty and child malnutrition, for example, People’s Democratic Republic, Cambodia and Nepal, which have high incidences and are making slow progress on these indicators, appear to be at greatest risk. They are also among those at highest risk for primary enrolment, along with the Solomon Islands, Pakistan, and Vanuatu.
3
ACHIEVING THE MILLENNIUM DEVELOPMENT GOALS IN AN ERA OF GLOBAL UNCERTAINTY : ASIA-PACIFIC REGIONAL REPORT2009/10
This type of impact analysis offers a useful snapshot, but indicates little about how this burden will be distributed among the most vulnerable groups. Among those likely to be hurt most are women, who constitute the majority of Asia’s low-skilled, low-salaried, and temporary workforce that can easily be laid off during economic downturns. Moreover the current global economic crisis has reduced the demand for migrant labour – and women form nearly two-thirds of the total Asian migrant population. Another channel through which women’s income would be affected is via reduced flows of microfinance – for which women are the principal clients.
These different channels will have first-round im-pacts that could directly affect women’s incomes and livelihood opportunities, with implications for the achievement of MDGs 1 and 3. Indirectly, however, second-round impacts at the household level will also have implications for the achieve-ment of other MDGs. The loss of female income is likely to have a greater impact on health and edu-cation, as women tend to spend a greater propor-tion of their income on meeting the basic needs of household members. At the same time, the strat-egies that households adopt to cope with falling incomes tend to disproportionately affect women and girls; experience with past crises has shown, for example, that, in these circumstances, girls are highly vulnerable to being withdrawn from school. In countries with high child mortality rates, the fall in household incomes could further increase the number of infant and child deaths, with dispropor-tionate effects on women and girls.
Fiscal impact of the crisis Another major concern is that the global economic slowdown is cutting into government tax revenues, and causing or increasing fiscal imbalances – forc-ing governments to respond, either by borrowing, with a corresponding rise in debt, or by cutting expenditure, with potentially serious implications for the MDGs. Based on previous patterns in the region, a 1 percentage point fall in per capita GDP growth translates on average, depending on the country, into a 0.5–0.8 percentage point decrease in the growth of per capita private health spend-ing, a 0.5–0.7 percentage point decrease in the growth of per capita public health spending, and a 0.3–0.5 percentage point decrease in the growth of
per capita public education spending.
To check what has actually happened so far on the fiscal front during this crisis, the report examined the situation for a select set of twelve countries for which data were readily available: Bangladesh, China, Fiji, India, Indonesia, Kazakhstan, Mongolia, Pakistan, Philippines, Papua New Guinea, Samoa and Thailand. Prior to the crisis, nine of these twelve countries had achieved either fiscal balances or surpluses. But the crisis soon took its toll and by 2008 only six countries were still in balance. All expect higher deficits (lower surplus) in 2009 compared with 2008, and seven expect to run budget deficits in excess of 3.5 per cent of GDP, a level often beyond which sustainability is likely to be undermined. In general the countries of this region have been relying less on external debt and more on domestic debt – made feasible by high domestic savings coupled with a slowdown in private investment.
The good news is that none of the governments surveyed here has reduced expenditures on the social sector, either in total or specifically on education or health – though Samoa is an exception in the case of health. Indeed most have increased their investment and, despite the prospect of higher deficits, appear determined to protect social-sector spending.
Protecting the MDGs through fiscal stimuliThe global economic crisis – and any future crises – could therefore have serious implications for the achievements of the MDGs. How can countries protect their people? The richer countries can rely to some extent on ‘automatic stabilizers’ such as progressive income tax regimes which, as people’s incomes drop, permit them to pay a smaller proportion of their incomes as tax. And if workers lose their jobs they will usually get unemployment benefits.
Developing countries generally do not have these options. Instead they usually have to make specific responses. For rich and poor countries alike, an alternative, or a supplement, to automatic stabilizers is a ‘fiscal stimulus’. To compensate for the loss of export demand from the developed economies, and to boost domestic demand, many governments in Asia and the Pacific have thus
4
increased public expenditure on infrastructure, such as roads and power supplies, while also cutting taxes on some goods and services.
If fiscal stimulus packages have a strong compo-nent of social expenditures, this is likely to produce a double dividend – not only boosting growth more rapidly but also accelerating progress to-wards the MDGs. To what extent have the pack-ages in Asia and the Pacific been ‘pro-MDG’? Thus far the picture has been mixed. In most countries, a large part of the stimulus package can be termed ‘MDG-neutral’ in the sense that the measures do not directly address MDG issues, though the poor might still benefit indirectly. In a few countries, the stimulus package includes elements that are pro-MDG.
How much difference would it make if countries followed the pro-MDG path for their stimulus packages? This can be estimated in rough terms by considering the likelihood that poor and the non-poor will spend money rather than save it – their different ‘propensities to consume’. The poor have a higher propensity to consume, so any pro-MDG government spending is likely to prompt further expenditure by the poor and thus have a higher multiplier than MDG-neutral spending.
An examination of the content of China’s package, for example, suggests that close to a quarter of the stimulus was pro-MDG, while the rest was MDG-neutral. Had the whole package been pro-MDG then not only would the poor have benefited more there would also have been a greater economic boost – not 21.3 per cent but 38.0 per cent accumulated over several years. Similarly, in the Philippines a stimulus that was fully pro-MDG would, accumulated over several years, have increased GDP by 12.0 per cent rather than the 6.2 per cent that the current stimulus package is expected to deliver. This represents the total increase over a number of years, with the largest increases in the initial years and the impact gradually tapering off.
Considering the fiscal packages in terms of their pro-MDG bias should give some indication of their general benefit for the attainment of the MDGs. But it is also possible to assess the scale of the ben-efit. The report estimates that the greatest con-tribution of the stimulus packages is for poverty
reduction, followed by health and education. In the Philippines, for example, using the country multi-plier, the stimulus package would reduce the pov-erty rate by 7.5 per cent and the under-five mortal-ity rate by more than 3.8 per cent. Again, however, this represents the total accumulated impact of the stimulus over a number of years.
Securing the MDGs through stronger social protection Many Asia-Pacific countries could expand their very limited automatic stabilizers by strengthening their systems for social protection – which includes social insurance, social assistance, labour market services, a range of social services, particularly for women and children, and many types of local funds such as microcredit schemes.
Social protection is becoming a priority because as countries become richer they are in a better position to protect their citizens. Another reason is that, in an era of globalization, they recognize that they have become more vulnerable to global crises that jeopardize hard-won gains in human development. Moreover, the surge in global trade and financial flows has been accompanied by rising social and economic inequality, while modernization has steadily undermined traditional form of community support, especially in the expanding urban areas, making older people in particular much less secure. A further source of vulnerability is the increasing frequency of natural disasters – some of which could be linked to global warming.
All these hazards pose specific threats to the poor who are usually most exposed to major hazards and who also have to contend with catastrophic household events – major illness, for example, family breakup, or the premature death of the main household earner. As a result, households that can survive in normal circumstances can suddenly find themselves sinking below the poverty line.
Achieving the Millennium Development Goals will bolster social protection. If, for example, people can escape from poverty they will live in more secure environments and will be much less vulnerable. By the same token, stronger social protection is also likely to foster the achievement of the MDGs. For example, households that are better insulated against catastrophes will feel more confident
5
ACHIEVING THE MILLENNIUM DEVELOPMENT GOALS IN AN ERA OF GLOBAL UNCERTAINTY : ASIA-PACIFIC REGIONAL REPORT2009/10
about committing themselves to new enterprises or technologies that can help them escape from poverty. Conversely, failures in social protection will undermine MDG achievement. If households, for example, face a sudden financial shock they may have to divert microcredit loans from productive investment into consumption. And, desperate for income, they may withdraw children, particularly girls, from school in order to work. Household expenditure on health, especially of women and girls, is also likely to be curbed in times of financial insecurity.
Asia-Pacific countries already have most of these forms of social protection. Many countries have schemes of social insurance, for example, but these usually reach only a small proportion of the work-force – generally government workers and some of those employed in the formal sector. Across Asia and the Pacific, only 20 per cent of the unem-ployed and underemployed have access to labour market programmes, such as unemployment benefits, training or public works programmes, including food-for-work programmes. Only 30 per cent of older people receive pensions.
Expenditure on social protection in most Asia-Pacific countries tends to be small relative to GDP, though it can represent a high proportion of government budgets. There are four main sources of finance: taxation, reprioritizing expenditures, official development assistance, and borrowing. Of these, the most important in the future is likely to be taxation, since, even in some low-income countries, there is scope for increasing fiscal space by reforming their tax systems and improving the efficiency of tax collection. In some countries, however, the potential for additional tax will be limited in the short run, partly for reasons of political economy and also because of the extent of the informal economy. Taxation should therefore be combined with other sources of finance. This region should certainly be able to do more. Prior to the current crisis, it had been growing at an average annual rate of 8 per cent – creating economic resources that can and should be allocated to building systems capable of reaching all members of society at all times. And there are signs that countries are moving towards more comprehensive social protection systems – from
extending cash transfers to offering guarantees of employment.
Opportunities for cooperation The economic crisis of 2008 may not have started in Asia and the Pacific, but its impact here was immediate. What might the region do in future to protect itself – and the MDGs – from such contagion? In the short term, the most practical way of filling the gap left by declining exports is through a fiscal stimulus. In the medium and longer term, however, many countries will want to generate domestic demand in a more sustainable way by increasing household incomes and consumption, alongside boosting corporate investment.
How can households be induced to save less and consume more? This depends on why people are saving. One reason could be to smooth incomes over the lifetimes of household members. Governments who wished to address this would need to consider increasing child benefits and old-age pensions. Another motive for saving is to set aside funds for emergencies: households will want to provide for unforeseen exigencies such as sickness or loss of income. Governments could respond with stronger social protection and more secure access to public health care or education, which would not only help achieve the health-related MDG targets but also reduce anxiety about having lower savings. Another motive for saving is to finance anticipated expenditure – to pay for expensive consumer goods, for example, or children’s schooling. Policies to counter this would involve better credit so that households could make more balanced choices between current and future consumption. Consumption is also likely to increase if a greater share of national income goes to the poor. Investing in the capacities and capabilities of the poor is also likely to increase their contribution to GDP thus ensuring a more inclusive pattern of growth. Reducing poverty by broadening the economic base can unleash latent demand.
But policies should not just aim to alter the choices of households. Governments will also want to give appropriate incentives to the private sector – through policies on exchange rates, taxation and subsidies – to make it more profitable for companies to invest in sectors that are oriented

6
less towards exports and more towards meeting domestic demand, and especially the needs of the poor. For example, by avoiding undervalued exchange rate, governments can divert resources from tradable sectors into non-tradable sectors.
As well as reorienting their economies more to-wards domestic markets, many countries can also consider diversifying their export markets so as to become less dependent on demand in the West. They can, for example, boost trade within the re-gion by liberalizing trade regimes and improving transport links, and simplifying customs and in-spection procedures. Cooperation would be par-ticularly valuable for the trade in food, and could include grain banks that are maintained in each country but readily accessible to others. Many subregions in Asia and the Pacific have very little trade between their constituent countries – a gap which represents a major opportunity for realizing trade gains and strengthening regional resilience.
Closely connected with flows of trade are flows of FDI, on which restrictions might be eased. Some countries, particularly in South Asia, maintain complex rules governing FDI flows. Regional cooperation would also benefit from better integrated financial markets to facilitate cross-border investment in both equity and bond markets. A major step in this direction would be faster progress with the Asian Bond Market initiative.
Regional cooperation can also be fostered by greater cooperation on monetary policy and on currency markets. One the most significant steps has been the Chiang Mai Initiative through which countries can pool currency reserves. Another is the Asian Cooperation Dialogue, which is an informal meeting to promote greater coordination amongst the region’s central banks. Despite these laudable efforts, the recent crisis has exposed weaknesses in coordination amongst the region’s monetary authorities. In addition to strengthening regional financial cooperation, Asia-Pacific governments will also have to play an important role in redesigning the global financial architecture – articulating their specific concerns and experiences.
The global economic crisis has been widely pre-dicted to affect international migration and re-
mittances adversely. Initial reports supported this expectation, with evidence of decelerating remit-tances in some countries. But as the crisis unfolds, it is becoming clear that the patterns of migration and remittances may be more complex than was previously imagined. Though growth of remittance flows moderated in some countries, overall flows remained resilient. In fact, in several countries (such as Bangladesh, India, Pakistan, Philippines, Nepal and Sri Lanka) remittance inflows have actually in-creased rather than declined so far. In this crisis, it seems likely that those affected are more likely to be migrant men employed in such sectors as man-ufacturing or construction in receiving countries, than migrant women who are often employed in domestic service. Nevertheless, those migrant workers, men and women, who manage to keep or find employment may face inferior working condi-tion or reduced wages. These contractions may re-duce the flow of remittances. In 2009 remittances to East Asia are expected fall by around 6 per cent and to South Asia by around 4 per cent.
At present, migration policy in the region is largely unilateral, with most of the power in the hands of the countries of destination who can try to control the arrivals and working conditions of migrants. Instead, it would be better if countries of origin and destination could cooperate more closely, either through bilateral agreements, or memoranda of understanding – which set out broad frameworks to address common concerns.
Another possible outcome of the crisis is a drop in development assistance. The major donor countries, facing falling tax revenues and the costs of massive fiscal stimulus packages, might feel the need to curtail overseas aid. Thus far, this does not seem to have happened. Indeed in April 2009 in London, the leaders of the G-20 countries committed themselves to significantly increasing the funds available to the developing countries. At this stage it is not clear how much of these commitments have actually come through in 2009.
Any reduction in ODA would hit some of the LDCs, Small Island Developing States (SIDS) and some Central Asian countries for which aid represents well over 10 per cent of gross capital formation. Much of the increase in the volume and share of aid committed to social sectors is towards government and the development of civil society, while the
7
ACHIEVING THE MILLENNIUM DEVELOPMENT GOALS IN AN ERA OF GLOBAL UNCERTAINTY : ASIA-PACIFIC REGIONAL REPORT2009/10
share allocated to education has fallen – raising doubts about the effectiveness of aid for helping achieve the MDGs. Nowadays, more aid is arriving as a result of South-South cooperation from other developing countries in the region – notably China, India and Thailand which, for some of the recipient countries, are the largest sources of aid.
Stronger cooperation across the region – via agreements on trade, finance, labour migration and development assistance – could thus make the region more resilient to future crises and bolster the capacity of many of the poorest countries to achieve the Millennium Development Goals.
8Photo: Marie Ange Holmgren-Sylvain
ACHIEVING THE MILLENNIUM DEVELOPMENT GOALS IN AN ERA OF GLOBAL UNCERTAINTY : ASIA-PACIFIC REGIONAL REPORT2009/10
9
hapter
Tracking the MDGs – trends and prospects
In recent years, the Asia-Pacific region, along with the rest of the world, has been assailed by a sequence of global crises, first the energy and food crises and, more recently, the economic crisis triggered by the Western financial meltdown. As a result, the region is facing additional threats to development and to the achievement of the MDGs.
This report will examine these threats in detail at the end of the chapter, but it begins by telling the story so far, using the most recent data on 21 out of the 60 official MDG indicators from the Global Millennium Development Goals Indicators Database – which generally reflect the position prior to the economic crisis (UN, 2009). To judge whether countries are on or off track to achieve the MDGs, it assesses past performance and assumes countries will continue along similar trajectories. But history is not destiny. Even in the face of crises, countries can secure their position and improve their prospects. For those that have so far made good headway, this will mean implementing policies that help them to protect their gains and sustain their progress. For countries that have been less successful, it will mean diverging from the predicted path and getting back on track to meet the MDGs by 2015.
For classifying the progress of countries and regions, this report uses the same system as in previous regional MDG reports. For selected indicators, based on trends of progress since 1990, the report places each country or country group into one of four categories:
Early achiever – Already achieved the 2015 target
On track – Expected to meet the target by 2015
Off track: slow – Expected to meet the target, but after 2015
Off track: no progress/regressing – Stagnating or slipping backwards
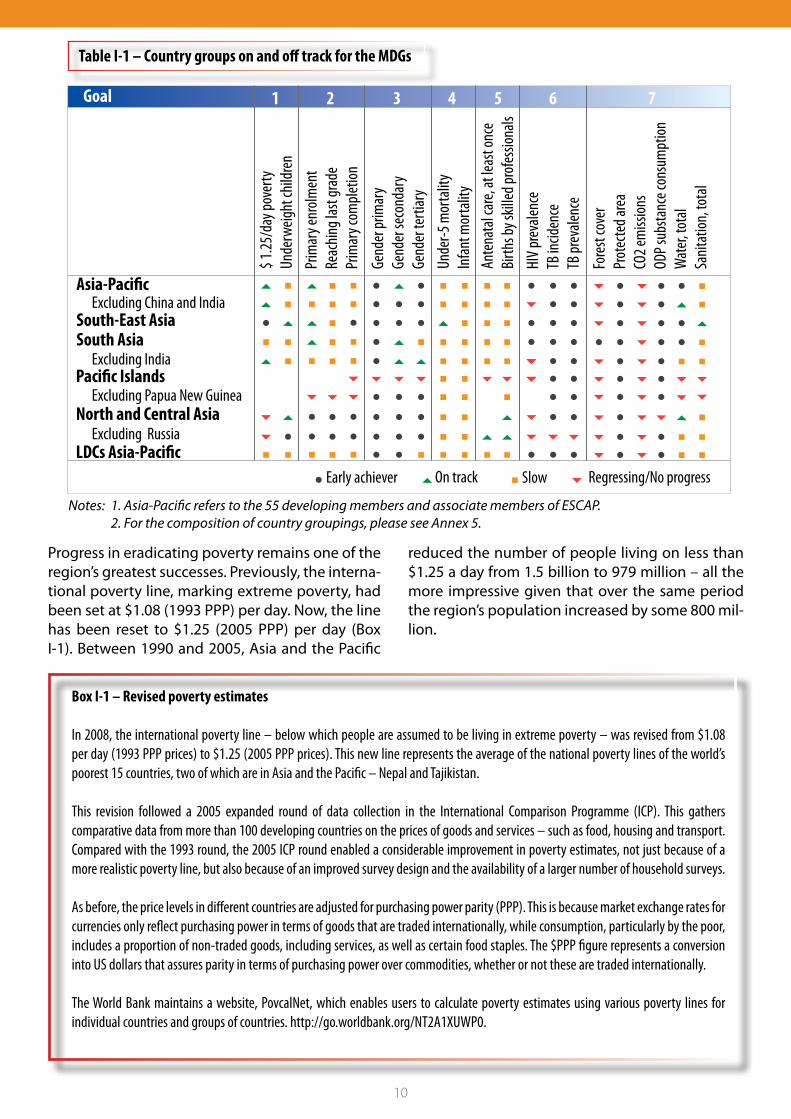
Based on this classification, Table I-3 presents the progress of 55 Asia-Pacific countries on selected MDG indicators. Table I-1 summarizes the data for various subregions and country groups. For details of the methodology for assessing whether coun-tries are on or off track, please see Annex 1.
Decades of progressPrior to the global crises, Asia and the Pacific had made impressive gains in some of the MDG indicators. As indicated in Table I-1, the region as a whole is an early achiever for a number of indicators: reducing gender disparities in primary and tertiary education; stopping the spread of HIV and AIDS and tuberculosis; ensuring a proportion of protected area to maintain bio-diversity, reducing consumption of ozone-depleting substances, and halving the proportion of people without access to safe drinking water. The region is also on track to achieve three other important targets: gender parity in secondary education, ensuring universal access of children to primary school and halving the proportion of people living below the poverty line.
C 1
10
Notes: 1. Asia-Pacific refers to the 55 developing members and associate members of ESCAP. 2. For the composition of country groupings, please see Annex 5.
Table I-1 – Country groups on and off track for the MDGs
Goal 1 2 3 4 5 6 7
Asia-Paci�cExcluding China and India
South-East AsiaSouth Asia
Paci�c Islands
North and Central Asia
LDCs Asia-Paci�c
Excluding India
Excluding Papua New Guinea
Excluding Russia
$ 1.25
/day
pove
rtyUn
derw
eight
child
ren
Prim
ary e
nrolm
ent
Reac
hing l
ast g
rade
Prim
ary c
omple
tion
Gend
er pr
imar
y Ge
nder
seco
ndar
yGe
nder
terti
ary
Unde
r-5 m
orta
lity
Infan
t mor
talit
yAn
tena
tal c
are,
at le
ast o
nce
Birth
s by s
killed
prof
essio
nals
HIV p
reva
lence
TB in
ciden
ceTB
prev
alenc
e
Fore
st co
ver
Prot
ecte
d are
aCO
2 em
ission
sOD
P sub
stanc
e con
sum
ption
Wat
er, to
tal
Sanit
ation
, tot
al
Early achiever On track Slow Regressing/No progress
Progress in eradicating poverty remains one of the region’s greatest successes. Previously, the interna-tional poverty line, marking extreme poverty, had been set at $1.08 (1993 PPP) per day. Now, the line has been reset to $1.25 (2005 PPP) per day (Box I-1). Between 1990 and 2005, Asia and the Pacific
reduced the number of people living on less than $1.25 a day from 1.5 billion to 979 million – all the more impressive given that over the same period the region’s population increased by some 800 mil-lion.
Box I-1 – Revised poverty estimates
In 2008, the international poverty line – below which people are assumed to be living in extreme poverty – was revised from $1.08 per day (1993 PPP prices) to $1.25 (2005 PPP prices). This new line represents the average of the national poverty lines of the world’s poorest 15 countries, two of which are in Asia and the Pacific – Nepal and Tajikistan.
This revision followed a 2005 expanded round of data collection in the International Comparison Programme (ICP). This gathers comparative data from more than 100 developing countries on the prices of goods and services – such as food, housing and transport. Compared with the 1993 round, the 2005 ICP round enabled a considerable improvement in poverty estimates, not just because of a more realistic poverty line, but also because of an improved survey design and the availability of a larger number of household surveys.
As before, the price levels in different countries are adjusted for purchasing power parity (PPP). This is because market exchange rates for currencies only reflect purchasing power in terms of goods that are traded internationally, while consumption, particularly by the poor, includes a proportion of non-traded goods, including services, as well as certain food staples. The $PPP figure represents a conversion into US dollars that assures parity in terms of purchasing power over commodities, whether or not these are traded internationally.
The World Bank maintains a website, PovcalNet, which enables users to calculate poverty estimates using various poverty lines for individual countries and groups of countries. http://go.worldbank.org/NT2A1XUWP0.
ACHIEVING THE MILLENNIUM DEVELOPMENT GOALS IN AN ERA OF GLOBAL UNCERTAINTY : ASIA-PACIFIC REGIONAL REPORT2009/10
11
However, even this good progress will not be sufficient to achieve all the MDGs by 2015. The Asia-Pacific region has been slow in reducing hunger, ensuring that girls and boys reach the last grade of primary education, reducing child mortality, improving maternal health and providing basic sanitation. To reach the goals, from now to 2015, countries in Asia and the Pacific need to give a big, final push – stepping up their efforts through focused MDG programmes and projects.
One issue on which it is difficult to make an accurate assessment, however, is maternal mortality – which is of particular concern given the large number of women across the region dying from causes related to childbirth (Box I-2). The reduction of CO2 emissions is one indicator on which all subregions are regressing.
Disparities between subregions and country groupsThe estimates for the Asia-Pacific region as a whole inevitably mask considerable variations between subregions and country groupings. Table I-1 shows that, amongst the subregions, the greatest progress has been in South-East Asia, which has already achieved 11 out of the 21 assessed indicators and is on track for another four. Next come the North and Central-Asian countries which, as a group, have already achieved nine of the indicators. The same group of countries, excluding the Russian Federation, have achieved nine of the indicators and are on track on two more – though they are progressing slowly on another three, and regressing in another six, including those related to poverty, HIV and TB.
Box I-2 – Measuring maternal mortality
Most developing countries find it difficult to estimate maternal mortality. Indeed on this indicator even the developed countries that have the advantage of more complete systems for vital registration suffer from misclassification and underreporting.
An alternative is to use household surveys to ask about the deaths of women in that household from causes related to childbirth. But because for each family maternal mortality is a relatively rare event this requires a large sample size to produce a statisti-cally significant result. Increasing the sample size is costly and may still result in estimates with large confidence intervals. As a result many countries, such as Indonesia, when carrying out their demographic and health surveys use the ‘direct sisterhood’ method – also asking women within the sampled households whether any of their sisters have died. This generates more data on maternal deaths, but those reported will generally have occurred some 6-12 years prior to the survey. Other options include, as in China, using a disease surveillance system or, as in India, a sample registration system. Whatever the method, national estimates based on surveys have wide confidence intervals, making it difficult to assess trends over time or make meaningful comparisons between countries.
To produce better quality estimates and calculate regional and global aggregates WHO, UNICEF, UNFPA, the World Bank, and UNDP have developed a methodology for adjusting national data to make them more internationally comparable. For this pur-pose they divide countries into three groups, which are of roughly equal numbers. The first group have complete civil registration systems and good systems for attributing causes of death so their data are not adjusted. The second group consists of countries that use a range of methodologies so the estimates for these countries are adjusted to take these differences into account. The third group comprises countries that lack appropriate data and whose maternal mortality levels have to be predicted using a statistical model. These adjusted global estimates are calculated every five years and published one or two years after the refer-ence year.
This exercise was carried out in 1990, 1995, 2000 and 2005. The 2005 estimates used an improved methodology. While this should give more reliable results it means that the 2005 estimates are not comparable with those of earlier years. To make a comparison, a separate exercise was required using the 2005 methodology to re-estimate the 1990 data, though this was only used to arrive at global, regional and subregional figures (box figure). As a result there are no internationally comparable trend data at the national level.
Box I-2 continued >>
12
The Asia-Pacific region includes the world’s two most populous countries – China and India – so the region’s overall achievement on poverty, as on other indicators, will be swayed by their performance. To illustrate this, Table I-1 also shows the performance of different country groupings that exclude Asia’s two giants. Thus ‘Asia and the Pacific excluding China and India’ on some indicators has performed worse than the region as a whole: it has progressed only slowly in ensuring primary enrolment, and regressed on HIV prevalence. On the other hand, this group of smaller countries has done better on gender parity in secondary educational attainment on which it is an early achiever.
Starting from a low base on many MDG indicators, South Asia has made good progress on eight indicators, but is progressing only slowly on many others. Given the weight of India in subregional aggregates, it is also useful to consider ‘South Asia without India’. This grouping is on track for poverty,
but progressing slowly on primary enrolment and the provision of clean water supplies, and regressing in HIV prevalence and forest cover.
As a group, the Pacific Island countries have been less successful – regressing or making no progress in 11 indicators and advancing only slowly in another two, those for infant and under-five mortality. Papua New Guinea is home to almost 70 per cent of the Pacific Island countries’ population, so estimates for the subregion are inevitably affected by this country’s performance. Table I-1, therefore, presents estimates for the Pacific Island countries excluding Papua New Guinea. This subgroup has made better progress on gender equality in education and is also moving forward, albeit slowly, on ensuring that births are attended by skilled health professionals. However, it should be noted that the accuracy of Pacific Island aggregates for many indicators is hampered by a shortage of data (Box I-3).
Box I-3 – Routes to faster MDG progress in the Pacific
The Pacific Island countries have been making slow progress on the MDGs. To some extent this reflects slow economic development in general, but it is also linked with a general weakness in institutions and a lack of capacity for management and implementation – including the ability to gather the necessary data.
Pacific Island governments want to scale up their MDG efforts and allocate resources more effectively and efficiently. For this they will need more accurate estimates of the costs of service delivery, so that they can better integrate MDGs into national budgets and
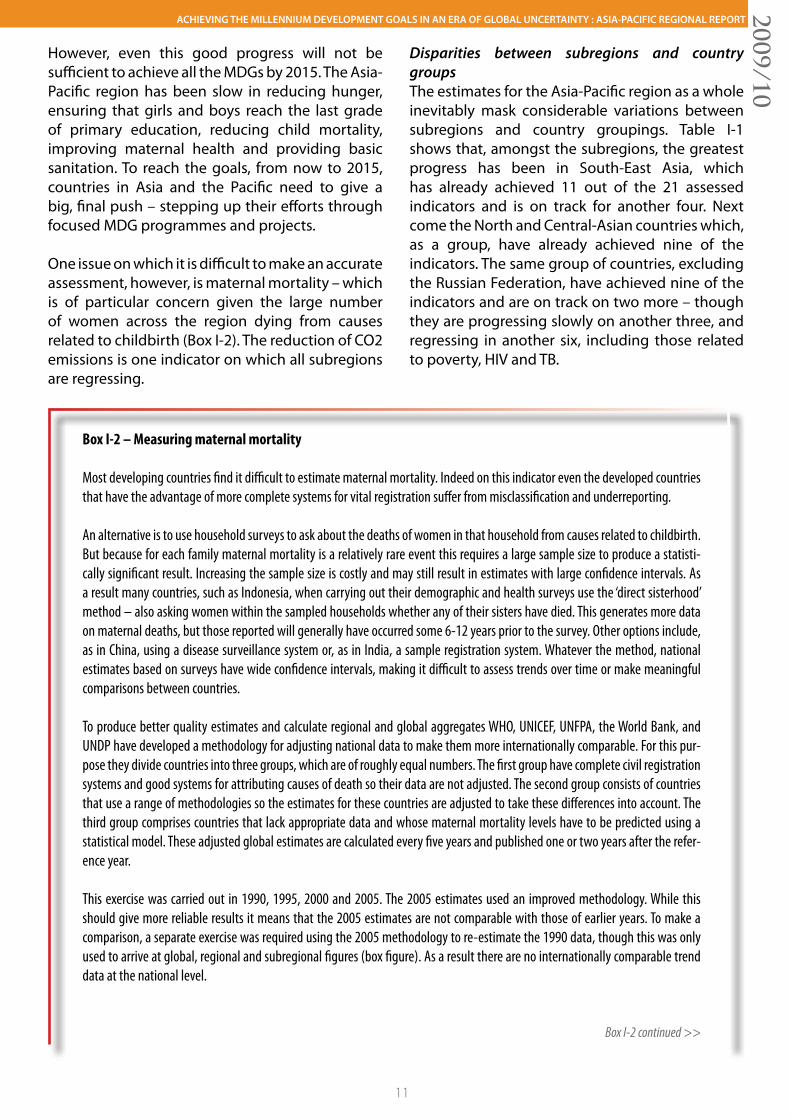
0 200 400 600
Maternal Mortality (per 100,000 live births)
1990 2005
Southern Asia
South-Eastern Asia
Oceania
Eastern Asia
Note: The regional groupings here are those in the 2009 Millennium Development Goals Report. Available at http://mdgs.un.org under ‘data’.
Maternal mortality ratios by subregion, per 100,000 live births
The MDG target is to reduce maternal mortality by three-quarters between 1990 and 2015. On the basis of these estimates, however, only Eastern Asia will come anywhere close to achieving this.
Box I-3 continued >>
ACHIEVING THE MILLENNIUM DEVELOPMENT GOALS IN AN ERA OF GLOBAL UNCERTAINTY : ASIA-PACIFIC REGIONAL REPORT2009/10
13
development strategies. At present, most governments in the subregion base their budgets on outputs rather than on outcomes in the form of identifiable long-term improvements in service standards. Some are now altering their approaches, though it will take some time for these efforts to bear fruit.
The Pacific island countries also have difficulties in tracking the MDGs. Some of the problems arise because most of the countries have small populations. The indicator on maternal mortality, for example, for which the denominator is 100,000 live births, is difficult to apply in a country with only a few thousand people. And, for this and other indicators, a relatively small number of events can cause wide fluctuations in national rates. There are also concerns that the MDG indicators fail to address specific concerns in the Pacific. In education, for example, the problem is not so much coverage as quality.
Moreover, on many issues a lot of the necessary data remain unavailable, especially at the sub-national level. This is partly due to inadequate systems for data collection and management. In the past, national statistical offices have had quite narrow mandates – dealing mainly with censuses, national surveys, compilations of financial, trade and immigration statistics, and extracts from birth and death registries.
The MDGs, however, require many new types of data which, thanks to the wider availability of information technology, may come from diverse sources, including other government departments and line ministries. In this new information environment, the chroni-cally understaffed and under-resourced national statistics offices face being overwhelmed or overlooked, even though they retain the power to declare information official or otherwise.
Recognizing these and other issues, in 2005 the Pacific Islands Forum Leaders adopted the Pacific Plan, which envisaged incorpo-rating the MDGs in National Sustainable Development Strategies – using Pacific-relevant indicators. At the national level, some countries have established task forces to facilitate and monitor MDG progress. Two countries have also agreed additional goals that reflect national priorities. The Cook Islands has an MDG9 on Improved Governance, and Niue has one on Population Development.
The countries of the Pacific should also be able to rely on international support. Australia, a major donor, has reemphasized its com-mitment to the MDGs through a major programme of Pacific Partnerships for Development. The UNDP has also provided leadership and assistance to most countries in compiling National MDG reports and organizing national and regional workshops on MDG-based planning, costing and budgeting. A regional MDG network could also help countries share information resources and good practices.
There are similar disparities between country groups. The region’s 14 least developed countries have made slow or no progress on most indicators – performing well only on gender equality in primary and secondary education and on reducing the prevalence of HIV and TB.
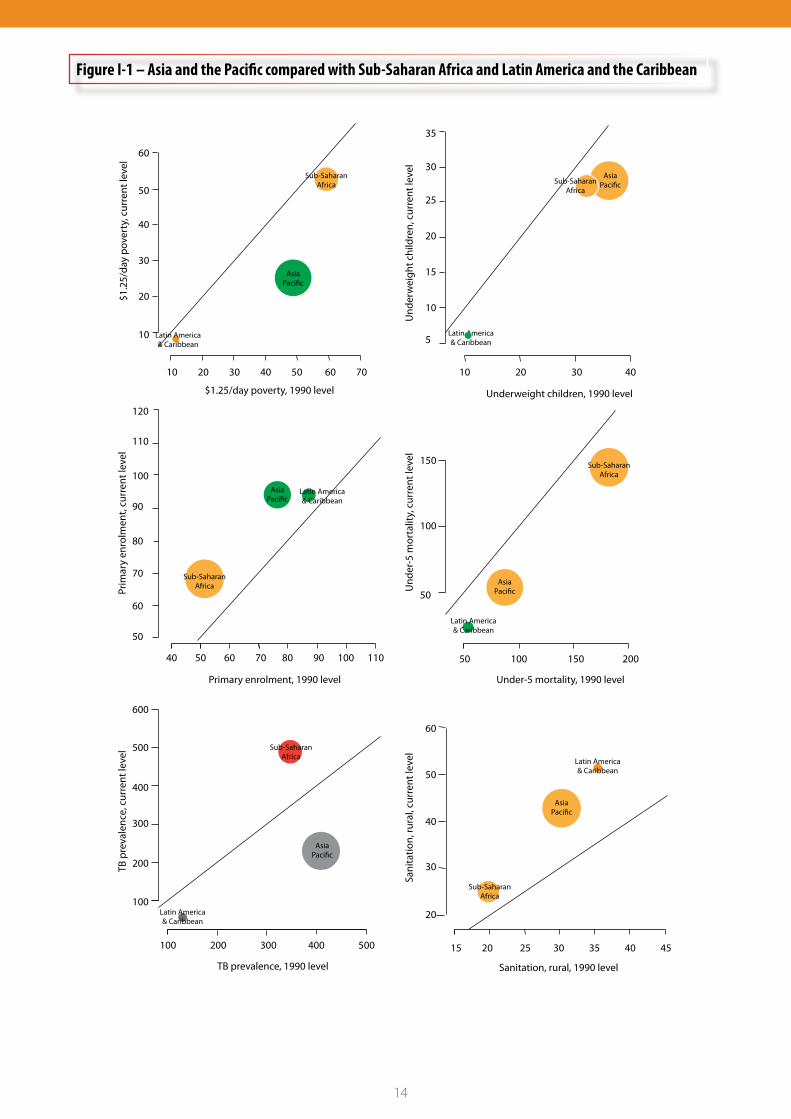
Comparison with other global regionsThe Asia-Pacific region as a whole has made more progress than Sub-Saharan Africa but less than Latin America and the Caribbean. The comparison between these three global regions is encapsulated in Figure I-1 for six indicators. In these charts, the size of the bubbles is in proportion to the population currently affected. The sloping line divides each chart into two parts: if the bubble is above the line, since 1990 the values on that indicator have increased; below the line they have decreased. The colours correspond to those of the on- or off-track progress symbols.
As these charts show, the Asia-Pacific region lags behind Sub-Saharan Africa only on under-five children underweight, but is typically behind Latin America and the Caribbean on most other indica-tors – coming close only for primary enrolment. The charts confirm, for example, that Asia and the Pacific is on track for reducing poverty – though the region’s average poverty rate is still higher than that in Latin America and the Caribbean and the Asia-Pacific region has the largest number of poor people. Indeed these charts emphasize the reality that, because of its larger population size, on most indicators, Asia and the Pacific has the greatest numbers of people affected – a particu-larly serious situation for underweight children, under-five mortality and rural sanitation, for which the region as a whole is off track.
14
60
50
40
30
20
10
35
30
25
20
15
10
5
10 20 30 40 50 60 70 10 20 30 40
40 50 60 70 80 90 100 110 50 100 150 200
15 20 25 30 35 40 45100 200 300 400 500
120
110
100
90
80
70
60
50
150
100
50
60
50
40
30
20
600
500
400
300
200
100
$1.2
5/da
y po
vert
y, c
urre
nt le
vel
$1.25/day poverty, 1990 level Underweight children, 1990 level
Primary enrolment, 1990 level Under-5 mortality, 1990 level
TB prevalence, 1990 level Sanitation, rural, 1990 level
Und
er-5
mor
talit
y, c
urre
nt le
vel
Prim
ary
enro
lmen
t, cu
rren
t lev
el
Und
erw
eigh
t chi
ldre
n, c
urre
nt le
vel
TB p
reva
lenc
e, c
urre
nt le
vel
Sani
tatio
n, ru
ral,
curr
ent l
evel
Sub-SaharanAfrica
Sub-SaharanAfrica
Sub-SaharanAfrica
Sub-SaharanAfrica
Sub-SaharanAfrica Sub-Saharan
Africa
AsiaPaci�c
AsiaPaci�c
AsiaPaci�c
AsiaPaci�c
AsiaPaci�c
Latin America& Caribbean
Latin America& Caribbean
Latin America& Caribbean
Latin America& Caribbean
Latin America& Caribbean
AsiaPaci�c
Latin America& Caribbean
Figure I-1 – Asia and the Pacific compared with Sub-Saharan Africa and Latin America and the Caribbean

ACHIEVING THE MILLENNIUM DEVELOPMENT GOALS IN AN ERA OF GLOBAL UNCERTAINTY : ASIA-PACIFIC REGIONAL REPORT2009/10
15
In the case of rural sanitation, for example, the Asia-Pacific region has more than 70 per cent of the developing world’s people who are affected – which in 2006 amounted to more than 1.3 billion people. This is illustrated in Figure I-2 for this and other selected indicators, showing that Asia and the Pacific is also home to over 70 per cent of the world’s under-five children underweight, 68 per cent of people infected with tuberculosis and the same proportion of those living in extreme poverty. Even on indicators for which Asia and the Pacific has made significant progress, it still has a large number of people who live in deprivation. When it comes to providing people in rural areas with access to clean water, for example, the region
0 10 20 30 40 50 60 70 80 90 100
1335
98
9
978
427
406
3
60
35
5
Millions1990 Latest
Without Basic Sanitation, Rural
Under-5 Underweight
Infected with TB
Living below $1,25/day
Without Basic Sanitation, Urban
Without Clean Water, Rural
Under-5 Mortality
Without Clean Water, Urban
Out of Primary School
Living with HIV
1487
140
12
1527
338
800
7
58
52
5
The latest years are: 2006 for primary enrolment, clean water rural and urban, $1.25/day poverty, basic sanitation in rural and urban; and 2007 for HIV prevalence, under-five mortality, TB prevalence, and underweight children.
is an early achiever but still has 406 million people deprived.
For most indicators, the slow progress or setbacks in achieving the MDGs will have serious gender implications. When resources are short, women and girls are typically hit hardest – and shoulder most of the burden for coping with any additional pressure on the household. By the same token, however, achieving the Goals will have particular benefits for women, providing them with more opportunities and greater security, while enabling them to strengthen their capabilities (Table I-2).
Figure I-2 – The Asia-Pacific region’s share of the developing world’s deprived people, selected indicators
16
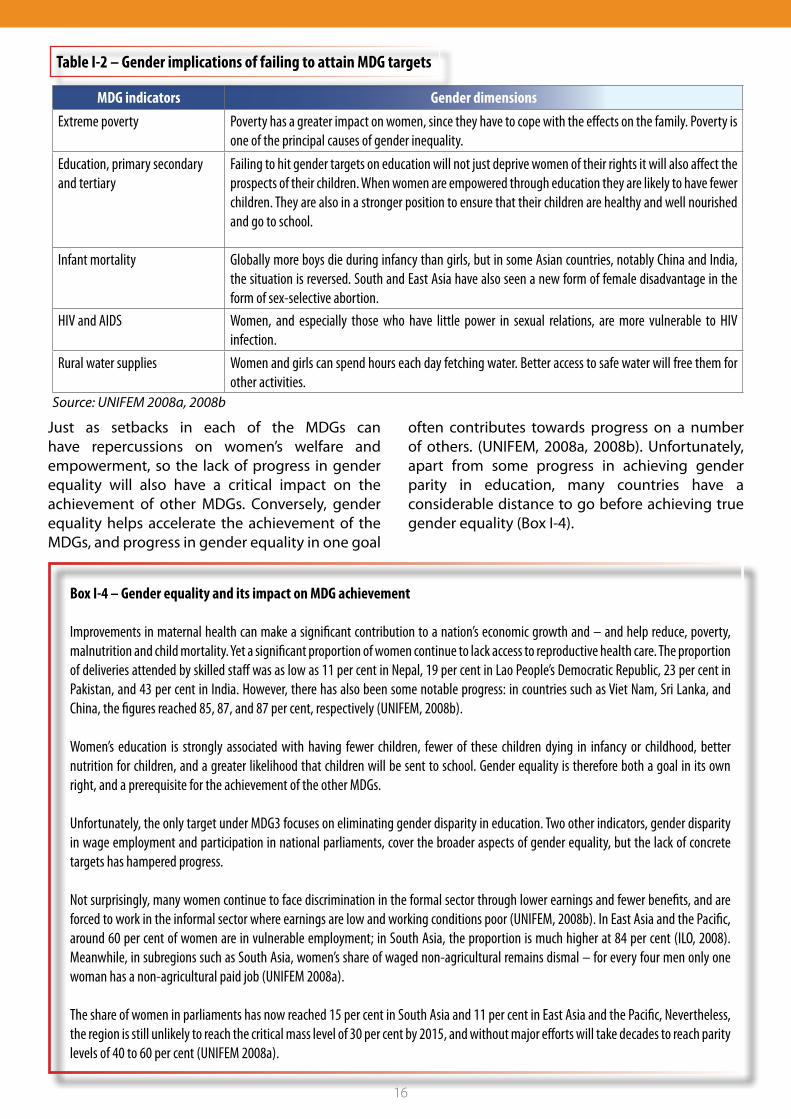
MDG indicators Gender dimensions Extreme poverty Poverty has a greater impact on women, since they have to cope with the effects on the family. Poverty is
one of the principal causes of gender inequality. Education, primary secondary and tertiary
Failing to hit gender targets on education will not just deprive women of their rights it will also affect the prospects of their children. When women are empowered through education they are likely to have fewer children. They are also in a stronger position to ensure that their children are healthy and well nourished and go to school.
Infant mortality Globally more boys die during infancy than girls, but in some Asian countries, notably China and India, the situation is reversed. South and East Asia have also seen a new form of female disadvantage in the form of sex-selective abortion.
HIV and AIDS Women, and especially those who have little power in sexual relations, are more vulnerable to HIV infection.
Rural water supplies Women and girls can spend hours each day fetching water. Better access to safe water will free them for other activities.
Table I-2 – Gender implications of failing to attain MDG targets
Source: UNIFEM 2008a, 2008b
Just as setbacks in each of the MDGs can have repercussions on women’s welfare and empowerment, so the lack of progress in gender equality will also have a critical impact on the achievement of other MDGs. Conversely, gender equality helps accelerate the achievement of the MDGs, and progress in gender equality in one goal
often contributes towards progress on a number of others. (UNIFEM, 2008a, 2008b). Unfortunately, apart from some progress in achieving gender parity in education, many countries have a considerable distance to go before achieving true gender equality (Box I-4).
Box I-4 – Gender equality and its impact on MDG achievement
Improvements in maternal health can make a significant contribution to a nation’s economic growth and – and help reduce, poverty, malnutrition and child mortality. Yet a significant proportion of women continue to lack access to reproductive health care. The proportion of deliveries attended by skilled staff was as low as 11 per cent in Nepal, 19 per cent in Lao People’s Democratic Republic, 23 per cent in Pakistan, and 43 per cent in India. However, there has also been some notable progress: in countries such as Viet Nam, Sri Lanka, and China, the figures reached 85, 87, and 87 per cent, respectively (UNIFEM, 2008b).
Women’s education is strongly associated with having fewer children, fewer of these children dying in infancy or childhood, better nutrition for children, and a greater likelihood that children will be sent to school. Gender equality is therefore both a goal in its own right, and a prerequisite for the achievement of the other MDGs.
Unfortunately, the only target under MDG3 focuses on eliminating gender disparity in education. Two other indicators, gender disparity in wage employment and participation in national parliaments, cover the broader aspects of gender equality, but the lack of concrete targets has hampered progress.
Not surprisingly, many women continue to face discrimination in the formal sector through lower earnings and fewer benefits, and are forced to work in the informal sector where earnings are low and working conditions poor (UNIFEM, 2008b). In East Asia and the Pacific, around 60 per cent of women are in vulnerable employment; in South Asia, the proportion is much higher at 84 per cent (ILO, 2008). Meanwhile, in subregions such as South Asia, women’s share of waged non-agricultural remains dismal – for every four men only one woman has a non-agricultural paid job (UNIFEM 2008a).
The share of women in parliaments has now reached 15 per cent in South Asia and 11 per cent in East Asia and the Pacific, Nevertheless, the region is still unlikely to reach the critical mass level of 30 per cent by 2015, and without major efforts will take decades to reach parity levels of 40 to 60 per cent (UNIFEM 2008a).
ACHIEVING THE MILLENNIUM DEVELOPMENT GOALS IN AN ERA OF GLOBAL UNCERTAINTY : ASIA-PACIFIC REGIONAL REPORT2009/10
17
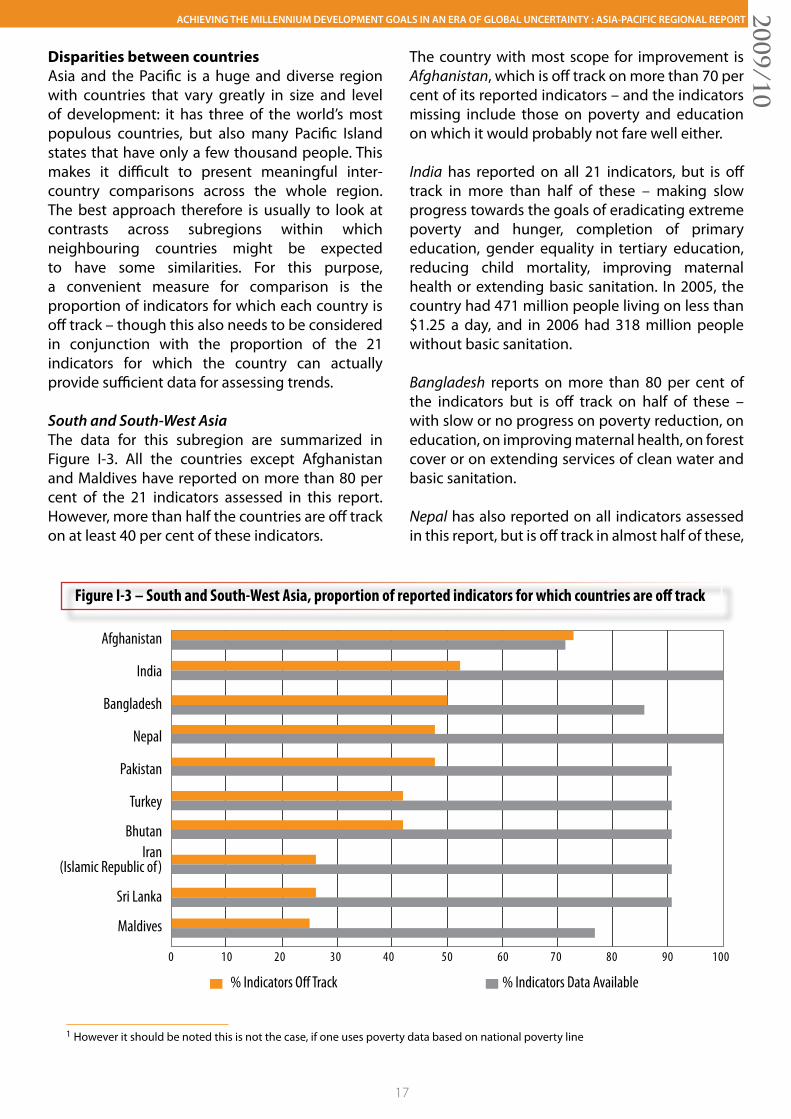
Disparities between countriesAsia and the Pacific is a huge and diverse region with countries that vary greatly in size and level of development: it has three of the world’s most populous countries, but also many Pacific Island states that have only a few thousand people. This makes it difficult to present meaningful inter-country comparisons across the whole region. The best approach therefore is usually to look at contrasts across subregions within which neighbouring countries might be expected to have some similarities. For this purpose, a convenient measure for comparison is the proportion of indicators for which each country is off track – though this also needs to be considered in conjunction with the proportion of the 21 indicators for which the country can actually provide sufficient data for assessing trends.
South and South-West AsiaThe data for this subregion are summarized in Figure I-3. All the countries except Afghanistan and Maldives have reported on more than 80 per cent of the 21 indicators assessed in this report. However, more than half the countries are off track on at least 40 per cent of these indicators.
0 10 20 30 40 50 60 70 80 90 100
% Indicators O� Track % Indicators Data Available
Afghanistan
India
Bangladesh
Nepal
Pakistan
Turkey
BhutanIran
(Islamic Republic of)
Sri Lanka
Maldives
Figure I-3 – South and South-West Asia, proportion of reported indicators for which countries are off track
The country with most scope for improvement is Afghanistan, which is off track on more than 70 per cent of its reported indicators – and the indicators missing include those on poverty and education on which it would probably not fare well either.
India has reported on all 21 indicators, but is off track in more than half of these – making slow progress towards the goals of eradicating extreme poverty and hunger, completion of primary education, gender equality in tertiary education, reducing child mortality, improving maternal health or extending basic sanitation. In 2005, the country had 471 million people living on less than $1.25 a day, and in 2006 had 318 million people without basic sanitation.
Bangladesh reports on more than 80 per cent of the indicators but is off track on half of these – with slow or no progress on poverty reduction, on education, on improving maternal health, on forest cover or on extending services of clean water and basic sanitation.
Nepal has also reported on all indicators assessed in this report, but is off track in almost half of these,
1 However it should be noted this is not the case, if one uses poverty data based on national poverty line
18
including those on reducing extreme poverty and hunger, on providing universal primary education, on improving maternal health and on providing basic sanitation.
Pakistan is in the same position as Nepal in aggre-gate terms – though the composition of indicators covered and the corresponding achievements dif-fer. The country has been successful on poverty, on which it is an early achiever1, and is on track for basic sanitation. On the other hand, Pakistan has made no significant progress on child mal-nutrition and is moving only slowly on under-five mortality, and on maternal health. It has also made slow progress on halving the proportion of people without sustainable access to safe drinking water.
Turkey and Bhutan are off track on more than 40 per cent of their reported indicators, while the Islamic Republic of Iran and Sri Lanka are off track on one third. A commendably strong performer is the Maldives, which despite being one of the subregion’s five LDCs is an early achiever on 9 of 16 reported indicators and on track on another three.
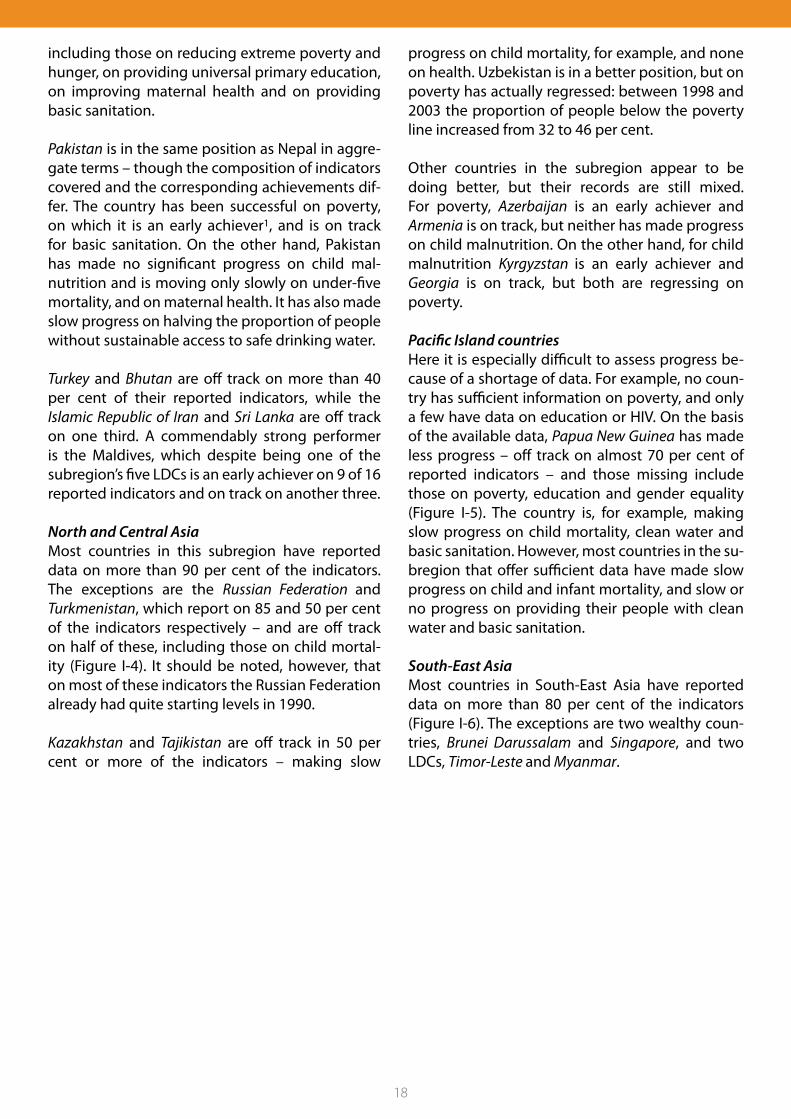
North and Central AsiaMost countries in this subregion have reported data on more than 90 per cent of the indicators. The exceptions are the Russian Federation and Turkmenistan, which report on 85 and 50 per cent of the indicators respectively – and are off track on half of these, including those on child mortal-ity (Figure I-4). It should be noted, however, that on most of these indicators the Russian Federation already had quite starting levels in 1990.
Kazakhstan and Tajikistan are off track in 50 per cent or more of the indicators – making slow
progress on child mortality, for example, and none on health. Uzbekistan is in a better position, but on poverty has actually regressed: between 1998 and 2003 the proportion of people below the poverty line increased from 32 to 46 per cent.
Other countries in the subregion appear to be doing better, but their records are still mixed. For poverty, Azerbaijan is an early achiever and Armenia is on track, but neither has made progress on child malnutrition. On the other hand, for child malnutrition Kyrgyzstan is an early achiever and Georgia is on track, but both are regressing on poverty.
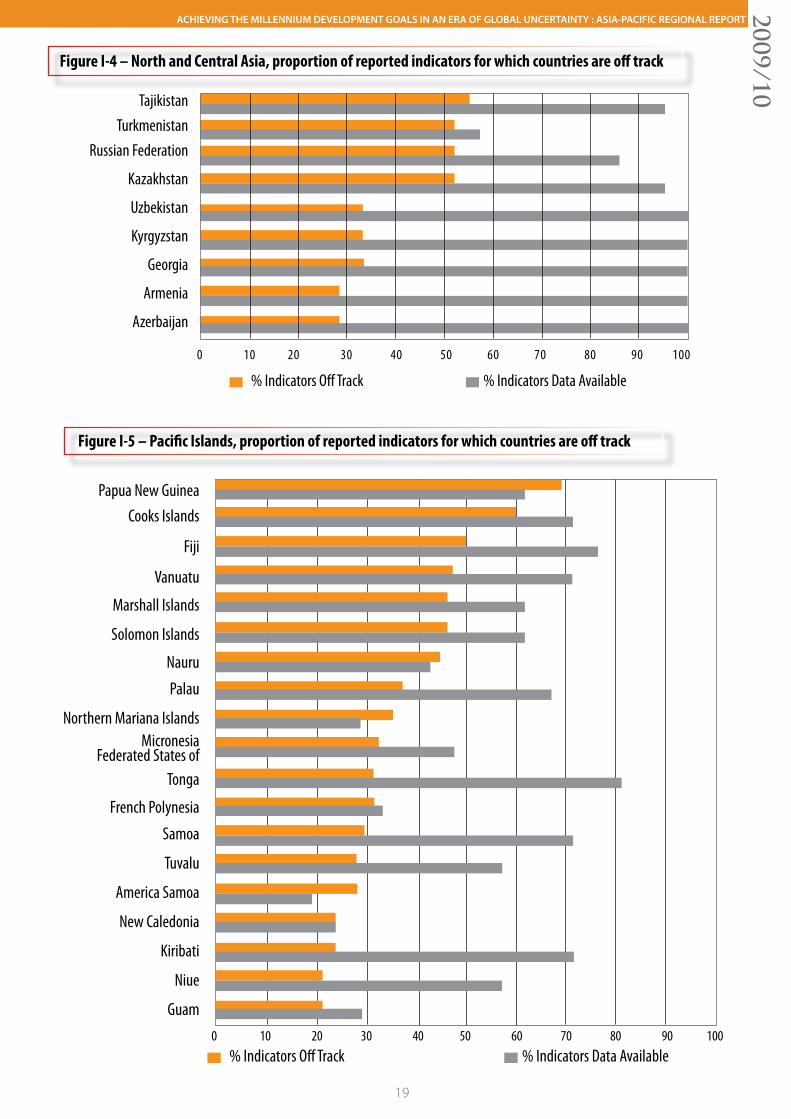
Pacific Island countriesHere it is especially difficult to assess progress be-cause of a shortage of data. For example, no coun-try has sufficient information on poverty, and only a few have data on education or HIV. On the basis of the available data, Papua New Guinea has made less progress – off track on almost 70 per cent of reported indicators – and those missing include those on poverty, education and gender equality (Figure I-5). The country is, for example, making slow progress on child mortality, clean water and basic sanitation. However, most countries in the su-bregion that offer sufficient data have made slow progress on child and infant mortality, and slow or no progress on providing their people with clean water and basic sanitation.
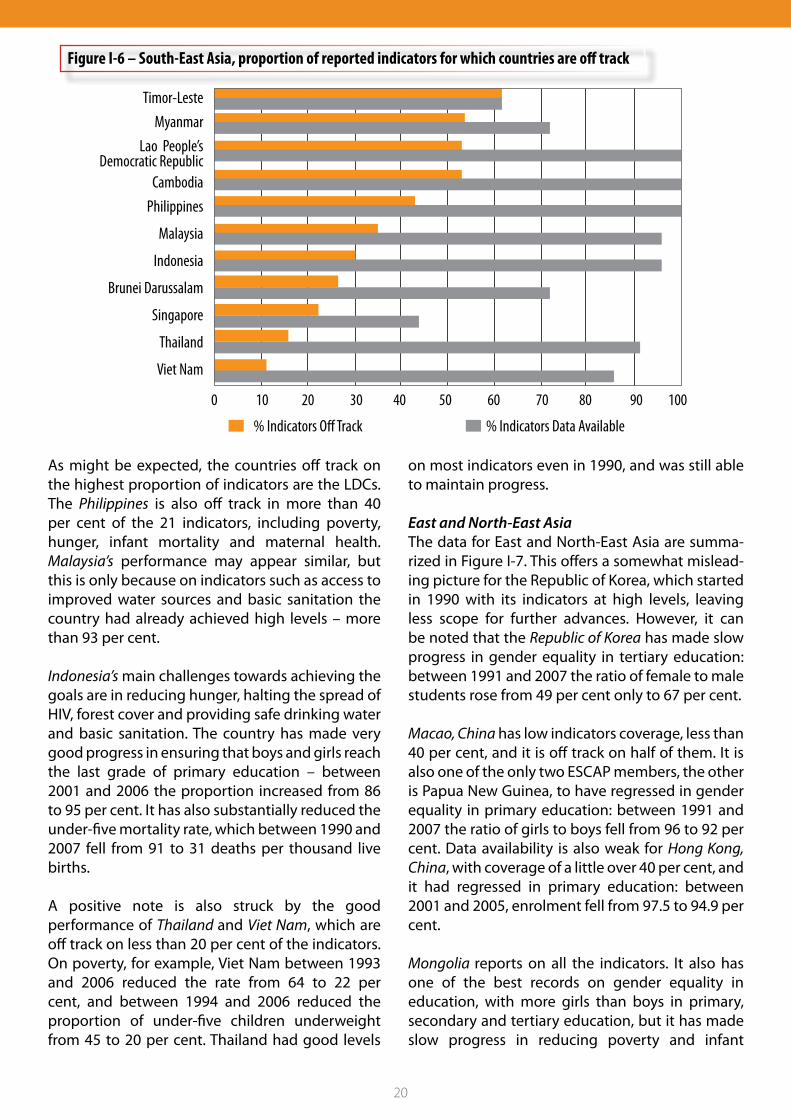
South-East AsiaMost countries in South-East Asia have reported data on more than 80 per cent of the indicators (Figure I-6). The exceptions are two wealthy coun-tries, Brunei Darussalam and Singapore, and two LDCs, Timor-Leste and Myanmar.
ACHIEVING THE MILLENNIUM DEVELOPMENT GOALS IN AN ERA OF GLOBAL UNCERTAINTY : ASIA-PACIFIC REGIONAL REPORT2009/10
19
0 10 20 30 40 50 60 70 80 90 100
% Indicators O� Track % Indicators Data Available
TajikistanTurkmenistan
Russian Federation
Kazakhstan
Uzbekistan
Kyrgyzstan
Georgia
Armenia
Azerbaijan
Figure I-4 – North and Central Asia, proportion of reported indicators for which countries are off track
Figure I-5 – Pacific Islands, proportion of reported indicators for which countries are off track
% Indicators O� Track % Indicators Data Available
Papua New GuineaCooks Islands
Fiji
Vanuatu
Marshall Islands
Solomon Islands
Nauru
Palau
Northern Mariana IslandsMicronesia
Federated States ofTonga
French Polynesia
Samoa
Tuvalu
America Samoa
New Caledonia
Kiribati
Niue
Guam0 10 20 30 40 50 60 70 80 90 100
20
Figure I-6 – South-East Asia, proportion of reported indicators for which countries are off track
0 10 20 30 40 50 60 70 80 90 100
% Indicators O� Track % Indicators Data Available
Timor-LesteMyanmar
Lao People’s Democratic Republic
CambodiaPhilippines
Malaysia
Indonesia
Brunei Darussalam
Singapore
Thailand
Viet Nam
As might be expected, the countries off track on the highest proportion of indicators are the LDCs. The Philippines is also off track in more than 40 per cent of the 21 indicators, including poverty, hunger, infant mortality and maternal health. Malaysia’s performance may appear similar, but this is only because on indicators such as access to improved water sources and basic sanitation the country had already achieved high levels – more than 93 per cent.
Indonesia’s main challenges towards achieving the goals are in reducing hunger, halting the spread of HIV, forest cover and providing safe drinking water and basic sanitation. The country has made very good progress in ensuring that boys and girls reach the last grade of primary education – between 2001 and 2006 the proportion increased from 86 to 95 per cent. It has also substantially reduced the under-five mortality rate, which between 1990 and 2007 fell from 91 to 31 deaths per thousand live births.
A positive note is also struck by the good performance of Thailand and Viet Nam, which are off track on less than 20 per cent of the indicators. On poverty, for example, Viet Nam between 1993 and 2006 reduced the rate from 64 to 22 per cent, and between 1994 and 2006 reduced the proportion of under-five children underweight from 45 to 20 per cent. Thailand had good levels
on most indicators even in 1990, and was still able to maintain progress.
East and North-East AsiaThe data for East and North-East Asia are summa-rized in Figure I-7. This offers a somewhat mislead-ing picture for the Republic of Korea, which started in 1990 with its indicators at high levels, leaving less scope for further advances. However, it can be noted that the Republic of Korea has made slow progress in gender equality in tertiary education: between 1991 and 2007 the ratio of female to male students rose from 49 per cent only to 67 per cent.
Macao, China has low indicators coverage, less than 40 per cent, and it is off track on half of them. It is also one of the only two ESCAP members, the other is Papua New Guinea, to have regressed in gender equality in primary education: between 1991 and 2007 the ratio of girls to boys fell from 96 to 92 per cent. Data availability is also weak for Hong Kong, China, with coverage of a little over 40 per cent, and it had regressed in primary education: between 2001 and 2005, enrolment fell from 97.5 to 94.9 per cent.
Mongolia reports on all the indicators. It also has one of the best records on gender equality in education, with more girls than boys in primary, secondary and tertiary education, but it has made slow progress in reducing poverty and infant
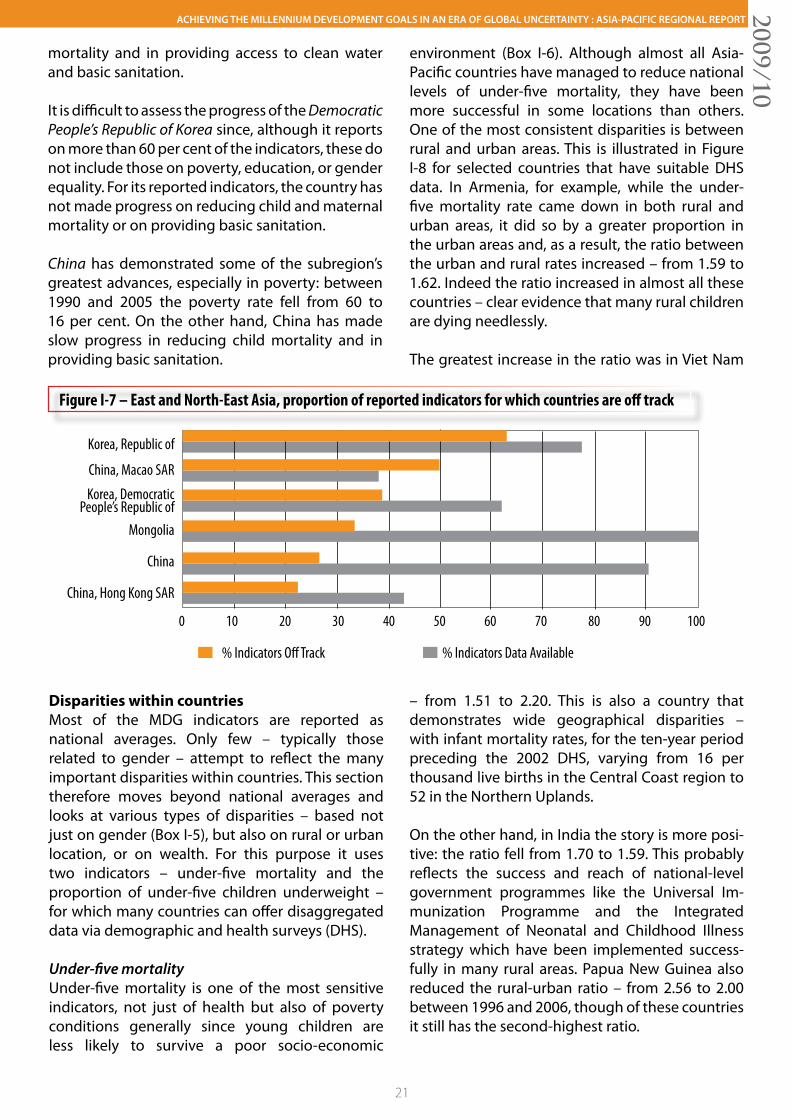
ACHIEVING THE MILLENNIUM DEVELOPMENT GOALS IN AN ERA OF GLOBAL UNCERTAINTY : ASIA-PACIFIC REGIONAL REPORT2009/10
21
Figure I-7 – East and North-East Asia, proportion of reported indicators for which countries are off track
mortality and in providing access to clean water and basic sanitation.
It is difficult to assess the progress of the Democratic People’s Republic of Korea since, although it reports on more than 60 per cent of the indicators, these do not include those on poverty, education, or gender equality. For its reported indicators, the country has not made progress on reducing child and maternal mortality or on providing basic sanitation.
China has demonstrated some of the subregion’s greatest advances, especially in poverty: between 1990 and 2005 the poverty rate fell from 60 to 16 per cent. On the other hand, China has made slow progress in reducing child mortality and in providing basic sanitation.
0 10 20 30 40 50 60 70 80 90 100
Korea, Republic of
China, Macao SAR
Korea, Democratic People’s Republic of
Mongolia
China
China, Hong Kong SAR
% Indicators O� Track % Indicators Data Available
Disparities within countriesMost of the MDG indicators are reported as national averages. Only few – typically those related to gender – attempt to reflect the many important disparities within countries. This section therefore moves beyond national averages and looks at various types of disparities – based not just on gender (Box I-5), but also on rural or urban location, or on wealth. For this purpose it uses two indicators – under-five mortality and the proportion of under-five children underweight – for which many countries can offer disaggregated data via demographic and health surveys (DHS).
Under-five mortalityUnder-five mortality is one of the most sensitive indicators, not just of health but also of poverty conditions generally since young children are less likely to survive a poor socio-economic
environment (Box I-6). Although almost all Asia-Pacific countries have managed to reduce national levels of under-five mortality, they have been more successful in some locations than others. One of the most consistent disparities is between rural and urban areas. This is illustrated in Figure I-8 for selected countries that have suitable DHS data. In Armenia, for example, while the under-five mortality rate came down in both rural and urban areas, it did so by a greater proportion in the urban areas and, as a result, the ratio between the urban and rural rates increased – from 1.59 to 1.62. Indeed the ratio increased in almost all these countries – clear evidence that many rural children are dying needlessly.
The greatest increase in the ratio was in Viet Nam
– from 1.51 to 2.20. This is also a country that demonstrates wide geographical disparities – with infant mortality rates, for the ten-year period preceding the 2002 DHS, varying from 16 per thousand live births in the Central Coast region to 52 in the Northern Uplands.
On the other hand, in India the story is more posi-tive: the ratio fell from 1.70 to 1.59. This probably reflects the success and reach of national-level government programmes like the Universal Im-munization Programme and the Integrated Management of Neonatal and Childhood Illness strategy which have been implemented success-fully in many rural areas. Papua New Guinea also reduced the rural-urban ratio – from 2.56 to 2.00 between 1996 and 2006, though of these countries it still has the second-highest ratio.
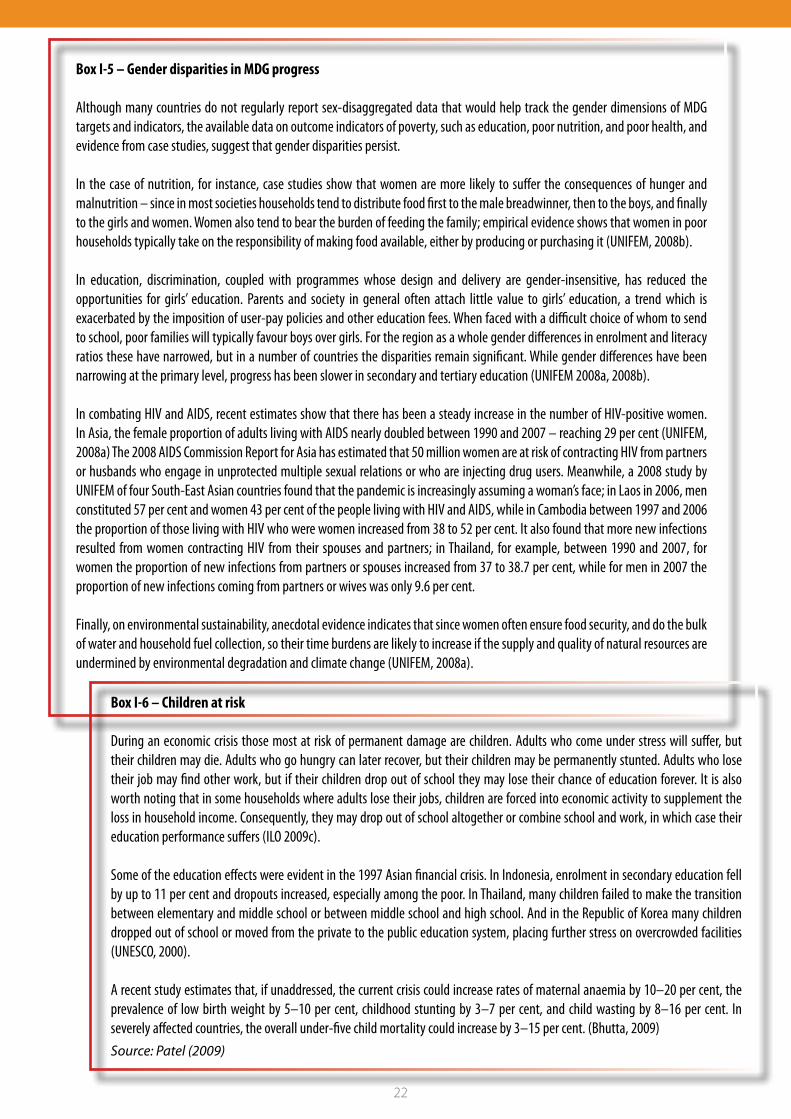
22
Box I-5 – Gender disparities in MDG progress
Although many countries do not regularly report sex-disaggregated data that would help track the gender dimensions of MDG targets and indicators, the available data on outcome indicators of poverty, such as education, poor nutrition, and poor health, and evidence from case studies, suggest that gender disparities persist.
In the case of nutrition, for instance, case studies show that women are more likely to suffer the consequences of hunger and malnutrition – since in most societies households tend to distribute food first to the male breadwinner, then to the boys, and finally to the girls and women. Women also tend to bear the burden of feeding the family; empirical evidence shows that women in poor households typically take on the responsibility of making food available, either by producing or purchasing it (UNIFEM, 2008b).
In education, discrimination, coupled with programmes whose design and delivery are gender-insensitive, has reduced the opportunities for girls’ education. Parents and society in general often attach little value to girls’ education, a trend which is exacerbated by the imposition of user-pay policies and other education fees. When faced with a difficult choice of whom to send to school, poor families will typically favour boys over girls. For the region as a whole gender differences in enrolment and literacy ratios these have narrowed, but in a number of countries the disparities remain significant. While gender differences have been narrowing at the primary level, progress has been slower in secondary and tertiary education (UNIFEM 2008a, 2008b).
In combating HIV and AIDS, recent estimates show that there has been a steady increase in the number of HIV-positive women. In Asia, the female proportion of adults living with AIDS nearly doubled between 1990 and 2007 – reaching 29 per cent (UNIFEM, 2008a) The 2008 AIDS Commission Report for Asia has estimated that 50 million women are at risk of contracting HIV from partners or husbands who engage in unprotected multiple sexual relations or who are injecting drug users. Meanwhile, a 2008 study by UNIFEM of four South-East Asian countries found that the pandemic is increasingly assuming a woman’s face; in Laos in 2006, men constituted 57 per cent and women 43 per cent of the people living with HIV and AIDS, while in Cambodia between 1997 and 2006 the proportion of those living with HIV who were women increased from 38 to 52 per cent. It also found that more new infections resulted from women contracting HIV from their spouses and partners; in Thailand, for example, between 1990 and 2007, for women the proportion of new infections from partners or spouses increased from 37 to 38.7 per cent, while for men in 2007 the proportion of new infections coming from partners or wives was only 9.6 per cent.
Finally, on environmental sustainability, anecdotal evidence indicates that since women often ensure food security, and do the bulk of water and household fuel collection, so their time burdens are likely to increase if the supply and quality of natural resources are undermined by environmental degradation and climate change (UNIFEM, 2008a).
Box I-6 – Children at risk
During an economic crisis those most at risk of permanent damage are children. Adults who come under stress will suffer, but their children may die. Adults who go hungry can later recover, but their children may be permanently stunted. Adults who lose their job may find other work, but if their children drop out of school they may lose their chance of education forever. It is also worth noting that in some households where adults lose their jobs, children are forced into economic activity to supplement the loss in household income. Consequently, they may drop out of school altogether or combine school and work, in which case their education performance suffers (ILO 2009c).
Some of the education effects were evident in the 1997 Asian financial crisis. In Indonesia, enrolment in secondary education fell by up to 11 per cent and dropouts increased, especially among the poor. In Thailand, many children failed to make the transition between elementary and middle school or between middle school and high school. And in the Republic of Korea many children dropped out of school or moved from the private to the public education system, placing further stress on overcrowded facilities (UNESCO, 2000).
A recent study estimates that, if unaddressed, the current crisis could increase rates of maternal anaemia by 10–20 per cent, the prevalence of low birth weight by 5–10 per cent, childhood stunting by 3–7 per cent, and child wasting by 8–16 per cent. In severely affected countries, the overall under-five child mortality could increase by 3–15 per cent. (Bhutta, 2009)Source: Patel (2009)
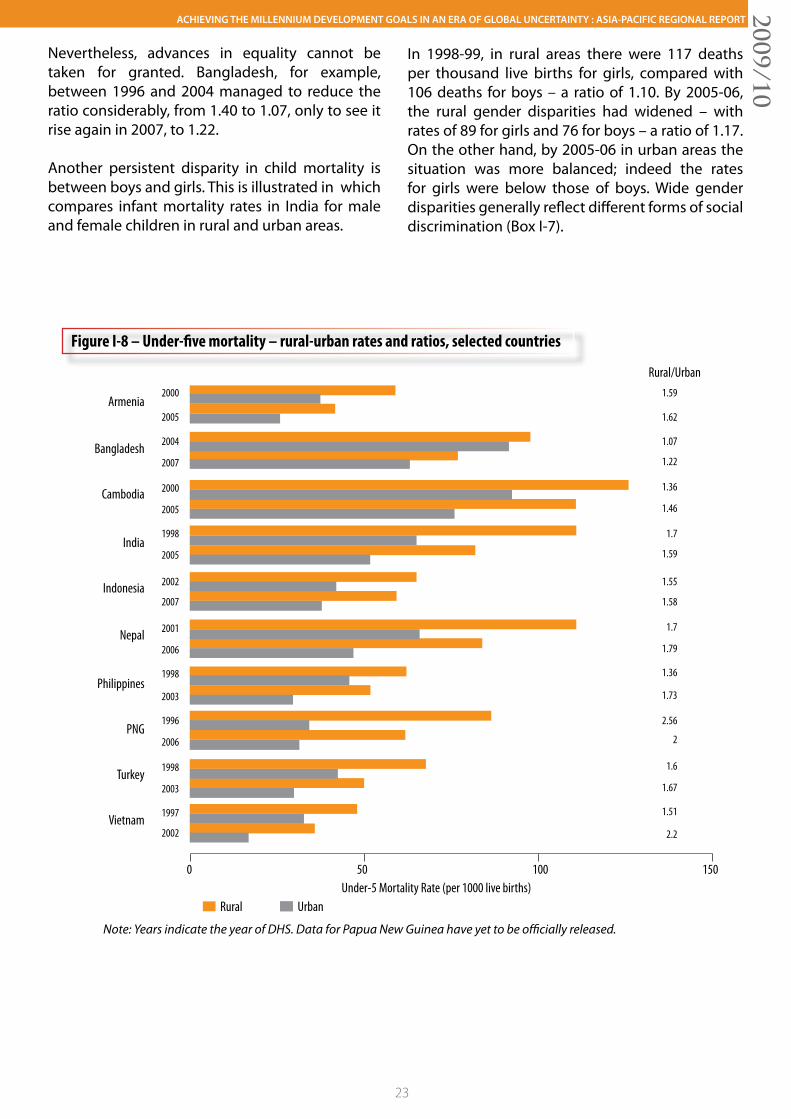
ACHIEVING THE MILLENNIUM DEVELOPMENT GOALS IN AN ERA OF GLOBAL UNCERTAINTY : ASIA-PACIFIC REGIONAL REPORT2009/10
23
Nevertheless, advances in equality cannot be taken for granted. Bangladesh, for example, between 1996 and 2004 managed to reduce the ratio considerably, from 1.40 to 1.07, only to see it rise again in 2007, to 1.22.
Another persistent disparity in child mortality is between boys and girls. This is illustrated in which compares infant mortality rates in India for male and female children in rural and urban areas.
In 1998-99, in rural areas there were 117 deaths per thousand live births for girls, compared with 106 deaths for boys – a ratio of 1.10. By 2005-06, the rural gender disparities had widened – with rates of 89 for girls and 76 for boys – a ratio of 1.17. On the other hand, by 2005-06 in urban areas the situation was more balanced; indeed the rates for girls were below those of boys. Wide gender disparities generally reflect different forms of social discrimination (Box I-7).
Figure I-8 – Under-five mortality – rural-urban rates and ratios, selected countries
Note: Years indicate the year of DHS. Data for Papua New Guinea have yet to be officially released.
0 50 100 150
Rural UrbanUnder-5 Mortality Rate (per 1000 live births)
Armenia
Bangladesh
Cambodia
India
Indonesia
Nepal
Philippines
PNG
Turkey
Vietnam
2000
2005
2004
2007
2000
2005
1998
2005
2002
2007
2001
2006
1998
2003
1996
2006
1998
2003
1997
2002
1.59
1.62
1.07
1.22
1.36
1.46
1.7
1.59
1.55
1.58
1.7
1.79
1.36
1.73
2.56
2
1.6
1.67
1.51
2.2
Rural/Urban
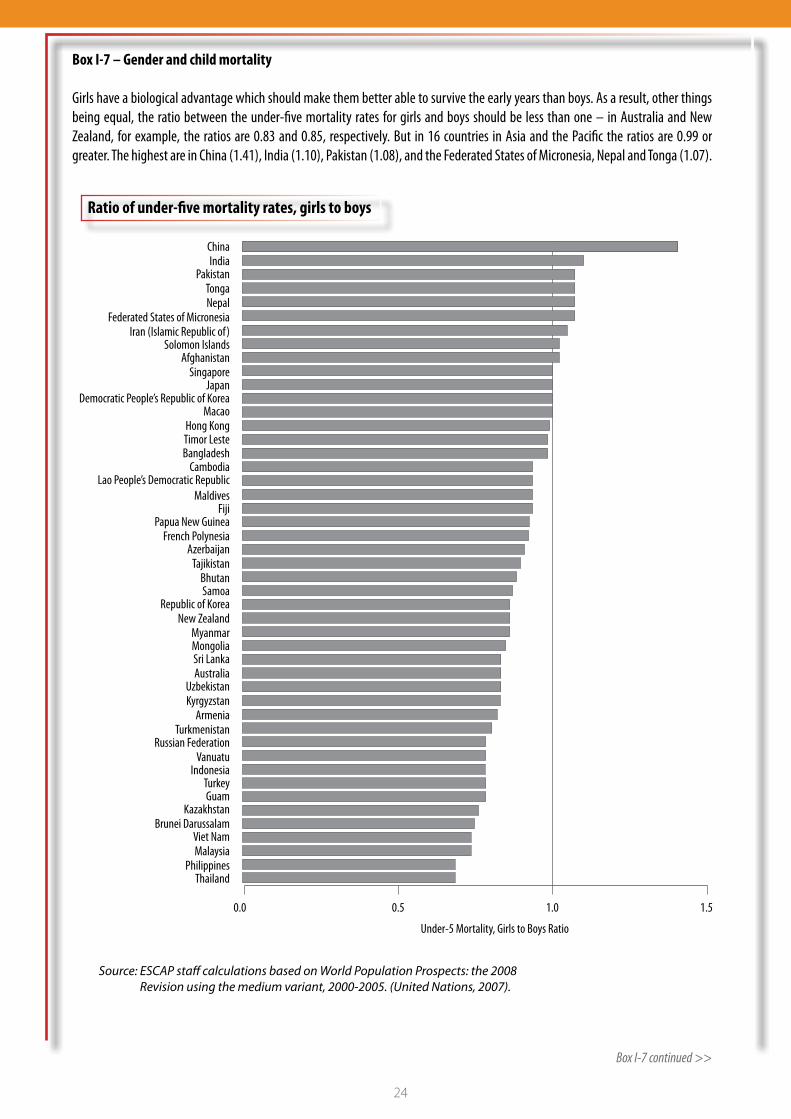
24
Box I-7 – Gender and child mortality
Girls have a biological advantage which should make them better able to survive the early years than boys. As a result, other things being equal, the ratio between the under-five mortality rates for girls and boys should be less than one – in Australia and New Zealand, for example, the ratios are 0.83 and 0.85, respectively. But in 16 countries in Asia and the Pacific the ratios are 0.99 or greater. The highest are in China (1.41), India (1.10), Pakistan (1.08), and the Federated States of Micronesia, Nepal and Tonga (1.07).
ChinaIndia
PakistanTongaNepal
Federated States of MicronesiaIran (Islamic Republic of)
Solomon IslandsAfghanistan
SingaporeJapan
Democratic People’s Republic of KoreaMacao
Hong KongTimor LesteBangladesh
CambodiaLao People’s Democratic Republic
MaldivesFiji
Papua New GuineaFrench Polynesia
AzerbaijanTajikistan
BhutanSamoa
Republic of KoreaNew Zealand
MyanmarMongoliaSri LankaAustralia
UzbekistanKyrgyzstan
ArmeniaTurkmenistan
Russian FederationVanuatu
IndonesiaTurkeyGuam
KazakhstanBrunei Darussalam
Viet NamMalaysia
PhilippinesThailand
Under-5 Mortality, Girls to Boys Ratio
0.0 0.5 1.0 1.5
Ratio of under-five mortality rates, girls to boys
Source: ESCAP staff calculations based on World Population Prospects: the 2008 Revision using the medium variant, 2000-2005. (United Nations, 2007).
Box I-7 continued >>
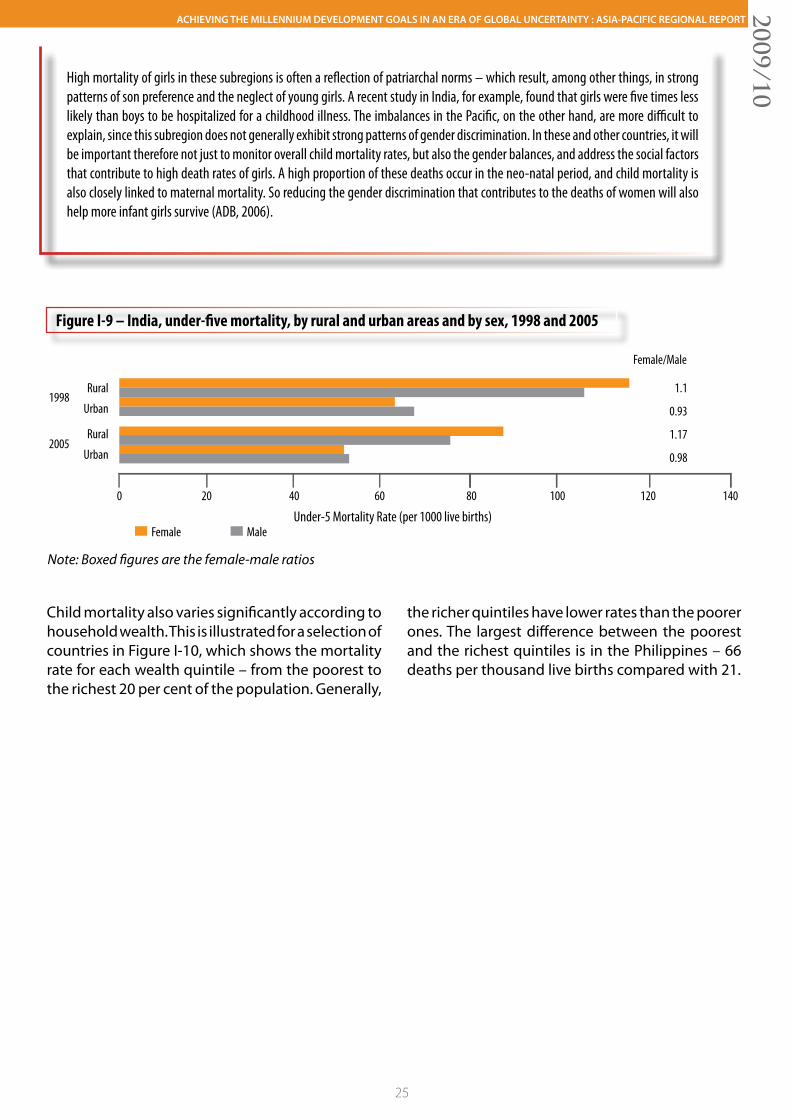
ACHIEVING THE MILLENNIUM DEVELOPMENT GOALS IN AN ERA OF GLOBAL UNCERTAINTY : ASIA-PACIFIC REGIONAL REPORT2009/10
25
High mortality of girls in these subregions is often a reflection of patriarchal norms – which result, among other things, in strong patterns of son preference and the neglect of young girls. A recent study in India, for example, found that girls were five times less likely than boys to be hospitalized for a childhood illness. The imbalances in the Pacific, on the other hand, are more difficult to explain, since this subregion does not generally exhibit strong patterns of gender discrimination. In these and other countries, it will be important therefore not just to monitor overall child mortality rates, but also the gender balances, and address the social factors that contribute to high death rates of girls. A high proportion of these deaths occur in the neo-natal period, and child mortality is also closely linked to maternal mortality. So reducing the gender discrimination that contributes to the deaths of women will also help more infant girls survive (ADB, 2006).
Figure I-9 – India, under-five mortality, by rural and urban areas and by sex, 1998 and 2005
Note: Boxed figures are the female-male ratios
0 20 40 60 80 100 120 140
Female MaleUnder-5 Mortality Rate (per 1000 live births)
Female/Male
Rural
Urban
Rural
Urban
1998
2005
1.1
0.93
1.17
0.98
Child mortality also varies significantly according to household wealth. This is illustrated for a selection of countries in Figure I-10, which shows the mortality rate for each wealth quintile – from the poorest to the richest 20 per cent of the population. Generally,
the richer quintiles have lower rates than the poorer ones. The largest difference between the poorest and the richest quintiles is in the Philippines – 66 deaths per thousand live births compared with 21.
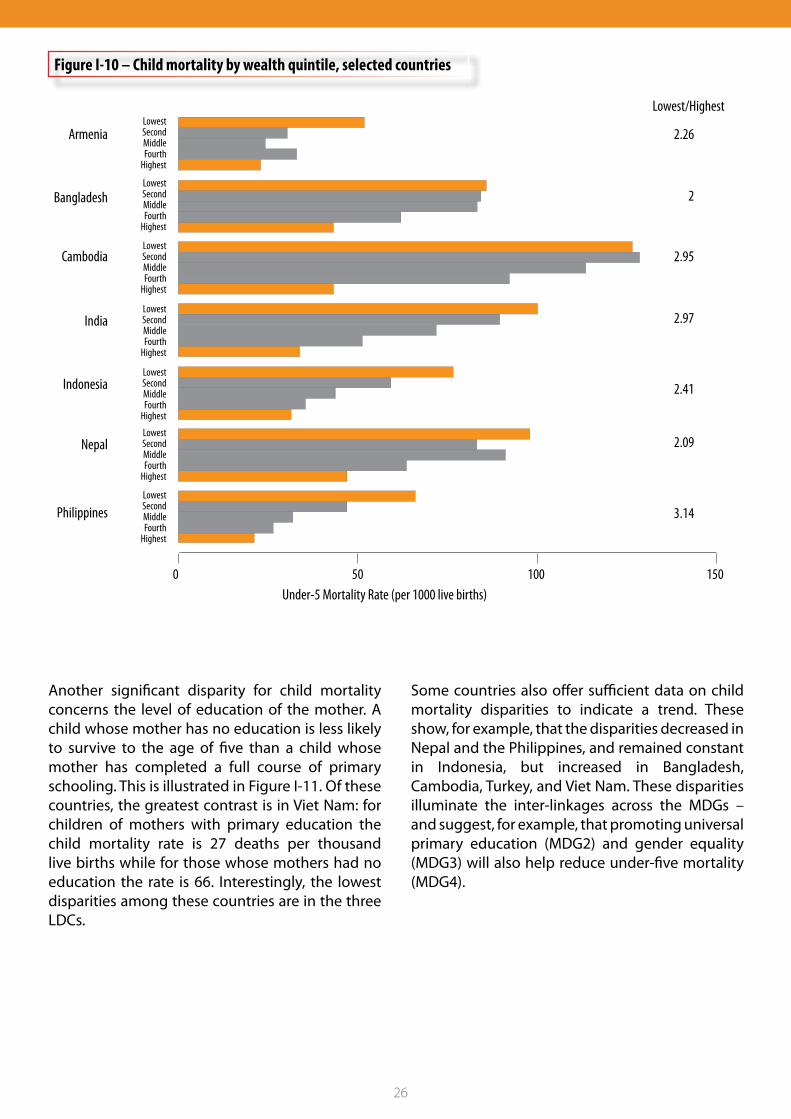
26
Lowest/Highest
Under-5 Mortality Rate (per 1000 live births)
Armenia
Bangladesh
Cambodia
India
Indonesia
Nepal
Philippines
LowestSecondMiddleFourth
Highest
LowestSecondMiddleFourth
Highest
LowestSecondMiddleFourth
Highest
LowestSecondMiddleFourth
Highest
LowestSecondMiddleFourth
Highest
LowestSecondMiddleFourth
Highest
LowestSecondMiddleFourth
Highest
2.26
2
2.95
2.97
2.41
2.09
3.14
0 50 100 150
Figure I-10 – Child mortality by wealth quintile, selected countries
Another significant disparity for child mortality concerns the level of education of the mother. A child whose mother has no education is less likely to survive to the age of five than a child whose mother has completed a full course of primary schooling. This is illustrated in Figure I-11. Of these countries, the greatest contrast is in Viet Nam: for children of mothers with primary education the child mortality rate is 27 deaths per thousand live births while for those whose mothers had no education the rate is 66. Interestingly, the lowest disparities among these countries are in the three LDCs.
Some countries also offer sufficient data on child mortality disparities to indicate a trend. These show, for example, that the disparities decreased in Nepal and the Philippines, and remained constant in Indonesia, but increased in Bangladesh, Cambodia, Turkey, and Viet Nam. These disparities illuminate the inter-linkages across the MDGs – and suggest, for example, that promoting universal primary education (MDG2) and gender equality (MDG3) will also help reduce under-five mortality (MDG4).
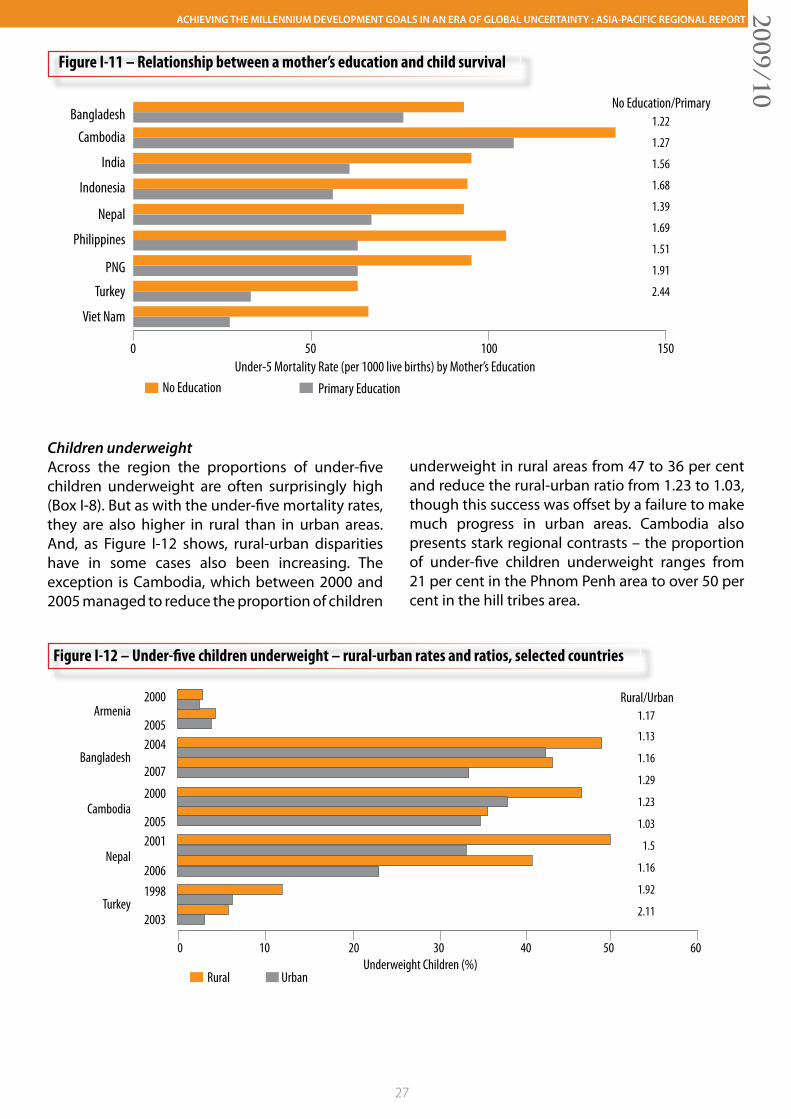
ACHIEVING THE MILLENNIUM DEVELOPMENT GOALS IN AN ERA OF GLOBAL UNCERTAINTY : ASIA-PACIFIC REGIONAL REPORT2009/10
27
Children underweightAcross the region the proportions of under-five children underweight are often surprisingly high (Box I-8). But as with the under-five mortality rates, they are also higher in rural than in urban areas. And, as Figure I-12 shows, rural-urban disparities have in some cases also been increasing. The exception is Cambodia, which between 2000 and 2005 managed to reduce the proportion of children
Armenia
Bangladesh
Cambodia
Nepal
Turkey
1.17
1.13
1.16
1.29
1.23
1.03
1.5
1.16
1.92
2.11
0 10 20 30 40 50 60
2000
20052004
2007
2000
20052001
20061998
2003
Rural UrbanUnderweight Children (%)
Rural/Urban
Figure I-11 – Relationship between a mother’s education and child survival
Figure I-12 – Under-five children underweight – rural-urban rates and ratios, selected countries
BangladeshCambodia
India
Indonesia
Nepal
Philippines
PNG
Turkey
Viet Nam
No Education Primary Education
No Education/Primary
Under-5 Mortality Rate (per 1000 live births) by Mother’s Education
1.22
1.27
1.56
1.68
1.39
1.69
1.51
1.91
2.44
0 50 100 150
underweight in rural areas from 47 to 36 per cent and reduce the rural-urban ratio from 1.23 to 1.03, though this success was offset by a failure to make much progress in urban areas. Cambodia also presents stark regional contrasts – the proportion of under-five children underweight ranges from 21 per cent in the Phnom Penh area to over 50 per cent in the hill tribes area.
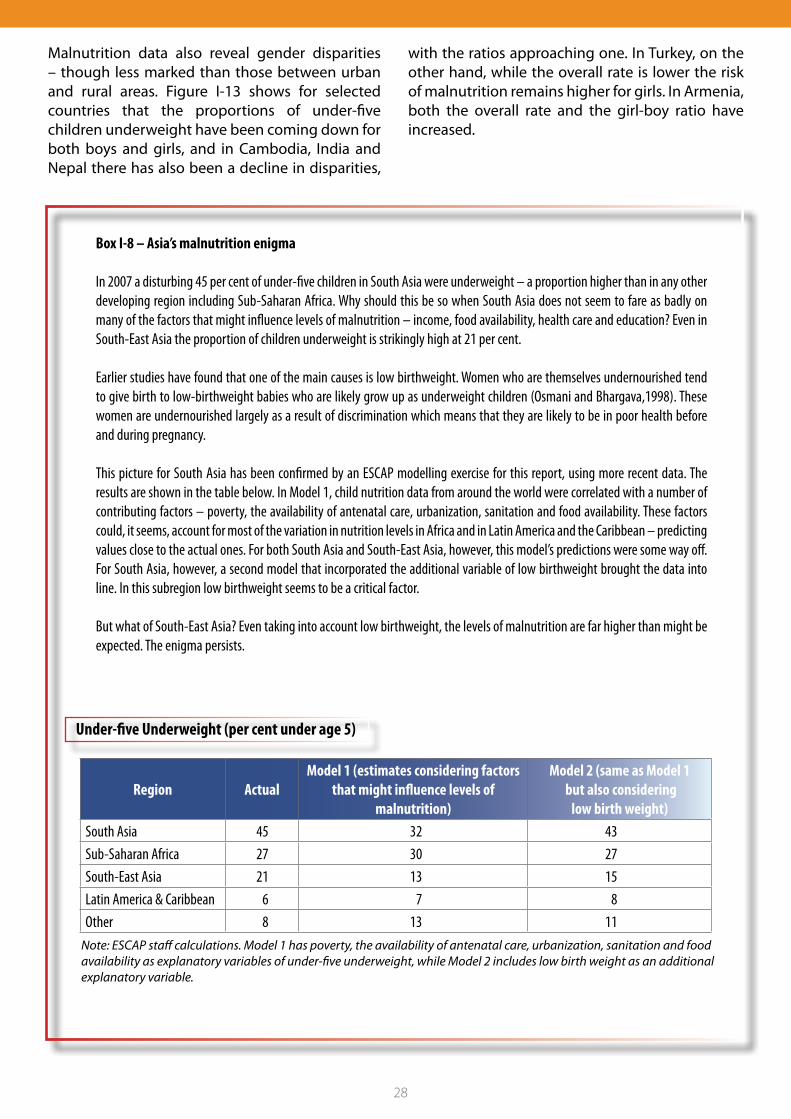
28
Malnutrition data also reveal gender disparities – though less marked than those between urban and rural areas. Figure I-13 shows for selected countries that the proportions of under-five children underweight have been coming down for both boys and girls, and in Cambodia, India and Nepal there has also been a decline in disparities,
Box I-8 – Asia’s malnutrition enigma
In 2007 a disturbing 45 per cent of under-five children in South Asia were underweight – a proportion higher than in any other developing region including Sub-Saharan Africa. Why should this be so when South Asia does not seem to fare as badly on many of the factors that might influence levels of malnutrition – income, food availability, health care and education? Even in South-East Asia the proportion of children underweight is strikingly high at 21 per cent.
Earlier studies have found that one of the main causes is low birthweight. Women who are themselves undernourished tend to give birth to low-birthweight babies who are likely grow up as underweight children (Osmani and Bhargava,1998). These women are undernourished largely as a result of discrimination which means that they are likely to be in poor health before and during pregnancy.
This picture for South Asia has been confirmed by an ESCAP modelling exercise for this report, using more recent data. The results are shown in the table below. In Model 1, child nutrition data from around the world were correlated with a number of contributing factors – poverty, the availability of antenatal care, urbanization, sanitation and food availability. These factors could, it seems, account for most of the variation in nutrition levels in Africa and in Latin America and the Caribbean – predicting values close to the actual ones. For both South Asia and South-East Asia, however, this model’s predictions were some way off. For South Asia, however, a second model that incorporated the additional variable of low birthweight brought the data into line. In this subregion low birthweight seems to be a critical factor.
But what of South-East Asia? Even taking into account low birthweight, the levels of malnutrition are far higher than might be expected. The enigma persists.
with the ratios approaching one. In Turkey, on the other hand, while the overall rate is lower the risk of malnutrition remains higher for girls. In Armenia, both the overall rate and the girl-boy ratio have increased.
Region ActualModel 1 (estimates considering factors
that might influence levels of malnutrition)
Model 2 (same as Model 1 but also considering
low birth weight)South Asia 45 32 43Sub-Saharan Africa 27 30 27South-East Asia 21 13 15Latin America & Caribbean 6 7 8Other 8 13 11
Note: ESCAP staff calculations. Model 1 has poverty, the availability of antenatal care, urbanization, sanitation and food availability as explanatory variables of under-five underweight, while Model 2 includes low birth weight as an additional explanatory variable.
Under-five Underweight (per cent under age 5)
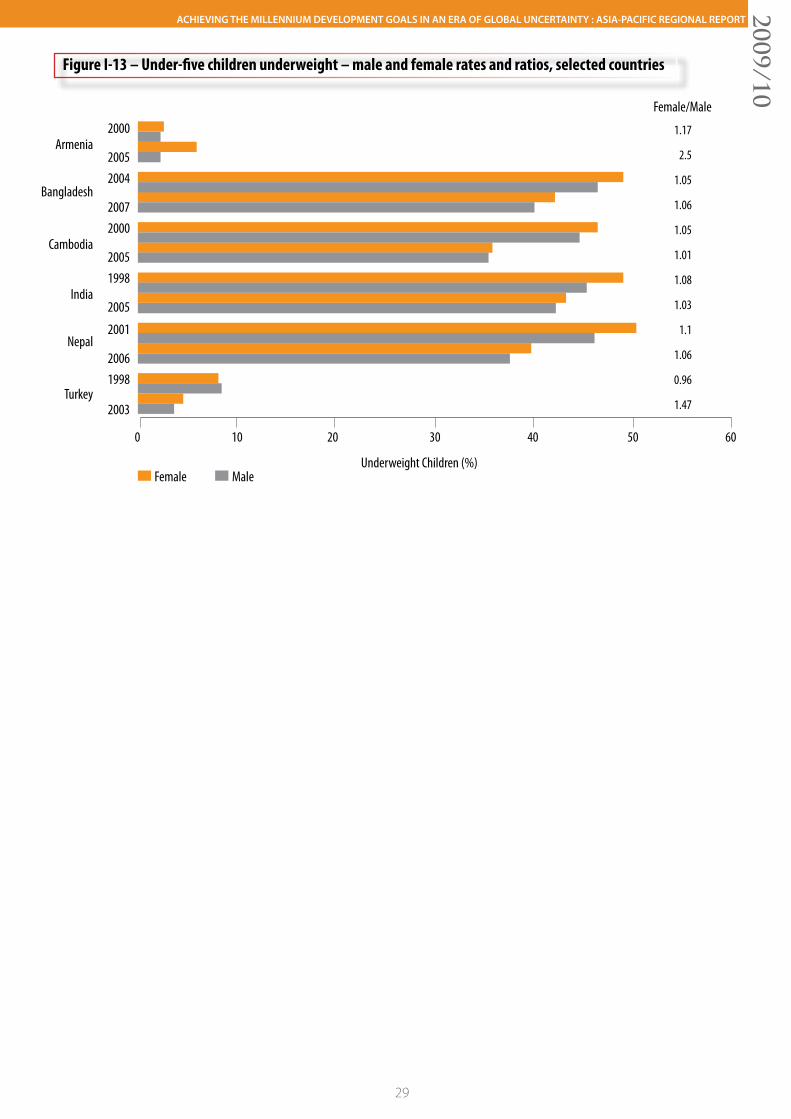
ACHIEVING THE MILLENNIUM DEVELOPMENT GOALS IN AN ERA OF GLOBAL UNCERTAINTY : ASIA-PACIFIC REGIONAL REPORT2009/10
29
Underweight Children (%)
0 10 20 30 40 50 60
Female/Male
Armenia
Bangladesh
Cambodia
India
Nepal
Turkey
1.17
2.5
1.05
1.06
1.05
1.01
1.08
1.03
1.1
1.06
0.96
1.47
2000
20052004
20072000
20051998
2005
2001
20061998
2003
Female Male
Figure I-13 – Under-five children underweight – male and female rates and ratios, selected countries
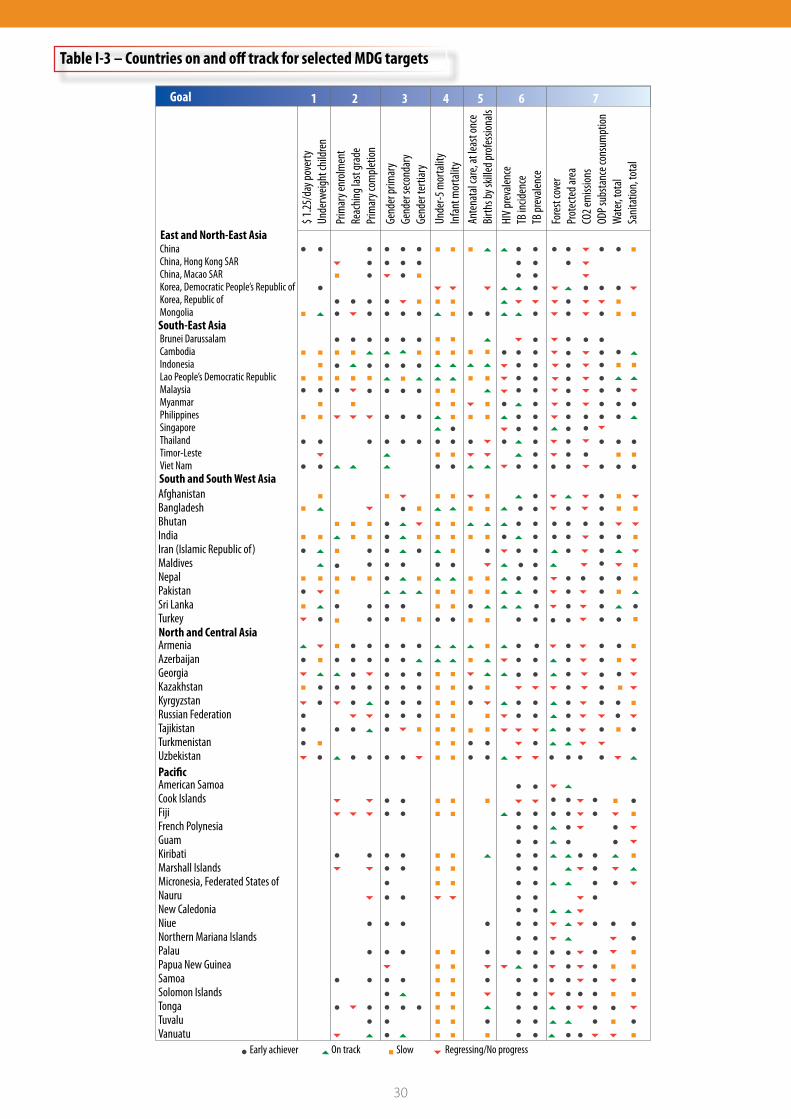
30
Goal 1 2 3 4 5 6 7
East and North-East AsiaChinaChina, Hong Kong SARChina, Macao SARKorea, Democratic People’s Republic ofKorea, Republic ofMongoliaSouth-East Asia
South and South West Asia
Paci�c
North and Central Asia
AfghanistanBangladeshBhutanIndiaIran (Islamic Republic of)MaldivesNepalPakistanSri LankaTurkey
$ 1.25
/day
pove
rtyUn
derw
eight
child
ren
Prim
ary e
nrolm
ent
Reac
hing l
ast g
rade
Prim
ary c
omple
tion
Gend
er pr
imar
y Ge
nder
seco
ndar
yGe
nder
terti
ary
Unde
r-5 m
orta
lity
Infan
t mor
talit
yAn
tena
tal c
are,
at le
ast o
nce
Birth
s by s
killed
prof
essio
nals
HIV p
reva
lence
TB in
ciden
ceTB
prev
alenc
e
Fore
st co
ver
Prot
ecte
d are
aCO
2 em
ission
sOD
P sub
stanc
e con
sum
ption
Wat
er, to
tal
Sanit
ation
, tot
al
Brunei DarussalamCambodiaIndonesiaLao People’s Democratic RepublicMalaysiaMyanmarPhilippinesSingaporeThailandTimor-LesteViet Nam
ArmeniaAzerbaijanGeorgiaKazakhstanKyrgyzstanRussian FederationTajikistanTurkmenistanUzbekistan
American SamoaCook IslandsFijiFrench PolynesiaGuamKiribatiMarshall IslandsMicronesia, Federated States ofNauruNew CaledoniaNiueNorthern Mariana IslandsPalauPapua New GuineaSamoaSolomon IslandsTongaTuvaluVanuatu
Early achiever On track Slow Regressing/No progress
Table I-3 – Countries on and off track for selected MDG targets
ACHIEVING THE MILLENNIUM DEVELOPMENT GOALS IN AN ERA OF GLOBAL UNCERTAINTY : ASIA-PACIFIC REGIONAL REPORT2009/10
31
Assessing MDGs progress in light of the global financial crisisMany countries across Asia and the Pacific have demonstrated that some MDGs are indeed within reach. The greatest achievements have clearly been for poverty and for gender equality in education. But for some other goals, notably on child nutrition, child mortality and provision of basic sanitation, many countries are still moving too slowly. Moreover, gains at the national level can mask stark disparities within countries. The estimates above are based on data gathered before the 2008 global economic crisis. The section below highlights challenges to MDG achievement posed by the global financial crisis.
The series of recent crises has put the achievement of the MDGs at risk. The global economic crisis start-ed in the West, but has subsequently been trans-mitted to the Asia-Pacific region through a number of channels including trade, equity markets, foreign direct investment, official development assistance and remittances. While the slowdown is likely to be felt first in higher unemployment, particularly in the export and tourism sectors, the effects are likely to ripple through Asia-Pacific economies, reducing employment and job creation, and leading to cuts in household and government budgets – with eventual consequences for the MDGs in terms of higher levels of poverty and threats to standards of health and education.
The impact of the crisis on economic growth and povertyAt this stage the empirical data to register the impact of the crisis is sparse. However, it is possible to estimate the likely damage by starting from projections of economic growth. Table I-4 shows two sets of estimates of economic growth, for 2009 and 2010. The first set was made in 2007, before the onset of the economic crisis, and the second in September 2009 by which time the contours of the crisis had become better defined.
Comparing these two sets of columns enables an estimate of lost – or postponed – economic growth. The Philippines economy, for example, had previously been expected to grow by 5.6 per cent in 2010 but is now projected to grow by 3.3 per cent. From these growth forecasts it is possible to estimate the effect on mean consumption expenditures and hence on rates of poverty: since
economic growth helps reduce poverty, slower growth will correspondingly mean that fewer people will escape from poverty. For details of the methodology, please see Annex 2.
By late 2008 and early 2009, when the impact of the economic crisis was initially felt in Asia-Pacific, particularly through the trade channel, the forecasts of GDP growth of many Asia-Pacific countries were even lower than the numbers presented in Table I-4 –China was expected to grow by only 6.5 per cent in 2009 and 7.5 per cent in 2010 (IMF, 2009e). These earlier estimates of GDP growth reflected the expectations at a time when the success of fiscal stimuli packages was unknown.
Initial estimates of the effect of such reduced growth highlighted the potential of the crisis for pushing millions of people into poverty. Wan and Francisco (2009), for example, concluded in early 2009 that by 2010 the number of additional people trapped in poverty in Asia and the Pacific based on the $1.25-a-day poverty line would be 64 million, and based on the $2-a-day line, 70 million. Chen and Ravallion (2009), also using earlier data, and another methodology, produced estimates of 73 million ($1.25 a day) and 91 million ($2 a day) for the world as a whole. By mid-June 2009, the World Bank produced estimates of additional 35 million people in Asia trapped in poverty in 2009 (World Bank, 2009c). However, as many countries started to introduce large fiscal stimuli packages almost simultaneously, and their effects started to be felt in the real economy, forecasts of GDP growth were revised, reflecting the optimism with the 2009/10 economic performance of countries such China and India.
On the basis of the revised estimates of economic growth of the 23 countries listed in Table I-4, in 2009 the crisis would trap an additional 17 million people below the poverty line of $1.25-a-day, and 21 million based on the $2-a-day poverty line. The crisis is expected to continue to have an impact on economic growth in 2010 with a cumulative increase of 21 million people in poverty based on $1.25-a-day poverty line, and 25 million based on the $2-a-day poverty line.
In an alternative scenario of “prolonged crisis”, if Asia-Pacific countries pull out too early from the fiscal stimuli that are expected to boost household
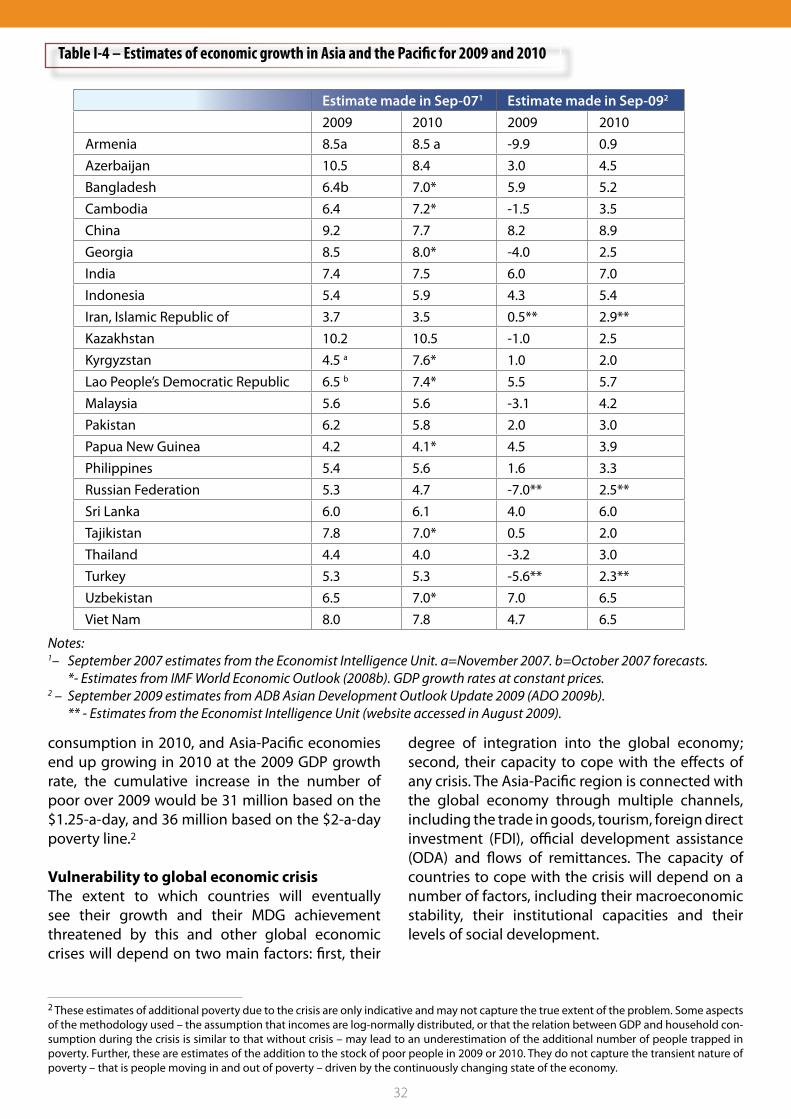
32
consumption in 2010, and Asia-Pacific economies end up growing in 2010 at the 2009 GDP growth rate, the cumulative increase in the number of poor over 2009 would be 31 million based on the $1.25-a-day, and 36 million based on the $2-a-day poverty line.2
Vulnerability to global economic crisisThe extent to which countries will eventually see their growth and their MDG achievement threatened by this and other global economic crises will depend on two main factors: first, their
degree of integration into the global economy; second, their capacity to cope with the effects of any crisis. The Asia-Pacific region is connected with the global economy through multiple channels, including the trade in goods, tourism, foreign direct investment (FDI), official development assistance (ODA) and flows of remittances. The capacity of countries to cope with the crisis will depend on a number of factors, including their macroeconomic stability, their institutional capacities and their levels of social development.
2 These estimates of additional poverty due to the crisis are only indicative and may not capture the true extent of the problem. Some aspects of the methodology used – the assumption that incomes are log-normally distributed, or that the relation between GDP and household con-sumption during the crisis is similar to that without crisis – may lead to an underestimation of the additional number of people trapped in poverty. Further, these are estimates of the addition to the stock of poor people in 2009 or 2010. They do not capture the transient nature of poverty – that is people moving in and out of poverty – driven by the continuously changing state of the economy.
Estimate made in Sep-071 Estimate made in Sep-092
2009 2010 2009 2010Armenia 8.5a 8.5 a -9.9 0.9Azerbaijan 10.5 8.4 3.0 4.5Bangladesh 6.4b 7.0* 5.9 5.2Cambodia 6.4 7.2* -1.5 3.5China 9.2 7.7 8.2 8.9Georgia 8.5 8.0* -4.0 2.5India 7.4 7.5 6.0 7.0Indonesia 5.4 5.9 4.3 5.4Iran, Islamic Republic of 3.7 3.5 0.5** 2.9**Kazakhstan 10.2 10.5 -1.0 2.5Kyrgyzstan 4.5 a 7.6* 1.0 2.0Lao People’s Democratic Republic 6.5 b 7.4* 5.5 5.7Malaysia 5.6 5.6 -3.1 4.2Pakistan 6.2 5.8 2.0 3.0Papua New Guinea 4.2 4.1* 4.5 3.9Philippines 5.4 5.6 1.6 3.3Russian Federation 5.3 4.7 -7.0** 2.5**Sri Lanka 6.0 6.1 4.0 6.0Tajikistan 7.8 7.0* 0.5 2.0Thailand 4.4 4.0 -3.2 3.0Turkey 5.3 5.3 -5.6** 2.3**Uzbekistan 6.5 7.0* 7.0 6.5Viet Nam 8.0 7.8 4.7 6.5
Notes:1– September 2007 estimates from the Economist Intelligence Unit. a=November 2007. b=October 2007 forecasts. *- Estimates from IMF World Economic Outlook (2008b). GDP growth rates at constant prices. 2 – September 2009 estimates from ADB Asian Development Outlook Update 2009 (ADO 2009b). ** - Estimates from the Economist Intelligence Unit (website accessed in August 2009).
Table I-4 – Estimates of economic growth in Asia and the Pacific for 2009 and 2010

ACHIEVING THE MILLENNIUM DEVELOPMENT GOALS IN AN ERA OF GLOBAL UNCERTAINTY : ASIA-PACIFIC REGIONAL REPORT2009/10
33
The interplay between these factors will differ not just from one county to another but also within countries, especially in the larger ones. And in each country some social groups will be more vulnerable than others. However it can also be useful, even in general terms to envisage how a crisis might impinge differently from country to country. For this purpose, this report has devised indices, presented in Annex 3, that reflect for each country both the extent of exposure and its capacity to cope; in combination, they measure vulnerability to the global economic crisis.
These indices indicate that the Asia-Pacific region has similar coping capacity to Latin America and the Caribbean but it is less exposed to the crisis. Comparing with Africa, Asia and the Pacific is more exposed to the crisis but it is in a much stronger position in terms of coping capacity. Among the country groups, the Pacific islands are the most exposed and have lower coping capacity. LDCs in Asia and the Pacific also have a lower capacity to cope with the crisis but are less exposed than the regional average. The LLDCs in Asia-Pacific are as exposed as LDCs but have greater coping capacity. South Asia and South-East Asia have similar exposures but the latter has greater coping capacity.3
The most vulnerable countries include some of the Pacific island countries along with North and Central Asian countries. Tonga, for example, ranks high in terms of exposure because it depends significantly on flows of external capital: its remittances are 39 per cent of GDP, its ODA is 12 per cent of GDP; and its FDI is 11 per cent of GDP. Vanuatu is in a similar position though relies less on tourism, which accounts for 15 per cent of GDP. Samoa is also quite exposed since remittances account for 23 per cent of GDP and tourism for 18 per cent.
The Maldives is also very exposed through the tourism channel, which is 52 per cent of GDP, as is Hong Kong, China through a combination of trade, tourism and FDI.
Bangladesh, on the other hand, is less exposed to the crisis because of its position on export sophistication with respect to GDP. It may, for
3 In some Asia-Pacific LLDCs the impact of the crisis was greater than predicted here owing to factors not considered in the analysis. In Arme-nia, for example, this included the collapse of the construction sector, and in Mongolia a fall in the prices of mineral exports. These countries requested assistance from the IMF to cope with the crisis. (IMF 2009c, 2009d).
example, face competition from Indonesia and China on garments, but with a lower per capita income can compete more aggressively on price. Papua New Guinea, compared with other Pacific Island states, relies less on tourism and remittances (both account for less than 1 per cent of GDP), on ODA (5 per cent of GDP) or on FDI (2 per cent of GDP).
It is reassuring to note that the region’s two most populous countries are less vulnerable to the crisis. China, for example, although more exposed than India, has higher levels of reserves that make it better able to cope.
Risks to the MDGsEach country’s vulnerability can then be consid-ered in the context of its MDG achievement to as-sess how far it is at risk for each goal. The analy-sis presented in annex 3 indicates that among the countries studied, Lao People’s Democratic Republic, Cambodia and Nepal are facing great-est risks in achieving MDG 1, given its combination of high poverty and high vulnerability. India and Bangladesh are also slow movers on poverty and have high poverty rates, but are less vulnerable to the crisis. Tajikistan appears the most vulnerable, due, among other things, to its exposure to remit-tances, but it has already achieved the poverty goal, and continues to make progress, so on this indicator is less at risk.
For child malnutrition indicator too, the countries at greatest risk are Lao People’s Democratic Republic, Cambodia and Nepal. Armenia and Pakistan which have much higher levels of malnutrition also are the most vulnerable. India and Bangladesh, which have the highest under-five children underweight rates – 48 and 46 per cent respectively – but appear less vulnerable to the crisis. The countries at greatest risk on child mortality are Cambodia, Pakistan and Solomon Islands. The countries at greatest risk on primary enrolment are the Solomon Islands, Vanuatu, Lao People’s Democratic Republic, Cambodia, Pakistan and Nepal.
The effect on womenBroad estimates of the impact of the crisis on poverty also say little about how this burden will
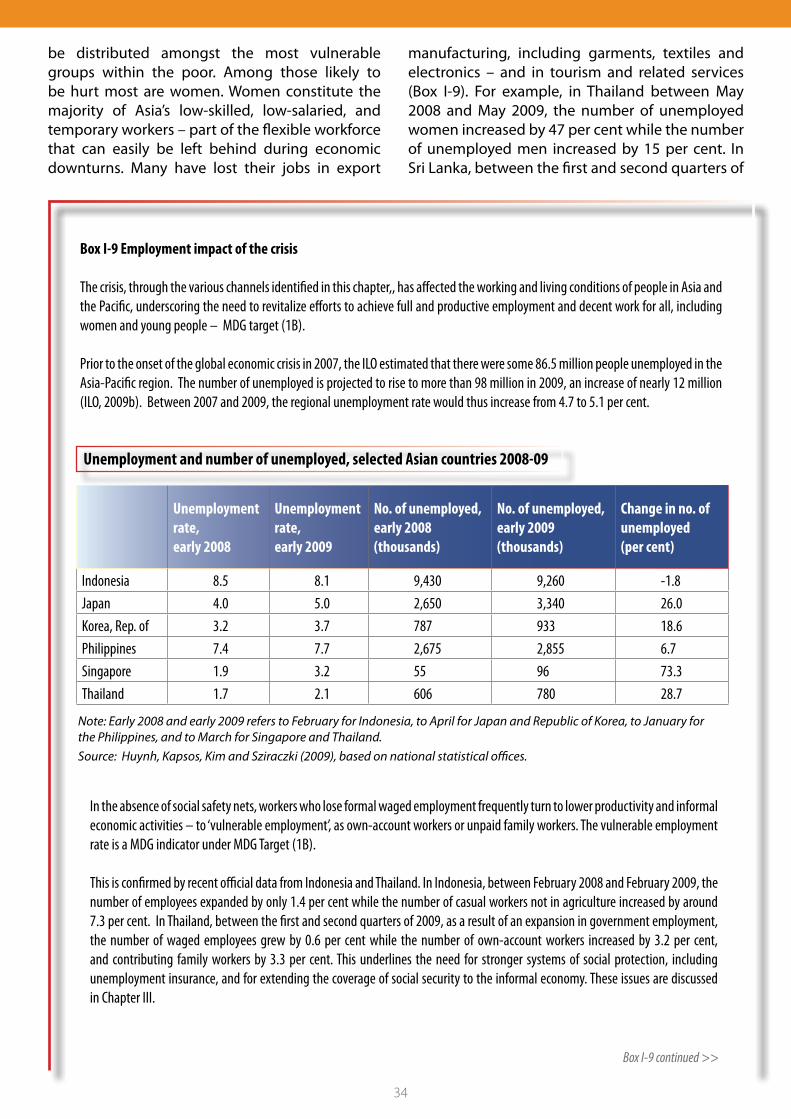
34
be distributed amongst the most vulnerable groups within the poor. Among those likely to be hurt most are women. Women constitute the majority of Asia’s low-skilled, low-salaried, and temporary workers – part of the flexible workforce that can easily be left behind during economic downturns. Many have lost their jobs in export
manufacturing, including garments, textiles and electronics – and in tourism and related services (Box I-9). For example, in Thailand between May 2008 and May 2009, the number of unemployed women increased by 47 per cent while the number of unemployed men increased by 15 per cent. In Sri Lanka, between the first and second quarters of
Box I-9 Employment impact of the crisis
The crisis, through the various channels identified in this chapter,, has affected the working and living conditions of people in Asia and the Pacific, underscoring the need to revitalize efforts to achieve full and productive employment and decent work for all, including women and young people – MDG target (1B).
Prior to the onset of the global economic crisis in 2007, the ILO estimated that there were some 86.5 million people unemployed in the Asia-Pacific region. The number of unemployed is projected to rise to more than 98 million in 2009, an increase of nearly 12 million (ILO, 2009b). Between 2007 and 2009, the regional unemployment rate would thus increase from 4.7 to 5.1 per cent.
Unemployment rate,early 2008
Unemployment rate,early 2009
No. of unemployed, early 2008(thousands)
No. of unemployed, early 2009(thousands)
Change in no. of unemployed (per cent)
Indonesia 8.5 8.1 9,430 9,260 -1.8 Japan 4.0 5.0 2,650 3,340 26.0Korea, Rep. of 3.2 3.7 787 933 18.6 Philippines 7.4 7.7 2,675 2,855 6.7 Singapore 1.9 3.2 55 96 73.3 Thailand 1.7 2.1 606 780 28.7
Unemployment and number of unemployed, selected Asian countries 2008-09
Note: Early 2008 and early 2009 refers to February for Indonesia, to April for Japan and Republic of Korea, to January for the Philippines, and to March for Singapore and Thailand.Source: Huynh, Kapsos, Kim and Sziraczki (2009), based on national statistical offices.
In the absence of social safety nets, workers who lose formal waged employment frequently turn to lower productivity and informal economic activities – to ‘vulnerable employment’, as own-account workers or unpaid family workers. The vulnerable employment rate is a MDG indicator under MDG Target (1B).
This is confirmed by recent official data from Indonesia and Thailand. In Indonesia, between February 2008 and February 2009, the number of employees expanded by only 1.4 per cent while the number of casual workers not in agriculture increased by around 7.3 per cent. In Thailand, between the first and second quarters of 2009, as a result of an expansion in government employment, the number of waged employees grew by 0.6 per cent while the number of own-account workers increased by 3.2 per cent, and contributing family workers by 3.3 per cent. This underlines the need for stronger systems of social protection, including unemployment insurance, and for extending the coverage of social security to the informal economy. These issues are discussed in Chapter III.
Box I-9 continued >>
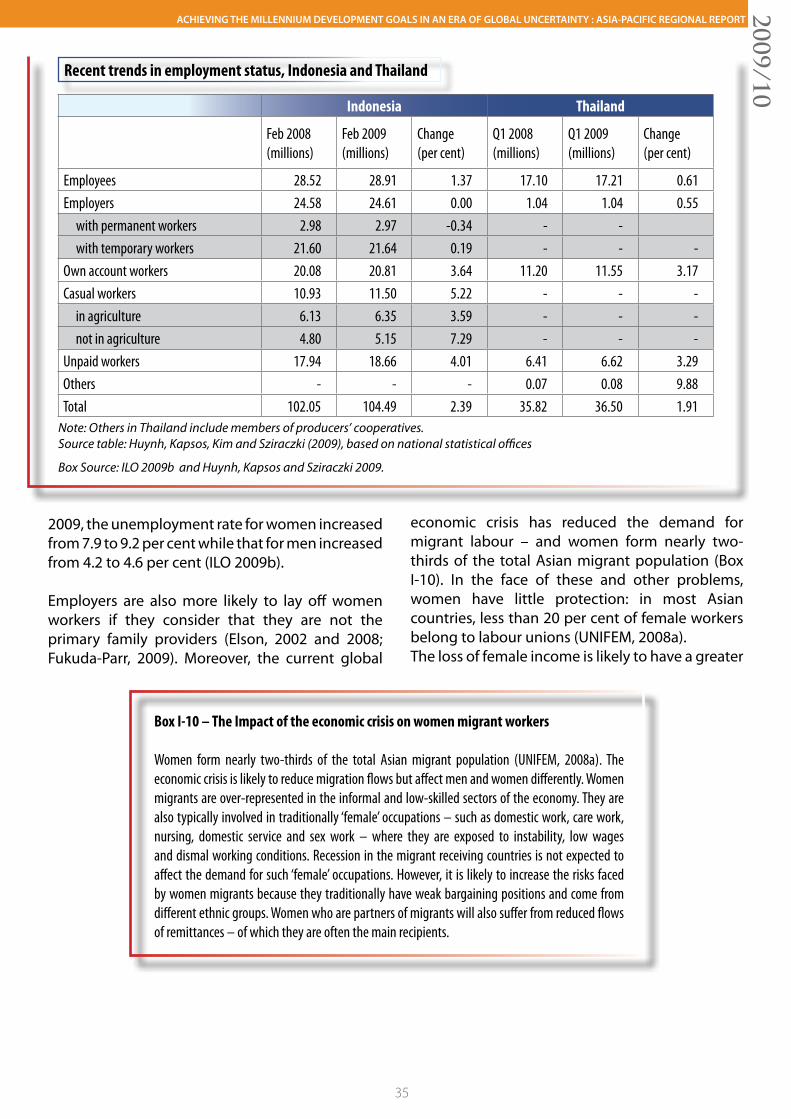
ACHIEVING THE MILLENNIUM DEVELOPMENT GOALS IN AN ERA OF GLOBAL UNCERTAINTY : ASIA-PACIFIC REGIONAL REPORT2009/10
35
2009, the unemployment rate for women increased from 7.9 to 9.2 per cent while that for men increased from 4.2 to 4.6 per cent (ILO 2009b).
Employers are also more likely to lay off women workers if they consider that they are not the primary family providers (Elson, 2002 and 2008; Fukuda-Parr, 2009). Moreover, the current global
Indonesia Thailand
Feb 2008(millions)
Feb 2009(millions)
Change (per cent)
Q1 2008(millions)
Q1 2009(millions)
Change (per cent)
Employees 28.52 28.91 1.37 17.10 17.21 0.61Employers 24.58 24.61 0.00 1.04 1.04 0.55 with permanent workers 2.98 2.97 -0.34 - - with temporary workers 21.60 21.64 0.19 - - -Own account workers 20.08 20.81 3.64 11.20 11.55 3.17Casual workers 10.93 11.50 5.22 - - - in agriculture 6.13 6.35 3.59 - - - not in agriculture 4.80 5.15 7.29 - - -Unpaid workers 17.94 18.66 4.01 6.41 6.62 3.29Others - - - 0.07 0.08 9.88Total 102.05 104.49 2.39 35.82 36.50 1.91
Recent trends in employment status, Indonesia and Thailand
Note: Others in Thailand include members of producers’ cooperatives. Source table: Huynh, Kapsos, Kim and Sziraczki (2009), based on national statistical offices
Box Source: ILO 2009b and Huynh, Kapsos and Sziraczki 2009.
economic crisis has reduced the demand for migrant labour – and women form nearly two-thirds of the total Asian migrant population (Box I-10). In the face of these and other problems, women have little protection: in most Asian countries, less than 20 per cent of female workers belong to labour unions (UNIFEM, 2008a).The loss of female income is likely to have a greater
Box I-10 – The Impact of the economic crisis on women migrant workers
Women form nearly two-thirds of the total Asian migrant population (UNIFEM, 2008a). The economic crisis is likely to reduce migration flows but affect men and women differently. Women migrants are over-represented in the informal and low-skilled sectors of the economy. They are also typically involved in traditionally ‘female’ occupations – such as domestic work, care work, nursing, domestic service and sex work – where they are exposed to instability, low wages and dismal working conditions. Recession in the migrant receiving countries is not expected to affect the demand for such ‘female’ occupations. However, it is likely to increase the risks faced by women migrants because they traditionally have weak bargaining positions and come from different ethnic groups. Women who are partners of migrants will also suffer from reduced flows of remittances – of which they are often the main recipients.
36
impact on welfare, as women tend to spend a greater proportion of their income on meeting the basic needs of household members. But women also come under pressure when other family members lose their jobs and households rely even more on women’s unpaid work – in food production and preparation, fuel and water collection, and home-based health care (Box I-11). Experience with past crises has shown that girls are highly vulnerable to withdrawal from school to cope with declining income. In countries with high
child mortality rates, the fall in household incomes could further increase infant and child deaths, with disproportionate effects on women and girls (Sabarwal, Sinha and Buvinic, 2009).
Another channel through which women’s income might be affected is through reduced flows of microfinance – for which women are the principal clients. As a result of the global crisis, microfinance institutions that get their funds from local and international commercial banks are likely face tighter credit markets – with implications for millions of women borrowers. In India, for instance, around 500 commercial, regional and cooperative banks are indirectly involved in microfinance and may choose to scale back much-needed loans to women.
Box I-11 – Households under pressure rely more on women’s work
As households come under pressure, women have to work even harder – as the providers of last resort. In Indonesia, for example, in 1997 and 1998, following the Asian financial crisis, analysis of the Indonesian Family Life Survey revealed that the proportion of the male labour force employed decreased by 1.3 per cent, while the proportion of the female labour force employed increased by 1 per cent. When unpaid work was also included, work increased for both men and women, but only by 1.3 per cent for men compared with 7 per cent for women. A survey conducted by the Indonesian statistical office sixteen months after the onset of the crisis also revealed household coping strategies – with an increase in labour market participation for older married women with children.
Similarly in the Philippines, between 1997 and 1998, both male and female labour force participation rates increased, but while the weekly work hours of employed men fell, those for employed women rose – partly because women working at home did more work on subcontract. Moreover, women in the Philippines typically spend almost 8 hours a day on housekeeping and child care compared about 2 and a half hours for men.
Women are also severely affected by any reduction in publicly provided social services and social safety nets. Because of their traditional gender roles, women depend more on such services. Cuts in such spending will therefore hurt women and girls more, and potentially lead to reversals in gains made in gender-related MDG targets (UNIFEM, 2008a; UNIFEM, 2008b).
Protecting the gainsThe global economic crisis – and any future crises – could therefore have serious implications for achievements of the MDGs – with some countries and social groups especially exposed for particular indicators. How can countries protect their people from the impact of such events? The next chapter will consider their options for tailoring economic stimulus packages so that they not only serve to kick-start sluggish economies but also lay firmer foundations for long-term development.
Source: Elson 2002.
ACHIEVING THE MILLENNIUM DEVELOPMENT GOALS IN AN ERA OF GLOBAL UNCERTAINTY : ASIA-PACIFIC REGIONAL REPORT2009/10
37Photo: Marie Ange Holmgren-Sylvain

38Photo: ILO
39
ACHIEVING THE MILLENNIUM DEVELOPMENT GOALS IN AN ERA OF GLOBAL UNCERTAINTY : ASIA-PACIFIC REGIONAL REPORT2009/10
2Chapter
Protecting the MDGs through fiscal stimuli
The global financial crisis has slowed the growth of economies in Asia and the Pacific – with potentially serious consequences for the attainment of the Millennium Development Goals. Governments can, however, take measures to protect their citizens, designing fiscal stimulus packages that can both help revive economic growth and also aid progress towards the MDGs.
The world has suffered a once-in-a-century financial crisis that has dragged the global economy into a recession. As indicated in the previous chapter, countries across the region are expected to suffer a slowdown in economic growth, some even slipping into a recession. This will have adverse consequences for the poor, and slow progress towards achieving MDGs.
In the richer countries, governments that wish to protect citizens during a steep downturn do not need to rely entirely on new policies. They can instead depend to some extent on ‘automatic stabilizers’ such as progressive income tax regimes which, as incomes drop, permit people to pay a smaller proportion of their incomes as tax. And if workers lose their jobs they will usually get un-employment benefit. During a recession these stabilizers help dampen the effects of an economic downturn by transferring resources from govern-ments to citizens. They also have the advantage of kicking in automatically, so they work quickly and then fall away when the recession is over. Moreover they are usually well targeted and do not leak away to many unintended beneficiaries.
Many developing countries, however, generally do not have these options. Lacking effective systems of progressive income tax, they rely more on regressive indirect taxes, such as VAT or sales tax, and have limited schemes for unemployment benefit.
For rich and poor countries alike, an alternative,
or a supplement, to automatic stabilizers is discretionary fiscal policy. This involves the government stepping in with new measures. On the revenue side it may, for example, reduce tax rates – such as the standard VAT rate – and on the expenditure side it may accelerate public spending on infrastructure so as to generate additional employment. A government may make such adjustments on a regular basis in an attempt to fine tune the economy or generally promote long-term economic growth. But when it does so on a large scale at times of severe economic crisis, in the hope of quickly restoring economic growth and employment, this is considered to be a ‘fiscal stimulus’.
Some people are doubtful about the value of fiscal policies in general on the grounds that they distort economies and can be badly timed and ineffective. Instead, they would prefer to use monetary policies – typically by adjusting interest rates. Proponents of fiscal policies argue, however, that, when interest rates are already very low, fiscal policies are the only option. Such policies are particularly appropriate when the problems are caused not by low productivity or weak infrastructure but rather by external shocks that have left the economy with excess capacity that might usefully be absorbed by a surge in demand.
In fact, evidence from both advanced and emerg-ing economies indicates that both tax cuts and higher public spending can work – though these fiscal packages need to be carefully designed
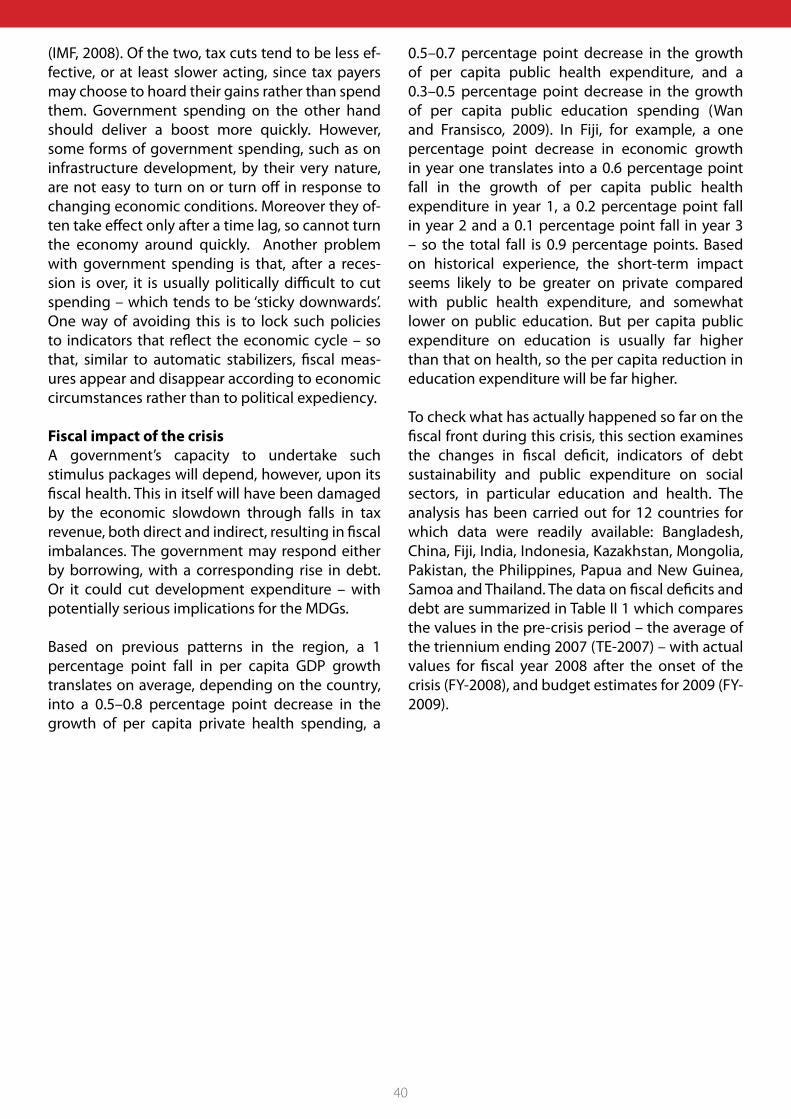
40
(IMF, 2008). Of the two, tax cuts tend to be less ef-fective, or at least slower acting, since tax payers may choose to hoard their gains rather than spend them. Government spending on the other hand should deliver a boost more quickly. However, some forms of government spending, such as on infrastructure development, by their very nature, are not easy to turn on or turn off in response to changing economic conditions. Moreover they of-ten take effect only after a time lag, so cannot turn the economy around quickly. Another problem with government spending is that, after a reces-sion is over, it is usually politically difficult to cut spending – which tends to be ‘sticky downwards’. One way of avoiding this is to lock such policies to indicators that reflect the economic cycle – so that, similar to automatic stabilizers, fiscal meas-ures appear and disappear according to economic circumstances rather than to political expediency.
Fiscal impact of the crisis A government’s capacity to undertake such stimulus packages will depend, however, upon its fiscal health. This in itself will have been damaged by the economic slowdown through falls in tax revenue, both direct and indirect, resulting in fiscal imbalances. The government may respond either by borrowing, with a corresponding rise in debt. Or it could cut development expenditure – with potentially serious implications for the MDGs.
Based on previous patterns in the region, a 1 percentage point fall in per capita GDP growth translates on average, depending on the country, into a 0.5–0.8 percentage point decrease in the growth of per capita private health spending, a
0.5–0.7 percentage point decrease in the growth of per capita public health expenditure, and a 0.3–0.5 percentage point decrease in the growth of per capita public education spending (Wan and Fransisco, 2009). In Fiji, for example, a one percentage point decrease in economic growth in year one translates into a 0.6 percentage point fall in the growth of per capita public health expenditure in year 1, a 0.2 percentage point fall in year 2 and a 0.1 percentage point fall in year 3 – so the total fall is 0.9 percentage points. Based on historical experience, the short-term impact seems likely to be greater on private compared with public health expenditure, and somewhat lower on public education. But per capita public expenditure on education is usually far higher than that on health, so the per capita reduction in education expenditure will be far higher.
To check what has actually happened so far on the fiscal front during this crisis, this section examines the changes in fiscal deficit, indicators of debt sustainability and public expenditure on social sectors, in particular education and health. The analysis has been carried out for 12 countries for which data were readily available: Bangladesh, China, Fiji, India, Indonesia, Kazakhstan, Mongolia, Pakistan, the Philippines, Papua and New Guinea, Samoa and Thailand. The data on fiscal deficits and debt are summarized in Table II 1 which compares the values in the pre-crisis period – the average of the triennium ending 2007 (TE-2007) – with actual values for fiscal year 2008 after the onset of the crisis (FY-2008), and budget estimates for 2009 (FY-2009).
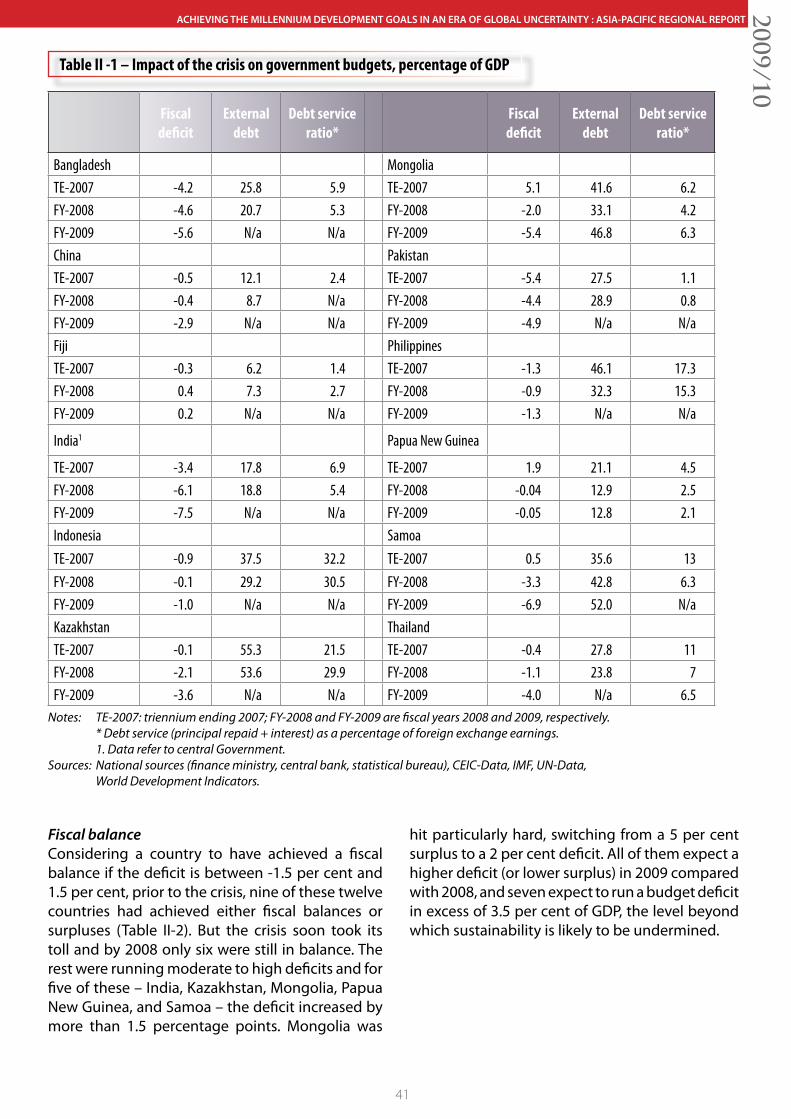
41
ACHIEVING THE MILLENNIUM DEVELOPMENT GOALS IN AN ERA OF GLOBAL UNCERTAINTY : ASIA-PACIFIC REGIONAL REPORT2009/10
Fiscal deficit
External debt
Debt service ratio* Fiscal
deficitExternal
debt Debt service
ratio*
Bangladesh Mongolia TE-2007 -4.2 25.8 5.9 TE-2007 5.1 41.6 6.2FY-2008 -4.6 20.7 5.3 FY-2008 -2.0 33.1 4.2FY-2009 -5.6 N/a N/a FY-2009 -5.4 46.8 6.3China Pakistan TE-2007 -0.5 12.1 2.4 TE-2007 -5.4 27.5 1.1FY-2008 -0.4 8.7 N/a FY-2008 -4.4 28.9 0.8FY-2009 -2.9 N/a N/a FY-2009 -4.9 N/a N/aFiji Philippines TE-2007 -0.3 6.2 1.4 TE-2007 -1.3 46.1 17.3FY-2008 0.4 7.3 2.7 FY-2008 -0.9 32.3 15.3FY-2009 0.2 N/a N/a FY-2009 -1.3 N/a N/a
India1 Papua New Guinea
TE-2007 -3.4 17.8 6.9 TE-2007 1.9 21.1 4.5FY-2008 -6.1 18.8 5.4 FY-2008 -0.04 12.9 2.5FY-2009 -7.5 N/a N/a FY-2009 -0.05 12.8 2.1Indonesia Samoa TE-2007 -0.9 37.5 32.2 TE-2007 0.5 35.6 13FY-2008 -0.1 29.2 30.5 FY-2008 -3.3 42.8 6.3FY-2009 -1.0 N/a N/a FY-2009 -6.9 52.0 N/aKazakhstan Thailand TE-2007 -0.1 55.3 21.5 TE-2007 -0.4 27.8 11FY-2008 -2.1 53.6 29.9 FY-2008 -1.1 23.8 7FY-2009 -3.6 N/a N/a FY-2009 -4.0 N/a 6.5
Notes: TE-2007: triennium ending 2007; FY-2008 and FY-2009 are fiscal years 2008 and 2009, respectively. * Debt service (principal repaid + interest) as a percentage of foreign exchange earnings. 1. Data refer to central Government.Sources: National sources (finance ministry, central bank, statistical bureau), CEIC-Data, IMF, UN-Data, World Development Indicators.
Fiscal balanceConsidering a country to have achieved a fiscal balance if the deficit is between -1.5 per cent and 1.5 per cent, prior to the crisis, nine of these twelve countries had achieved either fiscal balances or surpluses (Table II-2). But the crisis soon took its toll and by 2008 only six were still in balance. The rest were running moderate to high deficits and for five of these – India, Kazakhstan, Mongolia, Papua New Guinea, and Samoa – the deficit increased by more than 1.5 percentage points. Mongolia was
hit particularly hard, switching from a 5 per cent surplus to a 2 per cent deficit. All of them expect a higher deficit (or lower surplus) in 2009 compared with 2008, and seven expect to run a budget deficit in excess of 3.5 per cent of GDP, the level beyond which sustainability is likely to be undermined.
Table II -1 – Impact of the crisis on government budgets, percentage of GDP
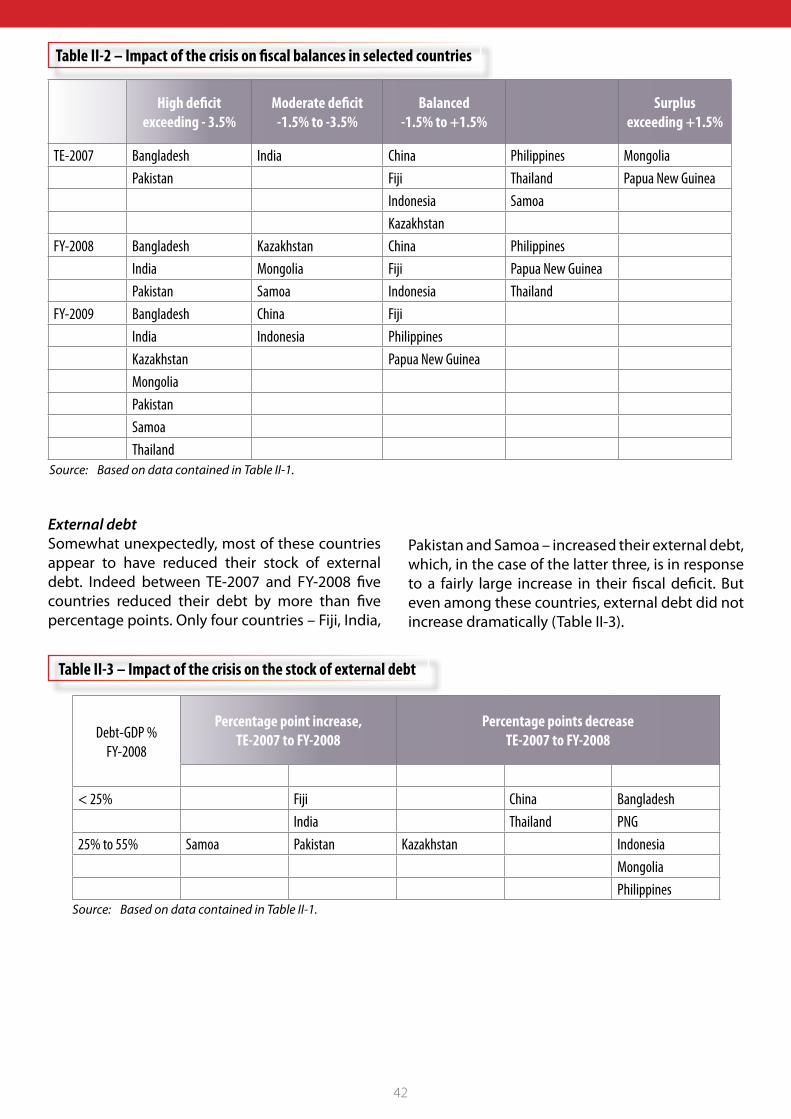
42
High deficit exceeding - 3.5%
Moderate deficit -1.5% to -3.5%
Balanced -1.5% to +1.5%
Surplus exceeding +1.5%
TE-2007 Bangladesh India China Philippines Mongolia Pakistan Fiji Thailand Papua New Guinea
Indonesia SamoaKazakhstan
FY-2008 Bangladesh Kazakhstan China PhilippinesIndia Mongolia Fiji Papua New GuineaPakistan Samoa Indonesia Thailand
FY-2009 Bangladesh China FijiIndia Indonesia PhilippinesKazakhstan Papua New GuineaMongoliaPakistanSamoaThailand
External debtSomewhat unexpectedly, most of these countries appear to have reduced their stock of external debt. Indeed between TE-2007 and FY-2008 five countries reduced their debt by more than five percentage points. Only four countries – Fiji, India,
Pakistan and Samoa – increased their external debt, which, in the case of the latter three, is in response to a fairly large increase in their fiscal deficit. But even among these countries, external debt did not increase dramatically (Table II-3).
Debt-GDP %FY-2008
Percentage point increase, TE-2007 to FY-2008
Percentage points decreaseTE-2007 to FY-2008
1.5 to 5 < 1.5 < 1.5 1.5 to 5 > 5< 25% Fiji China Bangladesh
India Thailand PNG25% to 55% Samoa Pakistan Kazakhstan Indonesia
MongoliaPhilippines
Table II-2 – Impact of the crisis on fiscal balances in selected countries
Table II-3 – Impact of the crisis on the stock of external debt
Source: Based on data contained in Table II-1.
Source: Based on data contained in Table II-1.
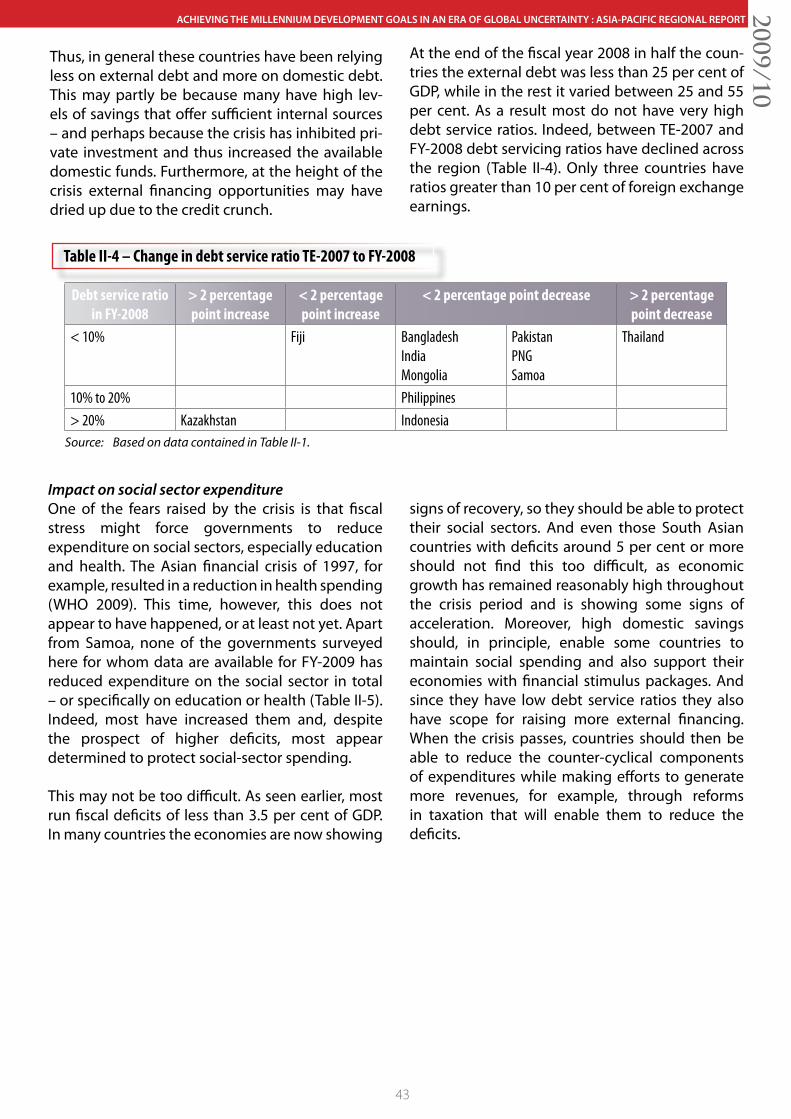
43
ACHIEVING THE MILLENNIUM DEVELOPMENT GOALS IN AN ERA OF GLOBAL UNCERTAINTY : ASIA-PACIFIC REGIONAL REPORT2009/10
Thus, in general these countries have been relying less on external debt and more on domestic debt. This may partly be because many have high lev-els of savings that offer sufficient internal sources – and perhaps because the crisis has inhibited pri-vate investment and thus increased the available domestic funds. Furthermore, at the height of the crisis external financing opportunities may have dried up due to the credit crunch.
At the end of the fiscal year 2008 in half the coun-tries the external debt was less than 25 per cent of GDP, while in the rest it varied between 25 and 55 per cent. As a result most do not have very high debt service ratios. Indeed, between TE-2007 and FY-2008 debt servicing ratios have declined across the region (Table II-4). Only three countries have ratios greater than 10 per cent of foreign exchange earnings.
Debt service ratio in FY-2008
> 2 percentage point increase
< 2 percentage point increase
< 2 percentage point decrease > 2 percentage point decrease
< 10% Fiji BangladeshIndiaMongolia
PakistanPNGSamoa
Thailand
10% to 20% Philippines> 20% Kazakhstan Indonesia
Impact on social sector expenditureOne of the fears raised by the crisis is that fiscal stress might force governments to reduce expenditure on social sectors, especially education and health. The Asian financial crisis of 1997, for example, resulted in a reduction in health spending (WHO 2009). This time, however, this does not appear to have happened, or at least not yet. Apart from Samoa, none of the governments surveyed here for whom data are available for FY-2009 has reduced expenditure on the social sector in total – or specifically on education or health (Table II-5). Indeed, most have increased them and, despite the prospect of higher deficits, most appear determined to protect social-sector spending.
This may not be too difficult. As seen earlier, most run fiscal deficits of less than 3.5 per cent of GDP. In many countries the economies are now showing
signs of recovery, so they should be able to protect their social sectors. And even those South Asian countries with deficits around 5 per cent or more should not find this too difficult, as economic growth has remained reasonably high throughout the crisis period and is showing some signs of acceleration. Moreover, high domestic savings should, in principle, enable some countries to maintain social spending and also support their economies with financial stimulus packages. And since they have low debt service ratios they also have scope for raising more external financing. When the crisis passes, countries should then be able to reduce the counter-cyclical components of expenditures while making efforts to generate more revenues, for example, through reforms in taxation that will enable them to reduce the deficits.
Table II-4 – Change in debt service ratio TE-2007 to FY-2008
Source: Based on data contained in Table II-1.
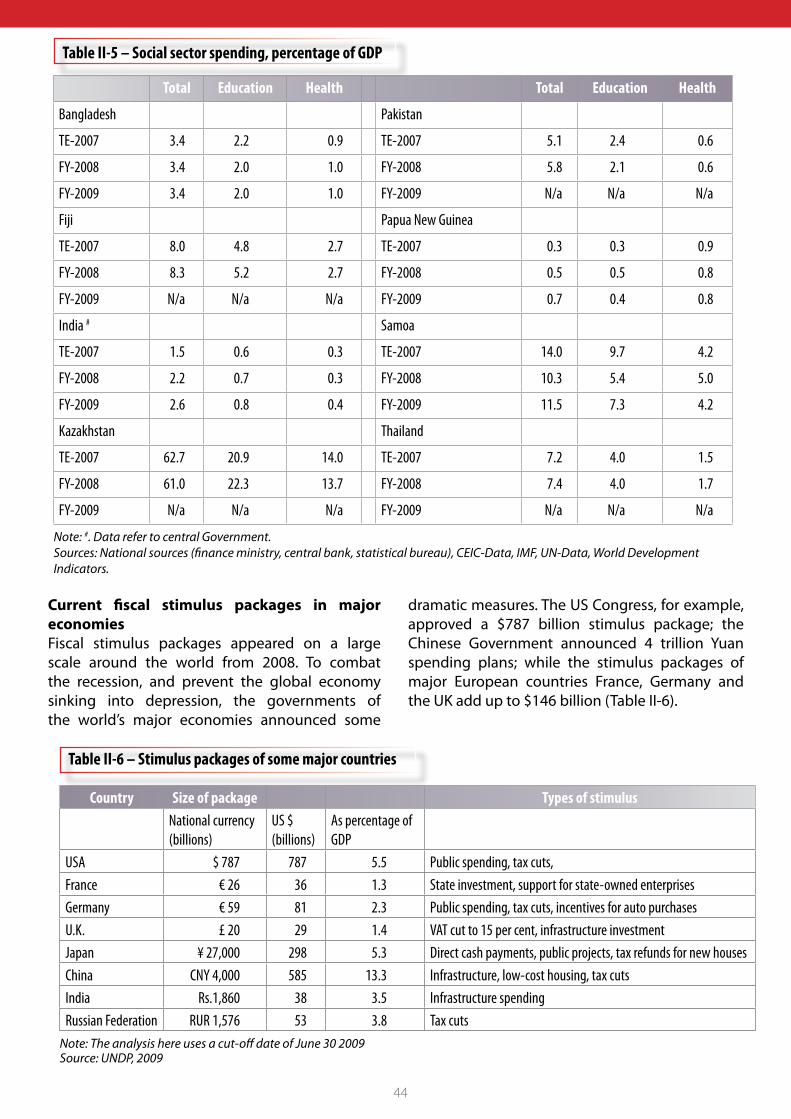
44
Total Education Health Total Education Health
Bangladesh Pakistan
TE-2007 3.4 2.2 0.9 TE-2007 5.1 2.4 0.6
FY-2008 3.4 2.0 1.0 FY-2008 5.8 2.1 0.6
FY-2009 3.4 2.0 1.0 FY-2009 N/a N/a N/a
Fiji Papua New Guinea
TE-2007 8.0 4.8 2.7 TE-2007 0.3 0.3 0.9
FY-2008 8.3 5.2 2.7 FY-2008 0.5 0.5 0.8
FY-2009 N/a N/a N/a FY-2009 0.7 0.4 0.8
India # Samoa
TE-2007 1.5 0.6 0.3 TE-2007 14.0 9.7 4.2
FY-2008 2.2 0.7 0.3 FY-2008 10.3 5.4 5.0
FY-2009 2.6 0.8 0.4 FY-2009 11.5 7.3 4.2
Kazakhstan Thailand
TE-2007 62.7 20.9 14.0 TE-2007 7.2 4.0 1.5
FY-2008 61.0 22.3 13.7 FY-2008 7.4 4.0 1.7
FY-2009 N/a N/a N/a FY-2009 N/a N/a N/a
Table II-5 – Social sector spending, percentage of GDP
Note: #. Data refer to central Government. Sources: National sources (finance ministry, central bank, statistical bureau), CEIC-Data, IMF, UN-Data, World Development Indicators.
Current fiscal stimulus packages in major economiesFiscal stimulus packages appeared on a large scale around the world from 2008. To combat the recession, and prevent the global economy sinking into depression, the governments of the world’s major economies announced some
dramatic measures. The US Congress, for example, approved a $787 billion stimulus package; the Chinese Government announced 4 trillion Yuan spending plans; while the stimulus packages of major European countries France, Germany and the UK add up to $146 billion (Table II-6).
Country Size of package Types of stimulusNational currency (billions)
US $ (billions)
As percentage of GDP
USA $ 787 787 5.5 Public spending, tax cuts, France € 26 36 1.3 State investment, support for state-owned enterprisesGermany € 59 81 2.3 Public spending, tax cuts, incentives for auto purchasesU.K. £ 20 29 1.4 VAT cut to 15 per cent, infrastructure investmentJapan ¥ 27,000 298 5.3 Direct cash payments, public projects, tax refunds for new housesChina CNY 4,000 585 13.3 Infrastructure, low-cost housing, tax cutsIndia Rs.1,860 38 3.5 Infrastructure spendingRussian Federation RUR 1,576 53 3.8 Tax cuts
Note: The analysis here uses a cut-off date of June 30 2009Source: UNDP, 2009
Table II-6 – Stimulus packages of some major countries
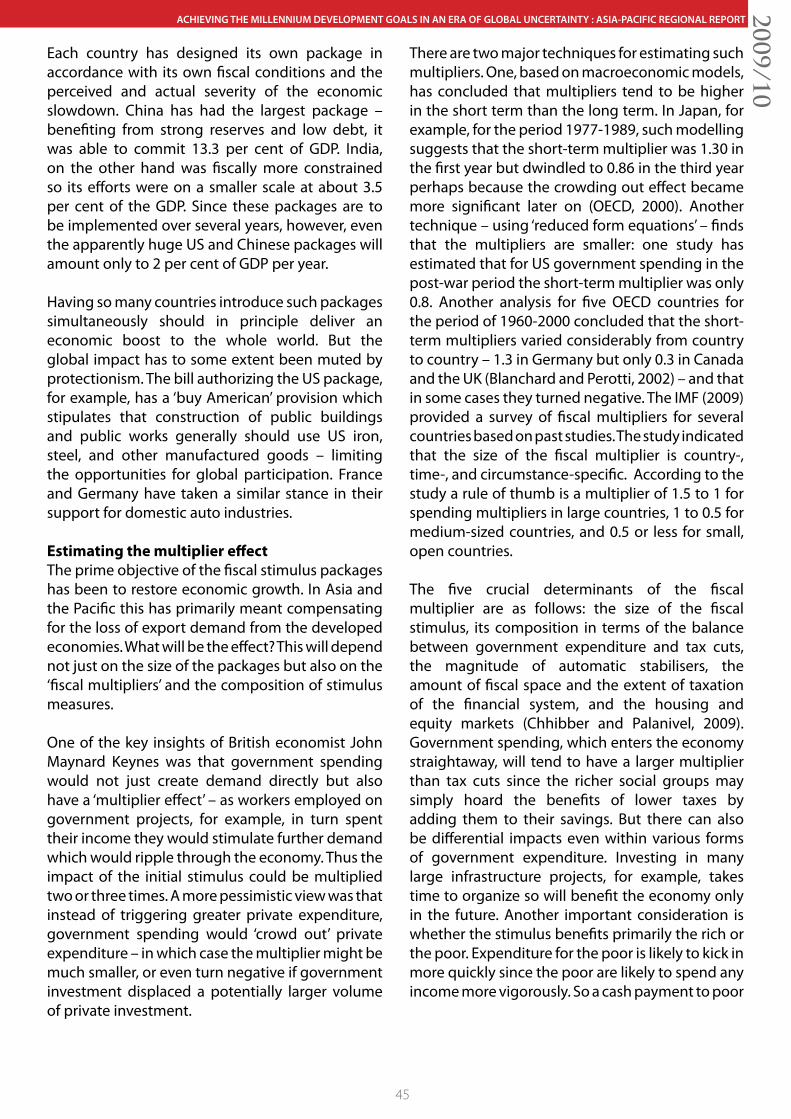
45
ACHIEVING THE MILLENNIUM DEVELOPMENT GOALS IN AN ERA OF GLOBAL UNCERTAINTY : ASIA-PACIFIC REGIONAL REPORT2009/10
Each country has designed its own package in accordance with its own fiscal conditions and the perceived and actual severity of the economic slowdown. China has had the largest package – benefiting from strong reserves and low debt, it was able to commit 13.3 per cent of GDP. India, on the other hand was fiscally more constrained so its efforts were on a smaller scale at about 3.5 per cent of the GDP. Since these packages are to be implemented over several years, however, even the apparently huge US and Chinese packages will amount only to 2 per cent of GDP per year.
Having so many countries introduce such packages simultaneously should in principle deliver an economic boost to the whole world. But the global impact has to some extent been muted by protectionism. The bill authorizing the US package, for example, has a ‘buy American’ provision which stipulates that construction of public buildings and public works generally should use US iron, steel, and other manufactured goods – limiting the opportunities for global participation. France and Germany have taken a similar stance in their support for domestic auto industries.
Estimating the multiplier effectThe prime objective of the fiscal stimulus packages has been to restore economic growth. In Asia and the Pacific this has primarily meant compensating for the loss of export demand from the developed economies. What will be the effect? This will depend not just on the size of the packages but also on the ‘fiscal multipliers’ and the composition of stimulus measures.
One of the key insights of British economist John Maynard Keynes was that government spending would not just create demand directly but also have a ‘multiplier effect’ – as workers employed on government projects, for example, in turn spent their income they would stimulate further demand which would ripple through the economy. Thus the impact of the initial stimulus could be multiplied two or three times. A more pessimistic view was that instead of triggering greater private expenditure, government spending would ‘crowd out’ private expenditure – in which case the multiplier might be much smaller, or even turn negative if government investment displaced a potentially larger volume of private investment.
There are two major techniques for estimating such multipliers. One, based on macroeconomic models, has concluded that multipliers tend to be higher in the short term than the long term. In Japan, for example, for the period 1977-1989, such modelling suggests that the short-term multiplier was 1.30 in the first year but dwindled to 0.86 in the third year perhaps because the crowding out effect became more significant later on (OECD, 2000). Another technique – using ‘reduced form equations’ – finds that the multipliers are smaller: one study has estimated that for US government spending in the post-war period the short-term multiplier was only 0.8. Another analysis for five OECD countries for the period of 1960-2000 concluded that the short-term multipliers varied considerably from country to country – 1.3 in Germany but only 0.3 in Canada and the UK (Blanchard and Perotti, 2002) – and that in some cases they turned negative. The IMF (2009) provided a survey of fiscal multipliers for several countries based on past studies. The study indicated that the size of the fiscal multiplier is country-, time-, and circumstance-specific. According to the study a rule of thumb is a multiplier of 1.5 to 1 for spending multipliers in large countries, 1 to 0.5 for medium-sized countries, and 0.5 or less for small, open countries.
The five crucial determinants of the fiscal multiplier are as follows: the size of the fiscal stimulus, its composition in terms of the balance between government expenditure and tax cuts, the magnitude of automatic stabilisers, the amount of fiscal space and the extent of taxation of the financial system, and the housing and equity markets (Chhibber and Palanivel, 2009). Government spending, which enters the economy straightaway, will tend to have a larger multiplier than tax cuts since the richer social groups may simply hoard the benefits of lower taxes by adding them to their savings. But there can also be differential impacts even within various forms of government expenditure. Investing in many large infrastructure projects, for example, takes time to organize so will benefit the economy only in the future. Another important consideration is whether the stimulus benefits primarily the rich or the poor. Expenditure for the poor is likely to kick in more quickly since the poor are likely to spend any income more vigorously. So a cash payment to poor
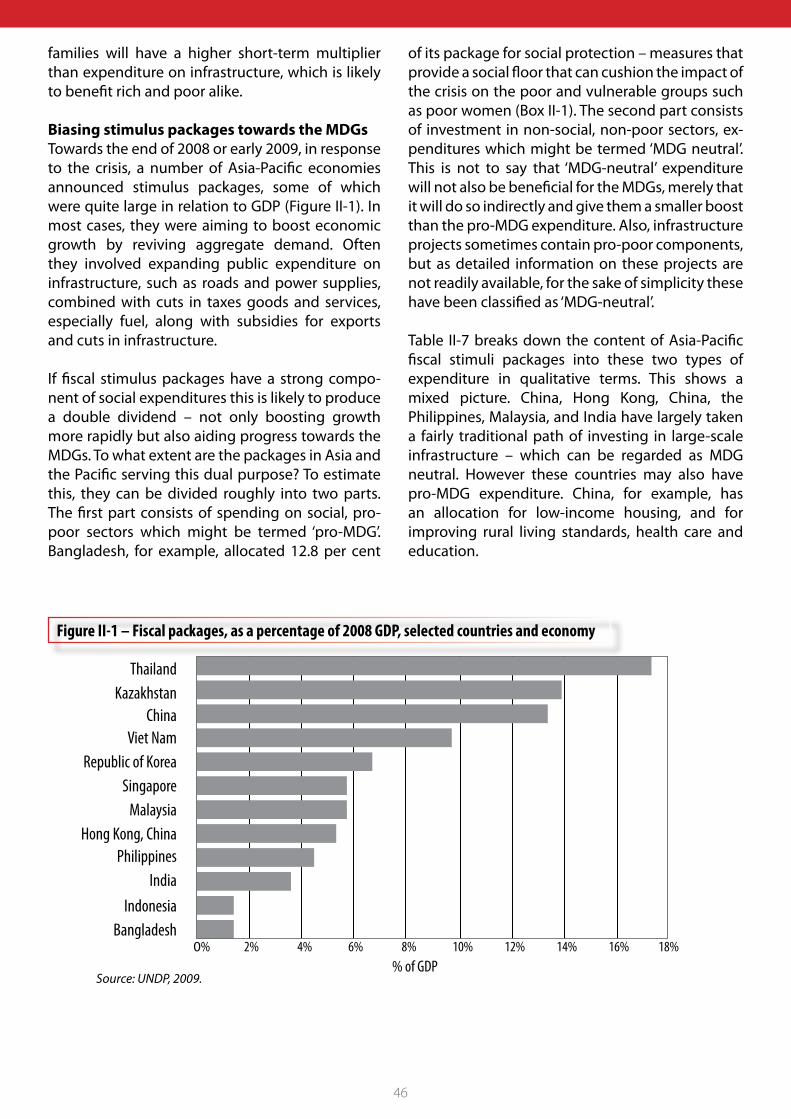
46
families will have a higher short-term multiplier than expenditure on infrastructure, which is likely to benefit rich and poor alike.
Biasing stimulus packages towards the MDGsTowards the end of 2008 or early 2009, in response to the crisis, a number of Asia-Pacific economies announced stimulus packages, some of which were quite large in relation to GDP (Figure II-1). In most cases, they were aiming to boost economic growth by reviving aggregate demand. Often they involved expanding public expenditure on infrastructure, such as roads and power supplies, combined with cuts in taxes goods and services, especially fuel, along with subsidies for exports and cuts in infrastructure.
If fiscal stimulus packages have a strong compo-nent of social expenditures this is likely to produce a double dividend – not only boosting growth more rapidly but also aiding progress towards the MDGs. To what extent are the packages in Asia and the Pacific serving this dual purpose? To estimate this, they can be divided roughly into two parts. The first part consists of spending on social, pro-poor sectors which might be termed ‘pro-MDG’. Bangladesh, for example, allocated 12.8 per cent
of its package for social protection – measures that provide a social floor that can cushion the impact of the crisis on the poor and vulnerable groups such as poor women (Box II-1). The second part consists of investment in non-social, non-poor sectors, ex-penditures which might be termed ‘MDG neutral’. This is not to say that ‘MDG-neutral’ expenditure will not also be beneficial for the MDGs, merely that it will do so indirectly and give them a smaller boost than the pro-MDG expenditure. Also, infrastructure projects sometimes contain pro-poor components, but as detailed information on these projects are not readily available, for the sake of simplicity these have been classified as ‘MDG-neutral’.
Table II-7 breaks down the content of Asia-Pacific fiscal stimuli packages into these two types of expenditure in qualitative terms. This shows a mixed picture. China, Hong Kong, China, the Philippines, Malaysia, and India have largely taken a fairly traditional path of investing in large-scale infrastructure – which can be regarded as MDG neutral. However these countries may also have pro-MDG expenditure. China, for example, has an allocation for low-income housing, and for improving rural living standards, health care and education.
ThailandKazakhstan
ChinaViet Nam
Republic of KoreaSingapore
MalaysiaHong Kong, China
PhilippinesIndia
IndonesiaBangladesh
0% 2% 4% 6% 8% 10% 12% 14% 16% 18%% of GDP
Source: UNDP, 2009.
Figure II-1 – Fiscal packages, as a percentage of 2008 GDP, selected countries and economy
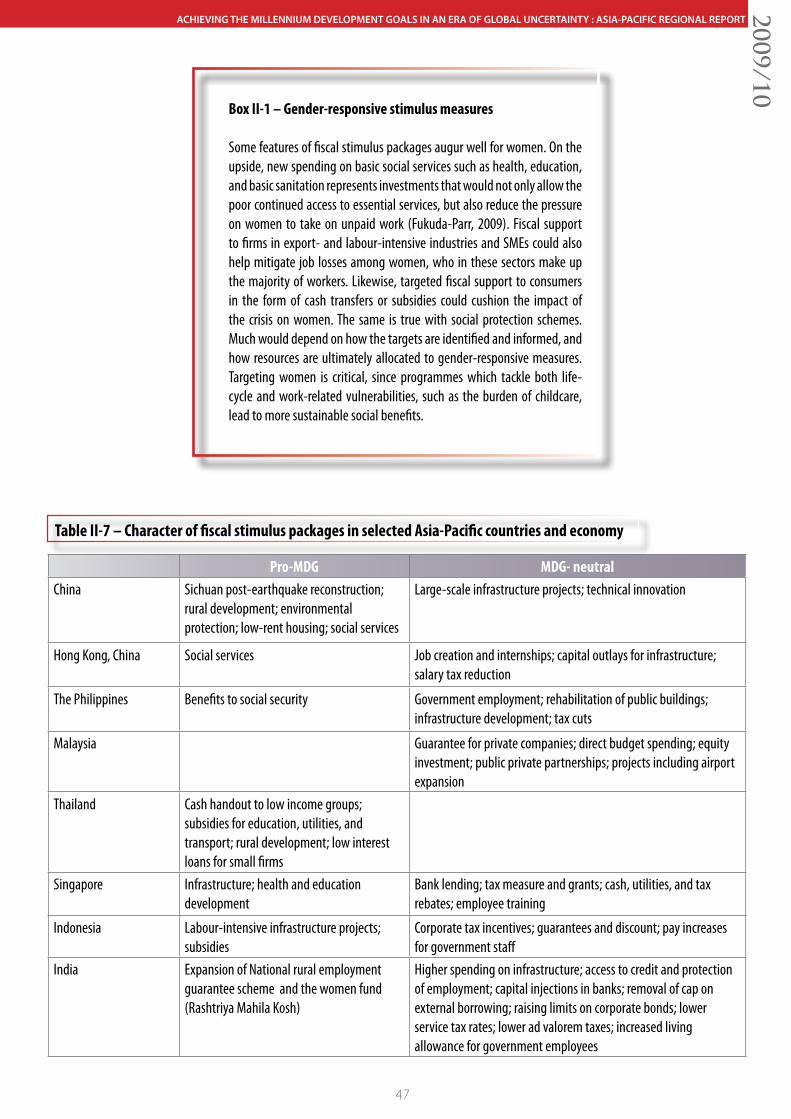
47
ACHIEVING THE MILLENNIUM DEVELOPMENT GOALS IN AN ERA OF GLOBAL UNCERTAINTY : ASIA-PACIFIC REGIONAL REPORT2009/10
Box II-1 – Gender-responsive stimulus measures
Some features of fiscal stimulus packages augur well for women. On the upside, new spending on basic social services such as health, education, and basic sanitation represents investments that would not only allow the poor continued access to essential services, but also reduce the pressure on women to take on unpaid work (Fukuda-Parr, 2009). Fiscal support to firms in export- and labour-intensive industries and SMEs could also help mitigate job losses among women, who in these sectors make up the majority of workers. Likewise, targeted fiscal support to consumers in the form of cash transfers or subsidies could cushion the impact of the crisis on women. The same is true with social protection schemes. Much would depend on how the targets are identified and informed, and how resources are ultimately allocated to gender-responsive measures. Targeting women is critical, since programmes which tackle both life-cycle and work-related vulnerabilities, such as the burden of childcare, lead to more sustainable social benefits.
Pro-MDG MDG- neutralChina Sichuan post-earthquake reconstruction;
rural development; environmental protection; low-rent housing; social services
Large-scale infrastructure projects; technical innovation
Hong Kong, China Social services Job creation and internships; capital outlays for infrastructure; salary tax reduction
The Philippines Benefits to social security Government employment; rehabilitation of public buildings; infrastructure development; tax cuts
Malaysia Guarantee for private companies; direct budget spending; equity investment; public private partnerships; projects including airport expansion
Thailand Cash handout to low income groups; subsidies for education, utilities, and transport; rural development; low interest loans for small firms
Singapore Infrastructure; health and education development
Bank lending; tax measure and grants; cash, utilities, and tax rebates; employee training
Indonesia Labour-intensive infrastructure projects; subsidies
Corporate tax incentives; guarantees and discount; pay increases for government staff
India Expansion of National rural employment guarantee scheme and the women fund (Rashtriya Mahila Kosh)
Higher spending on infrastructure; access to credit and protection of employment; capital injections in banks; removal of cap on external borrowing; raising limits on corporate bonds; lower service tax rates; lower ad valorem taxes; increased living allowance for government employees
Table II-7 – Character of fiscal stimulus packages in selected Asia-Pacific countries and economy
48
How much difference would it make if countries made more efforts to follow the pro-MDG path? This can be estimated in rough terms by considering the likelihood that the poor and the non-poor will spend money rather than save it – their different ‘propensities to consume’. The poor have a higher propensity to consume, so any pro-MDG government spending, especially in the way of a direct transfer to the poor, is likely to prompt further expenditure by the poor and thus have a higher multiplier than MDG-neutral expenditure. On this basis it is possible to decompose the overall fiscal multiplier into two parts – the pro-MDG multiplier and the MDG-neutral multiplier – and estimate their separate contributions to growth. The methodology for this is presented in Annex 4.
This exercise has been carried out for a number of countries or territories and the results are presented in Table II-8. In China, for example, the stimulus package is 13.3 per cent of GDP. Using the value of 1.6 as an estimate of China’s multiplier
4 Thus, if only 2 percent of GDP is spent out of the stimulus package in China in the first year (as is likely as mentioned earlier in this chapter) and the multiplier value realized in the first year is only half of its total value, then the GDP increase in the first year resulting from the stimu-lus is only 1.6 percent while the total increase is 21.3 percent.
would result in a total increase in GDP of 21.3 per cent, spread over a number of years. The impact on the first year would depend on the proportion of the stimulus package actually spent in the year, and the extent of the multiplier value realized within the first year. An examination of the content of China’s packages suggests that close to a quarter of the stimulus was pro-MDG, while the rest was MDG neutral. Based on the propensity to consume, the multiplier for pro-MDG spending was estimated at 2.9 while that for MDG-neutral spending was only 1.2. On this basis, about 41 per cent of the increase in GDP resulting from China’s stimulus would come from its pro-MDG component.
These numbers indicate the ‘growth potential’ of the total package, which will take place over several years. The annual growth will depend on actual annual expenditure and the multiplier for the particular year. This, however, has not been estimated.4
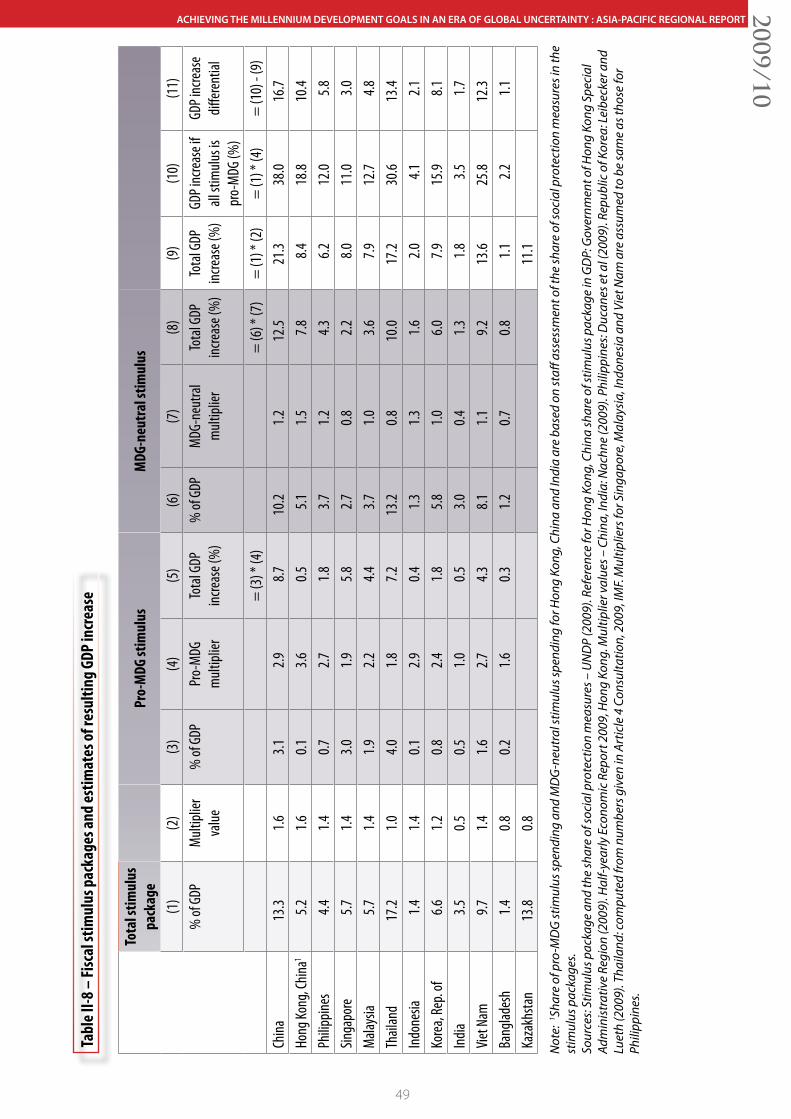
49
ACHIEVING THE MILLENNIUM DEVELOPMENT GOALS IN AN ERA OF GLOBAL UNCERTAINTY : ASIA-PACIFIC REGIONAL REPORT2009/10
Tabl
e II-8
– Fi
scal
stim
ulus
pac
kage
s and
estim
ates
of re
sulti
ng G
DP in
crea
se
Not
e: 1 Sh
are
of p
ro-M
DG
stim
ulus
spen
ding
and
MD
G-n
eutr
al st
imul
us sp
endi
ng fo
r Hon
g Ko
ng, C
hina
and
Indi
a ar
e ba
sed
on st
aff a
sses
smen
t of t
he sh
are
of so
cial
pro
tect
ion
mea
sure
s in
the
stim
ulus
pac
kage
s. So
urce
s: St
imul
us p
acka
ge a
nd th
e sh
are
of so
cial
pro
tect
ion
mea
sure
s – U
ND
P (2
009)
. Ref
eren
ce fo
r Hon
g Ko
ng, C
hina
shar
e of
stim
ulus
pac
kage
in G
DP:
Gov
ernm
ent o
f Hon
g Ko
ng S
peci
al
Adm
inis
trat
ive
Regi
on (2
009)
. Hal
f-yea
rly E
cono
mic
Rep
ort 2
009,
Hon
g Ko
ng. M
ultip
lier v
alue
s – C
hina
, Ind
ia: N
achn
e (2
009)
. Phi
lippi
nes:
Duc
anes
et a
l (20
09).
Repu
blic
of K
orea
: Lei
beck
er a
nd
Luet
h (2
009)
. Tha
iland
: com
pute
d fro
m n
umbe
rs g
iven
in A
rtic
le 4
Con
sulta
tion,
200
9, IM
F. M
ultip
liers
for S
inga
pore
, Mal
aysi
a, In
done
sia
and
Viet
Nam
are
ass
umed
to b
e sa
me
as th
ose
for
Phili
ppin
es.
Tota
l stim
ulus
pa
ckag
ePr
o-M
DG st
imul
usM
DG-n
eutr
al st
imul
us
(1)
(2)
(3)
(4)
(5)
(6)
(7)
(8)
(9)
(10)
(11)
% of
GDP
Mult
iplier
va
lue%
of G
DPPr
o-M
DG
mult
iplier
Tota
l GDP
inc
reas
e (%
)%
of G
DPM
DG-n
eutra
l m
ultipl
ier
Tota
l GDP
inc
reas
e (%
)To
tal G
DP
incre
ase (
%)
GDP i
ncre
ase i
f all
stim
ulus i
s pr
o-M
DG (%
)
GDP i
ncre
ase
differ
entia
l
= (3
) * (4
)=
(6) *
(7)
= (1
) * (2
)=
(1) *
(4)
= (1
0) -
(9)
China
13.3
1.63.1
2.98.7
10.2
1.212
.521
.338
.016
.7Ho
ng Ko
ng, C
hina1
5.21.6
0.13.6
0.55.1
1.57.8
8.418
.810
.4Ph
ilippin
es4.4
1.40.7
2.71.8
3.71.2
4.36.2
12.0
5.8Sin
gapo
re5.7
1.43.0
1.95.8
2.70.8
2.28.0
11.0
3.0M
alays
ia5.7
1.41.9
2.24.4
3.71.0
3.67.9
12.7
4.8Th
ailan
d17
.21.0
4.01.8
7.213
.20.8
10.0
17.2
30.6
13.4
Indo
nesia
1.41.4
0.12.9
0.41.3
1.31.6
2.04.1
2.1Ko
rea,
Rep.
of6.6
1.20.8
2.41.8
5.81.0
6.07.9
15.9
8.1In
dia3.5
0.50.5
1.00.5
3.00.4
1.31.8
3.51.7
Viet N
am9.7
1.41.6
2.74.3
8.11.1
9.213
.625
.812
.3Ba
nglad
esh
1.40.8
0.21.6
0.31.2
0.70.8
1.12.2
1.1Ka
zakh
stan
13.8
0.811
.1
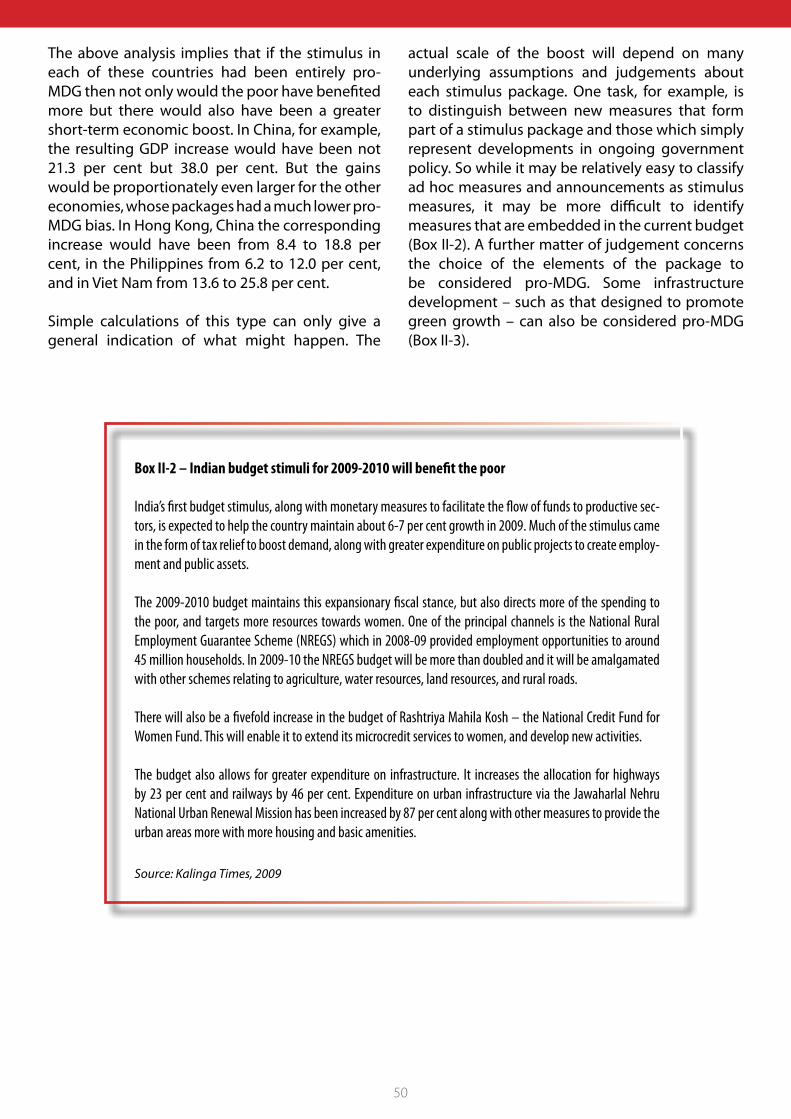
50
The above analysis implies that if the stimulus in each of these countries had been entirely pro-MDG then not only would the poor have benefited more but there would also have been a greater short-term economic boost. In China, for example, the resulting GDP increase would have been not 21.3 per cent but 38.0 per cent. But the gains would be proportionately even larger for the other economies, whose packages had a much lower pro-MDG bias. In Hong Kong, China the corresponding increase would have been from 8.4 to 18.8 per cent, in the Philippines from 6.2 to 12.0 per cent, and in Viet Nam from 13.6 to 25.8 per cent.
Simple calculations of this type can only give a general indication of what might happen. The
actual scale of the boost will depend on many underlying assumptions and judgements about each stimulus package. One task, for example, is to distinguish between new measures that form part of a stimulus package and those which simply represent developments in ongoing government policy. So while it may be relatively easy to classify ad hoc measures and announcements as stimulus measures, it may be more difficult to identify measures that are embedded in the current budget (Box II-2). A further matter of judgement concerns the choice of the elements of the package to be considered pro-MDG. Some infrastructure development – such as that designed to promote green growth – can also be considered pro-MDG (Box II-3).
Box II-2 – Indian budget stimuli for 2009-2010 will benefit the poor
India’s first budget stimulus, along with monetary measures to facilitate the flow of funds to productive sec-tors, is expected to help the country maintain about 6-7 per cent growth in 2009. Much of the stimulus came in the form of tax relief to boost demand, along with greater expenditure on public projects to create employ-ment and public assets.
The 2009-2010 budget maintains this expansionary fiscal stance, but also directs more of the spending to the poor, and targets more resources towards women. One of the principal channels is the National Rural Employment Guarantee Scheme (NREGS) which in 2008-09 provided employment opportunities to around 45 million households. In 2009-10 the NREGS budget will be more than doubled and it will be amalgamated with other schemes relating to agriculture, water resources, land resources, and rural roads.
There will also be a fivefold increase in the budget of Rashtriya Mahila Kosh – the National Credit Fund for Women Fund. This will enable it to extend its microcredit services to women, and develop new activities.
The budget also allows for greater expenditure on infrastructure. It increases the allocation for highways by 23 per cent and railways by 46 per cent. Expenditure on urban infrastructure via the Jawaharlal Nehru National Urban Renewal Mission has been increased by 87 per cent along with other measures to provide the urban areas more with more housing and basic amenities.
Source: Kalinga Times, 2009
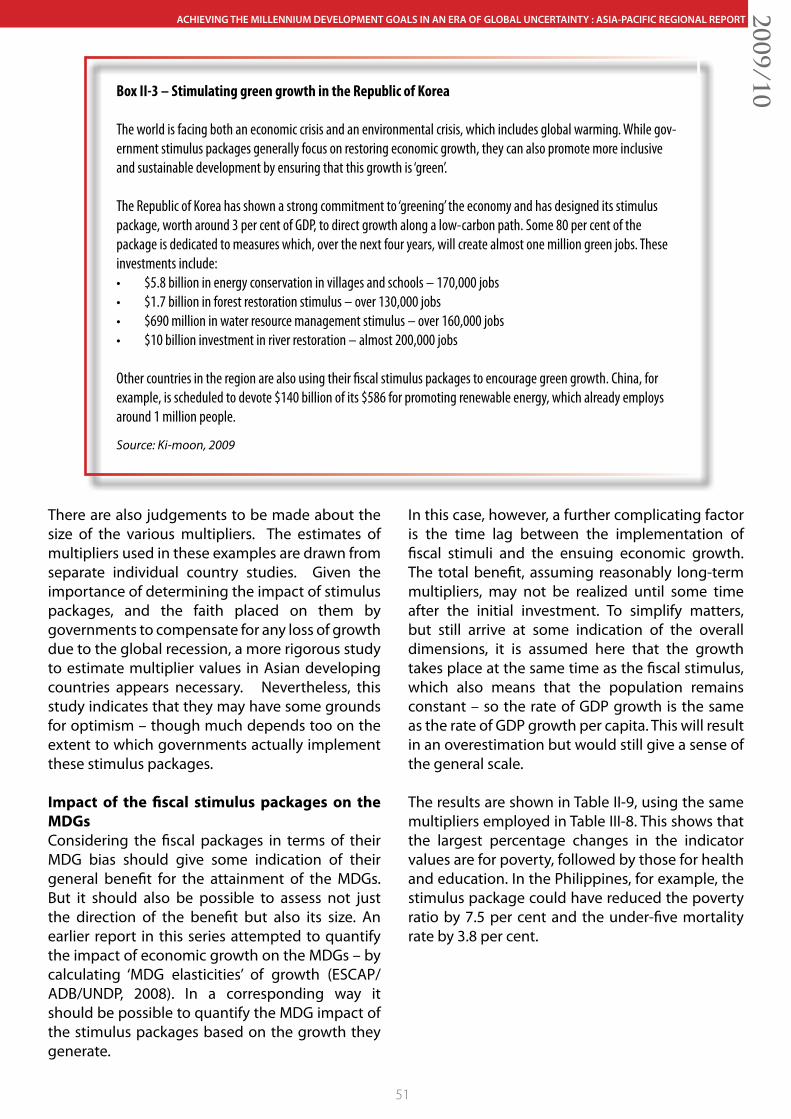
51
ACHIEVING THE MILLENNIUM DEVELOPMENT GOALS IN AN ERA OF GLOBAL UNCERTAINTY : ASIA-PACIFIC REGIONAL REPORT2009/10
There are also judgements to be made about the size of the various multipliers. The estimates of multipliers used in these examples are drawn from separate individual country studies. Given the importance of determining the impact of stimulus packages, and the faith placed on them by governments to compensate for any loss of growth due to the global recession, a more rigorous study to estimate multiplier values in Asian developing countries appears necessary. Nevertheless, this study indicates that they may have some grounds for optimism – though much depends too on the extent to which governments actually implement these stimulus packages.
Impact of the fiscal stimulus packages on the MDGsConsidering the fiscal packages in terms of their MDG bias should give some indication of their general benefit for the attainment of the MDGs. But it should also be possible to assess not just the direction of the benefit but also its size. An earlier report in this series attempted to quantify the impact of economic growth on the MDGs – by calculating ‘MDG elasticities’ of growth (ESCAP/ADB/UNDP, 2008). In a corresponding way it should be possible to quantify the MDG impact of the stimulus packages based on the growth they generate.
In this case, however, a further complicating factor is the time lag between the implementation of fiscal stimuli and the ensuing economic growth. The total benefit, assuming reasonably long-term multipliers, may not be realized until some time after the initial investment. To simplify matters, but still arrive at some indication of the overall dimensions, it is assumed here that the growth takes place at the same time as the fiscal stimulus, which also means that the population remains constant – so the rate of GDP growth is the same as the rate of GDP growth per capita. This will result in an overestimation but would still give a sense of the general scale.
The results are shown in Table II-9, using the same multipliers employed in Table III-8. This shows that the largest percentage changes in the indicator values are for poverty, followed by those for health and education. In the Philippines, for example, the stimulus package could have reduced the poverty ratio by 7.5 per cent and the under-five mortality rate by 3.8 per cent.
Box II-3 – Stimulating green growth in the Republic of Korea
The world is facing both an economic crisis and an environmental crisis, which includes global warming. While gov-ernment stimulus packages generally focus on restoring economic growth, they can also promote more inclusive and sustainable development by ensuring that this growth is ‘green’.
The Republic of Korea has shown a strong commitment to ‘greening’ the economy and has designed its stimulus package, worth around 3 per cent of GDP, to direct growth along a low-carbon path. Some 80 per cent of the package is dedicated to measures which, over the next four years, will create almost one million green jobs. These investments include: • $5.8billioninenergyconservationinvillagesandschools–170,000jobs• $1.7billioninforestrestorationstimulus–over130,000jobs• $690millioninwaterresourcemanagementstimulus–over160,000jobs• $10billioninvestmentinriverrestoration–almost200,000jobs
Other countries in the region are also using their fiscal stimulus packages to encourage green growth. China, for example, is scheduled to devote $140 billion of its $586 for promoting renewable energy, which already employs around 1 million people.
Source: Ki-moon, 2009
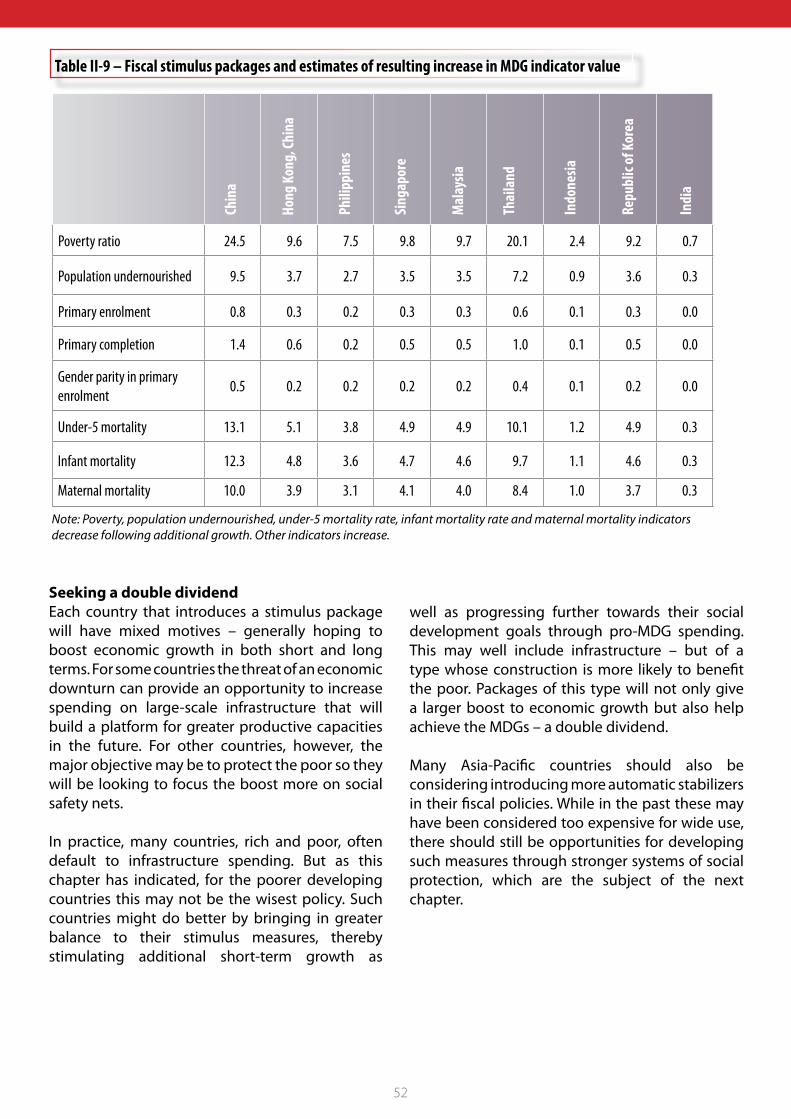
52
Poverty ratio 24.5 9.6 7.5 9.8 9.7 20.1 2.4 9.2 0.7
Population undernourished 9.5 3.7 2.7 3.5 3.5 7.2 0.9 3.6 0.3
Primary enrolment 0.8 0.3 0.2 0.3 0.3 0.6 0.1 0.3 0.0
Primary completion 1.4 0.6 0.2 0.5 0.5 1.0 0.1 0.5 0.0
Gender parity in primary enrolment
0.5 0.2 0.2 0.2 0.2 0.4 0.1 0.2 0.0
Under-5 mortality 13.1 5.1 3.8 4.9 4.9 10.1 1.2 4.9 0.3
Infant mortality 12.3 4.8 3.6 4.7 4.6 9.7 1.1 4.6 0.3
Maternal mortality 10.0 3.9 3.1 4.1 4.0 8.4 1.0 3.7 0.3
Chin
a
Hong
Kon
g, Ch
ina
Phili
ppin
es
Sing
apor
e
Mal
aysia
Thai
land
Indo
nesia
Repu
blic
of K
orea
Indi
a
Table II-9 – Fiscal stimulus packages and estimates of resulting increase in MDG indicator value
Note: Poverty, population undernourished, under-5 mortality rate, infant mortality rate and maternal mortality indicators decrease following additional growth. Other indicators increase.
Seeking a double dividendEach country that introduces a stimulus package will have mixed motives – generally hoping to boost economic growth in both short and long terms. For some countries the threat of an economic downturn can provide an opportunity to increase spending on large-scale infrastructure that will build a platform for greater productive capacities in the future. For other countries, however, the major objective may be to protect the poor so they will be looking to focus the boost more on social safety nets.
In practice, many countries, rich and poor, often default to infrastructure spending. But as this chapter has indicated, for the poorer developing countries this may not be the wisest policy. Such countries might do better by bringing in greater balance to their stimulus measures, thereby stimulating additional short-term growth as
well as progressing further towards their social development goals through pro-MDG spending. This may well include infrastructure – but of a type whose construction is more likely to benefit the poor. Packages of this type will not only give a larger boost to economic growth but also help achieve the MDGs – a double dividend.
Many Asia-Pacific countries should also be considering introducing more automatic stabilizers in their fiscal policies. While in the past these may have been considered too expensive for wide use, there should still be opportunities for developing such measures through stronger systems of social protection, which are the subject of the next chapter.
53
ACHIEVING THE MILLENNIUM DEVELOPMENT GOALS IN AN ERA OF GLOBAL UNCERTAINTY : ASIA-PACIFIC REGIONAL REPORT2009/10
Photo: ILO
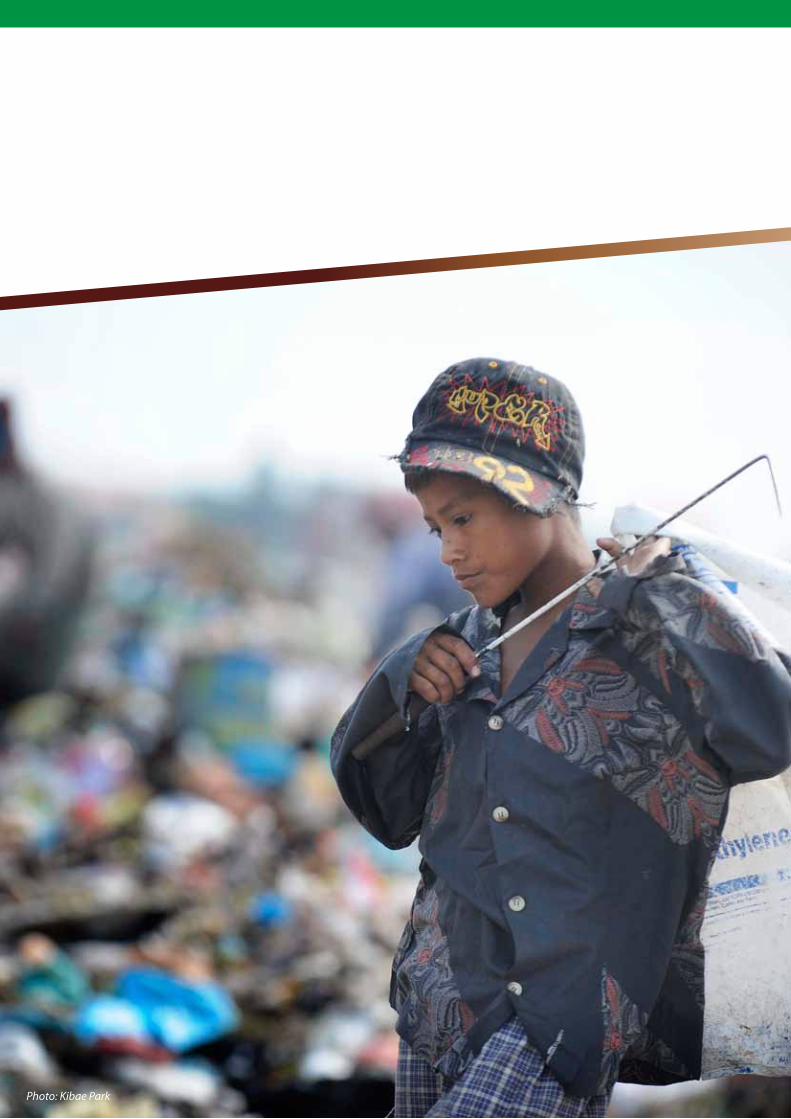
54Photo: Kibae Park
55
ACHIEVING THE MILLENNIUM DEVELOPMENT GOALS IN AN ERA OF GLOBAL UNCERTAINTY : ASIA-PACIFIC REGIONAL REPORT2009/10
3Chapter
Securing the MDGs through stronger social protection
The crises that have hit Asia and the Pacific in recent years – and threatened the achievement of the MDGs – have highlighted the need for stronger systems of social protection. In future, rather than sim-ply reacting to emergencies and other contingencies as they arise, the countries of the region should instead be able to offer much greater long-term socio-economic security, based not only on a solid foundation of human rights and social inclusiveness, but also on a commitment to equitable economic development and achieving the MDGs.
Both developed and developing countries, aiming to reduce the vulnerability of the poorest house-holds, have been expanding their systems of social protection – which can include social insurance, social assistance, labour market services, various social services particularly for women and children, and many types of local funds such as microcredit schemes (Box III-1).
Developed countries are now particularly concerned about the ageing of their populations and are seeking to achieve generational equity. As dependency rates rise, they have to find ways of sharing resources between today’s workers and the growing number of older dependents, in ways that are both financially prudent and sustainable.
For the Asia-Pacific developing countries, the challenges are different. They have more limited government resources and a significant proportion of their workers are in the informal sector. Generally, therefore, their systems of social protection are more limited. Nevertheless, as states achieve higher growth and become richer, they should be in a better position to protect their citizens. If they are to ensure sustained progress they will have to achieve the MDGs in a more equitable and inclusive way.
In particular, they need to address the impact of globalization. Globalization, by fostering economic
growth has helped reduce poverty, but it has also heightened risks and exposed many more people to international price shocks. Many people have failed to benefit from globalization and have been pushed to the margins. International food and fuel prices especially have become much more volatile: between January 2006 and June 2008 international prices of food grains, which account for more than half of total calories in developing countries, increased by 150 per cent.
Globalization has also accelerated international financial flows, but in so doing has heightened the potential for transmitting global financial crises. The Asian crisis in the late 1990s and the current economic crisis have demonstrated that suddenly declining output and rising unemployment can jeopardize hard-won gains in human development. With no, or very small, unemployment benefits the unemployed – women in particular – usually end up as casual, own-account or family workers, and there is now evidence of faster rise in these types of employment in several Asia-Pacific countries following the economic crisis. According to the ILO, in East Asia more than half the workforce is in unstable ‘vulnerable employment’, while in South-East Asia and the Pacific and in South Asia the proportion rises to 60 per cent or more (ILO, 2008).
Meanwhile, other forms of modernization and migration have undermined more traditional
56
Box III-1 – Social protection terminology
Different countries provide social protection in diverse ways – according to their own values, traditions and institutional and political structures. They can also use different terminology. This report uses the following terms:
Social protection – This is the overall umbrella term and its usage has evolved considerably in the past few decades. In general it is a society’s set of policies and programmes designed to reduce poverty and vulnerability – and includes both statutory and non-statutory provisions. In this report it is used in an inclusive sense, building upon the frameworks developed by the ILO, ADB and the World Bank. Thus social protection programmes can prevent individuals from slipping into poverty (employment guarantee and insurance), promote opportunities and economic risks (crop insurance) while also transforming communities and societies (human capital and health).
It may have each of the following components. First, social insurance, which provides benefits such as unemployment pay. This is often based partly on prior contributions by beneficiaries. Second, social assistance, which could be universal, such as free or subsidized public food distribution, or targeted, such as conditional cash transfers. Third, social services, typically including affordable housing, electricity, and basic health care services, such as child care, maternal care and immunization, which are provided free to children or other target groups. Fourth, labour market policies such as establishing unemployment offices or providing retraining that reduces workers’ vulnerability. Fifth, a child protection component to ensure that tomorrow’s leaders and teachers are protected. Finally, there are various kinds of local funds such as social funds and microcredit schemes, as well as other community- based efforts, such as early warning systems for disasters, or community-based food warehouse and storage facilities for food security.
Social insurance – The underlying principle is that of shared risk across the whole society. Its mechanisms are often embodied in national legislation. Certain events trigger payments – such as unemployment benefits, sickness benefits, maternity benefits or old-age pensions. The schemes are usually funded by contributions from up to three sources: individuals, employers, and governments. The benefits paid often vary according to the level of contribution from the individual: those who contribute more or work longer, for example, typically get higher payments. However, more recent social insurance schemes are strengthening the redistributive component.
Social assistance – This refers to those parts of social protection systems that are funded from general government revenues and by some NGOs and international donors. Benefits are paid according to need and bear no relation to what beneficiaries have paid as taxes. Indeed the beneficiaries are very often those who have paid the least tax. This would include, for example, food subsidies and emergency food distribution. In some countries such systems are called ‘social safety nets’; in others they are termed ‘welfare’.
Social services – These are some essential and basic services and are included in social protection because they often substitute for missing markets. The provision of free or subsidized health services for children and pregnant women, safe water and basic electricity fall under this category.
Social funds – These consist of agencies or programmes that give grants to communities for small-scale development projects that involve the active participation of local actors, such as community groups, local governments and NGOs. These funds typically finance a wide variety of socio-economic infrastructure, from health services to water supplies to micro-finance. Social funds are often concerned with local development and hence contribute to social protection.
Social safety net – This is another term for social assistance, which tends to be used more in developing countries and at times of emergency.
Social security – This term is used in different ways. Sometimes it corresponds to social insurance, sometimes it corresponds to social protection because it affords greater security to society.

57
ACHIEVING THE MILLENNIUM DEVELOPMENT GOALS IN AN ERA OF GLOBAL UNCERTAINTY : ASIA-PACIFIC REGIONAL REPORT2009/10
forms of household and community support, especially in the expanding urban areas. In these circumstances, children, women and older people especially, can become much less secure. And in the coming decades the share of the elderly in most Asian and Pacific populations is also expected to grow: according to current projections, between 2000 and 2025 the number of people aged 65 years and above will more than double.
A further and dangerous source of vulnerability is the increasing frequency of natural disasters – some of which are linked to global warming – including floods and droughts. Finally, the Asia Pacific region has the world’s highest population of displaced persons. A special set of interventions is needed to protect, reintegrate and rehabilitate displaced people, particularly in post-conflict countries.
Individuals are, however, not just subject to shocks transmitted through the economy or the environment, they also have to deal with catastrophic household events – sudden illness, for example, family breakup from forced migration, or the premature death of the main income earner.
Poor households are especially threatened. This is partly because they are more exposed – living in difficult conditions and lacking the assets that might buffer them against shocks. But they are also less able to cope. Poor communities have always had to be resilient and have developed remarkable abilities to manage risk. Nevertheless, living perpetually on the brink, they can suddenly be plunged into greater poverty. For example, when food prices spiral the poor have to concentrate on getting enough to eat – even at the expense of the family’s education or health. As a result, in the absence of effective social protection systems, many households that can survive in normal circumstances suddenly find themselves struggling below the poverty line.
Since the poor cannot afford most forms of insurance they should be able to rely on public provision to make up for the ‘missing market’. When the backbone of informal systems of support comes under stress, people should be able to turn for support to more formal systems. This can be supplemented by contributions from different elements of civil society, NGOs, community groups and society at large – participating in the design,
management and delivery of social protection.
Many countries in the region are now therefore re-examining ways of offering better protection to their citizens. This is not just to respond to the risks arising from the recent crises but also to provide a foundation for more robust economic development, since economic growth is unlikely to be sustainable unless the gains are equitably shared. The best way to achieve the MDGs is thus through inclusive and pro-poor growth, along with increased social justice, investment in human and physical capital, and the provision of productive employment. This will enable people to protect themselves more effectively and take advantage of many pathways out of poverty.
Social protection and the Millennium Develop-ment GoalsSocial protection measures are not explicitly included within the MDGS, but they can be critical to achieving them. At the same time, policies aimed to achieve the Millennium Development Goals will also address many forms of insecurity. Social protection and the MDGs thus have a symbiotic relationship.
For example, households that are less prone to economic failure will feel more confident about committing themselves to new enterprises or technologies that might help them escape poverty. Even more directly, the forms of social protection that serve to support the health and welfare of children and mothers will promote the goals related to child survival and gender while increasing future productivity and output.
Conversely, failures in social protection will undermine MDG achievement and increase vulnerability. Households faced with a sudden financial shock may, for example, have to divert microcredit loans from productive investment into consumption. And, desperate for income, they may withdraw children, particularly girls, from school in order to work. They will also have less to spend on health especially on preventive care. They are thus forced to take measures that are against their long-term interests.
The following sections explore in greater detail the ways in which the Millennium Development Goals are closely allied to social protection.
58
MDG-1 – Eradicate extreme povertySocial protection directly contributes to the achievement of MDG1 by transferring resources to the poor, smoothing their incomes and protecting their assets, while also building community assets – human and physical.
It also allows people to take informed risks. When individuals and households feel vulnerable, they may engage in ‘adverse behaviour’ that reduces their chances of escaping from poverty. They might, for example, choose less risky but also less rewarding activities. Thus rather than investing in more productive assets they might hold jewellery or cash. Rather than trying to raise crop yields they may plant drought-resistant but low-yielding varieties. And rather than specializing in one or two productive ventures they may try to smooth their income by working in a range of smaller but less productive activities.
Better social protection will also reduce household vulnerability by buffering the impact of current and future shocks. For poor families, this should enable them to rise above the poverty line. For those who are a little better off, it should provide a cushion that would keep them floating above the line even after a severe shock.
MDG-2 – Achieve universal primary education Providing primary education for all children has many benefits for society. Empirical evidence confirms the close link between family income and the education of children. A family that experiences a severe shock such as the illness of a breadwinner, may well pull a child out of school and send him or her to work, both to augment income and to pay for the costs of medical treatment. But this immediate response can have serious long-term consequences.
Social protection can also improve the quality of education by encouraging parents to send their children to school on a regular basis. Some of the most comprehensive schemes are conditional cash transfer programmes, which have been very successful in Mexico and Brazil, for example, and are now being introduced in Asia and the Pacific. The Asia-Pacific region also has a long history of programmes to encourage attendance, such as school-feeding programmes. Another option, as
with Bangladesh’s food-for-education programme is to provide a subsidy to the whole household if the children are going to school. There have also been transfer programmes at times of emergency: during the 1997 financial crisis, Indonesia, for example, mounted a large scholarship programme to safeguard enrolment.
Some social protection programmes can even increase the number of schools. Although traditional labour-intensive public works programmes focus on providing temporary income to their workers, they can also create and maintain infrastructure such as school buildings or access roads. Targeted social funds can also be used to rehabilitate schools and make them more child-friendly.
MDG-3 – Promote gender equality and empower womenWomen are usually the first providers of social protection in the household, and therefore social protection systems need to address their life-cycle risks as well as their work-related risks and their burden of care. The risks women face can be gender specific, or they could be intensified or imposed on by gender discrimination. Many countries are therefore adopting a two-pronged approach – mainstreaming gender while also specifically promoting social protection and gender equity.
Social protection can reduce gender disparities and empower women – while challenging existing social relations. However, much will depend on programme design and implementation. In Indonesia, for example, following the Asian financial crisis, job creation schemes often failed to cushion the impact on women’s employment and income. This was partly a result of gender bias, not only in the type of work provided, which often required physical strength, but also in the process of selecting participants.
This outcome is not inevitable. In India’s National Rural Employment Guarantee programme around 40 per cent of the workers are women. Moreover, women’s employment opportunities can be enhanced by expanding the concept of ‘public works’ to include employment-intensive social infrastructure projects and service delivery – such as auxiliary health care, care for the elderly, childcare, early childhood development, and
59
ACHIEVING THE MILLENNIUM DEVELOPMENT GOALS IN AN ERA OF GLOBAL UNCERTAINTY : ASIA-PACIFIC REGIONAL REPORT2009/10
youth development. These activities attract and employ women while lessening their burden of unpaid work (Dejardin and Owens 2009, and Elson 2008). Ongoing labour market activities, including training and other schemes, are also important for promoting gender equality – and are likely to increase the demand for girls’ education.
Informal community-based mechanisms such as social funds and micro-insurance schemes can also make an important contribution to gender empowerment (Box III-2). However, these informal mechanisms should not be treated as replacements for publicly-provided mechanisms.
MDG-4 – Reduce child mortality; MDG-5 – Improve maternal health; MDG-6 – Combat HIV and AIDS, malaria and other diseasesMDGs 4 to 6 are grouped together because of the similarity in the social protection interventions that address them. Affordable and quality healthcare services will contribute to all these goals, but they can be supplemented by social protection interventions such as widows’ and orphans’ pension benefits for HIV and AIDS, community care for improved maternal health and nutrition provision for infants.
Many countries in Asia and the Pacific have made impressive strides in improving maternal health, reducing child mortality, and in combating HIV and
Box III-2 – Informal mechanisms for social protection
Many non-governmental organizations can make a valuable contribution to social protection. In India, for example, the Self-em-ployed Women’s Association (SEWA) offers a number of informal social protection mechanisms. It works primarily in microfinance but has also established a health insurance scheme and offers free maternity benefits to women who subscribe to a fixed deposit plan.
In Bangladesh Grameen Kalyan targets rural groups of informal workers through health insurance, and emphasizes family planning, maternal and child health, and reproductive health.
In the Philippines, the ‘Social Health Insurance – Networking and Empowerment Project’ is a bilateral technical cooperation project between the German Agency for Technical Cooperation, and the Philippines Department of Health and the Philippine Health Insur-ance Corporation to support the implementation of an efficient, effective and equitable health insurance system. It has a ‘patchwork’ approach – targeting different groups by integrating grassroots organization and cooperatives with public social security, linked to the public health care systems.
Source: Luttrell and Moser, 2004
AIDS, malaria and other diseases but the systematic provision of health protection is very low. In India, for example, expenditure on public health care is only 1 per cent of GDP, and as a result, over 70 per cent of health care expenditure comes from personal out-of-pocket payments.
Effective social protection should not only make health care more accessible and affordable but also promote better health through preventative measures, especially for children. Conditional cash transfers can also encourage regular attendance at maternal and child clinics, and promote better nutrition. A number of countries in the region
are now improving access to basic as well as intermediate health-care services. This is evident not just in the richer countries like the Republic of Korea but also in several middle-income economies, including Malaysia, Thailand, Tonga, Fiji, and Sri Lanka, as well as in a few low-income economies such as Kyrgyzstan, Mongolia and Viet Nam.
MDG-7 – Ensure Environmental SustainabilityMillions of people rely for basic security on natural resources – on land, or forests, or fisheries. But at times of stress they can be driven to over-exploit common resources. Protecting people will therefore also help protect the environment. Social protection interventions include efforts aimed
60
at risk mitigation and adaptation, promoting environmentally friendly livelihoods, and providing drinking water and sanitation facilities to urban slums.
MDG-8 – Develop a global partnership for deve-lopmentUnder MDG 8, social protection which serves as a lynchpin for inclusive economic development can benefit from increased donor support – in terms of capacity building, knowledge sharing and financial support. Social funds and community-based efforts can also be used directly to promote youth welfare.
Social protection to reduce the impact of crisis and support MDG achievementThe current economic crisis is expected to result in higher unemployment and poverty in the region, thus retarding the progress in MDG-1, and in turn affect other MDGs such as nutrition, health and education outcomes. Social protection measures, by providing additional income to the poor, and maintaining their food intake and access to education and health services, can support the MDG achievements during such crises.
While several types of social protection measures exist, some are particularly relevant for tackling crisis situations as they can provide quick relief in the short-term to the poor. Important amongst these are (i) employment generation measures, (ii) cash transfers programmes - conditional or unconditional, (iii) targeted expansion of coverage of social services, such as feeding programmes, and health and education programmes, with particular focus on providing benefits to women and girls, and (iv) expansion of micro-credit schemes to affected groups and localities. Many of these programmes are in the nature of social assistance programmes and social services.
Indeed, as seen in the previous chapter, the stimulus packages announced by some countries do contain many such social protection measures for crisis relief. For example, the stimulus package in India includes an expansion of the National Rural Employment Guarantee Scheme, while Indonesia’s stimulus package lays stress on labour- intensive infrastructure projects. The stimulus packages in the Philippines and Thailand include social security benefits and cash transfers to the poor,
while subsidies for health, education and social services in general find a major place in the stimulus packages of China, Singapore, Thailand, and Hong Kong, China. Easing the availability of finance for affected groups – women and small firms – has also been stressed in the stimulus packages of India and Thailand.
To be effective as a crisis relief measure these social protection measures should be able to target the affected people and provide adequate benefits that meet the requirements during the crisis period, and to overcome the crisis impacts. The experience during the Asian financial crisis of 1997 brought out some of the major deficiencies of the social protection programmes on these two counts. An ESCAP study, based on surveys conducted in Indonesia, the Republic of Korea and Thailand, showed that the public works programmes, for example, failed to target women who lost jobs in formal sectors, while the unemployment insurance schemes did not benefit workers in the informal sector in any significant manner (ESCAP, 2002). Moreover, the additional income provided by these programmes was inadequate to cover the basic needs of the beneficiaries, and the benefits were not sustained sufficiently long for the affected people to overcome the impacts of that crisis. The micro-credit programmes, while successful in targeting women with low education, failed to reach those who had lost jobs in the formal sector. Similarly, the credit programmes for small and medium enterprises failed to reach those firms that suffered the most during the crisis and had to resort to job cuts. Further, the size of the credit provided under these programmes was insufficient to give a significant boost to the employment and incomes of the beneficiaries. The common bottlenecks in these programmes relate to deficiencies in design, administration and implementation, along with the appropriate monitoring and evaluation, in addition to sustainable financing.
All these problems are solvable – as experience across the region has demonstrated – especially if the affected local community plays an important role in their design and operation, including the control of funds. In addition to the well known example of the Grameen Bank in Bangladesh, other examples of effective social protection programmes include:
61
ACHIEVING THE MILLENNIUM DEVELOPMENT GOALS IN AN ERA OF GLOBAL UNCERTAINTY : ASIA-PACIFIC REGIONAL REPORT2009/10
India – National Rural Employment Guarantee SchemeLaunched in 2006, this guarantees every rural household up to 100 days of unskilled manual wage employment per year at the statutory minimum wage. This is usually through labour- intensive projects on rural infrastructure. In 2007-08, this provided employment to 34 million households, more than half of whom came from the most marginalized groups, and more than 40 per cent of the workers were women. It is thought that this could be reducing rates of poverty in the lean season by 10–15 percentage points. The total allocated funds towards the scheme for 2009-10 are approximately INR 39,100 crore ($8.5 billion ), which is about 0.7 per cent of GDP. Countries wishing to implement such schemes could learn from past experience – taking steps to avoid disincentives and economic distortions in behaviour, directing schemes towards social and economic infrastructure and promoting equity in participation, with special consideration for women, youth and disadvantaged minorities.
Armenia – Family Poverty Benefits ProgrammeIn 1999, in order to reduce the number of extremely poor families, the government replaced the system of state compensation and humanitarian assistance with a means-tested Family Poverty Benefits Programme. Since much of the country’s economic activity is in the informal sector, the targeting was based not on income but on a proxy mechanism, ranking each household on a single index based on individual and household characteristics. Each family that qualifies receives a basic monthly benefit. In 2003, the programme covered 141,218 families (505,560 individuals), or about 16.6% of the population at a cost of US$ 25 million or 0.9 per cent of GDP. Bangladesh – Food Security for Vulnerable Group Development Executed by the Government of Bangladesh in partnership with the World Food Programme, this distributes wheat flour fortified with essential micronutrients. Compared with the food ration programme, which distributes rice, this programme brings greater benefits to women. It is thought to have reduced extreme poverty by 30 percentage points and increased per capita calorie intake by more than 10 per cent (Ahmed and Ninno, 2002; Ahmed et al. 2004).
India – Tamil Nadu Integrated Nutrition ProjectCovering a rural population of more than 19 million, this is one of the world’s largest programmes for nutrition education and targeted supplementary feeding. A central tenet of the project, which has been running since 1980, has been that most malnutrition is the result of inappropriate child care practices. So key elements, along with nutrition supplements, include nutrition education and growth monitoring. Between 1983 and 2000, the incidence of severe malnutrition among children aged 0-36 months declined from 12.3 to 0.3 per cent (Swaminathan, M. 2009).
Indonesia – Unconditional cash transferIn 2005, the Government initiated this programme to compensate poor families for the short-term impacts of a fuel price increase and the removal of a fuel subsidy. Each beneficiary family, selected through a proxy means test based on its economic and social characteristics, receives about $10 per month, paid quarterly. In 2006, this covered 19 million poor and near- poor households – one third of the population. It cost around $2.4 billion or 0.7 per cent of GDP. Since 2007, Indonesia has also been piloting a conditional cash transfer programme.
Thailand – Universal health care In 2001, Thailand took an historic step towards achieving full population coverage in health care by introducing a universal health-care scheme – previously referred to as the ‘30 baht scheme’. This offers any Thai citizen not affiliated to the Social Security Health insurance scheme or the Civil Servants’ Medical Benefit Scheme full access to health services provided by designated district-based networks of providers – consisting of health centres, district hospitals and cooperating provincial hospitals. People who are eligible have to register with the networks and obtain a free insurance card. Originally they had to pay 30 baht – a little less than $1 – for each outpatient visit or hospital admission. However the co-payment has since been abolished, and drugs on prescription are also free of charge.
Long-term social protection to strengthen Asia’s resilience against future shocks Since global crises of different kinds are likely to recur, countries across the region will need to be ready with comprehensive social protection systems. In doing so they can defend millions of
62
vulnerable households and families, reducing the need for self-insurance or harmful household coping strategies. At the same time, by helping households avoid drastic cuts in expenditure they can build into the economy ‘automatic stabilizers’ that sustain economic activity at times of economic slowdown.
Coverage of social protection programmes in the Asia Pacific region is among the lowest in the world. Most of the poorer developing countries lack institutionalized welfare systems. Although they may have a variety of social protection measures, these are not sufficiently funded, coherent or extensive to protect their vulnerable populations. And such fragmented social safety nets as do exist are generally biased towards the formal sector, leaving many without basic services and rights.
Estimates of coverage are hampered, however, by definitions of what constitutes social protection as well as by the lack of data, so the information in this chapter should be considered only as a general indication. Some of the existing forms of social protection are shown, by country, in Table III-1– though this only indicates the presence of the corresponding scheme rather than the coverage. For instance, social insurance, tends to reach only a small proportion of the workforce – generally government workers and some of those employed in the formal sector – which in India, for example, is less than a tenth of the total workforce. Across the region, people working in the informal economy do not generally benefit from social safety nets.
Work by both ESCAP and the Asian Development Bank indicates the current scale of coverage.
ESCAP, for example, has estimated that across Asia and the Pacific only 20 per cent of the unemployed and underemployed have access to labour market programmes, such as unemployment benefits, training or public works programmes, including work-for-food programmes. It was also found that only 30 per cent of the elderly receive pensions while the vast majority rely on family support. Protection through health services is weak: only 20 per cent of the region’s population has access to health-care assistance – with the result that Asia and the Pacific has the world’s highest out-of-pocket health-care expenditures (ESCAP, 2007). Even in China, social insurance has been restricted to the urban population, and only recently has the Government made a concerted effort to extend it to migrants and to the rural population. South Asian countries on the other hand tend to have much lower coverage, except for microcredit.
The Asian Development Bank in its 2008 publication Social Protection Index for Committed Poverty Reduction has also made broad estimates by applying a set of weights to the coverage ratios for each target group for all major categories of social protection (Baulch et al, 2008). Since this includes public-sector pensions, those countries with a large public sector could have large values on this index. This index shows coverage to be highest in the two most developed countries in the data set, Japan and the Republic of Korea , but also high in the Central Asian countries because of the legacy of the Soviet era (Figure III-1).
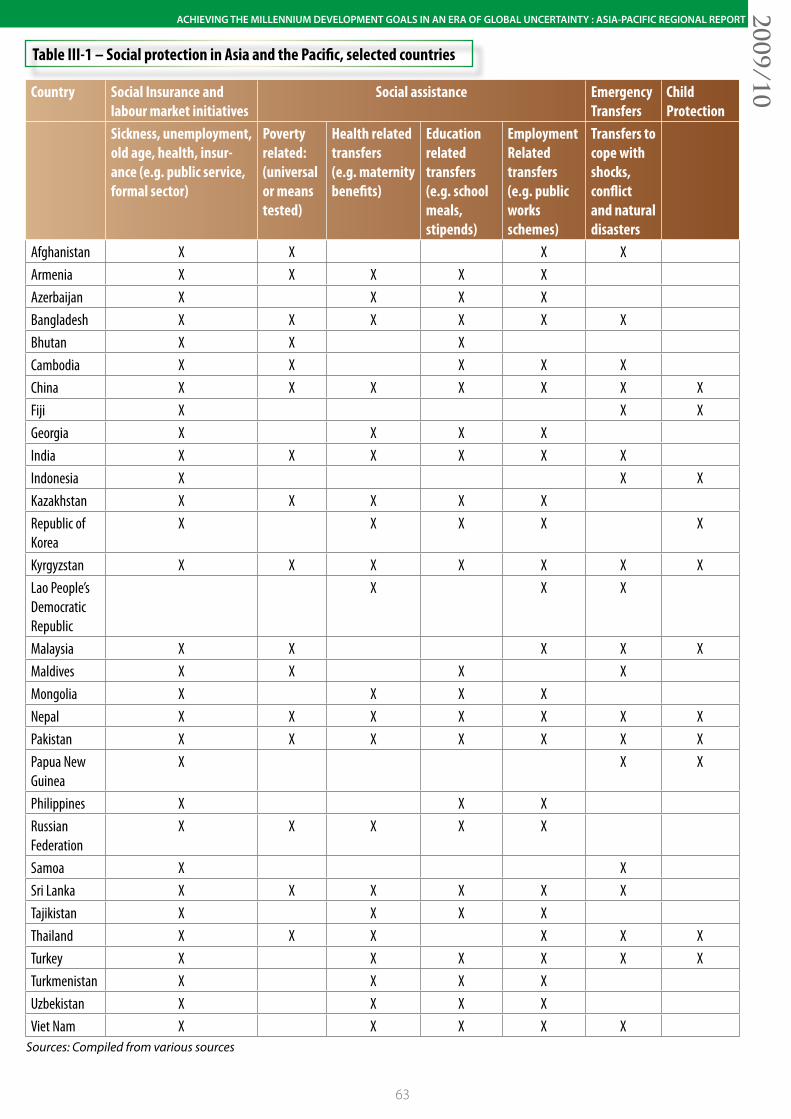
63
ACHIEVING THE MILLENNIUM DEVELOPMENT GOALS IN AN ERA OF GLOBAL UNCERTAINTY : ASIA-PACIFIC REGIONAL REPORT2009/10
Table III-1 – Social protection in Asia and the Pacific, selected countries
Sources: Compiled from various sources
Country Social Insurance and labour market initiatives
Social assistance Emergency Transfers
Child Protection
Sickness, unemployment, old age, health, insur-ance (e.g. public service, formal sector)
Poverty related: (universal or means tested)
Health related transfers (e.g. maternity benefits)
Education related transfers (e.g. school meals, stipends)
Employment Related transfers (e.g. public works schemes)
Transfers to cope with shocks, conflict and natural disasters
Afghanistan X X X XArmenia X X X X XAzerbaijan X X X XBangladesh X X X X X XBhutan X X XCambodia X X X X XChina X X X X X X XFiji X X XGeorgia X X X XIndia X X X X X XIndonesia X X XKazakhstan X X X X XRepublic of Korea
X X X X X
Kyrgyzstan X X X X X X XLao People’s Democratic Republic
X X X
Malaysia X X X X XMaldives X X X XMongolia X X X XNepal X X X X X X XPakistan X X X X X X XPapua New Guinea
X X X
Philippines X X XRussian Federation
X X X X X
Samoa X XSri Lanka X X X X X XTajikistan X X X XThailand X X X X X XTurkey X X X X X XTurkmenistan X X X XUzbekistan X X X XViet Nam X X X X X
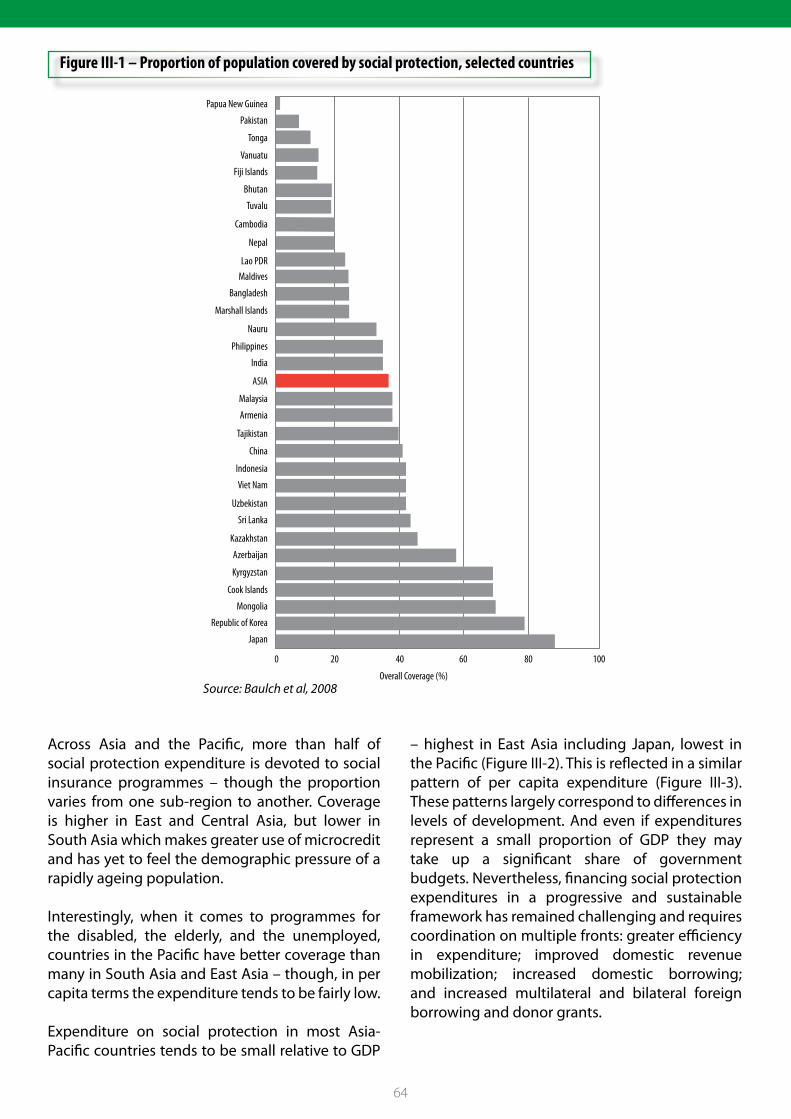
64
0 20 40 60 80 100
Overall Coverage (%)
Papua New Guinea
Pakistan
Tonga
Vanuatu
Fiji Islands
Bhutan
Tuvalu
Cambodia
Nepal
Lao PDRMaldives
Bangladesh
Marshall Islands
Nauru
Philippines
India
ASIA
Malaysia
Armenia
Tajikistan
China
Indonesia
Viet Nam
Uzbekistan
Sri Lanka
Kazakhstan
Azerbaijan
Kyrgyzstan
Cook Islands
Mongolia
Republic of Korea
Japan
Source: Baulch et al, 2008
Figure III-1 – Proportion of population covered by social protection, selected countries
Across Asia and the Pacific, more than half of social protection expenditure is devoted to social insurance programmes – though the proportion varies from one sub-region to another. Coverage is higher in East and Central Asia, but lower in South Asia which makes greater use of microcredit and has yet to feel the demographic pressure of a rapidly ageing population.
Interestingly, when it comes to programmes for the disabled, the elderly, and the unemployed, countries in the Pacific have better coverage than many in South Asia and East Asia – though, in per capita terms the expenditure tends to be fairly low.
Expenditure on social protection in most Asia-Pacific countries tends to be small relative to GDP
– highest in East Asia including Japan, lowest in the Pacific (Figure III-2). This is reflected in a similar pattern of per capita expenditure (Figure III-3). These patterns largely correspond to differences in levels of development. And even if expenditures represent a small proportion of GDP they may take up a significant share of government budgets. Nevertheless, financing social protection expenditures in a progressive and sustainable framework has remained challenging and requires coordination on multiple fronts: greater efficiency in expenditure; improved domestic revenue mobilization; increased domestic borrowing; and increased multilateral and bilateral foreign borrowing and donor grants.
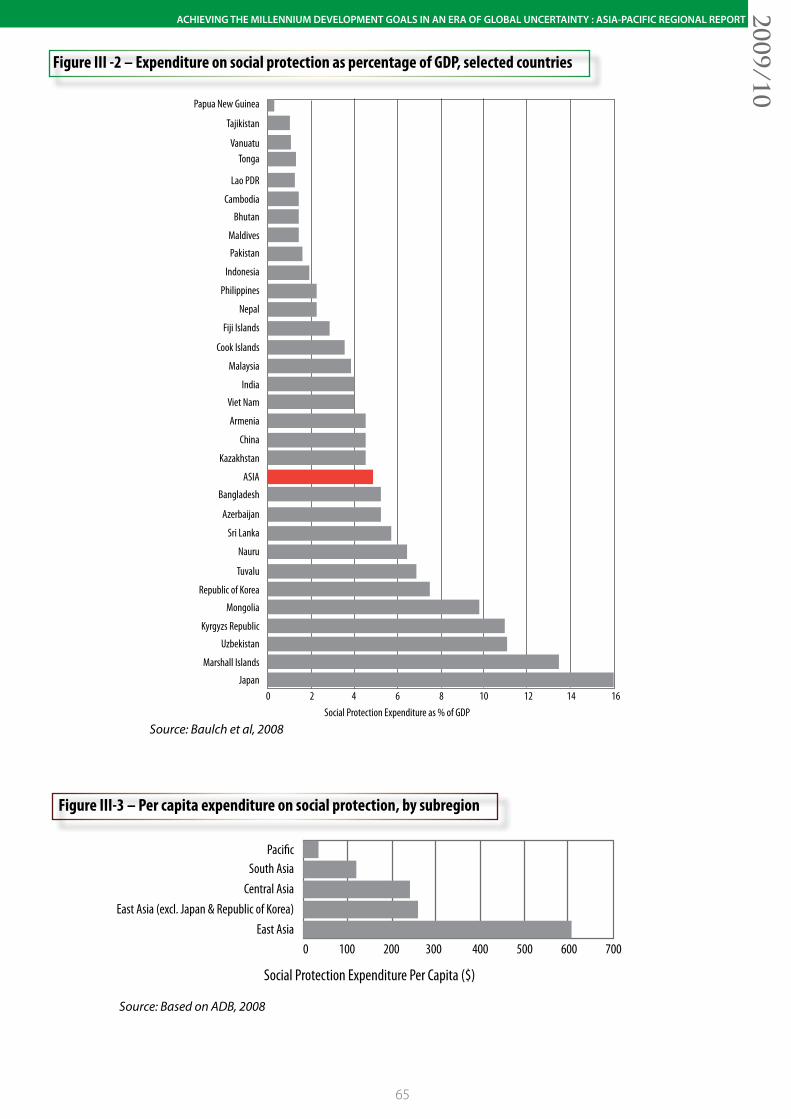
65
ACHIEVING THE MILLENNIUM DEVELOPMENT GOALS IN AN ERA OF GLOBAL UNCERTAINTY : ASIA-PACIFIC REGIONAL REPORT2009/10
Papua New Guinea
Tajikistan
VanuatuTonga
Lao PDR
Cambodia
Bhutan
Maldives
Pakistan
Indonesia
Philippines
Nepal
Fiji Islands
Cook Islands
Malaysia
India
Viet Nam
Armenia
China
Kazakhstan
ASIA
Bangladesh
Azerbaijan
Sri Lanka
Nauru
Tuvalu
Republic of Korea
Mongolia
Kyrgyzs Republic
Uzbekistan
Marshall Islands
Japan0 2 4 6 8 10 12 14 16
Social Protection Expenditure as % of GDP
Figure III -2 – Expenditure on social protection as percentage of GDP, selected countries
Source: Baulch et al, 2008
Paci�cSouth Asia
Central AsiaEast Asia (excl. Japan & Republic of Korea)
East Asia0 100 200 300 400 500 600 700
Figure III-3 – Per capita expenditure on social protection, by subregion
Source: Based on ADB, 2008
Social Protection Expenditure Per Capita ($)
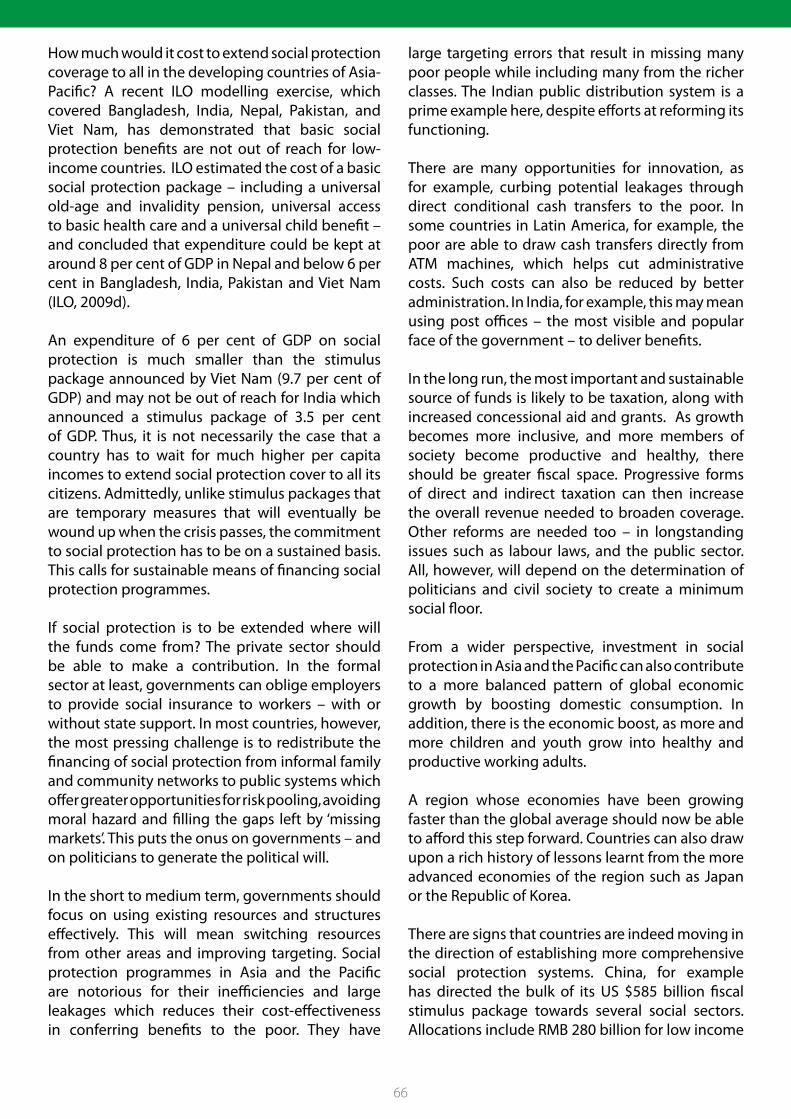
66
How much would it cost to extend social protection coverage to all in the developing countries of Asia-Pacific? A recent ILO modelling exercise, which covered Bangladesh, India, Nepal, Pakistan, and Viet Nam, has demonstrated that basic social protection benefits are not out of reach for low-income countries. ILO estimated the cost of a basic social protection package – including a universal old-age and invalidity pension, universal access to basic health care and a universal child benefit – and concluded that expenditure could be kept at around 8 per cent of GDP in Nepal and below 6 per cent in Bangladesh, India, Pakistan and Viet Nam (ILO, 2009d).
An expenditure of 6 per cent of GDP on social protection is much smaller than the stimulus package announced by Viet Nam (9.7 per cent of GDP) and may not be out of reach for India which announced a stimulus package of 3.5 per cent of GDP. Thus, it is not necessarily the case that a country has to wait for much higher per capita incomes to extend social protection cover to all its citizens. Admittedly, unlike stimulus packages that are temporary measures that will eventually be wound up when the crisis passes, the commitment to social protection has to be on a sustained basis. This calls for sustainable means of financing social protection programmes.
If social protection is to be extended where will the funds come from? The private sector should be able to make a contribution. In the formal sector at least, governments can oblige employers to provide social insurance to workers – with or without state support. In most countries, however, the most pressing challenge is to redistribute the financing of social protection from informal family and community networks to public systems which offer greater opportunities for risk pooling, avoiding moral hazard and filling the gaps left by ‘missing markets’. This puts the onus on governments – and on politicians to generate the political will.
In the short to medium term, governments should focus on using existing resources and structures effectively. This will mean switching resources from other areas and improving targeting. Social protection programmes in Asia and the Pacific are notorious for their inefficiencies and large leakages which reduces their cost-effectiveness in conferring benefits to the poor. They have
large targeting errors that result in missing many poor people while including many from the richer classes. The Indian public distribution system is a prime example here, despite efforts at reforming its functioning.
There are many opportunities for innovation, as for example, curbing potential leakages through direct conditional cash transfers to the poor. In some countries in Latin America, for example, the poor are able to draw cash transfers directly from ATM machines, which helps cut administrative costs. Such costs can also be reduced by better administration. In India, for example, this may mean using post offices – the most visible and popular face of the government – to deliver benefits.
In the long run, the most important and sustainable source of funds is likely to be taxation, along with increased concessional aid and grants. As growth becomes more inclusive, and more members of society become productive and healthy, there should be greater fiscal space. Progressive forms of direct and indirect taxation can then increase the overall revenue needed to broaden coverage. Other reforms are needed too – in longstanding issues such as labour laws, and the public sector. All, however, will depend on the determination of politicians and civil society to create a minimum social floor.
From a wider perspective, investment in social protection in Asia and the Pacific can also contribute to a more balanced pattern of global economic growth by boosting domestic consumption. In addition, there is the economic boost, as more and more children and youth grow into healthy and productive working adults.
A region whose economies have been growing faster than the global average should now be able to afford this step forward. Countries can also draw upon a rich history of lessons learnt from the more advanced economies of the region such as Japan or the Republic of Korea.
There are signs that countries are indeed moving in the direction of establishing more comprehensive social protection systems. China, for example has directed the bulk of its US $585 billion fiscal stimulus package towards several social sectors. Allocations include RMB 280 billion for low income
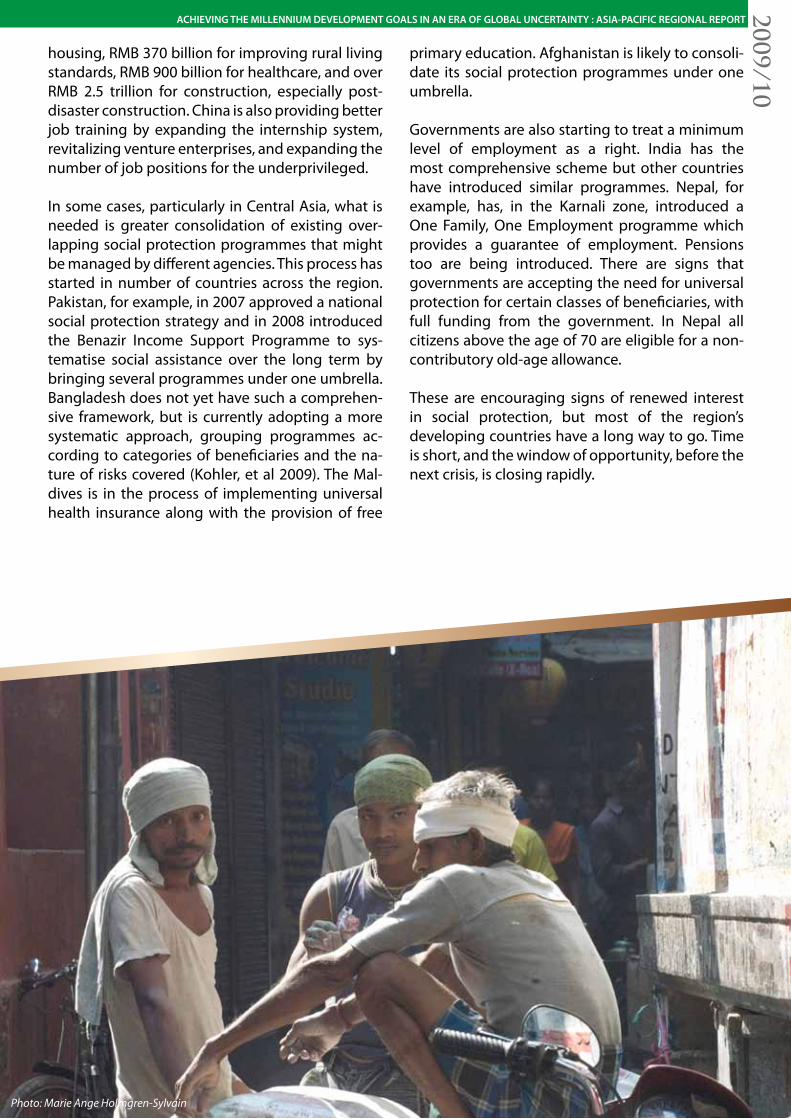
67
ACHIEVING THE MILLENNIUM DEVELOPMENT GOALS IN AN ERA OF GLOBAL UNCERTAINTY : ASIA-PACIFIC REGIONAL REPORT2009/10
housing, RMB 370 billion for improving rural living standards, RMB 900 billion for healthcare, and over RMB 2.5 trillion for construction, especially post-disaster construction. China is also providing better job training by expanding the internship system, revitalizing venture enterprises, and expanding the number of job positions for the underprivileged.
In some cases, particularly in Central Asia, what is needed is greater consolidation of existing over-lapping social protection programmes that might be managed by different agencies. This process has started in number of countries across the region. Pakistan, for example, in 2007 approved a national social protection strategy and in 2008 introduced the Benazir Income Support Programme to sys-tematise social assistance over the long term by bringing several programmes under one umbrella. Bangladesh does not yet have such a comprehen-sive framework, but is currently adopting a more systematic approach, grouping programmes ac-cording to categories of beneficiaries and the na-ture of risks covered (Kohler, et al 2009). The Mal-dives is in the process of implementing universal health insurance along with the provision of free
primary education. Afghanistan is likely to consoli-date its social protection programmes under one umbrella.
Governments are also starting to treat a minimum level of employment as a right. India has the most comprehensive scheme but other countries have introduced similar programmes. Nepal, for example, has, in the Karnali zone, introduced a One Family, One Employment programme which provides a guarantee of employment. Pensions too are being introduced. There are signs that governments are accepting the need for universal protection for certain classes of beneficiaries, with full funding from the government. In Nepal all citizens above the age of 70 are eligible for a non-contributory old-age allowance.
These are encouraging signs of renewed interest in social protection, but most of the region’s developing countries have a long way to go. Time is short, and the window of opportunity, before the next crisis, is closing rapidly.
Photo: Marie Ange Holmgren-Sylvain
68Photo: Paul Ubl
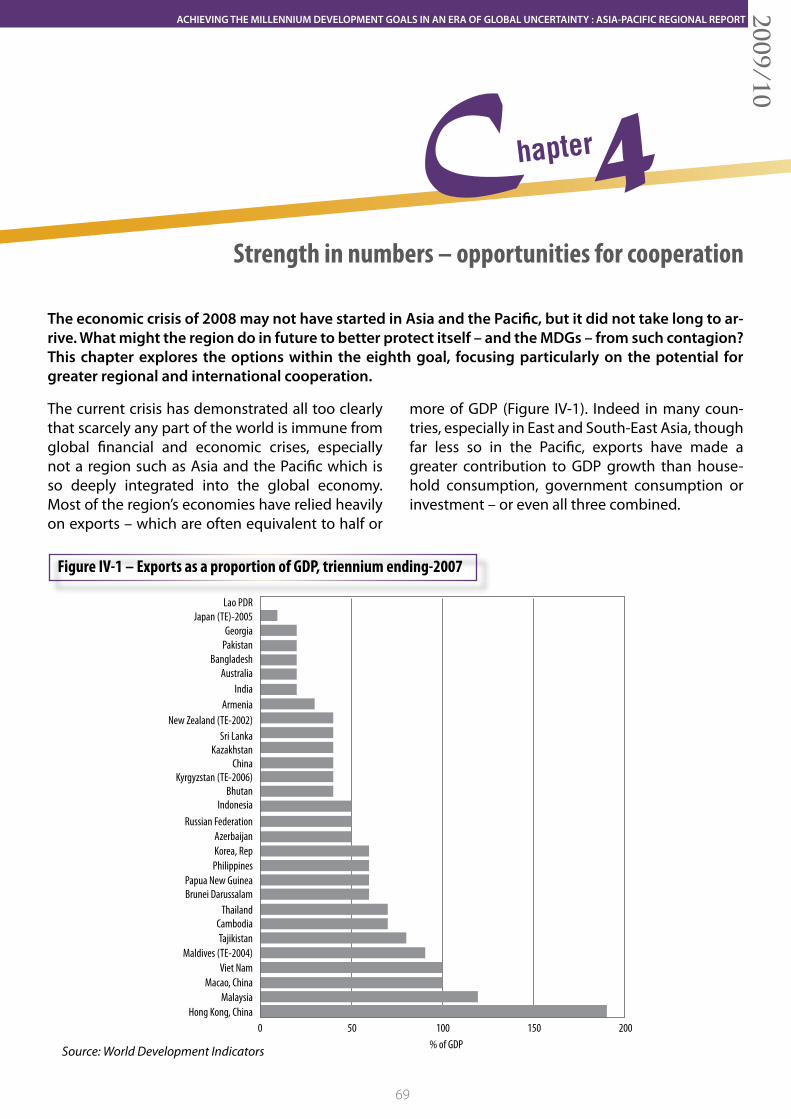
69
ACHIEVING THE MILLENNIUM DEVELOPMENT GOALS IN AN ERA OF GLOBAL UNCERTAINTY : ASIA-PACIFIC REGIONAL REPORT2009/10
4Chapter
Strength in numbers – opportunities for cooperation
The economic crisis of 2008 may not have started in Asia and the Pacific, but it did not take long to ar-rive. What might the region do in future to better protect itself – and the MDGs – from such contagion? This chapter explores the options within the eighth goal, focusing particularly on the potential for greater regional and international cooperation.
The current crisis has demonstrated all too clearly that scarcely any part of the world is immune from global financial and economic crises, especially not a region such as Asia and the Pacific which is so deeply integrated into the global economy. Most of the region’s economies have relied heavily on exports – which are often equivalent to half or
more of GDP (Figure IV-1). Indeed in many coun-tries, especially in East and South-East Asia, though far less so in the Pacific, exports have made a greater contribution to GDP growth than house-hold consumption, government consumption or investment – or even all three combined.
0 50 100 150 200
Lao PDRJapan (TE)-2005
GeorgiaPakistan
BangladeshAustralia
IndiaArmenia
New Zealand (TE-2002)Sri Lanka
KazakhstanChina
Kyrgyzstan (TE-2006)Bhutan
IndonesiaRussian Federation
AzerbaijanKorea, RepPhilippines
Papua New GuineaBrunei Darussalam
ThailandCambodiaTajikistan
Maldives (TE-2004)Viet Nam
Macao, ChinaMalaysia
Hong Kong, China
% of GDP
Figure IV-1 – Exports as a proportion of GDP, triennium ending-2007
Source: World Development Indicators
70
So when, following the crisis, import demand from the advanced economies shrank, many Asian countries faced a sudden drop in exports. The scale of the losses can be estimated by comparing 2008 exports with what they might have been had they followed their recent trend during the preceding three years. The results are shown in Table IV-1 for the 33 Asia-Pacific economies for which data were available. Of these, 12 economies saw their exports grow faster than the trend – predominantly natu-ral-resource exporters, such as Kazakhstan, which in 2008, prior to the financial crisis, had benefited from high commodity prices. The remaining 21, however, suffered setbacks. Compared with what they might have expected to export, five econo-mies suffered absolute losses of over $10 billion: China; India; Singapore; Hong Kong, China; and Thailand. For all 33 economies as a group, the net loss was $240 billion. However, the economies
that suffered the greatest proportional declines compared with expected exports were: Samoa, -30 per cent; Bhutan and Myanmar, -24 per cent; Armenia, -21 per cent; and Azerbaijan, -20 per cent. The above estimates of export declines are, how-ever, only one part of the loss in GDP. They do not capture the impact of job losses in export sectors, particularly for women who make up the major-ity of workers in export industries (Box IV-1), and the further loss in domestic demand. Nevertheless, they do give a general idea of the scale of the loss-es in 2008. With the world economy in recession for most of 2009, the export losses in 2009 could be even higher. Further, not all of the loss in exports in all these countries can be attributed entirely to the crisis. In Myanmar, for example, some of the export loss may be attributed to cyclone Nargis that hit the country in 2008 affecting rice production and exports.
Box IV-1 – Trade and gender equality
Asia’s export growth, and the rise of vertically integrated global supply chains within the region, have been powerful drivers of trends in women’s employment and migration. Women have re-sponded to the global economy’s need for a flexible workforce – concentrated in informal or vul-nerable employment – that can be tapped or discarded depending on market demand. In East Asia and the Pacific, around 60 per cent of women are in vulnerable employment; in South Asia over 80 per cent (ILO, 2008).
Despite making up the vast majority of workers in export industries and vertically-integrated glo-bal production chains, women typically remain segregated and concentrated at the margins of the production process, and account for less than 10 per cent of total sale price of what they produce (Carr and Chen, 2004).
Women also have limited opportunities to assert their labour rights; in most Asian countries, less than 20 per cent of female workers belong to labour unions. As a result of gender bias women will often lose their jobs first during economic downturns, since employers tend to favour the retention of male workers who are assumed to be the main income-earners in their households (UNIFEM, 2008b).
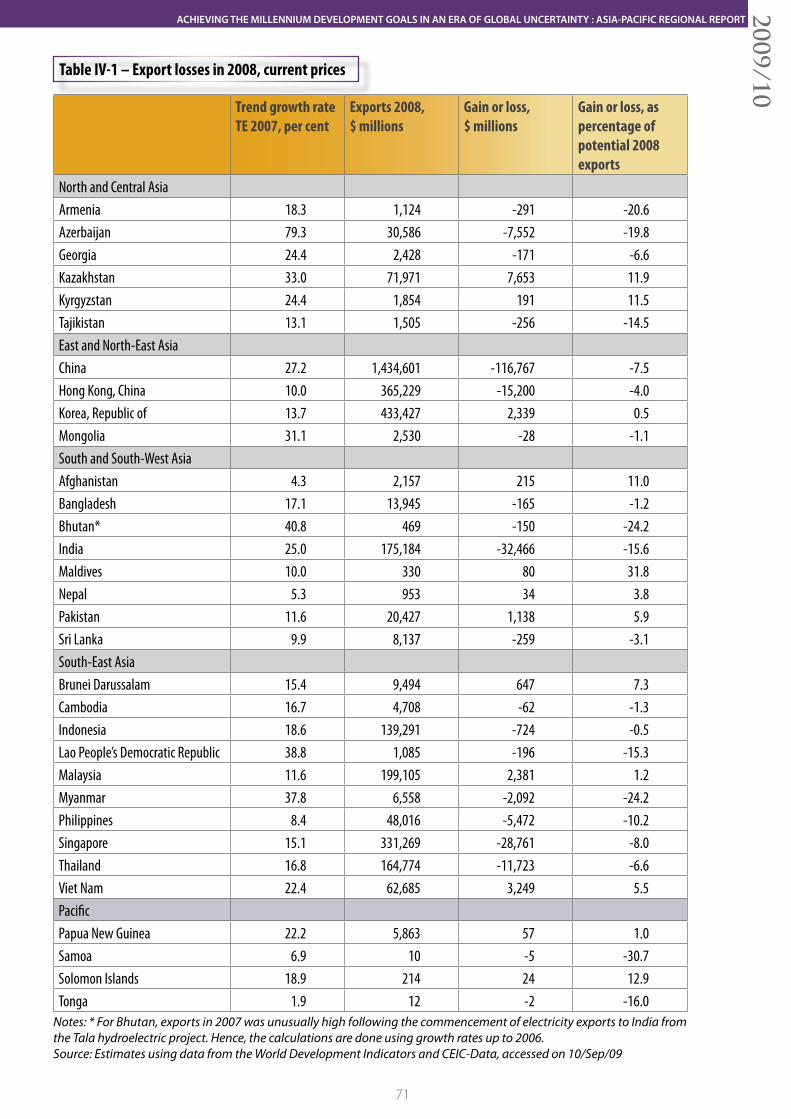
71
ACHIEVING THE MILLENNIUM DEVELOPMENT GOALS IN AN ERA OF GLOBAL UNCERTAINTY : ASIA-PACIFIC REGIONAL REPORT2009/10
Trend growth rate TE 2007, per cent
Exports 2008, $ millions
Gain or loss, $ millions
Gain or loss, as percentage of potential 2008 exports
North and Central AsiaArmenia 18.3 1,124 -291 -20.6Azerbaijan 79.3 30,586 -7,552 -19.8Georgia 24.4 2,428 -171 -6.6Kazakhstan 33.0 71,971 7,653 11.9Kyrgyzstan 24.4 1,854 191 11.5Tajikistan 13.1 1,505 -256 -14.5East and North-East Asia China 27.2 1,434,601 -116,767 -7.5Hong Kong, China 10.0 365,229 -15,200 -4.0Korea, Republic of 13.7 433,427 2,339 0.5Mongolia 31.1 2,530 -28 -1.1South and South-West Asia Afghanistan 4.3 2,157 215 11.0Bangladesh 17.1 13,945 -165 -1.2Bhutan* 40.8 469 -150 -24.2India 25.0 175,184 -32,466 -15.6Maldives 10.0 330 80 31.8Nepal 5.3 953 34 3.8Pakistan 11.6 20,427 1,138 5.9Sri Lanka 9.9 8,137 -259 -3.1South-East Asia Brunei Darussalam 15.4 9,494 647 7.3Cambodia 16.7 4,708 -62 -1.3Indonesia 18.6 139,291 -724 -0.5Lao People’s Democratic Republic 38.8 1,085 -196 -15.3Malaysia 11.6 199,105 2,381 1.2Myanmar 37.8 6,558 -2,092 -24.2Philippines 8.4 48,016 -5,472 -10.2Singapore 15.1 331,269 -28,761 -8.0Thailand 16.8 164,774 -11,723 -6.6Viet Nam 22.4 62,685 3,249 5.5Pacific Papua New Guinea 22.2 5,863 57 1.0Samoa 6.9 10 -5 -30.7Solomon Islands 18.9 214 24 12.9Tonga 1.9 12 -2 -16.0
Notes: * For Bhutan, exports in 2007 was unusually high following the commencement of electricity exports to India from the Tala hydroelectric project. Hence, the calculations are done using growth rates up to 2006. Source: Estimates using data from the World Development Indicators and CEIC-Data, accessed on 10/Sep/09
Table IV-1 – Export losses in 2008, current prices
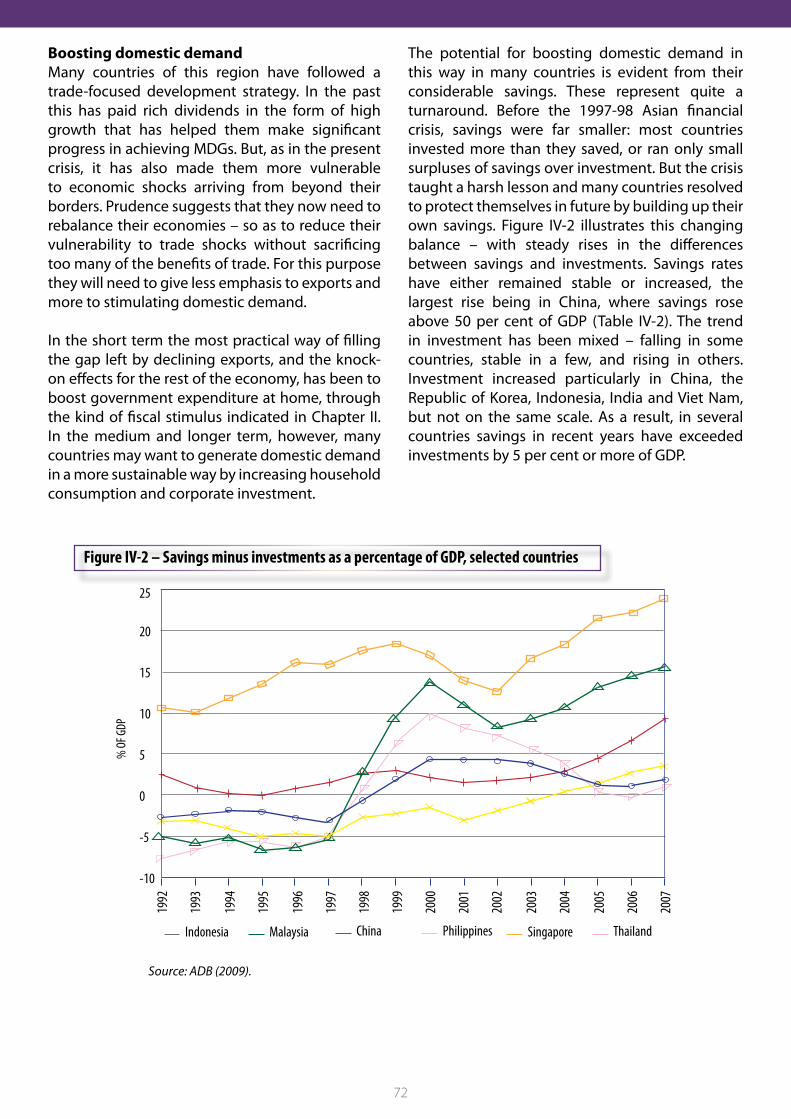
72
Boosting domestic demandMany countries of this region have followed a trade-focused development strategy. In the past this has paid rich dividends in the form of high growth that has helped them make significant progress in achieving MDGs. But, as in the present crisis, it has also made them more vulnerable to economic shocks arriving from beyond their borders. Prudence suggests that they now need to rebalance their economies – so as to reduce their vulnerability to trade shocks without sacrificing too many of the benefits of trade. For this purpose they will need to give less emphasis to exports and more to stimulating domestic demand.
In the short term the most practical way of filling the gap left by declining exports, and the knock-on effects for the rest of the economy, has been to boost government expenditure at home, through the kind of fiscal stimulus indicated in Chapter II. In the medium and longer term, however, many countries may want to generate domestic demand in a more sustainable way by increasing household consumption and corporate investment.
The potential for boosting domestic demand in this way in many countries is evident from their considerable savings. These represent quite a turnaround. Before the 1997-98 Asian financial crisis, savings were far smaller: most countries invested more than they saved, or ran only small surpluses of savings over investment. But the crisis taught a harsh lesson and many countries resolved to protect themselves in future by building up their own savings. Figure IV-2 illustrates this changing balance – with steady rises in the differences between savings and investments. Savings rates have either remained stable or increased, the largest rise being in China, where savings rose above 50 per cent of GDP (Table IV-2). The trend in investment has been mixed – falling in some countries, stable in a few, and rising in others. Investment increased particularly in China, the Republic of Korea, Indonesia, India and Viet Nam, but not on the same scale. As a result, in several countries savings in recent years have exceeded investments by 5 per cent or more of GDP.
Indonesia Malaysia China Philippines Singapore Thailand
1992
1993
1994
1995
1996
1997
1998
1999
2000
2001
2002
2003
2004
2005
2006
2007
25
20
15
10
5
0
-5
-10
% O
F GDP
Figure IV-2 – Savings minus investments as a percentage of GDP, selected countries
Source: ADB (2009).
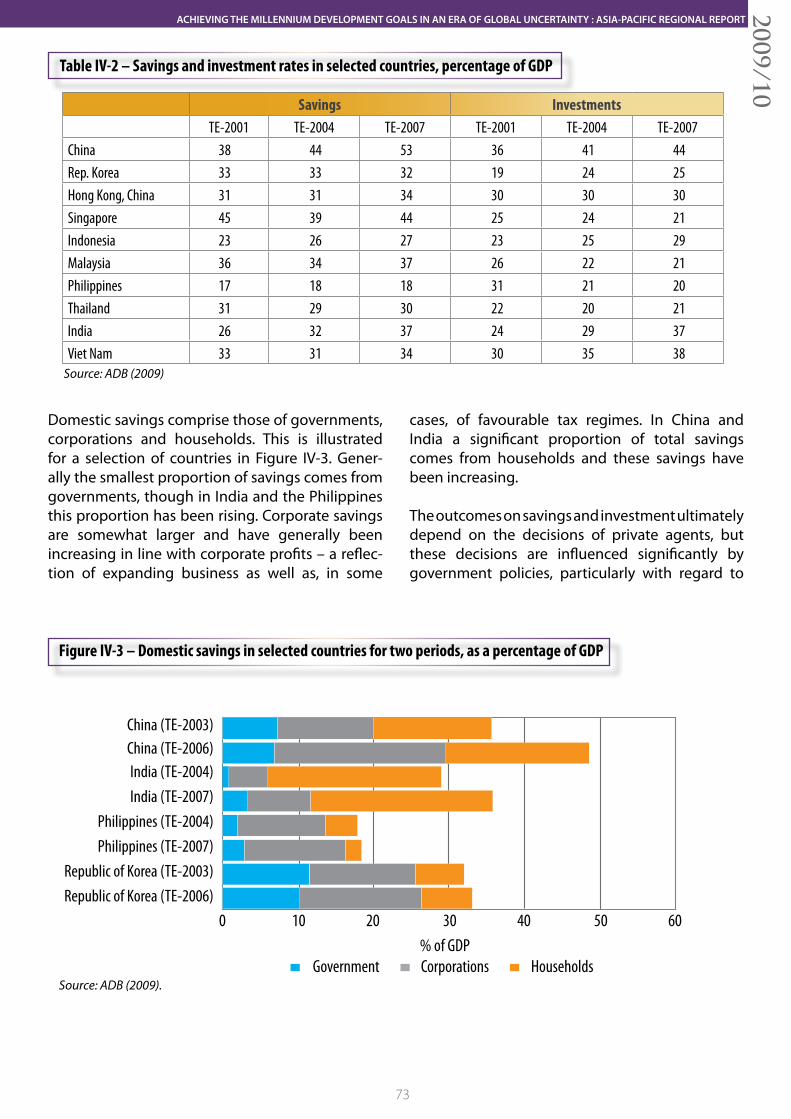
73
ACHIEVING THE MILLENNIUM DEVELOPMENT GOALS IN AN ERA OF GLOBAL UNCERTAINTY : ASIA-PACIFIC REGIONAL REPORT2009/10
Savings Investments TE-2001 TE-2004 TE-2007 TE-2001 TE-2004 TE-2007China 38 44 53 36 41 44Rep. Korea 33 33 32 19 24 25Hong Kong, China 31 31 34 30 30 30Singapore 45 39 44 25 24 21Indonesia 23 26 27 23 25 29Malaysia 36 34 37 26 22 21Philippines 17 18 18 31 21 20Thailand 31 29 30 22 20 21India 26 32 37 24 29 37Viet Nam 33 31 34 30 35 38
Table IV-2 – Savings and investment rates in selected countries, percentage of GDP
Source: ADB (2009)
Source: ADB (2009).
Domestic savings comprise those of governments, corporations and households. This is illustrated for a selection of countries in Figure IV-3. Gener-ally the smallest proportion of savings comes from governments, though in India and the Philippines this proportion has been rising. Corporate savings are somewhat larger and have generally been increasing in line with corporate profits – a reflec-tion of expanding business as well as, in some
cases, of favourable tax regimes. In China and India a significant proportion of total savings comes from households and these savings have been increasing.
The outcomes on savings and investment ultimately depend on the decisions of private agents, but these decisions are influenced significantly by government policies, particularly with regard to
Figure IV-3 – Domestic savings in selected countries for two periods, as a percentage of GDP
China (TE-2003)China (TE-2006)India (TE-2004)India (TE-2007)
Philippines (TE-2004)Philippines (TE-2007)
Republic of Korea (TE-2003)Republic of Korea (TE-2006)
0 10 20 30 40 50 60% of GDP
Government Corporations Households
74
investment, especially public investment, and by the general fiscal stance of the government. In the years following the Asian financial crisis, several governments adopted a conservative fiscal stance, and reduced their fiscal deficits, resulting in rises in government savings (Chhibber, Ghosh and Palanivel, 2009).
Boosting domestic demand will mean increasing both consumption and investment. How can households be induced to save less and consume more? This depends on why people are saving. One reason could be to smooth incomes over the lifetimes of household members. On this hypothesis, savings should thus be higher in countries that have lower dependency ratios – a higher number of working people compared with children and the elderly – and lower in countries with higher dependency ratios. Some Asian countries show evidence, albeit weak, for this life-cycle hypothesis. Governments who wished to address this would need to consider increasing child benefits and old-age pensions – measures that are probably out of reach of the poorest developing countries.
Another motive for saving is to set aside funds for emergencies. Households will want to provide for unforeseen exigencies such as loss of income or sickness. Offering more secure access to public health care or education, for example, would thus not only help achieve the health-related MDG targets but also reduce people’s anxiety about having lower savings. Evidence from Taiwan, China, for example, suggests that better public health insurance results in lower household savings (Athukorala and Tsai 2003; Chou et al. 2003, 2006).
A third motive for saving is to finance anticipated expenditure – to pay for expensive consumer goods, for example, or children’s schooling. This is more likely in countries with underdeveloped financial systems where households cannot easily go to a bank to borrow against future income. Instead they have to self-finance through savings (Caballero et al. 2008). Policies to counter this would involve better credit so that households can make more balanced choices between current and future consumption.
Consumption is also likely to increase if a greater share of national income goes to the poor who, as
discussed in chapter II, have a higher propensity to consume. Reducing poverty can therefore unleash the latent demand for goods and services that cater to the needs of the poor. Governments should be looking to increase the earning and spending power of the poor, especially in rural areas, through expansion of education and skills and improving their health standards. In this way, policies that promote the MDGs will also foster domestic demand and inclusive growth – while provide a stronger buffer against foreign storms.
But policies should not just aim to alter the choices of households. Governments will want to give appropriate incentives to the private sector to make it more profitable for companies to invest within the country – and in sectors that are oriented less towards exports and more towards meeting domestic demand, especially the needs of the poor. Policies on exchange rates, taxation and subsidies play an important role in this regard. For example, by avoiding undervalued exchange rate, governments can divert resources from tradable sectors into non-tradable sectors. In developing countries, government investment in infrastructure, such as energy and transport services, is also an important catalyst. From the MDG perspective, investments by small and medium enterprises (SMEs) are crucial for employment generation. But SMEs in developing countries are usually constrained by the availability of finance, and in that context a strong, stable and supportive financial system is essential.
Restructuring intra-regional trade As well as reorienting their economies more towards domestic markets, many countries can also consider diversifying their export markets so as to become less dependent on demand from the West. Here one of the most viable options is to boost trade within the region. In fact intra-regional trade is already quite high in some subregions, such as South-East Asia and East Asia, particularly in manufactured goods. For South-East Asia, for example, intraregional trade has been rising rapidly and now accounts for more than half of trade in manufactured goods – up from 40 per cent in 1994-95 (ADB, 2009). In other subregions, such as South Asia and Central Asia, the level of intraregional trade is low, though South Asia has recently been witnessing some growth in intraregional trade.
Much of the intraregional trade in Asia-Pacific
75
ACHIEVING THE MILLENNIUM DEVELOPMENT GOALS IN AN ERA OF GLOBAL UNCERTAINTY : ASIA-PACIFIC REGIONAL REPORT2009/10
is actually in parts and components for goods that will ultimately be shipped to markets in the USA, Europe and Japan. (ADB, 2009; Athukorala and Kohpaiboon, 2009). South-East and East Asia in particular have woven dense multi-stage production networks with much of the final assembly taking place in China – one reason why the recession in the advanced economies hit China’s exports first and then spread rapidly to the region’s other economies.
An alternative would be to use the same production networks to meet demand within the region. However, this would not just mean boosting domestic consumption but also liberalizing trade regimes to foster imports of finished goods from neighbouring countries. This would require a shift in mindset, since during this global recession some countries in the region actually moved in the other direction and raised barriers. On a more positive note, however, trade ministers of 35 countries met recently in New Delhi and decided to revive the stalled Doha round of trade negotiations.
Apart from maintaining liberal tariff regimes, governments will also be concerned with other trade issues. They will want to address non-tariff measures, such as those relating to standards for agricultural and manufactured products. They will
also need to look at ways of making trade easier by improving transport links and simplifying customs and inspection procedures. Trade would also be helped by stable currency markets that can arise from deeper coordination in fiscal, monetary and exchange rate policies.
The current crisis has highlighted how trade policies and programmes affect different sectors, industries and occupations in different ways, and these differential impacts must be taken into account. Efforts to maintain liberal trade policies and strengthen trade facilitation must therefore be accompanied by measures to ensure that trade benefits the poor and vulnerable groups. Regional cooperation can help ensure that non-discriminatory trading and financial systems do not lead to rising economic and social inequality.
The Asia-Pacific region already has a range of regional cooperation mechanisms (Box IV-2). These efforts at cooperation vary considerably in extent and depth, and in the progress they have made on different issues. They have, for example, been much more active in signing agreements on trade than in other areas such as investment or labour migration – or in food security, health or education. And even their agreements on trade tend to have quite a narrow focus, with more emphasis on tariff
Box IV-2 – Regional cooperation mechanisms in Asia and the Pacific
The countries of Asia and the Pacific have established many mechanisms for cooperation at a subregional level. These include the Association of South-East Asian Nations, ASEAN+3, the Greater Mekong Subregion, the Chiang Mai Initiative, the Brunei Darussalam, Indonesia, Malaysia, Philippines and East-ASEAN growth area, the South Asian Association for Regional Cooperation, the Bay of Bengal Initiative for Multi-Sectoral Technical and Economic Cooperation (BIMSTEC) and the Central Asia Regional Cooperation. In the Pacific, they include the Pacific Islands Forum and the Secretariat of the Pacific Community.
Most of these aim at closer cooperation in the field of trade and investment, encouraging greater economic linkages through the movement of people, the provision of development assistance, including technical assistance, and promoting socio-cultural linkages. Over time, some of them have produced free trade agreements (FTAs) amongst the member countries – including the Asia-Pacific Trade Agreement, ASEAN-FTA, the South Asia FTA amongst the SAARC countries, and the proposed BIMSTEC FTA. Besides these subregional agreements, there are also bilateral agreements of which one of the most recent is the India-ASEAN FTA.
A disturbing aspect of these agreements, however, is that the same set of countries are often partners under different FTAs. India and Thailand, for example, have a bilateral FTA and are also members of the India-ASEAN FTA, and would also be partners under a BIMSTEC FTA. Such multiple memberships could become counter-productive if the different FTAs have conflicting rules.
Pacific island initiatives include the Pacific Island Countries Trade Agreement and the Melanesian Spearhead Group Trade Agreement. Pacific island countries are also considering trade agreements under the Pacific Agreement on Closer Economic Relations with Australia and New Zealand.
76
measures than on non-tariff measures or trade facilitation. Intra-regional investment Closely connected with flows of trade are flows of foreign direct investment (FDI). In 2007, globally FDI reached an all time high at $1.8 trillion. Within Asia and the Pacific the three largest recipients were: China; Hong Kong, China; and the Russian Federation. Most of the FDI to the region comes from the developed countries, but increasingly this type of investment is coming from other developing countries. The countries of South Asia, East Asia, South-East Asia and the Pacific Islands, for example, received $249 billion in 2007, but also themselves supplied $150 billion.
There is, however, a striking difference between subregions. In North-East Asia, 39 per cent of FDI comes from other countries in that subregion. In South Asia, on the other hand, only around 0.2 per cent comes from other countries in the subregion, and less than 5 per cent from the developing countries of Asia and the Pacific as a whole.
Flows of FDI within the region, as with the flows of trade, often correspond to the needs of regional production networks. South Asia receives less FDI from within Asia and the Pacific since the countries of this subregion have developed few of these networks. This is partly because of restrictive investment policies. Although some governments in the subregion have liberalized trade, they still maintain complex rules governing capital flows, whether for FDI or portfolio investment. Often, for example, they restrict FDI in some sectors and ban it outright in others. They may also require foreign investors to enter into partnerships with national businesses and impose many other forms of regulation. Countries in East and South-East Asia often have similar requirements but in South Asia the restrictions tend to be more severe. While many countries could take advantage of greater FDI liberalization, this should not contribute to a ‘race to the bottom,’ so attention should be given to issues such as labour rights and environmental protection (Box IV-3).
Box IV-3 – Organizing for women’s rights
There is evidence to suggest that the low cost of female labour is one of the key factors that attract foreign investments. For instance, women tend to dominate employment in export processing zones (EPZs); in Bangladesh, Sri Lanka, and the Philippines, for instance, women account for more than 70 per cent of EPZ employment. Yet, despite their invaluable contribution to the global economy, women often have limited opportunities to heir labour rights; in most Asian countries, less than 20 per cent of female workers belong to labour unions. Women who work in EPZs, in particular, find themselves at a disadvantage, since EPZs are often exempt from labour regulations.
The presence of gender disparities and biases in the labour market implies that policies in line with investment liberalization are not gender-neutral. A gender-responsive approach is clearly needed to address the differential impacts that this may have on women and men. Organizing for women’s rights, in particular, has proved successful in a number of cases.
Growing numbers of casual and home-based workers are organizing for their rights. In 1996, the International Labour Organization (ILO) adopted the Convention on Home Work as the result of a long campaign led by SEWA (Self Employed Women’s Association) in India, the world’s largest union of women in informal work, and coordinated by HomeNet, an international network for home-based workers. So far, the Convention has been ratified by only five governments — Ireland, Finland, the Netherlands, Argentina and Albania— but in principle it provides a platform to demand accountability for the world’s estimated 300 million homeworkers.
Elsewhere, on May 1, 2006, organizations of home-based workers in Asia, Europe and Latin America announced the formation of the Federation of Homeworkers Worldwide to demand equal treatment with workers in more formal employment. Their demands include recognition for home-based workers’ rights, including the right to organize, and government-provided social protection, particularly for health, maternity and old age.
Source: UNIFEM 2008a, 2008b.
77
ACHIEVING THE MILLENNIUM DEVELOPMENT GOALS IN AN ERA OF GLOBAL UNCERTAINTY : ASIA-PACIFIC REGIONAL REPORT2009/10
Regional cooperation would also benefit from better integrated financial markets to facilitate cross-border investment in both equity and bond markets. At present, only one quarter of Asia’s portfolio investment stays within the region. In Western Europe, by contrast, more than half of such investment is within that region. Bond markets too are relatively underdeveloped.
The extent of financial linkages between countries will depend on many factors, including, for example, the use of a common language and the extent of bilateral trade, as well as on tax regimes and restrictions on the flow of capital. In Asia and the Pacific, however, one of the main issues is the lack of liquidity in financial markets (Garcia-Herrero et al, 2008). Improving the liquidity of markets depends largely on national policies and circumstances. Yet, there is scope for greater regional cooperation and coordination in the design of institutional structures governing these markets, in the way different types of cross-border investment risks are handled, in the design of a common regulatory framework governing the financial sector, and in developing institutional capacities.
One major step in this direction would be faster progress with the Asian Bond Market initiative. The ASEAN+3 countries are hoping that well-functioning local currency bond markets would open up opportunities for financing long-term investment projects that currently often rely heavily on domestic banks and on short-term external borrowing.
Monetary coordination Regional cooperation can also be fostered by greater cooperation on monetary policy and on currency markets. Here too there has been some progress. Since the Asian financial crisis the monetary authorities of the region have rolled out a series of initiatives. One of the most significant has been the Chiang Mai Initiative through which the ASEAN+3 countries can pool currency reserves. Another is the Asian Cooperation Dialogue, which is an informal meeting to promote greater cooperation and coordination amongst the region’s central banks. These efforts have opened up opportunities for cooperation in the monitoring and regulation of capital flows within the region. They also address, among other things, macroeconomic risk management, the development of common
audit standards, and technical assistance in issues relating to regulation and supervision.
Despite these laudable efforts, the recent crisis has exposed weaknesses in coordination amongst the region’s monetary authorities. This has been evident in policies on deposit assurance. At the beginning of the crisis, when there were doubts about the health of banks and financial institutions, some countries responded by guaranteeing some bank deposits. While this had the merit of building confidence in national banking systems it also encouraged the flight of capital to those countries – a consequence that could have been avoided if countries had better coordinated their efforts.
In addition to strengthening regional financial cooperation, Asia-Pacific governments will also have to play an important role in redesigning the global financial architecture – articulating their concerns and experiences.
Regional cooperation on food Of particular concern for the MDGs is food security. Prior to the financial and economic crisis, the region was struck by a food crisis that hit especially hard at the poor. The food crisis has not gone away. It is still lurking in the wings; prices seem likely to surge again as global demand recovers. The causes of the food crisis are many and complex. But one solution to short-term or seasonal price rises would be to maintain adequate stocks of food that could be shared between countries. In 2007 such cooperation was lacking. Indeed many countries including Bangladesh, Cambodia, China, India, Indonesia, Kazakhstan, Pakistan and Viet Nam, in efforts to conserve supplies and stabilize national prices, imposed export controls – policies which in turn seem to have accelerated the rise in global prices. The influence of a number of national policy decisions is indicated in Figure IV-4.
This episode also has important lessons for regional cooperation on food security. First, countries could establish stronger mechanisms for addressing temporary shortages – at national, subregional and regional levels. The South Asian countries have already taken one important step in this direction. In July 2007 they signed an agreement to establish a SAARC Food Bank which would act as a food security reserve (Box IV-4). Recently, Cambodia and Viet Nam have been exploring the possibility of
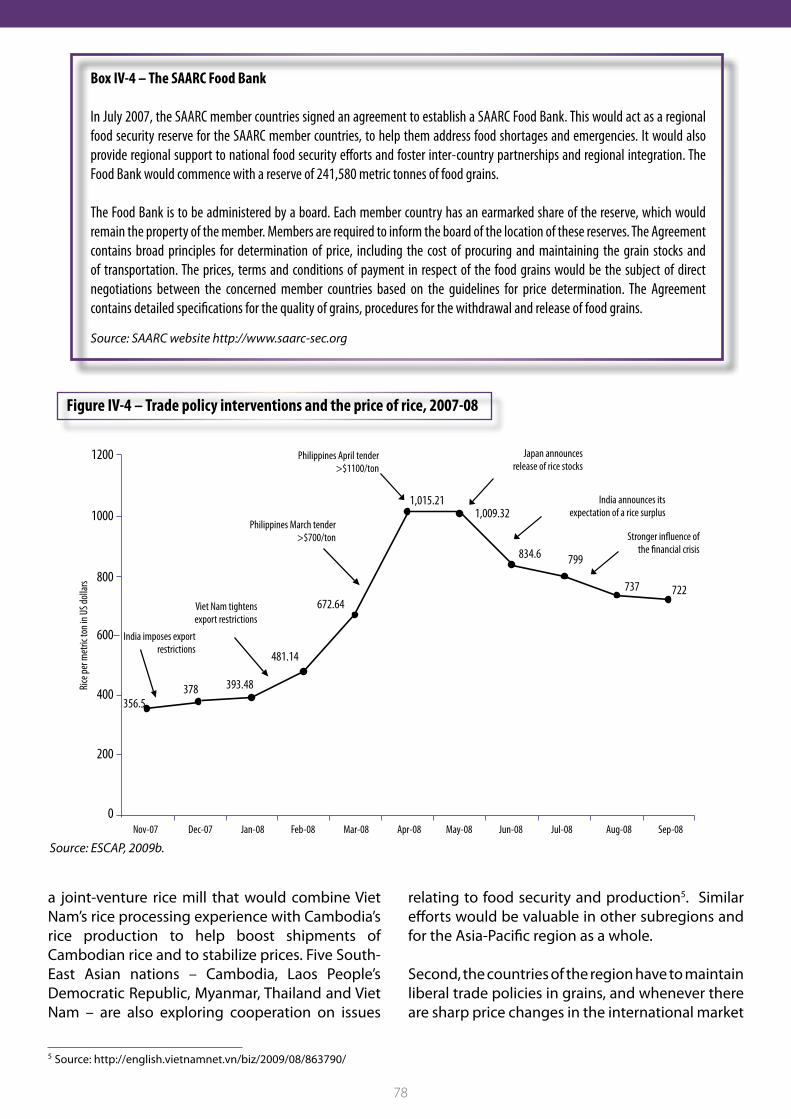
78
a joint-venture rice mill that would combine Viet Nam’s rice processing experience with Cambodia’s rice production to help boost shipments of Cambodian rice and to stabilize prices. Five South-East Asian nations – Cambodia, Laos People’s Democratic Republic, Myanmar, Thailand and Viet Nam – are also exploring cooperation on issues
relating to food security and production5. Similar efforts would be valuable in other subregions and for the Asia-Pacific region as a whole.
Second, the countries of the region have to maintain liberal trade policies in grains, and whenever there are sharp price changes in the international market
5 Source: http://english.vietnamnet.vn/biz/2009/08/863790/
Box IV-4 – The SAARC Food Bank
In July 2007, the SAARC member countries signed an agreement to establish a SAARC Food Bank. This would act as a regional food security reserve for the SAARC member countries, to help them address food shortages and emergencies. It would also provide regional support to national food security efforts and foster inter-country partnerships and regional integration. The Food Bank would commence with a reserve of 241,580 metric tonnes of food grains.
The Food Bank is to be administered by a board. Each member country has an earmarked share of the reserve, which would remain the property of the member. Members are required to inform the board of the location of these reserves. The Agreement contains broad principles for determination of price, including the cost of procuring and maintaining the grain stocks and of transportation. The prices, terms and conditions of payment in respect of the food grains would be the subject of direct negotiations between the concerned member countries based on the guidelines for price determination. The Agreement contains detailed specifications for the quality of grains, procedures for the withdrawal and release of food grains.
1200
1000
800
600
400
200
0
356.5378 393.48
481.14
672.64
1,015.211,009.32
834.6 799
737 722
Stronger in�uence of the �nancial crisis
India announces its expectation of a rice surplus
Japan announces release of rice stocks
Philippines April tender>$1100/ton
Philippines March tender>$700/ton
Viet Nam tightensexport restrictions
India imposes export restrictions
Nov-07 Dec-07 Jan-08 Feb-08 Mar-08 Apr-08 May-08 Jun-08 Jul-08 Aug-08 Sep-08
Rice
per m
etric
ton i
n US d
ollar
s
Figure IV-4 – Trade policy interventions and the price of rice, 2007-08
Source: ESCAP, 2009b.
Source: SAARC website http://www.saarc-sec.org
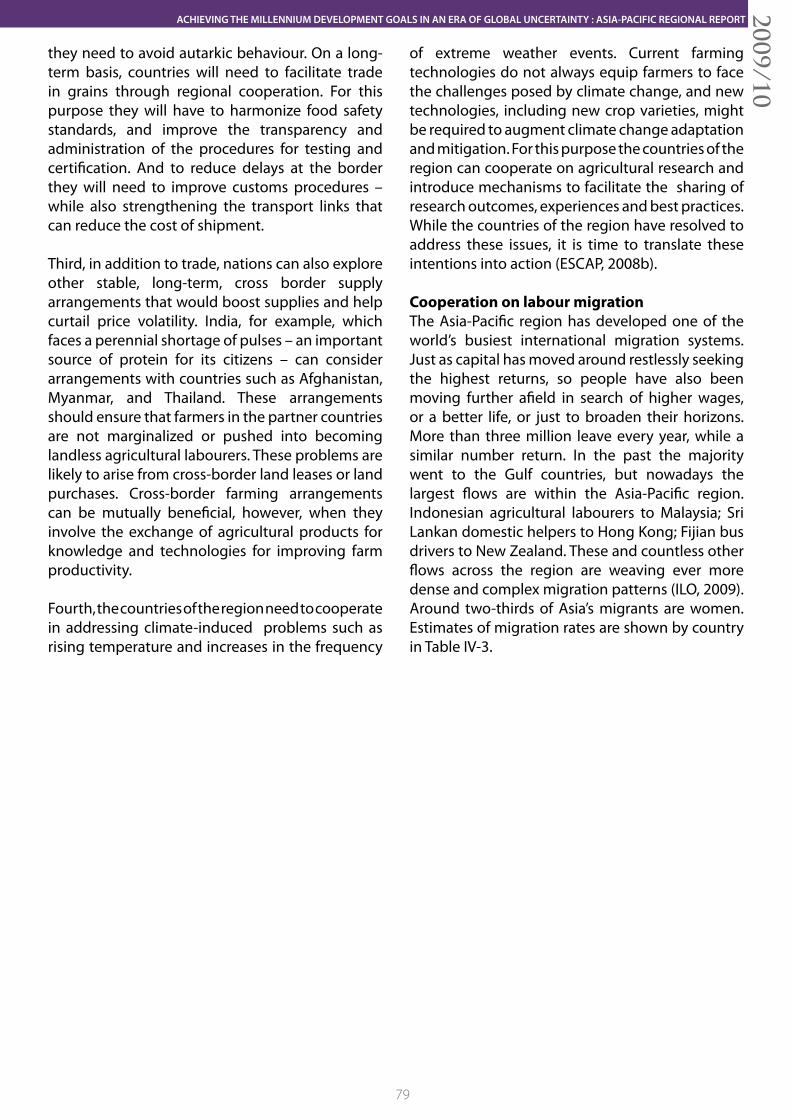
79
ACHIEVING THE MILLENNIUM DEVELOPMENT GOALS IN AN ERA OF GLOBAL UNCERTAINTY : ASIA-PACIFIC REGIONAL REPORT2009/10
they need to avoid autarkic behaviour. On a long-term basis, countries will need to facilitate trade in grains through regional cooperation. For this purpose they will have to harmonize food safety standards, and improve the transparency and administration of the procedures for testing and certification. And to reduce delays at the border they will need to improve customs procedures – while also strengthening the transport links that can reduce the cost of shipment.
Third, in addition to trade, nations can also explore other stable, long-term, cross border supply arrangements that would boost supplies and help curtail price volatility. India, for example, which faces a perennial shortage of pulses – an important source of protein for its citizens – can consider arrangements with countries such as Afghanistan, Myanmar, and Thailand. These arrangements should ensure that farmers in the partner countries are not marginalized or pushed into becoming landless agricultural labourers. These problems are likely to arise from cross-border land leases or land purchases. Cross-border farming arrangements can be mutually beneficial, however, when they involve the exchange of agricultural products for knowledge and technologies for improving farm productivity.
Fourth, the countries of the region need to cooperate in addressing climate-induced problems such as rising temperature and increases in the frequency
of extreme weather events. Current farming technologies do not always equip farmers to face the challenges posed by climate change, and new technologies, including new crop varieties, might be required to augment climate change adaptation and mitigation. For this purpose the countries of the region can cooperate on agricultural research and introduce mechanisms to facilitate the sharing of research outcomes, experiences and best practices. While the countries of the region have resolved to address these issues, it is time to translate these intentions into action (ESCAP, 2008b).
Cooperation on labour migrationThe Asia-Pacific region has developed one of the world’s busiest international migration systems. Just as capital has moved around restlessly seeking the highest returns, so people have also been moving further afield in search of higher wages, or a better life, or just to broaden their horizons. More than three million leave every year, while a similar number return. In the past the majority went to the Gulf countries, but nowadays the largest flows are within the Asia-Pacific region. Indonesian agricultural labourers to Malaysia; Sri Lankan domestic helpers to Hong Kong; Fijian bus drivers to New Zealand. These and countless other flows across the region are weaving ever more dense and complex migration patterns (ILO, 2009). Around two-thirds of Asia’s migrants are women. Estimates of migration rates are shown by country in Table IV-3.
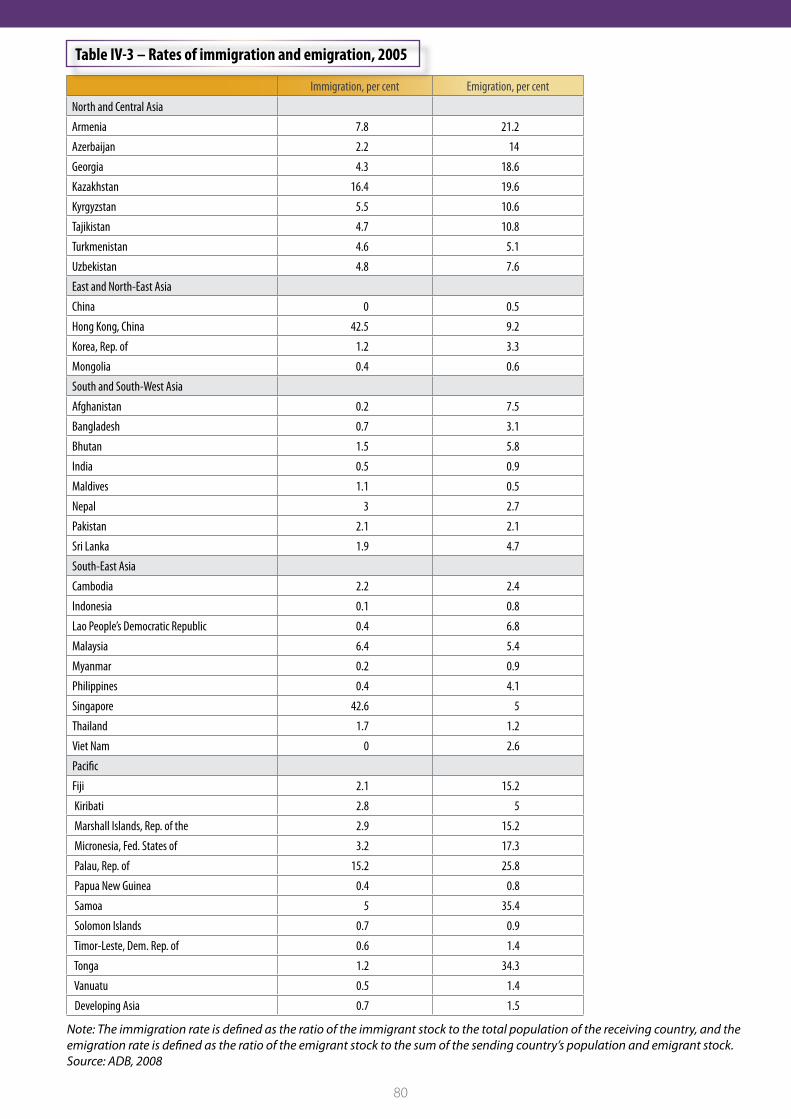
80
Immigration, per cent Emigration, per cent
North and Central Asia
Armenia 7.8 21.2
Azerbaijan 2.2 14
Georgia 4.3 18.6
Kazakhstan 16.4 19.6
Kyrgyzstan 5.5 10.6
Tajikistan 4.7 10.8
Turkmenistan 4.6 5.1
Uzbekistan 4.8 7.6
East and North-East Asia
China 0 0.5
Hong Kong, China 42.5 9.2
Korea, Rep. of 1.2 3.3
Mongolia 0.4 0.6
South and South-West Asia
Afghanistan 0.2 7.5
Bangladesh 0.7 3.1
Bhutan 1.5 5.8
India 0.5 0.9
Maldives 1.1 0.5
Nepal 3 2.7
Pakistan 2.1 2.1
Sri Lanka 1.9 4.7
South-East Asia
Cambodia 2.2 2.4
Indonesia 0.1 0.8
Lao People’s Democratic Republic 0.4 6.8
Malaysia 6.4 5.4
Myanmar 0.2 0.9
Philippines 0.4 4.1
Singapore 42.6 5
Thailand 1.7 1.2
Viet Nam 0 2.6
Pacific
Fiji 2.1 15.2
Kiribati 2.8 5
Marshall Islands, Rep. of the 2.9 15.2
Micronesia, Fed. States of 3.2 17.3
Palau, Rep. of 15.2 25.8
Papua New Guinea 0.4 0.8
Samoa 5 35.4
Solomon Islands 0.7 0.9
Timor-Leste, Dem. Rep. of 0.6 1.4
Tonga 1.2 34.3
Vanuatu 0.5 1.4
Developing Asia 0.7 1.5
Note: The immigration rate is defined as the ratio of the immigrant stock to the total population of the receiving country, and the emigration rate is defined as the ratio of the emigrant stock to the sum of the sending country’s population and emigrant stock.Source: ADB, 2008
Table IV-3 – Rates of immigration and emigration, 2005
81
ACHIEVING THE MILLENNIUM DEVELOPMENT GOALS IN AN ERA OF GLOBAL UNCERTAINTY : ASIA-PACIFIC REGIONAL REPORT2009/10
Source: Ratha et al, 2009
For the countries of origin, emigration may be con-sidered a mixed benefit, as those who migrate are often the most vigorous and brightest workers, and there is the risk of a ‘brain drain’. Workers can also be exposed to abuse – particularly women in domestic service. However, most sending coun-tries in Asia and the Pacific are keen to encourage emigration, partly to relieve unemployment or underemployment but principally because of the ensuing flows of remittances. In 2008, the region’s labour source countries in total received over $169
billion (Ratha et al, 2009). The largest recipients were India, China and the Philippines, though as a percentage of GDP, remittances were the most im-portant to Tajikistan, Tonga and Samoa (Table IV-4). This only reflects remittances that moved through official channels. It is thought that at least anoth-er 50 per cent of remittances travel unofficially, through the informal hundi or hawala systems. In some countries a large proportion of the remit-tances come from women – in the Philippines, for example, 45 per cent.
Estimated inflows $ millions As percentage of 2007 GDPIndia 51,974 3.3China 40,641 1.0Philippines 18,643 11.3Bangladesh 8,985 9.6Viet Nam 7,200 8.0Pakistan 7,032 4.2Indonesia 6,795 1.4Russian Federation 6,033 0.4Korea, Republic of 3,062 0.1Sri Lanka 2,947 7.8Nepal 2,735 16.8Malaysia 1,920 1.0Thailand 1,800 0.7Tajikistan 1,750 45.5Azerbaijan 1,554 4.1Kyrgyzstan 1,232 19.1Iran, Islamic Republic of 1,115 0.4Armenia 1,062 9.2Georgia 732 6.8Hong Kong, China 355 0.2Cambodia 325 4.2Mongolia 200 4.9Kazakhstan 192 0.2Fiji 175 4.8Myanmar 150 n/aSamoa 135 22.8Tonga 100 39.4Solomon Islands 20 5.3Papua New Guinea 13 0.2Seychelles 12 1.5Kiribati 9 9.0Vanuatu 7 1.2Maldives 3 0.3Lao People’s Democratic Republic 1 0.0
Table IV-4 – Remittances to principal Asia-Pacific migrant sending countries. 2008
82
The global economic crisis has been widely predicted to affect international migration and remittances adversely. Initial reports supported this expectation, with evidence of decelerating remittances in some countries. But as the crisis unfolds, it is becoming clear that the patterns of migration and remittances may be more complex than was previously imagined. Though growth of remittance flows moderated in some countries, overall flows remained resilient. In fact, in several countries (such as Bangladesh, India, Pakistan, Philippines, Nepal and Sri Lanka) remittance inflows have actually increased rather than declined so far. There has been a fall in labour migration in virtually all OECD countries (OECD, 2009). On the other hand, many Asian workers are also employed in oil-producing Gulf States which will be less affected by the crisis. The countries of South Asia used to worry about the concentration of their workers in the Gulf, though at present this seems to be an advantage.
Migration will also be affected in Asia-Pacific desti-nation countries. Malaysia, for example, has more than 2.1 million registered foreign workers, mostly from within the region, who could be affected by layoffs in manufacturing. Thailand has some 1.8 million foreign workers, with the most vulnerable being those in manufacturing and agriculture. Singapore has around 900,000 foreign workers and some projections suggest that 100,000 jobs in the
manufacturing and services sectors will be lost. The Republic of Korea has more than 400,000 foreign workers and some workers are leaving as small firms in particular shut down (Abella and Ducanes, 2009). In 2009, the Government more than halved its quota for temporary foreign workers recruited under bilateral schemes (OECD, 2009).
In this crisis at least, it seems likely that those affected are more likely to be migrant men em-ployed in such sectors as manufacturing or con-struction, rather than migrant women who are often employed in domestic service. Neverthe-less, those migrant workers, men and women, who manage to keep or find employment may face poorer working conditions or reduced wages. These contractions will reduce the flow of remit-tances. The World Bank has estimated that in 2009 remittances to East Asia will fall by around 6 per cent and to South Asia by around 4 per cent – the smaller drop in South Asia reflecting the fact their workers are largely in the Gulf. However, in 2010 remittances should start growing again.
Prospects for cooperation At present migration policy is fairly unilateral, with most of the power held by destination countries, which can try to control the arrival and the working conditions of migrants. Some destination countries have adopted measures to protect the rights of their migrant workers (Box V-5).
Box IV-5 – Empowering women migrant workers in Asia
The UNIFEM Regional Programme on Empowering Women Migrant Workers in Asia works in close collaboration with the Ministry of Labour in Jordan, which is amending the labour law to cover domestic workers. This recognizes domestic workers as productive labour and as workers with legally recognized and enforceable rights.
The Ministry has also endorsed a Special Unified Working Contract for Non-Jordanian Domestic Workers with substantive rights provisions. Under the contract, the employer is responsible for the costs of the workers’ travel, work and residence permits, timely payment of wages and providing adequate shelter, clothing, health care, and accident insurance. The worker has the right to terminate the contract without notice and is entitled to a weekly holiday and a bonus at the end of the contract equivalent to 15-days wages. Workers are entitled to treatment in accordance with international human rights standards.
The Government of Hong Kong also issues a legally valid domestic worker’s employment contract with important rights provisions, including minimum wages paid direct to the worker in timely fashion, a weekly holiday, and health insurance.
Source: UNIFEM 2008b.
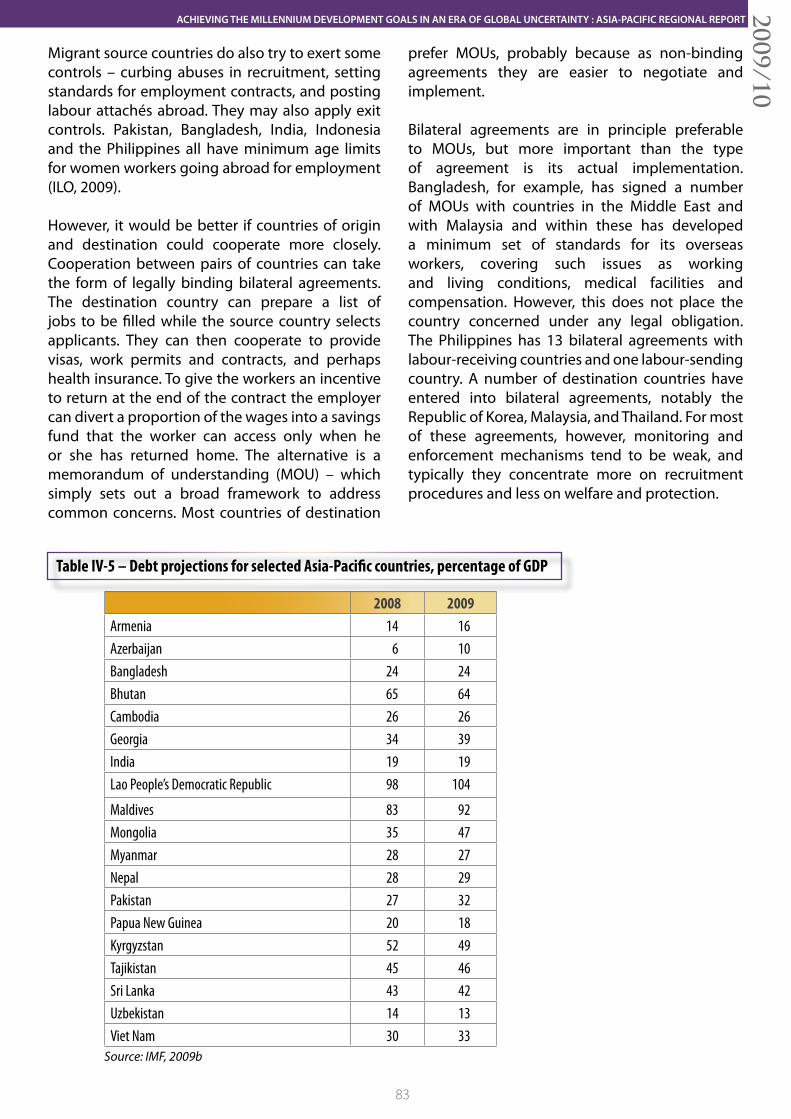
83
ACHIEVING THE MILLENNIUM DEVELOPMENT GOALS IN AN ERA OF GLOBAL UNCERTAINTY : ASIA-PACIFIC REGIONAL REPORT2009/10
Migrant source countries do also try to exert some controls – curbing abuses in recruitment, setting standards for employment contracts, and posting labour attachés abroad. They may also apply exit controls. Pakistan, Bangladesh, India, Indonesia and the Philippines all have minimum age limits for women workers going abroad for employment (ILO, 2009).
However, it would be better if countries of origin and destination could cooperate more closely. Cooperation between pairs of countries can take the form of legally binding bilateral agreements. The destination country can prepare a list of jobs to be filled while the source country selects applicants. They can then cooperate to provide visas, work permits and contracts, and perhaps health insurance. To give the workers an incentive to return at the end of the contract the employer can divert a proportion of the wages into a savings fund that the worker can access only when he or she has returned home. The alternative is a memorandum of understanding (MOU) – which simply sets out a broad framework to address common concerns. Most countries of destination
prefer MOUs, probably because as non-binding agreements they are easier to negotiate and implement.
Bilateral agreements are in principle preferable to MOUs, but more important than the type of agreement is its actual implementation. Bangladesh, for example, has signed a number of MOUs with countries in the Middle East and with Malaysia and within these has developed a minimum set of standards for its overseas workers, covering such issues as working and living conditions, medical facilities and compensation. However, this does not place the country concerned under any legal obligation. The Philippines has 13 bilateral agreements with labour-receiving countries and one labour-sending country. A number of destination countries have entered into bilateral agreements, notably the Republic of Korea, Malaysia, and Thailand. For most of these agreements, however, monitoring and enforcement mechanisms tend to be weak, and typically they concentrate more on recruitment procedures and less on welfare and protection.
2008 2009Armenia 14 16Azerbaijan 6 10Bangladesh 24 24Bhutan 65 64Cambodia 26 26Georgia 34 39India 19 19Lao People’s Democratic Republic 98 104
Maldives 83 92Mongolia 35 47Myanmar 28 27Nepal 28 29Pakistan 27 32Papua New Guinea 20 18Kyrgyzstan 52 49Tajikistan 45 46Sri Lanka 43 42Uzbekistan 14 13Viet Nam 30 33
Source: IMF, 2009b
Table IV-5 – Debt projections for selected Asia-Pacific countries, percentage of GDP
84
In addition to various bilateral arrangements, there are also a number of regional and subregional agreements on various aspects of migration. One is the 2002 Bali Process on People Smuggling, Trafficking in Persons and Related Transnational Crime, which has over 50 participant countries. There are also other agreements concerning the trafficking of women and children. At the subregional level, one of the most significant agreements is the 2007 ASEAN Declaration on the Protection and Promotion of the Rights of Migrant Workers, which aims to fair and appropriate employment protection, payment of wages, and adequate access to decent working and living conditions for migrant workers.
Development cooperation for the least deve-loped countriesGreater regional cooperation on trade and finance would help buffer countries from the impact of global crises and help them attain all the MDGs. But they would have special relevance for MDG8 which aims to build a global partnership for development and is oriented in particular to the LDCs. As well as seeking cooperation in trade, the LDCs will also be looking for initiatives on debt relief and development assistance.
As a result of the economic crisis, many of the poorest countries have suffered from a combination of drops in exports, capital flight and falling remittances, resulting in some cases in a sharp deterioration in their balance of payments. The IMF has forecast that the low- income countries as a whole will suffer a balance of payments shock of $165 billion, with the potential of creating a ‘new debt-burden’. In Asia and the Pacific the IMF has identified five countries as being particularly vulnerable – Georgia, Lao People’s Democratic Republic, Maldives, Mongolia, and Pakistan. In 2008 their stock of debt was already greater than 25 per cent of GDP, a proportion that in 2009 was likely to increase by five percentage points or more (Table IV-5). If not addressed, a new debt burden would cripple these and other developing countries in the region, especially the low-income countries, for years to come.
One unique way in which the crisis has hit Pacific countries is through diminished returns on their offshore investments. The crisis has reduced returns on offshore investments held by the
region’s trust funds – which in Tuvalu and Kiribati are a large proportion of national wealth – and superannuation funds.
Another potential risk for the Pacific countries arises from their high dependence on ODA. On a per capita basis, the ODA received by these countries is very high – about seven times the average in the developing world – though it has been declining. The costs of achieving the MDGs in these countries are also high compared with other developing countries due to their unique characteristics – small populations, considerable inter-island distances and their location in an environmentally fragile and disaster-prone region. Under these circumstances, any reduction in the aid flowing to these countries would seriously affect their balance of payments, economic growth in general, and their ability to achieving the MDGs. Indeed, there are concerns on the sustainability of the volume of ODA flows itself following the crisis. The major donor countries, facing falling tax revenues and the costs of massive fiscal stimulus packages, might feel the need to curtail overseas aid. Thus far this does not seem to have happened. Indeed in April 2009 in London, the leaders of the G-20 countries committed themselves to significantly increasing the funds available to the developing countries. In all, they offered $1.1 trillion in additional resources: $500 billion as an expansion of the IMF’s resources; $250 billion as an additional allocation of special drawing rights, of which $100 billion will go to emerging market and developing countries; $100 billion in additional lending from multilateral development banks, including the World Bank and the Asian Development Bank; and another $250 billion as international trade credits. At this stage it is not clear how much of these commitments have actually come through in 2009.
Along with these financial commitments, the leaders also announced several measures that would facilitate concessional or emergency lending to developing countries by the IMF and MDBs. For example, they doubled the IMF’s concessional lending capacity and the access limits under the IMF-World Bank Debt Sustainability Framework, and they trebled the general capital of the Asian Development Bank. Not all this is new money, and some may be available only over a number of years, but these do represent significant increases
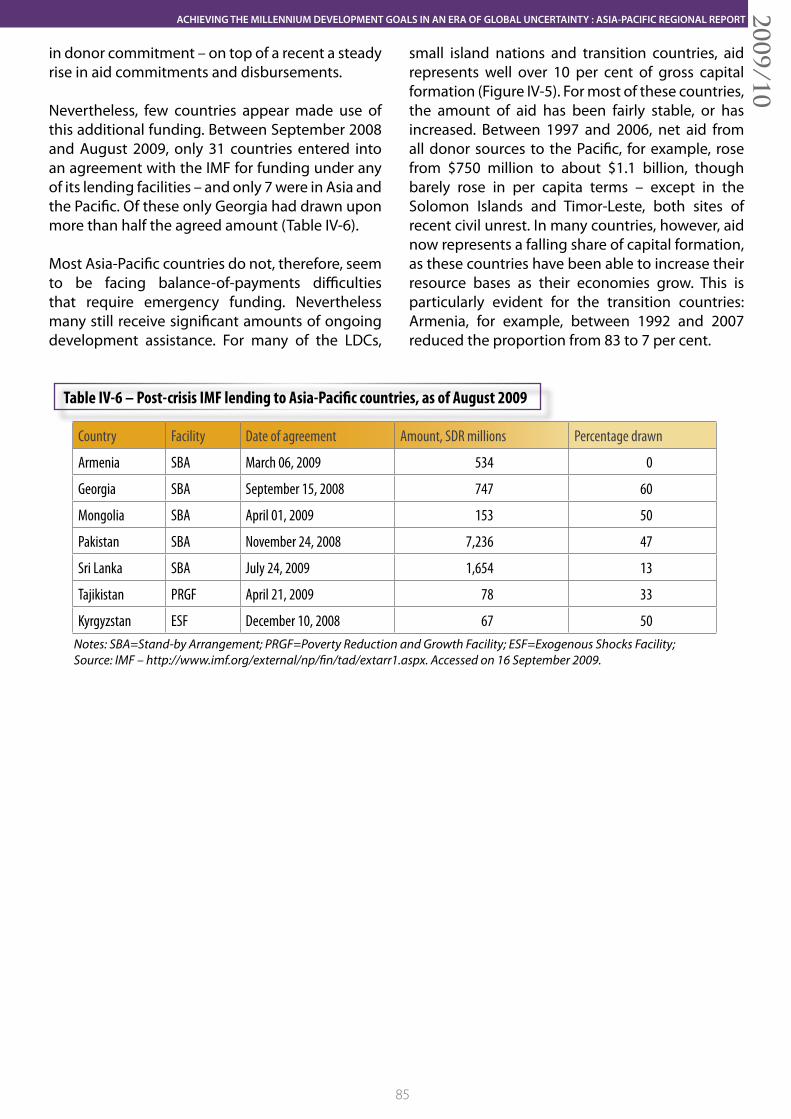
85
ACHIEVING THE MILLENNIUM DEVELOPMENT GOALS IN AN ERA OF GLOBAL UNCERTAINTY : ASIA-PACIFIC REGIONAL REPORT2009/10
Country Facility Date of agreement Amount, SDR millions Percentage drawn
Armenia SBA March 06, 2009 534 0
Georgia SBA September 15, 2008 747 60
Mongolia SBA April 01, 2009 153 50
Pakistan SBA November 24, 2008 7,236 47
Sri Lanka SBA July 24, 2009 1,654 13
Tajikistan PRGF April 21, 2009 78 33
Kyrgyzstan ESF December 10, 2008 67 50
Table IV-6 – Post-crisis IMF lending to Asia-Pacific countries, as of August 2009
Notes: SBA=Stand-by Arrangement; PRGF=Poverty Reduction and Growth Facility; ESF=Exogenous Shocks Facility; Source: IMF – http://www.imf.org/external/np/fin/tad/extarr1.aspx. Accessed on 16 September 2009.
in donor commitment – on top of a recent a steady rise in aid commitments and disbursements.
Nevertheless, few countries appear made use of this additional funding. Between September 2008 and August 2009, only 31 countries entered into an agreement with the IMF for funding under any of its lending facilities – and only 7 were in Asia and the Pacific. Of these only Georgia had drawn upon more than half the agreed amount (Table IV-6).
Most Asia-Pacific countries do not, therefore, seem to be facing balance-of-payments difficulties that require emergency funding. Nevertheless many still receive significant amounts of ongoing development assistance. For many of the LDCs,
small island nations and transition countries, aid represents well over 10 per cent of gross capital formation (Figure IV-5). For most of these countries, the amount of aid has been fairly stable, or has increased. Between 1997 and 2006, net aid from all donor sources to the Pacific, for example, rose from $750 million to about $1.1 billion, though barely rose in per capita terms – except in the Solomon Islands and Timor-Leste, both sites of recent civil unrest. In many countries, however, aid now represents a falling share of capital formation, as these countries have been able to increase their resource bases as their economies grow. This is particularly evident for the transition countries: Armenia, for example, between 1992 and 2007 reduced the proportion from 83 to 7 per cent.
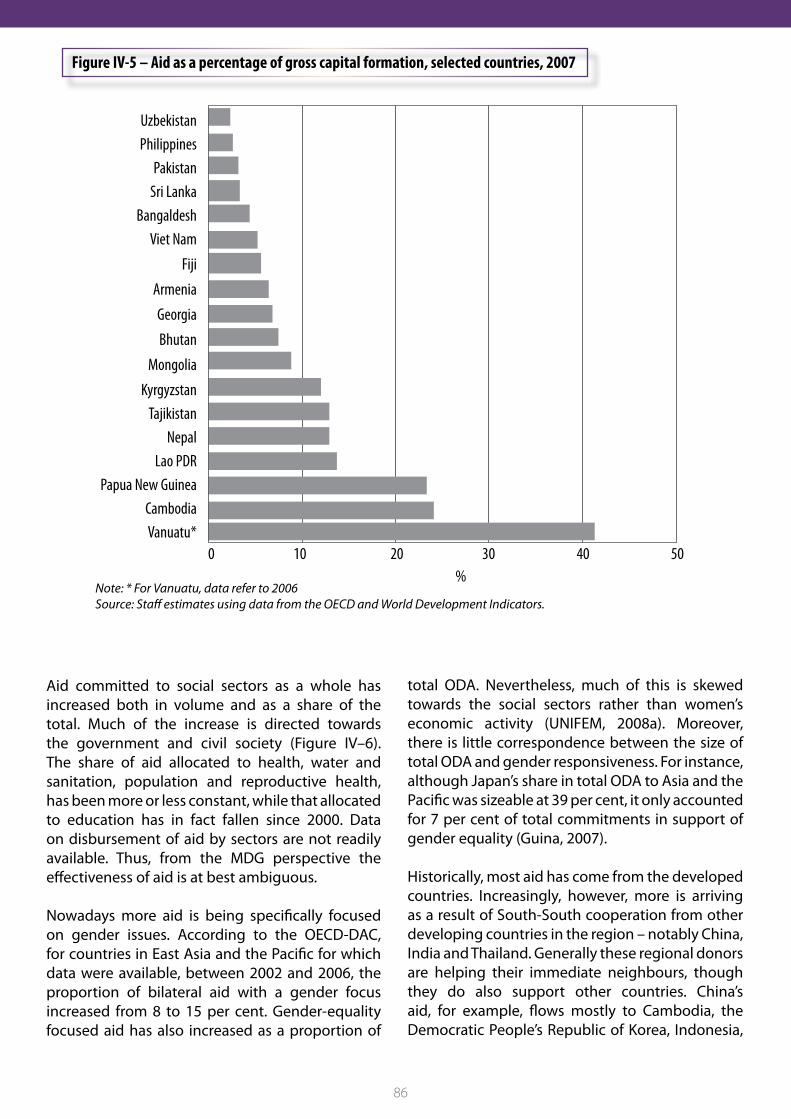
86
%
UzbekistanPhilippines
PakistanSri Lanka
BangaldeshViet Nam
Fiji
Armenia
Georgia
Bhutan
Mongolia
KyrgyzstanTajikistan
NepalLao PDR
Papua New GuineaCambodiaVanuatu*
0 10 20 30 40 50
Figure IV-5 – Aid as a percentage of gross capital formation, selected countries, 2007
Note: * For Vanuatu, data refer to 2006Source: Staff estimates using data from the OECD and World Development Indicators.
Aid committed to social sectors as a whole has increased both in volume and as a share of the total. Much of the increase is directed towards the government and civil society (Figure IV–6). The share of aid allocated to health, water and sanitation, population and reproductive health, has been more or less constant, while that allocated to education has in fact fallen since 2000. Data on disbursement of aid by sectors are not readily available. Thus, from the MDG perspective the effectiveness of aid is at best ambiguous.
Nowadays more aid is being specifically focused on gender issues. According to the OECD-DAC, for countries in East Asia and the Pacific for which data were available, between 2002 and 2006, the proportion of bilateral aid with a gender focus increased from 8 to 15 per cent. Gender-equality focused aid has also increased as a proportion of
total ODA. Nevertheless, much of this is skewed towards the social sectors rather than women’s economic activity (UNIFEM, 2008a). Moreover, there is little correspondence between the size of total ODA and gender responsiveness. For instance, although Japan’s share in total ODA to Asia and the Pacific was sizeable at 39 per cent, it only accounted for 7 per cent of total commitments in support of gender equality (Guina, 2007).
Historically, most aid has come from the developed countries. Increasingly, however, more is arriving as a result of South-South cooperation from other developing countries in the region – notably China, India and Thailand. Generally these regional donors are helping their immediate neighbours, though they do also support other countries. China’s aid, for example, flows mostly to Cambodia, the Democratic People’s Republic of Korea, Indonesia,
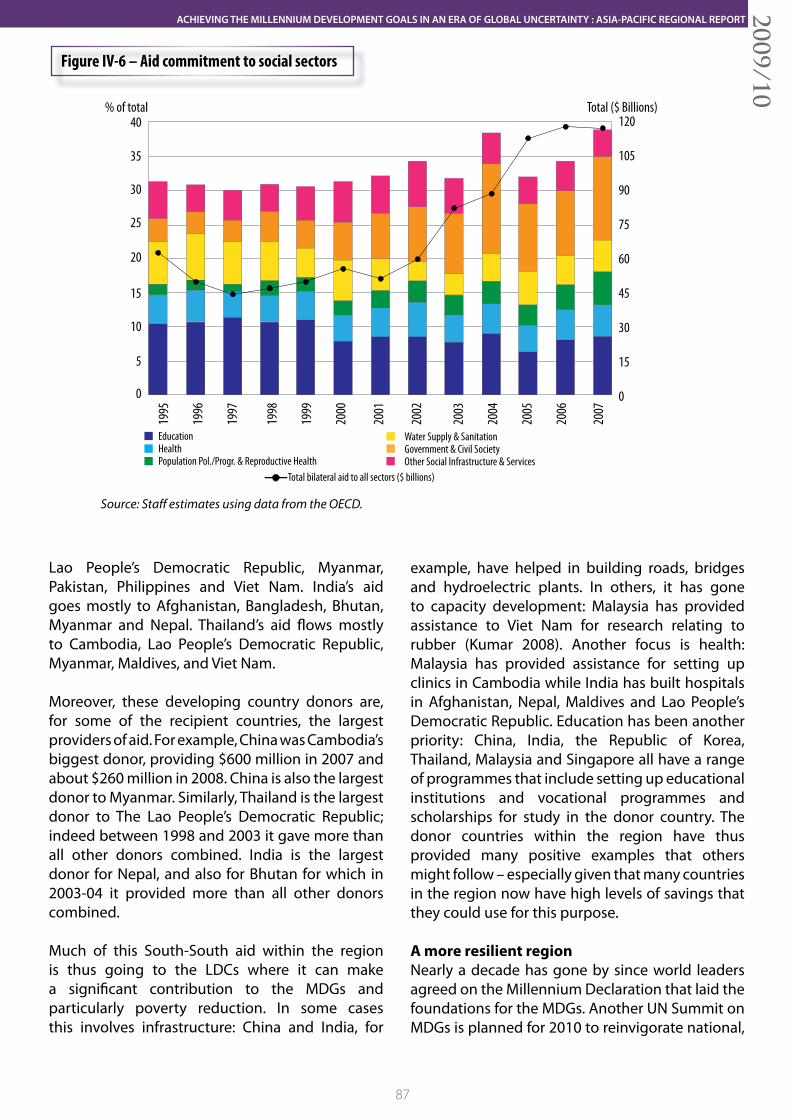
87
ACHIEVING THE MILLENNIUM DEVELOPMENT GOALS IN AN ERA OF GLOBAL UNCERTAINTY : ASIA-PACIFIC REGIONAL REPORT2009/10
% of total Total ($ Billions)40
35
30
25
20
15
10
5
0
120
105
90
75
60
45
30
15
0
1995
1996
1997
1998
1999
2000
2001
2002
2003
2004
2005
2006
2007
EducationHealthPopulation Pol./Progr. & Reproductive Health
Water Supply & SanitationGovernment & Civil SocietyOther Social Infrastructure & Services
Total bilateral aid to all sectors ($ billions)
Figure IV-6 – Aid commitment to social sectors
Source: Staff estimates using data from the OECD.
Lao People’s Democratic Republic, Myanmar, Pakistan, Philippines and Viet Nam. India’s aid goes mostly to Afghanistan, Bangladesh, Bhutan, Myanmar and Nepal. Thailand’s aid flows mostly to Cambodia, Lao People’s Democratic Republic, Myanmar, Maldives, and Viet Nam.
Moreover, these developing country donors are, for some of the recipient countries, the largest providers of aid. For example, China was Cambodia’s biggest donor, providing $600 million in 2007 and about $260 million in 2008. China is also the largest donor to Myanmar. Similarly, Thailand is the largest donor to The Lao People’s Democratic Republic; indeed between 1998 and 2003 it gave more than all other donors combined. India is the largest donor for Nepal, and also for Bhutan for which in 2003-04 it provided more than all other donors combined.
Much of this South-South aid within the region is thus going to the LDCs where it can make a significant contribution to the MDGs and particularly poverty reduction. In some cases this involves infrastructure: China and India, for
example, have helped in building roads, bridges and hydroelectric plants. In others, it has gone to capacity development: Malaysia has provided assistance to Viet Nam for research relating to rubber (Kumar 2008). Another focus is health: Malaysia has provided assistance for setting up clinics in Cambodia while India has built hospitals in Afghanistan, Nepal, Maldives and Lao People’s Democratic Republic. Education has been another priority: China, India, the Republic of Korea, Thailand, Malaysia and Singapore all have a range of programmes that include setting up educational institutions and vocational programmes and scholarships for study in the donor country. The donor countries within the region have thus provided many positive examples that others might follow – especially given that many countries in the region now have high levels of savings that they could use for this purpose.
A more resilient regionNearly a decade has gone by since world leaders agreed on the Millennium Declaration that laid the foundations for the MDGs. Another UN Summit on MDGs is planned for 2010 to reinvigorate national,
88
regional and global efforts at achieving the MDGs. The past decade has seen MDGs taking the centre stage in development discourses.
During this decade, the world economy has witnessed a series of global crises – food, fuel, financial and economic crisis. This report has focused largely on the last of these, which has exposed the vulnerabilities of the developing countries and the risks of reversing MDG achievements.
The experience of many countries of this region during the past decade has also shown that MDGs are achievable if governments reorient their policies towards the priorities of the poor. The success of some countries also shows that economic growth, while essential, cannot be relied upon alone to achieve the MDGs. Targeted interventions are required if the fruits of economic growth are to result in MDG achievements.
Achieving MDGs is also smart economics – as it would unleash the latent demand of the poor, helping to sustain economic growth in a more stable manner. But this cannot be left to national endeavour alone. The experience of the successful countries also shows that no country can make progress in human development all by itself. In developing countries the scarcities of resource – both human and capital – have to be bridged
through development assistance and international cooperation. In that sense, the MDGs have to be viewed as a “global public good” that is necessary for social stability, within countries as well as at the global level. With only six years left to 2015, efforts to achieve the MDGs will need to be accelerated. While countries will continue to provide the mainstay, a regional effort is needed to identify the bottle-necks and resources required, and to draw up a regional plan of action to address issues of common concern. Recognizing this, the Pacific countries have established a new development compact for the Pacific – The Cairns Compact on Strengthening Development Co-ordination in the Pacific.
Asia-Pacific countries have the resources, the capacity and the know-how to address the basic problems affecting human development. Now regional co-operation has to go beyond trade and investment issues to cover social areas such as health, food security, water and sanitation, labour migration and development assistance, and the environment. Stronger cooperation on these issues could make the region more resilient to future crises and bolster the capacity of many of the poorest countries to achieve the MDGs. The leaders of the world will, it is hoped, give thought to these issues at the 2010 UN Summit on the Millennium Development Goals.

89
ACHIEVING THE MILLENNIUM DEVELOPMENT GOALS IN AN ERA OF GLOBAL UNCERTAINTY : ASIA-PACIFIC REGIONAL REPORT2009/10
Photo: Marie Ange Holmgren-Sylvain
90Photo: Marie Ange Holmgren-Sylvain
91
ACHIEVING THE MILLENNIUM DEVELOPMENT GOALS IN AN ERA OF GLOBAL UNCERTAINTY : ASIA-PACIFIC REGIONAL REPORT2009/10
Abella, M and G. Ducanes, 2009. The effect of the global economic crisis on Asian migrant workers and government responses: Responding to the Economic Crisis – Coherent Policies for Growth, Employment and Decent Work in Asia and Pacific, Manila, Philippines, 18-20 February 2009. ILO technical note.
ADB, 2006. Pursuing Gender Equality through the Millennium Development Goals in Asia and the Pacific, Manila, Asian Development Bank.
ADB, 2008. Asian Development Outlook 2008, Manila, Asian Development Bank.
ADB, 2009. Asian Development Outlook 2009, Manila, Asian Development Bank.
ADB, 2009b. Asian Development Outlook 2009 Update, Manila, Asian Development Bank.
Ahmed, A.U. and C. del Ninno, 2002. Food for Education Program in Bangladesh: An Evaluation of its Impact on Educational Attainment and Food Security, Discussion Paper 138, Washington D.C.: International Food Policy Research Institute.
Ahmed, A.U., S. Rashid, M. Sharma and S. Zohir, 2004. Food Aid Distribution in Bangladesh: Leakage and Operational Performance, Discussion Paper 173, Washington D.C.: International Food Policy Research Institute.
Athukorala, P., and A. Kohpaiboon, 2009, Intra-Regional Trade in East Asia: The Decoupling Fallacy, Crisis, and Policy Challenges, Working Paper No. 2009/09, Canberra, Australian National University College of Asia and the Pacific.
Athukorala, P., and P.-W.Tsai, 2003. “Determinants of Household Saving in Taiwan: Growth, Demography and Public Policy”, Journal of Development Studies, 39(5): 65-88.
Baulch, B., A. Weber, and J. Wood, 2008. Social Protection Index for Committed Poverty Reduction, Volume 2: Asia, Manila: Asian Development Bank.
Bhutta, Z, 2009. Effects of the Crises on Child Nutrition and Health in East Asia and the Pacific. Global Social Policy 9.
Blanchard, O. and R. Perotti, 2002. “An Empirical Characterization of the Dynamic Effects of Changes in Government spending and Taxes on Output,” in Quarterly Journal of Economics, 117(4): 1329-1368
Bourguignon, F. , 2003. The Growth Elasticity of Poverty Reduction: Explaining Heterogeneity across Countries and Time Periods. In T.Eichler and S. Turnovsky (eds.), Growth and Inequality, Cambridge: MIT Press.
Briguglio, L., Cordina, G., Farrugia, N., and Vella, S., 2008. Economic Vulnerability and Resilience: Concepts and Measurements. UNU-WIDER Research Paper No. 2008/55, May 2008.
References
92
Caballero, R. J., E. Farhi, and P. O. Gourinchas, 2008. “An Equilibrium Model of ‘Global Imbalances’ and Low Interest Rates”, American Economic Review, 98(1).
Carr, M. and M. Chen, 2004. Globalization, social exclusion and work: with special reference to informal employment and gender. Working Paper No. 20. Policy Integration Department. World Commission on the Social Dimension of Globalization, Geneva, International Labour Office.
Chen, S., and M. Ravallion, 2009. The impact of the global financial crisis on the world’s poorest, available at: http://www.voxeu.org/index.php?q=node/3520.
Chhibber, A., J. Ghosh and T. Palanivel, 2009. The Global Financial Crisis and the Asia-Pacific region: A Synthesis Study Incorporating Evidence from Country Case Studies, UNDP Regional Centre in Asia and the Pacific, Bangkok.
Chhibber, A. and T. Palanivel, 2009. India Manages Global Crisis But Needs Serious Reforms for Sustained Inclusive Growth, paper presented at the Tenth Annual Conference on Indian Economic Policy Reform, Stanford Center for International Development, Stanford University, Stanford.
Chou, S.-Y., J.-T. Liu and J. K. Hammitt, 2003. “National Health Insurance and Precautionary Saving: Evidence from Taiwan”, Journal of Public Economics, (87(9-10): 1873-1894.
Chou, S.-Y., J.-T. Liu and J. K. Hammitt, 2006. “Households’ Precautionary Behaviours – the Effects of the Introduction of National Health Insurance in Taiwan”, Review of Economics of the Household, 4(4): 395-421.
Dejardin, A.K. and J. Owens 2009. Asia in the Global Economic Crisis: Impacts and Responses From A Gender Perspective. Responding to the Economic Crisis – Coherent Policies for Growth, Employment and Decent Work in Asia and Pacific Manila, Philippines, 18-20 February 2009.
Ducanes G. et al. 2009. Macroeconomic effects of fiscal policies, Working paper No 564, London, Queen Mary University.
Elson, Diane, 2002. Macroeconomics and Macroeconomic Policy from a Gender Perspective. Paper presented at the Public Hearing of Study Commission ‘Globalisation of the World Economy-Challenges and Responses’. Deutscher Bundestag, 18 February 2002.
Elson, Diane, 2008. Gender Equality and the Economic Crisis. IDRC/SID-OG meeting Ottawa, 27 November.
ESCAP, 2007. Access to Basic Services for the Poor: The Importance of Good Governance, Bangkok, ESCAP.
ESCAP, 2008. Statistical Yearbook for Asia and the Pacific 2008, Bangkok, ESCAP.
ESCAP, 2008b. High-level Regional Policy Dialogue on “The Food-fuel Crisis and Climate Change: Reshaping the Development Agenda”, held 9-10 December 2008, Bali, Indonesia, Bangkok, ESCAP.
ESCAP, 2009. Economic Survey of Asia and the Pacific 2009: Addressing the Triple Threats to Development. , Bangkok, ESCAP.
ESCAP, 2009b. Sustainable agriculture and food security in Asia and the Pacific, Bangkok, ESCAP.
ESCAP/ADP/UNDP, 2008. A Future Within Reach, Bangkok, ESCAP.
93
ACHIEVING THE MILLENNIUM DEVELOPMENT GOALS IN AN ERA OF GLOBAL UNCERTAINTY : ASIA-PACIFIC REGIONAL REPORT2009/10
Fukuda-Parr, S., 2009. The gender perspectives of the financial crisis. Written statement prepared for the Interactive Expert Panel at the Commission on The Status of Women, Fifty-Third Session, New York, 2 – 13 March 2009.
Garcia-Herrero, A., D. Yang and P. Wooldridge, 2008. “Why is there so little regional financial integration in Asia?”, in Regional Financial Integration in Asia: Present and future, BIS Paper No. 42, Bank of International Settlements, Basel.
Guina, C., 2007. The Paris Declaration: Linking Aid. Effectiveness and Gender in Asia Pacific, background paper for UNIFEM.
Hausmann, R., J. Hwang and D. Rodrik, 2007. “What you export matters”, in Journal of Economic Growth, 10(4):303-329
Huynh, P., Kapsos, S., Kim, K. B., and Sziraczki, G., 2009. Impact of the Current Global Economic Crisis on Asia’s Labour Market. ADBI Working Paper. Tokyo.
ILO, 2008. Global Employment Trends for Women, Geneva, ILO.
ILO, 2009. Asian programme on the Governance of Labour Migration – website, ILO Regional Office Bangkok. http://www.ilobkk-migration.org.
ILO, 2009b. Key Indicators of the Labour Market. 6th Edition. Geneva.
ILO, 2009c. Impacts of the global financial and economic crisis on child labour and youth employment, International Labour Organization.
ILO, 2009d. Social Security for All: Investing in Social Justice and Economic Development, Social Security Department, Paper 7, International Labour Organization.
IMF, 2008. “Fiscal Policy as a Countercyclical Tool”, in World Economic Outlook 2008, Washington DC, International Monetary Fund.
IMF, 2008b. World Economic Outlook: Housing and the Business Cycle, April 2008, Washington DC, International Monetary Fund.
IMF, 2009. Fiscal Multipliers, IMF Staff Position Note, SPN/09/11, Washington DC, International Monetary Fund.
IMF, 2009b. The Implications of the Global Financial Crisis for Low-Income Countries, Washington DC, International Monetary Fund.
IMF, 2009c. IMF Completes Second Review Under Stand-By Arrangement with Armenia, Approves Request for Waiver of Nonobservance of Performance Criterion, Modification of Performance Criteria, and Rephasing of Purchases. Press Release No. 09/378. November 2, 2009
IMF, 2009d. IMF Executive Board Approves US$229.2 Million Stand-By Arrangement for Mongolia. Press Release No. 09/110. April 1, 2009
IMF, 2009e. World Economic Outlook, April 2009, Washington DC, International Monetary Fund.
Kalinga Times, 2009. “Budget 2009-10: Fiscal stimulus to counter global slowdown” in Kalinga Times, July 6. www.kalingatimes.com
94
Ki-moon, B., 2009. “Green Growth: Korea’s New Strategy: Power Green Growth, Protect the Planet” in Korean Herald 14th April.
Klasen, S and Mark Misselhorn, 2008. Determinants of the Growth Semi-Elasticity of Poverty Reduction. EUDN/WP 2008-11.
Köhler, G., M. Cali, M. Stirbu, 2009. Social Protection in South Asia: A Review, Kathmandu: UNICEF ROSA.
Kumar, N., 2008. South-South and Triangular Cooperation in Asia-Pacific: Towards a new paradigm in development Cooperation, keynote address at the Asia-Pacific Development Forum Regional Workshop on Trends and Progress in Triangular and South-South Cooperation, 21-22 October 2008, Bangkok.
Leibecker, L. and E. Lueth, 2009. Republic of Korea, Selected Issues, Washington, International Monetary Fund.
Luttrell and Moser, 2004. Gender and Social Protection (draft). London: DFID.
Measure DHS, 2009. Demographic and Health Surveys, various years and countries, Macro International Inc. http://www.measuredhs.com/
Nachne, 2009. “Going Beyond Fiscal Stimulus”, Hindu Business Line, July 19. http://www.thehindubusinessline.com.
Numnak, G., 2006. Development and Structural Diversification of the Thai Economy: The Cause of Labour Immigration, paper presented at IZA/World Bank Conference, 2006.
OECD, 2000. Economic Survey Japan, Paris, OECD.
OECD, 2009. International Migration: Charting a Course through the Crisis. Policy Brief. June 2009, Paris, OECD.
Osmani, S.R., and A. Bhargava, 1998. Health and nutrition in emerging Asia, Asian Development Review, vol. 16, No. 1
Palanivel, T. 2008. Rising Food and Fuel Prices in Asia and the Pacific: Causes, Impacts and Policy Responses, UNDP Regional Centre in Colombo, Sri Lanka (unpublished)
Patel, M., 2009. Economic Crisis and Children: an Overview for East Asia and the Pacific. Global Social Policy, 1468-0181 vol. XX(X): pp1-21
Ratha, D., S Mohapatra, and A. Silwal, 2009. Migration and Development Brief, No 10. Migration and Remittances Team Development Prospects Group, Washington DC, World Bank.
Sabarwal, S., N. Sinha and M. Buvinic, 2009. The Global Financial Crisis: Assessing Vulnerability for Women and Children. World Bank Policy Brief. Washington DC, World.
Swaminathan, M. 2009. Report on the State of Food Insecurity in Rural India, Chennai, M S Swaminathan Research Foundation.
UN, 2009. Global Millennium Development Goals Indicators Database, available at http://mdgs.un.org/.
95
ACHIEVING THE MILLENNIUM DEVELOPMENT GOALS IN AN ERA OF GLOBAL UNCERTAINTY : ASIA-PACIFIC REGIONAL REPORT2009/10
UNDP, 2009. Social Protection in Fiscal Stimulus Packages: Some Evidence, A UNDP/ODS Working Paper, United Nations Development Programme, New York.
UNESCO, 2000. Education in Crisis: The Impact and Lessons of the East Asian Financial Shock, 1997-1999. Paris, UNESCO.
UNIFEM, 2008a. Progress of the World’s Women 2008/09: Who Answers to Women? Gender and Accountability, New York, UNIFEM..
UNIFEM 2008b. Making the MDGs Work for All: Gender-Responsive Rights-Based Approaches to the MDGs, New York, UNIFEM.
United Nations, 2007. World Population Prospects: the 2008 Revision, New York, Population Division of the Department of Economic and Social Affairs of the United Nations Secretariat. http://esa.un.org/unpp.
Wan, G. and R. Francisco, 2009. How Is the Global Recession Impacting on Poverty and Social Spending? An ex-ante assessment methodology with applications to developing Asia (unpublished)
WHO, 2009. Impact of global financial crisis on health, SEA/HMM/Meet.27/5, World Health Organization, Regional office for South-East Asia, New Delhi.
World Bank, 2009. World Development Report 2009, Washington DC World Bank.
World Bank, 2009b. Migration and Development brief 10 - July 13, 2009. Mitigation and Remittances team, Development Prospects Group.
World Bank, 2009c. Growing out of Crisis - Development outreach: Putting knowledge to work for development. December 2009.
96
Prospects for progress presented in this report are not always comparable with those in previous reports in this series. This is because indicator datasets in the Global Millennium Development Goals Indicators Database are updated yearly. Also, new MDG indicators were introduced in 2008. The same classification method is applied for both countries and regions or country groups. The four categories of MDG progress towards the targets are: • Earlyachiever:Alreadyachievedthe2015target• Ontrack:Expectedtomeetthetargetby2015• Offtrack-Slow:Expectedtomeetthetarget,butafter2015• Offtrack-Noprogress/regressing:Stagnatingorslippingbackwards
Two different procedures are used to determine the categories depending on whether or not an indicator has an explicit target value for 2015. For indicators without such a target value, such as HIV prevalence, TB prevalence, TB death rate, forest cover, protected area, CO2 emissions and con-sumption of ozone-depleting substances, only three of the four categories are used: indicators trending in the ‘right’ direction since 1990 are categorized as Early achievers; indicators showing no change at all over the period are categorized as On track; and finally indicators trending in the ‘wrong’ direction are categorized as Off track-No progress/regressing.
For indicators with an explicit target value, such as $1.25-a-day poverty, mortality rates, school en-rolment and the gender parity indices, all four categories are used. To determine the category, the year t* - by which a country would reach its MDG target if the trend since 1990 continued - is esti-mated (see below). Denote tLst as the year with the latest available value. If t* is below tLst country is categorized as an Early achiever. If t* lies between tLst + 1 and 2015, it is categorized as On track. If t* is above 2015, the country is categorized as Off track-Slow. Naturally no t* can be estimated if a country has a zero trend or trends in the ‘wrong’ direction, i.e. away from the target value. In these cases, the country is categorized as Off track-No progress/regressing.
Estimating the trend To estimate t*, the trend since 1990 is estimated first based on at least two data points, which are at least three years apart. The only exception is HIV prevalence, for which country data are available only for 2003 and 2005 for almost all countries. For indicators that are a proportion or a probability, we convert the original value Yt to yt, which is between 0 and 1, by dividing Yt by the appropriate scale. For example, for $1.25 poverty rate, we divide Yt by 100; for infant mortality, we divide Yt by 1000. A logit transformation is then made on yt so that they are on the scale of real numbers. For indicators that are odds ratios, such as gender parity, a log transform is used. For indicators that can’t be interpreted by either probability or odds ratio, such as CO2 emissions and consumption of ozone-depleting substances, no transform is needed.
(1)
The rate of change r1 can be estimated via this linear equation using the OLS method:
(2) For countries in North and Central Asia the impact of the social changes in the early 1990s on many
otherwisesproportion of rate a is if)log(
yprobabilit a is if1
log
y
tt
tt
tt
Y
YY
yy
yL
=
=
−
=
tt trrL ε++= *10
nnex 1 - MDG progress classificationA
97
ACHIEVING THE MILLENNIUM DEVELOPMENT GOALS IN AN ERA OF GLOBAL UNCERTAINTY : ASIA-PACIFIC REGIONAL REPORT2009/10
of the MDG indicators is taken into account. The rate of change for all the available data since 1990 is calculated first and then for all the available data except the first year. If the signs of the two es-timated rates differ, the trend estimate excluding the observation for the first year is used.
In addition, for indicators such as TB prevalence, TB death rate, CO2 emissions and consumption of ozone-depleting substances, where enough data (more than 5) are available to detect a reversal of trend, a binomial equation is estimated using the OLS method:
(3) When r2, the coefficient of t2 is statistically significant (at 0.02 level), and there are more than 3 data points to the right of the turning point, estimated at -r1/(2 * r2) , the binomial model will be used in place of the linear model. If r2 <0, the indicator has increased in value first and then decreased, and in this case, the indicator has achieved the goal early. If r2 >0, the indicator has regressed. If the linear model is used, the sign of r1 is used to judge if the indicator has achieved the goal already (r1<0), on track(r1=0), or regressing(r1 >0).
Estimating the year of MDG achievement For indicators with a target value, the calculation of t* is as follows. Let L* and LLst denote the target value and latest available value, respectively transformed as discussed previously.
(4)
Setting the target value When an indicator requires a target value, a value for the indicator for the year 1990 is required to calculate it. When the 1990 value is not available, with the exception of the North and Central Asian countries, the first value is used in place of the 1990 value. For the North and Central Asian countries, if the trend estimate excludes the first available value, the second value is then used in place of the 1990 value.
Using cut-off values Many of the MDG targets require an indicator value to increase or decrease by a certain proportion of their 1990 values. For these indicators, we only have a cut off point for $1.25-a-day poverty, be-cause that is the lowest level reported on this indicator. Many other indicators require an absolute level as a target, which cannot be achieved by our model due to the transformation used. So they are treated as achieved if a country has reached a certain absolute value. In the case of primary school enrolment, for example, this “cut-off” value is set at 95 per cent instead of 100. The transfor-mation and cut-off values for indicators are presented in the Table below.
tt trtrrL ε+++= 2
210 **
otherwise
signright thehas if,1max
target reaches if
11
0*
**
NA
rr
rLt
LLtt
Lst
LstLst
−
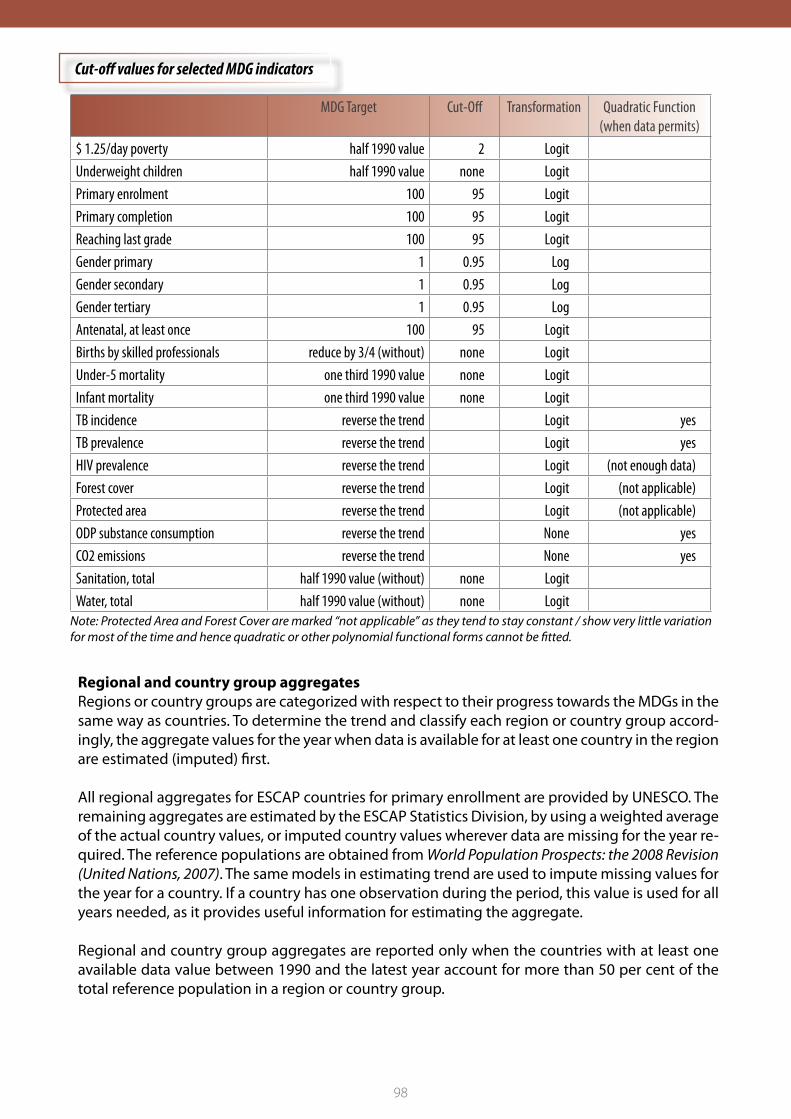
98
MDG Target Cut-Off Transformation Quadratic Function(when data permits)
$ 1.25/day poverty half 1990 value 2 LogitUnderweight children half 1990 value none LogitPrimary enrolment 100 95 LogitPrimary completion 100 95 LogitReaching last grade 100 95 LogitGender primary 1 0.95 LogGender secondary 1 0.95 LogGender tertiary 1 0.95 LogAntenatal, at least once 100 95 LogitBirths by skilled professionals reduce by 3/4 (without) none LogitUnder-5 mortality one third 1990 value none LogitInfant mortality one third 1990 value none LogitTB incidence reverse the trend Logit yesTB prevalence reverse the trend Logit yesHIV prevalence reverse the trend Logit (not enough data)Forest cover reverse the trend Logit (not applicable)Protected area reverse the trend Logit (not applicable)ODP substance consumption reverse the trend None yesCO2 emissions reverse the trend None yesSanitation, total half 1990 value (without) none LogitWater, total half 1990 value (without) none Logit
Cut-off values for selected MDG indicators
Note: Protected Area and Forest Cover are marked “not applicable” as they tend to stay constant / show very little variation for most of the time and hence quadratic or other polynomial functional forms cannot be fitted.
Regional and country group aggregates Regions or country groups are categorized with respect to their progress towards the MDGs in the same way as countries. To determine the trend and classify each region or country group accord-ingly, the aggregate values for the year when data is available for at least one country in the region are estimated (imputed) first.
All regional aggregates for ESCAP countries for primary enrollment are provided by UNESCO. The remaining aggregates are estimated by the ESCAP Statistics Division, by using a weighted average of the actual country values, or imputed country values wherever data are missing for the year re-quired. The reference populations are obtained from World Population Prospects: the 2008 Revision (United Nations, 2007). The same models in estimating trend are used to impute missing values for the year for a country. If a country has one observation during the period, this value is used for all years needed, as it provides useful information for estimating the aggregate.
Regional and country group aggregates are reported only when the countries with at least one available data value between 1990 and the latest year account for more than 50 per cent of the total reference population in a region or country group.
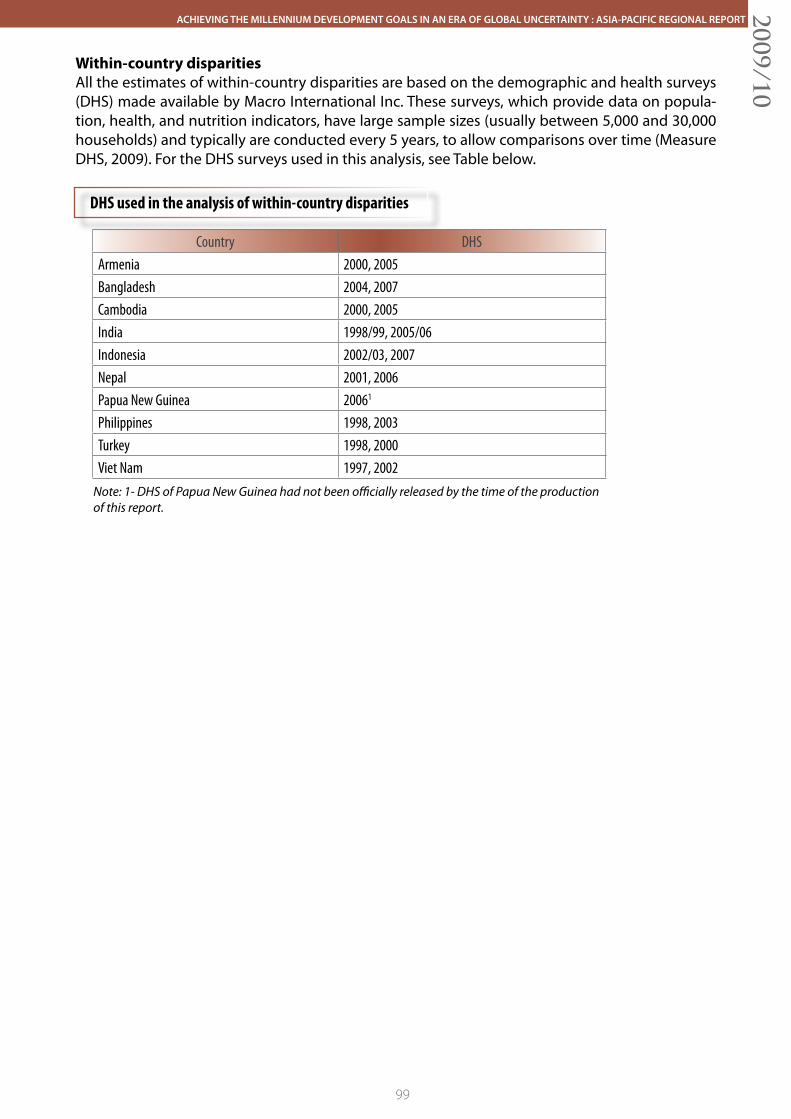
99
ACHIEVING THE MILLENNIUM DEVELOPMENT GOALS IN AN ERA OF GLOBAL UNCERTAINTY : ASIA-PACIFIC REGIONAL REPORT2009/10
Within-country disparities All the estimates of within-country disparities are based on the demographic and health surveys (DHS) made available by Macro International Inc. These surveys, which provide data on popula-tion, health, and nutrition indicators, have large sample sizes (usually between 5,000 and 30,000 households) and typically are conducted every 5 years, to allow comparisons over time (Measure DHS, 2009). For the DHS surveys used in this analysis, see Table below.
Country DHSArmenia 2000, 2005Bangladesh 2004, 2007Cambodia 2000, 2005India 1998/99, 2005/06Indonesia 2002/03, 2007Nepal 2001, 2006Papua New Guinea 20061
Philippines 1998, 2003Turkey 1998, 2000Viet Nam 1997, 2002
DHS used in the analysis of within-country disparities
Note: 1- DHS of Papua New Guinea had not been officially released by the time of the production of this report.
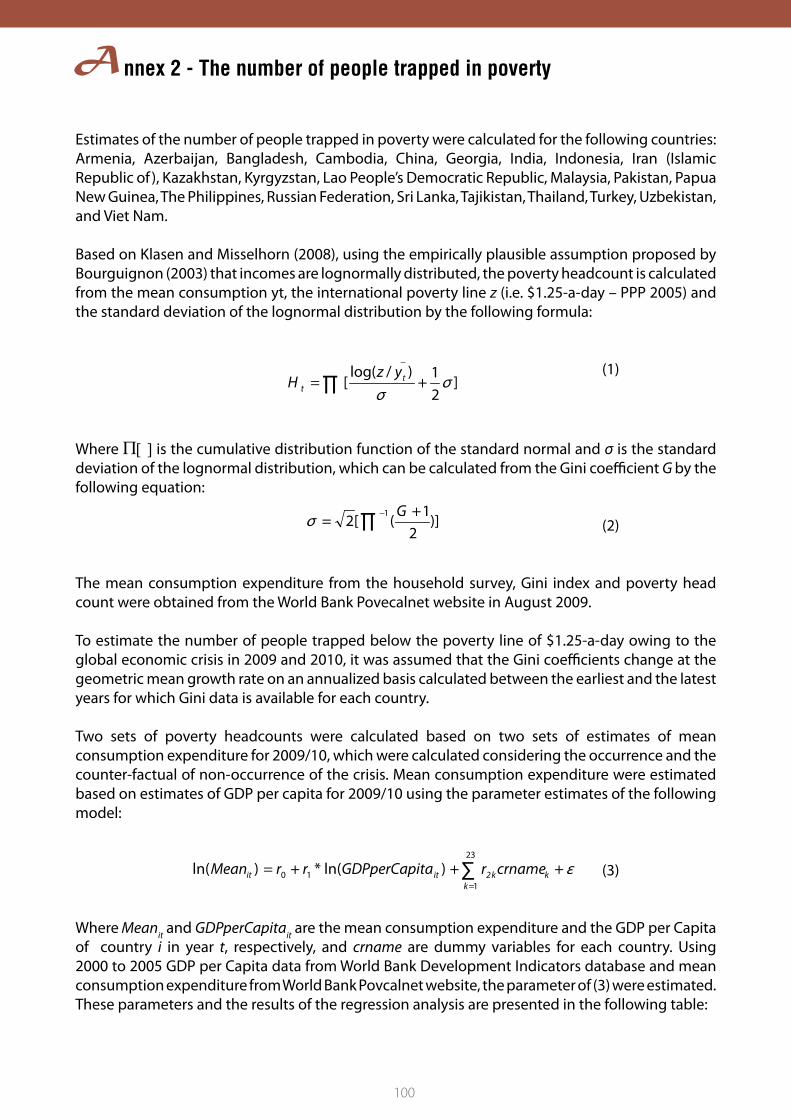
100
Estimates of the number of people trapped in poverty were calculated for the following countries: Armenia, Azerbaijan, Bangladesh, Cambodia, China, Georgia, India, Indonesia, Iran (Islamic Republic of ), Kazakhstan, Kyrgyzstan, Lao People’s Democratic Republic, Malaysia, Pakistan, Papua New Guinea, The Philippines, Russian Federation, Sri Lanka, Tajikistan, Thailand, Turkey, Uzbekistan, and Viet Nam.
Based on Klasen and Misselhorn (2008), using the empirically plausible assumption proposed by Bourguignon (2003) that incomes are lognormally distributed, the poverty headcount is calculated from the mean consumption yt, the international poverty line z (i.e. $1.25-a-day – PPP 2005) and the standard deviation of the lognormal distribution by the following formula:
(1)
Where P[ ] is the cumulative distribution function of the standard normal and σ is the standard deviation of the lognormal distribution, which can be calculated from the Gini coefficient G by the following equation:
(2)
The mean consumption expenditure from the household survey, Gini index and poverty head count were obtained from the World Bank Povecalnet website in August 2009.
To estimate the number of people trapped below the poverty line of $1.25-a-day owing to the global economic crisis in 2009 and 2010, it was assumed that the Gini coefficients change at the geometric mean growth rate on an annualized basis calculated between the earliest and the latest years for which Gini data is available for each country.
Two sets of poverty headcounts were calculated based on two sets of estimates of mean consumption expenditure for 2009/10, which were calculated considering the occurrence and the counter-factual of non-occurrence of the crisis. Mean consumption expenditure were estimated based on estimates of GDP per capita for 2009/10 using the parameter estimates of the following model:
(3)
Where Meanit and GDPperCapitait are the mean consumption expenditure and the GDP per Capita of country i in year t, respectively, and crname are dummy variables for each country. Using 2000 to 2005 GDP per Capita data from World Bank Development Indicators database and mean consumption expenditure from World Bank Povcalnet website, the parameter of (3) were estimated. These parameters and the results of the regression analysis are presented in the following table:
∏ += ]21)/log(
[
_
σσ
tt
yzH
∏ − +=
1)]
21
([2Gσ
ε+++= ∑
=
23
1210 )ln(*)ln(
kkkitit crnamerGDPperCapitarrMean
nnex 2 - The number of people trapped in povertyA
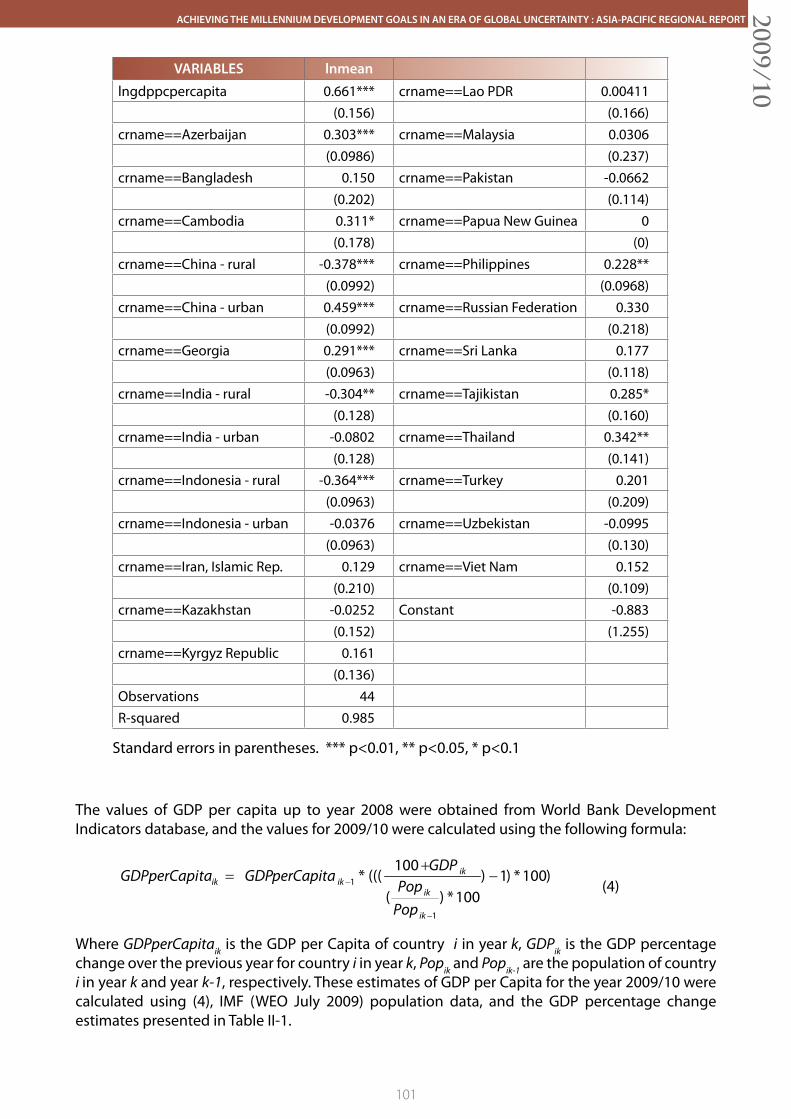
101
ACHIEVING THE MILLENNIUM DEVELOPMENT GOALS IN AN ERA OF GLOBAL UNCERTAINTY : ASIA-PACIFIC REGIONAL REPORT2009/10
VARIABLES lnmean lngdppcpercapita 0.661*** crname==Lao PDR 0.00411
(0.156) (0.166)crname==Azerbaijan 0.303*** crname==Malaysia 0.0306
(0.0986) (0.237)crname==Bangladesh 0.150 crname==Pakistan -0.0662
(0.202) (0.114)crname==Cambodia 0.311* crname==Papua New Guinea 0
(0.178) (0)crname==China - rural -0.378*** crname==Philippines 0.228**
(0.0992) (0.0968)crname==China - urban 0.459*** crname==Russian Federation 0.330
(0.0992) (0.218)crname==Georgia 0.291*** crname==Sri Lanka 0.177
(0.0963) (0.118)crname==India - rural -0.304** crname==Tajikistan 0.285*
(0.128) (0.160)crname==India - urban -0.0802 crname==Thailand 0.342**
(0.128) (0.141)crname==Indonesia - rural -0.364*** crname==Turkey 0.201
(0.0963) (0.209)crname==Indonesia - urban -0.0376 crname==Uzbekistan -0.0995
(0.0963) (0.130)crname==Iran, Islamic Rep. 0.129 crname==Viet Nam 0.152
(0.210) (0.109)crname==Kazakhstan -0.0252 Constant -0.883
(0.152) (1.255)crname==Kyrgyz Republic 0.161
(0.136)Observations 44R-squared 0.985
Standard errors in parentheses. *** p<0.01, ** p<0.05, * p<0.1
The values of GDP per capita up to year 2008 were obtained from World Bank Development Indicators database, and the values for 2009/10 were calculated using the following formula:
(4)
Where GDPperCapitaik is the GDP per Capita of country i in year k, GDPik is the GDP percentage change over the previous year for country i in year k, Popik and Popik-1 are the population of country i in year k and year k-1, respectively. These estimates of GDP per Capita for the year 2009/10 were calculated using (4), IMF (WEO July 2009) population data, and the GDP percentage change estimates presented in Table II-1.
)100*)1)
100*)(
100(((*
1
1 −
−
−
ik
ik
ikikik
PopPop
GDPperCapitaGDPtaGDPperCapi
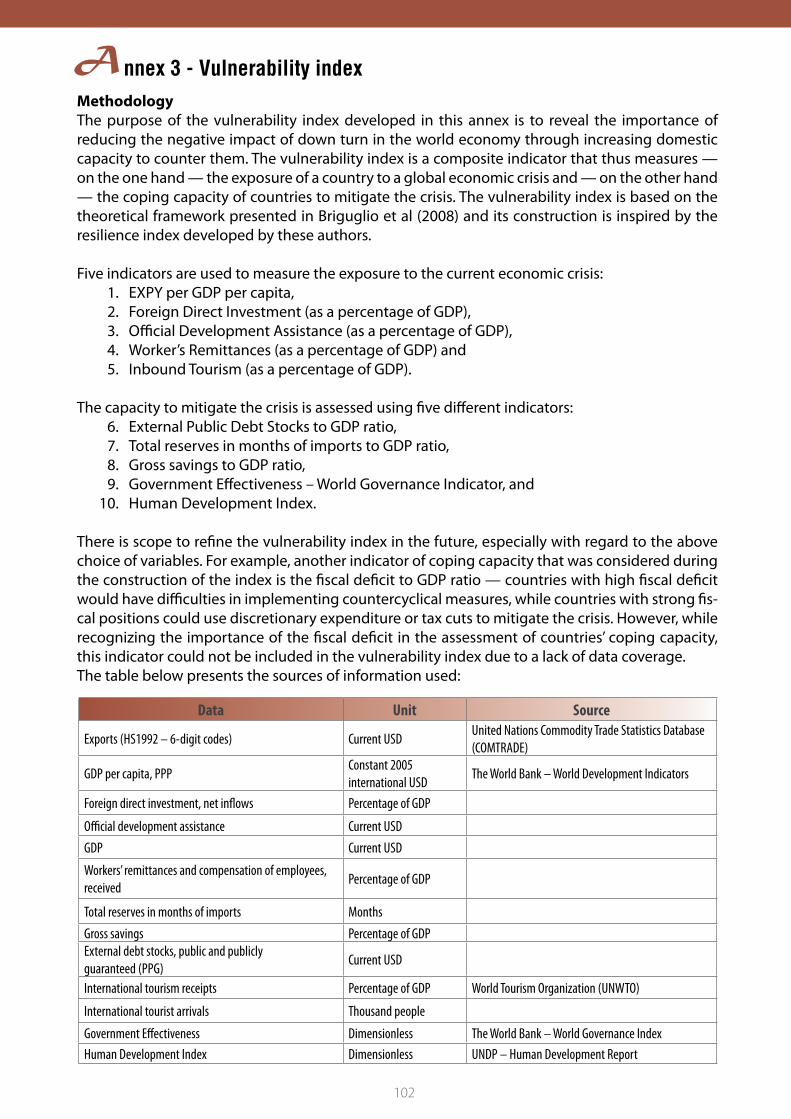
102
MethodologyThe purpose of the vulnerability index developed in this annex is to reveal the importance of reducing the negative impact of down turn in the world economy through increasing domestic capacity to counter them. The vulnerability index is a composite indicator that thus measures — on the one hand — the exposure of a country to a global economic crisis and — on the other hand — the coping capacity of countries to mitigate the crisis. The vulnerability index is based on the theoretical framework presented in Briguglio et al (2008) and its construction is inspired by the resilience index developed by these authors.
Five indicators are used to measure the exposure to the current economic crisis: 1. EXPY per GDP per capita, 2. Foreign Direct Investment (as a percentage of GDP), 3. Official Development Assistance (as a percentage of GDP), 4. Worker’s Remittances (as a percentage of GDP) and 5. Inbound Tourism (as a percentage of GDP).
The capacity to mitigate the crisis is assessed using five different indicators: 6. External Public Debt Stocks to GDP ratio, 7. Total reserves in months of imports to GDP ratio, 8. Gross savings to GDP ratio, 9. Government Effectiveness – World Governance Indicator, and 10. Human Development Index.
There is scope to refine the vulnerability index in the future, especially with regard to the above choice of variables. For example, another indicator of coping capacity that was considered during the construction of the index is the fiscal deficit to GDP ratio — countries with high fiscal deficit would have difficulties in implementing countercyclical measures, while countries with strong fis-cal positions could use discretionary expenditure or tax cuts to mitigate the crisis. However, while recognizing the importance of the fiscal deficit in the assessment of countries’ coping capacity, this indicator could not be included in the vulnerability index due to a lack of data coverage.The table below presents the sources of information used:
nnex 3 - Vulnerability indexA
Data Unit Source
Exports (HS1992 – 6-digit codes) Current USDUnited Nations Commodity Trade Statistics Database (COMTRADE)
GDP per capita, PPPConstant 2005 international USD
The World Bank – World Development Indicators
Foreign direct investment, net inflows Percentage of GDP
Official development assistance Current USDGDP Current USD
Workers’ remittances and compensation of employees, received
Percentage of GDP
Total reserves in months of imports Months
Gross savings Percentage of GDPExternal debt stocks, public and publicly guaranteed (PPG)
Current USD
International tourism receipts Percentage of GDP World Tourism Organization (UNWTO)
International tourist arrivals Thousand people
Government Effectiveness Dimensionless The World Bank – World Governance IndexHuman Development Index Dimensionless UNDP – Human Development Report
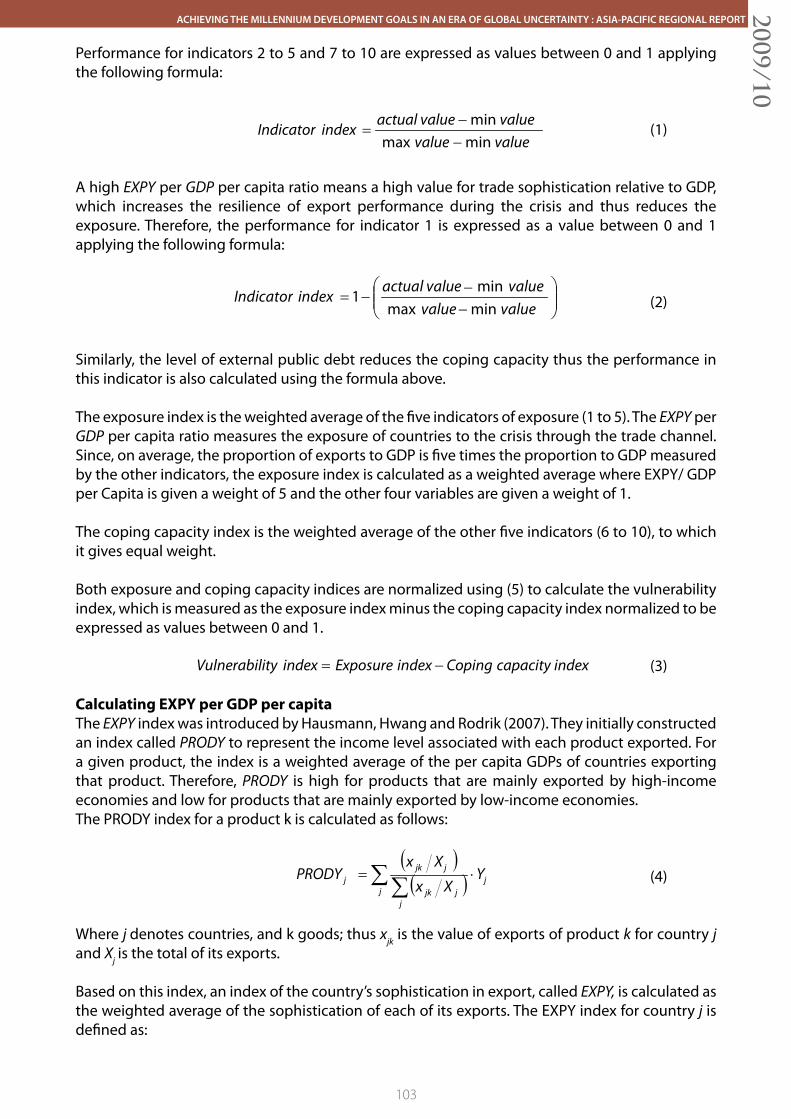
103
ACHIEVING THE MILLENNIUM DEVELOPMENT GOALS IN AN ERA OF GLOBAL UNCERTAINTY : ASIA-PACIFIC REGIONAL REPORT2009/10
Performance for indicators 2 to 5 and 7 to 10 are expressed as values between 0 and 1 applying the following formula:
(1)
A high EXPY per GDP per capita ratio means a high value for trade sophistication relative to GDP, which increases the resilience of export performance during the crisis and thus reduces the exposure. Therefore, the performance for indicator 1 is expressed as a value between 0 and 1 applying the following formula:
(2)
Similarly, the level of external public debt reduces the coping capacity thus the performance in this indicator is also calculated using the formula above.
The exposure index is the weighted average of the five indicators of exposure (1 to 5). The EXPY per GDP per capita ratio measures the exposure of countries to the crisis through the trade channel. Since, on average, the proportion of exports to GDP is five times the proportion to GDP measured by the other indicators, the exposure index is calculated as a weighted average where EXPY/ GDP per Capita is given a weight of 5 and the other four variables are given a weight of 1.
The coping capacity index is the weighted average of the other five indicators (6 to 10), to which it gives equal weight.
Both exposure and coping capacity indices are normalized using (5) to calculate the vulnerability index, which is measured as the exposure index minus the coping capacity index normalized to be expressed as values between 0 and 1.
(3)
Calculating EXPY per GDP per capitaThe EXPY index was introduced by Hausmann, Hwang and Rodrik (2007). They initially constructed an index called PRODY to represent the income level associated with each product exported. For a given product, the index is a weighted average of the per capita GDPs of countries exporting that product. Therefore, PRODY is high for products that are mainly exported by high-income economies and low for products that are mainly exported by low-income economies. The PRODY index for a product k is calculated as follows:
(4)
Where j denotes countries, and k goods; thus xjk is the value of exports of product k for country j and Xj is the total of its exports.
Based on this index, an index of the country’s sophistication in export, called EXPY, is calculated as the weighted average of the sophistication of each of its exports. The EXPY index for country j is defined as:
∑∑
⋅j
j
jjjk
jjkj Y
Xx
XxPRODY
value
actual valueindexIndicator
min valuemaxmin value
−−
−−−
valuevaluevalueactual value
indexIndicatorminmaxmin
1
indexcapacityCopingindexExposureindexVulnerability −
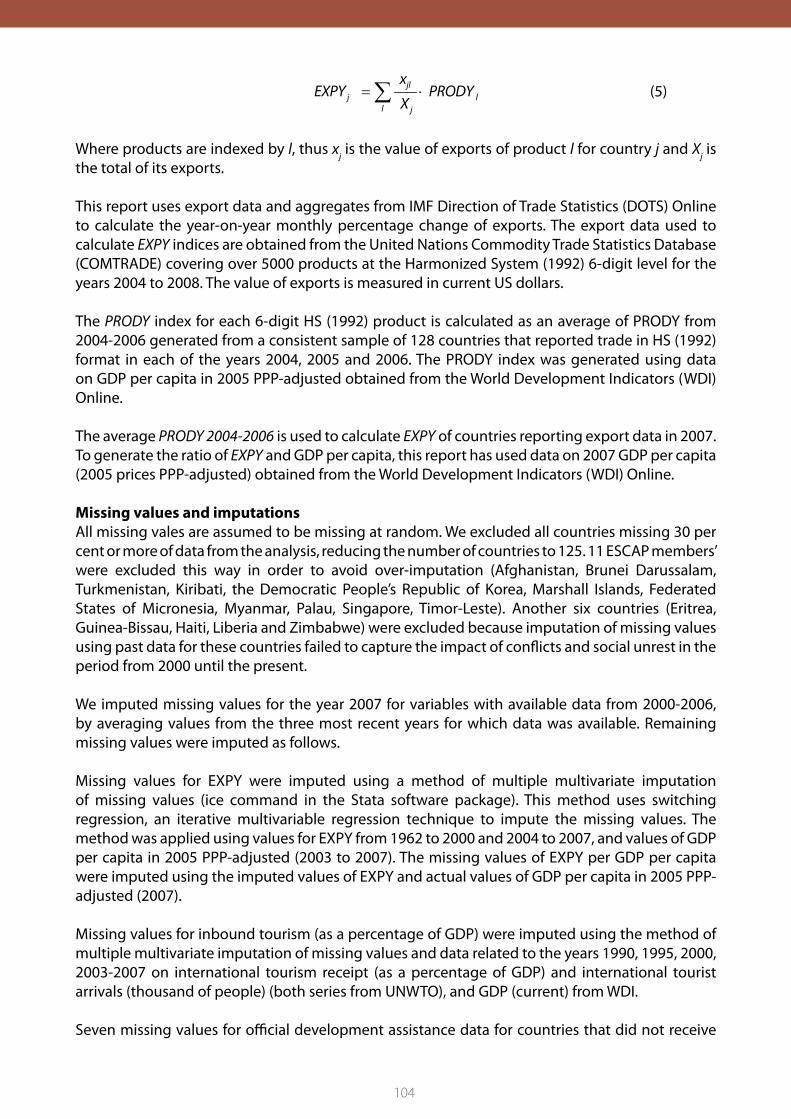
104
(5)
Where products are indexed by l, thus xj is the value of exports of product l for country j and Xj is the total of its exports.
This report uses export data and aggregates from IMF Direction of Trade Statistics (DOTS) Online to calculate the year-on-year monthly percentage change of exports. The export data used to calculate EXPY indices are obtained from the United Nations Commodity Trade Statistics Database (COMTRADE) covering over 5000 products at the Harmonized System (1992) 6-digit level for the years 2004 to 2008. The value of exports is measured in current US dollars.
The PRODY index for each 6-digit HS (1992) product is calculated as an average of PRODY from 2004-2006 generated from a consistent sample of 128 countries that reported trade in HS (1992) format in each of the years 2004, 2005 and 2006. The PRODY index was generated using data on GDP per capita in 2005 PPP-adjusted obtained from the World Development Indicators (WDI) Online.
The average PRODY 2004-2006 is used to calculate EXPY of countries reporting export data in 2007. To generate the ratio of EXPY and GDP per capita, this report has used data on 2007 GDP per capita (2005 prices PPP-adjusted) obtained from the World Development Indicators (WDI) Online.
Missing values and imputationsAll missing vales are assumed to be missing at random. We excluded all countries missing 30 per cent or more of data from the analysis, reducing the number of countries to 125. 11 ESCAP members’ were excluded this way in order to avoid over-imputation (Afghanistan, Brunei Darussalam, Turkmenistan, Kiribati, the Democratic People’s Republic of Korea, Marshall Islands, Federated States of Micronesia, Myanmar, Palau, Singapore, Timor-Leste). Another six countries (Eritrea, Guinea-Bissau, Haiti, Liberia and Zimbabwe) were excluded because imputation of missing values using past data for these countries failed to capture the impact of conflicts and social unrest in the period from 2000 until the present.
We imputed missing values for the year 2007 for variables with available data from 2000-2006, by averaging values from the three most recent years for which data was available. Remaining missing values were imputed as follows.
Missing values for EXPY were imputed using a method of multiple multivariate imputation of missing values (ice command in the Stata software package). This method uses switching regression, an iterative multivariable regression technique to impute the missing values. The method was applied using values for EXPY from 1962 to 2000 and 2004 to 2007, and values of GDP per capita in 2005 PPP-adjusted (2003 to 2007). The missing values of EXPY per GDP per capita were imputed using the imputed values of EXPY and actual values of GDP per capita in 2005 PPP-adjusted (2007).
Missing values for inbound tourism (as a percentage of GDP) were imputed using the method of multiple multivariate imputation of missing values and data related to the years 1990, 1995, 2000, 2003-2007 on international tourism receipt (as a percentage of GDP) and international tourist arrivals (thousand of people) (both series from UNWTO), and GDP (current) from WDI.
Seven missing values for official development assistance data for countries that did not receive
∑ ⋅
ll
j
jlj PRODY
X
xEXPY
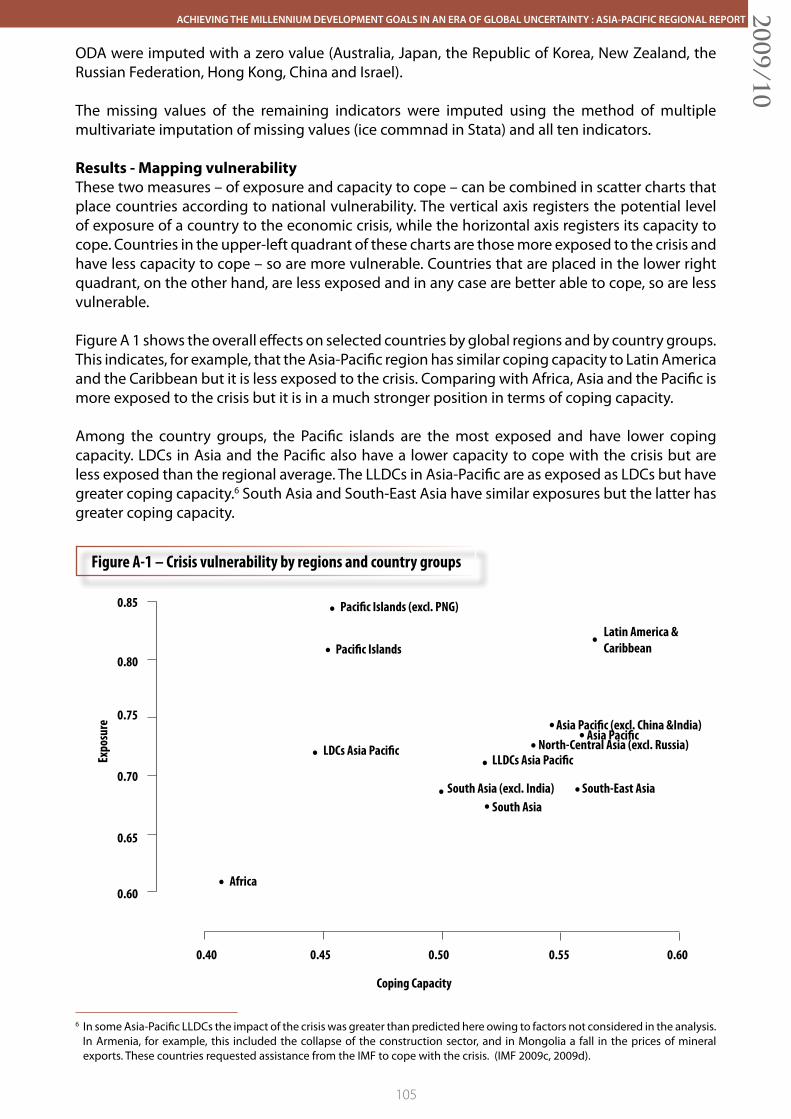
105
ACHIEVING THE MILLENNIUM DEVELOPMENT GOALS IN AN ERA OF GLOBAL UNCERTAINTY : ASIA-PACIFIC REGIONAL REPORT2009/10
ODA were imputed with a zero value (Australia, Japan, the Republic of Korea, New Zealand, the Russian Federation, Hong Kong, China and Israel).
The missing values of the remaining indicators were imputed using the method of multiple multivariate imputation of missing values (ice commnad in Stata) and all ten indicators.
Results - Mapping vulnerabilityThese two measures – of exposure and capacity to cope – can be combined in scatter charts that place countries according to national vulnerability. The vertical axis registers the potential level of exposure of a country to the economic crisis, while the horizontal axis registers its capacity to cope. Countries in the upper-left quadrant of these charts are those more exposed to the crisis and have less capacity to cope – so are more vulnerable. Countries that are placed in the lower right quadrant, on the other hand, are less exposed and in any case are better able to cope, so are less vulnerable.
Figure A 1 shows the overall effects on selected countries by global regions and by country groups. This indicates, for example, that the Asia-Pacific region has similar coping capacity to Latin America and the Caribbean but it is less exposed to the crisis. Comparing with Africa, Asia and the Pacific is more exposed to the crisis but it is in a much stronger position in terms of coping capacity.
Among the country groups, the Pacific islands are the most exposed and have lower coping capacity. LDCs in Asia and the Pacific also have a lower capacity to cope with the crisis but are less exposed than the regional average. The LLDCs in Asia-Pacific are as exposed as LDCs but have greater coping capacity.6 South Asia and South-East Asia have similar exposures but the latter has greater coping capacity.
6 In some Asia-Pacific LLDCs the impact of the crisis was greater than predicted here owing to factors not considered in the analysis. In Armenia, for example, this included the collapse of the construction sector, and in Mongolia a fall in the prices of mineral exports. These countries requested assistance from the IMF to cope with the crisis. (IMF 2009c, 2009d).
South-East Asia
Asia Paci�c (excl. China &India)Asia Paci�c
North-Central Asia (excl. Russia)
Latin America & Caribbean
0.40 0.45 0.50 0.55 0.60
Coping Capacity
Paci�c Islands (excl. PNG)
Paci�c Islands
LDCs Asia Paci�cLLDCs Asia Paci�c
Africa
South Asia (excl. India)South Asia
0.85
0.80
0.75
0.70
0.65
0.60
Expo
sure
Figure A-1 – Crisis vulnerability by regions and country groups
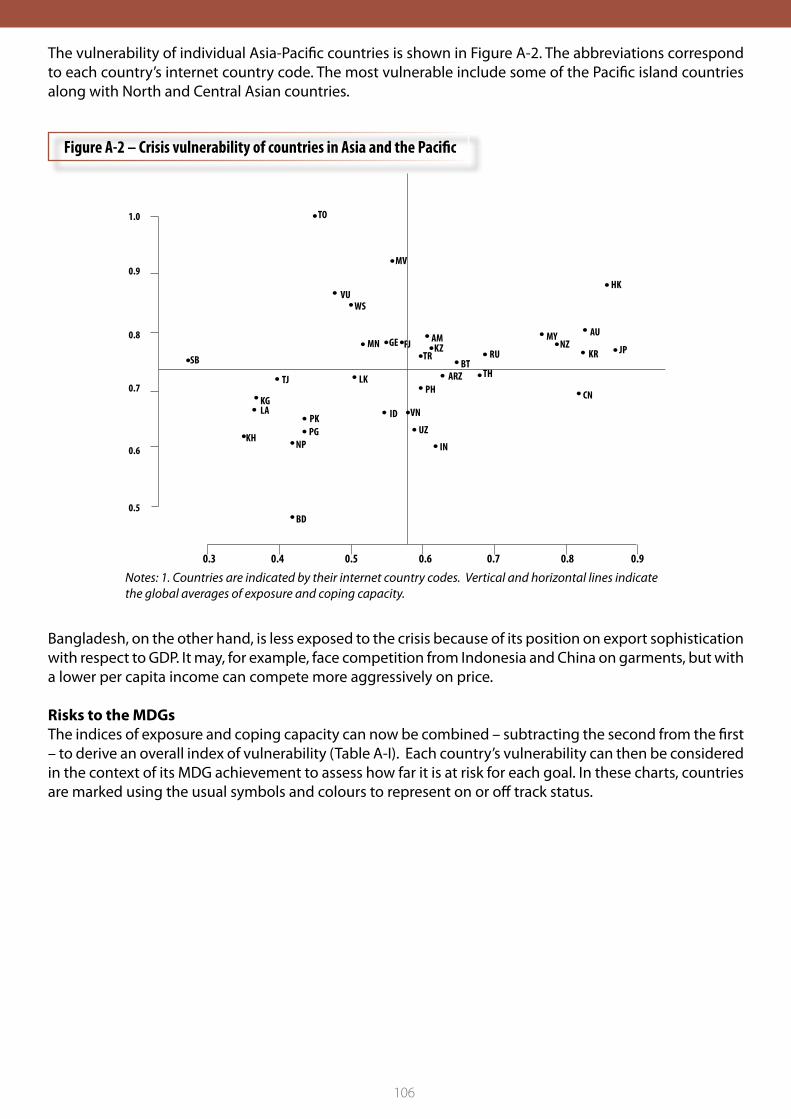
106
The vulnerability of individual Asia-Pacific countries is shown in Figure A-2. The abbreviations correspond to each country’s internet country code. The most vulnerable include some of the Pacific island countries along with North and Central Asian countries.
TO
MV
HKVU
WS
MN GE FJ AMKZ
TR RU
THBT
CN
MYNZ
AU
KR JP
PH
VN
UZ
IN
BD
NPPGPK
KH
ID
LKTJ
KGLA
SB
0.3 0.4 0.5 0.6 0.7 0.8 0.9
1.0
0.9
0.8
0.7
0.6
0.5
ARZ
Figure A-2 – Crisis vulnerability of countries in Asia and the Pacific
Notes: 1. Countries are indicated by their internet country codes. Vertical and horizontal lines indicate the global averages of exposure and coping capacity.
Bangladesh, on the other hand, is less exposed to the crisis because of its position on export sophistication with respect to GDP. It may, for example, face competition from Indonesia and China on garments, but with a lower per capita income can compete more aggressively on price.
Risks to the MDGsThe indices of exposure and coping capacity can now be combined – subtracting the second from the first – to derive an overall index of vulnerability (Table A-I). Each country’s vulnerability can then be considered in the context of its MDG achievement to assess how far it is at risk for each goal. In these charts, countries are marked using the usual symbols and colours to represent on or off track status.
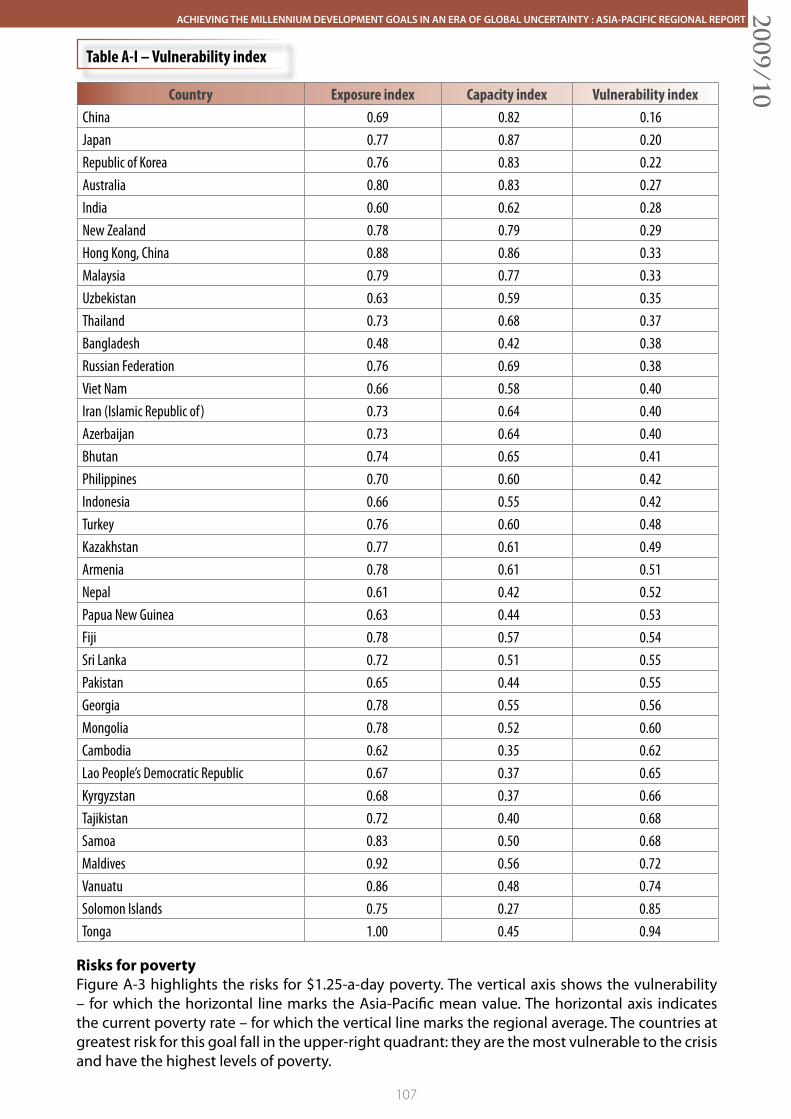
107
ACHIEVING THE MILLENNIUM DEVELOPMENT GOALS IN AN ERA OF GLOBAL UNCERTAINTY : ASIA-PACIFIC REGIONAL REPORT2009/10Country Exposure index Capacity index Vulnerability index
China 0.69 0.82 0.16Japan 0.77 0.87 0.20Republic of Korea 0.76 0.83 0.22Australia 0.80 0.83 0.27India 0.60 0.62 0.28New Zealand 0.78 0.79 0.29Hong Kong, China 0.88 0.86 0.33Malaysia 0.79 0.77 0.33Uzbekistan 0.63 0.59 0.35Thailand 0.73 0.68 0.37Bangladesh 0.48 0.42 0.38Russian Federation 0.76 0.69 0.38Viet Nam 0.66 0.58 0.40Iran (Islamic Republic of) 0.73 0.64 0.40Azerbaijan 0.73 0.64 0.40Bhutan 0.74 0.65 0.41Philippines 0.70 0.60 0.42Indonesia 0.66 0.55 0.42Turkey 0.76 0.60 0.48Kazakhstan 0.77 0.61 0.49Armenia 0.78 0.61 0.51Nepal 0.61 0.42 0.52Papua New Guinea 0.63 0.44 0.53Fiji 0.78 0.57 0.54Sri Lanka 0.72 0.51 0.55Pakistan 0.65 0.44 0.55Georgia 0.78 0.55 0.56Mongolia 0.78 0.52 0.60Cambodia 0.62 0.35 0.62Lao People’s Democratic Republic 0.67 0.37 0.65Kyrgyzstan 0.68 0.37 0.66Tajikistan 0.72 0.40 0.68Samoa 0.83 0.50 0.68Maldives 0.92 0.56 0.72Vanuatu 0.86 0.48 0.74Solomon Islands 0.75 0.27 0.85Tonga 1.00 0.45 0.94
Table A-I – Vulnerability index
Risks for povertyFigure A-3 highlights the risks for $1.25-a-day poverty. The vertical axis shows the vulnerability – for which the horizontal line marks the Asia-Pacific mean value. The horizontal axis indicates the current poverty rate – for which the vertical line marks the regional average. The countries at greatest risk for this goal fall in the upper-right quadrant: they are the most vulnerable to the crisis and have the highest levels of poverty.
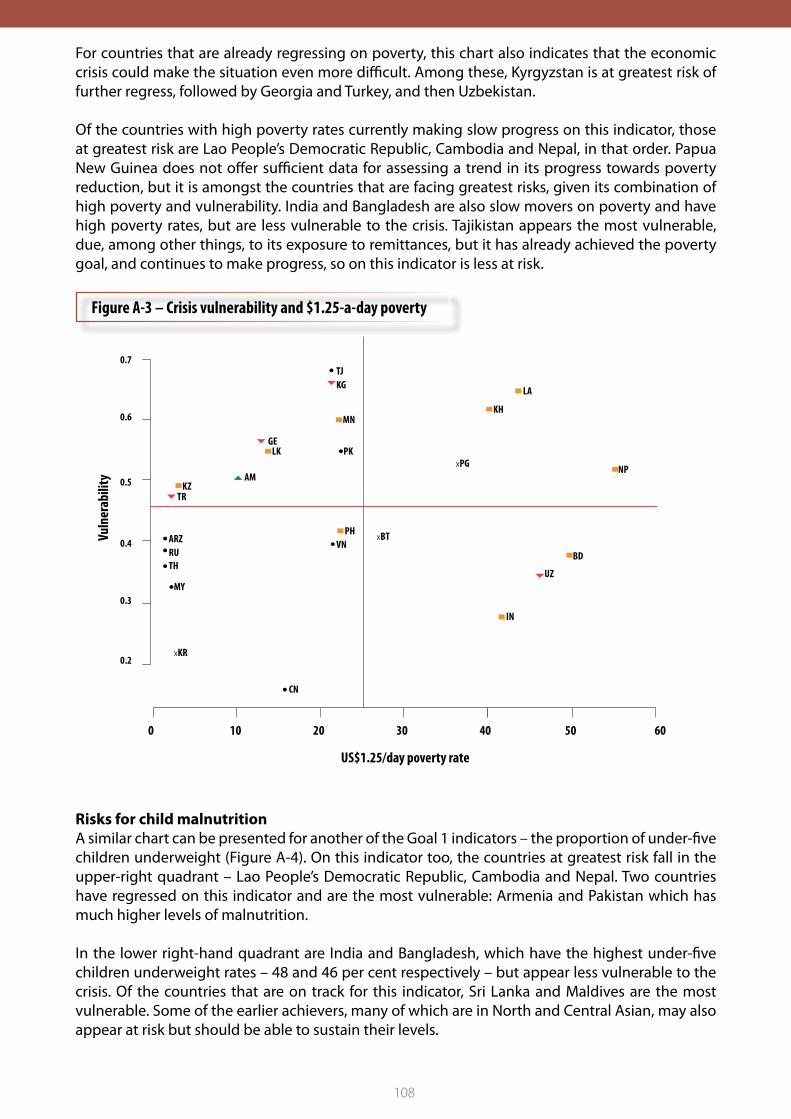
108
For countries that are already regressing on poverty, this chart also indicates that the economic crisis could make the situation even more difficult. Among these, Kyrgyzstan is at greatest risk of further regress, followed by Georgia and Turkey, and then Uzbekistan.
Of the countries with high poverty rates currently making slow progress on this indicator, those at greatest risk are Lao People’s Democratic Republic, Cambodia and Nepal, in that order. Papua New Guinea does not offer sufficient data for assessing a trend in its progress towards poverty reduction, but it is amongst the countries that are facing greatest risks, given its combination of high poverty and vulnerability. India and Bangladesh are also slow movers on poverty and have high poverty rates, but are less vulnerable to the crisis. Tajikistan appears the most vulnerable, due, among other things, to its exposure to remittances, but it has already achieved the poverty goal, and continues to make progress, so on this indicator is less at risk.
Risks for child malnutritionA similar chart can be presented for another of the Goal 1 indicators – the proportion of under-five children underweight (Figure A-4). On this indicator too, the countries at greatest risk fall in the upper-right quadrant – Lao People’s Democratic Republic, Cambodia and Nepal. Two countries have regressed on this indicator and are the most vulnerable: Armenia and Pakistan which has much higher levels of malnutrition.
In the lower right-hand quadrant are India and Bangladesh, which have the highest under-five children underweight rates – 48 and 46 per cent respectively – but appear less vulnerable to the crisis. Of the countries that are on track for this indicator, Sri Lanka and Maldives are the most vulnerable. Some of the earlier achievers, many of which are in North and Central Asian, may also appear at risk but should be able to sustain their levels.
MN
GE
AMKZ
TR
RUTH
XBT
MY
XKR
PHVN
UZ
IN
BD
NPXPGPK
KH
LK
TJKG LA
0.7
0.6
0.5
0.4
0.3
0.2
ARZ
0 10 20 30 40 50 60
CN
US$1.25/day poverty rate
Vuln
erab
ility
Figure A-3 – Crisis vulnerability and $1.25-a-day poverty
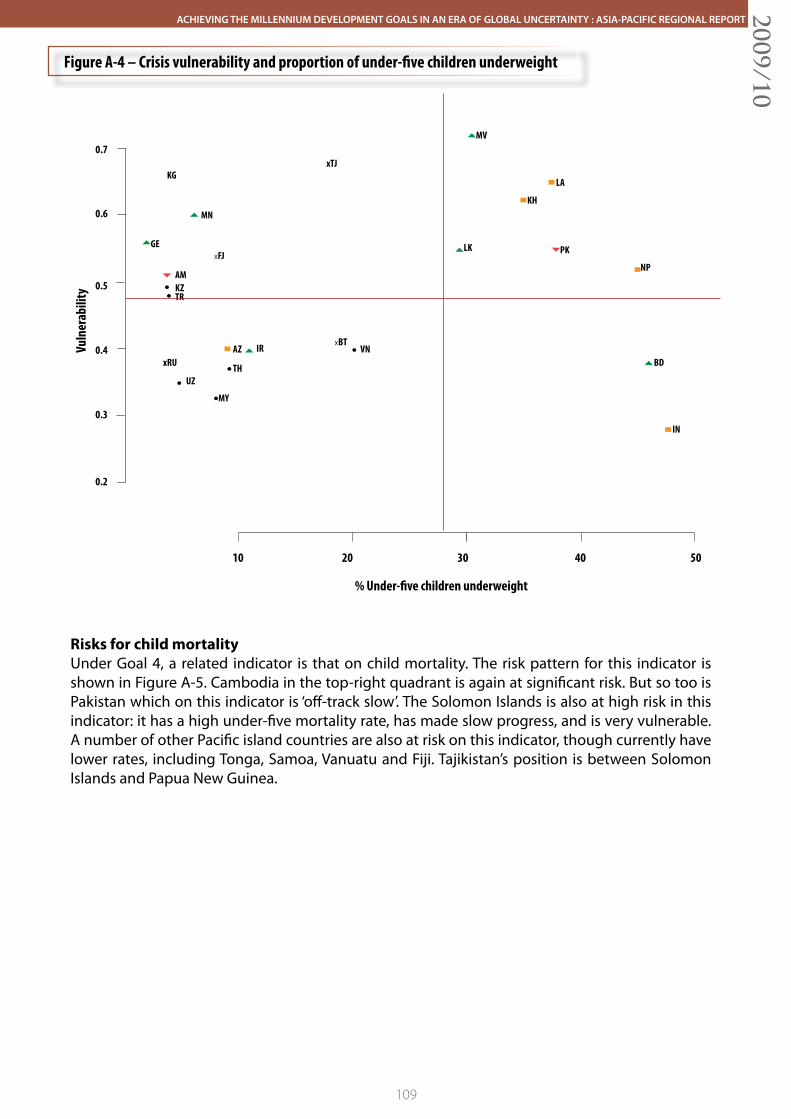
109
ACHIEVING THE MILLENNIUM DEVELOPMENT GOALS IN AN ERA OF GLOBAL UNCERTAINTY : ASIA-PACIFIC REGIONAL REPORT2009/10
Figure A-4 – Crisis vulnerability and proportion of under-five children underweight
MN
GE
AMKZTR
xRU TH
XBT
MY
VN
UZ
IN
BD
NP
PK
KH
LK
xTJKG
LA
0.7
0.6
0.5
0.4
0.3
0.2
AZ
10 20 30 40 50
% Under-�ve children underweight
Vuln
erab
ility
IR
XFJ
MV
Risks for child mortalityUnder Goal 4, a related indicator is that on child mortality. The risk pattern for this indicator is shown in Figure A-5. Cambodia in the top-right quadrant is again at significant risk. But so too is Pakistan which on this indicator is ‘off-track slow’. The Solomon Islands is also at high risk in this indicator: it has a high under-five mortality rate, has made slow progress, and is very vulnerable. A number of other Pacific island countries are also at risk on this indicator, though currently have lower rates, including Tonga, Samoa, Vanuatu and Fiji. Tajikistan’s position is between Solomon Islands and Papua New Guinea.
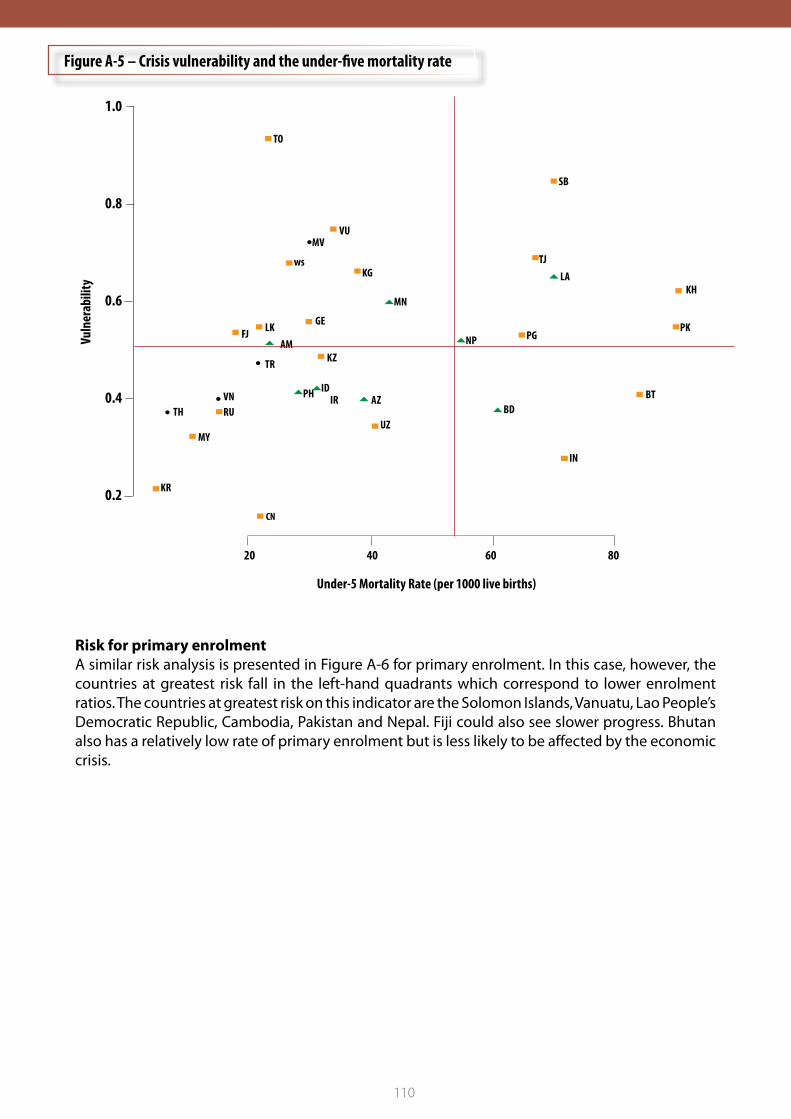
110
KR
PH
PG
CN
MN
GE
AMKZTR
RUTH
MY
VN
UZ
IN
BD
NPPK
KH
LK
TJKG LA
1.0
0.8
0.6
0.4
0.2
AZ
Under-5 Mortality Rate (per 1000 live births)
Vuln
erab
ility
IR
FJ
MV
20 40 60 80
ID
ws
VU
TO
SB
BT
Figure A-5 – Crisis vulnerability and the under-five mortality rate
Risk for primary enrolmentA similar risk analysis is presented in Figure A-6 for primary enrolment. In this case, however, the countries at greatest risk fall in the left-hand quadrants which correspond to lower enrolment ratios. The countries at greatest risk on this indicator are the Solomon Islands, Vanuatu, Lao People’s Democratic Republic, Cambodia, Pakistan and Nepal. Fiji could also see slower progress. Bhutan also has a relatively low rate of primary enrolment but is less likely to be affected by the economic crisis.
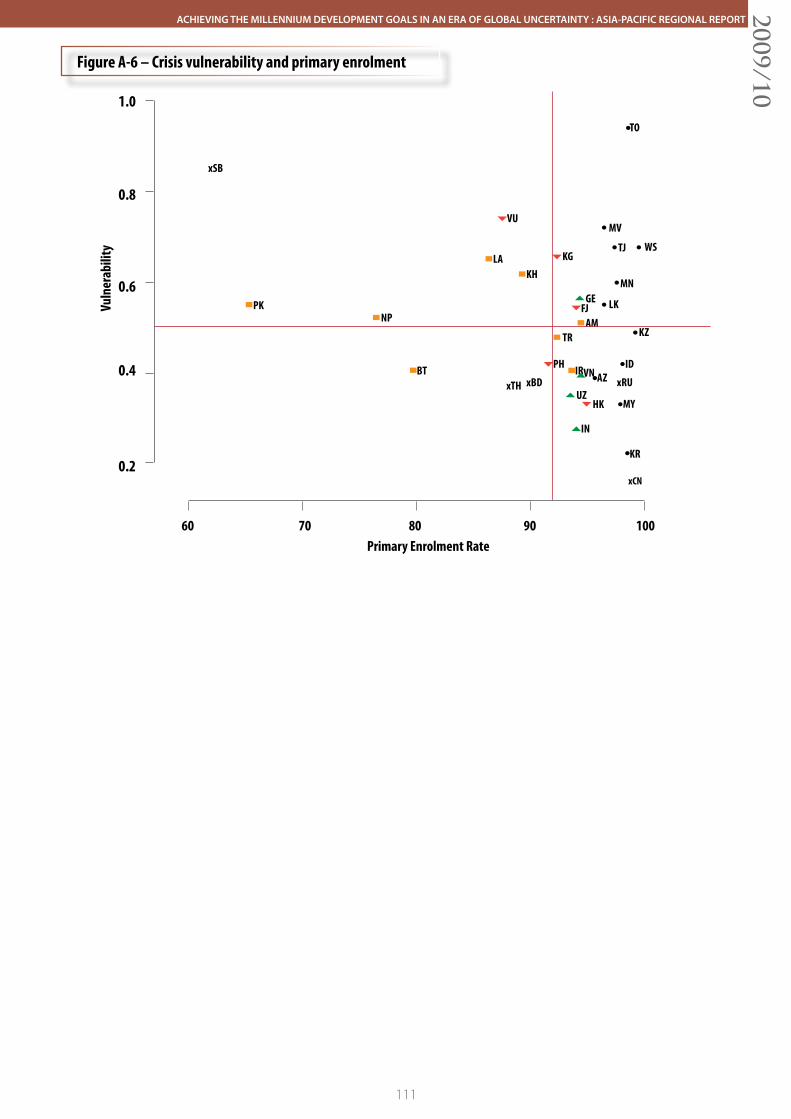
111
ACHIEVING THE MILLENNIUM DEVELOPMENT GOALS IN AN ERA OF GLOBAL UNCERTAINTY : ASIA-PACIFIC REGIONAL REPORT2009/10
Figure A-6 – Crisis vulnerability and primary enrolment
Primary Enrolment Rate
KR
PH
xCN
MNGE
AMKZTR
xRUxTH
MY
VN
UZ
IN
xBD
NPPK
KH
LK
TJKGLA
1.0
0.8
0.6
0.4
0.2
AZ
Vuln
erab
ility
IR
MV
60 70 80 90 100
ID
WS
VU
TO
xSB
BT
FJ
HK
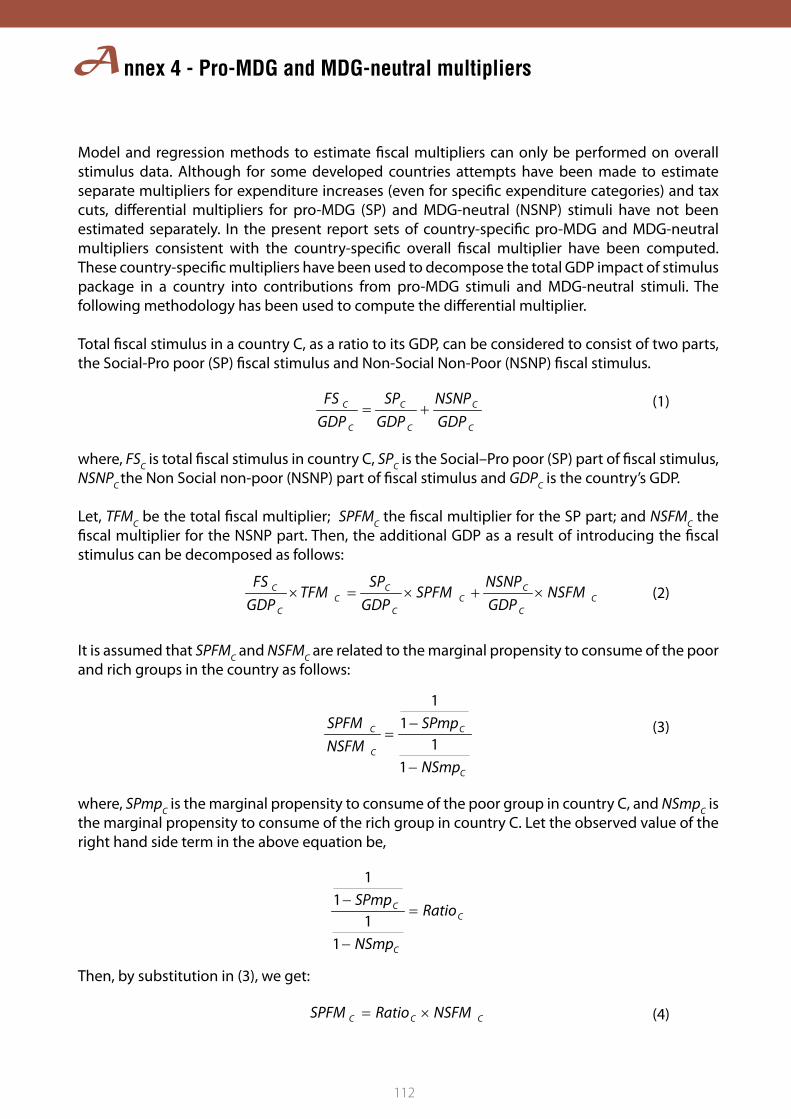
112
nnex 4 - Pro-MDG and MDG-neutral multipliersA
Model and regression methods to estimate fiscal multipliers can only be performed on overall stimulus data. Although for some developed countries attempts have been made to estimate separate multipliers for expenditure increases (even for specific expenditure categories) and tax cuts, differential multipliers for pro-MDG (SP) and MDG-neutral (NSNP) stimuli have not been estimated separately. In the present report sets of country-specific pro-MDG and MDG-neutral multipliers consistent with the country-specific overall fiscal multiplier have been computed. These country-specific multipliers have been used to decompose the total GDP impact of stimulus package in a country into contributions from pro-MDG stimuli and MDG-neutral stimuli. The following methodology has been used to compute the differential multiplier.
Total fiscal stimulus in a country C, as a ratio to its GDP, can be considered to consist of two parts, the Social-Pro poor (SP) fiscal stimulus and Non-Social Non-Poor (NSNP) fiscal stimulus.
(1)
where, FSC is total fiscal stimulus in country C, SPC is the Social–Pro poor (SP) part of fiscal stimulus, NSNPC the Non Social non-poor (NSNP) part of fiscal stimulus and GDPC is the country’s GDP.
Let, TFMC be the total fiscal multiplier; SPFMC the fiscal multiplier for the SP part; and NSFMC the fiscal multiplier for the NSNP part. Then, the additional GDP as a result of introducing the fiscal stimulus can be decomposed as follows:
(2)
It is assumed that SPFMC and NSFMC are related to the marginal propensity to consume of the poor and rich groups in the country as follows:
(3)
where, SPmpC is the marginal propensity to consume of the poor group in country C, and NSmpC is the marginal propensity to consume of the rich group in country C. Let the observed value of the right hand side term in the above equation be,
Then, by substitution in (3), we get:
(4)
C
C
C
C
C
C
GDPNSNP
GDPSP
GDPFS
C
C
CC
C
CC
C
C NSFMGDPNSNP
SPFMGDP
SPTFM
GDPFS
×××
C
C
C
C
NSmp
SPmpNSFMSPFM
−
−
11
11
C
C
C Ratio
NSmp
SPmp
−
−
11
11
CCC NSFMRatioSPFM ×
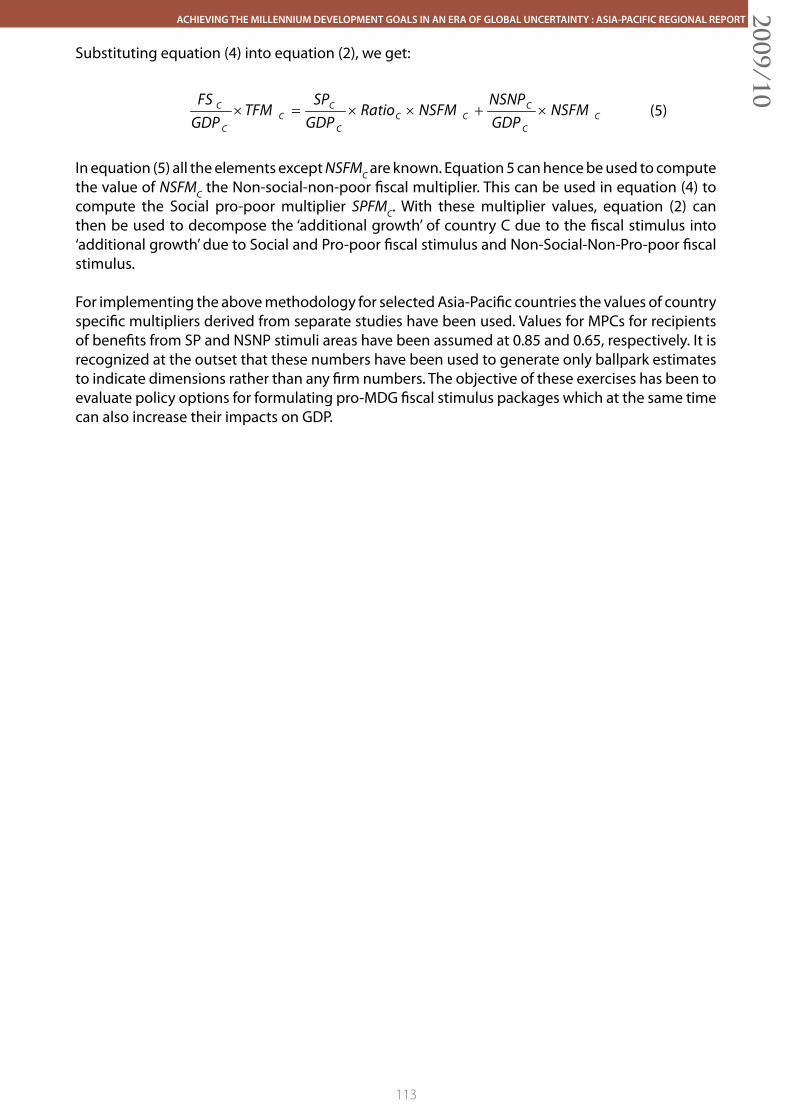
113
ACHIEVING THE MILLENNIUM DEVELOPMENT GOALS IN AN ERA OF GLOBAL UNCERTAINTY : ASIA-PACIFIC REGIONAL REPORT2009/10
Substituting equation (4) into equation (2), we get:
(5)
In equation (5) all the elements except NSFMC are known. Equation 5 can hence be used to compute the value of NSFMC the Non-social-non-poor fiscal multiplier. This can be used in equation (4) to compute the Social pro-poor multiplier SPFMC. With these multiplier values, equation (2) can then be used to decompose the ‘additional growth’ of country C due to the fiscal stimulus into ‘additional growth’ due to Social and Pro-poor fiscal stimulus and Non-Social-Non-Pro-poor fiscal stimulus.
For implementing the above methodology for selected Asia-Pacific countries the values of country specific multipliers derived from separate studies have been used. Values for MPCs for recipients of benefits from SP and NSNP stimuli areas have been assumed at 0.85 and 0.65, respectively. It is recognized at the outset that these numbers have been used to generate only ballpark estimates to indicate dimensions rather than any firm numbers. The objective of these exercises has been to evaluate policy options for formulating pro-MDG fiscal stimulus packages which at the same time can also increase their impacts on GDP.
C
C
CCC
C
CC
C
C NSFMGDPNSNP
NSFMRatioGDP
SPTFM
GDPFS
××××
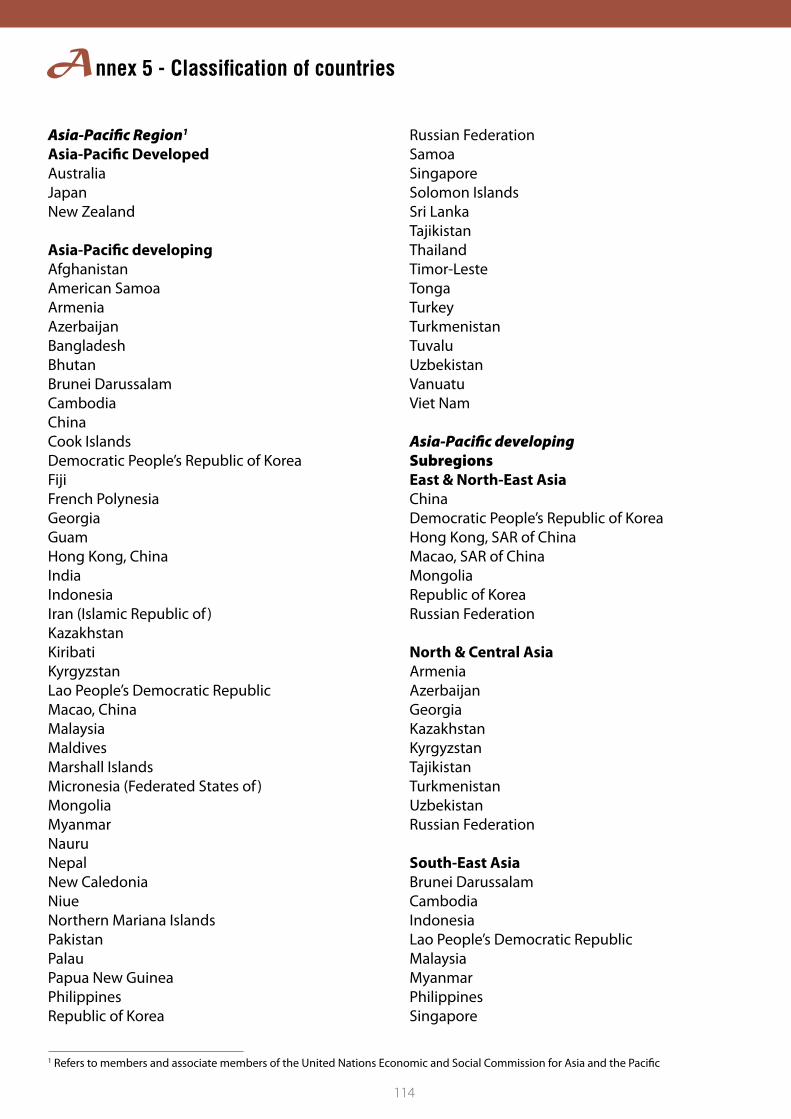
114
nnex 5 - Classification of countriesA
Asia-Pacific Region1 Asia-Pacific DevelopedAustraliaJapanNew Zealand
Asia-Pacific developingAfghanistanAmerican SamoaArmeniaAzerbaijanBangladeshBhutanBrunei DarussalamCambodiaChinaCook IslandsDemocratic People’s Republic of KoreaFijiFrench PolynesiaGeorgiaGuamHong Kong, ChinaIndiaIndonesiaIran (Islamic Republic of )KazakhstanKiribatiKyrgyzstanLao People’s Democratic RepublicMacao, ChinaMalaysiaMaldivesMarshall IslandsMicronesia (Federated States of )MongoliaMyanmarNauruNepalNew CaledoniaNiueNorthern Mariana IslandsPakistanPalauPapua New GuineaPhilippinesRepublic of Korea
Russian FederationSamoaSingaporeSolomon IslandsSri LankaTajikistanThailandTimor-LesteTongaTurkeyTurkmenistanTuvaluUzbekistanVanuatuViet Nam
Asia-Pacific developing SubregionsEast & North-East AsiaChinaDemocratic People’s Republic of KoreaHong Kong, SAR of ChinaMacao, SAR of ChinaMongoliaRepublic of KoreaRussian Federation
North & Central AsiaArmeniaAzerbaijanGeorgia KazakhstanKyrgyzstanTajikistanTurkmenistanUzbekistanRussian Federation
South-East AsiaBrunei DarussalamCambodiaIndonesiaLao People’s Democratic RepublicMalaysiaMyanmarPhilippinesSingapore
1 Refers to members and associate members of the United Nations Economic and Social Commission for Asia and the Pacific
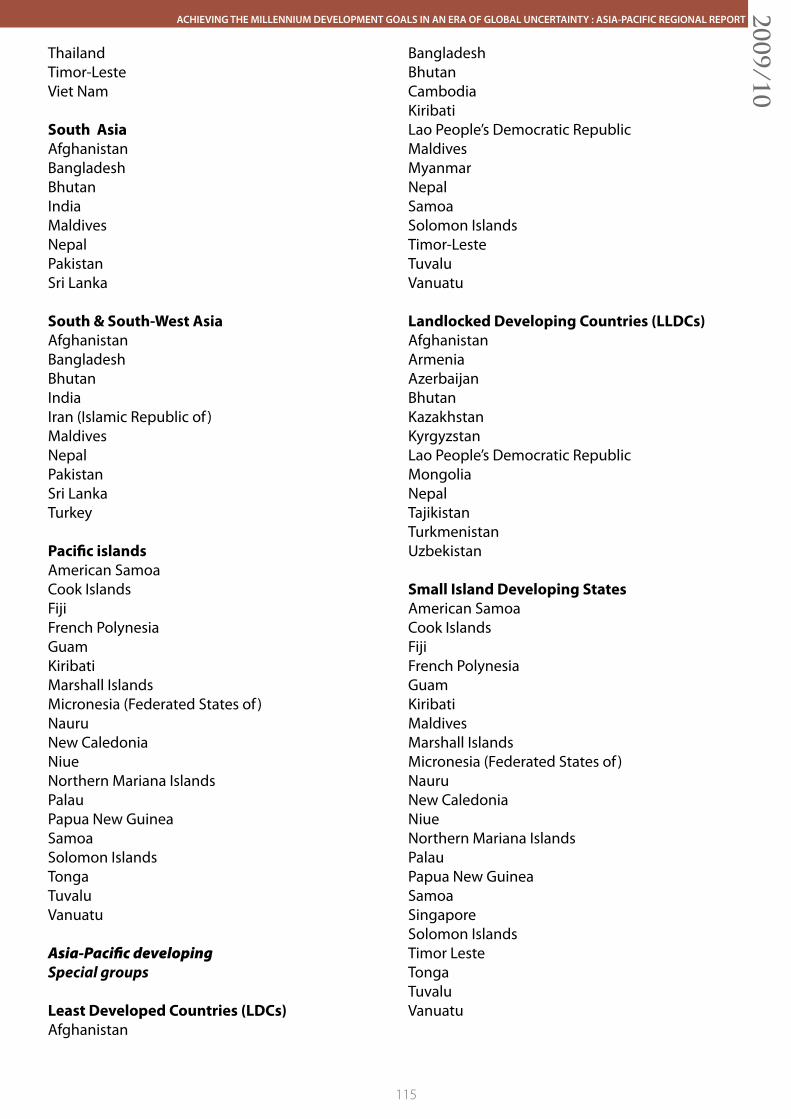
115
ACHIEVING THE MILLENNIUM DEVELOPMENT GOALS IN AN ERA OF GLOBAL UNCERTAINTY : ASIA-PACIFIC REGIONAL REPORT2009/10
ThailandTimor-LesteViet Nam
South AsiaAfghanistanBangladeshBhutanIndiaMaldivesNepalPakistanSri Lanka
South & South-West Asia AfghanistanBangladeshBhutanIndiaIran (Islamic Republic of )MaldivesNepalPakistanSri LankaTurkey
Pacific islandsAmerican SamoaCook IslandsFijiFrench PolynesiaGuamKiribatiMarshall IslandsMicronesia (Federated States of )NauruNew CaledoniaNiueNorthern Mariana IslandsPalauPapua New GuineaSamoaSolomon IslandsTongaTuvaluVanuatu
Asia-Pacific developing Special groups
Least Developed Countries (LDCs)Afghanistan
BangladeshBhutanCambodiaKiribatiLao People’s Democratic RepublicMaldivesMyanmarNepalSamoaSolomon IslandsTimor-LesteTuvaluVanuatu
Landlocked Developing Countries (LLDCs)AfghanistanArmeniaAzerbaijanBhutanKazakhstanKyrgyzstanLao People’s Democratic RepublicMongoliaNepalTajikistanTurkmenistanUzbekistan
Small Island Developing States American SamoaCook IslandsFijiFrench PolynesiaGuamKiribatiMaldivesMarshall IslandsMicronesia (Federated States of )NauruNew CaledoniaNiueNorthern Mariana IslandsPalau Papua New GuineaSamoaSingaporeSolomon IslandsTimor LesteTongaTuvalu Vanuatu
116
AF AfghanistanAM ArmeniaAS American SamoaAU AustraliaAZ AzerbaijanBD BangladeshBN Brunei DarussalamBT BhutanCK Cook IslandsCN ChinaFJ FijiFM Federate States of MicronesiaGE GeorgiaGU GuamHK Hong Kong, SAR ChinaID IndonesiaIN IndiaIR Iran (Islamic Republic of )JP JapanKG KyrgyzstanKH CambodiaKI KiribatiKP Democratic People’s Republic of KoreaKR Repbulic of KoreaKZ KazakhstanLA Lao People’s Democratic RepublicLK Sri LankaMH Marshall IslandsMM MyanmarMN MongoliaMO Macao, SAR ChinaMP Northern Mariana IslandsMV MaldivesMY MalaysiaNC New CaledoniaNP NepalNR NauruNU NiueNZ New ZealandPF French PolynesiaPG Papua New GuineaPH PhilippinesPK PakistanPW PalauRU Russian FederationSB Solomon Islands
SG SingaporeTH ThailandTJ TajikistanTL Timor LesteTM TurkmenistanTO TongaTR TurkeyTV TuvaluUZ UzbekistanVN Viet NamVU VanuatuWS Samoa
ey to country codesK
Printed in BangkokApril 2008 – 2,110
United Nations publicationSales No. E.08.II.F.15Copyright © United Nations 2008ISBN: 978-92-1-120547-3ST/ESCAP/2501
Printed in BangkokFebruary 2010
United Nations publication Sales No.: E.10.II.F.10 Copyright © United Nations 2010ISBN: 978-92-1-120604-3
9 789211 206043
52500
www.unescap.org www.adb.org www.undp.org