achieving scale and sustainability in a social enterprise at the base
TRANSCRIPT

1
Achieving Scale and Sustainability in a Social Enterprise at the Base of the Pyramid – Case of
Hapinoy, Philippines
Markus Dietrich 2009
School of Community Economic Development Southern New Hampshire University
Submitted in Partial Fulfillment of Requirements for the Masters of Science in Community Economic Development
Approved by Professor Puneetha Palakurthi

2
ACKNOWLEDGEMENTS
To my parents Karin and Johann Dietrich

3
TABLE OF CONTENTS
i. Abstract.......................................................................................................................... 6
ii. List of Tables ................................................................................................................. 7
iii. List of Figures................................................................................................................ 8
iv. List of Symbols, Abbreviations and Nomenclatura....................................................... 9
A THOUGHT ................................................................................................................... 10
FOREWORD .................................................................................................................... 11
1. INTRODUCTION ........................................................................................................ 12
2. DEVELOPMENT OF BASE OF THE PYRAMID AND RELATED CONCEPTS... 13
2.1 Emergence of the original BoP Concept................................................................. 13
2.2 Criticism of the BoP concept .................................................................................. 23
2.3 Development of the new BoP Concept................................................................... 24
2.4 Social Entrepreneurship .......................................................................................... 29
2.5 Microfranchsising ................................................................................................... 30
3. BOP CONSUMER BEHAVIOR AND THE BOP RETAIL MARKET...................... 32
4. THE PHILIPPINE RETAIL MARKET ....................................................................... 37
5. THE HAPINOY PROGRAM....................................................................................... 41
5.1 Microventures Inc. (MVI)....................................................................................... 42
5.2 FMCG Manufacturer .............................................................................................. 44
5.3 Smart Communications Inc (Smart) ....................................................................... 45
5.4 CARDS Business Development Services Inc (CARD BDS) ................................. 47
6. ACTION RESEARCH PROJECT................................................................................ 49
6.1 Familiarization in the Field and with CARD BDS and MVI.................................. 50
6.1.1 Hapinoy Stores: Recruitment and Value Proposition ...................................... 50
6.1.2 Community Stores: Recruitment and Value Proposition................................. 53
6.2 Field Action Research............................................................................................. 55
6.2.1 Store Organization ........................................................................................... 55
6.2.2 Sales Analysis .................................................................................................. 55
6.2.3 Merchandise Categories................................................................................... 58

4
6.2.4 Reasons for Joining the Hapinoy Program ...................................................... 59
6.2.5 Problems with the Hapinoy Program............................................................... 59
6.2.6 Evaluation of Hapinoy Program November 2008 ........................................... 60
6.3 Strategy Development, Implementation and Monitoring with the Balanced
Scorecard....................................................................................................................... 64
6.3.1 Strategy Development...................................................................................... 64
6.3.2 Strategy Implementation.................................................................................. 67
6.3.3 Strategy Monitoring ......................................................................................... 69
6.3.4 Evaluating the BSC Project ............................................................................. 71
6.4 Developing Marketing Methodology and Management ......................................... 71
6.4.1 BoP Consumer Behavior Study ....................................................................... 72
6.4.2 Sari-Sari Store Survey...................................................................................... 79
6.4.3 Application of Research Results in Hapinoy ................................................... 81
6.5 Implementation of POS system .............................................................................. 83
6.6 Other Strategic Projects .......................................................................................... 85
6.6.1 Learning Perspective........................................................................................ 86
6.6.2 Process Perspective.......................................................................................... 86
6.6.3 Customer Perspective....................................................................................... 93
6.7 Evaluation ............................................................................................................. 103
6.7.1 Economic Evaluation of CS........................................................................... 103
6.7.2 Individual Evaluation of CS........................................................................... 107
6.7.3 Evaluation of CS - Summary ......................................................................... 111
6.7.4 Assessment by CARD BDS and MVI ........................................................... 112
6.7.5 Evaluation of Hapinoy Program August 2009............................................... 114
7. LESSONS LEARNT .................................................................................................. 118
7.1 MFI’s Limitations and Chances as a Shared Channel at the BoP......................... 118
7.2 Benefit of Balanced Scorecard to the Social Enterprise ....................................... 118
7.3 Involving Corporations in Social Enterprise Programs ........................................ 119
7.4 Client Loyalty to Programs................................................................................... 119
7.5 The Importance of a Learning and Innovation Culture in Social Enterprises ...... 119
7.6 BoP as a Consumer ............................................................................................... 120
5
7.7 The Importance of the Co-Creation Process......................................................... 120
7.8 The Value of Technology at the BoP.................................................................... 120
7.9. Path towards Formality ........................................................................................ 121
7.10 Impact as Key Parameter for Evaluating Success............................................... 121
7.11 Strength and Weaknesses of CED, Representing the Development Community, at
the BoP........................................................................................................................ 121
8. RECOMMENDATIONS............................................................................................ 122
8.1 Microventures Inc. ................................................................................................ 122
8.2 CARD Business Development Services Inc ......................................................... 122
8.3 CED and the Development Community ............................................................... 123
8.4 For Profit Social Enterprises................................................................................. 123
8.5 Corporations.......................................................................................................... 123
8.6 Government........................................................................................................... 124
8.7 Microfinance Institutions ...................................................................................... 124
8.8 Development of BoP Theory and Practise............................................................ 124
9. EPILOGUE................................................................................................................. 126
10. REFERENCES ......................................................................................................... 128
11. APPENDICES .......................................................................................................... 138

6
i. Abstract
Achieving scale and sustainability is a prerequisite for poverty alleviation by
market based social enterprises at the Base of the Pyramid. The report shows
that reaching these goals is dependent upon five key elements. Firstly, a
coherent co-creation process leads to the development of the right products,
services and processes. Secondly, innovative partnerships with microfinance
institutions enable outreach and financing. Thirdly, partnerships with private
corporations engaged at the BoP add another income stream. Fourthly, the
implementation of a Balanced Scorecard leads to professional strategy
development, implementation and monitoring on an organizational level.
The last element is an instituted organizational learning capability
questioning assumptions about mindsets and learning from the failures. The
report recommends to add BoP as distributor as a distinct group to the BoP
theory development and encourages further research into BoP consumer
behavior and psychology and the BoP retail sector.
Keywords: Base of the Pyramid, Shared Channel, Retail, Balanced
Scorecard, Social Enterprise, BoP as Distributor

7
ii. List of Tables
Table 1: The Difference between the First and Second Generation BoP Concept, Adapted
from Simanis & Hart (2008) and Hart (2007)
Table 2: Household Spending Pattern in Global BoP
Table 3: Household Spending Pattern in Global and Philippine BoP
Table 4: Segmentation of Philippine Retail Market (AC Nielsen)
Table 5: The Original Hapinoy Loan Package
Table 6: Action Research Timetable
Table 7: Average Income Statement of a CS in October 2008
Table 8: Merchandise Category Analysis
Table 9: Merchandise Category Analysis with Project Cobra
Table 10: SWOT Analysis Hapinoy as of November 2008
Table 11: Balanced Scorecard Development - Marketing
Table 12: Balanced Scorecard Development - Operations
Table 13: Household Spending Pattern in Global, Philippine and Community BoP
Table 14: Purchase Pattern in Consumption Goods Adapted from D’Andrea et al (2006)
Table 15: Brand Recollection at the BoP
Table 16: Brand Recognition at the BoP
Table 17: Original Hapinoy Supply Chain Model
Table 18: 2nd Hapinoy Supply Chain Model
Table 19: 3rd and Current Hapinoy Supply Chain Model as of August 2009
Table 20: Doing Business 2009 – Table on Ease of Doing Business
Table 21: Average Income Statement of a CS before Joining Hapinoy
Table 22: Average Income Statement of a CS in October 2008
Table 23: Average Income Statement of a CS in July 2009
Table 24: SWOT Analysis Hapinoy as of August 2009

8
iii. List of Figures
Figure 1: Prahalad and Hart (2002) – The Original Pyramid
Figure 2: Prahalad and Hart (2002) – The Original Business Models
Figure 3: Prahalad and Hammond’s Pyramid (2002)
Figure 4: Hart and Christensen’s Pyramid (2002)
Figure 5: Prahalad: From Pyramid to Diamond
Figure 6: Business Models at the BoP according to Budinich (2005)
Figure 7: Next 4 Billion Report’s Pyramid
Figure 8: The Base of the Pyramid Protocol 2nd edition – The In-Field Process by Simanis
& Hart (2008)
Figure 9: Household Spending Pattern in the Philippines (NSO)
Figure 10: Logo and Map with Location of Hapinoy Community Stores (Wikipedia,
Googlemaps)
Figure 11: MVI’s BoP Pyramid
Figure 12: Hapinoy’s Original Business Model
Figure 13: Existing FMCG Supply Chain and Hapinoy Supply Chain
Figure 14: Existing Smart e-load Supply Chain and Hapinoy Supply Chain
Figure 15: Workflow of Hapinoy Store Recruitment 2007/2008
Figure 16: Workflow of Hapinoy Store Recruitment 2008/2009
Figure 17: Generic Balanced Scorecard
Figure 17 Social Enterprise Balanced Scorecard – Social Enterprise London (2004)
Figure 19: Hapinoy Balanced Scorecard 2009
Figure 20: Excerpt from Hapinoy Community Store Audit Form
Figure 21: BoP as Distributor
Figure 22: Theory U by Otto Scharmer (2009)

9
iv. List of Symbols, Abbreviations and Nomenclatura
AO – MFI Account Officer
BoP – Base of the Pyramid
CARD MRI – Center for Agricultural and Rural Development Mutually Reinforcing
Institutions
CED – Community Economic Development
CS – Hapinoy Community Store
CSR – Corporate Social Responsibility
FGD – Focus Group Discussion
HS – Hapinoy Sari-Sari Store
ICT – Information and Communication Technology
IFC – International Finance Corporation – World Bank Group
MFI – Microfinance Institution
MIS – Management Information System
MNC – Multinational Corporation
MVI – Microventures Incorporated
PRA – Participatory Rapid Appraisal
RM – MFI Regional Manager
SKU – Stock Keeping Unit
SD – MVI Store Doctor
TGC – Transaction Governance Capacity
UM – MFI Unit or Branch Manager
WRI – World Resource Institute
Nanay - literally “mother”, used to address Sari-Sari store owner
Sari-Sari store - literally “variety” store, micro to small neighborhood store
Tita - literally “aunt”, used to respectful addressing a woman
The value of Philippine Peso (P) is 48P/1USD, as of 02.08.2009 www.oanda.com

10
A THOUGHT
An Open Letter to the "Development Posse"
“The people we purport to serve - the unserved - really don't want our pithy explanations.
Actually they don't even want our projects or programmers. What they want, folks, is
choice. That's job one. Not inputs, outputs, outcomes, measures, strategy, tactics or cost-
benefits. Our job is to be less sincere, less certain, more agnostic and do those few things
that eliminate barriers to choice. We should be avoiding the clichés (Does it scale? Hell,
let's first ask: does it work?). Let's share stories of what works at creating choice for the
poor who employ us.”
Philip LaRocco has over thirty years of international and U.S. development experience.
He is the co-founder of E+Co, the leading practitioner of the enterprise-centered model of
investing in energy enterprises in developing countries. (LaRocco, 2009)

11
FOREWORD
I first became aware of the next 4 billion on a journey to India at the age of 40. Although
I had traveled widely, it only became apparent to me then, that all my previous travels
had been in the so called “developed” world. As I transitioned from an entrepreneurial
and managerial career in retail IT in Europe to something, not yet identified, new, I came
across an article about Mohammad Yunnus’ microfinance organization. The idea of
giving small loans to micro entrepreneurs to achieve development struck a chord inside
me that I decided to follow. To learn more about it, I went to Southern New Hampshire
University’s Microenterprise Development Institute. It provided me with a deeper insight
into the microfinance industry and its challenge of acting between the poles of
“unsustainable” charity and “usury” market based solutions. As I found myself in the
discussions mostly on the latter side, I was advised to read “Fortune at the Bottom of the
Pyramid” and instantly I knew where my interest was: at the BoP. Within two day I also
knew where I would do it, as Bill Maddocks announced the start of the Master degree in
International Community Economic Development in the new South East Asia Center in
the Philippines and Dr. Aris Alip, founder of CARD MRI, spoke the next day about a
new retail operation that he has started in the Philippines. Combining my expertise in
retail IT with my new vision of doing well by doing good at the BoP, I started the course
and the project “Achieving Scale and Sustainability in a Social Enterprise at the Base of
the Pyramid – Case of Hapinoy, Philippines.”

12
1. INTRODUCTION
The term “Base of the Pyramid” is, first and foremost, a socio-economic description of
the bottom of the income distribution pyramid. Secondly, it has become the term for the
business strategy of providing products and services to the people at the base of the
pyramid.
C.K. Prahalad (2005) describes it as “The distribution of wealth and the capacity to
generate income in the world can be captured in the form of an economic pyramid. More
than 4 billion people live at the BoP on less than $2 per day. They are the subject
matter…”
The concept derives a lot of its tension and creative energy from the fact that it is located
on the convergence point of two previously distant, even antagonistic, sectors. The term
“base of the pyramid” in the business sense, and in this meaning the term will be used in
this project, symbolizes two paradigm shifts for the development community: First, the
view of the poor as customer/producer and not as beneficiary. Second, a solution to
poverty alleviation lies in market based solutions and not in government aid. But it also
symbolizes a paradigm shift for the business sector in regarding the BoP as a market
opportunity and not as recipient of philanthropic corporate social responsibility
intervention.
The report traces the development of the BoP concept from the 1990s until today and
then focuses on a specific BoP market, the retail sector. Moving from a global overview
to a local market, the Philippine retail market and a country-specific BoP retail operation,
the Sari-Sari store, is analyzed and thereby the context for the Hapinoy program
established. The program and its development towards scale and sustainability from
October 2008 until August 2009 is topic of the action research part of the paper. The
report closes with the lessons learned and recommendations for the program and further
development of BoP theory.
13
2. DEVELOPMENT OF BASE OF THE PYRAMID AND RELATED CONCEPTS
The development of the Base of the Pyramid concept can be traced back to the late 1990s
and be divided into three distinct phases:
1. Emergence of the original BoP concept
2. Criticism of the BoP concept
3. Development of the new BoP concept
2.1 Emergence of the original BoP Concept
CK Prahalad and Stuart Hart (1999) coined the term “Bottom of the Pyramid” for the first
time in a working paper, having started to work on the concept in 1998. It already laid out
some of the basic premises of the concept in so far as the “4 billion poor that are at the
bottom of the economic pyramid” were described as an “opportunity” for “multinational
firms”. It was however only three years later that articles were published and the concept
publicized to a larger audience. During those three years, several events and publications
focused on poverty and private sector solutions to poverty.
A major milestone was the United Nations Millennium Declaration, adopted in
September 2000. According to the Resolution 55/2 (2000) the signing countries “will
spare no effort to free our fellow men, women and children from the abject and
dehumanizing conditions of extreme poverty, to which more than a billion of them are
currently subjected”. One of the means to achieve this goal is “to develop strong
partnerships with the private sector and with civil society organizations in pursuit of
development and poverty eradication.” The resolution was operationalized in eight
Millennium Development Goals (MDG) and eighteen targets. Goal number one is to
eradicate extreme poverty and hunger and the first target according to the MDG Report
(2009) is to “halve, between 1990 and 2015, the proportion of people whose income is
less than $1 a day”. The partnership of the United Nations with the business sector was
formalized in the United Nations Global Compact in 2000 aiming to “catalyze actions in

14
support of broader UN goals, including the Millennium Development Goals (MDGs)”
according to its website.
Development scholars who challenged traditional approaches to development at that time
were Hernando de Soto and Amartya Sen. De Soto (2000) highlights the need to value
and formalize the assets of the poor and enable them to be used as collateral for credit, a
pillar of building a market economy, and moving the poor thereby from the informal to
the formal economy. Sen (1999) broadens the focus of development from increase in
income to capability building and freedom as the goals of development. Both included
private sector as playing a role in development and poverty eradication.
2002 can be described as the birth year of the BoP concept. In “The Fortune at the
Bottom of the Pyramid”, CK Prahalad & Stuart L. Hart (2002) laid down the foundation
of the concept by stating that “MNC investment at the “bottom of the pyramid” means
lifting billions of people out of poverty” and “represents the biggest potential market
opportunity in the history of commerce ”. The paradigm shift of the BoP concept for the
business as well as the development community consists of viewing the poor no longer as
beneficiaries but as customers. Prahalad and Hart sized the opportunity with “4 billion
people in Tier 4” whose “annual per capita income is less than $1.500” making it “a
multitrillion market”.
Figure 1: Prahalad and Hart (2002) – The Original Pyramid
The business model for the BoP proposed by Prahalad and Hart consists of creating
buying power, shaping aspirations and tailoring local solutions. Prahalad and Hart focus

15
on MNCs as prime actors in the model because “few local entrepreneurs have the
managerial or technological resources”. MNCs can also utilize “their unique global
knowledge base”, “are best positioned to unite the range of actors required” and “have
the capacity to transfer innovation up-market”.
Figure 2: Prahalad and Hart (2002) – The Original Business Models
Prahalad and Hart note that a change in management focus is needed as “margins are
likely to be low but unit sales can be extremely high”. This premise turned out to be one
of the main business models in the BoP context.
As a “pioneering” firm engaged in the BoP, the authors mention Hindustan Lever Ltd
(HLL), a subsidiary of Unilever, which changed its products and strategy radically to
serve the BoP sector. HLL reformulated their detergent according to the needs of the BoP
consumer, established a new distribution network to reach these consumers and lowered
the price substantially. As Vindi Banga, Chairman of HLL, describes in a response to
Prahalad (2002) “the answer was a single-use sachets available at one rupee per unit”, the
start of the so-called sachet economy in the 1990s.

16
Prahalad and Hammond (2002) further elaborated the BoP concept and changed the
income threshold of the 4 billion people from less than $1.500 to less than $2.000.
Figure 3: Prahalad and Hammond’s Pyramid (2002)
They stress that “businesses can gain three important advantages by serving the poor – a
new source of revenue growth, greater efficiency and access to innovation”. Strategies to
serves this market must be based on creativity and change whereas the “biggest change
has to come from the attitudes and practices of executives” next to internal “structural
changes” and the involvement of “external partners”. Prahalad and Hammond also point
to the “high cost economy of the poor”, later called the “BoP penalty” by WRI (2007),
which constitutes an opportunity for larger, more efficient, companies, to serve the
market at profitable margins.
In an article focusing on economic development in India, CK Prahalad (2002)
foreshadows the emergence of India as the “source for innovation” in the BoP sector. He
also stresses the importance of reaching scale as one of four basic conditions for BoP
solutions, next to “price-performance relationship”, “environmentally sustainable
models” and “harmonizing the most advanced technologies and local conditions”. Further
case studies are introduced, such as Aravind Hospitals, which had developed a “unique

17
system of eye-care” by using “paying patients from the top tier of the pyramid to
subsidize free patients in the middle and bottom tier”.
Stuart Hart and Clayton Christensen (2002) change the terminology from bottom to base
of the pyramid, under which the BoP concept is nowadays known. They apply the theory
of disruptive innovations, introduced by Christensen (1997), to the BoP and state that
“disruptive innovations at the base of the pyramid … have much greater potential than
those that begin and end in developed markets” and are a “chance for sustained corporate
growth while also helping to lift the poor out of poverty”. As an example of disruptive
innovation, they mention Grameen Telecom’s Village Phone venture, which brings
wireless phone services profitably to the rural poor in Bangladesh
Figure 4: Hart and Christensen’s Pyramid (2002)
The Base of the Pyramid concept gained widespread public awareness with the
publication of the book “The Fortune at the Bottom of the Pyramid” by C.K. Prahalad
(2005). In the book, Prahalad expanded on the concept of the original article building
upon new best practice studies in BoP strategy.

18
Prahalad argues that due to the “the dominant logic”, which is the shared and firmly
entrenched belief system in companies, false assumptions exist about the poor which
prohibit companies from seeing them as a market opportunity. These include that the
poor have no money, cannot be accessed profitably, do not value brands, are not
connected to information networks and do not accept new technology
Based on the case studies, those assumptions are refuted. The BoP framework is based on
new assumptions about the poor which include that they represent a huge and growing
market providing corporations with new growth and innovation opportunities. To access
this market firms have to go through a profound change in business models, innovation
practice, products and services.
Innovation is at the core of the development of the new business models for the BoP and
twelve principles are identified, of which the critical ones are the focus on price
performance, scalability, ecological sustainability and product, process and
communication innovation based on profound understanding of the realities of the new
consumers.
According to Prahalad, the basic BoP model focuses on “small unit packages, low margin
per unit, high volume, and high return on capital employed”.
To make private sector involvement feasible the context has to be developed, a process
which Prahalad terms “transaction governance capacity” TGC and defines as the
“capacity of a society to guarantee transparency in the process of economic transactions
and the ability to enforce commercial contracts.
The BoP theory of change according to Prahalad starts with the old premise of poverty
alleviation through subsidies and aid which is replaced by the new basic premise of BoP
as a global market and poverty alleviation as a market development task. Together with
the premise of BoP as a source of innovation, and transaction governance capacity as the
foundation for private sector development, the outcome at the Bottom of Pyramid is a

19
social and economic transformation and ultimately “the morphing of the pyramid into a
diamond.”
Figure 5: Prahalad: From Pyramid to Diamond
Case studies have played an important in developing BoP theory. This descriptive
methodology is based on exemplary best practice and draws general conclusions from the
specific cases.
Cemex, one of the largest cement companies in the world, is based in Mexico. Their
Patrimonio Hoy program organizes low income households into groups and enables them
through savings via an MFI partner to build their houses. The Cemex case is mostly
known for its use of a six month management immersion program aiming at deeply
understanding the economics of house building at the BoP. The business model was
based on this experience and involved a whole eco-system as partners.
Jaipur Foot is an example for radically altering the price performance of a product as it
produces foot prosthesis at a cost of $30 compared to $8,000 in the US through
innovative design and delivery mechanism based on the needs of the BoP.
ITC e-choupals is an example of a BoP venture that re-engineered the value chain in
agriculture in India to the advantage of the small farmer and the procurer, ITC, through
the use of technology. Computers are installed in the villages where farmers can access

20
price information about their produce and communicate with ITC regarding the
procurement.
Also in 2005, the co-author of the original BoP article, Stuart L. Hart (2005), focuses in
his book “Capitalism at its crossroads” on “The unlimited business opportunities in
solving the World’s most difficult problems”. In 2007 the second edition was published
with the changed subtitle “Aligning Business, Earth and Humanity”. This new subtitle
underscores the changes that the BoP theory and practice underwent during the
intermittent years which will be described later in detail.
Hart and London (2005) introduced the concept of “native capabilities” which “assumes
that the critical knowledge for success lies beyond the firm’s boundaries” within the local
community. To achieve success at the BoP, the MNCs have to become “embedded” in
that ecosystem and “unlearning” existing practices, or in other words, to move away from
their dominant logic. Case studies that exemplify such an approach are Honey Care
Africa, which formed non-traditional partnerships with NGOs and the local community,
and has grown to become “the largest producer of high quality honey in East Africa.
Whereas Prahalad and Hart’s focus was on MNCs and innovation, the first framework
based on business models for market based strategies for the BoP was developed by
Valeria Budinich (2005) with an emphasis on Citizen Sector Organizations (CSO). The
framework was used for a Changemaker competition organized by Ashoka, a global
association of the social entrepreneurs, led by Bill Drayton. This framework stresses the
importance of the partnership of the business and the social sector in “Hybrid Value
Chains” (HVC), as CSOs have “more experience in delivering products and services to
low-income consumers and small producers”. Budinich identifies nine business models
based on case studies.

21
Figure 6: Business Models at the BoP according to Budinich (2005)
The new aspect in this matrix is the emergence of “community” as an important factor in
categorizing the business models, later embraced by the BoP Protocol 2.0 and the BoP
Impact Assessment Framework.
Many academics now joined and broadened substantially the discussion and a
“Conference on Global Poverty: Business Solutions and Approaches” was held at the
Harvard Business School in December 2005 with 120 academics and practitioners
attending. Rangan, Quelch, Herrero and Bartoin (2007) edited the conference papers
whose focus is on case study based analyses of understanding the poor, building the BoP
value chain with BoP consumers and producers, business models at the BoP and the role
of government and civil society.
Also in 2005 the Independent Advisory Body to UN Secretary General Kofi Annan
headed by Jeffrey Sachs released its report “Investing in Development: A Practical Plan

22
to Achieve the Millennium Development Goals”. Most of the report focuses on the public
sector as the driver of development and the private sector’s role is limited since
“enormous numbers of poor people simply cannot afford to pay even the lowest market
price” and that “services often need to be publicly financed“.
This argument was further developed by Jeffrey Sachs (2005). He argues that foreign aid
needs to be increased “to jump-start the process of capital accumulation, economic
growth, and rising household incomes”.
He thereby sparked an argument among development scholars. William Easterly (2006)
states that Sachs’ “intellectual solutions are less convincing”. He argues that foreign aid
and the idea of a “big plan” to end poverty is fundamentally flawed and indeed
responsible for the “second tragedy of the world’s poor.., the ineffective efforts by those
who care”. Among others, he sees an important role for commercial and social
enterprises as “private firms could provide services that reach the poor, provide funding
for poor entrepreneurs and train aid workers to think like Searchers for customer
satisfaction”. The notion that foreign aid and the aid agencies are actually harming the
developing countries has been voiced before by Hancock (1989) and is carried forward
by Moyo (2009) in her book “Dead Aid: Why Aid is Not Working and How There is a
Better Way for Africa.”
23
2.2 Criticism of the BoP concept
A growing unease with the original BoP concept reached its pinnacle 2007 with Aneel
Karnani’s sweeping critique. Karnani (2007a) states that the concept is “riddled with
fallacies… logically flawed and inconsistent with the evidence”. He also argues that the
market size is overestimated, as he calculates “the global market is less than $0.3 trillion”
and “unlikely to be very profitable”. Karnani continues his critique by stating that the
BoP concept is either a “harmless illusion or a dangerous delusion”. Instead of selling to
the poor he suggests that “the private sector can help alleviate poverty by focusing on the
poor as producers … and help create more employment opportunities”. Karnani (2007b)
also empirically examines the BoP proposition using HLL’s Fair and Lovely whitening
cream as an example of a BoP product that according to him is “doing well … but not
doing good” and has “negative implication for public welfare” by promoting socially
questionable products to the poor. In another paper, Karnani (2007c) stresses the
importance of the role of government as opposed to the private BoP sector in supplying
services such as water. The academic feud lasts until today as Karnani (2009) continues
his critical assessment of the BoP proposition by arguing that the market size is less than
1/10 of what the proponents of BoP claim. He also sees a need for consumer protection
for the poor as more and more consumption products are aimed at this market and the
“mounting evidence suggests that just being poor hinders people’s ability to make good
decisions”. He calls for “more government” that “helps create and grow private
enterprises … and protect poor consumers”. Allen Hammond (2009) calls the critique
“just silly - armchair theorizing” and argues that the poor are making good choices by
considering products and services from the private sector which are not and will not for a
foreseeable future be provided by the government.
Landrum (2007) reviews the criticism leveled against the BoP concept by Bendell,
Crabtree, Hopkins, Jenkins, Jose, Karnani, Rost and Ydren, Walsh, Kress and Beyerchen
and groups them into four blocks: Firstly, the widely differing estimates of the BoP
market size, which question the commercial viability of venturing into the BoP.
Secondly, the missing evidence of MNCs actually engaging in the BoP, as most case

24
studies describe small to medium sized companies or NGOs. Thirdly, marketing products
to the poor is considered as ethically questionable as it raises questions about artificial
need creation, lack of consumer protection and negative environmental implications of
single serve sachet products. Lastly, the link between BoP strategies and poverty
eradication cannot be proven by the case studies. She concludes that “there is no evidence
in the past 50 years to support” the claim that corporate strategies for emerging markets
will eradicate poverty.
2.3 Development of the new BoP Concept
The proponents of the BoP concept reacted in different ways to the critics.
CK Prahalad (2006) refutes Karnani’s arguments by highlighting that the BoP concept
includes BoP consumers as well as BoP producers. He also stresses that a key to
understand the BoP proposition is to focus on the “capacity to consume” which is
enhanced through income generation or savings on existing but expensive products and
services.
Allen Hammond (2006) reacts to the first criticism block regarding the market size by
pointing to the forthcoming study of the World Resource Institute which will clarify the
base data. In 2007 then IFC and WRI published the groundbreaking “The Next 4 Billion”
report, authored by Allen Hammond, William Kremer, Robert Katz, Julia Tran and
Courtland Walker. This report sizes and segments the BoP market for the first time
empirically, based on national household survey data. It confirms Prahalad’s earlier
estimate that “Four billion low income consumers… constitute the base of the economic
pyramid” and that “significant opportunities for market based approaches” exist with a
“total household income of $5 trillion”. The report further details the spending power of
the BoP according to market sectors, such as water and housing on a global, regional and
national scale. Furthermore, case studies were evaluated and grouped around four BoP
business models: Focusing on the BoP, localizing value creation, enabling access and
unconventional partnering.

25
Figure 7: Next 4 Billion Report’s Pyramid
Based on his experience in the BoP Learning Labs, started in 2002, Stuart L. Hart (2007)
accepts the third and forth criticism block that the “selling to the poor” strategy had only
very limited success among the MNCs and is not leading to poverty alleviation. He
proposes the development of a new generation Base of the Pyramid concept, which he
calls “second generation” or “BoP 2.0”, based on the notion of “Creating Mutual Value”
as opposed to “Selling to the Poor”. These ideas have become the base of the further
development of the BoP concept and lead to the BoP Protocol 2.0 in 2008 by Simanis &
Hart (2008), a comprehensive manual for companies to develop BoP strategies.
Table 1: The Difference between the First and Second Generation BoP Concept, adapted from Simanis & Hart (2008) and Hart (2007) BoP 1.0 BoP 2.0 BoP as a consumer BoP as a business partner Deep listening Deep dialogue Reduced price point Expand imagination Redesigning packaging Marry capabilities and build shared
commitment Low cost production Build local capacity Extended distribution Embedded processes Arms length relationship via NGOs Direct, personal relationship facilitated by
NGOs Ecosystem of local partners
At the core of the BoP protocol 2.0 is the logic of co-creation, a concept originally
developed by Prahalad and Ramaswamy (2004) for MNC innovation strategies.

26
Figure 8: The Base of the Pyramid Protocol 2nd edition – The In-Field Process by Simanis
& Hart (2008)
The BoP Protocol 2.0 divides the development of a BoP venture into five phases: Pre-
field, in-field – opening up, in-field – building the ecosystem, in-field enterprise creation
and scaling out. In the process it draws on many tools and strategies used by the
development community, such as participatory rural appraisal, quick ethnography and
emphasis on community. It thereby represents a constructive and integrative approach to
BoP strategy as the convergence point of business and development sector.
Kanachar and Halme (2007) add to the BoP discussion a European, “human-centered”
product and service design perspective. They argue that designers have a key role to play
as an integrator in the BoP concept. Kanachar and Halme (2008) also edited a collection
of BoP research papers focusing on inclusive markets and BoP strategies, local
enterprises and MNCs at the BoP and sustainability challenges and solutions.
The second criticism block, MNCs are not engaging successfully in the BoP, is
confirmed by the latest important report “Emerging Markets, Emerging Models – market
based solutions to the challenges of global poverty” by the Monitor Group (2009). It is
rather NGOs and local and national companies which are successfully engaged at the

27
BoP. The report formulates a new assumption in the theory of change: Only when the
BoP venture reaches scale and sustainability, it has a positive poverty alleviation effect.
Therefore the two key determinants of success are reaching scale and sustainability.
Drawing on 270 cases studies, the report defines seven business models, four for BoP as
consumer and three for BoP as producer which have exhibited success in terms of
sustainability and scale.
Business models for BoP as consumer
1. Pay-Per-Use
This model aims to lower the cost of products and services by focusing on paying
for the use rather than the ownership of a product and service. It also matches the
irregular cash flow income at the BoP with the spending pattern on products and
services.
2. No Frills Service
No frills service strips the service to its core, while still maintaining quality, to
reach a very low price point. Profit is derived from high volume or asset
utilization.
3. Paraskilling
Enhances the No Frills Service model with reengineering and disaggregating of
processes to allow lesser skilled, and less expensive, staff to take over tasks and
thereby reduce cost.
4. Shared channels
In this model, existing distribution channels are used to carry products for the
BoP. This model is most closely related to the Hapinoy program and its relevance
will be discussed later.

28
Business models BoP as producer
5. Contract production
In the contract production business model the contractor organizes the whole
supply chain from the small scale farmer including the assured purchase of the
produce, farming inputs, training, credit and transportation.
6. Deep procurement
The deep procurement model circumvents the middlemen and connects the
operator directly to small farmers without assuring purchases of the produce at a
fixed price as in the contract production model.
7. Demand-led Training
The demand-led training model uses the temp agency model to place employees
in the informal and formal sector while offering qualification opportunities for the
workforce.
Ted London (2009) developed an impact assessment framework which offers BoP
ventures a “systematic process for measuring the entire range of their effects” by tracking
changes on the level of economics, capabilities and relationships from an individual and
community consumer/producer perspective. By adding the community perspective he
draws, similar to the BoP Protocol, on insights and tools from the development
community where such impact assessments have been long in use.
The next major step in BoP theory development can be expected with the publication of a
book in 2010 in which the results of a conference with the title “Creating a shared
roadmap: collaboratively advancing the Base of the Pyramid community” are published,
combining papers from the leading academic proponents of the BoP theory, such as CK
Prahalad, Al Hammond, Stuart Hart, Prabhu Kandachar, Ted London and Erik Simanis.

29
The above review traces the development of the BoP concept from a narrow focused
theory of MNCs selling to the poor towards a lively academic discussion and hundreds of
practical applications. This evolution demonstrates that the concept is able to develop and
react to criticism and experience in the field. BoP 2.0 is the point where business,
development theory and practice meet in a constructive manner and enhance each other
to achieve the goal of poverty alleviation.
2.4 Social Entrepreneurship
Another emerging academic field is the study of social entrepreneurship. The
establishment of Grameen Danone Foods, the joint venture of Grameen Bank with
Danone, indicates the growing potential of social enterprises in the BoP market. There is
also a connection on a personal level, as Al Hammond works for Ashoka, the important
social enterprise networks, and Ashoka staff, in person of Valerie Budinich (2005)
developed a BoP business model framework. The main reason however for the inclusion
of a review of social entrepreneurship is that MVI, the focus of the report, is a social
enterprise.
Similar to the academic discussion of BoP, the theory of social enterprise is a recent
phenomenon. Nicholls (2008) points out that the term was initially coined by Banks in
1972 and the subsequent academic work centered mainly on management for not-for-
profit organizations and on defining the boundaries to commercial entrepreneurship. In
recent years it has moved out of the field of not-for-profit and tries to establish itself as a
distinct academic field. However, no universally agreed definition has emerged so far.
Nicholls (2008) defines social entrepreneurship as “innovative and effective activities
that focus strategically on resolving social market failures and creating new opportunities
to add social value systematically by using a range of resources and organizational
formats to maximize social impact and bring about change.” Parallel to the academic
discussion, networks of social entrepreneurs emerged, the most well known, Ashoka, was
founded in 1980 by Bill Drayton. Other more recent additions are the Schwab Foundation
for Social Entrepreneurship in 2000 and the Skoll Center for Social Entrepreneurship in

30
2003. All networks provide a platform for social entrepreneurs to showcase their work,
attract funding and other support services and work on the proliferation of the social
enterprise idea. Bornstein’s (2007) selection of social entrepreneurs’ case studies, many
drawn from the Ashoka Fellowship program, brought the concept to the attention of a
wider audience. One of the contentious issues in the academic and network community is
the question of for-profit or not-for-profit, or differently phrased earned income or
income from other sources. Dees (2008), one of the leading academics in the field, is
critical of the earned income postulate and does not include it in his definition of social
entrepreneurship. He demands further academic research into the issues of self
sufficiency, sustainability, financial freedom scalability and social impact, as all those
concepts are widely discussed but not properly researched. Boschee (2008) represents the
other faction in the social enterprise discussion calling the omission of earned income by
Dees “not only conceptually flawed, but also psychologically crippling”. As the academic
world struggles with defining terminologies and establishing themselves as a distinct
subject, the social entrepreneurs are “leading change on a global scale” according to
Nicholls (2008).
2.5 Microfranchising
Another related field of academic study is microfranchising, championed by Fairbourne,
Gibson and Dyer (2007). Its basic premise is that one of the most successful methods of
business growth in the developed world, the franchise concept, can be used at the BoP
level. Providing a proven business concept to an entrepreneur has the benefit of reduced
risk and an increased likelihood of sustainability, it allows for rapid scaling up and
sharing of overhead cost, such as advertising. Started with a lot of promise and theoretical
coherence, the microfranchising idea has not yet caught on a larger scale and the existing
microfranchises have not scaled up to a recognizable and sustainable level. So, the
concept’s development is far from Magleby’s (2007) assertion that the microfranchise
solution will be instrumental in “ending global poverty”. Nevertheless, Hapinoy states as
one of its core strategic objectives to arrive at a sustainable and scalable business model
that is franchise ready, therefore referring to the franchise concept.

31
The next chapter focuses on the retail market as one particular market at the BoP and its
players, the retailers and the consumers.

32
3. BOP CONSUMER BEHAVIOR AND THE BOP RETAIL MARKET
As the overview of the development of BoP theory shows, there has been an emphasis on
the BoP in terms of consumer and producer. However, there are not many articles or case
studies focusing on the point where consumer and producer meet, i.e. the BoP retail and
distribution market, as Vachani and Smith (2008) observe. Retail at the base of the
pyramid from a retailer as well as from a consumer behavior perspective has still scope
for further research. There are plenty of studies of retailing and consumer behavior for
the affluent market, however only a few focus on the low income sector. D’Andrea,
Lopez-Aleman and Stengel (2006a) and D’Andrea, Ring, Lopez-Aleman and Stengel
(2006b) study the Latin American small retailer market from a retailer and consumer
perspective. According to D’Andrea et al. (2006b), the BoP consumer must not be seen
as a massive homogenous mass of billions but as a market that needs to be segmented
according “to economic or behavioral patterns”. The BoP consumption market is
characterized by small but frequent purchases by a large number of people, giving it an
important size of the total market. Brands play an important role in the purchasing
behavior of the BoP as the consumers look to fulfill their “basic” needs with quality
products, mainly associated with branded products. This defies the common logic that
poor people are inclined to buy cheap products. An important behavioral concept at the
BoP is the “desire to minimize total purchasing cost” as opposed to shelf price as the
determinant for a price conscious purchasing decision. Total purchasing cost takes into
account the shelf price plus transport, time and convenience and is found to be more
relevant than the product price alone in making a decision where to shop. Although
modern supermarkets have increased their market share in Latin America, small retailers
have been able to keep up by fine tuning their offering to the needs of the BoP consumer
with a tailored product assortment, a meaningful relationship with the consumer,
closeness to the neighborhood and “virtual wallet” credit which the consumer uses to
smooth consumption. The adaptation of small retailers to the needs of the BoP consumer
was further researched by D’Andrea et al. (2006a). It was found that small retailers offer
tangible benefits to its customers in terms of close location, tailored assortment, an
acceptable total cost of purchase and a human centered shopping experience. The

33
business model of the small retailers is focused on cash and therefore the inventory
turnover becomes a key performance indicator. As the study shows, small retailers are
less efficient than big retailers in terms of gross margin per square meter and gross
margin per employee, however significantly more efficient in terms of gross margin per
inventory. This indicates a good understanding of the items to stock which generate high
turnover. Even taking into account that small retailers mainly operate in the informal
economy and thereby avoid taxation, the business model focusing on fast turnover of
goods into cash and tailoring the shopping experience to the BoP consumer is sustainable.
Another aspect of retailing at the BoP was highlighted by Prahalad (2005) in the case
study of Casas Bahia, one of the largest Brazilian retailers. It operates in the shanty towns
and its key to success is to build the “capacity to consume” at the BoP by extending the
informal virtual wallet to a formal financing offer to its constituency.
Looking now at the consumer side of retailing, several studies have focused on the
spending pattern at the BoP. WRI (2007) uses household survey data to analyze on what
BoP consumers spend their limited income.
Table 2: Household Spending Pattern in Global BoP Category Global BoP Food 57.9% Energy 8.7% Housing 6.6% Transportation 3.6% Health 3.2% ICT 1.0% Water 0.4% Other 18.6%
This global view from a macro perspective is complemented by Banerjee and Duflo
(2007), also using household data and own surveys focusing on the extremely poor living
below $1 a day. Their findings confirm that even the extremely poor do not spend all
their money on food, although it represents the highest percentage of consumption
spending with 56 to 75 percent. The rather large amount of money the poor spend on

34
entertainment mainly in form of festivals (10%) and alcohol and tobacco (1 to 6%) is
explained with the build up of social capital and the relatively low value attached to
spending the marginal income on better food. The project performs an exploratory survey
to validate these findings.
D’Andrea et al. (2006b) also look at spending from the retail perspective, i.e. what do
BoP consumer actually buy and establishes a matrix of product categories with a
segmentation into stables, secondary and luxury products for Latin America.
Having established that there is a massive market at the BoP, that it is served by formal
and informal retailers and that the BoP consumer does not spend exclusively on food, the
next paragraphs focus on the question why the BoP consumer spends the way he does,
i.e. the consumer behavior side.
Subrahmanyan and Gomez-Arias (2008) find that Maslow’s hierarchy of needs does not
fully explain consumer behaviour at the BoP as higher order needs, such as mobile
communication, are met although lower needs are not yet fully satisfied. They point
towards two theories that might explain this reversal. One is the importance of building
up social capital, for example in the form of enabling children to go to school or to
frequent the more expensive neighbourhood store in order to build up goodwill for the
case a credit facility is needed in the future. Another perspective is viewing the purchases
which are not meeting basic but higher needs as compensatory consumption.
Consumption of relatively expensive items can be interpreted as means to acquire social
status.
Bijapurkar (2007) analyzes the BoP consumer in the Indian context. She finds a
significant shift in consumer attitude post liberalization 1991 towards aspiration for a
better life and consequently for better and more products. Informed by the media, BoP
consumers buy products and services which enhance their earnings potential. The
decision making process is characterized by “complicated value processing” taking into
consideration opportunity costing, economic means, funding possibilities from various

35
sources, cash available and earnings potential of other spending opportunities. As
D’Andrea et al (2006b), she sees the need for market segmentation and suggests
segmentation along the lines of “transitory” and “persistent” low income consumer,
referring to Alwitt and Donley’s research. Another possibility to segment the market is
suggested by Bhan (2009). It focuses on the differences in income pattern: regular vs.
irregular and predictable vs. unpredictable as relevant lines of segmenting the BoP
consumer market. The importance of the irregularity of income as a defining parameter of
the BoP sector is also mentioned in The Monitor Report (2009). The project will try to
validate this approach in its action research part about consumer behavior.
Chakravarti (2006) acknowledges that consumer psychology research has almost
exclusively focused on the affluent market despite the fact that a deeper understanding of
the poor’s consumer psychology would benefit the design of products and services and
ultimately contribute towards the alleviation of poverty. Reviewing the existing literature,
he finds that “the eco-culture surrounding poverty and deprivation may drive significant
differences in the cognitive and motivational profiles of the poor (relative to the
affluent)”. The assertion that poverty does lead to differences in the mindset offers a
psychological reason for the need of the co-creation process which brings together the
different mindset to develop products and services at the BoP. It also explains the failure
of business models relying on the downsizing of offerings developed for the affluent
market and underscores the importance of qualitative research to unearth the deeper
mindset of the BoP consumer in order to co-create. Nisbett (2004) found that there is not
one universal human mindset but at least an Asian and a Western difference on the
cognitive level. If the assertion of Chakravarti holds true, there could be also a further
segmentation of the cognitive landscape in terms of poor and affluent. However, as he
also points out a lot more research needs to be done to substantiate such a claim. For the
action research the understanding that differences in cognitive and behavioral processes
have to be taken into consideration when co-creating products and services in the BoP
sector is important. Further research on the mindset of BoP consumer was undertaken by
Bhan (2009). Using an immersion action research approach, she arrives at the same
conclusion as Chakravati, that the life in adversity leads to a different mindset which then

36
translates into different values and consumer behavior. She confirms Bijapurkar’s finding
that “complex value processing” is taking place “constantly juggling income versus
expenses” and managing different sources of funds. The purchasing behavior is governed
by matching the irregular and unpredictable cash flows with spending. She asserts that
the BoP should not be seen as consumers but “strategic money managers” who are
thinking not in terms of spending disposable income but investing in goods minimizing
risk and maximizing return. The value gaps between BoP and affluent consumer culture
can be characterized by “tried and true over new and improved, pay as you go over buy
now, pay later and recycle and reuse over throwaway and replace”.
The next chapter adds the Philippine context to the discussion of the BoP retail market
and consumer behavior.

37
4. THE PHILIPPINE RETAIL MARKET
The retail sector is a very important part of the Philippine economy, accounting for
P1.1trillion, which is equal to 15% of GDP, according to BMI (2009).
The importance of the retail market becomes even more apparent when personal
consumption expenditure is analyzed. It corresponds to 71% of GDP according to NSCB
(2009a). In 2008 it stood at P5.28trillion with a year on year growth rate of 14.5%.
The per capita personal consumption expenditure amounts to P 58,382 according to
NSCB (2009b). Consumption is distributed unequally among the population as the
Philippine is a country with a high inequality of income or consumption as expressed by
the Gini coefficient of 44.5 in 2003, according to UNDP (2009). The richest 20% of the
population account for 50.6% of consumption, whereas the poorest 20% account for only
5.4%.
The retail sector is also the second largest employer with 6.17million people employed in
October 2007, representing 18% of the total workforce (NSCB 2009c). This number,
however, even underestimates the figure as it only covers the formal sector.
Donnie Tantoco III, CEO of a leading Philippine retailer summarized the situation as
“We’re a country of shoppers and shopkeepers” as quoted by Flores (2004).
49.8% of the personal consumption is in the categories food, beverages and tobacco
totaling P2.6trillion, whereby food accounts for P2.47trillion, beverages P82.67billion
and tobacco for P76.5billion (NSCB 2009d). The 2006 family income and expenditure
survey, released by National Statistical Office (NSO) (2009) reveals that the distribution
of the consumption pattern shows significant differences according to the income group.
The upper 70% spend only 39.3% on food, whereas the bottom 30% income group
spends 59.1%.

38
Figure 9: Household Spending Pattern in the Philippines (NSO)
Reformatting the data allows for the comparison of the results of the NSO survey with
the global BoP consumer expenditure data from WRI (2007).
Table 3: Household Spending Pattern in Global and Philippine BoP Category Global BoP Philippine BoP Food 57.9% 59.1% Energy and water 9.1% 7.3% Housing 6.6% 9.0% Transportation and ICT 4.6% 3.8% Others and Health 21.8% 20.8%
The Philippine expenditure pattern is thereby roughly in line with the global expenditure
pattern.
A sector analysis of the Philippine retail market by AC Nielsen (2004) shows that 90% of
all retails outlets are so called Sari-Sari stores, highlighting the importance of this
channel.

39
Table 4: Segmentation of Philippine Retail Market (AC Nielsen, 2004)
Outlet type Number of outlets 2004 % of Total Growth to 1997 Sari-Sari Stores 549,717 90.68% 237% Market Stalls 40,178 6.63% 167% Drugstores 8,516 1.40% 211% Grocery Stores 5,003 0.83% 198% Convenience Stores 1,238 0.20% 248% Supermarkets 1,092 0.18% 143% Department Stores 485 0.08% 36% Total 606,229
Also in terms of growth, Sari-Sari stores were only surpassed by the growth in
convenience stores.
Sari-Sari is the Tagalog name for variety. A Sari-Sari store is a micro convenience store
often located in a room inside the house of the owner. Access for the customers is via a
cross-barred window with a small opening. The proprietor is predominantly a woman
who runs the store parallel to the household. Silverio, as cited by Malapit (2007) traces
the origin of the Sari-Sari store to the 12th century as part of the trade network with
China.
Due to this long history and its pervasiveness in the urban and rural area, the Sari-Sari
store has become part of Philippine culture and landscape.
A main characteristic of Sari-Sari stores according to Chen (1997) is its legal but not
regulated and taxed, i.e. its informal, status. Specialized in serving the poor income
population they fulfill their client’s needs by breaking packages into small, thereby
affordable, quantities and extend credit to enable consumption smoothing. Capistrano
(2005), citing the ACNielsen study Asia Pacific Retail and Shopper Trend, shows that in
2003 60% of all fast moving consumer goods (FMCG) in the Philippines are traded
through a Sari-Sari store. He thereby further highlights the importance of the Sari-Sari
store to the retail industry. Malapit (2007) offers an economic explanation to the success
of the Sari-Sari store sector. She ascribes it on the female proprietor’s side to her low
opportunity cost of time and on the consumer side to a rational profit-maximizing

40
strategy taking into consideration the constraints in terms of disposable purchasing power
and credit needs. Sari-Sari stores thereby fulfill a specific role in the retail environment
which will ensure its continued existence. Chen also concludes that despite the
informality, the Sari-Sari stores have become an important part in the distribution chain.
He suggests that “marketing officials would be wise to integrate them into their company
marketing system in order to tap a wider territory and a bigger segment of the market”.
It took 10 years and two social entrepreneurs for that to happen ….

41
5. THE HAPINOY PROGRAM
Hapinoy, the Store of the Happy Filipino, is a joint program of Microventures Inc, a for-
profit social enterprise, and CARD BDS, the business development services arm of
CARD MRI, the largest MFI in the Philippines. It operates currently in the
CALABARZON area, encompassing the provinces of Cavite, Laguna, Batangas, Rizal
and Quezon, in the Philippines.
Figure 10: Logo and Map with Locations of Hapinoy Community Stores (Wikipedia,
Googlemaps)

42
5.1 Microventures Inc. (MVI)
MVI was founded in September 2007 in Manila. Its purpose is to develop and run
sustainable business models for microentrepreneurs and thereby empowering socially and
economically challenged families. MVI is led by Paolo Benigno (Bam) Aquino IV as
president and Mark Ruiz as managing director, who had been classmates at Ateneo de
Manila, a Jesuit education institution. To form MVI, Mark left a professional career with
Unilever, whereas Bam, nephew of Mrs. Cory Aquino, former president of the
Philippines, left politics, where he had served as Chairman of the National Youth
Commission. Chairman of the Board is Rafael (Rapa) Lopa, cousin of Bam, who also
serves as trustee of the PinoyME Foundation, which was set up in 2006 by Mrs. Cory
Aquino. PinoyME’s vision is to assist MFIs and microentrepreneurs in the Philippines.
The foundation’s effort to facilitate access to commercial loans for MFIs has been crucial
to the growth of the industry in the Philippines. Business development service is another
plank in its strategy and the support for MVI is an expression of this strategy. Also on the
board is Dr. Aris Alip, founder and managing director of CARD MRI, which is a major
shareholder in MVI.
Hapinoy was initiated in a meeting in December 2006 by Dr. Alip, Bam Aquino and
Mark Ruiz. Dr. Alip was looking for concepts to improve the business of CARD clients.
Mark and Bam had developed “Project Goldmine”, a concept to form a chain of Sari-Sari
stores and link them as an aggregated group directly to major supermarkets. As many
Sari-Sari store owners are MFI clients and also form a large group within the MFI’s
client base, CARD alone counts 60.000 Sari-Sari store proprietors as members, the
strategic fit of the MFI and the MVI concept becomes apparent.
As a for-profit social enterprise, the vision of MVI is to change the socio-economic
pyramid in the Philippines to a diamond with a market based solution, placing it firmly in
the BoP context. Bam Aquino puts it this way: “At the end of the day, hand-in-hand with
our partners and our microentrepreneur nanays, we hope to alleviate poverty, one sari-sari
store at a time” as quoted in a press release by Smart (2007). But not only the direct
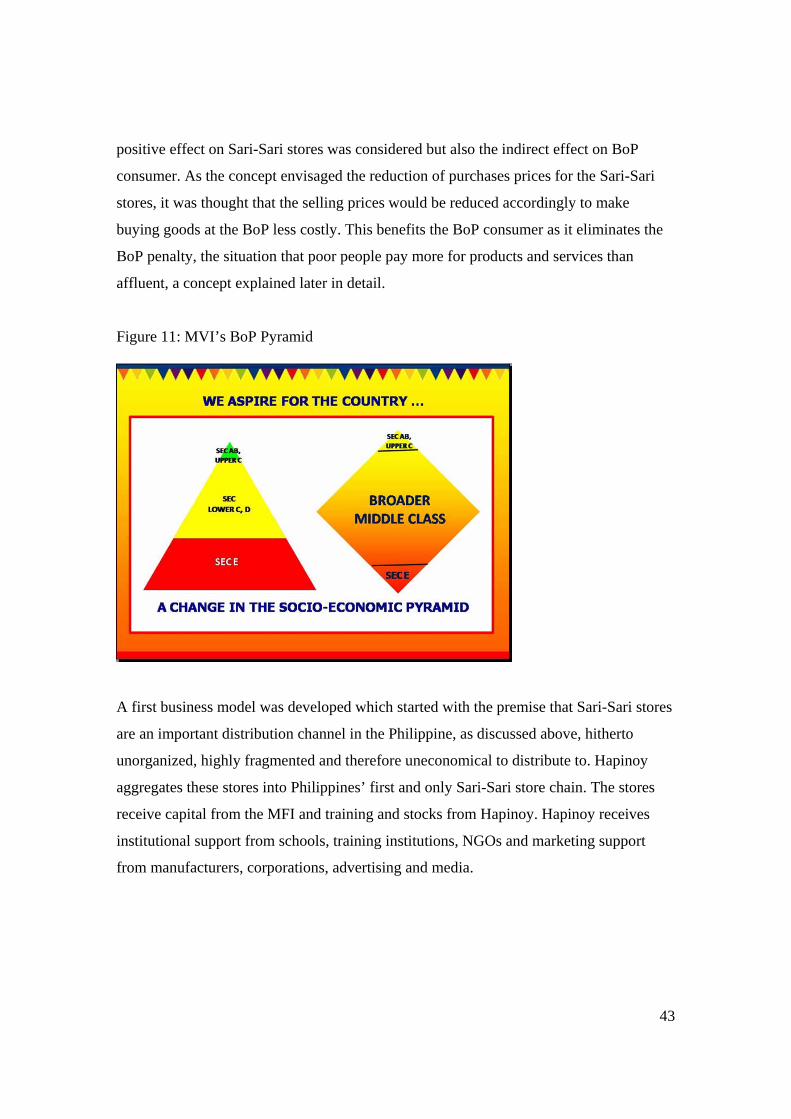
43
positive effect on Sari-Sari stores was considered but also the indirect effect on BoP
consumer. As the concept envisaged the reduction of purchases prices for the Sari-Sari
stores, it was thought that the selling prices would be reduced accordingly to make
buying goods at the BoP less costly. This benefits the BoP consumer as it eliminates the
BoP penalty, the situation that poor people pay more for products and services than
affluent, a concept explained later in detail.
Figure 11: MVI’s BoP Pyramid
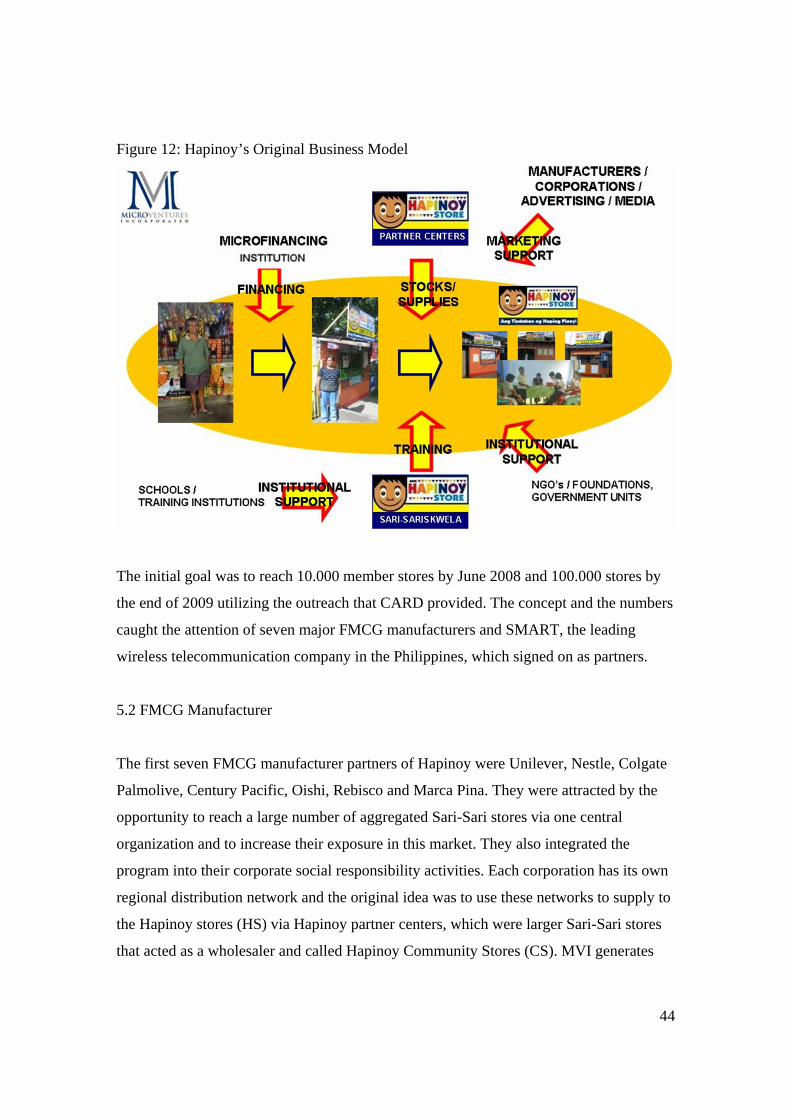
A first business model was developed which started with the premise that Sari-Sari stores
are an important distribution channel in the Philippine, as discussed above, hitherto
unorganized, highly fragmented and therefore uneconomical to distribute to. Hapinoy
aggregates these stores into Philippines’ first and only Sari-Sari store chain. The stores
receive capital from the MFI and training and stocks from Hapinoy. Hapinoy receives
institutional support from schools, training institutions, NGOs and marketing support
from manufacturers, corporations, advertising and media.
44
Figure 12: Hapinoy’s Original Business Model
The initial goal was to reach 10.000 member stores by June 2008 and 100.000 stores by
the end of 2009 utilizing the outreach that CARD provided. The concept and the numbers
caught the attention of seven major FMCG manufacturers and SMART, the leading
wireless telecommunication company in the Philippines, which signed on as partners.
5.2 FMCG Manufacturer
The first seven FMCG manufacturer partners of Hapinoy were Unilever, Nestle, Colgate
Palmolive, Century Pacific, Oishi, Rebisco and Marca Pina. They were attracted by the
opportunity to reach a large number of aggregated Sari-Sari stores via one central
organization and to increase their exposure in this market. They also integrated the
program into their corporate social responsibility activities. Each corporation has its own
regional distribution network and the original idea was to use these networks to supply to
the Hapinoy stores (HS) via Hapinoy partner centers, which were larger Sari-Sari stores
that acted as a wholesaler and called Hapinoy Community Stores (CS). MVI generates

45
income by of taking a share of the additional discount from the manufacturer. Hapinoy
members benefit from the arrangement in terms of lower prices and promotions.
Figure 13: Existing FMCG Supply Chain and Hapinoy Supply Chain
Existing supply chain Hapinoy supply chain
FMCG manufacturer FMCG manufacturer
Regional Distributor Regional distributor
Grocery/Supermarket Hapinoy Partner Center
Sari-Sari Store Hapinoy Store
In terms of BoP terminology, this approach is classic BoP 1.0, using existing structures
and selling sachet packaged branded goods. The innovative part of it is to engage the
distributors to work directly with an aggregated number of the small stores, thereby
integrating them officially into their distribution network. The benefits for the Hapinoy
store are lower purchasing prices, leading to higher margins, and the possibility to profit
from manufacturer promotions.
5.3 Smart Communications Inc (Smart)
Smart is the largest Philippine wireless telecommunication operator and has been,
together with its main competitor Globe Telecom, very active in reaching the BoP
through tailoring its products, especially the popular text messaging, to the needs of the
BoP sector and very aggressive pricing. They perfected the pay-per-use business model
through the introduction of e-load, by which the user can purchase airtime from another
user which acts as an e-load retailer. It thereby circumvented the costly distribution and
pricing issues associated with the traditional pay-per-use methods of utilizing a scratch
card and it enabled the operators to reduce the minimum amount to P10, making it

46
affordable to the BoP. As there are no restrictions on the distribution of e-load, a whole
industry of distributors, sub-distributors and retailers has emerged at the BoP. The
strategy paid off as the two operators counted in 2007 50million subscriber, representing
a penetration rate of 60%, who send more than 1bn text messages daily, according to
Francisco (2008). The Hapinoy venture fits therefore in the core business model of Smart
as it adds additional retailers to their brand and expands its outreach in the target market.
In the words of Danilo J. Mojica, Smart head for wireless consumer division, according
to Smart press release (2007), “The Smart Hapinoy Store will benefit both the store
owners and the local community. For store owners, it’s a sure source of additional sales,
while for Smart subscribers in the community; it means easier access to leading cutting-
edge Smart products and services”. The consequence of the good fit has been a very close
cooperation of MVI and Smart, which has been the most important industry partner and
income generator for MVI from the inception in 2007.
Figure 14: Existing Smart E-load Supply Chain and Hapinoy Supply Chain
Existing supply chain Hapinoy supply chain
Smart Smart
Distributor Card NGO/Bank Unit Manager
Dealer
Sub-Dealer
Hapinoy Store Hapinoy Store
In the Hapinoy supply chain, the store is registered free of charge as an e-load retailer and
can avail a special e-load loan, which has a repayment time of one week and is priced at
1%, from the CARD NGO/Bank account officer. The e-load is then transferred from the
CARD unit manager to the Hapinoy store. The benefit of the store owner is the
availability of a new business without incurring additional cost and access to capital to

47
purchase e-load. The benefit of CARD NGO/Bank is an additional loan product with
higher interest than the usual loan. CARD BDS profits from a 1% share in the load sold
by the CARD NGO/Bank. The benefit of MVI is a share in the sale of e-load and, to a
much larger extent, by running “Store Makeover and Merchandising”, a marketing
program with Smart. Smart agreed to pay for the signage and painting of 4.000 Hapinoy
store which had to be recruited until October 2008, giving the new chain a recognizable
branded look, while prominently displaying Smart’s logo. MVI outsourced the job to an
agency and earned from the difference. It turned out that this merchandising program
sustained MVI for two years.
Smart’s approach to Hapinoy is substantially different from the approach of the FMCG
manufacturers. It represents a BoP business model that is consistent with BoP 2.0, as it is
developed with the needs of the BoP in mind and integrated into the core strategy of the
corporation.
The first MFI partner organization is CARD MRI, which assigned CARD BDS, its
business development service company, which was incorporated 2005, with the operation
of the Hapinoy program together with MVI.
5.4 CARDS Business Development Services Inc (CARD BDS)
CARD BDS is one of six mutually reinforcing institutions of CARD MRI. Its role is to
provide CARD’s microfinance clients with business development services to enable them
to grow, to become more sustainable and ultimately, to move out of poverty. It is led by
Aristeo (Boyet) Dequito and Julius Alip. In addition to Hapinoy, CARD BDS was in
2007 also active in running CARD’s printing press, solar energy, housing-loan, bulk
sourcing and customized business services programs. BDS marketed the Hapinoy
program as its own product, undertaken with the support of MVI. MVI’s role is to
organize advocacy, consumer marketing and the relationship to the partners. BDS’ role is
to operationalize the venture and organize the recruitment of Hapinoy Stores and
Hapinoy Community Stores. The Hapinoy Store program was marketed with the

48
following four benefits to Sari-Sari store owners: access to additional loan, store
makeover including painting and signage, promotions and best price of products from
community stores and training. The one time membership fee was P150. Community
Stores were recruited with the following benefits: Additional loan, store makeover
including painting and signage, promotions and best price of products from distributor
and training.
Table 5: The Original Hapinoy Loan Program
The Hapinoy program was launched in September 2007 and the first year was planned by
management as a pilot phase to determine a sustainable and scalable business model. The
action research started therefore at a crucial stage of exiting the pilot phase and moving
with the right business model into the expansion phase.

49
6. ACTION RESEARCH PROJECT
The action research project was undertaken to aid MVI and CARD BDS management in
their quest to develop a scaleable and sustainable business model. It started with a
familiarization program in October and November 2008 with CARD BDS followed by a
field action research period with MVI from December to July 2009 and ended with the
evaluation phase in August 2009.
Table 6: Action Research Timetable Time Headline Action Task 1. Phase October 2008
Familiarization in the field and with CARD BDS and MVI
Field trips with BDS staff In depth interviews with BDS and MVI management
Deep understanding of Hapinoy program
2. Phase November 2008 to July 2009
Field Action Research
Interviews with CS owners Joint BDS-MVI planning meeting Participation at weekly staff meeting Conducting strategy workshops Field trips with MVI staff Participation at CS meeting Participation at joint BDS-MVI workshop
Collection of baseline data from CS stores and Hapinoy operation Strategy development, implementation and monitoring with Balanced Scorecard Developing marketing methodology and management Implementation of POS system Other Strategic Projects
3. Phase August 2009
Evaluation In depth interviews with CS owners, CARD BDS, MVI
Report

50
6.1 Familiarization in the Field and with CARD BDS and MVI
In the period of October to November 2008, meetings with CARD BDS staff and 14 field
trips were undertaken to acquire an in-depth understanding of the Hapinoy program. The
field trips involved visit to nine Community Stores, three CARD Center Meetings and
one Hapinoy Recruitment Caravan.
In meetings with CARD BDS staff the recruitment process and the value proposition for
HS and CS were explained.
6.1.1 Hapinoy Stores: Recruitment and Value Proposition
Hapinoy Stores (HS) form the first category of Sari-Sari stores in the Hapinoy ecosystem.
As mentioned above, the stated goal was to aggregate 100.000 of them within 27 months.
The requirements to become a HS were an existing Sari-Sari store business, one
completed loan cycle and a 100% loan repayment rate. The value proposition to the
stores for joining the program rested on four pillars: Additional loan, best price, training
and store makeover including signage and painting. The store makeover was dependent
upon becoming a SMART e-load retailer which in turn represents a new business
opportunity for the Sari-Sari store and therefore an additional incentive to become a
Hapinoy store. The e-load program became quickly one of the major drivers in the
recruitment process.
However, it also added an unforeseen dynamic into the Hapinoy program whose
consequences will be analyzed later in this chapter.
CARD BDS was responsible for the recruitment of HS. To recruit the large numbers of
HS targeted, the account officers (AO) of CARD NGO and Bank were activated. As the
AOs meet all members and potential participants in the center meetings once a week,
they were deemed to be the ideal sales force for the Hapinoy Store program using the
shared channel business model, i.e. utilizing an existing channel, MFI, to promote

51
another product or service, Hapinoy. Due to the involvement of seven parties, the process
from recruitment to operation as a Hapinoy Store was complex and it was not backed up
by a computerized work flow system. Instead it was mostly done in a manual process and
with excel sheets, making it prone to data losses.
Figure 15: Workflow of Hapinoy Store Recruitment 2007/2008
SS AO UM BDS Active Asia MVI
Signs up Collects Approves Aggregates Paints and Validates
Sign up Sign up Installs
sheet Signage
Hapinoy Store BDS MVI SMART
operational sends activates registers
SIM-Card SIM-Card e-load retailer
In June 2008 it became clear that the original strategic goal of reaching 10.000 HS has
been missed by a large margin and that the goal of reaching 100.000 HS by the end of
2009 was very difficult to attain. The result of the recruitment as of July 2008 which is
ten months after the launch was 2.096 sign ups and 894 fully operational Hapinoy stores
of which 805 also availed the e-load program. The large discrepancy between number of
sign ups and operational stores was explained by inefficiencies in the process and a
geographically scattered recruitment approach, which made the paint and signage part of
the program unsustainable. The large discrepancy between the number of sign ups for the
program and the target of 4.000 stores, which had to be reached by October according to
the agreement with Smart, can be explained by a capacity problem of the AOs. The main
task of an AO is the disbursement of loans and the collection of the repayment. He is very
busy with his core work and any additional task, as interviews with several account
officers have brought to light, is more viewed as an additional workload than a welcomed
opportunity, especially as no incentives were provided. Some AO were enthusiastic about
the program but the majority, relying on anecdotal evidence and the lackluster result, was

52
at best indifferent. In addition, there was no institutionalized coordination between the
recruiting parties. The first meeting between CARD BDS, the regional heads of CARD
Bank and CARD NGO and MVI staff was only held in September 2008, revealing a lack
of understanding and buy-in of the program on a middle management level.
As the contract with Smart foresaw 4.000 operational stores by October 2008 and given
the problems in the recruitment process, MVI started its own recruitment process in
addition to the continuing efforts by CARD, utilizing full time five recruiters, and
streamlining the process.
Figure 16: Workflow of Hapinoy Store Recruitment 2008/2009
SS Recruiter UM Active Asia MVI
Signs up Promotes Approves Paints and Validates
at center Hapinoy Sign up Installs
meeting collects Signage
Sign ups sheets
Hapinoy Store BDS MVI SMART
operational sends activates registers
SIM-Card SIM-Card e-load retailer
Starting in the Calabarzon area, the recruiters were met with resistance and cyniscm by
nanays who had signed up already long time ago but were not converted into a Hapinoy
store yet. With recruitment in this area seemingly impossible, MVI decided to start
recruiting in the NCR (Metro Manila) region which had a large number of Sari-Sari
stores within a small geographic region, making fast recruitment and painting and
merchandising feasible. However, it moved them from their pilot area with a rural
environment into the urban environment, an expansion step which was originally planned
to happen years ahead. At the same time Smart agreed to extend the timeline and finally a
total of 3,981 Hapinoy stores were reached in May 2009, seven months behind schedule
and with about half of the stores not in the pilot area. The force that drove MVI into the

53
NCR region was the need to comply with the Smart agreement out of contractual
obligation but also because a large portion of the income of MVI depended on this
program.
The e-load retailing, proved to be the main values of the Hapinoy program to the HS, as
almost all Hapinoy stores signed up to this service. However, after receiving the SIM
card from CARD, thereby becoming an e-load retailer, many stores bought their e-load
from other distributors as CARD was not in a position to match the prevailing market
prices in the e-load distribution business. The program reached its pinnacle in October
2008 with 1,500 stores participating in purchasing the e-load from CARD for a total of
P3.3 million. In July 2009 this figure was down to P2 million, below the expectations of
CARD BDS, leading to a financial loss for CARD BDS.
According to Abellada (2008), the Hapinoy program had a significant positive impact,
i.e. an increase in income, on the HS as compared to non-Hapinoy Sari-Sari stores in the
same area. The study did not determine the reason for the increase. Analyzing the
benefits of the program and the uptake of them, e-load is probably an important factor
surpassing the value of the supply chain.
6.1.2 Community Stores: Recruitment and Value Proposition
Hapinoy Community Stores (CS) formed the second category of Sari-Sari stores in the
Hapinoy ecosystem. The selection criteria for CS were more stringent and consisted of a
three year membership in CARD, in July 2008 reduced to one year, with good
performance rating and a five year, in July 2008 reduced to three year, history in the Sari-
Sari store business. Additionally a scorecard was developed wherein business criteria
held a 60% weight and personality traits a 40% weight. The most important criteria were:
central store location, capacity to repay the loan, standing with CARD and focus on new
business. Entrepreneurial drive was the least important characteristic in the selection
process. The value proposition to the CS consisted of five features: additional loan,
access to partner distributors, store makeover including painting and signage, best price

54
from distributor or manufacturer and training. The recruitment for CS was done by
CARD BDS staff directly in cooperation with the local CARD Bank and CARD NGO
branch manager. The first four CS were recruited in 2007 and ten more were added until
October 2008, bringing the total number to 14, all of them in the Calabarzon region.
The CS performs a crucial role in the supply chain of Hapinoy, as it acts as the
wholesaler, receiving goods from distributors or manufacturers and selling them to the
HS. However, their total number was small in comparison to the HS, they were supposed
to serve. Even more damaging to the supply chain, the geographic spread of CS and HS
was not coordinated, resulting in large areas without CS. So, only a total of 200 HS out of
about 800 HS participated in the supply chain. Efforts by CARD BDS to increase the
number to 30 by December 2008 were not successful, as the process of CARD BDS staff
recruiting with the help of the CARD Bank and CARD NGO was not efficient. On two
field trips, the recruitment procedure was observed and both times no recruitment took
place as either the branch manager’s suggestion did not fit the requirements or the nanay
was not available for an interview.
Since the CS perform such an important role in the Hapinoy program and is seen by
management as key to the success of the program it was decided to concentrate the field
action research on the CS.

55
6.2 Field Action Research
The field trips to the community stores resulted in baseline data consisting of social and
economic parameters. Out of the total population of 14 community stores, 9 were
randomly selected for the baseline data and visited in October 2008.
6.2.1 Store Organization
On average the stores were open 7 days a week for 16 hours a day. Shelves were of
varied size, shape and color. No store had signage with pricing on the shelves. Most
merchandise was packed in boxes and placed within or outside the store. Lighting was
generally insufficient. The retail business was conducted through a window or opening
on the street front, the wholesale business was conducted mostly inside the store.
Consequentially, the inside of the store had more the appearance of a warehouse than a
formal grocery.
6.2.2 Sales Analysis
As the stores are for-profit enterprises a particular emphasis was put on income and
profitability of these stores to later determine the impact of the Hapinoy program on the
stores. However, a typical problem of Base of the Pyramid enterprises is the availability
and reliability of data, especially of sales and profit data. One result of the baseline data
acquisition was the fact that the majority of the stores had no written record of their sales
transactions. Only one store has a POS system, but it was used for playing computer
games. The store owners provided sales data; however, this data has to be taken with a lot
of caution, primarily for two reasons: They do not know themselves the exact figure;
secondly some are not keen to reveal it. On a follow up visit one nanay said that she
increased her sales but the figure she gave was 20% below the previous figure. She
explained the inconsistency with the admission that she simply does not know the
numbers. The way she follows the development of her store is by looking at the shelves,
i.e. the level of inventory, cash at hand and bills to pay. The triangulation of supplier bills
56
plus the mark-up and cash in hand gives her an approximation of the sales figures. The
second issue of purposely under- or over-representing income figures can be explained
with a lack of trust or a caution of revealing those figures in the light of hassle from
authorities. Until enough trust is build up, the misrepresentation is likely and consistent
with the findings of Collins, Morduch, Rutherford and Ruthven (2009). Another problem
with the use of income data from anecdotal evidence was described by Kobb (1997) in
the context of using it as a determinant of impact of a development program. He found
that even the “act of measurement” itself, i.e. the person asking and framing the question,
has an influence on the answer. He suggest “willingness to pay” as a “more appropriate
monitoring and evaluation indicator”. This recommendation was put into practice at a
later stage of the project.
The analysis has shown a gap between the availability and reliability of the data in the
stores and the needs of MVI. For MVI to run a retail supply chain, detailed sales data on
a SKU level per store is a necessity. To fill this gap a project to install a point-of-sale
(POS) system was initiated. This project will be described in detail later as an example of
the introduction of technology to solve a problem at the BoP.
Nevertheless, in absence of a POS system or a consistent manual system and in
knowledge of its general limitations, the sales per day figure given by the nanays ranged
from P1,500 to P45,000 with an average of P14,400. The large spread can be explained
by the type of business that the CS is in: If the CS is already in the wholesale business,
i.e. selling to other Sari-Sari stores, in addition to the retail business, i.e. selling to
consumer, its sales are higher. CS that had only retail customer averaged P3,000 sales per
day. CS that were already in the wholesale business had averages sales of P20,000 per
day of which P11,000 came from the wholesale activities, i.e. 55%. This figure gives an
indication of the potential upside for the non wholesaling CS when it starts this business.
The customers in the wholesaling business are Sari-Sari stores. On average a community
store had 22 Hapinoy Stores customers. The total number of Hapinoy Stores buying from
the CS was 200.

57
The determination of the selling price for the merchandise is done on a cost plus basis.
On average the margin to retail customers is 8% and the margin in the wholesale business
is 4%. Transactions in the wholesale side of the business are all done on a cash only
basis. On the expense side, there are no expenses for rent for 67% of the CS, as the
business is conducted in their own premises, which explains the average of only P24 per
day. On average, the CS employs one helper at a salary of P2,000 per month. In 67% of
the CS, family members, either the husband or the daughter also helps at no monetary
cost. Main cost is interest with an average of P176 per day.
Table 7: Average Income Statement of a CS in October 2008
Daily Monthly % Sales 14,400 432,000 Wholesale 7,100 Retail 7,300 Gross Margin 284 584 868 26,040 6% Rent 24 Salary 67 Electricity 8 Interest 176 Expenses 275 8,250 Net Profit 593 17,790 4,1%
The Gross Profit Margin is 6%, the Net Profit Margin is 4.1%. The average stock value is
P273,889 which translates into a Gross Margin on Inventory of 9.5%. This result does not
correspond to the 50% + figure which D’Andrea et al. observed in Latin America. The
reason for the discrepancy is difficult to determine and the evaluation will show whether
an improvement can be seen with the participation of the program.
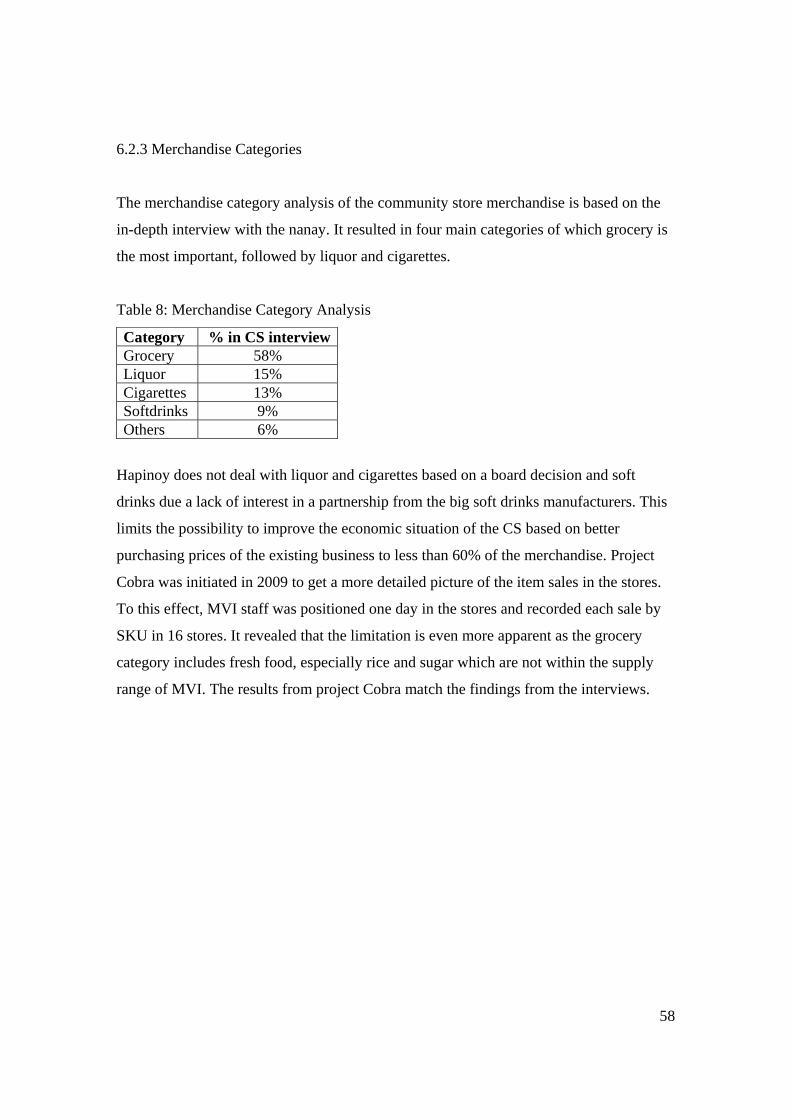
58
6.2.3 Merchandise Categories
The merchandise category analysis of the community store merchandise is based on the
in-depth interview with the nanay. It resulted in four main categories of which grocery is
the most important, followed by liquor and cigarettes.
Table 8: Merchandise Category Analysis
Category % in CS interviewGrocery 58% Liquor 15% Cigarettes 13% Softdrinks 9% Others 6%
Hapinoy does not deal with liquor and cigarettes based on a board decision and soft
drinks due a lack of interest in a partnership from the big soft drinks manufacturers. This
limits the possibility to improve the economic situation of the CS based on better
purchasing prices of the existing business to less than 60% of the merchandise. Project
Cobra was initiated in 2009 to get a more detailed picture of the item sales in the stores.
To this effect, MVI staff was positioned one day in the stores and recorded each sale by
SKU in 16 stores. It revealed that the limitation is even more apparent as the grocery
category includes fresh food, especially rice and sugar which are not within the supply
range of MVI. The results from project Cobra match the findings from the interviews.

59
Table 9: Merchandise Category Analysis with Project Cobra Category Sub-category % in CS interview % in project Cobra Grocery 58% 58% Fresh Food 17% Beverages 10% Snacks 7% Personal care 6% Cooking aids 5% Canned Food 4% Home care 4% Noodles 3% Milk 2% Liquor 15% 12% Cigarettes 13% 18% Soft drinks 9% 13% Others 6% 0%
The analysis indicates that only 41% of the Sari-Sari store merchandise is affected by
improved purchasing prices and promotions from the Hapinoy program as the other
products, especially fresh food, liquor, cigarettes and soft drinks, are not part of the
Hapinoy supply chain.
6.2.4 Reasons for Joining the Hapinoy Program
The main reasons for joining the program were training in business skills (87%),
followed by additional loan (57%) and the expectation for more sales (43%).
6.2.5 Problems with the Hapinoy Program
The nanays identified as their main problems with the program the incomplete product
line, which corresponds with findings of the category analysis, and the lack of HS buying
at their store, which is coherent with the finding that only 200 Hapinoy stores participated
actively in the supply chain.

60
6.2.6 Evaluation of Hapinoy Program November 2008
The result of the organizational and field research at the end of November 2008 can be
described in a classic SWOT analysis which has been adapted by introducing four
perspectives: Finance, Customer/Supplier, Process and Human Resources foreshadowing
the introduction of the Balanced Scorecard in February 2009

61
Table 10: SWOT Analysis Hapinoy as of November 2008 Perspectives SWOT Strength Weakness Opportunity Thread Finance MVI profitable through SMART
merchandising BDS unprofitable First mover advantage E-load distributors targeting HS with
deep discounts and giveaways Strong backing of CARD MRI
management MVI without income from core operation
Fees from CS and HS not collected
Customer Supplier
Growth from 0 to 3.000 HS within 14 months
Incomplete product line at CS 60.000 Sari-Sari stores in the CARD membership
Partner distributors uncooperative in giving discounts
Partner network of for FMCG and wireless business
Only few HS buy from CS Public awareness of Hapinoy as successful social enterprise
Acquisition of new partners difficult with lower than expected retail outlets
Good relationship with CS Location of CS too far from HS Discounts in FMCG too small to support all parties in supply chain
E-load opportunity led to higher sales in HS
75% of benefits to HS not delivered: Best price, training, additional loan
Discontent among CARD members with program
Core benefit to CS not delivered: Best price
Mismatch between positive public image based on initial goal and reality backfires on program
Limited interaction possibilities with HS
Processes New HS recruitment process successful
Supply chain, the core business, dysfunctional
Problems appeared in pilot phase
Problems need to be solved before expansion
Problems in recruiting HS and CS Inefficient process of HS sign up
and opening
HS program and CS program not aligned, working as two separate programs
Roles and responsibilities of BDS and MVI unclear and misaligned with capacity
Strategy misalignment of BDS and MVI

62
Perspectives SWOT
Processes cont. Strength Weakness Opportunity Thread
No reliable data from HS and CS makes management of operations difficult
Learning One year experience on what works and what does not work
Staff organized according to CS and HS program
MVI and BDS with mindset to innovate together for the sake of the program
Staff becomes tired with program
BDS staff hard working BDS staff spend most time on collecting and reconciling data
Staff attrition
MVI staff with professional capacity
CARD staff not active sales people for program

63
In summary, the Hapinoy program as it stood in November 2008 did not have a
sustainable and scalable business model. Major strategic and organizational changes had
to be implemented to move ahead. To this effect, the first joint strategy workshop of MVI
and CARD BDS was convened in December 2008 involving all staff and, separately,
strategy board meetings took place.
It was decided that the roles and responsibilities will be aligned to the capabilities. This
meant that MVI takes control of the operations of the Hapinoy program and CARD BDS
concentrates on the financial aspects of the program and develops customized financial
solutions. CARD MRI increased its shareholding in MVI to further strengthen the link
between the two organizations. Consistent with this realignment, the income streams
were also separated in so far as income from financial transactions would be credited to
CARD BDS, income from operational and marketing activities to MVI. To close the gap
in the supply chain between HS and CS a push and pull strategy will be developed. The
push side would involve encouragement to the HS to buy goods from the CS, the pull
side involves making the CS offer more attractive by introducing new products through
MVI’s own trading activities with secondary brand goods and non-branded goods. As
Smart announced the introduction of a new computer based e-load distribution policy,
thereby cutting the sub-distribution business, a new e-load distribution system via the CS
will be developed, further adding to the attractiveness of the CS. The problem of data
reliability at the store level will be met with the introduction of a POS system at the CS.
Based on the findings of the familiarization and analysis and the result of the joint
planning meeting several strategic projects were instigated to move the Hapinoy program
from the pilot stage to a sustainable and scalable business model.
1. Strategy development, implementation and monitoring with Balanced Scorecard
2. Developing marketing methodology and management
3. Implementation of POS system
4. Other Strategic Projects

64
6.3 Strategy Development, Implementation and Monitoring with the Balanced Scorecard
6.3.1 Strategy Development
During the pilot phase several strategic shortfalls of the program became apparent and
needed to be addressed to successfully arrive at a scalable and sustainable business
model. With the clear separation of roles and responsibilities after the joint strategy
meeting, MIV had to develop a coherent and holistic strategy development approach to
the whole Hapinoy program. It was decided to use Balanced Scorecard (BSC) as the tool
for strategy development, implementation and monitoring. BSC was first introduced by
Kaplan and Norton (1996), who saw the need to close the gaps between strategy
development, implementation and monitoring and to expand from a narrow financial
focus to a more holistic view of the company by adding learning, or human resource, a
process and a customer perspective. BSC has become one of the most widely used
management tools in today’s corporations.
Figure 17: Generic Balanced Scorecard
Customer
Processes
Learning
Finance
1. Strategy Map1. Strategy Map 2. Objectives
Relevant, measurableobjectives
3. KPIs
Balanced, relevantkey performance
indicators
3. KPIs
Balanced, relevantkey performance
indicators
4. Strategicprojects
Actions reequiredto implemenetthe strategy
5. Target
Short and mediumterm target valuesfor MTP, budget
and MbOs
Most importantobjectives and
strategicdirection

65
The use of BSC within a social enterprise has not been widely discussed. Social
Enterprise London (SEL) (2004) developed a Social Enterprise Balanced Scorecard
framework based on Kaplan and Norton’s work. The main additions were the expansion
of the customer perspective to a stakeholder perspective and the addition of social
enterprise specific objectives such as impact assessment and inclusion of stakeholders
such as community. Somers (2005) found that this Social Enterprise Balanced Scorecard
technique can be adapted to the social enterprise environment and that social enterprises
can benefit in terms of becoming a “better business” while at the same time
“demonstrating social value”.
Figure 18 Social Enterprise Balanced Scorecard – Social Enterprise London (2004)
The Social Balanced Scorecard project was not further pursued within SEL after 2005
and no further academic studies on the subject were undertaken.

66
The work on Hapinoy’s BSC started with the development of the strategy map. After
several management meetings and eight iterations the Hapinoy strategy map was
approved.
Figure 19: Hapinoy Balanced Scorecard Strategy Map 2009
The Strategy Map in the Balanced Scorecard offers a comprehensive overview of
Hapinoy’s strategy. The connections between the different strategic objectives indicate

67
the relationship and dependencies among them. The strategy path can be transcribed as:
The training of Store Doctors and the standardization of the CS will lead to a CS
franchise ready model. This process will lead an increase in CS retail and wholesale
revenue, leading to a total increase in CS revenue and adding towards the sustainability
of the CS which results in increased CS franchise fees, leading towards growth in income
and ultimately attainment of sustainability. The combination of all paths represents the
strategy.
The main change to the previous strategy was the shift of focus from HS to CS as the
main stakeholder and partner in the Hapinoy program. The CS was no longer seen as a
necessary part of the supply chain serving the HS, but as the focal point of the whole
Hapinoy program. Accordingly, most objectives in the learning and process perspectives
lead towards arriving at a business model for the CS which will lead to more sustainable
CS. In another major strategy shift, the income from other activities was no longer
defined as extraordinary revenue but as an income stream of equal importance to the
operational income from CS and suppliers. Other activities include marketing programs
with partners, such as Smart, which will be developed on a sustainable basis.
6.3.2 Strategy Implementation
The second step in developing the Balanced Scorecard is the implementation of the
strategic objectives and putting them into action. The objectives are taken from the
strategy map and made measurable by attaching a key performance indicator (KPI) and a
time line to it. To attain the objectives the necessary strategic projects are developed and
made measurable with targets, timelines, budgets and the assignment of staff
responsibility.
This process will be demonstrated using two objectives from the strategy map as shown
in Table 11 and 12.

68
6.3.2.1 Developing Marketing Methodology and Management
The reason why management considered it as important to develop marketing
methodologies was the realization that important marketing programs at the CS and HS
level failed. The prime example is the introduction of a non branded detergent to the CS
store whose price level was 40% below the nearest competitor. The basic assumption of
MVI was that cheaper products would outsell more expensive products at the BoP.
However, the product failed to sell at all. As the introduction of new products is another
strategic objective named “New and existing business/services/supplier development and
delivery” in the process perspective, MVI wants to assure that the proper methodology is
in place to make it a success.
Table 11: Balanced Scorecard Development - Marketing
Strategy Map Objective Developing marketing methodology and management KPI Have a marketing methodology developed, piloted, tested
and published in the operations manual Timeline target By June 2009 Strategic projects Market Research at HS and BoP consumer level Issue
guidelines for introduction of new products and new marketing initiatives
Responsibility Mark Ruiz – Marketing Team
6.3.2.2 CS Standardized Operations and Service
An important aspect of the development of a scalable and sustainable business model on
the CS level is to have standardized operations and services. It assures efficiency in the
delivery of services to the CS and operational efficiency at the CS. One of the findings of
the project’s analysis was the lack of reliable data because most CS did not use a manual
or computerized system to record transactions. On the other hand, MVI needs reliable
data to manage the supply chain. So a strategic project to introduce a POS system was
included in the BSC.

69
Table 12: Balanced Scorecard Development - Operations
Strategy Map Objective CS Store standardized operation and services
KPI CS Store standardized operation and services developed and
published in the Operations Manual
Timeline target By June 2009
Strategic projects Operations Manual
POS at CS
Responsibility AJ Rodriguez – CS Operations Manager
The process of identifying KPIs, targets, strategic projects, targets for the projects and
responsibilities was performed for each of the strategic objectives in the Balanced
Scorecard for Hapinoy.
6.3.3 Strategy Monitoring
BSC is not only a tool for developing strategies and turning them into action but also a
monitoring tool. Each project is tracked on a daily, weekly, monthly or quarterly basis to
allow management to evaluate the progress and take remedial or reinforcing action in
case of delay, under- or over performance. The status is symbolized by traffic lights (red,
yellow and green) ensuring easy understanding and communication. The task for the
developer of the BSC is to devise methods to convert qualitative and quantitative data
into the traffic light monitoring status reporting. To acquire the data, each strategic
project has a tracking tool assigned to it. The most important tracking tool for Hapinoy
operations is the Community Store Audit.

70
Figure 20: Excerpt from Hapinoy Community Store Audit Form
The store doctor (SD), the MVI staff in the field supporting the CS, fills in the form on
each of the weekly visits and transmits the data to MVI where the results are aggregated.
The way to transform quantitative sales and profit data into status is by assigning ranges
of discrepancy to targets. For example, gross sale above 90% of target is considered
green, between 70% and 89% is considered yellow and below 70% is considered red.
On an aggregated level, 90% and above CS with status Green is considered green,
between 70% and 89% is considered yellow and below 70% is considered red. With this
method the sales progress on a CS level and on the MVI level is measured and flows
back into the BSC to complement the overall performance measurement.
A similar method is used for the qualitative data from the sales & operations and trading
post evaluation. If the sum of Yes scores is above 80%, status is considered green,
between 60% and 79% the status is considered yellow and below 60% the status is
considered red. On an aggregated level, 90% and above CS with status Green is
considered green, between 70% and 89% is considered yellow and below 70% is
considered red.

71
With this method progress on sales performance, store operations and implementation of
the POS project on a CS level and on the MVI level is measured against targets and flows
back into the BSC to complement the overall performance measurement.
6.3.4 Evaluating the BSC Project
Evaluating the project BSC, MVI management considers the development of the BSC
strategy map for Hapinoy as a useful exercise bringing all the existing programs and
objectives together and linking them in a coherent framework. It clarified the strategy and
forced strategic decisions, such as the shift from HS to CS as the main focus of the
Hapinoy program and the inclusion of other activities in the definition of operational
income. It also highlighted the relative importance of several strategic objectives such as
the need to recruit and train store doctors to be able to serve the CS. Connecting the
strategic projects with the objectives and assigning responsibilities and timelines gives
management the tool to overview and see and communicate internally the dependencies
of the projects. The monitoring tool is still work in progress as the CS audit forms need to
be aggregated and integrated into the CS dashboard. A first monitoring session was held
in July and clearly highlighted the progress in each project and objective.
Overall, management is satisfied with the Balanced Scorecard and will continue using it
in its strategy planning, implementation and monitoring.
6.4 Developing Marketing Methodology and Management
The objective “Developing marketing methodology and management” was taken into the
process perspective because some elements of the Hapinoy program were not working as
expected by MVI such as the introduction of new products. This indicated to
management that some basic assumptions about the market and the mindset of the people
involved were not correct and needed to be researched.

72
The introduction of new products has been a failure up to March 2009. The assumption of
MVI staff was that cheaper non branded products or goods from second tier brands would
be a good alternative to more expensive brands, as price was considered the most
important determinate in the decision making process of the consumer at the BoP. Based
on this assumption, a non-branded detergent from Khol’s Industry was introduced to
eight CS in February 2009. The main competitors are Champion, Surf and Tide, all very
established brands at the BoP. The price of the detergents was 40% below the price of the
least expensive branded good. Within the month of February and March not a single pack
was sold. What went wrong in this case and what went wrong with the general approach
MVI took for introducing new products and services? To find out more about it an
exploratory consumer research study at the BoP was started.
Drawing on the academic work of Chakravarti (2006) and D’Andrea et al. (2006b) and
action research oriented work by Bhan (2009) a qualitative exploratory study of
consumer behavior at the BoP in urban Manila was undertaken. The goal of the study is
to gain an insight into the mindset of the BoP consumer and how it manifests in terms of
consumer behavior. The study also set out to test assumptions from existing studies and
compare the results with global statistics. Once an understanding of the BoP consumer
behavior is gained, Hapinoy programs can be tailored towards the target group. The
limitation of this exploratory research is its location in the urban BoP and its small
sample size. To substantiate the findings, it has to be used to construct a quantitative
survey and tested in a rural environment.
6.4.1 BoP Consumer Behavior Study
Together with a female translator from the community, ten semi structured interviews of
an average length of one hour were conducted in May 2009 in Park7, an informal
settlement in Metro Manila where 300 families live, representing an urban BoP
environment. The interviewees were selected among the friends of the translator covering
the range of two poverty levels, as used by Social Weather Stations (SWS), a Philippine
survey company, and described by Flores (2009). The interviewees were the female head

73
of the household, as they were assumed to be the one responsible for the purchase of
consumption goods.
6.4.1.1 Income, Poverty Level and Income Pattern
The first part of the interview covered the income, poverty level and income pattern.
SWS uses a self rated poverty index (food-poor, borderline-poor and not poor) and
matches it with income levels on a regional basis. In Metro Manila food-poor households
in the first quarter of 2009 earned less than P4,800 a month, borderline poor between
P4,800 and P10,000 and non-poor above P10,000.
40% of the sample rated themselves as poor, 60% as borderline. Using the income
thresholds, 20% fall into the food-poor, 50% in the borderline and 30% in the non-poor
category, giving the sample a range of poverty levels on the account of income and self
rating. Testing Bhan’s (2009) assumption that not the income level itself but the pattern
of income determines the consumption pattern, it was found that all food-poor
respondents had an irregular and unpredictable income, whereas the borderline and non-
poor all had regular and predictable income, indicating that poverty level and income
pattern are correlated.
6.4.1.2 BoP Household Spending
The second part of the interview covered household spending.
Table 13: Household Spending Pattern in Global, Philippine and Community BoP
Category Global BoP Philippine BoP Park7 BoP Food 57.9% 59.1% 52% Energy and water 9.1% 7.3% 14% Housing 6.6% 9.0% 2% Transportation and ICT 4.6% 3.8% 14% Others and Health 21.8% 20.8% Health 2% Clothes 2% School Allowance 11% Children 3%

74
The spending on consumption goods (food, personal care and cleaning products)
averaged 52% with no difference between the food-poor and the borderline/non-poor
category and is below Philippine average. No explanation can be offered here as it could
be assume that it would be even higher taken the urban environment into consideration
where food needs to be bought and cannot be harvested as in a rural environment.
The lower average expenditure in housing can be explained by the fact that the survey
took place in an informal settlement and only 20% of the participants rent the house. The
higher average figure on energy and water can be explained by the fact that all houses
were connected to the formal energy and water grid and charged at the normal rate. In the
discussion it was highlighted that in addition to the cost of water and energy placing a
burden on the household, the mismatch between the pattern of income, irregular and
unpredictable, and the once a month payable invoice creates a cash flow problem, which
is mostly solved by the use of a moneylender. There are seven moneylenders active in
Park7, working on a 5-6 basis over 2 months, i.e. charging a monthly interest rate of
10%. The higher than average spending on transport and ICT can be explained by the fact
that most husbands with regular jobs have to use public transport or motorcycles using
gasoline to reach their place of work. In the category others, the high cost of school
allowance which summarizes pocket, food and transport money for the children going to
school is a fact previously not noted in the statistics. It sheds a light on the fact that
although public schooling in the Philippine is free, there is nevertheless a substantial cost
involved in sending the children to school.
6.4.1.3 BoP Consumer Goods Spending
The third part looked in more detail at the goods bought in the consumption category
consisting of food, personal care and cleaning products. It categorizes them according to
usage into stable, secondary and luxury items adapting the matrix developed by
D’Andrea et al. (2006b)

75
Table 14: Purchase Pattern in Consumption Goods Adapted from D’Andrea et al (2006b) Category Staples Secondary Luxuries Packaged Foods Rice Canned sardines Canned beef Dried fish Canned tuna Cheese Oil Tomato sauce Cookies Soy sauce Ready to eat Chocolate bars Vinegar Catsup Salt Flour Sugar Cereal Noodles Perishable Foods Fresh fish Fresh chicken, pork Fresh beef Fresh vegetables Ice cream Yoghurt Egg Fruits Beverages Milk Soft drink Tea Coffee Fruit juice Pipe water Ice Tea Beer Cleaning products Bar soap Softener Soap powder Bleach Personal care Toothpaste Cologne Make up Shampoo Alcohol Diaper Toilet paper Body lotion Deodorant Baby powder Sanitary napkin
From this data, the diet at the Philippine BoP can be constructed: It consists of rice or
noodles with fresh or dried fish and fresh vegetables and egg prepared with oil, vinegar
and soy sauce accompanied by water as beverage. Occasionally canned fish or pork and
fresh chicken or pork is added together with tomato sauce and ketchup, accompanied by
fruits, soft drinks or beer. Only rarely beef, cookies, tea and chocolate bars are consumed.
This data can be used to be matched with the assortment of the Hapinoy Stores.

76
6.4.1.4 BoP Consumer Shopping Behavior
The fourth part explored in detail the shopping behavior at the BoP. According to
ACNielsen (2004) there are five main places where people buy consumption goods in the
Philippines: Sari-Sari stores, market stalls, groceries, convenience stores and
supermarkets. The interviews revealed that the main shopping place for the food-poor
segment is the Sari-Sari store frequented up to thrice times daily. The borderline/non-
poor segment shops predominately in the grocery and the market where they go twice a
month on pay day, further highlighting the importance of the income pattern to the
shopping behavior. This segment also frequents the Sari-Sari store once a day, however
only for small purchases complementing the market and grocery purchases.
6.4.1.5 Brands at the BoP
The fifth part of the interviews focused on the importance of brands as opposed to non
branded goods in the shopping behavior at the BoP for consumption products. The
interviewees were asked for the name of the products they purchase of a selection of their
respective stable products.
Table 15: Brand Recollection at the BoP
Brand mentioned
Brand not mentioned
Detergent 11 0 Bleach 8 2 Toothpaste 10 0 Shampoo 10 1 Coffee 8 2
This table shows a very high recollection of brand names in the category of the stable
consumption goods, indicating the importance of brands in those categories. This
corresponds to Gnanakumar (2007) findings of a profound “depth of conscious and
subconscious feelings” towards FMCG brands in the Indian rural BoP context using
emotion mining techniques.

77
The dominance of the leading brands is indicated by the number of brands mentioned per
category.
Table 16: Brand Recognition at the BoP Category Number of brands mentioned Name of brand Toothpaste 1 Colgate Coffee 1 Nescafe Bleach 2 Zonrox, Chlorox Shampoo 3 Clear, Palmolive,
Head & Shoulder Detergent 4 Champion,
Safeguard, Tide, Ariel
The findings indicate that only a few brands per category dominate the market at the BoP
and that brand allegiance is high.
In the discussions it was tried to determine reasons for the attractiveness of brands to the
interviewees. As branding is an abstract concept, the discussion was difficult due to
language problems and problems with the basic understanding of the concept. The one
recurring theme in all cases was the term “quality”. This corresponds to the branding
concept which puts quality as one of the necessary core conditions for building a brand as
described by Holt (2004). The other components of branding such aspiration were not
mentioned. Also there was no indication that minimizing risk and maximizing return of
investment, as suggested by Bhan (2009) are of importance to the BoP in the context of
consumption goods. Therefore her characterization of BoP customers as strategic money
managers and not consumers could not be confirmed. The study suggests that quality as
the core ingredient of a brand is highly valued and the associated price is accepted.

78
6.4.1.6 Relevance of Findings to Hapinoy
The importance to Hapinoy of these findings is the understanding that there is a
segmentation of the consumer market at the BoP along the food-poor and borderline/non-
poor line. However, the determining factor is the income pattern regular – irregular
segmentation.
Both segments shop frequently in the Sari-Sari store, however for different reasons: The
food-poor for the majority of their purchases, the other segment for complementary
purposes. One can deduct that the Sari-Sari store is the pantry for the food-poor and the
extended pantry for the borderline/non-poor segment. With these differences in mind the
product assortment and other services can be better tailored to the needs of each segment.
The finding that with increasing and regular income, people switch from the Sari-Sari
store to the grocery and market for their main shopping means that purchasing power is
moving away from the Sari-Sari store. Strategically, Hapinoy stores can try to recover
this purchasing power by developing into a grocery or concentrating on its role as
extended pantry for the borderline/non-poor segment.
The decision which retail establishment within a category to visit, is done on the basis of
location, assortment, price and cleanliness for both segments. The food-poor segment
values additionally the informal credit as an important decision factor. The informal
credit is the possibility to pay the whole or part of the purchase later, usually at the end of
the day or the week. According to the interviews it is an important part for the
consumption smoothing of the food-poor consumer and on the retailer side it represents
an important tool to attract customer. The other important factor in the decision making
process on where to shop is the Suki relationship, which is a Philippine terminology
describing a regular customer-supplier relationship. Describing this relationship, it was
mostly characterized by friendship, thereby expanding the meaning from a purely
commercial relationship to a more encompassing relationship. On average, both segments
had three Suki relationships with Sari-Sari stores and in the market.

79
For Hapinoy, the shopping place selection criteria location, assortment and price was well
documented and know from the discussion with the stores. The criteria cleanliness and
Suki relationship were not identified before. Especially the Suki factor does hold a lot of
promise for the program, as a focus on the Suki relationship has the potential to drive up
number of customers and sales.
The importance of the major brands to the BoP consumer will be a major challenge in
Hapinoy’s quest to expand the product assortment in the CS and HS to secondary brand
or non-branded goods in the consumption product range. It also explains why previous
attempts to introduce those products have failed. A more in depth study into what
processes, for example training and product demonstrations, need to be initiated to
change the consumer behavior towards non-branded goods is necessary, before starting to
introduce new products to the Hapinoy stores. Additionally, Gnanakumar (2007) pointing
towards packaging of the product as the most important ingredient of brand equity at the
BoP, gives an indication for areas of further research into product design.
One of the reasons of the strategic objective to develop marketing methodologies was the
realization that Hapinoy needs to understand better the consumer at the BoP to not fall for
wrong assumptions in designing products and services. Market research in form of in-
depth interviews has resulted in valuable new information which Hapinoy can utilize for
its program.
6.4.2 Sari-Sari Store Survey
Out of a total of 3,981 HS, about 3,180 had no CS in the vicinity, leaving a potential of
800 HS for purchasing at the respective CS. However, only 200 bought there regularly.
According to the CS, the reasons were the comparatively high prices, incomplete product
line and inconvenient location of the CS. The communication about this issue has up to
February 2009 exclusively happened between MVI and the CS. There was little
knowledge about the buying behavior and store operations at the HS level. Therefore the

80
second primary research was undertaken by the internal market research team led by
Richie Magpayo in the context of understanding the behavior at the BoP involving the
Sari-Sari stores owners and their purchasing behavior. As they are the customer of the CS
it is important to know more about their selling and buying operations. A survey and
focus group discussions were conducted in three locations with a CS presence. 105 Sari-
Sari store owners, of which 80% were customer of the CS, were interviewed and their
operations observed. The focus group consisted of six female Sari-sari store owners.
6.4.2.1 Sari-Sari Store Sales Operations
The first part of the survey covered the store’s selling activities. Customers fall into two
groups: neighbors and passer-bys, both groups buy at the store because of location,
assortment, low price and the Suki relationship mirroring the result of the consumer
study. The amount spent per visit falls into two ranges: P10 to P20 for cigarettes, snacks
and soft drinks and P21 above for alcoholic beverages, soft drinks, snacks and rice. The
observed demographic profile came as a surprise as firstly children and secondly male
adults appeared as a large customer group, even outnumbering female customers. The
largest customer group was children with 40%, buying sweets for themselves or other
goods for the family, followed by male adults with 33%, buying predominantly alcoholic
beverages and cigarettes and the smallest group was female adults with 27%. This
statistic reveals why there is a discrepancy between the consumer study, in which the
sample consisted of women only and alcoholic beverages were hardly mentioned, and the
high sales figure for alcohol and cigarettes in Sari-sari stores: Philippine men buy their
alcohol and cigarettes themselves and appear as a new customer segment next to children.
75% of customer come to the store, buy and leave in less than one minute, only 25%
browse and chat and stay between 2 and 5 minutes which limits the interaction
possibilities of the store owner with consumer. However, it is the Suki relationship which
is, next to competitive pricing, the most important way to retain and attract customer.

81
6.4.2.2 Sari-Sari Store Purchasing Behavior
The second part of the interview covered the purchasing behavior of the Sari-sari store
owner. The main points of purchases were the CS and local groceries. The groceries were
chosen over the CS due to cheaper price, better product assortment and more convenient
location. On average, groceries were visited 4 times a week and between P1.000 and
P3.000 was spent. The CS was visited 3 times a week and between P500 and P1.500 was
spent. This spending pattern mirrors the result from the consumer survey in so far, as
groceries due to their price and product advantage attract a larger share of the
expenditure. Therefore improving on price and product assortment in the CS can have a
trickle down effect to the Sari-Sari stores making them more attractive to consumer.
In the focus group discussion, the issue of pricing was explored in more detail as it is the
key to improve the sales performance of the stores. It was also conducted to reconcile
feedback received via the field staff pointing towards the high prices in the shop as a
reason for not frequenting the CS and the assumption within MVI that based on its data
prices are low. The assumption was that Sari-Sari stores buy a basket of goods and not
individual goods. As no uniform low prices are possible, more expensive products are
offset by cheaper products making the whole basket price competitive. The FGD revealed
that stores buy products on an individual basis and not with a basket of goods in mind,
therefore the price setting on a basket size does not correspond to the way the stores
purchase the goods. The effect is that relatively cheap products are bought in the CS and
then the buyer moves on to the next store to complement its purchase and optimize the
cost of the basket. This finding needs to be considered when pricing the products in the
CS.
6.4.3 Application of Research Results in Hapinoy
Having established market research facts, the reason of the failure of the non branded
detergent can be given very easily: Detergent is a category where brand allegiance is very
high and low price alone does no sell a new product.

82
With the experience of studying the BoP and realizing the mindset differences in mind, a
strategic decision was taken by MVI management to institutionalize the process and
adapting the concept of co-creation as laid out by Simanis and Hart (2008) in the 2nd
edition of the BoP protocol. MVI decided for all projects to test its assumptions and ideas
first before starting the project by thorough market research and then co-create the new
product or service in focus group discussions with the nanays. Once the project is
designed, a rapid pilot project is started using funds from MVI to test the design of the
new product or service and adapt it according to the lessons learnt from the pilot before it
is rolled out to other stores.
Another effect of the in-depth discussions with the nanays and the resulting better
understanding of their mindset and their operations has been a clarification in the strategy
of MVI. According to Treacy and Wiersema (1993) a firm needs to adhere to one of the
three generic business strategies to achieve a competitive advantage: Operational
excellence, associated with price leadership, product leadership and customer intimacy.
As the reality of the program has shown, operational excellence is not achievable in the
current set up with only a limited number of participants in the supply chain. It is also
highly unlikely that it will be achievable in the near future as the FMCG business is a
volume driven business and the large retailers do have an unassailable advantage in this
respect. One of the main ingredients of such a strategy is a highly efficient supply chain,
a situation that Hapinoy is far from reaching. Therefore the promotion of Best Price as a
key feature of the program is misleading and stifling to the further development. As
Hapinoy does not develop its own products, the second option is not a valid one.
Customer intimacy, the other hand, does fit very well into the relationship based retail
ecosystem, exemplified by the Suki culture. Consequently, MVI moved away from the
illusive operational excellence towards the customer intimacy strategy and developed
projects based on this generic strategy.

83
6.5 Implementation of POS system
One of the main impediments to manage the supply chain in Hapinoy efficiently has been
the general lack of sales data from the stores. As most of the stores have either no or only
a manual record keeping system, there was no reliable information on sales and gross
margin levels. By way of analyzing supplier invoices, cash in hand and inventory count,
it can be theoretically possible to validate the data given by the nanays. However, the cost
involved far outweighs the potential benefit. Even more importantly from a supply chain
perspective is the sales data by product (SKU). Modern retail chains rely on
computerized systems to manage the supply chain. Data is collected from the point-of-
sale (POS) system at the checkout and send to the main office. With the help of minimum
stock analysis the optimal order quantity is calculated, aggregated and sent to the
manufacturers. The manufacturer delivers the goods directly to the store or to a
warehouse for further distribution. These automated processes are of strategic value to
retailers and generate competitive advantage, as Mike Troy (2002) describes for
Walmart, the world’s largest retailer. The start of the process lies at the checkout where
POS systems scan each item. Therefore MVI decided to develop a POS system for the
CS. A POS system consists of a specialized software and hardware including a PC,
monitor, printer and barcode scanner. A grant from GSM Association was acquired in
2008 which covered the development of a tailored system or adaptation of an existing
system to the specific needs of Hapinoy. Several potential systems were evaluated. An
initial pilot with an existing system was abandoned because the nanay refused to work
with it as it was not user friendly and her son ended up using it for computer gaming as it
was discovered during the familiarization visit. It was decided to invest in building a
custom made software by a software development company with special emphasis on
user friendliness to make adoption by the nanay easy. The hardware and the beta version
of the software were installed in December 2008 in an initial pilot in one CS and the
nanay tasked with building the database by scanning each item and adding name and
price and testing the system. After one month it was found out that the nanay is not using
or testing the POS system as she had too much other work to do. A staff from MVI was
then assigned to work with the nanay supporting and training her in pilot testing the

84
system. The database was completed, the system approved and the roll-out to 15 stores
was completed by April 2009 in agreement with the conditions of the grant by GSMA.
However, during July 2009 an evaluation of the usage of the system brought to light that
no CS was using the POS system. What went wrong?
The introduction of the POS system can be set in the context of technology at the BoP.
As WRI (2007) has shown, incremental income at the BoP is invested in technology
which increases earning potential such as mobile phones and transport. Also the success
of the Hapinoy e-load program using mobile phone technology does suggest that the BoP
and the Hapinoy store owners are not technology adverse. In a similar approach to the
tackling of the problem of not selling non branded items, the Hapinoy operations team
undertook a research project, starting with conducting research in the form of immersion
and in depth interviews with the nanays. It was found out, that indeed none of the stores
was using the POS system. Reasons given were manifold and included no time, hardware
breakdown and too complicated to use. Analyzing the results, it was concluded that the
nanays did not see a value in the system. Whereas for MVI, data is crucial to manage the
supply chain and monitor the stores, for the nanay the data is not worth the effort and
using the system is additional workload and considered waste of time. MVIs basic
assumption that the nanays would value the system as it gives them for the first time
exact sales, profit and inventory data was wrong. The nanay was content with an
approximation of this information based on her system of triangulation of supplier
invoices, cash in hand and inventory estimate. The POS Salvation project was started
piloting three different ways of data capturing with the aim of making it easier for the
nanay to use and still delivering the exact item based data to MVI. In the spirit of co-
creation and research based problem solving, the current methods of data gathering by the
nanays was observed. It was found that 10 out of the 15 operated a manual system, called
Pakora, of writing receipts to their wholesale customers with two nanays also keeping a
carbon copy. This system was piloted using a standardized form. The second pilot
involved scanning each item in a continuous flow into an excel sheet and in a subsequent
step encoding the data by MVI staff. In a third pilot a helper was employed to man the
POS station relieving the nanay of that task. After running the pilots and more in-depth
85
interviews with the participating nanays it was concluded that the problem cannot be
solved by technology which was developed without the involvement of the nanay. Going
back to the drawing board, the original question was re-framed to: How can MVI receive
the data it needs from the nanay in a sustainable manner? The first pilot was studied in
more detail and it was observed that the receipts with each item name and price listed
were issued on demand from the wholesale customers therefore it was a common and
recurring work process for the nanay. It was also observed that the Nanays are very
diligent in writing down the items. The approach was then to build upon this existing
methodology and not to impose a technological solution replacing it immediately. Based
on the Pakora method, a form and special booklet was developed that would make the
process easier for the nanay thereby giving additional value. The carbon copies of the
receipts will be collected and encoded by MVI staff on a weekly basis. With this method,
the technology was, for the moment at least, abandoned in favor of a manual system
building upon an existent method that delivers value to the nanay. In a second step, when
all nanays use the carbon copy receipt method consistently, it is envisaged to re-introduce
the POS system as a way to automate the cumbersome handwritten receipts, thereby
offering again value to the nanay. Until then, the computer will be continued to be used
for other applications, especially the new e-loading distribution software, making the
nanay more proficient in the use of computer.
6.6 Other Strategic Projects
During the action research phase with MVI other important strategic projects were
undertaken to achieve the strategic objectives laid down by the Hapinoy BSC. A
selection of those projects are described and sorted according to the BSC perspectives.

86
6.6.1 Learning Perspective
6.6.1.1 Strategic objective: Store Doctor Training and Recruitment
Strategic project: Store Doctor Training
Store doctor (SD) is the name for the MVI field staff. Their task is to visit the CS weekly,
conduct trainings, monitor the development of the store, assist in pilots and introduction
of new products and services and support the CS in all aspects. The monitoring is done
via the CS audit form and the results flow ultimately into the BSC. As MVI took charge
of the operations of Hapinoy and re-started the CS recruitment process in the beginning
of 2009, the expansion of the SD staff had to catch up and then grow in line with the
number of CS. Each SD is responsible for 10 to 12 CS and visits each of them on a
weekly basis. To prepare the SDs for their job, a training manual was developed and
training sessions conducted. The SD is the face of MVI to the nanays and his and her role
is crucial to Hapinoy in terms of gaining the trust of the nanay, observe and transmit
information both ways and gain a deeper understanding over time of their mindset.
Thereby the SDs will provide the groundwork for the process of co-creation of products
and services.
6.6.2 Process Perspective
6.6.2.1 Strategic Objective: New and Existing Business/Services/Supplier Development
and Delivery
Strategic Project: Improve Supply Chain
Connected to Strategic Objective in Customer/Supplier perspective: MVI no 1
Source of Purchase for Optimal CS Assortment
The supply chain is at the core of the business model of Hapinoy and therefore of utmost
importance. To create an efficient and effective supply chain generating value at each
level the operations underwent several changes during 2009. As indicated in the

87
familiarization phase, the original model did not work to the satisfaction of any party
involved.
Table 17: Original Hapinoy Supply Chain Model Supply chain Planned Benefit Problem Consequence Manufacturer partner
Formalizes channel at BoP, demonstrate CSR commitment
Insignificant quantities lead to low discounts
No new partners attracted
MVI Income from supplier
Unable to collect income share
Missed income target
Regional Exclusive Distributor
New customer leading to increase in sales
Unwillingness to grant discounts Low volume making delivery unattractive
Low participation rate in program
Hapinoy Community Store
Best price, assured supply, participation in promotions
Best price not achieved, supply from assigned regional distributors infrequent
Revert back to existing suppliers
Hapinoy Store Best price, product promotions
Best price not achieved
Revert back to existing suppliers
One of the core reasons why the supply chain did not work as expected is the fact that in
the FMCG market margins are very slim. Even with the best intention, the Hapinoy
manufacturer partners were unable to grant more than 5% additional discount. Since for
the model to work this discount had to be distributed to MVI and CS and still deliver best
price to the HS, there was just not enough margin to distribute. Another core problem
was that the partner line up did include important manufacturers for the CS, however, not
all, therefore leading to an incomplete product assortment.
To solve the problem of dealing with the regional exclusive distributors and to offer a
more complete product assortment a partnership with Suy Sing, a multi line distributor
was agreed. Suy Sing specializes in the delivery of products to groceries, carries
thousands of articles and offers promotions and discounts. In a price comparison analysis
it was found that Suy Sing prices were on average 6% lower on the CS level than the

88
existing pricing from the regional distributors. It was therefore well suited to streamline
the Hapinoy supply chain. The system was put into place, orders from CS were
aggregated and the first delivery took place in March 2009. After the first round of
delivery to the CS, a new problem appeared. For restocking the supplies at the CS smaller
quantities per product were needed, Suy Sing, however, does not break cases, meaning
that the customer has to always buy the whole box. Therefore the Hapinoy supply chain
was broken again because the minimum order quantities per product with Suy Sing could
not be reached even from the largest CS although the total minimum order size of
P25,000 was reached by most CS.
Table 18: 2nd Hapinoy Supply Chain Model Supply chain Planned Benefit Problem Consequence Manufacturer Suy Sing New customer base Supply chain broke
down at CS level No sales
MVI Income from share in additional discounts
Supply chain broke down at CS level
Miss income targets
Hapinoy Community Store
Best price, assured supply, wide product assortment, participation in promotions
Minimum order quantities from Suy Sing not reached, stopped supply via Suy Sing
Revert back to existing suppliers
Hapinoy Store Best price, wide product assortment
Best price and wide assortment not achieved
Revert back to existing suppliers
As the minimum order quantity per product is the core of the problem in the second
supply chain model, a new level in the supply chain needed to be introduced which was
called Hub. In each of the four regions, one CS was selected to provide space for a
warehouse facility where Suy Sing could deliver to. In the Hub, the cases are broken
according to the orders from the CS and delivered to them. As of August 2009, the Hub
facility is rented from the CS and operated by MVI for pilot purposes. It is planned to
turn it over to the CS once the system is established and working. The additional level
will be financed from additional discount given by Suy Sing for picking up the goods at
its warehouse and is thereby cost neutral. In addition to new ways of delivering existing
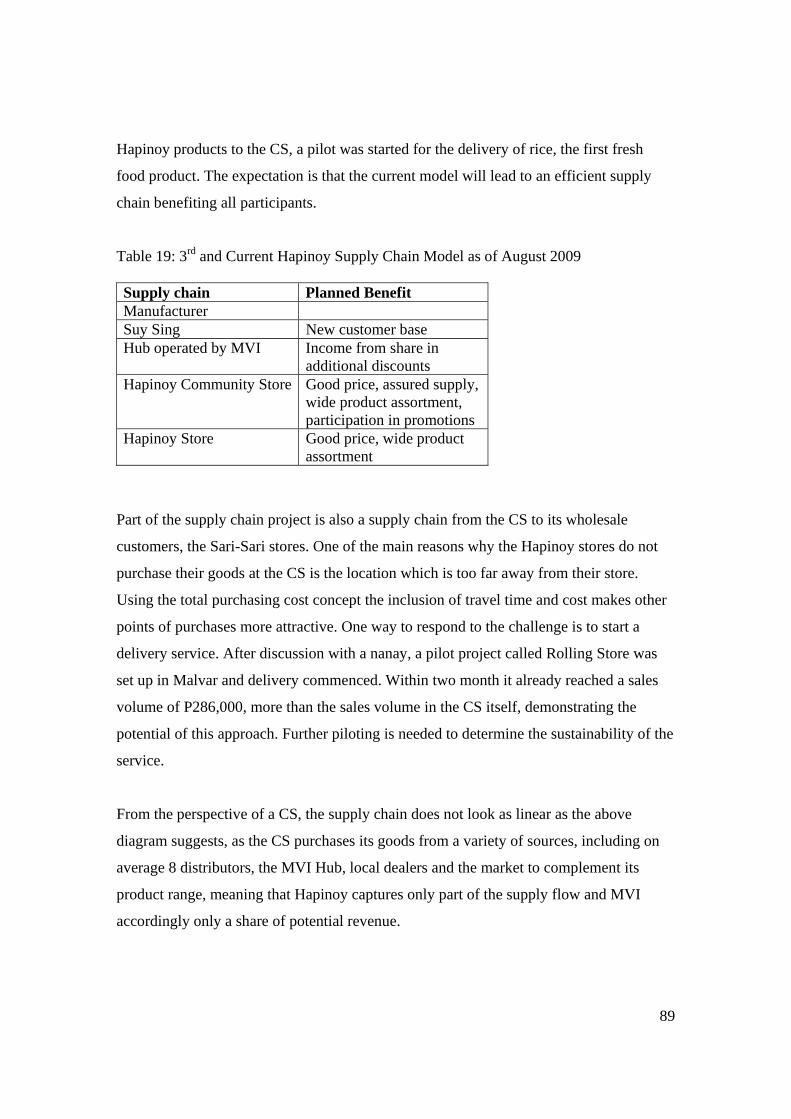
89
Hapinoy products to the CS, a pilot was started for the delivery of rice, the first fresh
food product. The expectation is that the current model will lead to an efficient supply
chain benefiting all participants.
Table 19: 3rd and Current Hapinoy Supply Chain Model as of August 2009 Supply chain Planned Benefit Manufacturer Suy Sing New customer base Hub operated by MVI Income from share in
additional discounts Hapinoy Community Store Good price, assured supply,
wide product assortment, participation in promotions
Hapinoy Store Good price, wide product assortment
Part of the supply chain project is also a supply chain from the CS to its wholesale
customers, the Sari-Sari stores. One of the main reasons why the Hapinoy stores do not
purchase their goods at the CS is the location which is too far away from their store.
Using the total purchasing cost concept the inclusion of travel time and cost makes other
points of purchases more attractive. One way to respond to the challenge is to start a
delivery service. After discussion with a nanay, a pilot project called Rolling Store was
set up in Malvar and delivery commenced. Within two month it already reached a sales
volume of P286,000, more than the sales volume in the CS itself, demonstrating the
potential of this approach. Further piloting is needed to determine the sustainability of the
service.
From the perspective of a CS, the supply chain does not look as linear as the above
diagram suggests, as the CS purchases its goods from a variety of sources, including on
average 8 distributors, the MVI Hub, local dealers and the market to complement its
product range, meaning that Hapinoy captures only part of the supply flow and MVI
accordingly only a share of potential revenue.

90
6.6.2.2 Strategic Objective: CS Store Standardized Operation and Services – Project BIR
The BIR, Bureau of Internal Revenue of the Republic of the Philippines, is the Philippine
equivalent to the IRS, the Internal Revenue Service, in the US. It is responsible for the
collection of personal, corporate and value added tax. The project BIR looks into the
whole issue of formalizing the operations of the Hapinoy stores. Although not legally
responsible, MVI views it as its obligation to inform the store owners about the legal
situation and possible ways to move from the informal to the formal economy.
According to Schneider (2005) informal enterprises encompass the “market-based legal
production of goods and services that are deliberately concealed form public authorities
… to avoid payment of…taxes, to avoid payment of social security contributions, to
avoid having to meet certain labor market standards…, to avoid complying with certain
administrative procedures”, in summary, informal enterprises are legal but not registered.
A survey among the CS owners revealed that all of them fall into this category.
Schneider’s study revealed that the size of the informal economy in developing countries
is large, averaging in 2003 43.2% in Africa, 30.8% in 2003 in Asia and 43.4% in Latin
America. He concludes that the informal economy is a “complex phenomena” and people
engage in the informal economy mainly as “a reaction to government actions, most
notably taxation and regulation”. In the Philippines the size of the informal economy is
significantly above the Asian average and increased from 43.4% in 1999 to 45.6% in
2003 which ranks it on forth place in Asia behind Thailand, Cambodia and Sri Lanka.
Another way to measure the size of the informal economy is the number of people
engaged in it. According to Chanco (2009) the estimates range from 10.5 million, as
counted by the National Statistical Office, to 24.6 million, as estimated by the UP
College of Social Work and Community Development, amounting to between 33% and
76% of the total labor force in 2008. Taking all the figures together and considering the
effects of the economic crisis, it is safe to say that about half of the Philippine economy is
informal in 2009.
As Schneider pointed out, avoiding government regulation and taxation are the main
reasons for the engagement in the informal economy. The relevant government regulation

91
and taxation can be gauged using the Doing Business Report by the World Bank (2009)
series that compares regulation in 181 countries. The result for the Philippines, ranked
140th out of 181 countries, shows that government regulation makes it very difficult to
run a formal business in this country and the situation is worsening as the drop by four
places indicates.
Table 20: Doing Business 2009 – Table on Ease of Doing Business Category Doing Business
2009 rank Doing Business
2008 rank Change in rank
Doing Business Total score rank
140 136 -4
Starting a Business 155 151 -4 Employing Workers 126 123 -3 Getting Credit 123 116 -7 Protecting Investors 126 125 -1 Paying Taxes 129 132 +3 Enforcing Contracts 114 113 -1 Closing a Business 151 150 -1
To start a business takes 15 procedures and 52 days costing 29.8% of per capita income.
The total tax rate is 50% of profit and it takes 195 hours per year to administer the
taxation. In short, it costs a lot of money and time, not only once but every year thereafter
to move from an informal to a formal business in the Philippines.
To make this move more palatable, the Philippine government has enacted in 2002 the
Barangay Micro Business Enterprise Act RA 9178 (BMBE) which exempts micro
businesses, which are defined by income of less than P3 million per year, from tax and
eases regulations and registration requirements substantially. It has the potential of
smoothing the entry into the formal sector. However, the law has not been implemented
properly, partly due to resistance from local officials and BIR, and as a consequence,
only few businesses have registered under the BMBE law according to Indon (2007).

92
Another perspective on the issue of formality and informality is the analysis of potential
benefits for the owner of an informal enterprise to become formal as there are
1. Building of equity in the business
2. Access to finance from formal sources
3. Safety net against harassment from officials
4. Competitive advantage through inclusion in formal supply chain
5. Contributing towards Philippine development
6. Fines for non compliance
In discussions with the nanays the potential benefits were discussed and most of them
were dismissed. Equity in a Sari-Sari store is difficult to build and Hapinoy brand equity
currently built is accumulated in MVI rather than the individual store. Access to
financing and inclusion into the formal supply chain is already achieved through the
Hapinoy program. On the issue of harassment, the opinion was rather that coming out
from “under the radar” would make them more vulnerable to official harassment as it
indicates that the business is profitable. Fines for non compliance were not considered a
danger as controls were not experienced. The morale issue of paying taxes to contribute
to the development of the country was dismissed with reference to the corruption in the
country which is confirmed by Transparency International’s (2009) corruption ranking
where the Philippines ranks 131 out of 179. To summarize, there is no incentive for the
nanay to formalize her business, she only occurs cost and has to spend time. However,
the negative impact of this situation is that it constitutes an important impediment to
growth, as the nanay prefers to stay under the radar. It also discourages accurate record
keeping. Therefore it is in the interest of MVI to explore ways of formalizing the store
operations. To that effect MVI started to engage in a dialogue with the authorities in
2008.

93
6.6.3 Customer Perspective
6.6.3.1 Strategic Objective: Improve CS Effectiveness and Efficiency
Strategic Project: Project CS Meeting and FLEX Workshop
From 2008 onwards a monthly CS meeting was conducted where all CS store owners met
with MVI and CARD BDS for one day. As the number of CS grows, regional CS
meetings are conducted to assure effective meetings. During the meetings, the nanays
have the opportunity to meet, exchange information about success and failures, learn and
bond with each other. For the first time, they feel not as single entrepreneur but as a
group which benefits from each other. The communication is not restricted to the day of
the CS meeting but continues during the month using text messaging. Also during the
meetings, manufacturers have the opportunity to present new products and MVI and BDS
announce new services.
FLEX is the name for a two day personal development workshop developed by MVI. It
was conducted twice during the period October 2008 to July 2009. At the first, 12 nanays
participated at the second there were 43 participants. The workshop is an in-depth shared
experience of nanays and MVI staff aiming at establishing a common mindset and build
confidence.
Both projects are therefore key projects in the co-creation process and are equally highly
valued by the nanays.

94
6.6.3.2 Strategic Objective: Increase Number of CS
Strategic Project Expansion
Connected to Strategic Objective in Process Perspective: MVI - BDS
Coordination on all Levels
Following the Joint Strategy Workshop and the new focus on CS as the prime stakeholder
in Hapinoy, MVI took the lead in the expansion process and assigned staff dedicated to
CS expansion. The recruitment of HS was continued with the external recruitment model
until the numbers stipulated by the agreement with Smart were reached in May 2009 and
then discontinued.
In a first phase, the new approach consisted of matching the existing HS with new CS.
The idea was to map each town where HS were registered and appoint a CS to serve
them. However, this model proved not to be successful as the HS were too scattered and
the mapping process too time consuming. It was therefore decided to formulate an
expansion plan independent from HS locations and focus an establishing one CS in each
town starting with the pilot areas and expand from there into new areas. To this effect
MVI staff started the coordination with the regional managers of CARD Bank and NGO
to get their understanding and buy-in into the program. Unit managers in the target area
were tasked to find suitable CS candidates who were then screened at a one day
workshop by MVI according to business criteria and by CARD BDS according to
financial criteria. During the workshop the CS are selected and receive introductory
training. In contrast to the first CS expansion in 2008, the business criteria were modified
substantially. Whereas before central store location, capacity to repay the loan, standing
with CARD were the most and entrepreneurial drive was the least important criteria, it is
now the other way round with entrepreneurialism leading the criteria list. The reason for
this change was the realization that a key success factor for the success of a CS is the
willingness to grow and to take on new business opportunities and challenges. Again, a
major assumption was challenged. It was assumed that Sari-Sari store owners at a certain
size have a willingness to expand when being offered the opportunity to earn more
income. However, it was found that some are content with their current level of

95
operations, making them unsuitable for the program. This tendency to smallness has been
identified by Joaquin (2005), one of Philippine’s foremost writers, as a national trait in
the Philippines and must therefore be considered seriously in the assessment of the
potential CS owner’s character.
As of August 2009, the expansion plan is on track to reach the target of 150 CS by the
end of 2009 and expanding outside the initial pilot area into the neighboring Bicol region.
The active recruitment of HS was stopped in May 2009. With the shift in attention
towards the CS, the perspective of the CS on its customers was adopted and integrated
into the BSC framework. A CS has two groups of customer: the consumer, also called the
retail customer, and the Sari-Sari store, called wholesale customer. The further
segmentation of the wholesale customer into Hapinoy and non Hapinoy was abandoned
in favor of segmentation into Suki and non Suki. As one of the three levers to increase
sales volume at the CS is to increase the number of Suki, projects were initiated to drive
up their number. The target is to have 150 Suki per CS and the CS is responsible for
reaching this figure. One of the projects which promises to have a positive effect on the
number of Suki is the sales of Smart e-load by the CS. As the new painting and signage
activities will be based on signing up to the e-load program, those stores will be added to
the merchandised Hapinoy stores number. Another project is the rolling store which has
shown positive results in the pilot in Malvar, increasing number of Suki from 50 to 140.
Basically, the Suki has become the new Hapinoy store thereby aligning MVI and CS
perspective. In terms of expansion, the goal is to reach 150 CS serving 150 HS each,
totaling 22.500 HS in this region. Due to the time lag of building up the HS network
through the CS, the number is expected to reach about 5.700 HS by the end of 2009. As
of July 2009, 1.270 HS are participating in the supply chain, averaging 42 HS per CS. In
contrast to the previously recruited HS, the new HS will be actively engaged in the
Hapinoy supply chain and have to be compared with the 200 HS which participated in the
supply chain of the old model.

96
Key to success of the new expansion process is the leadership of MVI in very close
cooperation with CARD BDS and the alignment of CS’ and Hapinoy program’s goals.
Practically embedded in the BDS operation in San Pablo, sharing common offices,
Hapinoy was able to fully leverage the possibilities in terms of outreach of CARD BDS,
Bank and NGO to the benefit of the program to recruit CS and to use the CS as the driver
for the expansion on the HS level.
6.6.3.3 Strategic Objective: Increase CS revenue
Strategic Project: Path to 500
Connected to Strategic Objective in the Finance Perspective: Grow Income
The Path to 500 project is run by the marketing and operations team in MVI. The
program’s target is to enable all CS to reach on average a monthly sales volume of
P500,000 and monitor the progress in the BSC. This average figure is broken down into
retail and wholesale sales with a split of P100,000 to 400,000. Concentrating on the
components of the wholesale business a formula was devised further breaking down the
total figure:
Total Wholesale Sales= No of Suki x Visit Frequency x Sales/Visit
Sales of P400,000 = 100 Suki x 8 times per month x P500
The breakdown of the sales figure enabled MVI to focus its attention on the levers which
drive sales and devise strategic projects together with the nanays to firstly increase the
number of Sukis, secondly increase the amount spent per visit and the visit frequency. All
parameters are weekly tracked in the CS Audit Form and centrally monitored. To adjust
for the differing sales volume when a Sari-Sari store becomes a CS, theses average
figures are customized to the individual store. According to its progress and starting sales
volume, the store is classified into one of four levels.
Part of MVI’s income is derived from the CS service fee. There have been prolonged
discussions about the right way of charging a fee from the CS enabling MVI to become

97
sustainable and at the same time offering value for money to the CS. There have also
been discussions with the nanays about a fair service fee. The alternatives were a fixed
fee and a variable fee depending on sales volume. The nanays expressed a preference for
the variable method, as they want MVI to participate in the success of their enterprises. It
also provides them with a cover in times when sales volume is down. To determine the
percentage of the fee, the willingness to pay technique was used and the nanays asked to
write down anonymously the percentage they considered as fair. The result was a service
fee of 2%, which was above the expectations of MVI. Besides being a sign of
appreciation, this technique demonstrated its potential to arrive at a higher figure as
assumed with the other party still being content with the result. The first variable service
fees were collected in June 2009 based on the deliver from Suy Sing. As this supply
chain was discontinued after one delivery, the service fee was calculated on the goods
delivered via the MVI hub. In connection with the Path to 500 project the service fee
issue was again tackled combining a flat fee with the variable approach by defining four
levels of service fees depending on the level into which the store is categorized. This new
structure has yet to be introduced.
The details of the strategic projects deriving from the Path to 500 project were in the
spirit of co-creation developed with the nanays and piloted in one store. During the pilot
phase important information could be gathered and the projects fine tuned.
6.6.3.4 Strategic Objective: Improve Financial Services
Strategic Project IFS, PAL and GC
Connected to Strategic Objective in Process Perspective: MVI - BDS
Coordination on all Levels
Another key element in the Hapinoy program is the financing of the stores organized and
funded by CARD. The original Hapinoy idea was to combine the MVI business model of
the aggregation of Sari-Sari stores with the 60.000 Sari-Sari stores which were already
CARD members. One of the original benefits was the additional loan a nanay could avail
to fund the expansion of her business through the Hapinoy supply chain. The importance

98
of the financing and the management of the loan program was highlighted as some CS
nanay threatened to quit the program in 2009 because of problems with the reconciliation
of their loans with CARD BDS. CARD BDS cleared the issues in a timely fashion so the
nanays stayed on board, but the action was a reminder how closely the success of the
CARD loan program is related to MVIs success and that it forces both partners to work
together in a coherent manner. In 2007 and 2008, the Hapinoy stores could avail an
additional loan between P3,000 and P8,000 from CARD Bank and NGO. However,
contrary to the initial idea of the loan as a top-up loan which can be availed immediately
after joining the program, CARD Bank and NGO, due to administrative issues, decided to
wait until the current loan cycle expires and then to issue an increased loan, however,
only if the unit manager agrees. This not only delayed the effect of the loan program on
the Hapinoy program, as there was no additional capital for the stores to fund their
expansion it also led to a misalignment of incentives as CARD BDS did not profit from
the HS loan program. As the Hapinoy loan was not a separate financial product but an
increased traditional micro-loan, the MIS did not track it, so there is no information how
many HS actually availed this increased loan. The other loan product was a loan to the
CS, administered by CARD BDS. The loan sized depended on the assessment of the BDS
staff. The problem with this loan was that the nanay had to repay the principal as any
other micro-loan which meant she had to reduce her inventory to be able to repay the loan
which complicated her management of the store as it led to inefficient and fluctuating
stock levels.
With the focus on the CS and the concentration of CARD BDS on the financial aspects of
the Hapinoy program in 2009, three new financial products were developed. These new
products were not existing products adapted to the program as before, but financial
innovations created with the customer in mind. This indicates a shift from a product
driven MFI to a customer driven MFI on the side of CARD BDS.

99
6.6.3.4.1. Inventory Financing Scheme (IFS) for CS
The IFS was introduced to remedy the problem of forced stock liquidation to repay the
loan. It is a one year interest only loan of P100,000, P200,000 and P300,000 whose
principal does not have to repaid during the cycle. It is collateralized to 120% against the
inventory in the store to create a security for the increased risk. It is issued by CARD
BDS whose staff monitors the stock level on a regular basis. The nanay will use the loan
to pay in cash to distributors, either the exclusive regional distributor and/or MVI Hub. It
represents a major innovation for CARD as it departs from non-collateralized micro loan
with regular repayment of the principal. As of July 2009, the IFS loan outstanding
amounts to P5.2 million, and no interest payment problems have been reported.
6.6.3.4.2 Productive Assets Loan (PAL) for CS
When a Sari-Sari store becomes a Hapinoy CS it changes its business model from a retail
business to a combined retail and wholesale business and grows. Therefore a store
renovation or the investment in store technology, such as the POS system, becomes a
necessity. PAL was introduced for that purpose. It is a loan to be used for capital
expenditure. Interest and capital is repayable on a regular basis. This loan is also
administered by CARD BDS. As of July 2009, three loans with a total sum of P160,000
were availed.
6.6.3.4.3 Gift Cheque (GC) for Sari-Sari Stores Redeemable at CS
The GC loan was developed by CARD BDS and MVI to enhance the supply chain
linkage between Sari-Sari stores and the CS. A GC is a monthly loan of P1,000 or P2,000
given to Sari-Sari store owners by CARD Ban k and NGO in addition to their regular
loans and redeemable only at the local CS. This financial product reaches two goals.
Firstly, it gives immediate additional capital for Sari-Sari store owners. Secondly, it
increases immediately sales volume at the CS and gives the CS owner the opportunity to
transform the new customers into Sukis and Hapinoy Stores. As of July 2009 GCs were

100
issued at three pilot sites with a target of reaching a loan volume of P100,000 before
expanding the program.
The GC has also the potential to be used as consumption loan when given to CARD
members who have no Sari-Sari store business. Collins et al (2009) have confirmed a
long held suspicion that MFI loans are not used exclusively to finance micro
entrepreneurial activities but also to smooth consumption. So, the GC would
accommodate this loan usage and at the same time keep the money within the community
as it has to be spent at a CARD member store. It therefore could be the start of the
development of local currency, a concept which is being seen as a powerful driver for
community economic development, as for example by Williams (1996).
6.6.3.5 Strategic Objective: Increase CS Wholesale Revenue
Strategic project: Smart E-load
The Smart e-load program has initially been one of the main benefits to the HS as up to
1,500 stores traded with it purchasing P3.3 million worth of airtime in October 2008. As
of July 2009 this number has gone down to P2 million because many e-load retailers
bought their airtime from other distributors and sub-distributor at a cheaper price. The
competition among the distributors was not controlled by Smart and increased as there
was no limit on how many times an e-load can be sold and purchased. In January 2009,
Smart announced a change in its policy eliminating the possibility to resell load
continuously and thereby regaining control of the market. It appointed several key
account distributors among them MVI. MVI lists the CS as subsidiaries and thereby
opens up the opportunity to them the sell e-load as an official distributor. In July 2009 the
transition phase started in three pilot areas as CARD relinquishes its e-load distribution
business and transfers it to the CS. The HS e-load retailer were informed about the steps
and encouraged to purchase their e-load from the local CS. The CS are tasked with
recruiting at least 100 e-load retailers who would be locked into the CS as their point of
purchase due to Smart’s new controlled distribution strategy and thereby generate
recurring income for the CS. The CS has to use a computerized system to distribute the e-
load and so the computer, previously used as a POS system, got another use as e-load

101
station. CARD’s e-load loan program will also be stopped when the transfer of the
distribution business is completed. The replacement for this loan program is the GC
which can be used to purchase e-load from the CS just as any other product further
streamlining the loan products. Although the e-load program did generate income for
MVI and BDS, it was an unprofitable venture for BDS as expenses exceeded the income.
Therefore the new system is a benefit for BDS as it stops an unprofitable business and for
the CS as it gains an important new product with the potential of generating recurring
income. This program will also serve as a marketing tool to recruit new Sukis as the
nanay is tasked, and supported by MVI, to actively seek e-load retailer which will then
frequent the stores for other purchases as well.
6.6.3.6 Strategic Objective: Increase CS Revenue
Strategic Project: Hapinoy Plus
From 2000 onwards, supermarket and department store chains have expanded from the
NCR region into the province. For example SM Corporation now counts 100 stores all
over the Philippines and will continue to grow. The effect of a supermarket opening on
the Sari-Sari store environment was observed in one of the CS pilot areas. The revenue of
the CS went down substantially on the wholesale side as Sari-Sari stores either went out
of business or started sourcing from the supermarket. On the retail side, consumer also
went to the supermarket for their household purchases. This poses a thread to the
Hapinoy program when it continues to focuses mainly on the grocery business in direct
competition with much larger corporations. Therefore MVI explores other business
opportunities which can be delivered on a shared channel basis through the Hapinoy
supply chain. Discussions have started on the distribution of generic medicine and a pilot
is being conducted for a Hapinoy photo print corner inside a store. These new businesses
can complement the CS’s offering and make it less dependent on the low margin grocery
business.

102
6.6.3.7 Strategic Objective: Improve CS Store Operations
Strategic Project: Implement Store Planogram
Observations in the CS have shown that the store layout is not optimal and the stores do
not have the appearance of a modern grocery business. In modern retail, the layout of the
store, the aisles, the signage and placement of the products is very important for the
store’s success and major investments are undertaken to optimize these factors. Using the
co-creation approach, MVI tackled this subject together with the nanays by firstly
observing the flow of customers. It was validated that retail customer stand in front of the
shop’s window and are being served through it, wholesale customer go inside the store
and browse along the shelves. MVI and nanays then worked on optimizing the layout of
the store, the product placement and introduced price signage at the shelves. A check-out
counter was developed and installed in 15 CS. The check out counter and the shelves
were painted in the Hapinoy corporate colors to convey a clean and modern look and feel.
6.6.3.8 Strategic Objective: Increase Revenue from Other Activities
Strategic Project: Smart Tipit-Sulit
Connected to Strategic Objective in the Customer Perspective: Increase CS
Revenue
The inclusion of income from other activities into the category of ordinary operational
activities, i.e. not categorizing them as extraordinary income, received strong
confirmation with the signing on as Smart’s Tipit-Sulit partner. Tipit-Sulit, translated
“Frugality and value for money”, is a high profile advocacy marketing campaign
promoting values such as hard work, ingenuity and perseverance and connecting them to
Smart’s Talk’n Text mobile phone product. Smart features Hapinoy and the nanays to
demonstrate the above mentioned values in everyday Philippine life. In addition to two
page spreads in national newspapers and a TV advertisement campaign, further
grassroots activities are planned at CS store level. MVI undertook research in form of
focus group discussions and surveys to understand the meaning of Tipid Sulit at the BoP.

103
The findings will be used to design the campaigns together with the nanays and Smart.
MVI decided to share the income from this marketing activity with the participating
nanays encouraging thereby active involvement from their side. This sharing of income is
a further indication of a social enterprise. As the importance and frequency of marketing
activities increases, it will provide not only MVI but also the nanays with a recurring
income stream.
The establishment of sound methodologies and procedures on BoP product and service
has made MVI attractive to companies which plan to engage in the BoP market, for
product development, market research and piloting. This activity could provide another
income stream for MVI and the nanays.
6.7 Evaluation
In August 2009 the original nine CS covered during the familiarization phase were
visited again and evaluated, based on a one hour in depth interview and observation in the
store.
Out of the nine, eight were still active as CS, one nanay had dropped out of the program
as her business had faltered and she had stopped running a Sari-Sari store.
6.7.1 Economic Evaluation of CS
78% of the CS have a higher sales volume in July 09 as they had before they joined the
program with an average increase of 157%. During the time period covered, October
2008 to July 2009, the average sales volume went down by 11.1%. This leaves an
increase of 129% from the time they joined until July 2009.
Between October 2008 and July 2009, 44% of stores increased their sales, 56%,
experienced a sales reduction. However, 67% said that they are “economically better
off”. The nanays ranked the additional loan as the most important economic benefit of the

104
program, followed by increase in number of customers, widening of product assortment
and business education.
The average number of Suki nearly doubled to 40 Sukis per CS as compared to the
number of Hapinoy store buying in October 2008. The spread of sales among the CS has
decreased from 30 to 8 times between the lowest and highest as the new CS increased
their sales whereas two established CS experienced a decrease. This figure indicates the
trend that CS who had previous wholesale experience reported on average a decrease in
sales whereas CS who did not had a wholesale business before joining Hapinoy reported
on average an increase in sales.
The average gross margin remained at 8% and 4% for retail and wholesale business
respectively. On the expense side, the reduction in sales was mirrored by a reduction in
loans and interest payment went down by 43%. Net profit was reduced by 5.2% for the
period, 149% above the net profit before the stores joined the Hapinoy program. Net
profit margin increased by 0.3% for the period and 0.4% for the whole Hapinoy
membership time. Again, this is only due to the reduction in interest payments.
Table 21: Average Income Statement of a CS before joining Hapinoy Daily Monthly % Sales 5,600 168,000 Wholesale 1,400 Retail 4,200Gross Margin 56 336 392 11,760 7% Rent 24 Salary 67 Electricity 8 Interest 68Expenses 167 5,010 Net Profit 225 6,750 4.0%
.

105
Table 22: Average Income Statement of a CS in October 2008
° Before joining Hapinoy
Table 23: Average Income Statement of a CS in July 2009
Daily Monthly % % Change to Start°
% Change to Oct.
Sales 12,800 384,000 + 129 % - 11,1% Wholesale 6,600 Retail 6,200 Gross Margin 264 496 760 22,800 5,9% + 98 % - 12,4% Rent 24 Salary 67 Electricity 8 Interest 99 Expenses 198 5,940 Net Profit 562 16,860 4,4% + 149 % - 5,2%
° Before joining Hapinoy
According to those figures the Hapinoy program did not lead to an increase in the gross
margin percentage as it would be expected from an improvement in the supply chain. On
the bottom line there is a relative improvement on the net profit percentage, however, this
Daily Monthly % % Change to Start°
Sales 14,400 432,000 + 157 % Wholesale 7,100 Retail 7,300 Gross Margin 284 584 868 26,040 6% + 121 % Rent 24 Salary 67 Electricity 8 Interest 176 Expenses 275 8,250 Net Profit 593 17,790 4,1% + 163 %

106
is due to a reduction in financial expenses and not due to improved efficiencies. For the
period observed, the net profit went down by more than 5%.
Important factors have to be considered before assessing the impact of the Hapinoy
program using this data and analysis. As no control group was selected, the decrease in
sales can be due to other factors, such as the economic crisis that arrived in the
Philippines in the beginning of 2009. It was not possible to define a meaningful control
group of Sari-Sari stores, as the Hapinoy program added for 30% of the sample a new
business line to the enterprise which other Sari-Sari stores did not do, in 70% of the
sample a wholesale business was already in operation. This diversity is also a hindrance
to arrive at a meaningful average income statement figures. To study the effects of other
factors on sales income, an individual analysis and not the analysis of the average figure
is necessary. Although the sample covered 64% of the population of the pilot stores, the
small population itself does not allow for generalizations. As the program only had 14
stores in October it was all the analysis could work with, however the caveat remains. As
mentioned before, primary data quality is doubtful, as the sales figures and margins are
not derived objectively from computerized systems or written records but from the
subjective assessment of the nanay. This fact alone makes the interpretation of the result
very difficult (Garbage in – Garbage out). Another factor which skews the result is
seasonality as the baseline data is taken in October and the evaluation data is taken in
July which could not be factored out due to a lack in comparative timeline data. As Kobb
(1997) pointed out, even the person asking the question, in this case a Caucasian male,
does influence the result.
In addition to the economic data, other data, regarding the individual’s assessment, was
taken and analyzed. Although only 44% of the stores experienced an increase in sales
volume, 67% felt “economically better off” pointing towards the existence of other
factors in the individual’s assessment of her economic situation. All of the stores owners
made positive comments regarding their development as an individual during the nine
months, pointing towards a positive impact in terms of empowerment.

107
6.7.2 Individual Evaluation of CS
As this summary of caveats points out, the economic data alone cannot be taken for face
value and the social data looses some of its meaning in the process of averaging.
Therefore an analysis on an individual basis is needed to judge the situation in a more
meaningful way.
6.7.2.1 CS Dolores, Ruby Bobadilla
Tita Ruby began her Sari-Sari store operation with only retail sales in 1965 and joined
Hapinoy in September 2008. She increased her sales from P120,000 to P390,000, a
growth of 225%. The decrease in her retail business of 35% was more than made up by
the new wholesale operation which serves now 20 Sukis. She accredits the success to
addition of new products, better prices and the “big help from Hapinoy, received through
training and CS meetings”. She considered herself “better off” as in 2008.
6.7.2.2 CS Tiaong, Josephine (Josie) Moog
The store in Tiaong started retail-only operations in 2001 and became a Hapinoy CS in
September 2008. Tita Josie increased her sales from P45.000 to P240.000, an increase of
433%, all due to the new wholesale operations. In addition to the grocery business, she
became a distributor for a direct selling firm of beauty products. She increased the store
size to accommodate new products and larger quantities. She is “happy” about the
success which according to her, is due to the Hapinoy program, mainly the financing
scheme, the new products and better prices.
6.7.2.3 CS Sto. Tomas, Rosa Maloles
Tita Rosa started in 1986 with a Sari-Sari store business, joined Hapinoy in 2007 and
added the wholesale operations with the start of the program. Her sales went from
P390,000 to P570.000, an increase of 46%. She added two additional sales locations in

108
the surrounding area and the wholesale operation contributes 70% to her total sales
volume. She added beauty products and beer to her product assortment. Her area,
although only 30min away from Malvar, was not affected by the economic crisis,
illustrating the micro cosmos nature of the Sari-Sari store business. Consequently, she
feels “much better off” in July as compared to October 2008, however the reason is not
only economic but also because she “feels rich and popular as a celebrity” referring to her
appearance in an article about Hapinoy in national newspapers. She values the program
also because it increased her capital through the additional loan and she learned how to
manage her business better.
6.7.2.4 CS Malvar, Jenny Bagutua
Tita Jenny started her Sari-Sari store business only in 2006 and was admitted to the
Hapinoy CS program despite the fact that she did not meet the 3 year in business
requirement because of her entrepreneurial spirit. She had no wholesale business before
joining and relied to 100% on products Hapinoy could supply as she joined the program.
Her sales are down by 20% over the complete period recovering from a level of minus
68% in February. The sales decrease up to the first quarter of 2009 was mainly due to the
economic crisis as factories in the area closed down or reduced working hours. As in
Edith’s case, the same customers came but purchased less and cheaper goods. Jenny did
not manage the downturn very well and ended up going to a moneylender to finance
further stock purchases. It was at that moment that MVI decided to use Jenny’s store as
the pilot store for the Path to 500 program and investing resources into the recovery of
her sales. Among others, the Hapinoy photo print, Store Layout project and the rolling
store project are piloted in Malvar and CARD BDS was instrumental in getting her
finances back on track. She also decided to add non Hapinoy products, such as cigarettes
and alcohol in her product assortment, accounting for 30% of her sales in July 2009. As
of May the factories started hiring again and increased working hours, resulting in an
increase in purchases. Those four factors contributed towards the recovery of most of her
lost sales within five months. Her story raises the important issue of the level of
involvement which the Hapinoy program can and should provide. As the CS owners are

109
not employees but independent entrepreneurs they manage the stores at their risk and
benefit and Hapinoy does provide a broad support program. MVI has increased its
monitoring capacity to be able to react faster in the future, however, the discussion is
ongoing in how far MVI can and should micro-manage the CS. Jenny is feeling “super
doper” and is happy that she was “able get back on her feet” with the support of MVI and
CARD. Overall, she now feels “better off” as more capital, more products, more
suppliers and more customers have put her business on a broader foundation. Tita Jenny’s
recovery also came as an assurance to MVI, as it shows that the Path to 500 model works.
6.7.2.5 CS Pagbilao, Nelia (Lalynn) Macaraan
Tita Lalynn has been operating a Sari-Sari store since 1997 and joined Hapinoy in 2007.
Next to the grocery business she conducted a direct selling operation for two companies,
acting as the local distribution point. Her monthly sales figure in October 2008 was
P750,000 for the grocery part and P750,000 for the direct selling part. Near her store a
large supermarket opened in August 2008. It had already taken away business in October
and this trend continued, accelerated by the economic crisis which caused unemployment
in the area, until in July 2009 her monthly grocery sales are down to P180,000, a drop of
76%. The wholesale business almost stopped completely as her customers either went out
of business or switched their sourcing to the supermarket. One the other hand, her direct
selling business, in which Hapinoy has no stake, went up to P1.5 million, more than
compensating for the lost grocery wholesale business. She now distributes from a
portfolio of direct selling firms promoting among others beauty products, fashion, shoes
and children toys. The change in her business set up is also apparent in her store, as the
direct selling section accounts for 50% of the space allocation in July 2009, up from 20%
in October 2008. She recruited former Sari-Sari store owners, who went out of business,
as sub-distributors, thereby creating further income earning opportunities. In her own
words, she is “thankful” for the knowledge gained and the support received through the
CS meetings and the Flex workshop. It has helped her to adjust to the situation and
change her business. So for the time period October 2008 to July 2009, she said the

110
decline in grocery sales “makes her sad, but she learned to adjust” and now runs a large
business than before.
6.7.2.6 CS Candelaria, Editha (Edith) Miranda
Tita Edith has been operating a Sari-Sari store since 1998 and joined Hapinoy in 2007.
Next to the grocery business she raises hogs and goats. Her monthly sales figure in the
grocery business in October 2008 was P1.35 million and went down to P750,000 in July
2009, a drop of 44%. She was hard hit by the economic crisis, as customers did not
reduce in numbers but economized by buying less and cheaper items, sardines instead of
tuna, shampoo instead of shampoo/conditioner and brown sugar instead of white sugar. In
her assessment, the Hapinoy program is “very good”. It helped her in running the
business by providing training and support, especially valued were the CS meetings and
the Flex workshop. She is “proud to be a Hapinoy member”. As compared to October she
concludes, “Sales are down, but it is ok”.
6.7.2.7 CS Bay, Susan Dino
Tita Susan opened her store in 1987 and joined Hapinoy in September 2008 only
operating a retail operation. Her sales decreased from P270,000 to P210.000, a drop of
22% mainly due to a reduction of work hours in a nearby factory. She appreciated in the
program the “help to become a bigger store” by accessing increased loans, attracting
more customers and participating at the meetings. Overall, she says she is “happy” with
the program and better off as in October.
6.7.2.8 CS Pagsanjan, Irma Susan Abas
Tita Irma started her business in 1998 and joined Hapinoy in July 2008 recording sales of
P105,000 in retail business. She started wholesaling with Hapinoy. Her sales increased by
only by 14% from P105,000 to P120.000, as her wholesale business did not increase her
sales as expected. She was only able to recruit 5 Hapinoy members because of strong

111
competition from groceries. In her assessment, she is better off as “being in Hapinoy
made me a successful business woman.” Next to the business benefits and training she
received, she also mentioned the positive effects of the Flex workshop in regards to her
relationship with husband and children, a rather unexpected benefit of the program.
6.7.2.9 CS Magdalena, Josephine (Josie) Cuison
Tita Josie started in 2005 with a small Sari-Sari store, reaching a sales volume of
P120,000 in October 2008. As in May 2009 sales volume went down to P90,000, she
closed down her business and dropped out of the Hapinoy program. As the Hapinoy
program did not deliver a complete product assortment and better prices, she was unable
to attract enough additional business. She also neglected her Sari-Sari store during the
mango season when she closed the store and sold mango in a nearby market. As her
losses increased she decided to stop and pull out. The business failure is most probably
due to a mix off reasons, among them bad management and the failure to deliver the
promised benefits. However, other stores faced with the same price problem managed to
stay in business or to grow. Josie feels “happy and sad” about her experience, sad about
the losses she incurred, happy about the bounding she experienced with the other nanays
at the CS meetings.
6.7.3 Evaluation of CS - Summary
As each nanay started from a different situation and experienced different economic
circumstances it is difficult to perform a general evaluation. However, it is safe to state
that the impact of the program is highest when the Sari-Sari store did not have a
wholesale operation before and the entrepreneurial talent is there to build such a business
based on the program. In evaluating the program the economic and the support benefits
have to be considered. Due to the incomplete supply chain not all promised economic
benefits were delivered, however the new financing scheme and the support projects,
such as business training, personal development workshops and the exposure to new
business opportunities are highly valued leading a positive evaluation of the program by

112
the participants. Also the fact, that none of the nanays, who are still operating a store, has
left the program is an expression of support for the program. In the discussion with the
nanays it was observed that they have become more assured of themselves and feel that
they are more in control of the business due to the training they received. This might
explain the difference in the perceived economic situation and the income data. The fact
that some nanays have started additional businesses, especially in direct selling of beauty
products, and utilizing the knowledge gained from the Hapinoy program is positive from
the nanays point of view but a threat to Hapinoy as MVI has no share in the revenue of
the new business. The store layout program has transformed the stores with new painting
inside, painting and signage on the shelves and the installation of the checkout counter. It
gave the CS more of professional appearance, making it a source of pride to the nanays.
In summary, the nanays give good grades to Hapinoy.
6.7.4 Assessment by CARD BDS and MVI
In-depth interviews with the management of CARD BDS, Boyet and Julius, and MVI,
Bam and Mark, were conducted during August 2009 for an evaluation of the program
from their point of view.
6.7.4.1 Assessment of Hapinoy Program by CARD BDS
Boyet and Julius stressed the importance of the alignment of strategies and the
reorganization of the roles and responsibilities in December 2008. Also the focus on CS
instead of HS was seen positively as it enables CARD BDS to interact directly with the
clients and not via CARD Bank and NGO. CARD BDS now sees its role within CARD
MRI as the research and development arm, responsible for product innovation for its
member clients and the other CARD organizations. This role fits very well into the role
CARD BDS has taken in the Hapinoy program, relinquishing the operational
responsibility and concentrating on the innovation of financial products for the CS and
the Sari-Sari stores. With IFS, PAL and GC, CARD BDS has developed, piloted and
rolled-out three major new financial products within eight month. They rely now on MVI

113
to run the program from an operational point of view. Due the shareholding of CARD
MRI in MVI, control and strategic direction will continue to be influenced. Also
positively noted was the embedding of MVI staff in the San Pablo office and the close
cooperation on all staff levels. It was acknowledged that the supply chain and other
projects need to be improved and that there is still room for improvement, but CARD
BDS is confident that Hapinoy is on track to deliver the promised benefits to the clients,
scale up to cover more CARD territories and become a sustainable program also for
CARD BDS.
6.7.4.2 Assessment of Hapinoy program by MVI
Bam and Mark also point towards the December to January period as roles and
responsibilities were newly assigned and the strategies aligned, as a key moment in the
development of Hapinoy. The other main factor that shaped the development of Hapinoy
during the period was the shift in focus from the Hapinoy Stores to the Community
Stores. After this strategic re-focusing, all other projects were aligned towards the success
of the CS. After taking on the operational responsibility, MVI also instituted the store
doctors as their communication line to the nanays, giving MVI direct knowledge about
the situation in the field, fast feedback and input into the issues of the program, in
summary, bringing them closer to their clients. From an organizational standpoint, MVI
has become a more mature company taking a more systemic approach towards the
development of the program utilizing the Balanced Scorecard. Most projects, with the
notable exception of supply chain, have moved from the pilot to implementation phase,
and a clear methodology of co-creation for new products and services is in place.
Looking forward, MVI management plans for 2010 to scale up in a major geographical
expansion and with the introduction of more business opportunities for the CS under the
banner of Hapinoy plus and the integration of micro producers into the Hapinoy network
to improve the sustainability of the organization.

114
6.7.5 Evaluation of Hapinoy Program August 2009
The SWOT analysis as of August 2009 shows the areas of improvement as compared to
November 2008. The management of both organizations and the CS nanays are aligned in
their assessment of the program. They are aware of its shortcomings, especially in the
supply chain project, but value and build upon its improvements.
In the learning perspective, the clear separation of roles and responsibility combined with
a close cooperation of MVI and CARD BDS staff has laid the foundation of the
improvements in the program. The challenge is to match human resources with the
expansion plans.
In the process perspective major changes to the better have occurred. The clear separation
of roles and responsibility and the focus on community stores has led to a systemic
alignment of all projects, managed and monitored with the Balanced Scorecard. A
stringent methodology of new business development has been instituted under the
headline of co-creation and based on the findings of the primary market research. The
issue of data quality and the supply chain process remain to be improved and as the
organization moves to scale up its outreach it has to have processes in place to match the
growth.
Based on the foundation laid in the learning perspective and through the processes
described, major improvements can be observed in the customer/supplier perspective.
Especially the change in the business strategy from unsuccessfully focusing on price
leadership to build on existing strength in customer intimacy has led to many innovative
projects such as rolling store. The main challenge remains the supply chain. Other
projects have had positive impact such as the new financial products and the close
communication with the nanays leading to a substantial growth in the number of CS
stores. The public image of Hapinoy as a leading social enterprise has further improved
and the threat of the continuously low margin FMCG business has been counteracted
with introduction of secondary brands, rice and other business opportunities. As Hapinoy

115
scales up it will also become more attractive to the larger FMCG companies to enter into
partnerships with Hapinoy on a commercial basis and not longer under the banner of
CSR.
All these learnings, processes, customer/supplier strategies and projects have led to a
major advance in the direction of sustainability for MVI and CARD BDS. On MVIs side
through the integration of marketing activities into ordinary activities and on CARD BDS
side through the introduction of new financial products. The threat to the program
through the expansion of large retailers into the provinces remains to be watched. With
the methodologies of co-creation in place and embracing the concepts of building an
ecosystem of local partners, viewing the BoP as a business partner and expanding
imagination, Hapinoy is firmly in the field of BoP 2.0.
In summary, scale and sustainability have not been achieved yet, but Hapinoy is set to
reach the goal by 2010.
As scale and sustainability is not the end for a social enterprise but a means to alleviate
poverty, the question has to be posed whether Hapinoy alleviates poverty.
As the program is hardly two years and in its current business model only seven months
old, it is too early to evaluate the impact of Hapinoy in a meaningful way. At the end of
2010 such an analysis based on Ted London’s (2009) Impact Assessment Framework,
would be a useful exercise for MVI and CARD BDS.
The wider poverty alleviation effect of Hapinoy which envisages the elimination of the
BoP penalty by bringing lower prices to the BoP consumers has not been observed now.
It will depend upon reaching sufficient scale in 2010 to achieve higher bargaining power
with manufacturers and the efficiency gains in the supply chain.
One impact is already visible: Hapinoy does create choice and many small retailers at the
BoP are grasping this new opportunity

116
Table 24: SWOT Analysis Hapinoy as of August 2009 Perspectives SWOT Strength Weakness Opportunity Thread Finance MVI profitable through SMART
marketing programs MVI without little income from supply chain operation
First mover advantage Expansion of supermarkets into province
Strong backing of CARD MRI management
BDS has not yet reached sustainability
New e-load distribution policy positive for CS
First fee collection from CS BDS sustainability improving
Customer Supplier
Growth from 14 to 61 CS within 6 months Incomplete product line at CS 60.000 Sari-Sari stores in the CARD membership
Discounts in FMCG too small to support all parties in supply chain
Partner network for FMCG, wireless business and new businesses
Only small number of Suki buying from CS but improving
Public awareness of Hapinoy as successful social enterprise
Successful CS owners move into new business opportunities without Hapinoy involvement
Very good relationship with CS through direct communication and meetings
A core benefit to CS not delivered: functioning supply chain with acceptable price
Introduction of secondary brand improves margin situation
Financial innovations successfully implemented: GC, IFS, PAL
Acceptable price structure for Suki not yet fully achieved
Hapinoy Plus. new business opportunities
Focus from “Best price” to “Customer intimacy” builds on strength of Suki network and rolling store pilot successful
Increase in CS store number lead to new opportunities with large corporations
Processes New CS expansion process successful Supply chain, a core business, not yet functional
As processes are in place the scaling up phase can be entered well prepared
Expansion into new regions can overstretch organization
Marketing methodologies under the headline of co-creation implemented
No reliable data from HS and CS makes management of operations still difficult
More systemic approach leads to better project design with less slack
BSC tool for systemic approach to management and monitoring implemented
Roles, responsibilities and strategy of BDS and MVI clear and aligned
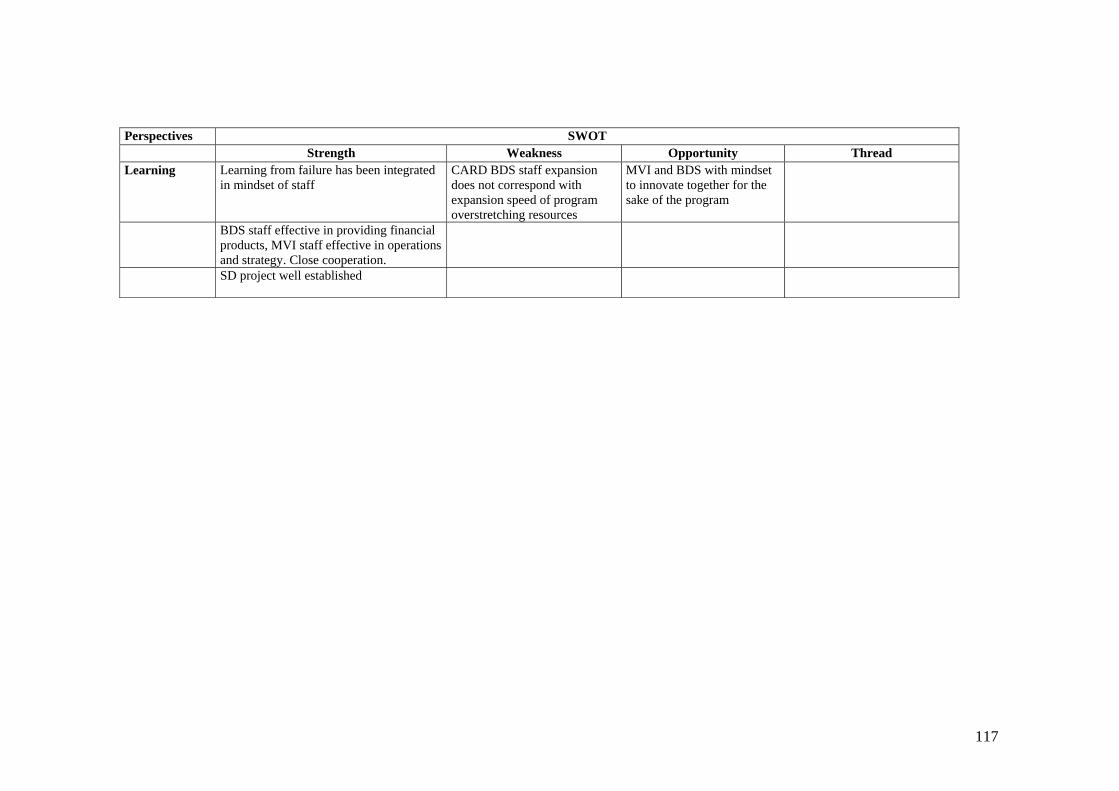
117
Perspectives SWOT Strength Weakness Opportunity Thread Learning Learning from failure has been integrated
in mindset of staff CARD BDS staff expansion does not correspond with expansion speed of program overstretching resources
MVI and BDS with mindset to innovate together for the sake of the program
BDS staff effective in providing financial products, MVI staff effective in operations and strategy. Close cooperation.
SD project well established

118
7. LESSONS LEARNT
During the project many lessons were learnt and an organizational culture emerged in
Hapinoy that builds upon these learnings to improve the program.
7.1 MFI’s Limitations and Chances as a Shared Channel at the BoP
The business model of shared channels in connection with MFIs has to be viewed
critically in respect to the capacity of the front staff. Although theoretically appealing, the
utilization of loan officers as sales people for products and services other than financial
might not deliver the expected results due to capacity, time, qualification and
management support constraints. A core strength of a MFI is the development and
marketing of financial products. Sticking to its core strength and partnering with an
organization with complementary strength in operating and sector expertise is the best
way for business development within MFIs. The combination of a social enterprise and a
MFI to deliver market-based solutions to the BoP is a promising model. The relationship
of the two organizations has to be managed carefully as different philosophies have to be
aligned.
7.2 Benefit of Balanced Scorecard to the Social Enterprise
Starting a program without the systems in place to deliver the promised value does not
only slow down outreach but alienates the participants and endangers future program
outreach. The key in developing a Balanced Scorecard for Social Enterprise is the
integration of the main stakeholder’s objectives into one of the perspectives. This forces
an alignment of the objectives and leads to the attainment of social goals. The process of
turning strategy into action in the implementation part of BSC is aiding management to
bundle and link all strategic projects. By assigning responsibilities and timelines the
individual’s contribution to the whole program becomes visible. Starting the monitoring
process from the BSC down towards each project streamlines reporting procedures and

119
enables management and field staff to give instant status updates using traffic light
symbols which are easy to communicate.
7.3 Involving Corporations in Social Enterprise Programs
Partnering with corporations for marketing purposes is an additional source of income,
however it comes with a price of potentially having to divert from the original business
plan due to 3rd party obligations and threatening the core business model. Income from
marketing activities with partners from the private sector should be recognized as of
equal value and importance to the program, opening up new revenue streams to social
enterprises
7.4 Client Loyalty to Programs
Providing entrepreneurs at the BoP with new business opportunity and technology to earn
does not lead to loyalty to the program if the offer does not match prevailing market
conditions and knowledge gained in the program will be used for other activities
7.5 The Importance of a Learning and Innovation Culture in Social Enterprises
The ability to learn and adapt, instead of plan and execute, is key in developing business
model at the BoP. A conscious learning culture has to be developed in the organization
which emphasis the use of prototypes and pilots, i.e. action in the field, over planning and
modelling in the office. The dynamic environment of the market, for example the retail
market, makes constant innovation a necessity which should be embraced by the social
enterprise.

120
7.6 BoP as a Consumer
The BoP consumers are not a homogenous group of 4 billion people. As a target market,
it needs to be segmented to be addressed in the right way. The BoP consumer market can
be segmented into BoP consumer with irregular and BoP consumer with regular income.
The first group’s main place of purchasing consumption goods is the Sari-Sari store using
it as its pantry whereas the second group prefers the market and groceries und uses the
Sari-Sari store as its extended pantry. The Suki relationship can be the starting block in
building a customer focused retail organization at the BoP. BoP consumer take rational
decisions in their consumer behavior. The strength of branded consumption goods at the
BoP is based on the concept of quality rather the aspiration. To enter this market, the new
offer has to have more to offer than just a cheaper price.
7.7 The Importance of the Co-Creation Process
The concept of co-creation is not only important in devising a program but has to be
ingrained in the innovation process for every new product and service. Market research
provides valuable insights into the BoP consumer and customer mindset and has to be
included in the first phase of the co-creation process for new products and services at the
BoP. The research can take the form of in-depth interviews and quantitative surveys,
however to gain more and deeper insights into the mindset, other techniques from the
CED school have to be utilized such as immersion and participatory rapid appraisal.
Market research is the starting point for the development of a methodology for the
introduction of new products and services at the BoP followed by co-creation, rapid
prototyping, piloting and roll-out. This methodology produces solutions that are
sustainable and deliver benefits to all stakeholders.
7.8 The Value of Technology at the BoP
Technology is only a mean to achieve a solution. The solution must deliver real value at
the BoP and the value must not be assumed but confirmed through research.

121
7.9. Path towards Formality
One goal of business development at the BoP is to transform informal micro businesses
into formal small businesses. Unless transitioning policies are in place, implemented and
executed, micro businesses have no incentives to become formal. Therefore the need to
formalize at a certain threshold becomes a major impediment to growth as micro
businesses decide to stay under the radar and below the threshold, foregoing growth
opportunities.
7.10 Impact as Key Parameter for Evaluating Success
The impact on the main stakeholder is an important criterion for success of a social
enterprise. In the case of a social enterprise offering business opportunities, the economic
evaluation of the stakeholder’s business is an important parameter. The traditional
measure, income and profitability, forms a major part in this analysis but it has to be
complemented by other welfare factors from the stakeholder’s perspective such as
gaining control of the business by increased knowledge about the processes. However,
impact is a difficult concept, as a program constitutes only part of a dynamic
environment. Willingness to pay and the actual payment of a fee can be a good proxy for
success and impact.
7.11 Strength and Weaknesses of CED, Representing the Development Community, at
the BoP
CED and the development community have developed tools, such as participatory rapid
appraisal and immersion, which are vitally important to the co-creation process at the
BoP and provide great value. However, the ideological barrier towards market-based
solutions and a mindset focused on projects and log frames restricts the possibilities CED
has in shaping the BoP discussion in theory and practice.

122
8. RECOMMENDATIONS
Based on the learnings during the project, recommendations are given for the
stakeholders in the Hapinoy program and for the wider BoP and CED theory and practise.
8.1 Microventures Inc.
MVI and Hapinoy have done a major step in terms of organizational, methodological and
program development in 2009. Although not finished yet, substantial progress has been
made to “build the highway into the BoP”, as Bam Aquino puts it. However, an important
piece in the puzzle, the supply chain, has not been mastered yet and should be the focus
of management and operations. Hapinoy plus, the addition of other products and services
to the Hapinoy offering, will be a major task for 2010. The inclusion of micro producers
into the Hapinoy network would then complement the BoP ecosystem. The growth of the
organisation in terms of manpower and geographic expansion has to be managed
carefully and the capacity adjusted accordingly. The product portfolio should be
expanded to include alcohol and cigarettes as these categories account for 30% of the
sales of a Sari-Sari store.
8.2 CARD Business Development Services Inc
CARD BDS – MVI partnership in the Hapinoy has demonstrated the great potential that
lies in the combination of a MFI and a social enterprise. Once the roles and
responsibilities were aligned to the strength of each organisation, the Hapinoy program
made a substantial step towards scale and sustainability. Consequently, CARD BDS
should focus on engaging with other social enterprises and replicate the success they
experience with MVI. CARD BDS should actively seek additional social enterprises
which are experts in operations and have sector specific knowledge. The role of CARD
BDS would be then to act as the node and interface for social enterprises connecting to
the other CARD institutions and the members and as a research and development centre
for innovative financial solutions catering to the specific needs of each program. Such a

123
role for BDS would offer business development choice to the members and it would
reinforce the other CARD institutions. CARD BDS should expand its financial
innovation gift check and develop it into a community based consumption loan, thereby
offering a new class of loan, meeting demand from the clients, and strengthening the
Hapinoy network, also benefiting their Sari-Sari store owner members.
8.3 CED and the Development Community
CED should embrace the concept of BoP and start getting involved in shaping the
development of BoP theory and practise. As practitioners and academics the development
community has a much longer history and experience than the BoP sector which only
emerged seven years ago from the business schools. Tools, such as PRA, and concepts,
such a community, of the development community are of great value to the BoP practise
and are now “discovered” by the BoP proponents whereas in fact, they have been around
for a long time. Bridging the ideological barrier and starting an active involvement of
CED would greatly strengthen the BoP.
8.4 For Profit Social Enterprises
For profit social enterprise is an emerging organizational setup in the development sector
and is expected to play an important role in the future as it is coherent in the way it aligns
mission with its organizational form. It is beneficial for those organizations to use
business tools such as the Balanced Scorecard as early as possible in their organizational
development to systematize and professionalize the strategy and operation.
8.5 Corporations
As the example of Smart has demonstrated, there is a profitable business at the BoP, if a
coherent BoP 2.0 approach is taken. The full power of corporations can however only be
unleashed if they move their focus from CSR activities and charitable foundations

124
towards an inclusion of BoP work into their core strategy by engaging the BoP as a
consumer, producer or distributor.
8.6 Government
Government has to modify regulation and implement the new regulations in order to
encourage micro business owners to come out of the formal economy and thereby remove
a major impediment to growth. It should be a goal in the country’s development plan to
move up the ranking in the Ease of Doing Business report to streamline the activities in
the business regulation. To provide an enabling environment for the growth of the social
enterprise sector a special regulatory and tax status is advisable.
8.7 Microfinance Institutions
MFIs should set up business development service divisions to support its members. By
cooperating with social enterprises they can utilize their outreach without having to invest
in organizational and operational capacity focusing on their core strength, the provision
of financial services.
8.8 Development of BoP Theory and Practise
Al Hammond said (personal conversation, July 2009) that the leading academics in the
BoP scene will meet in October and discuss the future direction of the BoP theory and
practise as CK Prahalad believes that the MNC have not reached the potential of the BoP
and other approaches and other players have to be considered. Social enterprises should
be included as a major contender in this space.
Whereas the past and current discussion focuses on BoP as consumer and BoP as
producer, the project has demonstrated that BoP as distributor has the potential to
complement the BoP ecosystem and merits its distinct research and development
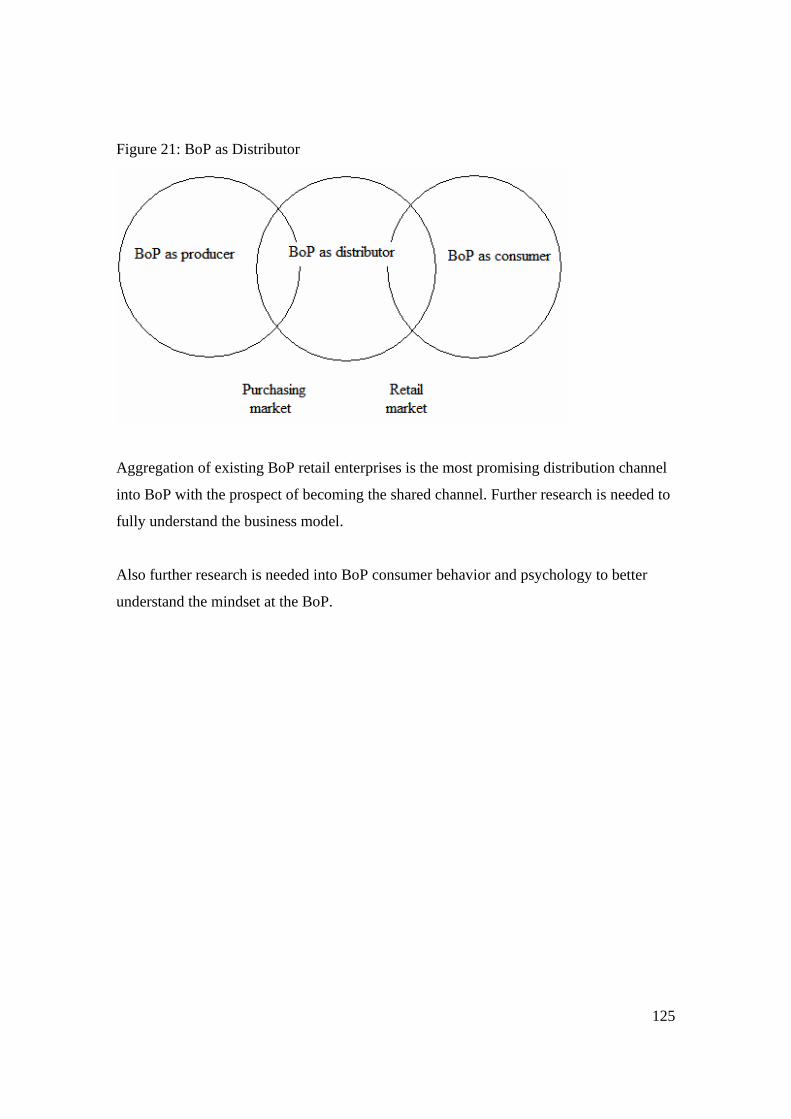
125
Figure 21: BoP as Distributor
Aggregation of existing BoP retail enterprises is the most promising distribution channel
into BoP with the prospect of becoming the shared channel. Further research is needed to
fully understand the business model.
Also further research is needed into BoP consumer behavior and psychology to better
understand the mindset at the BoP.

126
9. EPILOGUE
More than one year has passed since I first set foot on the Philippines and started the MS-
ICED course and the Hapinoy project. It has been an amazing learning experience on
many levels. On a personal level, I “let go” a corporate life in Europe and “let come” a
new life in the Philippines. Working at the BoP in a social enterprise environment I feel
that my “head, heart and hands” are aligned. I decided to stay in the Philippines and
establish the Asian Social Enterprise Incubator that envisages forming an ecosystem of
social enterprises and BoP ventures.
Within Hapinoy I was part of a learning experience which moved us from “downloading”
existing practices that worked so well in the affluent markets to the realization that we
have to see “with fresh eyes”. “Letting go” of our assumption and “deep listening” to the
nanays moved us one step closer to solutions. “Co-creating” with the nanays then brought
solutions that worked, they were “prototyped”, refined and scaled up.
BoP 1.0 was about using “patterns of the past” in directing MNCs to a new market
opportunity. The many learnings at the BoP moved theory and practice towards BoP 2.0
with co-creation of mutual value at its core.
So a pattern emerges, on an individual, organizational and theoretical level. It consists of
the realization that existing thoughts are not leading into the future; that one-way learning
and listening is not helping to progress; that deep listening and understanding is a pre-
requisite of something truly new evolving and that only moments of connecting to the
deepest source are the points when the future emerges. It is followed by a co-creation
process which expresses the future in a tangible project. It is tested in a proto-type pilot to
ascertain its quality and then evolves into a new system.

127
This pattern is described in Theory U by Otto Scharmer (2009).
Figure 22: Theory U by Otto Scharmer (2009)
In my opinion, it is an encompassing theory of development on a personal, an
organizational, and a theoretical level. It has a particular relevance to the Base of the
Pyramid as here the most diverse mindsets, theories, ideologies and cultures converge
and only a process, as deep co-presencing, will result in successful processes, products
and services leading to poverty alleviation. That’s my path to follow…..

128
10. REFERENCES
Abellada, A. C. (2008). An Assessment of a Social Business Enterprise.
(Master Thesis, University of the Philippines School of Economics, 2008).
ACNielsen (2004). AC Nielsen Retail Audit Philippine. Philippines. ACNielsen.
Anderson, B. B., & Dees, G. J. (2008). Rhetoric, Reality, and Research: Building a Solid
Foundation for the Practice of Social Entrepreneurship. In Alex Nicholls (Ed.), Social
Entrepreneurship: New Models of Sustainable Social Change (144-168). Oxford:
Oxford University Press.
Banerjee, A. V., & Duflo, E. (2007). The Economic Lives of the Poor, Journal of
Economic Perspectives, Vol. 21 Issue 1, 141-167.
Bhan, N. (2009). Life is hard: Insights on BoP Mindsets. Presentation given on March 4th
2009 at ibop Conference on Climate Change Adaptation in Manila. Retrieved April 1,
2009, from http://www.ibop-asia.net/index.php?option=com_content
&task=view&id=152&Itemid=43
Bijapukar, R. (2007). We Are Like That Only: Understanding the Logic of Consumer
India. New Delhi: Penguin Group.
Bornstein, D. (2007). How to Change the World: Social Entrepreneurship and the Power
of New Ideas. Oxford: Oxford University Press.
Boschee, J. (2008). Social Entrepreneurship: The Promise and the Perils. In Alex
Nicholls (Ed.). Social Entrepreneurship: New Models of Sustainable Social Change
(356-390). Oxford: Oxford University Press.

129
Budinich, V. (2005). Market Based Strategies Serving Low Income Populations.
Retrieved June 18, 2009 from http://www.caseplace.org/d.asp?d=1434.
Business Monitor International (BMI) (2009). Philippine Retail Report [Abstract].
Retrieved August 2, 2009 from http://www.marketresearch.com/map
/prod/2294276.html
Capistrano, F. Y. (2005, January 7). Modern Sari Sari Stores for Modern Consumers.
Business World. Retrieved August 2, 2009 from http://www.itmatters.com.ph/
features.php?id=010705b
Chakravarti, D. (2006). Voices Unheard: The Psychology of Consumption in Poverty and
Development. Journal of Consumer Psychology, 16(4), 363-376.
Chanco, B. (March 6, 2009). Our Guerilla Economy. The Philippine Star, B-4.
Chen, K.-J. (1997). The Sari-Sari Store: Informal Retailing in the Philippines, Journal of
Small Business Management, vol. 35 issue 4, 88-91.
Christensen, C (1997). The Innovator’s Dilemma: When New Technologies Cause Great
Firms to Fail. Boston: Harvard Business School Press.
Collins, D., Morduch, J., Rutherford, S., & Ruthven, O. (2009). Portfolios of the Poor:
How the World’s Poor Live on $2 a Day. Princeton: Princeton University Press.
D’Andrea, G., Lopez-Aleman, B., & Stengel, A (2006a), Why Small Retailers Endure in
Latin America. International Journal of Retail & Distribution Management, vol 34,
661-673.

130
D’Andrea, G., Ring, L., Lopez-Aleman, B., & Stengel, A. (2006b). Breaking the Myths
on Emerging Consumers in Retailing. International Journal of Retail & Distribution
Management, vol 34, 674-687.
Easterly, W. (2006). The White Man’s Burden: Why the West’s Efforts to Aid the rest
Have done So Much Ill and So Little Good. New York: Penguin Press.
Fairbourne, J., Gibson, S. W., & Dyer, G. W. (Ed.) (2007). Microfranchising: Creating
Wealth at the Bottom of the Pyramid. Northhampton MA: Edward Elgar Publishing
Ltd.
Flores, H. (April 22, 2009). Poverty Declines to 47% - SWS. The Philippines Star, 4.
Flores, W. L. (December 22, 2004). Success secrets of Philippine Retail Champions. The
Philippine Star. Retrieved August 8, 2009 from http://www.newsflash.org/2004/02/si/
si001955.htm.
Francisco, R. (April 3, 2008) Filipinos sent 1 billion text messages daily. Philippine Daily
Inquirer. Retrieved August 3, 2009 from http://technology.inquirer.net/infotech/
infotech/ view/20080304-122775/Filipinos-sent-1-billion-text-messages-daily-in-
2007.
Gnanakumar, P. B. (2007). The Ethical Value of Brand Feelings in Rural Society – A
Micro Level Study. International Marketing Conference on Marketing and Society
IIMK, 130-138. Retrieved May 4, 2009 from http://dspace.iimk.ac.in/bitstream/
2259/379/1/131-138.pdf.
Hammond, A. (June 6, 2006). Response to Mirage at the Bottom of the Pyramid.
Message posted to http://www.nextbillion.net/blog/2006/08/24/response-to-mirage-at-
the-bottom-of-the-pyramid.

131
Hammond, A. (February 12, 2009). Response to Romanticizing the Poor. Message posted
to http://www.nextbillion.net/blog/2009/02/12/hammond-vs-karnani-debating-
romanticizing-the-poor-part-1.
Hancock, G. (1989). Lords of Poverty: The Power, the Prestige, and Corruption of the
International Aid Business. London: Macmillan.
Hart, S. L., & Christensen, C. (2002). The Great Leap – Driving Innovation from the
Base of the Pyramid. MIT Sloan Management Review, Fall 2002, 51 – 56.
Hart, S. L. (2007). Capitalism at its Crossroads: Aligning Business, Earth and Humanity
(2nd ed.). Upper Saddle River NJ: Wharton School Publishing.
Holt, D.B. (2004). How Brands Become Icons: The Principles of Cultural Branding.
Harvard: Harvard University School Press.
Indon, R. (2007). Legal Mechanisms to Empower Informal Businesses. Working paper
retrieved August 1, 2009 from http://www.undp.org/legalempowerment/reports/
National%20Consultation%20Reports/Country%20Files/21_Philippines/21_6_Inform
al_Business_Rights.pdf.
Joaquin, N. (2005). A Heritage of Smallness. Retrieved May 5, 2009 from
http://www.getrealphilippines.com/agr-disagr/17-4-smallness.html.
Kandachar, P., & Halme, M. (2007). Introduction to an Exploratory Journey towards the
Research and Practice of the ‘Base of the Pyramid’. Greener Management
International, Issue 51, 3-17.
Kandachar, P., & Halme, M. (Eds.). (2008). Sustainability Challenges and Solutions at
the Base of the Pyramid. Sheffield, UK: Greenleaf Publishing.

132
Kaplan, R. S., & Norton, D. P. (1996). Translating Strategy into Action: The Balanced
Scorecard. Boston: Harvard University Press.
Karnani, A. (2007a). The Mirage of Marketing to the Bottom of the Pyramid: How the
Private Sector can help alleviate poverty. California Management Review, vol 49,
issue 4, 90-111.
Karnani, A. (2007b). Doing well by doing good – Case Study: Fair & Lovely Whitening
Cream. Strategic Management Journal, vol 28, issue 13, 15-17.
Karnani, A. (2007c). Employment, not Microcredit is the solution. The Journal of
Corporate Citizenship, issue 32, 23-29.
Karnani, A. (2009). Romanticizing the Poor. Stanford Social Innovation Review, Winter
2009, vol. 7, 38-43.
Kobb, D. (1997). Measuring Informal Sector Incomes in Tanzania: Some Constraints to
Cost-Benefit Analysis. Small Enterprise Development, vol 8, no 4, 40-48.
LaRocco, P. (July 30, 2009). An Open Letter to the Development Posse: Lighten Up
Already!. Retrieved August 2, 2009 from http://www.nextbillion.net/blog/2009/07
/30/an-open-letter-to-the-development-posse-lighten-up-already.
Landrum, N. E. (2007). Advancing the ‘Base of the Pyramid’ Debate. Strategic
Management Review, issue 1, 1-12.
London, T. (2009). Making Better Investments at the Base of the Pyramid. Harvard
Business Review, issue May, 106-113.

133
Magleby, K. (2007). Ending Global Poverty: The Microfranchising Solution. Provo,
USA: Power Think Publishing.
Malapit, H. J. (2007). The Filipino Sari-Sari Store. Retrieved August 2, 2009 from
http://www.aer.ph/pdf/papers/FilipinoSariSariStore_draft_HMalapit.pdf, unpublished,
cited with author’s permission.
Moyo, D. (2009). Dead Aid: Why Aid is Not Working and How There is a Better Way for
Africa. New York: Farrar Straus & Giroux.
Monitor Group (2009). Emerging Markets, Emerging Models: Market Based Solutions to
the Challenges of Global Poverty. New Delhi: Karamchandi, Ashish & Kubzansky,
Michael & Frandano, Paul
National Statistical Office, NSO (2009). 2006 Family Income and Expenditure Survey.
Retrieved August 3, 2009 from http://www.census.gov.ph/data/sectordata/
sr09412tx.html.
National Statistical Coordination Board, NSCB (2009a). Gross National Product & Gross
Domestic Product: First Quarter 2009: by Expenditure Share. Retrieved August 3,
2009 from http://www.nscb.gov.ph/sna/2009/1stQ2009/2009gnpe1.asp.
National Statistical Coordination Board NSCB (2009b). Gross National Product & Gross
Domestic Product: First Quarter 2009: per Capita. Retrieved August 3, 2009 from
http://www.nscb.gov.ph/sna/2009/1stQ2009/2009per1.asp
National Statistical Coordination Board, NSCB (2009c). Labour and Employment.
Retrieved August 3, 2009 from http://www.nscb.gov.ph/secstat/d_labor.asp.

134
National Statistical Coordination Board, NSCB (2009d). Gross National Product & Gross
Domestic Product: First Quarter 2009: Personal Consumption Expenditure. Retrieved
August 3, 2009 from http://www.nscb.gov.ph/sna/2009/1stQ2009/2009pce1.asp.
Nicholls, A. (Ed.). (2008). Social Entrepreneurship: New Models of Sustainable Social
Change. Oxford: Oxford University Press.
Nisbett, R. E. (2004). The Geography of Thought: How Asians and Westerners Think
Differently… and Why. New York: Free Press.
Prahalad, C.K. (2002). Strategies for the Bottom of the Economic Pyramid: India as a
Source of Innovation. Reflections, vol. 3 no. 4, 6-17.
Prahalad, C.K. (2005). The Fortune at the Bottom of the Pyramid. Upper Saddle River:
Wharton School Publishing.
Prahalad, C.K. (August 8, 2006). Response to Mirage at the Bottom of the Pyramid.
Message posted to http://www.nextbillion.net/archive/multimedia/2006/08/31/c-k-
prahalad-responds-to-mirage-at-the-bottom-of-the-pyramid.
Prahalad C.K., & Hart, S. L. (1999). Strategies for the Bottom of the Pyramid: Creating
Sustainable Development. Working Paper. Retrieved June 15, 2009 from
www.nd.edu/~kmatta/mgt648/strategies.pdf
Prahalad C.K., & Hart, S. L. (2002). The Fortune at the Bottom of the Pyramid. strategy
+ business, issue 26, 1-14.
Prahalad, C.K., Hammond A. (2002). Serving the World’s Poor – Profitably. Harvard
Business Review, September issue, 48-57.

135
Prahalad, C.K., & Ramaswamy, V. (2004). Co-creation Experiences: The Next Practice
in Value Creation. Journal of Interactive Marketing, Summer issue, 5-14.
Rangan, V. K., Quelch J. A., Herrero, G., & Barton, B. (Eds.). (2007). Business Solutions
for the Global Poor: Creating Social and Economic Value. San Francisco: Jossey-
Bass.
Sachs, J. (2005). The End of Poverty – Economic Possibilities for our Time. New York:
Penguin Press.
Scharmer, O. (2009). Theory U, Leading from the Future as It Emerges. San Francisco:
Berrett- Koehler Publishing.
Schneider, F. (2005). The Size of the Shadow Economies in 145 Countries from 1999 to
2003. The Brown Journal of World Affairs, Winter/Spring Vol. XI, Issue 2,113-129.
Sen, A. (1999). Development as Freedom. New York: Random House.
Simanis, E., & Hart, S. L. (2008). The Base of the Pyramid Protocol: Toward Next
Generation BoP Strategy 2nd edition. Retrieved June 20, 2009 from http://www.bop-
protocol.org/docs/.
Smart (September 4, 2007). Smart, Microventures launch Smart Hapinoy Stores. Smart
Press release. Retrieved August 3, 2009 from http://smart.com.ph/corporate/
newsroom/Hapinoy.htm.
Social Enterprise London (SEL) (2004). Social Enterprise Balanced Scorecard. In
Proving and Improving: A Quality & Impact Toolkit for Social Enterprises, 72-86.
Retrieved March 3, 2009 from http://www.proveandimprove.org/new/tools/
socialenterprise.php.

136
Somers, A. B. (2005). Shaping the Balanced Scorecard for Use in UK Social Enterprises.
Social Enterprise Journal, vol 1, issue 1, 43-56.
De Soto, H. (2000). The Mystery of Capital: Why Capitalism Triumphs in the West and
Fails Everywhere Else. London: Bantam Press.
Subrahmanyan, S., & Gomez-Arias, T. J. (2008). Integrated Approach to Understanding
Consumer Behavior. Journal of Consumer Marketing, vol 25, no 7, 402-412.
Transparency International (2009). The Philippines’ Transparency International Ranking
in Corruption. Retrieved August 10, 2009 from http://www.zamboanga.com/news/
philippines_transparency_ranking.htm.
.
Treacy, M., & Wiersema, F. (1993). Customer Intimacy and Other Value Disciplines.
Harvard Business Review, vol.71, issue.1, 84-93.
Troy, M. (June 6, 2002). Competitive advantage lies in systems efficiencies. DSN
Retailing Today. Retrieved August 10, 2009 from http://findarticles.com/p/articles/
mi_m0FNP/is_11_41/ai_87146180/.
United Nations Global Compact (2009). About Us. Retrieved June 15, 2009 from
www.unglobalcompact.org/AboutTheGC/.
United Nations (2000). 55/2 United Nations Millennium Declaration. Retrieved August 3,
2009 from http://www.un.org/millennium/declaration/ares552e.pdf.
United Nations (2009). The Millennium Development Goals (MDG) Report 2009.
Retrieved August 3, 2009 from http://www.un.org/millenniumgoals/pdf/
MDG%20Report%202009%20ENG.pdf.

137
UNDP (2009). Human Development Reports. Retrieved August 2, 2009 from
http://hdrstats.undp.org/countries/data_sheets/cty_ds_PHL.html.
UN Millenium Project (2005). Investing in Development: A Practical Plan to Achieve the
Millenium Development Goals. Retrieved August 3, 2009 from
http://www.unmillenniumproject.org/documents/MainReportComplete-lowres.pdf.
Vachani, S,, & Smith, C. N. (2008). Socially Responsible Distribution: Distribution
Strategies for Reaching the Bottom of the Pyramid. California Management Review,
vol. 50 no. 2, 52-84.
Williams, C. C. (1996). Local Currencies and Community Development: An Evaluation
of Green Dollar Exchanges in New Zealand. Community Development Journal, vol.
31, 319-329.
The World Bank Group (2009). Doing Business Report 2009. Retrieved 1.8.2009 from
http://www.doingbusiness.org/documents/fullreport/2009/Country_Tables.pdf.
World Resource Institute, WRI (2007). The Next 4 Billion, Washington, D.C: Hammond,
A., Kramer, W. J., Katz, Robert S., Tran, Julia T., Walker, Courtland.

138
11. APPENDICES
11.1 BoP Academics
Allen Hammond is Senior Entrepreneur at Ashoka and heads a BoP venture in India. As Director at the World Resource Institute, he co-authored with CK Prahalad in 2002 the second article on BoP. He also co-authored the seminal study Next 4 Billion by WRI.
Ted London is Senior Research Fellow at the University of Michigan’s Ross School of Business. He introduced the concept of native capability building together with Stuart Hart and developed a BoP Impact Assessment Framework
Stuart L. Hart is Professor of Management at Cornell University. He introduced the Bottom of the Pyramid concept together with CK Prahalad in 2002 and wrote with “Beyond greening: Strategies for a sustainable world, “Developing native capabilities”, “The great leap –driving innovation from the base of pyramid” and “Capitalism at its crossroads” other important contributions. He is co-founder of the BoP protocol initiative and BoP Learning Lab Network.
Coimbatore Krishnarao Prahalad is Professor for corporate strategy at the University of Michigan. Because of his book “The Fortune at the Bottom of the Pyramid” he is considered by the public as the father of the BoP concept. In the 1990s he had major contribution to management theory in the field of core competency. He introduced the Bottom of the Pyramid concept together with Stuart L. Hart in 2002. His latest book is called “The New Age of Innovation”

139
´
Prabhu Kandachar is Professor of Industrial Design Engineering at the Delft University in The Netherlands. He is a major representative of the European BoP community and views the BoP from a product designer point of view. He is co-editor of “Sustainability Challenges and Solutions at the Base of the Pyramid”
Minna Halme is associate Professor at the Helsinki School of Economics in Finland. She is a major representative of the European BoP community and views the BoP from a sustainability point of view. She is co-editor of “Sustainability Challenges and Solutions at the Base of the Pyramid”
Aneel Karnani is Professor at University of Michigan and the most prolific academic critic of the BoP proposition. His latest critique is the forthcoming “Romantizing the Poor” article.

140
11.2 BoP Practioners: CARD BDS and MVI
11.3 The Nanays
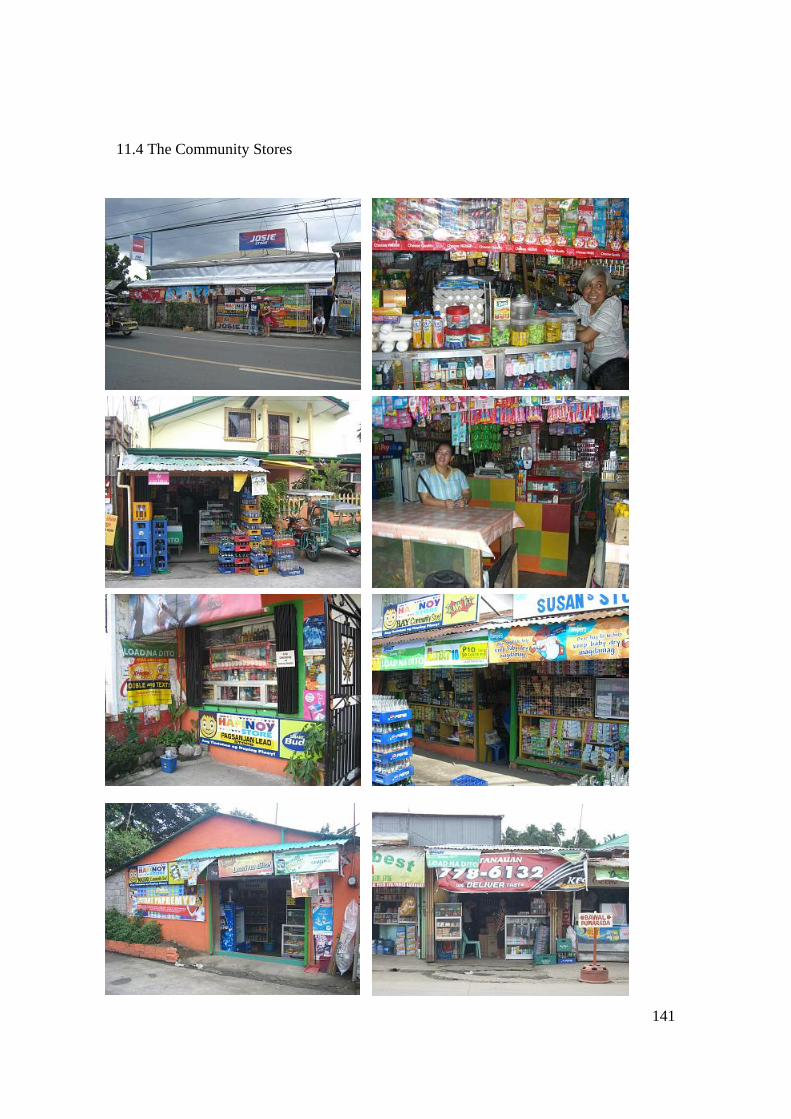
141
11.4 The Community Stores

142
11.5 BoP Consumer research – Guidelines for in-depth interview Anong pangalan po ninyo? Meron po akong mga tanong tungkol sa ….. Can I ask some questions to… Income (Kita) Kumusta po ang pamumu hay Do you consider yourself: „Mahirap“ Borderline Hindi Mahirap Bakit po mahirap/hindi mahirap Why do you consider yourself (see above): Size of household Ilang po ang Adults nakakatanda # Children mga anak ninyo # Earners kumikita # Anong po nag-trabaho Total Income Magkano po ang kita ninyo Below 5.000 monthly/1.250weekly/200daily Below 10.000 monthly/2.500 weekly/400 daily Above 10.000 monthly/2.500 weekly/400 daily Sources of income Anong po ang pinagkakakitaan Work Trabaho Remittances Social Benefit Tulong galing sa gubyirno Others Iba pa
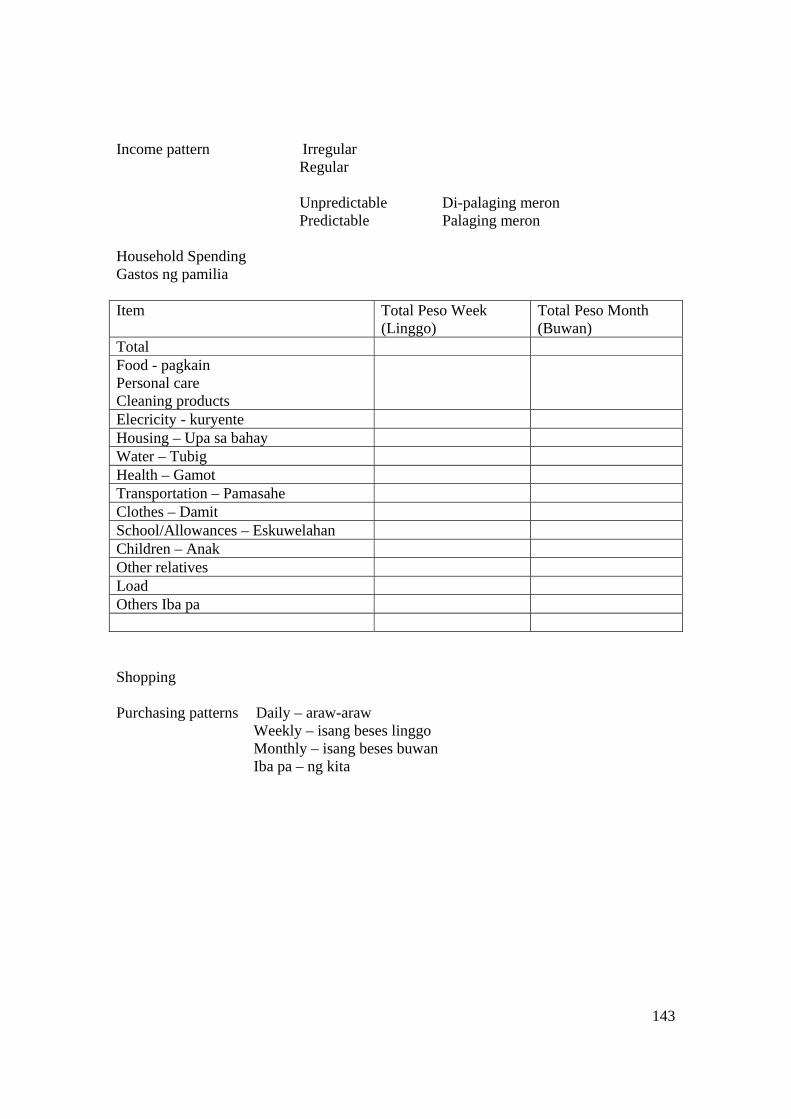
143
Income pattern Irregular Regular
Unpredictable Di-palaging meron Predictable Palaging meron
Household Spending Gastos ng pamilia Item Total Peso Week
(Linggo) Total Peso Month (Buwan)
Total Food - pagkain Personal care Cleaning products
Elecricity - kuryente Housing – Upa sa bahay Water – Tubig Health – Gamot Transportation – Pamasahe Clothes – Damit School/Allowances – Eskuwelahan Children – Anak Other relatives Load Others Iba pa Shopping Purchasing patterns Daily – araw-araw
Weekly – isang beses linggo Monthly – isang beses buwan Iba pa – ng kita

144
Where Saan
Why Bakit
How often/week Gaano kadalas sa isang linggo
Market/Palengke
SariSari Grocery Supermarket Shopping experience Sa pamamalengke gaano ka importante ang Hindi
importante Mediyo importante
Napaka importante
Closeness – Location Product Assortment- Maraming pagpipilian Affordability/Price - Murang tinda Credit and Virtual wallet - Puedeng umutang Personal relationship - Kakilala ang may-ari Entertainment - Chizz miz, chikka-chikka Cleanliness – malinis Services – serbisyo Delivery/Promos What is close? 1min – 5 min – 10min – 30min Anong malapit How many SariSari Shop Only 1 – Isang lang Several – Marami - Why - Bakit Planning vs impulse To you plan your purchases or do you go in the shop without plan Tried and tested vs new and improved Do you rather buy a tried and tested product or a new and improved product at the same price Pay as you go vs buy now pay later Do you like to pay the goods you bought directly or do you prefer to pay later

145
Brands What does brand mean for you? Wait for response and probe on: Confidence in the product Always good and consistent quality I buy it out of Habit Others Do you sometimes buy new products? If yes, why Are you encouraged by TV Advertising Endorsing by show personality Friends Shop assistant Signage on the shelf What happens after you buy the new product? Test it – how Discuss with friends How do you decide whether you buy new product or stick to product you usually buy Quality What is quality for you? If you look back the last 6 months. How many new products have you tried? How many new products do you continue to use? Attitude towards low cost? When you see a new product at a much lower cost than the product you usually buy, what is your first reaction: Great, I can save a lot of money Need proof, need to try Cheap price means cheap quality, I will not consider buying the new product

146

147
11.6 Sari-Sari Store Survey – developed and conducted by Richie Magpayo SSS Market Research Survey SSS Owner: _________________________________ Area: _____________________________________ Date/Time: ________________________________ Direksyon: Lagyan ng check ang box na angkop sa sagot ng respondent. Who, What, How much, How many, and How does the SSS sells? 1. Sino-sino ang mga bumibili sa inyong tindahan? (paki-check lahat ng angkop na sagot) [_] Kapitbahay [_] Mga dumadaan [_] Hindi kilala [_] Suki [_] Mga estudyante [_] Iba pa (specify) ________________________
2. Bakit sila bumibili? (paki-check lahat ng angkop na sagot) [_] Mura [_] May stock nung hinahanap na produkto [_] Malapit [_] Nakakautang [_] Dahil suki 3. Anu-ano ang mga karaniwang binibili sa inyong tindahan? (Pakisulat ang brand kung meron) Food: De-lata [_] Sardinas/Tuna ___________________ [_] Ibang de-lata _____________________ [_] Gatas ______________________ ----------------------------- Food: Hindi de-lata [_] Noodles ____________________ [_] Kendi _____________________ [_] Biscuit/tinapay ____________________ [_] Tsitirya ______________________ [_] Mantika ____________________ [_] Suka ______________________ [_] Patis ______________________ [_] Toyo ______________________

148
[_] Asukal ____________________ [_] Iba pang pagkain ______________________ ----------------------------- Inumin: De-bote [_] Softdrink ___________________ [_] Juice ____________________ [_] Alak ______________________ [_] Iba pang de-bote ______________________ ----------------------------- Inumin: Hindi de-bote [_] Kape ______________________ [_] Juice ______________________ ----------------------------- Non-food [_] Toothpaste __________________________ [_] Sabon panligo _______________________ [_] Sabon panlaba ________________________ [_] Shampoo/Conditioner _____________________ [_] Diapers _____________________ ----------------------------- Iba pang binibili [_] Specify __________________________________ __________________________________ 4. Anu-ano ang madalas na maubos sa inyong tinda? [_] Specify __________________________________ __________________________________ __________________________________ 5. Kung kayo ay nauubusan ng tinda, ano ang karaniwang dahilan nito? (paki-check lahat ng angkop na sagot) [_] Nagamit ng personal [_] Walang kapital o pambili [_] Walang stock sa supplier/binibilhan [_] Mabilis maubos at hindi napapalitan agad [_] Iba dahilan _____________________________ 6. Kapag wala ng produktong hinahanap ano ang ginagawa ng bumibili? (isang sagot po lamang) [_] Hindi na bumibili at lumilipat sa ibang tindahan [_] Naghahanap ng ibang produkto [_] Bumibili ng parehong produkto pero ibang brand 7. Kayo po ba ay nagpapautang? [_] OO, bakit?_________________________________
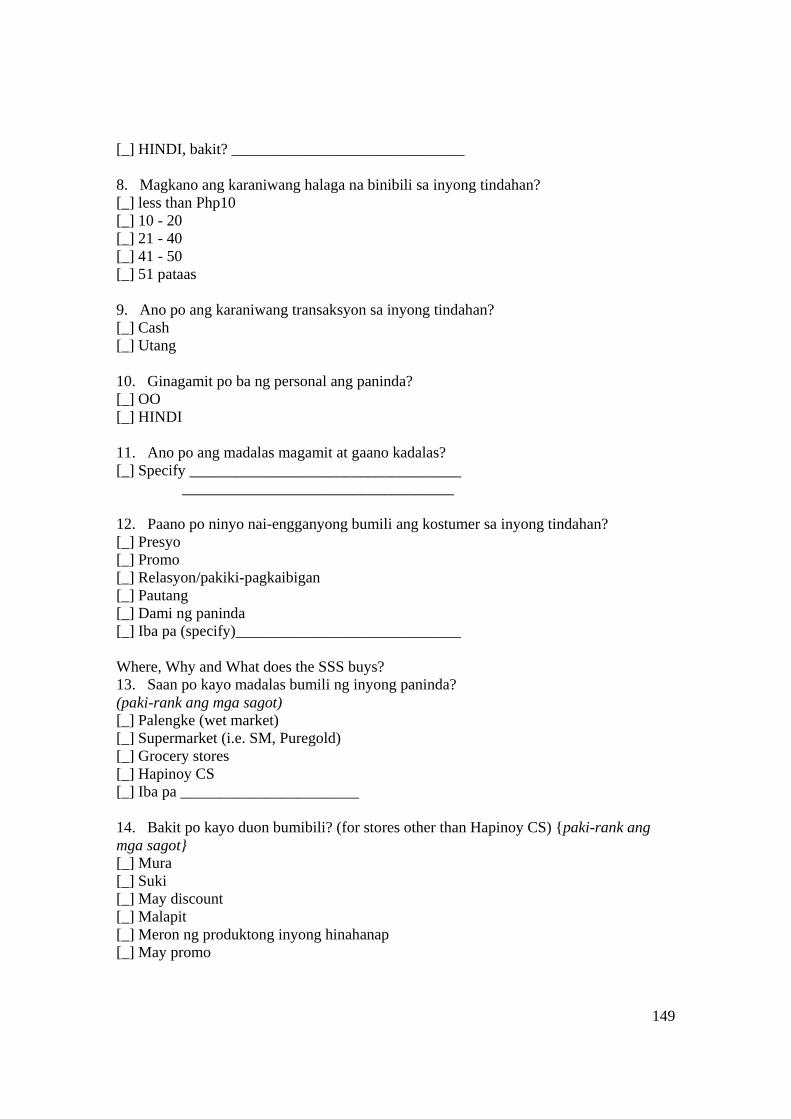
149
[_] HINDI, bakit? ______________________________ 8. Magkano ang karaniwang halaga na binibili sa inyong tindahan? [_] less than Php10 [_] 10 - 20 [_] 21 - 40 [_] 41 - 50 [_] 51 pataas 9. Ano po ang karaniwang transaksyon sa inyong tindahan? [_] Cash [_] Utang 10. Ginagamit po ba ng personal ang paninda? [_] OO [_] HINDI 11. Ano po ang madalas magamit at gaano kadalas? [_] Specify ___________________________________ ___________________________________ 12. Paano po ninyo nai-engganyong bumili ang kostumer sa inyong tindahan? [_] Presyo [_] Promo [_] Relasyon/pakiki-pagkaibigan [_] Pautang [_] Dami ng paninda [_] Iba pa (specify)_____________________________ Where, Why and What does the SSS buys? 13. Saan po kayo madalas bumili ng inyong paninda? (paki-rank ang mga sagot) [_] Palengke (wet market) [_] Supermarket (i.e. SM, Puregold) [_] Grocery stores [_] Hapinoy CS [_] Iba pa _______________________ 14. Bakit po kayo duon bumibili? (for stores other than Hapinoy CS) {paki-rank ang mga sagot} [_] Mura [_] Suki [_] May discount [_] Malapit [_] Meron ng produktong inyong hinahanap [_] May promo

150
[_] Iba pang dahilan, _____________________________ 15. Gaano kadalas po kayo mamili ng paninda? [_] Linggo-linggo (specify) __________ [_] Buwanan (specify) _____________ 16. Magkano ang inyong budget kapag namimili? [_] less than 500 [_] 500 – 1,000 [_] 1,000 pataas (specify) ____________________ 17. Bakit po kayo bumibili sa Hapinoy CS? [_] Mura [_] Suki [_] May discount [_] Malapit [_] Meron ng produktong inyong hinahanap [_] May promo [_] Ginagamit ang GC [_] Iba pang dahilan, _____________________________ 18. Gaano kadalas po kayo pumunta sa CS? [_] Linggo-linggo (specify) __________ [_] Buwanan (specify) _____________ 19. Ano po ang inyong madalas bilhin sa CS? [_] Pagkaing de-lata __________________________ [_] Pagkaing hindi de-lata ______________________ [_] De-bote _________________________________ [_] Iba pa __________________________________ 20. Magkano ang halaga ng inyong nabibili sa CS? [_] less than 500 [_] 500 – 1,000 [_] 1,000 pataas (specify) ____________________ 21. Sa mga sumusunod na statement, alin po ang angkop na deskripsyon sa inyong pamimili sa CS? [_] Strongly satisfied [_] Satisfied [_] Ok lang/Neutral [_] Dissatisfied [_] Strongly dissatisfied [_] Hindi masabi
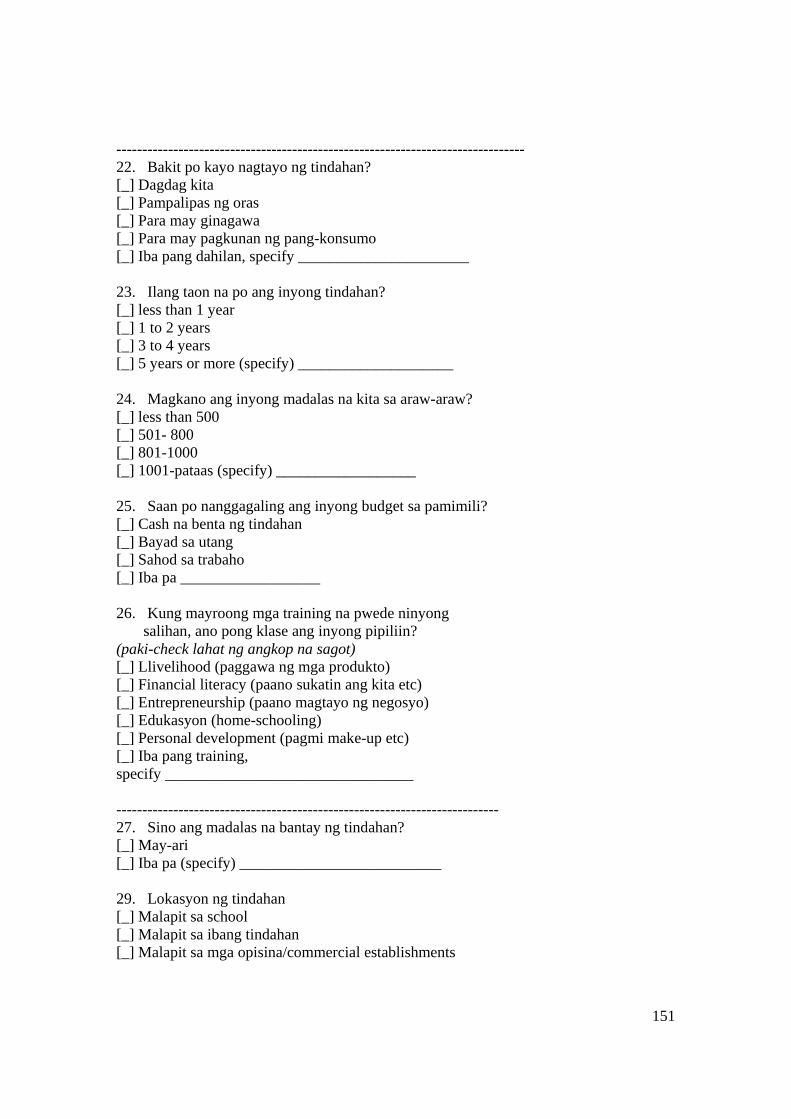
151
------------------------------------------------------------------------------- 22. Bakit po kayo nagtayo ng tindahan? [_] Dagdag kita [_] Pampalipas ng oras [_] Para may ginagawa [_] Para may pagkunan ng pang-konsumo [_] Iba pang dahilan, specify ______________________ 23. Ilang taon na po ang inyong tindahan? [_] less than 1 year [_] 1 to 2 years [_] 3 to 4 years [_] 5 years or more (specify) ____________________ 24. Magkano ang inyong madalas na kita sa araw-araw? [_] less than 500 [_] 501- 800 [_] 801-1000 [_] 1001-pataas (specify) __________________ 25. Saan po nanggagaling ang inyong budget sa pamimili? [_] Cash na benta ng tindahan [_] Bayad sa utang [_] Sahod sa trabaho [_] Iba pa __________________ 26. Kung mayroong mga training na pwede ninyong salihan, ano pong klase ang inyong pipiliin? (paki-check lahat ng angkop na sagot) [_] Llivelihood (paggawa ng mga produkto) [_] Financial literacy (paano sukatin ang kita etc) [_] Entrepreneurship (paano magtayo ng negosyo) [_] Edukasyon (home-schooling) [_] Personal development (pagmi make-up etc) [_] Iba pang training, specify ________________________________ -------------------------------------------------------------------------- 27. Sino ang madalas na bantay ng tindahan? [_] May-ari [_] Iba pa (specify) __________________________ 29. Lokasyon ng tindahan [_] Malapit sa school [_] Malapit sa ibang tindahan [_] Malapit sa mga opisina/commercial establishments
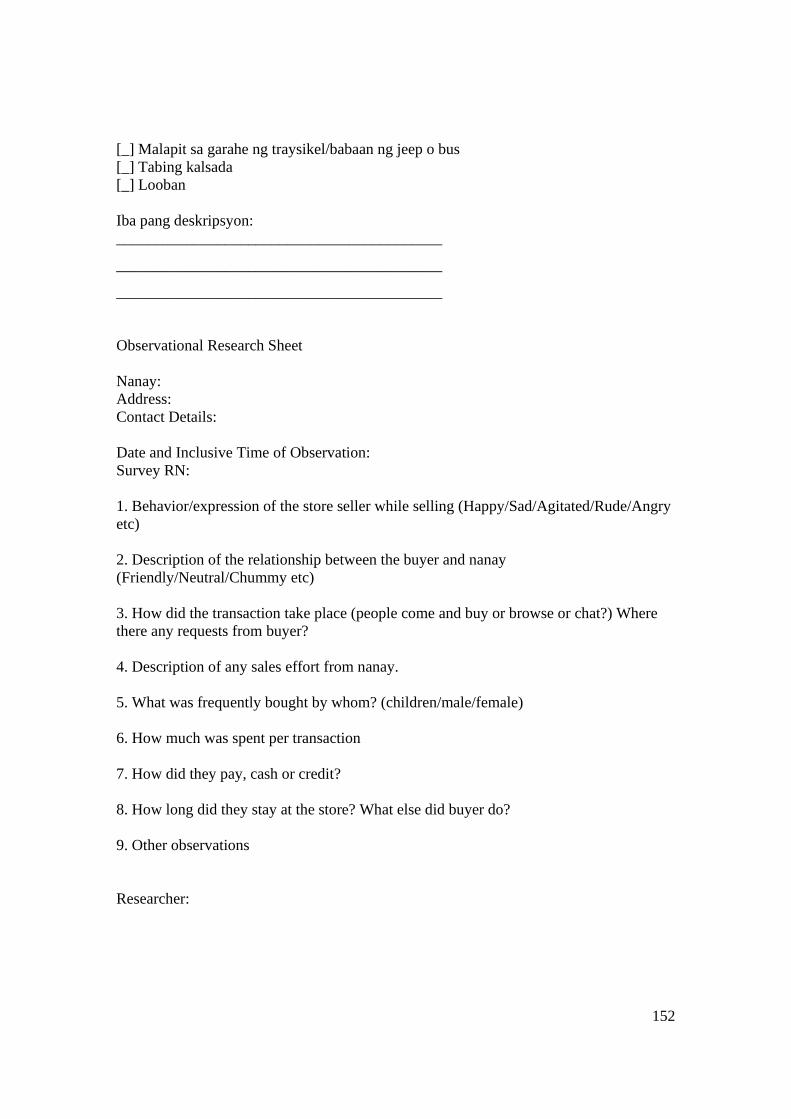
152
[_] Malapit sa garahe ng traysikel/babaan ng jeep o bus [_] Tabing kalsada [_] Looban Iba pang deskripsyon: __________________________________________
__________________________________________
__________________________________________
Observational Research Sheet Nanay: Address: Contact Details: Date and Inclusive Time of Observation: Survey RN: 1. Behavior/expression of the store seller while selling (Happy/Sad/Agitated/Rude/Angry etc) 2. Description of the relationship between the buyer and nanay (Friendly/Neutral/Chummy etc) 3. How did the transaction take place (people come and buy or browse or chat?) Where there any requests from buyer? 4. Description of any sales effort from nanay. 5. What was frequently bought by whom? (children/male/female) 6. How much was spent per transaction 7. How did they pay, cash or credit? 8. How long did they stay at the store? What else did buyer do? 9. Other observations Researcher: