achieving more: operational flood storage areas and biodiversity
TRANSCRIPT

Environment Agency Title
Achieving more: operational flood storage areas and biodiversity Final report October 2009
Achieving more: operational flood storage areas and biodiversity. Final report - October 2009
We are The Environment Agency. It's our job to look after your environment and make it a better place - for you, and for future generations. Your environment is the air you breathe, the water you drink and the ground you walk on. Working with business, Government and society as a whole, we are making your environment cleaner and healthier. The Environment Agency. Out there, making your environment a better place.
Published by:
Environment Agency Rio House Waterside Drive, Aztec West Almondsbury, Bristol BS32 4UD Tel: 0870 8506506
Email: [email protected] www.environment-agency.gov.uk © Environment Agency All rights reserved. This document may be reproduced with prior permission of the Environment Agency.

Achieving more: operational flood storage areas and biodiversity. Final report - October 2009
Contents Amendment Record This report has been issued and amended as follows:
Issue Rev Description Date Halcrow Group Ltd Author Reviewer
Comments
1 1 Draft Report 25-09-09 ST/IE/KP/JC KP
1 1 Final report 21-10-09 ST/PT/KP/JC CM Report amended to accommodate comments

Achieving more: operational flood storage areas and biodiversity. Final report - October 2009

Achieving more: operational flood storage areas and biodiversity. Final report - October 2009
Contents
Glossary 1
1 Executive summary 3
2 Flood Storage Areas in England 6 2.1 Introduction 6 2.2 What is a Flood Storage Area? 7 2.3 FSA operation and where they are best used 8 2.4 Example FSAs 10 2.5 Current FSA design 16
3 Biodiversity value of Flood Storage Areas 17 3.1 Aims and approach 17 3.2 Biodiversity resource in existing FSAs 19 3.3 Value of biodiversity resource in existing FSAs 22 3.4 Importance and potential of FSAs for biodiversity 24
4 Resilience and compatibility of habitats 25 4.1 Aims and approach 25 4.2 Impacts of flood storage on biodiversity in FSAs 27 4.3 Compatibility of non-wetland land uses and FSAs 50 4.4 Increasing resilience to flood storage 52 4.5 Discussion and conclusions 53
5 Climate change and flood storage areas 56 5.1 Context 56 5.2 Impacts of increased peak flows on biodiversity 56 5.3 Projected changes in peak river flow 62 5.4 Other impacts of changes in rainfall on flood storage operability 64 5.5 Land use change and CFMPs 64
6 Integrated design for flood storage and biodiversity 68 6.1 Review of requirements to achieve integration 68 6.2 Biodiversity-potential decision key 69 6.3 Example integrated design scenarios 70
7 Recommendations for developing workable solutions 74 7.1 Context 74 7.2 Mainstream delivery mechanisms 75 7.3 Other possible delivery and funding mechanisms 76 7.4 Scheme development 76 7.5 Risks and future implementation 80

Achieving more: operational flood storage areas and biodiversity. Final report - October 2009
8 Next steps and recommendations 81
References 83
Appendices 87
Appendix A: FSA Data Collection and Analysis i
Appendix B: Overview design guide for FSAs iii
Appendix C: Land Cover Map Habitat Definitions xvii
Appendix D: Biodiversity value of FSAs xx
Appendix D(i): Assessment methodology xx
Appendix D (ii) Biodiversity value of specific FSAs xxv
Appendix D(iii): Associated species populations and groups xxxix

Achieving more: operational flood storage areas and biodiversity. 1 Final report - October 2009
Glossary
Anoxia Without oxygen, or, low oxygen conditions.
Biodiversity The number and diversity of plant and animal life in a given area.
Community An assemblage of plants or animals that occur together.
Culvert A culvert is a structure through which water can flow. Culverts vary in shape. A pipe is an example of a circular culvert.
Dynamic Having the ability to change.
Eutrophication Build-up of excessive levels of nutrients leading to high levels of productivity.
FSA Flood storage area. A natural or man made area basins that temporarily fill with water during periods of high river levels.
Fluvial River related.
Hydrograph A hydrograph is a graph which shows the relationship between river discharge and time.
Hydrological niche space
The range of functional roles or positions that species can occupy in relation to hydrology.
Impounding FSA
Impounding FSAs are constructed across watercourses (usually by means of a dam) and restrict the peak size of downstream flows along the watercourse by means of a culvert.
Median light transmission
The most frequent proportion of light passing through e.g. 10%, 50%.
NNR National Nature Reserve. NNRs are a selection of the very best parts of England’s Sites of Special Scientific Interest. The majority also have European nature conservation designations.
Niche The functional role or position of a species in its ecosystem.
Non-impounding FSA
Non-impounding FSAs are constructed next to watercourses (not across them). Peak water flows are removed from the watercourse, are stored temporarily, and then are returned once the peak flows have passed.

Achieving more: operational flood storage areas and biodiversity. 2 Final report - October 2009
Ramsar site Wetlands of international importance, designated under the Ramsar Convention.
Resilience The ability to re-establish following a catastrophic event.
Riparian Riverside/related to rivers or flowing water.
Succession The gradual and orderly process of change in an ecosystem brought about by the progressive replacement of one community by another.
SAC Special Area of Conservation. Areas which have been given special protection under the European Union’s Habitats Directive and contribute to the establishment of a European network of important high-quality conservation sites that will make a significant contribution to conservation of the 189 habitat types and 788 species identified in Annexes I and II of the Directive (as amended).
SPA Special Protection Areas. Area which have been identified as being of national and international importance for the breeding, feeding, wintering or the migration of rare and vulnerable species of birds found within European Union countries.
SSSI Sites of Special Scientific Interest (SSSI) is a national designation for the best sites for wildlife and geology in England.
Tolerance The level of disturbance or stress that a species or habitat can withstand without being destroyed.
Washland A washland is an area or plot which can become immersed in water at times of higher water levels. Washlands fill and drain naturally.
Water regime The duration, depth and timing of surface water inundation resulting from surface water (overland flow), precipitation and ground water inflow.
Weir A weir is a structure or dam over which water flows.
Wetland An area of land whose soil is saturated with moisture either permanently or seasonally.

Achieving more: operational flood storage areas and biodiversity. 3 Final report - October 2009
1 Executive summary
This project is one of a number commissioned by the Environment Agency as a response to the Pitt Review (2007) Recommendation 27, to work with partners to establish a programme to achieve greater working with natural processes to manage flood risk. This study will inform how Flood Storage Areas (FSAs) may contribute to national biodiversity and designations targets such as the UK Biodiversity Action Plan (BAP) and the Defra Outcome Measures 4 and 5.
The key aim of the project is to better understand the operational requirements of flood storage areas (FSAs) to deliver desired standards of protection and how these might influence the biodiversity values that could be achieved.
FSAs are natural or man-made areas that temporarily fill with water during periods of high river level, retaining a volume of water which is released back in to the watercourse after the peak river flows have passed. In terms of Environment Agency involvement, the vast majority of FSAs attenuate fluvial events and are located either on or adjacent to rivers to provide flood protection to downstream communities. Details of how these are best used and three examples are provided in this report. A much smaller number of FSAs are located on estuaries and operate by limiting the progression of the tide and thereby improving the standard of protection to properties at risk from tidal flooding.
Data on existing FSAs was extracted from the Environment Agency’s National Flood & Coastal Defence Database (NFCDD) and the Environment Agency’s Reservoirs Database. These two sources were combined to form a single spreadsheet. The biodiversity resource within FSAs was subsequently analysed using Natural England’s BAP Habitat data and Centre for Ecology and Hydrology’s Land Cover Map data (sub-class 2).
GIS analysis revealed that out of the total of 1000 FSAs in England, 211 contained UK BAP habitats. Deciduous woodland (not including wet woodland) is the most frequently occurring UK BAP habitat in FSAs. However the total area of this habitat is relatively small, suggesting that although the habitat is present within FSA boundaries, it only occupies a small proportion of area. By far the most extensive habitats within FSAs are coastal and floodplain grazing marsh and lowland meadows.

Achieving more: operational flood storage areas and biodiversity. 4 Final report - October 2009
The biodiversity value of the existing resource was analysed by ranking FSAs according to statutory nature conservation designations and whether UK BAP habitats are supported. The analysis demonstrates that 5.3% of FSAs already support national or international habitat. FSAs are also already making an important contribution to national BAP targets. However over 75% of FSAs currently only support ‘lower value’ biodiversity, which means that there are significant potential opportunities for increasing the biodiversity value of these sites and for working more closely with natural processes, i.e. storing water within floodplain habitats that naturally occur in flood-prone locations.
With the opportunities for meeting BAP targets for wetland habitats being limited to those areas where sufficient water resources are available, the potential importance of FSAs to contribute must not be overlooked. Further, the potential flood storage capacity of areas where wetlands would occur naturally were it not for human intervention, presents a strong opportunity for increased working with natural processes.
A literature review and quantification of the tolerance and resilience of wetland BAP habitats to flood storage were undertaken. This demonstrated that several UK BAP wetland and floodplain habitats are resilient to long durations of flooding. The majority of existing FSAs currently support dry habitats of lower biodiversity value and this is often targeted in the design of new FSAs in order to maximise storage capacity. Although these dry land cover types and habitats are compatible with flood storage and are likely to have non-use value in terms of, for example, recreation and biodiversity, they also have potential to support higher biodiversity value. The study has shown that even infrequent, short duration flooding on soils with slow drainage can support UK BAP wetland habitats, assuming that the conditions are suitable in between events.
Three key approaches to enhancing the biodiversity value of FSAs have emerged from this study. These can be incorporated into the design process for new FSAs and can also be applied to existing FSAs, to retro-fit benefits for biodiversity. These are:
Details of the tolerance of target UK BAP habitat types under varying soil drainage, flood duration, seasonal and flood frequency conditions have been identified, allowing suitable targets to be selected and the water regime during and between flood storage events to be designed as appropriate.

Achieving more: operational flood storage areas and biodiversity. 5 Final report - October 2009
Modifications to designs to reduce potentially negative impacts of flooding characteristics, such as water quality, stagnation and water depth, on biodiversity.
Examples of methods to increase the inherent resilience of habitats and species populations to flood storage include:
o Addressing connectivity between the flood management asset and adjacent habitats;
o Consider site-specific measures such as over-designing flood-storage capacity so that the wetness of the area is maintained beyond the flood event period without compromising flood storage capacity when it is needed; and
o Consider neighbouring land-use and identify potential to seek agreement with landowners to conserve or enhance washland habitat types.
Further to the above recommendations, a reappraisal of design considerations must also ensure sustainability into the future, and take account of climate change impacts on habitats, flood storage requirements and changes in land use.
Integrating biodiversity and flood risk management requires the consideration of biodiversity early in the design process. A five stage biodiversity-potential decision key has been developed to capture all biodiversity potential available in new or existing FSAs. Example integrated scenarios are provided for fluvial and tidal FSAs.
To develop workable solutions, a new design process flow chart and a revised overview design guide for FSAs have been developed. These products can be used to deliver fully integrated biodiversity and flood management solutions. Apart from Environment Agency-funded scheme delivery, a number of other delivery mechanisms which have the potential to deliver flood-risk management benefits were explored. These can be grouped into delivery mechanisms designed to have large-scale uptake, targeted delivery mechanisms and mainstream funding mechanisms.

Achieving more: operational flood storage areas and biodiversity. 6 Final report - October 2009
2 Flood Storage Areas in England
2.1 Introduction Halcrow Group Limited, working with academic experts (Cranfield University and the Open University), was commissioned by the Environment Agency to undertake a study into the use of Flood Storage Areas (FSAs) and the biodiversity opportunity these present now and the potential for them to enhance biodiversity value in the future. This study will therefore inform how FSAs may contribute to national biodiversity and designation targets such as the UK Biodiversity Action Plan (BAP) and the Defra Outcome Measures 4 and 5.
The project is one of a number that have been commissioned by the Environment Agency as a response to the Pitt Review (2007) which recommended that the Environment Agency should work with partners to establish a programme to achieve greater working with natural processes to manage flood risk. FSAs are one way in which greater working with natural processes might be achieved. The concept of “working with natural processes” is becoming increasingly accepted in flood and coastal erosion risk management (FCERM) policy and is highlighted within the Government’s current Draft Flood and Water management Bill.
The Government’s response to Making Space for Water1 in 2005 stated its intention to pursue a more strategic approach, and move to a wider portfolio of responses to flood risk. This would entail use of rural land-use solutions, such as creation of wetlands and washlands, coastal realignment, river-corridor widening and river restoration. Other key drivers such as the Water Framework Directive, and climate change related Government initiatives, also highlight the need to consider different approaches to how flood risk is managed.
Pitt Recommendation 27 Working Group’s working definition Working with natural processes means taking action to manage flood and
coastal erosion risk by protecting, restoring and emulating the natural regulating function of catchments, rivers, floodplains and coasts…
Whilst the overall aim of this project is to assist the Environment Agency in working with natural processes, one way in which this can be achieved is by developing a better understanding of the operational requirements of FSAs
1 http://www.defra.gov.uk/environ/fcd/policy/strategy.htm

Achieving more: operational flood storage areas and biodiversity. 7 Final report - October 2009
to deliver desired standards of protection, and understanding how these might be adapted to enhance the biodiversity values they provide.
At times of high flows, some rivers overtop their banks and flow out onto the surrounding land. This is a natural process and evidence of this includes inundated fields adjacent to rivers. Areas of land affected in this way are often referred to as washlands. FSAs can represent a formalisation of this natural arrangement ensuring that if a river overtops it will occur in a pre-determined location. Often, however, FSAs are constructed specifically to reduce high river flows, again with the purpose of ensuring that overtopping occurs in a pre-determined location (for example in a park or agricultural area) rather than somewhere where it is not wanted such as in a housing estate.
This ‘Increase use of flood storage areas and biodiversity’ report includes a review of the concepts of FSAs, biodiversity values of FSAs, habitat resilience and compatibilities, the effects of climate change and a review of how fluvial FSA design may be amended to enhance the biodiversity value.
2.2 What is a Flood Storage Area? 2.2.1 Types of FSA
FSAs are natural or man-made areas that temporarily fill with water during periods of high river level, retaining a volume of water which is released back in to the watercourse after the peak river flows have passed. In terms of Environment Agency involvement, the vast majority of FSAs attenuate fluvial events and are located either on or adjacent to rivers to provide flood protection to downstream communities. A much smaller number of FSAs are located on estuaries and operate by limiting the progression of the tide and thereby improving the standard of protection to properties at risk from tidal flooding.
FSAs are predominantly owned and maintained by the Environment Agency, however there are some in private ownership or owned by Local Authorities and Water Companies.
2.2.2 Existing FSA data The first stage in this project was to define and extract the locations of all FSAs. It was agreed during the steering group inception meeting (19 June 2009) that the scope of the project would cover England only.
FSA data was extracted from two sources; namely the Environment Agency’s National Flood and Coastal Defence Database (NFCDD) and the
Achieving more: operational flood storage areas and biodiversity. 8 Final report - October 2009
Environment Agency’s Reservoirs Database. Information from the two sources was extracted and combined to form a single data set, presented in the form of a spreadsheet.
2.2.3 Summary data presentation Following the combination of NFCDD/Reservoir Database data (where possible) into a spreadsheet, pertinent details were then extracted and presented in a GIS layer.
The data has indicated that there are 1,000 FSAs in England. These range in size from a fraction of a hectare, through to a massive 2300ha, but almost 95% of them have an area of less than 75ha.
2.2.4 Data set shortcomings Difficulties were encountered with the data including inconsistencies between the amount of information provided for different sites in NFCDD and security issues with some of the data in the Reservoirs Database. More details on this are provided in Appendix A.
The data does not reveal the standard of protection the FSA provides to communities nor their likely frequency of operation. Some indication of the size of the storage area can be gleaned from the maximum volume of the storage area and the surface area of the reservoir i.e. whether the reservoir has a large shallow footprint or whether it is small in area with a significant depth of water, which does have some implications for biodiversity potential.
2.3 FSA operation and where they are best used 2.3.1 FSAs considered in this project
The scope of this report is specifically to cover FSAs rather than naturally occurring washlands (as described in Section 2.1).
2.3.2 Fluvial FSAs Fluvial FSAs work by removing a volume of water from the watercourse at peak flows thereby reducing downstream flows. FSAs are often used in conjunction with river training structures e.g. walls and embankments, to improve the standard of flood protection provided to a community.
To work efficiently the FSAs need to be designed such that they remove the peak flood flows. If an FSA is full with water before the peak flow arrives, it will have a negligible impact on reducing flood level rise downstream and therefore be ineffective.
Impounding FSAs, also known as on-line FSAs, are constructed across watercourses and restrict the peak size of downstream flows along the

Achieving more: operational flood storage areas and biodiversity. 9 Final report - October 2009
watercourse. Impoundment is usually achieved through construction of a dam and flows are restricted by means of a culvert (or pipe). The culvert may be fitted with a flow control device to better control the magnitude of the flows passing through.
Non-impounding FSAs, also known as off-line FSAs, are not constructed across a watercourse but are located next to them. Typically non-impounding FSAs comprise an inlet structure, a dam or retaining structure and an outlet structure. Peak water flows are removed from the watercourse, are stored temporarily, and then are returned once the peak flows have passed. Examples of Impounding FSAs (Gaunless) and Non-impounding FSAs (Centre Vale Park (Todmorden) and Millwood) are presented in Section 2.4.
The inlet structures to non-impounding FSAs can take many different forms including weirs or culverts and channels, both of which may have control gates. In the case of inlet weirs or inlet channels, the inlet level needs to be set such that the storage area starts to fill thus removing the peak of the flood flow from the river system. Where inlets are gated, the gate needs to open once the river has reached a pre-defined level.
On impounding reservoirs, the size of the culvert passing through the dam is critical. If the culvert in the dam is too large it will allow too much water to pass through and thereby not achieve the required standard of protection downstream. If the culvert through the dam is too small it will start restricting the flow of water too early and the FSA will be full before the peak flows have occurred. The design of culvert size is further complicated because the amount of water passing through the culvert will vary with varying depths of water retained in the FSA. This problem may be overcome through the use of a vortex flow control device.
Outlets from non-impounding FSAs can either be via gravity through an open or gated culvert. The gravity outlet commences operation once the peak river flow has passed and requires no manual intervention. The gravity outlet ensures that the FSA commences emptying as soon as possible after a flood event and so is ready for re-use should there be another flood in the watercourse. In contrast, gated outlets require manual intervention and the FSAs will remain full until the gate is opened.
FSAs vary considerably in size, shape and nature. They can be relatively simple having only one inlet and outlet or they can be more complex with multiple inlet and outlets. Furthermore, some FSAs are designed to empty completely following use and others are designed to include wetland habitats. The wetland habitats present within FSAs vary considerably,

Achieving more: operational flood storage areas and biodiversity. 10 Final report - October 2009
depending on the design and operation of the FSA and the characteristics of the flood event. Provision of a set of generic design guidelines for habitat creation is not possible, as the type of habitat created varies depending on frequency and duration of flooding and soil drainage (chapter 4).
FSAs are often combined with river training structures such as walls and embankments to achieve an increased standard of flood protection to a downstream community. This appropriate standard of protection is calculated by an iterative process of modelling a number of storm events and undertaking a cost benefit analysis of the whole life cost of the proposed works versus the benefits. Through this iterative process, the appropriate ‘design’ event is determined and the scheme designed for that event. When events larger than the design event occur, the FSA will tend to be full early, which will have an impact on the downstream standard of protection.
The type of FSA suitable for a particular location depends on a number of factors and this is covered in more detail in Appendix B. In general however, where high river levels occur over a long period, it is more efficient to use a non-impounding FSA. Where the river levels rise and fall quickly, it is better to use an impounding FSA.
2.3.3 Tidal FSA Tidal FSAs are used to intercept peak water flows passing upstream along a watercourse originating from the sea. By removing a proportion of the flow in an upstream direction and storing it temporarily in an FSA the upstream watercourse level rise is reduced as is the risk of flooding to areas beyond the FSA. To be effective, a tidal FSA needs to be located a considerable distance upstream from the sea (or estuary) on a relatively narrow section of watercourse. An example of this is the Environment Agency’s FSA at Alkborough. It must be noted that the use of tidal FSAs is rare and the number of locations where this solution may be employed is limited. Consequently, tidal FSAs are not considered further in this report.
2.4 Example FSAs 2.4.1 River Gaunless Flood Storage Area
The River Gaunless flood alleviation scheme is an example of an impounding FSA. This scheme manages river flows to reduce flood risk to over six hundred properties south west of Bishop Auckland, County Durham, on the River Gaunless, a tributary of the River Wear. The scheme comprises a 315m long and 12m high earthfill dam (Photos 1 and 2) and a culvert complete with a flow control structure (Photo 3), making most efficient use of the available storage. Local river training defences were also

Achieving more: operational flood storage areas and biodiversity. 11 Final report - October 2009
included as part of this project. The layout of this impounding FSA may be seen in Photo 1.
Photo 1: River Gaunless – Impounding FSA (at end of construction)
At Gaunless the maximum pass forward flow is limited to 11.2 cubic metres per second, which is approximately equivalent to a 1 in 2 year flood. In other words this FSA will commence filling, to some extent, every other year.
River Flow
Photo 2
Photo 3

Achieving more: operational flood storage areas and biodiversity. 12 Final report - October 2009
Photo 2: River Gaunless – View along the top of the impounding dam
Photo 3: River Gaunless – Outlet structure with screen and flow controllers
2.4.2 Todmorden Flood Alleviation Scheme The Lower Todmorden flood alleviation scheme includes two examples of non-impounding FSAs. The main FSA is located in the town’s recreational park at Centre Vale (Photos 4 and5) and is designed to hold 22,500m3 of flood water (refer to Figure 2.2). The dam length is 270m with a maximum

Achieving more: operational flood storage areas and biodiversity. 13 Final report - October 2009
height of approximately 3m. The dam is constructed from clay fill. The inlet is a gated culvert, set to open when the river reaches a 1 in 10 year level (it would be expected to fill to some extent every 10 years). The gravity outlet allows the FSA to empty once the peak flows have passed.
Figure 2.2: Centre Vale Park FSA – Non-impounding

Achieving more: operational flood storage areas and biodiversity. 14 Final report - October 2009
Photo 4: Centre Vale Park FSA and inlet structure
Photo 5: Centre Vale Park FSA and outlet structure
The second storage area is downstream of Todmorden town centre at Millwood and reduces the flood risk to the properties on the outskirts of the town. This storage area is designed to hold about 14,000m3 (refer to Figure 2.3). The dam length is approximately 150m and the maximum height of the dam is about 2.5m. The dam is constructed from clay fill. The inlet structure

Achieving more: operational flood storage areas and biodiversity. 15 Final report - October 2009
is a weir set to start overtopping when the river reaches a 1 in 10 year level. The outlet is by a gated gravity outlet and will allow the FSA to empty once the gate is opened. With the inlet level set as it is, statistically this non-impounding FSA will contain water to some extent every 10 years.
Figure 2.3: Millwood FSA – Non-impounding
Photo 6: Millwood FSA - inlet weir

Achieving more: operational flood storage areas and biodiversity. 16 Final report - October 2009
Photo 7: Millwood FSA - gated outlet
2.5 Current FSA design Halcrow has prepared an ‘Overview Design Guide’ for FSAs as part of this study and this is included as Appendix B. This design guide covers how fluvial FSA’s are currently designed and incorporates modifications to ensure that biodiversity opportunities are realised. It also identifies the main technical references that are applicable to the design. The design guide only considers FSAs retained by embankment dams. It is possible that a concrete dam or structure could be used to create a FSA but to date these account for less than 5% of the retaining structure on the current FSAs.
To supplement the ‘Overview Design Guide’, an optioneering stage spreadsheet has been created to allow the user to identify the broad brush costs associated with the construction of a FSA. This spreadsheet considers both impounding (online) and non-impounding (offline) reservoirs and can be operated with minimal basic data. The rates used in the spreadsheet are extracted from the Environment Agencies Unit Cost Database 2007 but used defined rates can be entered.
It should be noted that to date, FSA’s have been designed primarily for the purpose of reducing flood risk. As a result of implementation of the Pitt Review and other policy initiatives, the Environment Agency is working with partners to identify opportunities for increasing the biodiversity value of its assets, both new and existing.

Achieving more: operational flood storage areas and biodiversity. 17 Final report - October 2009
3 Biodiversity value of Flood Storage Areas
3.1 Aims and approach This chapter establishes the current biodiversity resource within flood storage areas and assesses any non-flood risk values of those areas, with a particular focus on biodiversity value. Biodiversity value has been assessed by reference to habitats and communities they support. The methodology followed also includes species for many higher value sites where species are the targeted interest features for statutory designations.
3.1.1 Identification of existing biodiversity resource Data availability and relevance to end-uses of this study determined that the resolution of habitats selected followed that of the UK Broad Habitat Types classification, sub-divided into Priority Habitat Type and Land Cover Map sub-class 2, as sourced from:
Biodiversity Action Plan (BAP) Habitat Map (Natural England) Land Cover Map categories, down to sub-class 2 (Centre for
Ecology and Hydrology).
Interrogation of these data sets identified the habitats and land cover types within each FSA.
3.1.2 Valuation of habitat types Assessing the biodiversity value of habitats can be a contentious issue and a number of different approaches have been developed in recent years. For this study, valuation of habitats and land cover types must be undertaken using a simple, objective, rapid and repeatable approach. The methodology adopted was to rank FSAs according to statutory designations and whether UK BAP habitats are supported, following recommendations(1). Details of the methodology and selection process are presented in Appendix D(i). Resulting biodiversity value categories and assumptions are shown in Table 3.1.

Achieving more: operational flood storage areas and biodiversity. 18 Final report - October 2009
Table 3.1. Biodiversity value categories, qualifying criteria and associated assumptions.
Value Category Qualifying criteria Assumptions International SPA (including potential
SPAs) SAC (including candidate SACs) Ramsar (including proposed sites)
Assumed to be in favourable condition and supporting or having the potential to support the same features as at the time of designation or proposal for designation.
National SSSI (including all national nature reserves)
Assumed to be in favourable condition or having the potential to support the same features as at the time of designation.
UK BAP UK BAP Priority Habitat The status as a priority habitat type does not imply any specific level of ecological value, however BAP habitats are all of value in terms of contributing to targets and will therefore be valued higher than non-BAP habitats but sub-national unless specifically designated.
Lower value Undesignated and non-UK BAP habitat.
Assumes that all land not included in UK BAP habitats dataset is currently of sub-priority habitat value.
Statutory or non-statutory designations of regional or local value such as Sites of Interest for Nature Conservation (SINCs) and Local Nature Reserves (LNRs), and the potential to achieve Local BAP targets are beyond the scope of this project and, as these sub-national designations and targets are considered to be in-consistent between regions and areas, analysis is considered unlikely to be meaningful.
3.1.3 Supplementary biodiversity values for flood storage areas
Landscape context The landscape context of each habitat or land cover type i.e. being part of a larger resource beyond the FSA boundary, may increase the biodiversity value and value of the resource for dependent species. The habitat context has been analysed by identifying those UK BAP habitats included in a 1km buffer around each FSA.
Value of species populations Data on populations of species is unattainable within the timescale of the project, therefore supplementary biodiversity value for sites based on value

Achieving more: operational flood storage areas and biodiversity. 19 Final report - October 2009
of species populations is considered beyond the scope of the project. However, species populations of importance have been identified from citations for internationally and nationally designated sites (details in Appendix D(ii)).
3.2 Biodiversity resource in existing FSAs 3.2.1 Land Cover Map types in FSAs
A total of 1000 FSAs in England fulfilled the conditions for inclusion in this study. Land Cover Map data suggest that these FSAs include 23 sub-class level 2 land cover types, with 11 land cover types occupying more than 1% of total FSA area (Table 3.2). Appendix C provides definitions of the Land Cover types.
Table 3.2. Land cover occurrence of over 1% of FSAs in England.
Land Cover Map habitat
No. of FSAs where habitat
is found
% of FSAs where
habitat is found
% of total FSA area
Total area of habitat in FSAs (ha)
Arable cereals 264 26.4 9.7 2016
Arable horticulture 404 40.4 21.0 4389
Broad-leaved/mixed woodland
597 59.7 7.0 1452
Calcareous grass 298 29.8 5.0 1046
Coniferous woodland
253 25.3 1.3 272
Continuous urban 373 37.3 3.7 769
Fen, marsh, swamp 28 2.8 5.9 1232
Improved grassland 446 44.6 23.4 4879
Inland water 245 24.5 11.0 2293
Neutral grass 169 16.9 5.4 1126
Suburban/rural development
496 49.6 3.8 791
The most frequently occurring habitat type is broadleaved/mixed woodland followed by suburban/rural development (likely to include parks and

Achieving more: operational flood storage areas and biodiversity. 20 Final report - October 2009
recreation grounds), improved grassland and arable horticulture. The most extensive in area is improved grassland followed by arable horticulture and inland water (Figure 3.1). The latter demonstrates that over 11% of FSA area and 24.5% of FSAs have standing water as the primary land use type.
0 500 1000 1500 2000 2500 3000 3500 4000 4500 5000
Arable Cereals
Arable Horticulture
Broad-leaved/Mixed woodland
Calcareous Grass
Coniferous Woodland
Continuous Urban
Fen, Marsh, Swamp
Improved Grassland
Inland Water
Neutral Grass
Suburban/Rural Development
Area (ha)
Figure 3.1 – Area of Land Cover Map Types in all FSAs
3.2.2 UK BAP habitats in FSAs Of the total of 1000 FSAs in England, 211 contained UK BAP habitats. These BAP habitats comprise eight priority habitats (Table 3.3).
Deciduous woodland (not including wet woodland) is the most frequently occurring UK BAP habitat in FSAs, reflecting the findings of Land Cover Map analysis in section 3.1.1. However the total area of this habitat is again relatively small, suggesting that although the habitat is present within FSA boundaries it only occupies a small proportion of area. By far the most extensive habitats within FSAs are coastal and floodplain grazing marsh and lowland meadows (Figure 3.2).
Lowland heathland, mudflats, fen and purple moor grass/rush pasture habitats are each only present in under 10 of the 1000 FSAs, therefore these habitats have been excluded from detailed analysis in chapter 4, which instead focuses on the more widespread habitats.

Achieving more: operational flood storage areas and biodiversity. 21 Final report - October 2009
Table 3.3. UK BAP habitat occurrence within FSAs in England.
BAP habitat No. of FSAs where habitat
is found
% of FSAs where hab-itat is found
% of FSA area where habitat
is found
Total area of habitat in FSAs (ha)
Coastal & floodplain grazing marsh
69 6.9 33.8 7065
Lowland fen 9 0.9 3.2 659
Lowland heathland 3 0.3 0.02 4
Lowland meadow (including MG4 and MG8 grassland)
17 1.7 17.5 3654
Lowland mixed deciduous woodland
136 13.6 1.0 211
Mudflats 4 0.4 0.01 2
Purple moor grass & rush pasture
5 0.5 8 1685
Reedbed 13 1.3 4.1 847
Wet woodland 13 1.3 0.09 19
0 1000 2000 3000 4000 5000 6000 7000 8000
Wet Woodland
Reedbed
Purple Moor Grass and Rush Pasture
Mudflat
Lowland Meadow
Lowland Heathland
Fen
Deciduous Woodland
Coastal and Floodplain Grazing Marsh
Figure 3.2 – Area of UK BAP habitat in all FSAs

Achieving more: operational flood storage areas and biodiversity. 22 Final report - October 2009
3.3 Value of biodiversity resource in existing FSAs 3.3.1 Habitat value
Analysis of designated site data has shown that a total of 53 FSAs in England contain habitat of national or international value (Appendix D(i)). Of these, 25 contain habitat of international ecological value (SAC, SPA or Ramsar sites) and 53 contain habitat of national ecological value (SSSI). A total of 173 have UK BAP habitats but do not have any national or international value. This also means that 774 FSAs only contain habitat of lower ecological value (Figure 3.3).
Figure 3.3 – Total Area of each Biodiversity Value Category in FSAs
The land cover types in those FSAs that only contain lower value habitats are shown in Figure 3.4. This shows a slightly different pattern in land cover extents to those of the whole data set, with arable horticulture covering the greatest area, followed by inland water and improved grassland.
International
National
UK BAP
Lower value

Achieving more: operational flood storage areas and biodiversity. 23 Final report - October 2009
0 200 400 600 800 1000 1200 1400 1600 1800
Area (ha)
Acid Grassland
Arable CerealsArable Horticulture
Arable Non-rotationalBracken
Broad-leaved/Mixed woodlandCalcareous GrasslandConiferous Woodland
Continuous UrbanDense Dwarf Shrub Heath
Fen, Marsh, SwampImproved GrasslandInland Bare Ground
Inland WaterLittoral Sediment
Neutral GrassOpen Dwarf Shrub Heath
Saltmarsh
Setaside GrassSuburban/Rural Development
Figure 3.4 – Total Area of each Biodiversity Value Category in FSAs
It should be noted that BAP data sets were last updated in 2004 and some data may be several years older than that and may not be comprehensive. Therefore these data sets are to be considered indicative rather than accurate and precise with reference to the presence of habitats and areas covered.
3.3.2 Species value Species populations and groups listed on citations for designated sites are contained within Appendix D(ii). Those species groups that are of value within FSAs are clearly biased towards species groups found in wetland habitats. Birds are frequently a designated feature of these sites, even where there is no SPA designation (Birds Directive). The most frequent groups of birds to be listed are wildfowl and wading species, with wetland and riparian birds, woodland birds and other ground-nesting birds also being included as important or even primary features for designations. The other species groups include:
Plants o Aquatic, riparian and wetland plants including fen species o Wet grassland species including meadow species o Saltmarsh species o Dry grassland and scrub species (acid and calcareous) o Ancient and other woodland species (including ancient trees) o Heathland species (wet and dry) o Bryophytes (mosses)
Fungi Invertebrates

Achieving more: operational flood storage areas and biodiversity. 24 Final report - October 2009
o Aquatic and estuarine invertebrates including beetles, crustaceans and molluscs
o Wetland invertebrates including dragonflies, damselflies, hoverflies, moths and soldier flies
o Terrestrial invertebrates including woodland and deadwood species, butterflies and beetles
Fish Amphibians Reptiles
It is important to note however, that the species groups listed are present within the designated site as a whole, and the designated site intersects with the FSA. However, the species group may not occur within the FSA or be in anyway related to the habitats present within the FSA.
3.4 Importance and potential of FSAs for biodiversity The analysis demonstrates that 5.3% of FSAs already support national or international habitat. FSAs are also already making an important contribution to national BAP targets. However the high proportion (over 75%) of FSAs currently supporting ‘lower value’ biodiversity means that there are significant potential opportunities for increasing the biodiversity value of these sites and for working more closely with natural processes, i.e. storing water within floodplain habitats that naturally occur in flood-prone locations.
With the opportunities for meeting BAP targets for wetland habitats being limited to those areas where sufficient water resources are available, the potential importance of FSAs to contribute must not be overlooked. Further, the potential flood storage capacity of areas where wetlands would occur naturally were it not for human intervention, is clearly a strong opportunity for increased working with natural processes.
Chapter 4 explores the tolerance and resilience of habitats of higher biodiversity value to flood storage in order to identify how this potential can be realised, both in existing FSAs and most importantly through integration of biodiversity targets with standards of flood protection in the design process for new FSAs.

Achieving more: operational flood storage areas and biodiversity. 25 Final report - October 2009
4 Resilience and compatibility of habitats
4.1 Aims and approach Following on from analysis of biodiversity value and contribution of FSAs to the biodiversity resource in England, this chapter aims to review the tolerance and resilience of biodiversity known to occur in FSAs to flooding regimes found in FSAs. Previous research e.g. the Environment Agency’s Ecohydrological Guidelines for Lowland Wetland Plant Communities and English Nature’s Research Report 598(2) explore the tolerable water regimes (water table level, timing, duration and soil drainage conditions) for various wetland habitats and plant communities within a year. The focus of this report is especially in relation to between-year variation and the operational requirements of flood storage areas to reduce flood risk, with the objective to:
a) Identify biodiversity interest (both wetland and non-wetland) that should be compatible with the management of FSAs as flood defence assets,
b) Identify biodiversity interests that are not compatible with flood storage,
c) Identify the benefits of flood storage to biodiversity, and
d) To inform the design process such that FSA standards of protection are integrated with biodiversity benefits during the design process.
This chapter provides indicative guidance into the factors that influence compatibility of habitats with flood storage and the potential benefits for biodiversity. It generally takes a pragmatic, high level stance to identify issues for consideration and opportunities for biodiversity, rather than establishing detailed information on responses of all habitats or comprehensive habitat coverage. However greater detail has been included specifically for relevant UK Biodiversity Action Plan (UK BAP) wetland habitats. The study makes the assumption that hydrological conditions between flood events are suitable for the persistence of the habitats present. The tolerance of individual species has been considered for the most commonly occurring species of fauna cited in nationally and internationally designated sites (species of higher value): namely wildfowl and waders.

Achieving more: operational flood storage areas and biodiversity. 26 Final report - October 2009
A brief literature review was undertaken to focus on the factors that determine tolerance and resilience of habitats and species to flood storage, as distinct from natural flooding regimes. This review contributes to qualitative understanding of biodiversity within FSAs and also helps to develop a quantitative analysis of responses of selected habitats, building on previous research into typologies of habitats in washland habitats(2). Potential implications for recovery from flood storage on high value habitats are illustrated with two case studies. This information was then applied to the lower value habitats that comprise the majority of area within FSAs in order to identify opportunities for increasing biodiversity benefits of FSAs.
4.1.1 Definition of tolerance and resilience to flood storage Habitat tolerance to flood storage is an important aspect of habitat persistence in flood storage areas. In ecology, tolerance to flooding can be defined as ‘the frequency and duration of flooding that the habitat can withstand without being destroyed and replaced by another habitat type’. Therefore a habitat is tolerant to flood storage if it is not destroyed by the flooding event.
Resilience of habitats to flood storage can be defined as; ‘the time it would take to re-establish favourable habitat condition following a catastrophic flood event’. In layman’s terms this equates to the rate of recovery (if at all). Therefore a habitat is resilient to flooding if it recovers rapidly enough between flood events to persist into the future. It follows that flood frequency is an important function of resilience to flood storage.
4.1.2 Flood storage scenarios to be analysed Previous research has shown that the impacts of flooding are strongly dependent on soil water regime, duration and frequency of flooding and seasonality(2). This part of the study develops the methodology used in the Environment Agency’s Ecohydrological Guidelines for Lowland Wetland Plant Communities, which attributed habitats to matrices of soil drainage and flood duration. That study considered annual flooding, whereas here a range of flooding frequencies is considered to establish resilience of habitats(2).
4.1.3 Habitat compatibility with FSA operation Those habitats identified in chapter 3 as being most widespread in FSAs have been assessed for their compatibility with flood storage.
Data supplied during this study (i.e. that taken from the Environment Agency’s NFCDD database and reservoirs database) do not specify the designed standard of protection (return period) of each FSA. Therefore meaningful quantitative analysis of compatibility of existing flood storage

Achieving more: operational flood storage areas and biodiversity. 27 Final report - October 2009
regimes with biodiversity is not feasible with the current dataset but would be an informative analysis in a review of existing FSAs.
4.2 Impacts of flood storage on biodiversity in FSAs The impacts of flood inundation on biodiversity are determined by the characteristics of the flood event, with the relative importance of each characteristic varying depending on the sensitivities of the habitat and the combination of characteristics occurring. The following literature review briefly describes each of these characteristics and the impacts on resilience of flora and fauna over different time scales.
4.2.1 Characteristics of flood storage
Flooding frequency On floodplain grassland, high inundation frequencies promote survival of grass species that naturally occur on floodplains, including those species that are targets for floodplain grassland conservation(3). Where flooding frequency increases, rapid changes are induced in the plant community composition, and community composition is highly dynamic with respect to soil moisture status(4,5). Therefore flooding frequency can be a strong determinant of the community composition and a pre-requisite for wetland habitats.
It has been demonstrated that in stable plant communities, floodplain-meadow species have distinct hydrological niches(6). These hydrological niches have been quantified for 99 of the more common meadow species(7). Community types (as defined by the National Vegetation Classification (NVC)) also show clear segregation in “hydrological niche space”, i.e. different plant communities are present in areas with different water regimes(7). As such, flood storage areas with differing flooding frequencies offer an opportunity to increase the extent of a diverse range of wetland habitats.
Mechanisms operating within plant communities that determine species composition include suppression or loss of species that are intolerant to the flooding. Regular flooding generally causes an overall reduction in species richness of floodplain grassland (due to the loss of the less tolerant species) and an increase in biomass production (due to the increase in sediment delivered nutrients). This has been shown to be only partly reversed after ten years. A future increase in flood frequency might be detrimental to species richness in that habitat(8). However, species composition can recover rapidly from short duration flooding(9).

Achieving more: operational flood storage areas and biodiversity. 28 Final report - October 2009
Flooding causes changes not only to established vegetation, but also to seed-bank composition, favouring wetland species and imparting long-term influence on species being recruited to the plant community(10).
Of particular importance to wetland birds and particularly wading species, is the impact of inundation on soil fauna.
Earthworm abundance and biomass is usually reduced by extensive flooding at a large spatial scale locally by 80–100%. Where controlled flooding is applied at a large scale, recolonisation by annelid worms from un-flooded refuge sites would be a very slow process. Therefore, the time interval between two flooding events should exceed the development time from cocoon to adult of the earthworm and enchytraeid species (pot worms). To maintain viable populations of annelids, especially in spring when they serve as food for wetland birds, a new inundation in the recovery period (2–3 months for enchytraeids and about 6 months for earthworms) should be omitted or kept short(11).
Soil invertebrate biomass (and hence potential to support breeding-wader populations) declines within a few years of water levels being raised(12). Subsequent colonisation by anoxia-tolerant species does occur, but biomass levels do not recover to those of well-managed grasslands that avoid prolonged low oxygen conditions.
Therefore although the vegetation of a habitat normally supporting wetland birds may be resilient to the flooding regime, frequent flooding may detrimentally impact the foraging opportunities to such an extent that the habitat can no longer support the bird features of particular value.
Timing Timing and duration of a flooding event are considered the key components for the survival of plant communities(13). Timing (i.e. season) will influence water and soil temperatures (see below) as well as plant growth stage. When plants are dormant (generally when mean soil temperatures are <5oC), their oxygen demand is very low, therefore survival of flooding in winter is high. However, when in active growth, plant roots and other soil organisms display a high demand for oxygen and can rapidly exhaust this resource and then die during a flood unless they are specifically adapted to such conditions. Where flooding kills plants before seed set, annual species in particular can be lost from the community. Overall, the tolerance to flooding is reduced if flooding occurs within the growing season.

Achieving more: operational flood storage areas and biodiversity. 29 Final report - October 2009
Duration The length of time that land is inundated is a primary driver of community composition in flooded grasslands(14), and the lower boundary of species distribution on floodplains is set by duration of flooding during the growing season(15). The lethal threshold values for inundation duration under extreme conditions have been defined for different vegetation types(16) (Table 4.1).
Table 4.1. Inundation duration thresholds for vegetation types relevant to England (16).
Vegetation type Lethal duration threshold (days per year)
Hardwood forest (oak, ash and elm) 20–50
Softwood forest (white willow) 20–150
Wet hardwood forest (ash and alder) 50–150
Marsh forest (alder and sedges) >150
Hardwood shrub (hawthorn, rose, blackthorn) <50
Wet herbaceous (reed canary-grass, great willowherb, creeping thistle)
20–150
Helophytes (bullrush, sedges, reeds) >150
Wet hayfield (meadow foxtail, docks/sorrel and creeping bent)
50–150
Dry meadow (Brome, crested dog’s-tail and creeping buttercup)
<20
Wet meadow (creeping bent, silverweed and clovers) 20–150
Arable floodplain <20
Lake 365
The duration of flooding also determines the length of time that seeds are exposed on the soil surface. This is an important factor in the germination and early establishment phases of species and can change the plant community by determining which species are recruited to the plant community(17).
The most important constraint that plants have to deal with during flooding is oxygen deficiency, especially on soils with high organic matter content. Long duration flooding causes major “setbacks” in the vegetation

Achieving more: operational flood storage areas and biodiversity. 30 Final report - October 2009
composition. Shortening the flood duration is, therefore, advantageous to vegetation(16).
Water depth Deep floods are characterized by very low median light transmission levels due to the suspended sediment load in the water(18). The degree to which riparian plants survive a given period of submergence is determined by light intensity. Vervuren’s(18) experiments indicate that the survival in poor light conditions in extreme years determine the species distribution for many years after.
Some species found in regularly flooding environments show adaptation to sudden changes in flood depth, for example changes in physiological and metabolic processes resulting in morphological change, triggered by low oxygen levels(19).
Water quality PHOSPHORUS. Particle-bound phosphorus is transported in the sediment load of flood water and therefore phosphorus import is a consequence of flooding. About 30% of the sediment and adsorbed phosphorus that enters an area during an extreme flood is retained(16). Phosphorus availability in floodplain soils is a function of flooding regime rather than soil wetness(20).
Species richness (of floodplain grasslands) decreases significantly with increasing phosphate supply, therefore high-frequency fluvial flooding can be detrimental to species richness(3). Species diversity is greatest at intermediate nutrient availabilities with nitrogen and phosphorus interacting(21).
STAGNATION. Where water retained in FSAs is stagnant, high organic content from crop residue and bottom sediments can impose a high oxygen demand. The consequence of this is a high risk of low dissolved oxygen levels leading to fish kill. This risk increases if sediment oxygen demand increases with rising water temperatures(22). Depletion of oxygen causes earthworm kill(11) and thereby can increase long term impacts on wetland birds.
Water temperature As stated above, the impact of stagnation and low dissolved oxygen levels in storage areas is increased as water temperatures increase. This is due to increased sediment oxygen demand and also to decomposition of algal blooms(22). This issue is therefore of particular importance where floods occur outside the winter period at warmer times of year.

Achieving more: operational flood storage areas and biodiversity. 31 Final report - October 2009
Management MOWING. Both flood frequency and mowing affect species composition of temperate lowland floodplain meadows. However, flood regime has been found to be less important in determining community composition than mowing regime and a combination of frequent flooding and annual mowing can increase species-richness(23). Annual disturbance and/or the creation of open vegetation gaps through annual mowing are necessary in order to maintain species-rich vegetations in these systems.
Mowing is also effective at nutrient removal(24) and favours fungal dominance in the soil microbial fauna(25). In regularly flooded sites, mowing to remove nitrogen and restore nitrogen limitation is necessary to maintain species diversity(26).
GRAZING. Species richness of floodplain grasslands decreases significantly under year-round grazing, probably due to competitive interactions between plants with uneven patterns of defoliation. This contrasts with mowing, which removes tall species and mediates competition for light(3).
SPECIES INTRODUCTION. Floods are ineffective at introducing species of conservation interest to a system, and other techniques are needed to increase species richness or introduce target species(27). Although flooding can transport in more seeds, these are mainly of a few species such as soft rush, and therefore this process does not increase species-richness
4.2.2 Implications for resilience to flood storage Habitat resilience to flood storage The influence of the characteristics of flood storage events on habitat resilience equate to:
factors that reduce survival of component species, and factors that influence recruitment and replenishment of species
during the recovery period.
These factors are summarised in Table 4.2.

Achieving more: operational flood storage areas and biodiversity. 32 Final report - October 2009
Table 4.2. Factors influencing survival and recruitment following flood storage.
Survival of species reduced by: Recruitment of species reduced by:
Higher frequency flooding that may occur in impounding reservoirs
Depleted seed bank due to higher frequency flooding that may occur in impounding reservoirs
Flooding during the growing season which is more likely in impounding reservoirs due to the frequency of flooding
Seed production failure due to summer flooding which is more likely in impounding reservoirs due to the frequency of flooding,
Higher water temperature -
Long duration flooding, that may occur in gated non-impounding reservoirs
Long duration flooding (reduced seed exposure time) which is more likely in gated non-impounding reservoirs
Deeper water -
Turbid water -
Stagnation and low oxygen -
- Additional competition caused by high nutrient status
Furthermore the issues discussed above illustrate that resilience is moderated or changed by those characteristics of flooding that have a residual impact on the habitat (assuming hydrology and management is appropriate between flood events). In particular, elevated nutrient levels can have a prolonged impact on habitats, reducing species richness and delaying recovery of communities that require nutrient-limited soils, such as species-rich lowland meadows and fens. This water quality issue needs to be considered during decision making processes in the design of integrated FSAs. On a precautionary note, the following case studies 1 and 2 illustrate implications of introducing flood storage on existing high value sites for biodiversity. Case studies 3 and 4 are examples of sites where existing low biodiversity value was enhanced by use for flood storage.
4.2.3 Case studies
Case study 1: Woodwalton Fen Woodwalton Fen is a NNR and Ramsar site in Cambridgeshire. Its Ramsar designation is due to being a “…particularly good representative example of a near natural wetland, which is characteristic of the biogeographical region…[and as it] …supports an appreciable assemblage of wetland plants

Achieving more: operational flood storage areas and biodiversity. 33 Final report - October 2009
and invertebrates...”. It also qualifies as a cSAC (and SSSI) due to supporting one of the best areas in the UK for purple moor grass meadows. It is also recognised for its saw sedge beds and population of great crested newts.
Approximately 50 years ago the site was impounded and became a reservoir to store floodwater let in from the Great Raveley Drain at times of high flow in the Middle Level System. The fen is only used for flood storage in extreme circumstances which means it is not flooded very often but occasionally these flood storage events are big; the last of substantial size was in 1998. Photo 8 shows the depth of flooding at Woodwalton Fen during that event.
Photo 8. Flooding depths on Woodwalton Fen, showing the very high levels in 1998 (photo by Tim Hess).
A program of three surveys of flora and fauna in the dyke system has shown that the site is in decline due to long term eutrophication. Uncoupling impacts of flood storage from the reliance on eutrophic agricultural drain water for summer irrigation is extremely difficult, however experience of site managers suggests that impacts in particular can be attributed to flood storage.
Silt has been observed to be deposited during flood storage, which certainly contributes to increased nutrients on the site. Strong growth of common

Achieving more: operational flood storage areas and biodiversity. 34 Final report - October 2009
reed, reed canary grass and soft rush are indicators of eutrophication and are invading previously species-rich stands of fen.
Flood timing is crucial. Spring and summer flooding is detrimental to ground-nesting birds and invertebrate populations. However, long duration winter flooding is also detrimental. For example the large copper butterfly has been lost from the site due to incompatibility with overwintering larva (pers comm.. Alan Bowley conservation officer).
The experience on this site suggests that high quality habitat is very difficult to combine with flood storage. With increasing eutrophication on the site the demands on management are increasing yet flora and fauna are still in decline.
The Great Fen Project has identified that; “Woodwalton Fen is suffering from the inundation of winter water that occurs when the Middle Level drainage system can’t carry water away fast enough. Whilst the site needs to remain wet the quality and quantity of winter water is doing more harm than good”.
After 10 years the site is still recovering from the detrimental impacts of the depth, duration and nutrients deposition on the site during the flood storage event.
Case study 2: Cricklade North Meadow Cricklade North Meadow is designated as a NNR and SAC on the grounds of its species-rich floodplain-meadow flora (MG4). It also contains the majority of the UK’s population of the rare snakeshead fritillary.
The meadow is in open connection with the Rivers Thames and Churn. Both spill out onto the site at time of high flow. The return period is approximately 1 year. Water returns to the rivers by overland flow and/or groundwater flow via the underlying gravel terrace when river levels drop. The duration of surface water following a flood can vary from 3 days to several weeks depending on river behaviour. Substantial deposits of silt can be left on the meadow following the recession.
Monitoring of vegetation has shown that larger than average flood events in 2000 and 2001, which resulted in prolonged surface water standing on the meadow surface during the growing season, has led to a change in extent of the species-rich and most highly valued communities at this site.
The immediate consequences of these prolonged periods of standing water in spring 2000 and spring 2001, were extensive grass kills across the

Achieving more: operational flood storage areas and biodiversity. 35 Final report - October 2009
meadow, where plants died and rotted as a result of soil anoxia. In many areas the species richness of the vegetation was reduced by up to 50%. Some areas did show substantive recovery in just a few years, but many lower-lying parts of the meadow have suffered long-term effects of the flooding as a result of sedges becoming dominant within the sward. These areas have shown no detectable recovery in 7 years. Some mitigation work had been carried out by the Environment Agency in 1998, which allowed better surface drainage in one area of the meadow. This area has shown greater recovery than a control area whether the surface drainage was left unchanged. Monitoring is on-going to follow the longer-term response.
Case study 3: Alkborough Tidal Defence Scheme, Humber Estuary Alkborough Flats was identified as one of the key sites where managed realignment could provide both flood-risk management and nature conservation (habitat creation) benefits. The site is located on the south bank of the Humber Estuary, on the eastern side of the confluence between the Humber and the River Trent. The project has been managed through a steering group led by the Environment Agency with the full involvement of Natural England and North Lincolnshire District Council. Funding has been secured from a diverse range of sources and organisations, including Yorkshire Forward (for local employment elements) the EU (as a demonstration Interreg project) and the Heritage Lottery Fund (local oral history project, archaeological investigations) as well as Defra grant in aid, Higher Level Stewardship (HLS) and Natural England funds.
The site has a total area of 450ha, of which 370ha lie between the tidal defence and an escarpment; the remaining 80ha lie between the tidal defence and low water mark. The existing defence comprises a grassed earth embankment set back behind saltmarsh. Seaward of the saltmarsh is mudflat.
A breach was created in the existing tidal defence to allow tidal inundation and development of intertidal habitat. Further designs for the benefit of biodiversity included a bund within the new intertidal area, constructed to separate a possible area of freshwater habitat from the main intertidal area (Photo 9). The site has proved to be extremely successful and there is potential for formal designation.
The design process at this site is outlined in Figure 4.1.

Achieving more: operational flood storage areas and biodiversity. 36 Final report - October 2009
Figure 4.1. Summary of Alkborough Tidal Defence Scheme project design process.
Photo 9. Alkborough Tidal Defence Scheme.
Case study 4: Long Eau In order to increase the efficiency of land drainage for agriculture, both the Great and Long Eau rivers were modified with raised embankments to increase the channel capacity. The embankments constrained

Achieving more: operational flood storage areas and biodiversity. 37 Final report - October 2009
geomorphological processes and cut off contact between the rivers and their floodplains, thereby reducing its flood storage potential.
In the mid 1990s, washlands were created in the floodplain of the Long and Great Eau by setting back the old embankments and opening up areas of the floodplain for seasonal flooding (Photo 10). The first washland to be created was situated on the River Long Eau in an otherwise intensive agricultural area. Following its success, the owner of arable land across the river also signed up to the scheme to extend the washland to a total area of 72ha.
A main objective of the washland creation was to enhance the habitat in an area of low biodiversity. Arable land was sown with grass seed to create semi-improved grassland. In addition, enhancements were made to the channel to encourage increased biodiversity. Wet ledges (berms) were created to allow wetland marginal flora and fauna to establish and develop along the edge of the river. Riffles were constructed within the channel to alternate the depth of water between shallows and deep pools, and the bank which was not set-back was re-profiled in places to produce cliffs to encourage kingfishers to return to the river.
Photo 10. Long Eau Scheme .

Achieving more: operational flood storage areas and biodiversity. 38 Final report - October 2009
Case study Conclusions The key conclusion from these Case Studies is that changing the water regime (to flood storage) on a site that already supports high value biodiversity is unlikely to be compatible with the existing biodiversity and could be detrimental to the site, since water regime is a key determinant of which plant and animal communities can be supported. However the opportunities to increase biodiversity value of an existing lower value site for habitats and species can create and sustain improved, (and sometimes internationally important), new habitat and species. Therefore, flood storage opportunities for biodiversity should initially be focussed on areas with lower existing biodiversity value.
4.2.4 UK BAP habitat tolerance and resilience to flooding frequency Overview The tables provided in this section indicate the soil water and flooding duration conditions tolerated by each habitat type, under a range of flooding frequencies. The quantitative assessment has been undertaken for the four most widespread UK BAP habitats found in FSAs. These habitats are subject to national targets for conservation, enhancement and creation, and the assessment will inform risk and opportunities for them in FSAs. The habitats found within FSAs have been identified in chapter 3 and are sourced from the Natural England UK BAP habitat inventories and Land Cover Map data (see caveats in chapter 3). The UK BAP habitats to be analysed comprise:
Coastal and floodplain grazing marsh, Wet woodland, Lowland meadow (including MG4 and MG8 grassland), Reedbed
Each habitat comprises plant communities, defined by the National Vegetation Classification (NVC) that are naturally found in floodplains and tolerant to a degree of flooding. As described in the literature review (4.2.1), the flooding characteristics will determine which of these plant communities are present under different flooding regimes. The analysis of the habitats has been broken down into the constituent plant communities.
Key environmental variables considered are:
Soil drainage (rapid, moderate & slow) Flood duration (< 3 days, < 2 weeks and > 2 weeks) Flooding frequency (annual, > 3 years, > 6 years) Time of year (winter or any time of year)

Achieving more: operational flood storage areas and biodiversity. 39 Final report - October 2009
Soil drainage and flooding duration are defined (2) as:
Soil drainage is a function of soil conductivity and drainage infrastructure.
Rapid soil drainage = following inundation, water table typically falls by >30 cm in < 10 days in winter.
Moderate soil drainage = following inundation, water table typically falls by >30cm in < 30 days in winter.
Slow soil drainage = water table does not fall below 30 cm following an inundation event in winter until late April.
Short duration of surface water: typically less than 3 days per event. Medium duration of surface water: typically less than 2 week per
event. Long duration: typically more than two weeks per event.
Tolerance and levels of resilience are distinguished for winter flooding and also for flooding at any time of year as follows:
Blue boxes indicate resilience to annual flooding; a high level of resilience to flood storage.
Green boxes indicate resilience to a flooding frequency of more than 3 years; a moderate level of resilience to flood storage.
Red boxes indicate resilience to a flooding frequency of more than 6 years; a lower level of resilience to flood storage.
Empty boxes indicate that the plant community is not tolerant to flood storage under those soil drainage and duration conditions at any flood frequency.
Other boxes indicate the soil habitat type that would occur where soil drainage and duration conditions are too dry for the specified habitat to form.
Specific details will need to be considered for each FSA but annual flooding could relate to an impounding FSA, flooding frequency of more than 3 years could relate to impounding or non-impounding FSA and a flooding frequency of greater than 6 years is likely to relate to a non-impounding FSA.

Achieving more: operational flood storage areas and biodiversity. 40 Final report - October 2009
Coastal and floodplain grazing marsh Coastal and floodplain grazing marsh habitat type is: “periodically inundated pasture, or meadow with ditches which maintain the water levels, containing standing brackish or fresh water. The ditches are especially rich in plants and invertebrates. Almost all areas are grazed and some are cut for hay or silage. Sites may contain seasonal water-filled hollows and permanent ponds with emergent swamp communities, but not extensive areas of tall fen species like reeds…”2. Therefore a degree of flooding is inherent in the ecology of the habitat, and constituent plant communities exist across a broad water regime gradient. Six types of grassland, three types of open vegetation (ephemeral habitat) and one type of swamp community are included in the BAP habitat type. In general, within coastal and floodplain grazing marsh the sequence of NVC plant community type from drier to wetter conditions is:
Table 4.3. Sequence of NVC communities on Coastal and floodplain grazing marsh
Drier
Wetter
MG6 MG7c MG9 MG10 MG11 MG13 OV28 OV30 OV32 S22
Sem
i-im
prov
ed
gras
slan
d
Spec
ies-
poor
floo
dpla
in
mea
dow
Tuss
ocky
wet
gra
ssla
nd
Rus
h pa
stur
e
Inun
datio
n gr
assl
and
Inun
datio
n gr
assl
and
Eph
emer
al v
eget
atio
n
Eph
emer
al v
eget
atio
n
Eph
emer
al v
eget
atio
n
Floa
ting
swee
t-gra
ss
swam
p
The tables clearly show that tolerance to flooding duration and soil water drainage ranges across the habitats, which defines their distribution in the flood zone. Swamp (S22), open vegetation (OV28, OV30, OV32) and inundation grasslands (MG11, MG13) tolerate slower drainage or longer duration flood events. Assuming other conditions and management are favourable, the habitat as a whole would not be excluded by any flooding regime listed in the matrix.
2 http://www.ukbap.org.uk/library/UKBAPPriorityHabitatDescriptionsfinalAllhabitats20081022.pdf#CFGM accessed August 2009.

Achieving more: operational flood storage areas and biodiversity. 41 Final report - October 2009
Table 4.3(a). MG6
Winter flooding only Flooding at any time of year
Soil Drainage Soil drainage
MG6 Semi-
improved grassland Rapid Mod Slow Rapid Mod Slow
Short Annual Annual >3 yr
Mod Annual >6 yr
Dur
atio
n flo
odin
g
Long
Table 4.3(b). MG7c
Winter flooding only Flooding at any time of year
Soil Drainage Soil drainage
MG7c Species-poor
floodplain meadow Rapid Mod Slow Rapid Mod Slow
Short →drier
grassland
Annual Annual >3 yr >3 yr >6 yr
Mod →drier
grassland Annual >3 yr >3 yr >6 yr
Dur
atio
n flo
odin
g
Long Annual >6 yr
Table 4.3(c). MG9
Winter flooding only Flooding at any time of year
Soil Drainage Soil drainage
MG9 Tussocky
wet grassland Rapid Mod Slow Rapid Mod Slow
Short →drier
grassland Annual Annual Annual >3 yr >3 yr
Mod →drier
grassland Annual >3 yr >3 yr
Dur
atio
n flo
odin
g
Long Annual >6 yr

Achieving more: operational flood storage areas and biodiversity. 42 Final report - October 2009
Table 4.3(d). MG10
Winter flooding only Flooding at any time of year
Soil Drainage Soil drainage MG10
Rush-pasture Rapid Mod Slow Rapid Mod Slow
Short →drier
grassland →drier
grassland →drier
grassland →drier
grassland Annual Annual
Mod →drier
grassland →drier
grassland →drier
grassland →drier
grassland >3 yr > 6 yr
Dur
atio
n flo
odin
g
Long →drier
grassland Annual Annual >6 yr
Table 4.3(e). Various other communities
Winter flooding only Flooding at any time of year
Soil Drainage Soil drainage
MG11, MG13, OV28,
OV30 & 0V32 Inundation grassland
and ephemeral vegetation
Rapid Mod Slow Rapid Mod Slow
Short →drier
grassland →drier
grassland Annual →drier
grassland Annual Annual
Mod →drier
grassland →drier
grassland Annual →drier
grassland Annual Annual
Dur
atio
n flo
odin
g
Long →drier
grassland Annual Annual >3yr >3yr >3yr
Table 4.3(f). S22
Winter flooding only Flooding at any time of year
Soil Drainage Soil drainage
S22 Floating
sweet-grass swamp Rapid Mod Slow Rapid Mod Slow
Short →drier
grassland →drier
grassland Annual →drier
grassland →drier
grassland Annual
Mod →drier
grassland →drier
grassland Annual →drier
grassland →drier
grassland Annual
Dur
atio
n flo
odin
g
Long →drier
grassland Annual Annual Annual Annual Annual

Achieving more: operational flood storage areas and biodiversity. 43 Final report - October 2009
Lowland Meadow Lowland meadows “include most forms of unimproved neutral grassland across the enclosed lowland landscapes of the UK. In terms of National Vegetation Classification plant communities, they primarily embrace each type of Cynosurus cristatus - Centaurea nigra grassland (MG5), Alopecurus pratensis - Sanguisorba officinalis floodplain meadow (MG4) and Cynosurus cristatus - Caltha palustris flood-pasture (MG8)…”3. These three plant community types include unimproved seasonally-flooded grasslands. In addition, MG7c (species-poor floodplain meadow) is included in the analysis since it is closely allied with MG4, occurring as less diverse fringe or mosaic with that community, with the transition between the two often controlled by water regime. Apart from this example, the differences between the communities are generally due to management and soil types rather than a clear wetness gradient. Overall, lowland meadow habitats are restricted by soil drainage and duration of flooding. Table 4.4(a). MG4
Winter flooding only Flooding at any time of year
Soil Drainage Soil drainage
MG4 Floodplain meadow Rapid Mod Slow Rapid Mod Slow
Short Annual
>3 yr
>6 yr
>6 yr
Mod Annual
>6 yr
Dur
atio
n flo
odin
g
Long >6 yr
Table 4.4(b). MG5
Winter flooding only Flooding at any time of year
Soil Drainage Soil drainage
MG5 Species-rich
pasture Rapid Mod Slow Rapid Mod Slow Short >3 yr
>6 yr
Mod >6 yr
Dur
atio
n flo
odin
g
Long
3 http://www.ukbap.org.uk/library/UKBAPPriorityHabitatDescriptionsfinalAllhabitats20081022.pdf#LM accessed August 2009

Achieving more: operational flood storage areas and biodiversity. 44 Final report - October 2009
Table 4.4(c). MG7c
Winter flooding only Flooding at any time of year
Soil Drainage Soil drainage
MG7c Species-poor
floodplain meadow Rapid Mod Slow Rapid Mod Slow
Short →drier
grassland Annual >3 yr >3 yr >6 yr
Mod →drier
grassland Annual >3 yr >3 yr >6 yr
Dur
atio
n flo
odin
g
Long Annual >6 yr
Table 4.4(e). MG8
Winter flooding only Flooding at any time of year
Soil Drainage Soil drainage
MG8 Water
meadow Rapid Mod Slow Rapid Mod Slow Short →drier
grassland Annual
>3 yr
Annual
>3 yr
Mod →drier
grassland >3 yr
>3 yr
Dur
atio
n flo
odin
g
Long >3 yr
>6 yr
Reedbed Reedbeds are: “wetlands dominated by stands of the common reed Phragmites australis, wherein the water table is at or above ground level for most of the year. They tend to incorporate areas of open water and ditches, and small areas of wet grassland and carr woodland may be associated with them.”4 . Analysis shows that reed bed exhibits a reverse pattern to the lowland meadow communities, being restricted by rapid drainage and shorter duration flooding.
4 http://www.ukbap.org.uk/library/UKBAPPriorityHabitatDescriptionsfinalAllhabitats20081022.pdf#R accessed August 2009

Achieving more: operational flood storage areas and biodiversity. 45 Final report - October 2009
Table 4.5(a). S4
Winter flooding only Flooding at any time of year
Soil Drainage Soil drainage S4
Reedbed Rapid Mod Slow Rapid Mod Slow
Short →drier
grassland →drier
grassland →drier
grassland →drier
grassland →drier
grassland Annual
Mod →drier
grassland →drier
grassland Annual
→drier
grassland Annual
Annual
Dur
atio
n flo
odin
g
Long →drier
grassland Annual
Annual
Annual
Annual
Annual
Wet woodland Wet woodland is defined as woodland that: “… occurs on poorly drained or seasonally wet soils, usually with alder, birch and willows as the predominant tree species, but sometimes including ash, oak, pine and beech on the drier riparian areas. It is found on floodplains, as successional habitat on fens, mires and bogs, along streams and hill-side flushes, and in peaty hollows”5. These communities are to a large extent determined by water regime and therefore occupy different water regime niches, generally as follows:
Table 4.6. Sequence of NVC communities on wet woodland Drier Wetter
W8 W5 W6 W7 W1 W2
Ash woodland Alder woodland Willow woodland
5 http://www.ukbap.org.uk/library/UKBAPPriorityHabitatDescriptionsfinalAllhabitats20081022.pdf#WW accessed August 2009

Achieving more: operational flood storage areas and biodiversity. 46 Final report - October 2009
Table 4.6(a). W8
Winter flooding only Flooding at any time of year
Soil Drainage Soil drainage
W8 Ash
Woodland Rapid Mod Slow Rapid Mod Slow Short >3 yr >6 yr >6 yr
Mod >6 yr
Dur
atio
n flo
odin
g
Long
Table 4.6(b). W5, 6 and 7
Winter flooding only Flooding at any time of year
Soil Drainage Soil drainage
W5, 6 & 7 Alder
Woodland Rapid Mod Slow Rapid Mod Slow
Short Annual Annual Annual Annual Annual
Mod Annual >3 yr >3 yr >3 yr
Dur
atio
n flo
odin
g
Long >3 yr >3 yr
Table 4.6(b). W1 and 2
Winter flooding only Flooding at any time of year
Soil Drainage Soil drainage
W1&2 Willow
Woodland Rapid Mod Slow Rapid Mod Slow Short →drier
woodland
→drier
woodland
→drier
woodland
→drier
woodland
→drier
woodland
Annual
Mod →drier
woodland
Annual Annual Annual Annual Annual
Dur
atio
n flo
odin
g
Long Annual Annual Annual Annual >3 yr >6 yr
Tolerance summarised by flood frequency

Achieving more: operational flood storage areas and biodiversity. 47 Final report - October 2009
The data above can be summarised and expressed in terms of flood frequency for rapid reference where flood frequency is known. Habitats tolerant to the stated flooding frequency are indicated for each soil drainage type, flooding duration and timing scenario. Colours refer to habitat type only. These tables show that the range of opportunities to develop and sustain wetland habitats are greatest where annual flooding occurs and become more limited with reduced flooding frequency.
Table 4.7. UKBAP habitats tolerant to annual flooding
Winter flooding only Flooding at any time of year Soil Drainage Soil drainage
Annual flooding
Rapid Mod Slow Rapid Mod Slow Short Lowland
meadow Coastal & Floodplain grazing marsh Wet woodland
Lowland meadow Coastal & Floodplain grazing marsh Wet woodland
Coastal & Floodplain grazing marsh Wet woodland
Lowland meadow Coastal & Floodplain grazing marsh Wet woodland
Coastal & Floodplain grazing marsh Wet woodland
Coastal & Floodplain grazing marsh Reedbed Wet woodland
Mod Lowland meadow Coastal & Floodplain grazing marsh Wet woodland
Lowland meadow Coastal & Floodplain grazing marsh Wet woodland
Coastal & Floodplain grazing marsh Reedbed Wet woodland
Wet woodland
Coastal & Floodplain grazing marsh Reedbed Wet woodland
Coastal & Floodplain grazing marsh Reedbed Wet woodland
Dur
atio
n flo
odin
g
Long Lowland meadow Coastal & Floodplain grazing marsh Wet woodland
Coastal & Floodplain grazing marsh Reedbed Wet woodland
Coastal & Floodplain grazing marsh Reedbed Wet woodland
Coastal & Floodplain grazing marsh Reedbed Wet woodland
Coastal & Floodplain grazing marsh Reedbed
Coastal & Floodplain grazing marsh Reedbed

Achieving more: operational flood storage areas and biodiversity. 48 Final report - October 2009
Table 4.8. UKBAP habitats tolerant to flooding >3 years
Winter flooding only Flooding at any time of year Soil Drainage Soil drainage
>3 years Rapid Mod Slow Rapid Mod Slow
Short Lowland meadow Wet woodland
Lowland meadow
Lowland meadow
Coastal & Floodplain grazing marsh Lowland meadow
Lowland meadow Coastal & Floodplain grazing marsh
Coastal & Floodplain grazing marsh
Mod Lowland meadow Wet woodland
Lowland meadow Coastal & Floodplain grazing marsh Wet woodland
Lowland meadow Coastal & Floodplain grazing marsh Wet woodland
Coastal & Floodplain grazing marsh
Dur
atio
n flo
odin
g Long Lowland meadow Wet woodland
Wet woodland
Coastal & Floodplain grazing marsh
Coastal & Floodplain grazing marsh Wet woodland
Coastal & Floodplain grazing marsh

Achieving more: operational flood storage areas and biodiversity. 49 Final report - October 2009
Table 4.9. UKBAP habitats tolerant to flooding >6 years Winter flooding only Flooding at any time of year
Soil Drainage Soil drainage >6
years Rapid Mod Slow Rapid Mod Slow Short Lowland
meadow Wet woodland
Lowland meadow
Lowland meadow Wet woodland
Coastal & Floodplain grazing marsh Lowland meadow
Mod Lowland meadow Wet woodland
Lowland meadow
Coastal & Floodplain grazing marsh
Lowland meadow Coastal & Floodplain grazing marsh
Coastal & Floodplain grazing marsh
ratio
n flo
odin
g
Long Lowland meadow
Lowland meadow
Lowland meadow Coastal & Floodplain grazing marsh
Wet woodland
4.2.5 Species tolerance to flooding Tolerance of species to flooding is complex but can be summarised to dependence on the following factors:
Tolerance to submersion
Ability to move to a place of safety (out of flooding zone to nearby similar habitat or climbing/residing in taller plants that have not been submerged).
Food availability during and after flood event.
Shelter availability during and after flood event.
Timing of flooding in relation to life cycle (e.g. breeding site availability during and after flood event).
Impacts on predation.
Taking the example of wildfowl and waders, flood storage can have positive and negative implications, described in Table 4.3.

Achieving more: operational flood storage areas and biodiversity. 50 Final report - October 2009
Table 4.10. Key impacts of flood storage on wildfowl and waders.
Positive Impacts
Reasons Negative impacts
Reasons
Increased feeding areas
Expanse of surface water (required by dabbling and diving wildfowl) and bare ground at margins during drawdown (required by waders).
Depleted food supply
Reduced density of anoxia and submersion in-tolerant invertebrates at sites that dry out between floods.
Increased protection from predators
Only applicable where islands are formed and can be used for roosting.
Breeding failure
Washed out nests or loss of young. Only applicable where flooding occurs in breeding season at a site that is sufficiently wet between floods to attract ground nesting wildfowl and waders.
Increased wetland habitat for feeding, shelter and breeding.
Developed due to a suitable flood frequency. Applicable where the site did not formerly support wetland.
Loss of suitable habitat for feeding, shelter and breeding.
Occurring where the vegetation is not resilient to the flood conditions – with loss of suitable habitat.
4.3 Compatibility of non-wetland land uses and FSAs Although wetland habitats and species can be compatible with flood storage, chapter 3 demonstrates that the majority of fluvial FSAs in England currently support non-wetland land cover types. The following sections discuss the compatibility of these land cover types with FSA and issues to consider in increasing the biodiversity value of these areas.

Achieving more: operational flood storage areas and biodiversity. 51 Final report - October 2009
4.3.1 Agricultural land use Flooding of agricultural land results in:
reduced yield, or complete loss of crops; loss of grazing or conserved grass; loss of stock; damage to infrastructure; deposition of debris.
Although these losses are small in comparison to losses resulting from urban flooding (for example, the summer 2007 floods in England resulted in an estimated agricultural loss of £50.7 million(28) compared to insurance claims of over £3 billion) they can be very significant to the farm businesses affected.
However, the intensity of land use and the expected frequency of flooding will determine the viability of the land use in the long term. Horticultural and intensive arable land uses require the highest standard of protection (Table 4.1) and in particular protection against summer floods - a single summer flood can result in the complete loss of harvestable yield, as such they should not be considered for impounding FSAs. Cereals, however, are more tolerant of flooding and the financial losses are lower, such that flooding with a return period of 1 in 5 years is acceptable to most businesses, as such they may be considered for either impounding or non-impounding FSAs. Similarly, improved grassland can tolerate flooding, on average, once every other year.
Table 4.11. Standards of flood defence required to support different types of agricultural land use and productivity in the UK(29).
Whole year Summer (April-October)
Land use type
Flood return period (years)
Horticulture 20 100
Intensive arable including sugar beet and potatoes
10 25
Extensive arable: cereals, beans, oil seeds 5 10
Intensive grass: improved grass (150-200 kgN ha-1), including dairy
2 5
Extensive grass (0-75 kgN ha-1), cattle and sheep
<1 3

Achieving more: operational flood storage areas and biodiversity. 52 Final report - October 2009
In all land uses, the duration of inundation is critical to the degree of crop damage. Plants can recover from short periods of inundation, but when saturated conditions persist, irreversible damage is caused and yields and crop quality are severely affected. Many land uses are therefore tolerant of short-duration flooding (typically less than one week). Given this, the use of gated outlets should be avoided unless there is an overriding need for it.
In most cases, a FSA will be designed to be used in extreme events and not to flood with small, frequent events. This is because the maximum flood risk management value can be obtained by leaving the FSA empty until it is needed and then filling as late as possible in order to provide the maximum downstream flood attenuation. Similarly, a rapid evacuation of flood water is required to provide storage for subsequent events (a FSA has no hydrological value if it is already full from the last event). Therefore, as long as the expected flood frequency complies with the requirements in Table 4.1 above and the flood waters are evacuated rapidly, agricultural land uses sit comfortably in FSAs.
4.3.2 Suburban/rural development and continuous urban areas. It is likely that most FSAs occurring on land classified as “Suburban/rural development” or “Continuous urban” are used as parks and recreational areas (such as playing fields) within otherwise urban areas. The vegetation of such land uses is generally tolerant of flooding (and may benefit from occasional deposition of sediment and nutrients) and risks to users from flood events are likely to be low. However, flood waters in an urban setting are often of poor quality. A study of a number of sports field affected by the summer 2007 floods (Cranfield University) found that although concentrations of petroleum hydrocarbons were higher in affected areas, they were not thought to be high enough to cause harm to human health. However, Escherichia coli, indicating the presence of faeces, and Salmonella spp. were found at some sites; posing a direct risk to human health if ingested. Therefore also the vegetation within this type of land use category is compatible with flood storage, large amounts of debris may be deposited that needs to be cleaned up after a flood event before the land can be returned to recreational use.
4.4 Increasing resilience to flood storage The preceding sections demonstrate the level of tolerance and resilience to flood storage exhibited by wetland UKBAP habitats and dry habitats; the latter occupying the majority of FSAs. However they also show that resilience can be increased by manipulating flooding characteristics (4.2.1) in order to reduce their impacts and thereby increase biodiversity resilience. This approach can be applied to new designs and can also be retro-fitted to existing FSAs. Examples are provided below.

Achieving more: operational flood storage areas and biodiversity. 53 Final report - October 2009
Water quality. Flooding events tend to have high sediment loads due to re-suspension of matter with high flow energy and incorporation of matter from overland flow. Methods to reduce the impact of water quality range between sediment capture, e.g. focussing sediment deposition in a specific area, and management between floods, which can be effective at removing nutrients from the system and hence improve recovery rate.
Stagnation. The impact of stagnation depends on water temperature and the oxygen demand of decomposing organic matter. Therefore minimising standing crop prior to flood events can reduce the impact of stagnation on remaining vegetation and fish in particular. In addition, design or operation to reduce the duration of flooding should be implemented where possible.
Water depth. Water depth can be reduced by increasing the FSA footprint by including topographic variability in the FSA to provide gradients.
Further to the above methods that address characteristics of flood storage, other approaches can improve the inherent resilience of habitats to flood storage. For example:
Where wetland habitats and/or species are the target biodiversity feature for the site, then conditions between floods should seek to maintain a water regime suitable for the development and persistence of that habitat and species population.
Providing connectivity between the FSA and the surrounding landscape can impart a robust and dynamic equilibrium in the wider landscape as opposed to isolated habitats and populations that are vulnerable to local loss. For example, connectivity can allow migration of mobile species between suitable locations at times of flood storage, and also provide reservoirs of species (e.g. individuals or seeds) to supplement depleted populations following flooding.
4.5 Discussion and conclusions This study has shown that several UK BAP wetland and floodplain habitats are resilient to long durations of flooding and therefore FSAs clearly offer important opportunities to support habitats of greater than ‘lower value’ and to contribute towards UK BAP targets. The majority of existing FSAs to maximise storage capacity currently support dry habitats of lower biodiversity value and these are often targeted in the design of new FSAs. Although these dry land cover types and habitats are compatible with flood

Achieving more: operational flood storage areas and biodiversity. 54 Final report - October 2009
storage and are likely to have non-use value in terms of, for example, recreation and biodiversity, they also have potential to support higher biodiversity value. The study has shown that even infrequent, short duration flooding on soils with slow drainage can support UKBAP wetland habitats, assuming that conditions in between events are suitable.
Key findings from the study that can be incorporated into design guides for fluvial FSAs in order to identify appropriate target UK BAP habitat types early in the design process are:
Characteristics of the flood event, (flood frequency, timing, duration, depth, water quality, temperature and between flood habitat management) all contribute to determining whether a habitat will be tolerant and resilient to flood storage and must be considered when selecting the target habitats and biodiversity features for a site.
Habitats that display greater biodiversity value tend to be more sensitive to the precise characteristics of flood events and between flood conditions therefore they require more careful control of the in-flood and out of flood water regime in order to persist within FSAs.
Careful FSA design can increase resilience of habitats and species to impacts of flood storage by reducing the negative impacts of flooding and by increasing the inherent resilience of habitat present
As a lead agency in the implementation of BAP targets, and under the recommendation 27 of the Pitt review, these findings present an opportunity for the Environment Agency to integrate intelligent design into a FSA design review.
Three key approaches to enhancing the biodiversity value of FSAs have emerged from this study that can be incorporated into the design process for new FSAs and also can be applied to existing FSAs in order to retro-fit benefits for biodiversity. These are:
Details of the tolerance of target UK BAP habitat types under varying soil drainage, flood duration, seasonal and flood frequency conditions have been identified, allowing suitable targets to be selected and the water regime during and between flood storage events to be designed as appropriate.
Modifications to designs to reduce potentially negative impacts of flooding characteristics, such as water quality, stagnation and water depth, on biodiversity.

Achieving more: operational flood storage areas and biodiversity. 55 Final report - October 2009
Examples of methods to increase the inherent resilience of habitats and species populations to flood storage include:
o addressing connectivity between the flood management asset and adjacent habitats,
o Consider site-specific measures such as over-designing flood-storage capacity of washland so that the wetness of the area is maintained beyond the flood event period without compromising flood storage capacity when it is needed,
o Consider neighbouring land-use and identify potential to seek agreement with landowners to conserve or enhance washland habitat types.
Further to the above recommendations, a reappraisal of design considerations must also ensure sustainability into the future. Therefore the following chapter details potential impacts of climate change on UKBAP habitats and flood storage requirements in a changing landscape.

Achieving more: operational flood storage areas and biodiversity. 56 Final report - October 2009
5 Climate change and flood storage areas
5.1 Context A review of possible impacts of climate change on flood storage areas and their biodiversity has been undertaken. This has included impacts such as:
Wetter winters affecting embankment stability Change in peak summer/annual/winter temperatures (biodiversity,
increased vegetation and storage area maintenance) Changes in sunlight hours (eutrophication, biodiversity) Effects of future land-use on flood storage area operation
5.2 Impacts of increased peak flows on biodiversity 5.2.1 Approach
This study has considered potential effects of increased peak flows that are 20% higher than current climate peak flows on existing FSAs. The impact of this has been reviewed to assess the effect on operation and biodiversity, giving an overview of the principal issues related to the expected impacts of climate change on biodiversity associated with FSAs. The UK Climate Impacts Programme has recently updated its climate change projections up to the 2080s(30). The impacts differ according to region in the UK and according to low, medium and high greenhouse gas emissions scenarios. However, the general trends are increasing summer and winter temperatures, variable precipitation predictions, with some UK regions becoming drier and some wetter, decreasing humidity, increasing storminess (depending on which climate models used) and increasing sea levels.
Wetlands generally are often biodiversity ‘hotspots’, as well as functioning as filters for pollutants from both point and non-point sources, and being important for carbon sequestration and emissions.
The study looked at the impact of these changes on the following habitats (i.e. those identified in chapter 3 as of most relevance to FSAs):
Coastal and floodplain grazing marsh Wet woodland/carr Lowland meadow Reedbed

Achieving more: operational flood storage areas and biodiversity. 57 Final report - October 2009
General effects of climate change on FSAs across all four of these habitats include, but are not exclusive to, the following:
Increased water-logging; could affect embankment stability Increased carbon dioxide levels; leading to increased photosynthesis
and vegetation growth Increased carbon dioxide levels; freshwater acidification known to
particularly affect crustaceans, some mayfly species, fish species such as minnows, salmon, roach and trout and plant communities
Increased average temperature; increased vegetation growth from longer growing season, including algal blooms, thereby exacerbating eutrophication effects
Increased peak temperature; possible die-back of plant communities External factors such as land use change, including urban
encroachment and agricultural trends will also have additional impacts on these habitats and need to be factored into any climate change adaptation measures.
Specific impacts on these habitats are described in sections 5.2.2 to 5.2.5.
5.2.2 Coastal and floodplain grazing marsh Climate change is predicted to cause a general decline in intertidal habitats. In East Anglia, losses of saltmarsh are already estimated to be approximately 60ha per annum(31). These losses are mainly attributed to coastal squeeze. If efforts are taken to compensate this loss, coastal grazing marsh currently located landward of sea defences may be vulnerable where defences are realigned or abandoned as part of a managed retreat. Tidal flooding could therefore ultimately turn these habitats into mudflat and/or saltmarsh. A tidal flood frequency of once per year or more is assumed to lead to coastal grazing marsh loss(32). Conversely, a gain in coastal grazing marsh may occur if agricultural land in the coastal floodplain is subjected to a greater flood frequency, rendering it unsuitable for other agricultural use.
An increase of 20% in peak river flows due to climate change has been reported in a separate Technical Note(33). This can be directly translated into an increased risk of fluvial flooding. This flooding could potentially lead to loss of fluvial grazing marsh if areas are inundated more frequently or for a longer duration. However, as with coastal grazing marsh, if agricultural land within the floodplain is abandoned or lost through increased flooding, new fluvial grazing marsh may be created.

Achieving more: operational flood storage areas and biodiversity. 58 Final report - October 2009
Six different climate change scenarios taking into account a highest annual temperature change of +3.5%, highest winter precipitation rate of +21% a lowest summer precipitation rate of -20% and default sea level rise of between 14cm and 54cm were tested for the time period up to the 2050s(34). This gave the results in Table 5.1 for coastal and fluvial grazing marsh in East Anglia. The six scenarios are fairly complex(34).
Table 5.1: Habitat stock and change results for different climate change scenarios in East Anglia (Case Study)
Table 5.2: Changes in su
The same six climate change scenarios also gave the results in Table 5.2 for different grazing marsh species:
Table 5.2: Changes in suitable climate space and habitat for selected Grazing Marsh species
Scenario (% change from base) Species
1 2 3 4 5 6
Brackish water crowfoot (Ranunculus baudotii) -19 -3 109 -3 -26 -6
Hairy buttercup (Ranunculus sardous) -21 -12 89 -12 -35 -6
Strawberry clover (Trifolium fragiferum) -20 -3 109 -3 -26 -5
Great crested newt (Triturus cristatus) -19 -28 67 -29 -50 -95
Coastal grazing marsh Fluvial grazing marsh
Change relative to baseline
Change relative to baseline
Climate change
scenario
Sea level rise
predicted
Area (ha)
Ha %
Area (ha)
Ha %
Baseline 15,360 13,964
1 14cm 15,281 -79 -1 13,188 -776 -6
2 18cm 15,281 -79 -1 11,431 -2,533 -18
3 18cm 48,491 33,131 216 188,607 174,643 1,251
4 54cm 15,163 -198 -1 11,381 -2,583 -19
5 54cm 1,760 -13,600 -89 10,085 -3,879 -27
6 14cm 15,281 -79 -1 10,729 -3,235 -23

Achieving more: operational flood storage areas and biodiversity. 59 Final report - October 2009
The results of this analysis show that, for the majority of climate change scenarios, coastal and grazing marsh habitats and species are expected to decline. The most vulnerable species to the scenarios is the great crested newt, yet the grazing marsh plant species are also expected to decline under five of the six scenarios.
Climate change may also exacerbate the effects of eutrophication. For example, rising temperatures can favour cyanobacteria that form harmful algal blooms. Global warming also affects patterns of precipitation and drought. These changes in the hydrological cycle could further enhance cyanobacterial dominance. For example, more intense precipitation will increase surface and groundwater nutrient discharge into water bodies. In the short term, freshwater discharge may prevent blooms by flushing. However, as the discharge subsides and water residence time increases as a result of drought, nutrient loads will be captured, eventually promoting blooms(35).
5.2.3 Wet woodland There is limited research available on climate change impacts on this specific woodland habitat type. However, the Forestry Commission has produced guidance(36) on the effects of climate change on British woodland generally. This is summarised in Table 5.3.
For habitat-specific effects, changes to water table levels could lead to the most direct impact on wet woodland. The drier climate expected in south-east England may ultimately affect water levels in carr habitat of the region, perhaps indirectly through increased water abstraction. In wetter conditions elsewhere or in different time periods, species such as alder and Salix species may be more tolerant of longer periods of flooding than other species associated with this habitat, such as ash, field maple and Betula pubescens.
Wet woodland is also vulnerable to invasive species, some of which may thrive under certain climate change scenarios. The UK BAP Habitat Action Plan for this habitat shows that the composition of vegetation communities may change due to climate change and that the habitat is vulnerable to invasive species such as Indian balsam, Impatiens glandilifera. It is also susceptible to diseases such as Phytophthora, a root disease of alder, especially those Phytophthora species, which have higher growth temperature optima (28–30ºC) such as P. cinnamomi(37). Eutrophication exacerbated by climate change could also affect water quality.

Achieving more: operational flood storage areas and biodiversity. 60 Final report - October 2009
Table 5.3: Summarised effects of climate change on British woodland
Variable Beneficial effects Detrimental effects
Increased atmospheric CO2
• Increase in growth rate
• Reduction in stomatal conductance and lower water use on a leaf area basis
• Reduction in timber quality
• Increase in leaf area and thus higher wind resistance and water use; lower light transmission also affects character of ground vegetation
• Possible nutrient imbalances
Ozone pollution
• Reduction in growth rate
• Impaired stomatal function and thus increased susceptibility to drought
Temperature • Higher potential productivity
• Lower risk of winter cold damage
• Potential for use of species not hardy at present
• Delayed hardening
• Risk of spring and autumn frost damage possibly increased
• Longer growing seasons reducing winter soil water recharge period
• Reduced winter mortality of insect and mammalian pests
• More rapid development and increased fecundity of insect and mammal pests
• Potential for exotic/alien pests to spread to the UK
Rainfall • Reduced intensity of some foliar pathogens
• Winter waterlogging limiting access for forest operations and reducing stability
• Root death increasing susceptibility to drought and soil-borne pathogens
• Summer drought-induced mortality
• Facultative pathogens more damaging in stressed trees
• Possible increase in forest fires
Wind Increased number of deep depressions increasing risk of wind damage, particularly in England
Cloud cover Increased potential productivity
Increased diurnal temperature range in autumn increasing risk of frost damage
5.2.4 Lowland meadow This UK BAP habitat is known to be vulnerable to reduced inundation frequency and duration and therefore may benefit from a reversal of this trend under some climate change scenarios; i.e. new habitat may be created. Conversely, if lowland meadows are flooded too often or for long

Achieving more: operational flood storage areas and biodiversity. 61 Final report - October 2009
periods of time many flora and fauna species may be adversely affected due to the change in habitat. Some lowland meadow species, such as Alopecurus pratensis have been modelled under different climate change scenarios to gain little or no extra habitat space in the UK and northern Europe(38). The JNCC also note that the higher frequency of warm springs in the past decade, which may also be a feature of future climate change, will favour grass dominance through encouraging an early burst of nitrogen mineralization(39). This may be at the expense of non-grass plant species and communities. Grassland communities generally may also be affected by climate change impacts on soil biodiversity, as the soil food web is critical for key herbivores and plant allocation of nutrients(40).
5.2.5 Reedbed On a UK scale, Defra have modelled the impacts of climate change on ‘agro-ecosystems’ for the UK in different time periods up to 2080(41). This found that the overall climate suitability for Phragmites australis, will remain virtually unchanged. However, for coastal areas of eastern England, where most of the important UK Biodiversity Action Plan (UKBAP) reedbed habitats are found, reedbeds are vulnerable to sea level rise; this is predicted to lead to the loss of significant areas of habitat(42) due to salinity changes. Any erosion of banks in habitat borders may also increase siltation and turbidity, which in turn may affect the ability of some fauna species to survive. Reedbeds in areas vulnerable to drought may also be vulnerable to habitat deterioration if water table levels were to change significantly. Wet reedbed habitats may change to dry reedbed habitats due to climate change, therefore impacting on the bird species dependent on the habitat; for example, warblers may become more vulnerable to predation under this type of habitat change. Flooding events and rising water temperatures have also been shown to increase the significance of the reed pathogen Pythium phragmitis as a contributing factor in the decline of Phragmites australis in continental Europe(42). Pathogens such as this could potentially be a problem for P. australis in the UK, for example by eutrophication-linked population increases(43).
5.2.6 Generic mitigation/adaptation measures
The above findings suggest that impacts of climate change on biodiversity habitats may be significant. However, there are a number of actions, both within FSAs and in the wider environment that can be taken to mitigate these impacts:
Reduce habitat fragmentation by, for example, developing more wetlands and woodlands, and enlarging existing ones.
Identify new areas for habitat creation for all four of these UK BAP habitats.

Achieving more: operational flood storage areas and biodiversity. 62 Final report - October 2009
Co-operate across administrative boundaries and national borders to improve ecological networks by combining nature conservation and flood management objectives.
Develop climate-proof networks at the regional scale for sensitive species by creating conditions for dispersal including reducing barriers to dispersal.
Consider neighbouring land-use and seek agreement with landowners to conserve or enhance washland habitat types
Consider site-specific measures such as over-designing flood-storage capacity of washland so that the wetness of the area is maintained beyond the flood event period without compromising flood storage capacity when it is needed.
5.3 Projected changes in peak river flow
Guidance from the Defra FCDPAG3 report recommends the use of a sensitivity allowance of 20% increase on peak river flows for the period 2025 to 2115(44). It should be stressed that this value is a precautionary sensitivity allowance, not a best estimate of likely change. Research by CEH Wallingford that studied 10 UK catchments indicated that peak flows could increase or decrease in the future using different climate change model runs or downscaling techniques and for different time horizons (45). However, the range of change in peak flow was generally found to be below 20% in most cases. The new UKCP09 scenarios have not yet been used to review the 20% value for peak flow increase since this is derived through catchment modelling with projected rainfall increases and is a relatively complex process.
To estimate the impact of a 20% increase in peak flow on a flood storage area we can have prepared a straightforward example. Figure 1 illustrates a typical river hydrograph shape and the effect of increasing peak flow by 20%. If we assume peak flow in a given catchment for a given return period (e.g. 1 in 100 years) is 100m3/s and the flood hydrograph lasts for 32-hours, the additional volume of flood water will be approximately 900,000m3. Hence a flood storage area offering a 100-year standard of protection in current climate would need to be increased to accommodate additional flood water to continue to provide the same level of protection in the future. In reality, it is likely that only a proportion of the hydrograph will be required to be diverted in flood storage, either removing the first portion of the hydrograph or part of the peak flow.

Achieving more: operational flood storage areas and biodiversity. 63 Final report - October 2009
0
20
40
60
80
100
120
0 2 4 6 8 10 12 14 16 18 20 22 24 26 28 30 32
Time (hours)
Flow
(m3/
sec)
Flow m3/sFlow cc m3/s+20%
0
50000
100000
150000
200000
250000
300000
350000
400000
450000
500000
0 2 4 6 8 10 12 14 16 18 20 22 24 26 28 30 32
Time
Volu
me
(m3)
per
hou
r
Normal VolumeCC Volume
Figure 5.1 – illustration of volume increase resulting from peak flow increase of 20% in a typical river hydrograph

Achieving more: operational flood storage areas and biodiversity. 64 Final report - October 2009
5.4 Other impacts of changes in rainfall on flood storage operability Changes in rainfall through the year are predicted to result in wetter winters and drier summers across England(30). Depending on the probability level used in the UKCP09 scenarios, changes in winter rainfall across England are predicted to be between approximately 0 and 60% increase and changes in summer rainfall to be between 60 and 0% reduction. Wetter winters with more prolonged wet weather and heavier rainfall when rain does fall may give rise to other issues that could affect FSA operability, such as stability of earth banks used for retaining flood water and the draining of FSAs after river flows have subsided. If, through a wet winter, there is a succession of flood events that fill the FSA, the available volume for further floods may be reduced if the retained flood water cannot be released back into the watercourse.
Hence, both changes in magnitude of individual flood events and changes in seasonal rainfall patterns can impact on FSA levels of service and effectiveness in reducing flood flows downstream
Lastly, climate change projections in both UKCIP02 and the most recent UKCP09 information do quantify changes in the intense, localised rainfall arising from convection in the atmosphere. The general message that we should expect drier summers in the UK in the future may mask the potential for increases in localised flooding from summer thunderstorms and convective events which can cause major flood damage. This issue is most pertinent to any FSAs in either small, steep or heavily urbanised catchments (or a combination of these characteristics) where allowance may need to be made for accommodating such ‘summer’ downpour events.
5.5 Land use change and CFMPs The Environment Agency has developed a series of Catchment Flood Management Plans (CFMPs) which include an analysis of land use management within a range of future scenarios. In particular, CFMPs address land use change in the context of its potential impact on run-off characteristics.
Land use changes, whether through intensification or reduction in activity, may result from a number of factors. These could include the expansion of areas protected by environmental designations, the inability of soils to maintain levels of agriculture, or changes to agricultural policy. However, if land remains non-urban in nature, change is most likely to respond to market factors. Such changes tend to reflect short term, and not long term, market projections. For example a dry summer leading to poor milk production on one side of the globe can induce high milk demand and prices on the other, thus leading to maintenance or increase in land set down to pasture.

Achieving more: operational flood storage areas and biodiversity. 65 Final report - October 2009
The possible changes to land management set out below reflect what has been considered within the CFMP process in the context of what might happen if there were a continuation of existing trends in the UK, and are examined in terms of their relevance to the provision of sites for flood storage.
5.5.1 Agricultural Land Classification (ALC) The Agricultural Land Classification (ALC) categorises land according to potential for food production. Grade 1 is best quality and Grade 5 is poorest quality. A number of consistent criteria are used for assessment, which includes climate (temperature, rainfall, aspect, exposure, and frost risk), site (gradient, micro-relief, flood risk) and soil (depth, structure, texture, chemicals, stoniness). The poorer quality soils at high altitudes are traditionally extensively managed, unimproved grassland or heathland grazed primarily by sheep, with some cattle.
Grade 1 land is excellent quality land and is nationally very scarce, accounting for only 2.6 per cent of the country. Grade 2 land is good quality land and is much more widely distributed. Grade 3, i.e. good to moderate quality is divided into better, Grade 3a land and to somewhat worse, more restrictive Grade 3b land. In policy terms, the Government seeks to conserve, where possible the “best and more versatile” land, which comprises Grade 1, 2 and 3a. On heavier, wetter soils Grade 3 land is typically under cereals or grassland. Grade 4 is poor quality where often a cold wet climate is a significant limitation to agricultural use. Grade 5 land only covers 8.5% nationally.
5.5.2 Land management changes identified within the CFMP process Land management changes identified as relevant to the provision of FSAs within the development of CFMPs include:
An increase in ‘environmentally sensitive’ farming (i.e. an increase in landscape/environmental restoration), especially in upland areas. This may lead to a reduction in agricultural drainage. However the demand for productivity in areas of high agricultural value will remain. Availability of land on the floodplain suitable for use as a flood storage area may thus be constrained by the continuing demand for high value agricultural land. Intensive cropping practices are likely to have a higher rate surface run-off than areas under permanent pasture with a low stocking level. However, the adoption of best practice steps would help to decrease runoff and soil erosion.
Wider implementation of Environmental Stewardship Schemes (ESS).
While recent agricultural policies have encouraged farmers in the main to be high volume commodity producers, society now requires a range of outputs beyond primary food production, not least the quality of the
Achieving more: operational flood storage areas and biodiversity. 66 Final report - October 2009
rural environment, and environmental land management will be a key driver for future sustainable development. This driver may provide opportunities for flood storage areas, dependent on biodiversity benefits that would match ESS requirements.
Increased cover by woodland. This trend is driven both by the market
(for timber, pulp, bio-energy and woodland recreation) and by tax and other fiscal incentives. This change is likely to apply to the upper and middle parts of a catchment only and not to the best and most versatile land. This is likely to have only a small effect on land availability for FSAs.
The cost of transport will rise considerably over the next 100 years, due
to rising energy costs. In addition, there is likely to be an increased public desire for local produce. Therefore, there will be increased pressure to obtain more crops and greater efficiency from the catchments better land, rather than relying on imports. This will lead to reduced availability of land (i.e. higher purchase and/or agreement costs) for flood storage.
Some areas of England and Wales may have been identified for
minerals extraction. Working of sand, clay and gravel in river valleys can provide potential sites for flood storage. For example, areas of the Upper Severn in both Wales and England have been recommended as preferred areas for extraction and this has been highlighted in the Severn CFMP. Given the very large increase in urban development within some catchments, there is likely to be a related increase in demand for clay for bricks and sand and gravels for construction materials and aggregates. More land will thus be required for minerals extraction, and costs will dictate they should be close to the new markets. No estimate of that additional land bank requirement is available, but this may provide some opportunities (dependent on site specific considerations) for flood storage areas.
5.5.3 Sustainable flood management
Sustainable flood management, including approaches such as FSAs as well as Sustainable Urban Drainage Systems (SUDS) is considered explicitly within the CFMP context as a potential land use change. Within CFMPs it is generally noted that sustainable flood management practices, SUDS and farming practices that slow down run-off are promoted or encouraged by the Environment Agency where appropriate.
5.5.4 Land use and climate change There are considerable implications of climate change for land use. The UKCIP09 scenarios indicate that there are likely to be hotter summers but

Achieving more: operational flood storage areas and biodiversity. 67 Final report - October 2009
also milder winters. Farmers and land managers would need to respond to these changes. Some potential changes might include:
milder winters would provide an advantage because less protection from frost would be required, and there would be an opportunity, therefore, for a greater range of crops;
potential drought in summer would lead to an increased need for irrigation; greater need to protect crops and soil resources from intense spates of rain;
demand for pasture for stock and for milk cattle to be concentrated in cooler, wetter parts of catchments; and
the UK could even become a major food producer for countries where climate change will make agriculture less feasible.
There may thus be increased pressure for areas of Grades 1 and 2 agricultural land to respond to a rise in demand for horticultural needs. This will bring with it a change of crops. This will lead to increased demand for land, which may also have the potential for flood storage use. In addition, there may be a more significant change brought about by the likely rapid and sustained demand for viticulture. Champagne houses are buying up land in the south and southern midlands of the UK because they can anticipate climatic problems in Eastern France, but this is likely to be for steeper slopes and of less relevance to potential flood storage sites.
In the upland areas it is less clear to anticipate the impact of climate change on land use. The likelihood is that, other than for hobby farmers, there will be a reduced desire to farm such areas, given the fall in services, cost of transport etc. However, this is of less significance for potential flood storage area sites.

Achieving more: operational flood storage areas and biodiversity. 68 Final report - October 2009
6 Integrated design for flood storage and biodiversity
6.1 Review of requirements to achieve integration The purpose of this report is to successfully satisfy the situation depicted in Figure 6.1.
Figure 6.1: Flood Benefit versus Biodiversity An efficient FSA in engineering terms is simply one which efficiently removes peak watercourse flows, temporarily stores flood water (in an area which is generally relatively deep with a small footprint) and then which drains quickly and completely ready for service in the next big event (which may however in practice occur a number of years later). This behaviour poses a number of challenges to habitats, examples of which include that complete inundation can create long term damage through sediment deposition and high volume flows can have a serious negative impact on various species of flora and fauna. Flood waters draining away quickly will then leave a relatively dry environment, which may recover over a long period or which may never fully recover. These challenges need to be overcome if biodiversity is to be increased and an approach to this is presented in this chapter.
All possible opportunities to deliver biodiversity benefit must be considered during the very early stages of scheme appraisal.
The first fundamental step is for the Environment Agency scheme Project Manager to secure an ecologist who can advise on the biodiversity objectives and potential of the site. The ecologist will carry out an expert judgment. This will enable the identification of potential habitat types,
FLOOD BENEFIT
ONLY
BIODIVERSITYBENEFIT
ONLY
Low quality habitat Good flood storage
High quality habitat Poor flood storage
WIN-WIN

Achieving more: operational flood storage areas and biodiversity. 69 Final report - October 2009
suitable land use and management solutions and must be carried out and applied right at the very beginning of the process. The ecologist will work with the project team to establish detailed operational requirements for the different potential habitat options, supporting the initial development of the overall scheme objectives. It is at this stage that it can be established whether or not there is in fact potential for any biodiversity improvement.
6.2 Biodiversity-potential decision key In order to capture all biodiversity potential available in new or existing FSAs, the decision key in Table 6.1 has been developed for use by the design team. The five stages need not be addressed in any particular order and should be viewed as an iterate process. Successful outcomes that integrate and maximise the potential for both flood risk management and biodiversity will require cross-reference and continued liaison between ecologist and design engineer.

Achieving more: operational flood storage areas and biodiversity. 70 Final report - October 2009
Table 6.1. Biodiversity-potential decision key
Existing Scheme New Scheme Type of FSA and key design considerations
Consider • Designed standard of protection. • Flood characteristics (known or
estimated): flood frequency, timing, duration, water depth, water quality.
• Any additional areas available to incorporate into scheme?
Consider • Required standard of protection • Area available (for flood storage and
biodiversity, together or separate)
Assess Biodiversity Resource
DECISION: Enhance existing quality of biodiversity features or target higher value biodiversity features?
DECISION: Can the FSA scheme incorporate or complement existing high value habitats within the proposed habitat or in the surrounding landscape?
DECISION. Are there opportunities for the FSA scheme to contribute to local and national BAP targets?
Target water regime
DECISION: What is the target water regime? Set key water regime parameters for target biodiversity. For wetland habitats refer to appropriate tables (consider whether there is potential to change flood frequency or between flood conditions). For other habitats consider dependent key flooding characteristics such as flooding duration
Opportunities to reduce impacts of flooding.
DECISION: Is there potential to retro-fit elements to the design e.g. sediment traps, gradients or additional land incorporated into scheme?
DECISION: Is there potential to change operation e.g. increase flood frequency or increase drawdown rate?
Design to optimise operation and design elements to maximise biodiversity and flood risk management potential.
Opportunities to increase resilience.
DECISION: Is there potential to enhance management between floods and/or connectivity with wider landscape?
Design to optimise opportunities to increase resilience.
6.3 Example integrated design scenarios The way in which the biodiversity potential is included in the Overview Design Guide is presented in Appendix B. The overall design process is summarised in the flowchart below (Figure 6.2).

Achieving more: operational flood storage areas and biodiversity. 71 Final report - October 2009
Determine the max available pass forwardflow and volume of water to be stored.
Can this be accommodated?
Assess the FSA inlet
Determine the max allowable pass forward flow.Can this be achieved through the use of a culvert
or is a flow control device needed?
Flood Hydrograph /Design Hydrograph
Determine if long durationevent
Determine if short duration andflashy watercourse
Topography suitable forimpounding FSA
Non-impounding FSAImpounding FSA
Size culvert and flow control device
Determine the volume to be stored
Determine the approximatecost of structure.
Is it cost effective storage?
Consider the floodextent of the FSA
Consider the size &footprint of the dam
Consider access & public safety
Consider the spillwayarrangement & protection
Detailed Design• Hydraulics• Geotechnics• Environmental• Structures• Etc
Stop
Size culvertInlet channel Inlet weirInlet culvert
Open structureGated / penstocked Erosion protection
Inlet velocities(consider public safety)
Outletdesign
Considerthe
flood extent
Consider thesize & footprint
of the dam
Consider access
& public safety
Consider the spillway
arrangement& protection
Stop Detailed design• Hydraulics• Geotechnics• Environmental• Structures• Etc
Determine the approximatecost of structure.
Is it cost effective flood storage?
YES NO
Determine the max volume ofwater to be stored.
Can this be accommodated?StopNO
YESYES
NOYES
NOYES
NOStop
Determine the max volume ofwater to be stored.
Can this be accommodated?
Appoint Ecologist Appoint Ecologist
ConsiderBiodiversity
potential
Consider biodiversitypotential
Figure 6.2. FSA design flowchart

Achieving more: operational flood storage areas and biodiversity. 72 Final report - October 2009
Several examples of how biodiversity might be integrated into the designs for existing and new FSAs are provided below in Figures 6.3(a) and (b).
Figure 6.3(a). Existing impounded FSAs

Achieving more: operational flood storage areas and biodiversity. 73 Final report - October 2009
Figure 6.3(b). New non-impounded fluvial FSAs

Achieving more: operational flood storage areas and biodiversity. 74 Final report - October 2009
7 Recommendations for developing workable solutions
7.1 Context The Pitt Review of the summer flooding 2007 (recommendation 27, Pitt, June 2008) sets out the need for the Environment Agency and Natural England to work together to achieve greater working with natural processes. In order to accomplish this aim, greater use of appropriate solutions must be considered during the very early stages of scheme development.
This section addresses the steps within scheme development during which real opportunities can exist to identify, assess and pursue solutions which can deliver biodiversity benefits. A key to this approach is to understand how appropriate measures can be selected and funded. Apart from pure Environment Agency-funded scheme delivery, there are a number of delivery mechanisms, often targeted at land managers, which have the potential to deliver flood-risk management benefits. These can be grouped into:
Delivery mechanisms designed to have large-scale uptake and so influence the management of very large areas of land, but likely to deliver flood-risk management as an incidental benefit of biodiversity improvements, adopting good practice for management of soil or avoidance of diffuse pollution.
Targeted delivery mechanisms with different objectives and
management options. Some of these are deployed in such a way as to be effective at catchment or sub-catchment level; others are directed at single landholdings. Some of the management options could deliver significant flood-risk management benefits; others are solely targeted at biodiversity objectives. None of the delivery mechanisms has the ideal combination to address flood-risk other than as a secondary consequence.
Other mainstream funding mechanisms, including access to European
funding, Lottery funding routes, and other funding bodies, where finance is generally available for a specific project or programme through which the wider objectives of the funding body can be delivered.

Achieving more: operational flood storage areas and biodiversity. 75 Final report - October 2009
7.2 Mainstream delivery mechanisms In the last 15 years or so, numerous projects have been successfully completed, which have been delivered via delivery/funding mechanisms other than pure Environment Agency-funded routes.
The Natural England 2007 Guidelines for the restoration of physical and geomorphological favourable condition on river SSSIs in England describes the main delivery mechanisms in England and Wales, and these are summarised below in Table 7.1.
Table 7.1- Mainstream delivery mechanisms Delivery mechanism Organisation responsible Relevance to FSAs
FRM capital programmes Environment Agency FRM maintenance Environment Agency
Environmental Stewardship Entry Level Stewardship (ELS) and Higher Level Stewardship (HLS)
Natural England
Focus is likely to be on riparian features (e.g. wetland habitats) rather than the river itself. But, may be able to contribute to bank-side capital works for elements such as fencing, tree planting and creation of strips.
Local flood risk solutions Local authorities, RDAs, Development Corporations
A potential funding and delivery route for locally focussed flood risk management solutions
Local initiatives and interest groups
Various interest groups, e.g. fishery associations, clubs, individual landowners, wildlife trusts, Wild Trout Trust, rivers trusts
May be prepared to contribute to a scheme where their objectives can also be delivered
LIFE+ INTEREG
European funding
Structural funds
Likely to be scheme specific for flagship demonstration projects (e.g. Alkborough)
Heritage Lottery Fund
Contributed to Alkborough scheme National Lottery funding
Big Lottery Fund
Direct Defra funding For demonstration projects

Achieving more: operational flood storage areas and biodiversity. 76 Final report - October 2009
7.3 Other possible delivery and funding mechanisms In addition to those identified in the table, there are a number of schemes, programmes and initiatives, targeted at land managers, which are managed by Government Agencies and others in England and Wales. These schemes aim to encourage sustainable management of the environment. Different schemes will have a different focus, but all are to some extent concerned with management of biodiversity and resources (soil, water, air).
Ad-hoc local Environment Agency funding (‘local levy’ funding) Private sector contributions, including Section 106 funding (Town
and Country Planning Act 1990) Income generation schemes, e.g. angling passport schemes Defra Flood Management Division: two main schemes – Innovation Fund (from ‘Making Space for Water’) - funds new
approaches to FRM Demonstration Fund (from recommendation 27 of the Pitt Review) -
provides funding for FRM schemes that work with natural processes
Defra WFD funding (recently announced – 29 June 2009): “£10 million for river improvements and green jobs”6. £1.75 million will be channelled through the Association of Rivers Trusts.
7.4 Scheme development
Pivotal to any options appraisal process during scheme development, should be the consideration of biodiversity benefit, underpinned also by reference to the principle of working with natural processes. To achieve the overall goal of sustainable flood-risk management, as well as the specific aims of increased use of FSAs with delivery of biodiversity benefit, it is fundamentally important that opportunities are identified at the earliest possible stage in the process.
If published as they are currently presented, the Environment Agency’s new working draft Appraisal Guidance (FCERM-AG, February 2009) offers some potential for identification of opportunities for ecological enhancement, restoration or habitat creation early on in the decision-making process. For example, if projects are not covered by an existing strategy, but there are potential implications or opportunities for the natural environment (for example, potential for habitat creation, Habitats Directive implications), then projects may fall within the ‘Complex Change (Strategy) Project’ appraisal level. Within this level, a number of key questions are asked during the decision flow-chart (which could provide the trigger for ensuring that opportunities are identified for integrated schemes). These key questions
6 see http://www.defra.gov.uk/news/2009/090629a.htm for news release

Achieving more: operational flood storage areas and biodiversity. 77 Final report - October 2009
relate to interconnected benefits, and smaller-scale problems that could be addressed via an integrated solution and effects over a large area.
All possible opportunities to deliver biodiversity benefit must be considered during the very early stages of scheme appraisal. Recommendations on how this could be applied to the scheme appraisal process are demonstrated in the flow-diagram in Figure 7.1. This flow-chart can be equally applied to a new FSA scheme, or to an improvement scheme for an existing flood storage asset.
The biodiversity-potential decision key (Table 6.1) has been developed to capture all biodiversity potential available in new or existing FSAs. The five stages need to be addressed within the scheme development and appraisal process, as shown in Figure 7.1. Successful outcomes that integrate and maximise the potential for both flood risk management and biodiversity will require cross-reference and continued liaison between ecologist and design engineer.
Following these five stages, it can then be established if it is possible for all potential biodiversity improvements to be delivered wholly through a stand-alone Environment Agency funded scheme. If so, the scheme can then be progressed without the need to establish partnership or seek additional funding mechanisms.
If not all potential biodiversity benefits can be delivered by the Environment Agency alone, it will be necessary to identify potential partners, and to work towards the establishment of a Partnership arrangement to support scheme development and delivery. Once partners have been successfully brought on board, potential delivery mechanisms and funding streams can be identified and considered, whether through Environmental Stewardship, Environment Agency local levy, land development or any other driver, as discussed in sections 6.2 and 6.3.
In some cases it may not be possible to successfully engage partners, or to secure additional funding, as a result the scheme may be limited to delivering only the biodiversity benefits achievable through Environment Agency funding alone.
This approach should be applied to compare and effectively ‘test’ the potential of alternative approaches during options development. To be effective and maximise benefits from a scheme, it is recommended that a number of specific actions are undertaken to increase the chances of successful scheme delivery and implementation on the ground. These include detailed examination and inclusion of the following elements to secure:
Additional funding

Achieving more: operational flood storage areas and biodiversity. 78 Final report - October 2009
A Partnership agreement Meaningful stakeholder engagement Support, by rigorous project management, of the biodiversity elements,
which should be fully integrated within the main scheme.
Essential to successful long-term scheme operation is the need to evaluate and monitor the establishment and condition of the habitats within the site. This is particularly important to provide evidence to contribute to the achievement of BAP targets, and to demonstrate performance against outcome measures.

Achieving more: operational flood storage areas and biodiversity. 79 Final report - October 2009
Report on habitat targets: UK BAP gain
PSA 3 Outcome Measure 4 Outcome Measure 5
Scheme Appraisal Process Stage 1
Define the problem and possible solutions
Stage 2 Set detailed scheme
objectives
Establish Partnership (if required)
Stage 3 Develop options
Appraisal
Identify additional funding (if required)
Stage 4 Compare options
Identify preferred option
Stage 5 Evaluate & monitor
Biodiversity benefits identification Apply Biodiversity decision key process
Identify potential habitat type(s) Identify potential for biodiversity benefit
Scheme cannot deliver any biodiversity
benefit
NO
NO
Identify detailed operational requirements for habitat options
Potential partnership scheme
Requires following objectives • Partnership agreement(s) • Additional funding
Objectives cannot be
met
Objectives can be set
Pre-feasibility assessment - does scheme have potential to deliver biodiversity
benefit?
Can EA deliver all biodiversity benefits
unaided?
YES
YES
Partnership scheme not
feasible - but may deliver
limited biodiversity
benefit
Figure 7.1 - Application of biodiversity benefits identification within scheme appraisal

Achieving more: operational flood storage areas and biodiversity. 80 Final report - October 2009
7.5 Risks and future implementation Risks are associated with the failure to consider biodiversity elements or options for a scheme at a sufficiently early stage, or at all, in initial scheme development. As a result, partnership opportunities may not be identified and pursued early enough, or are not addressed at all, as a scheme is developed. Opportunities for access to additional, supporting funding are thus not identified and harnessed.
It is noted that the Appraisal Guidance is understood to be operated as a ‘live’ document, and therefore opportunities currently exist to influence its development to support delivery of Pitt Recommendation 27.
It is important that detailed supporting guidance is also produced to accompany the new Appraisal Guidance. This is necessary to ensure that practitioners are fully informed of the types of approaches that are available when considering scheme options, with a particular focus on those that fit with the principles of delivering biodiversity benefits. It should also contain an emphasis on the importance of post-project appraisal to learn from schemes and identify which approaches work and which do not, thereby informing decisions for the future.

Achieving more: operational flood storage areas and biodiversity. 81 Final report - October 2009
8 Next steps and recommendations
This study has shown that several UK BAP wetland and floodplain habitats are resilient to long durations of flooding and therefore FSAs clearly offer important opportunities to support habitats of greater than ‘lower value’ and to contribute towards UK BAP targets. The study has shown that even infrequent, short duration flooding on soils with slow drainage can support UK BAP wetland habitats, if between flood management is suitable.
Key findings from the study are:
Characteristics of the flood event, (flood frequency, timing, duration, depth, water quality, temperature and between flood habitat management) all contribute to determining whether a habitat will be tolerant and resilient to flood storage and must be considered when selecting the target habitats and biodiversity features for a site.
Habitats that display greater biodiversity value tend to be more sensitive to the precise characteristics of flood events and between flood conditions therefore they require more careful control of the in-flood and out of flood water regime in order to persist within FSAs.
Careful FSA design can increase resilience of habitats and species to impacts of flood storage by reducing the negative impacts of flooding and by increasing the inherent resilience of habitat present
Details of the tolerance of target UK BAP habitat types under varying soil drainage, flood duration, seasonal and flood frequency conditions have been identified, allowing suitable targets to be selected and the water regime during and between flood storage events to be designed as appropriate.
Modifications to designs to reduce potentially negative impacts of flooding characteristics, such as water quality, stagnation and water depth, on biodiversity, should be considered.
Methods to increase the inherent resilience of habitats and species populations to flood storage for consideration include:
• addressing connectivity between the flood management asset and adjacent habitats

Achieving more: operational flood storage areas and biodiversity. 82 Final report - October 2009
• Site-specific measures should be considered such as over-designing flood-storage capacity of washland so that the wetness of the area is maintained beyond the flood event period without compromising flood storage capacity when it is needed
• Assessment of neighbouring land-use and the potential to seek agreement with landowners to conserve or enhance washland habitat types
Reappraisal of design considerations must also ensure sustainability into the future.
Biodiversity opportunities must be identified at the earliest possible scheme development stage
It is recommended that the decision process illustrated in Figure 7.1 should be followed as a formal part of scheme development
The establishment and condition of the habitats within the site must be evaluated and monitored, to provide evidence to contribute to the achievement of BAP targets, and to demonstrate performance against outcome measures.
Achieving more: operational flood storage areas and biodiversity. 83 Final report - October 2009
References
Note: the references below are those referred to in the main report text. Other references are provided at the end of the relevant Appendices.
1 Rouquette, J.R., Posthumus, H., Gowing, D.J.G., Tucker, G., Dawson, Q.L, Hess, T.M. and Morris, J. (2009) Valuing nature-conservation interests on agricultural floodplains. Journal of Applied Ecology, 46: 289–296. 2 Morris, J., Hess, T.M., Gowing, D.J. Leeds-Harrison, P.B., Bannister, N., Wade, M. and Vivash R.M. (2004) Integrated washland management for flood defence and biodiversity. English Nature Research Report, 598. 3 Hardtle, W., Redecker, B., Assmann, T. and Meyer. H, (2006) Vegetation responses to environmental conditions in floodplain grasslands: Prerequisites for preserving plant species diversity. Basic and Applied Ecology, 7: 280-288. 4 Toogood, S. and Joyce, C. (2009) Effects of raised water levels on wet grassland plant communities. Applied Vegetation Science, 12: 283–294. 5 Toogood, S., Joyce, C. and Waite, S. (2008) Response of floodplain grassland plant communities to water regimes. Plant Ecology, 197 (2): 285-295. 6 Silvertown, J., Dodd, M.E., Gowing, D.J.G. and Mountford, J.O. (1999) Hydrologically defined niches reveal a basis for species richness in plant communities. Nature 400: 62-63 7 Gowing, D.J.G., Lawson, C.S, Barber, K.R. and Youngs, E.G. (2005) Response of grassland plant communities to altered hydrological management. Final report to DEFRA, Project BD1321 (Conservation Management Division), London. 8 Beltman, B., Willems, J.H. and Gusewell, S. (2007) Flood events overrule fertiliser effects on biomass production and species richness in riverine grasslands. Journal of Vegetation Science 18 (5): 625-634. 9 Sera, B. and Cudlin, P. (2001) Flood impact on vegetation communities. International Journal for Ecological Problems of the Biosphere. 20(1): 38-46. 10 Bekker, R.M., Oomes, M.J.M. and Bakker, J.P. (1998) The impact of groundwater level on soil seed bank survival. Seed Science Research, 8:399-404. 11 Plum, N. and Fliser, J. (2005) Floods and drought: Response of earthworms and potworms (Oligochaeta: Lumbricidae, Enchytraeidae)to hydrological extremes in wet grassland. Pedobiologia 49: 443-453. 12 Ausden, M. and Hirons, G.J.M. (2002) Grassland nature reserves for breeding wading

Achieving more: operational flood storage areas and biodiversity. 84 Final report - October 2009
birds in England and the implications for the ESA agri-environmental scheme. Biological Conservation 106: 279-291. 13 Vervuren, P.J.A., Blom, C.W.P.M. and de Kroon, H. (2003) Extreme flooding events on the Rhine and the survival and distribution of riparian plant species. Journal of Ecology 91: 135-146. 14 Violle, C., and Cudennec, C. (2005) Indirect assessment of flooding duration as a driving factor of plant diversity in wet grasslands. Symposium on Predictions in Ungauged Basins, Foz do Iguaco, Brazil. 15 van Eck, W.H.J.M., van de Steeg, H.M., Blom, C.W.P.M. and de Kroon, H. (2004) Is tolerance to summer flooding correlated with distribution patterns in river floodplains? A comparative study of 20 terrestrial grassland species. Oikos 107: 393-405. 16 Baptiste, M.J., Haasnoot, M., Cornelissen, P., Icke, J., van der Wedden, G., de Vriend, H.J. and Gugić, G. (2006) Flood detention, nature development and water quality along the lowland river Sava, Croatia. Hydrobiologia 565: 243–257. 17 Coops, H. and van der Velde, G. (1995) Seed dispersal, germination and seedling growth of six helophyte species in relation to water-level zonation. Freshwater Biology 34 (1): 13-20. 18 Vervuren, P.J.A., Blom, C.W.P.M. & de Kroon, H. (2003) Extreme flooding events on the Rhine and the survival and distribution of riparian plant species. Journal of Ecology 91: 135-146. 19 Blom, C.W.P.M., Voesenek, L.A.C.J., Banga, M., Engelaar, W.M.H.G., Rijnders, J.H.G.M., van de Steeg, H.M. and Visser, E.J.W. (1994) Physiological Ecology of Riverside Species: Adaptive Responses of Plants to Submeregnce. Annals of Botany 74: 253-263. 20 van Oorschot, M., Hayes, C. and van Strien, I. (1998) The influence of soil desiccation on plant production, nutrient uptake and plant nutrient availability in two French floodplain grasslands. Regulated Rivers: Research & Management 14(4): 313-327. 21 Janssens, F., Peters, A., Tallowin, J.R.B., Bakker, J.P., Bekker, R.M., Fillat, F. and Oomes, M.J.M. (1998) Relationship between soil chemical factors and grassland diversity. Plant Soil 202: 69-78. 22 Lindenschmidt, K., Pech, I. and Baborowski, M. (2009) Environmental risk of dissolved oxygen depletion of diverted flood waters in river polder systems – A quasi-2D flood modelling approach. Science of the Total Environment 407: 1598-1612. 23 Gerard, M., El Kahloun, M., Rymen, J., Beauchard, O. and Meire, P. (2008) Importance of mowing and flood frequency in promoting species richness in restored floodplains. Journal of Applied Ecology 45: 1780-1789. 24 Bakker, J.P. & Olff, H. (1995) Nutrient dynamics during restoration of fen meadows by haymaking without fertiliser application. In: Wheeler, B.D., Shaw, S.C., Foyt, W.J. and

Achieving more: operational flood storage areas and biodiversity. 85 Final report - October 2009
Robertson, R.A. (Eds.) Restoration of temperate wetlands. Wiley, Chichester, UK ,143–166. 25 Donnison, L.M., Griffith, G.S., Hedger, J., Hobbs, P.J. and Bardgett, R.D. (1999) Management influences on soil microbial and fungal communities of botanically diverse hay-meadows in northern England and Wales. Soil Biology and Biochemistry 32: 253-263. 26 Antheunisse, A.M., Loeb, R., Lamers, L.P.M. and Verhoeven, J.T.A. (2006) Regional differences in nutrient limitation in floodplains of selected European rivers: implications for rehabilitation of characteristic floodplain vegetation. River Research and Applications 22(9): 1039-1055. 27 Bissels, S., Hölzel, N., Donath, T.W. and Otte, A. (2004) Evaluation of restoration success in alluvial grasslands under contrasting flooding regimes. Biological Conservation 118:641–650. 28 Posthumus, H., Morris, J., Hess, T.M., Neville, D., Phillips, E. and Baylis, A. (2009) Impacts of the summer 2007 floods on agriculture in England. Journal of Flood Risk Management. 2009:1-8. 29 Penning-Rowsell, E., Johnson, C., Tunstall, S., Tapsell, S., Morris, J., Chatterton, J. and Green, C. (2005) The benefits of flood and coastal risk management. A handbook of assessment techniques. Flood Hazard Research Centre, Middlesex. 30 UKCIP09, Jenkins et al, 2009 31 English Nature, (2004) Coastal squeeze, saltmarsh loss and special protection areas. In Environment Agency (ed) Specialist term consultancy: geomorphology. Environment Agency, Peterborough. P82. In Richards et al (2008). 32 Nicholls and Wilson (2001) Integrated impacts on coastal areas and river flooding. In: Holman, I.P. and Lovel, P.J. (eds) Regional climate change impacts and response studies in East Anglia and NorthWest England (RegIS). MAFF Project no. CC0337. MAFF, London, 54–103. 33 Halcrow (Dale, M.) (2009) Climate change impacts related to flood flows. Technical Note. 34 Richards J.A., Mokrech, M., Berry, P.M. Nicholls, R.J. (2008) Regional assessment of climate change impacts on coastal and fluvial ecosystems and the scope for adaptation. Climatic change, 90: 141-167. 35 Pearl, H.W. and Huisman, J. (2008). Blooms like it hot. Science, 320 (5872): 57-58. 36 Broadmeadow, M., Ray, D., Sing, L. and Poulsom, E. (2003). Climate change and British woodland: what does the future hold? Forest Research Annual Report and Accounts 2002-2003. HMSO, Edinburgh, 70-83. 37 Forestry Commission (2005) Climate change and British woodland. Information note: pg 6.

Achieving more: operational flood storage areas and biodiversity. 86 Final report - October 2009
38 Harrison, P.A., Berry, P.M., Butt, N. and New, M. (2006) Modelling climate change impacts on species’ distributions at the European scale: implications for conservation policy. Environmental Science and Policy, 9: 116-128. 39 JNCC. 2007. Conservation status assessment for: H6510: Lowland hay meadows (Alopecurus pratensis, Sanguisorba officinalis). Second Report by the UK under Article 17 on the implementation of the Habitats Directive from January 2001 to December 2006 40 Wall, D. 2005. Climate change impacts on soil biodiversity in a grassland ecosystem. Case study in Lovejoy and Hannah (eds) Climate change and biodiversity. Yale University Press, London. 41 Defra (2004) ACCELERATES: Climate Change Impacts and Responses on the United Kingdom (EU project). 42 UKBAP (2009) Habitat Action Plan: Reedbeds. 43 Konstanz, ALLEMAGNE (12/2005) (2008) Ecological Effects of Water-Level Fluctuations in Lakes. Workshop, 613 (186 p.) [Document : 7 p.] (3/4 p.), 109-115. 44 Defra (2006) Table 2, Flood and Coastal Defence Appraisal Guidance FCDPAG3 Economic Appraisal, Supplementary Note to Operating Authorities – Climate Change Impacts, October 2006. 45 Defra (2005) R&D Technical Report W5-032/TR, Reynard et al, April 2005.

Achieving more: Operational flood storage areas and biodiversity. i Final report (Appendices) - October 2009
Appendix A: FSA Data Collection and Analysis
1 Existing FSA Data The first stage in this project was to define and extract the locations of all FSAs. It was agreed during the steering group inception meeting (19 June 2009) that the scope of the project would cover England only.
The main Geographical Information System (GIS) data source was extracted from the National Flood & Coastal Defence Database (NFCDD). The NFCDD is the database used by the Environment Agency to store details of all their assets. This database was searched for assets recorded as FSA. This GIS shapefile details the location of the FSA, together with numerous data fields containing information such as asset type, reference, maintainer, and general description. Whilst this data set provides some useful information, it is inconsistent in the amount of information it provides for certain sites.
Another major source of data has been the Environment Agency’s Reservoirs Database. As enforcement Authority for the Reservoirs Act 1975 in England and Wales the Environment Agency are required to maintain a database of up to date information on all the raised reservoirs. Data extracted from this database has been combined with the NFCDD data set and used together to form the dataset upon which this report is based. For National security reasons some of the data obtained from the Environment Agency’s Reservoirs database is considered very sensitive so whilst it has been used in the analysis behind the report it is not possible to include it in the interactive outputs.
2 Summary spreadsheet Halcrow have combined the NFCDD data with the Environment Agency Reservoir Database data, where possible, and produced a summary spreadsheet which includes all the available details that can be provided. From these data the pertinent details have been extracted and are presented in a GIS layer. The pertinent details comprise;
Reservoir Name Asset No National Grid Reference Category (impounding, non-impounding) Year Built Dam Type Maximum dam height Capacity of Reservoir Surface area of reservoir Undertaker type

Achieving more: Operational flood storage areas and biodiversity. ii Final report (Appendices) - October 2009
The data has indicated that there are between 800 and 1,000 FSAs in England.
3 Data Set Shortcomings Looking at the dataset with particular reference to this project, the available data does not provide any information on the standard of protection provided by the FSAs to communities nor on the likely frequency of operation of the FSAs ie wetting/ drying cycles. Some indication of the size of the storage area can be gleaned from the maximum volume of the storage area and the surface area of the reservoir ie whether the reservoir has a large shallow footprint or whether it is small in area with a significant depth of water.

Achieving more: Operational flood storage areas and biodiversity. iii Final report (Appendices) - October 2009
Appendix B: Overview design guide for FSAs
1 General
The choice of type of FSA is dependent upon a number of items:
Is the river flashy i.e. do river levels rise to a high level and quickly Does the river level rise slowly before reaching peak flows Do the existing ground elevations allow for an impounding reservoir Is their sufficient space to create a non-impounding FSA For a non-impounding FSA how will the water be taken from the
watercourse For a non-impounding reservoir, what form will the outlet take
This overview design guide typically describes the process that would be followed in the design of a fluvial FSA. This guide has been updated to reflect the findings of this report with regard to increasing biodiversity in FSAs. 2 Introduction
Flood Storage Areas (FSA’s) are generally located upstream of communities and work by attenuating water from the river, during periods of high river flow, such that the downstream flows are reduced. The reduced downstream flow can then be contained by river training structures such as walls and embankments to provide an increased standard of flood protection to the community whilst not being too visually intrusive.
This overview design guide discusses the main elements of FSA design and identifies the main technical references that are applicable to the design. A spreadsheet is included as Disc 2 to help guide the user through the initial design process.
This guide only considers FSA’s retained by embankment dams. It is possible that a concrete dam or structure could be used to create a FSA but to date these account for less than 2% of the current FSA’s.
The first fundamental step is for the Environment Agency scheme Project Manager is to secure a wetland ecologist who can advise on the biodiversity objectives and potential of any FSA site. The ecologist will carry out an expert judgment, using the EIA approach outlined in Chapter 3 of this study. This will enable the identification of potential habitat types,

Achieving more: Operational flood storage areas and biodiversity. iv Final report (Appendices) - October 2009
suitable land use and management solutions and must be carried out and applied right at the very beginning of the design process.
3 Flood Storage Areas
Impounding FSA’s are located across water courses and restrict the flow along the water course thereby limiting the downstream flows. This restriction will often take the form of a dam with a culvert through it sized to limit the downstream flows to a predetermined amount.
Non-impounding FSA’s take the water away from the river and store it remotely before transferring it back to the water course once the peak flows have passed. Non-impounding FSA’s generally comprise an inlet structure from the river, a dam or retaining structure to hold the water and an outlet structure back to the river.
FSA’s are generally located upstream of communities and where their size is such that they retain more than 25,000m3 of water, above natural ground level, they tend to be Category A Reservoirs(1) under the Reservoirs Act 1975. As such there are design, monitoring and maintenance requirements that need to be considered during the optioneering, design and construction stages.
To enable the FSA’s to work efficiently they need to remain empty, or have sufficient residual capacity remaining such that flood waters can be stored thereby reducing the peak downstream flows. If the FSA is full prior to the peak river flows reaching them the storage area will simply pass the peak flows downstream with minimal attenuation.
4 Desk Study
Prior to deciding whether to include a FSA as part of the flood risk management option it is necessary to undertake a desk study review of the proposed site. The desk study review will provide information on the following;
(a) Site history and past land use. (b) Geology, nature of the underlying strata i.e. clay or gravel etc and
whether there are any springs in the area, whether there is likely to be any made ground or contaminated ground etc
(c) Existing site investigations (d) Geohazards i.e. coal seams, together with an indication as to when
they were mined, dissolution features etc

Achieving more: Operational flood storage areas and biodiversity. v Final report (Appendices) - October 2009
(e) Water abstraction points, is the site underlain by aquifers etc (f) Environmental classifications / constraints (Ancient Woodland,
AONBs, Country Parks, Green Belt data, Nature Reserves, wildlife habitats, National Scenic Areas, Historic Parks, Gardens and Landscapes, Ramsar Sites, SSSIs, Special Areas of Conservation and Special Protection Areas)
(g) Archaeological information (h) Presence of listed buildings and other such constraints (Planning
Constraints - Historic Battlefields, Listed Buildings, National Parks, Public Rights of Way, Scheduled Monuments and World Heritage Sites)
(i) Location of services eg gas, electric, telecom etc (j) Site specific issues that may impact on the design eg the area is
used as a recreational park or sports pitches (k) Topographical information (l) Landowner information (m) General access issues (n) Suitability of site for use as a FSA, will it have the desired effect on
downstream water levels
Having selected an appropriate site it is generally necessary to undertake some form of site investigation. It is highly recommended that a staged site investigation is undertaken. Such a staged approach will provide sufficient detail for the options appraisal and outline design stages whilst not committing the client to the cost of the full investigation required for detailed design. The recommended investigation at this stage should be targeted at;
(a) Confirming, using ground radar type systems, the presence of services such that diversions can be assessed and intrusive site investigation can be planned safely.
(b) Confirming, via intrusive ground investigation, that the ground conditions established by the desk study are accurate and through the results of laboratory testing, on samples gathered from site, allow outline design parameters to be determined. These works should be undertaken in accordance with Eurocode 7 (2).
(c) Confirming historic topographical information and supplementing it as necessary.
Following on from Section 2.4, if the project ecologist determines the site has potential for biodiversity improvement the ecologist will work with the project team to establish detailed operational requirements for the different potential habitat options, supporting the initial development of the overall

Achieving more: Operational flood storage areas and biodiversity. vi Final report (Appendices) - October 2009
scheme objectives. These will be developed in line with the biodiversity potential decision chart in Section 6.2, considering the integrated design scenarios of 6.4 and recommendations for developing workable solutions in Chapter 7.
5 Dam Design
Once the site selection has been confirmed the design of the dam can commence. If a staged approach to site investigation has been adopted then it will be necessary to obtain more site investigation data before commencing the detailed design stage.
The design of the dam is complex and covers a number of topic areas these are discussed below, however this list is not exhaustive and site conditions may require other aspects to be considered. Furthermore under the Reservoirs Act 1975, the design will need to be reviewed and approved by a Construction Engineer refer to section 6 for more details.
There are three main elements to the design of the dam; slope stability, seepage through and under the dam and settlement.
Slope Stability; the slope stability is governed by the strength of the founding layer and underlying strata together with the strength of the placed fill and the water level within the embankment. The stability of the dam needs to be assessed under the following five different cases/ scenarios and both upstream and downstream faces need to be assessed;
(a) End of construction utilising total stress soil parameters (b) Long term conditions utilising effective stress soil parameters (c) Flood conditions ie reservoir full utilising total stress and effective
stress soil parameters (d) Drawdown ie when the reservoir was full and has emptied quickly
utilising total stress parameters (e) Under seismic loading ie during an earthquake(3) if applicable
Computer software programmes are available to undertake the above analysis and it is suggested that the Morgenstern-Price method of analysis is used as it is a more rigorous analysis method. More information on slope stability analysis is available(5), giving an indication as to commonly adopted factors of safety for different design scenarios.
If the slope stability analysis identifies that there is an unacceptable risk of slope stability failure then it will be necessary to reduce the gradient of the proposed shoulders to the embankment, lower the ground water table or

Achieving more: Operational flood storage areas and biodiversity. vii Final report (Appendices) - October 2009
construct a berm which in most cases will improve the overall slope stability.
Particular care needs to be taken with the analysis of the slope stability as slope stability is one of the most common causes of failure of embankment dams in the UK.
Example slope stability analysis for downstream slope under flood conditions
Seepage; the seepage through the embankment is dependent on the nature of the material that has been used to construct the dam, type of dam i.e. homogeneous or zoned, the nature of the founding strata and the size of the dam ie the flow path length. It is usually assessed for:
(a) Worse case scenario: the FSA full and the culverts blocked i.e. a steady state condition.
(b) Flood scenario: considering transient analysis during a flood event to gain an appreciation as to how the wetting front (temporary ground water level) will pass through the dam. This would only generally be required should the steady state case be onerous.
Computer software programmes are available to undertake the above analysis. More information on seepage analysis is available(6,7).
If the seepage analysis indicates that there is an unacceptably high seepage rate through the dam it will be necessary to either modify or change the material from which the dam is constructed or possibly

Achieving more: Operational flood storage areas and biodiversity. viii Final report (Appendices) - October 2009
incorporate drainage within the structure to ensure that the seepage is managed. The drainage may take the form of chimney drains.
If the seepage analysis indicates that there is an unacceptably high seepage rate through the dams sub-strata then it may be necessary to incorporate drainage blankets under the dry side shoulder, pressure relief wells on the dry side or even provide a cut off. The drainage blanket works by reducing the seepage exit gradient thereby limiting the chances of piping failure. The pressure relief wells work by reducing the head of water on the underside of a thin clay layer over permeable sands and gravels thereby limiting the chances of heave failure. The cut off works by extending the flow path under the dam so the seepage rate is reduced.
Particular care needs to be taken with the seepage analysis as internal erosion is the most common form of failure for embankment dams in the UK.
Settlement; the settlement beneath the dam is controlled by the geological conditions that occur under the footprint of the dam. The impact of past land uses e.g. mining, past local environments and old river paths will all impact on the overall settlement. In cohesive soils settlement is made up of three components; firstly immediate settlement will occur during construction as a direct impact of the additional load being imposed on the ground. Consolidation settlement will occur as pore water pressures dissipate from the soil structure. Finally secondary consolidation will occur as the soil particles alter their structural position, usually only occurs in organic clays and peat. In granular soils the majority of the settlement will occur instantaneously.
Particular care is needed when assessing settlements. Differential settlement, particularly between structures and the embankment, can cause localised cracks to develop which can act as preferential flow paths for seepage and these can lead to internal erosion of the dam. In FSA’s care needs to be taken in the area around the outlets, where differential settlement can lead to voids forming between the outlet structures and the dam fill material.
Care is also needed when making allowances for future settlement on the dam crest and along the spillway. This is particularly important over the crest of the spillway as this needs to remain level. In the event of low spots appearing on the crest/ spillway they will need to be repaired as soon as possible as such low spots can lead to preferential flow paths with associated high flow velocities which can cause erosion of the dam and if left unchecked can lead to instability.

Achieving more: Operational flood storage areas and biodiversity. ix Final report (Appendices) - October 2009
Settlement can be calculated by hand or through the use of complex computer packages. More information on settlement calculations is available(8).
Construction Material; as part of the design of the dam it will also be necessary to identify local sources of material. The cost of the material from which the dam is constructed will be a significant proportion of the overall cost of the dam. If a local source is not available and the material needs to be imported it can significantly affect the viability of the business case. Investigation of the borrow material should be undertaken at both outline and detailed design site investigation stages.
When assessing whether a material is acceptable for dam construction some assessment of the likelihood of the material being prone to desiccation cracking should be made. These desiccation cracks can form both horizontally and vertically creating a blocky zone in the upper surface. This is a weakness as the blocks may be lifted by water pressures when the embankment is in full flood or overtopping(9).
6 Ancillary Structure Design
The main ancillary structures associated with FSA’s are inlet structure, outlet structure, spillway and flow control mechanism. The secondary ancillary structures associated with FSA can comprise trash screens, emergency draw off, fish passes and provision for access etc. These lists are not exhaustive and further information on typical ancillary structures is available(10,11).
The design of the ancillary structures and the design of the dam tends to be an iterative process with one impacting on the design of the other. To enable the design to be undertaken as efficiently as possible it is essential to have an early concept review with the Undertaker (defined in the Reservoirs Act 1965 as the owner or persons responsible for using the reservoir for that purpose), the land owner and other stake holders so that the constraints and expectations are fully understood from the outset.
Inlet structure; the inlet structure will generally take the form of an inlet weir or an inlet culvert. In some circumstances it may be appropriate to gate the inlet culvert.
When an inlet weir is considered it is necessary to set the length and the level of the weir such that it will remove the required volume of water at the appropriate time during the flood hydrograph so that the downstream flood protection benefits can be realised. The hydraulic model will need to

Achieving more: Operational flood storage areas and biodiversity. x Final report (Appendices) - October 2009
be used to determine the appropriate length, the appropriate level and the velocity of the flow over the spillway. Care needs to be taken to ensure that there are no physical restrictions on site that will impact on the construction of the weir. Consideration also needs to be given to future access arrangements for maintenance.
The velocity of flow over the weir will need to be assessed to see whether it is necessary to provide erosion protection to the surface to prevent it being washed out. This erosion protection can take the form of good grass cover, reinforced grass cover or concrete cellular blocks. Further guidance on the need and type of erosion protection is available(12).
When an inlet culvert is considered it is necessary to size the culvert such that it will remove the required volume of water at the appropriate time during the flood hydrograph to realise the downstream flood protection benefits. The level and size of the culvert are critical elements when determining how much water can be taken from the water course. Another critical element is the operating philosophy of any gates that are installed at the upstream end of the culvert ie the gate will start to open when the river level reaches a predefined level and as such control the flows. The hydraulic model will need to be used to determine the required size, level and operating philosophy for the culvert.
The design of the culvert itself should be in accordance with guidance (13).
Consideration needs to be given to the likely transportation of gravel and other sediments in to the storage area. Depending on the nature of the storage area and frequency of use it can be an expensive process to have to clean up material that has been washed in during periods when the storage area is used. To prevent gravel and other sediments getting washed in it may be necessary to consider including a gravel trap within or upstream of the inlet culvert.
Whether an inlet weir or inlet culvert is used consideration needs to be given to public safety. This is particularly relevant if the FSA’s ‘normal’ use is public open space, sports pitches or recreational parks. In these situations it is necessary to provide adequate signage (without causing alarm) and to ensure measures are in place to limit the velocity of the flow in areas where the public can access. It may also be necessary to install some CCTV such that the Undertakers can visually confirm that it is safe to allow the storage area to fill.
Outlet Structure (Offline FSA); offline FSA outlets tend to take the form of gravity outlets located at the low points. Some additional pumped

Achieving more: Operational flood storage areas and biodiversity. xi Final report (Appendices) - October 2009
method of emptying may also be included where it is not possible to empty the flood storage area via gravity.
The outlet culverts are generally sized to empty the FSA in a given time depending on the ‘normal’ use of the FSA, the perceived likelihood of further events and to ensure they do not increase the risk of downstream flooding. The culverts are designed in accordance with guidance(13). The culverts will often be fitted with a non return valve (flap valve) at the downstream end to prevent backflow of river water in to the FSA. The Undertakers may, in some circumstances, also want the inlet to the outlet gated so that there is a conscious decision/ action taken to empty the FSA.
The culverts are typically installed with pipe bedding and surround to allow them to withstand the load of the dam and potential traffic loading during construction and maintenance operations. Intermittent stanks through the pipe bedding and surround are included to prevent water being able to pass along/ through the pipe bedding and surround material.
An additional aspect the designers will need to consider is the settlement profile along the culvert ie the settlement may be greater under the centreline of the dam
Outlet Structure (Online FSA); the design of the outlet for an online FSA is particularly complex as it needs to pass the normal river flows so that the space is available in the FSA when it is needed, yet restrict flows once the river flow exceeds a certain amount. Furthermore the restricted flow needs to stay restricted under varying head conditions ie there is a design limit on what downstream flows the downstream river training structures can accommodate without being overtopped.
Generally outlets from online FSA’s take the form of culverts passing though the body of the dam. The culverts typically have pipe bedding and surround and intermittent stanks are installed to prevent water being able to pass along/ through the pipe bedding and surround. The culverts are generally designed in accordance with guidance(13), albeit that consideration needs to be given to providing man access for inspection purposes.
Care must be taken if the width of the river channel is increased upstream of the outlet as this will lead to a reduction in flow rate and result in sediment being deposited, out of suspension, and the area silting up. If the area does silt up it will require ongoing regular maintenance.

Achieving more: Operational flood storage areas and biodiversity. xii Final report (Appendices) - October 2009
Flow Control Device; flow control devices allow the water to flow through the culvert under normal conditions and once a certain flow is exceeded they slow the flow down thereby causing the water to back up and flood the storage area.
There are two general types of flow control device, the simplest is the orifice plate. When using orifice plates the culvert is sized slightly larger than is needed and the aperture reduced by a metal plate that is fitted over the inlet. The inclusion of the orifice plate allows for future alteration of the pass forward flow. The orifice plate limits how much water can be passed through the culvert but the flow rate is dependent on the driving head ie the orifice plate is sized to limit flows under maximum driving head.
A more efficient flow control device is one that causes the flow to vortex once it reaches a certain flow rate, as the flood storage area fills the driving head builds trying to force more water through which causes the water to vortex more. These flow control devices have the advantage of a uniform maximum downstream flow under varying head conditions and that the FSA remains empty until the flows start to vortex resulting in a more efficient use of the FSA.
FSA outlet with flow control device and screen
Spillway; under the Reservoirs Act 1975 all reservoirs have to have a spillway and be capable of passing a defined peak flow. ‘Floods and Reservoir Safety’ reference 1 provides guidance on the peak flow that must be accommodated but for the majority of FSA’s the peak flow will be the PMF flow.

Achieving more: Operational flood storage areas and biodiversity. xiii Final report (Appendices) - October 2009
The hydraulic model will provide the flows associated with a PMF event and the velocities associated with those flows. The model can be adjusted to determine the most efficient configuration of length of spillways, downstream shoulder gradient, split level spillways etc. Once the spillway velocity has been determined CIRIA 116(12) should be used to assess what slope protection is likely to be needed.
The spillway tailbay area i.e. the area at the base of the spillway downstream slope, will need to be designed to accommodate the hydraulic jump that will occur as the flow down the spillway meets the flat valley floor. Failure to provide suitable protection in this area will result in erosion of the toe which if left unchecked will result in undercutting and eventually in failure of the dam. Protection can take the form of buried reinforced concrete rafts with sacrificial coverings of topsoil and grass.
The area downstream of the spillway should also be reviewed to assess where spillway flows will go. If there are structures immediately downstream of the spillway then it may be necessary to create localised training structures to force the flood flows towards the river channel, such structures would generally take the form of small landscaped embankment.
FSA Online Dam and Spillway
Screens; screens may be provided to either keep debris out of the inlet and outlet culverts or to prevent access by unauthorised personnel ie security screens.
In there simplest form security screens can comprise vertical bars at uniform centres set in a frame and fastened to the headwall. However

Achieving more: Operational flood storage areas and biodiversity. xiv Final report (Appendices) - October 2009
when designing the screens consideration should be given to the need to provide access for authorised personnel ie will a gate be required, and the need to clear any debris that snags on the screen. When considering screen clearance it is essential to remember the lifting regulations, to consider how larger debris will be removed and to provide any necessary access routes to the area.
Trash screen for online FSA’s are often very large, due to the size of the culverts, and it can often be difficult to determine the best spatial arrangement particularly when vehicle access is included. In trying to accommodate the screen it can be necessary to increase the width of the channel which as noted earlier can lead to sediment being deposited.
Emergency draw down; it is generally good practice to include some provision for emergency drawdown which can be used in the event of the normal outlet mechanism failing eg through blockage of the culvert/ screens etc. This emergency draw down provision may take the form of a separate much smaller diameter culvert which is normally closed via a penstock but can be opened to allow water to bypass the screens and the upper section of the main outlet culvert. Alternatively the emergency drawdown provision may simply be provision for the installation of pumps so that the outlet can be over pumped.
Access arrangements; generally the Undertaker will require access to all parts of the dam for routine maintenance and inspection. In some cases this maintenance and inspection will require vehicular access and the designer will need to make provision for this in the design. Some examples of occasions where vehicular access will/ may be required are:
(a) Clearance of trash screens
(b) Clearance of river channel upstream of outlet
(c) Grass mowing for the embankment side slopes and crest
7 Reservoirs Act 1975
The 1975 Reservoirs Act requires all raised reservoirs (reservoirs capable of holding more than 25,000m3 of water above natural ground level) to be registered with the Environment Agency’s Reservoir Team in Exeter. The Reservoirs Act 1975 places a legal duty on the Undertakes to appoint a Supervising Engineer who will be responsible for the reservoir at all times and to get the reservoir inspected by an All Reservoir Panel Engineer at least every 10 years (unless the Supervising Engineer calls for one
Achieving more: Operational flood storage areas and biodiversity. xv Final report (Appendices) - October 2009
earlier). During the Inspection the All Reservoir Panel Engineer will identify the main elements that the Supervising Engineer should be monitoring and he may also identify ‘Measures in the Interest of Safety’ ie specific studies or maintenance that needs to be undertaken to ensure that the dam/ reservoir remains safe. The All Reservoir Panel Engineer will specify a timescale in which the ‘Measures’ need to be undertaken and this is legally binding.
The Reservoirs Act 1975 also calls for a Construction Engineer to be appointed who is responsible for overseeing the design, construction and initial period of operation of the reservoir. It is recommended that the Construction Engineer is appointed as early as possible, ideally at the outline design stage, so that nothing is missed as the design is worked up.
The Environment Agency are the enforcement authority for the Reservoirs Act in England and Wales.
The Floods and Water Bill is currently being progressed through parliament and if passed will see the minimum size of reservoirs requiring registration reduced to 10,000m3. This revised act may also modify the inspection requirements and means of classifying the Reservoirs.
Appendix B - References
1 Floods and Reservoir Safety, 3rd ed 1996 ICE) under the Reservoirs Act 1975,
2 BS EN 1997-1, 2004, Eurocode 7: Geotechnical design. Part 1: General rules; BS EN 1997-2, 2004, Eurocode 7: Geotechnical Design Part 2: Ground Investigation & Testing
3 Charles J A, Abbiss C P, Gosschalk C M, Hinks J L, 1991, An Engineering Guide to Seismic Risk to Dams in the United Kingdom, BRE Report 210,
4 ICE DETR, 1998, An Application Note to An Engineering Guide to Seismic Risk to Dams in the United Kingdom, Thomas Telford
5 (Johnston T A, Millmore J P, Charles J A, Tedd P, 1999, An Engineering Guide to the Safety of Embankment Dams in the United Kingdom, BRE Report 363

Achieving more: Operational flood storage areas and biodiversity. xvi Final report (Appendices) - October 2009
6 CedegrrenH.R., 1972, Seepage Control in earth dams, in Embankment Dam Engineering, Cassegrande Volume. RC. Hirschfeld & SJ Poulos (eds). Wiley;
7 Fell R, Macgregor P, Stapledon D, 1992, Geotechnical Engineering of Embankment Dams, Aa Balkema
8 Lambe T W, Whitman R V, 1979, Soil Mechanics SI version
9 Dyer M.R., Utili S., Zielinski M. (2009). "Field study into fine desiccation fissuring at Thorngumbald". ICE Proc. Water Management
10 Kennard M F, Hoskins C G, Fletcher M, 1996, Small Embankment Reservoirs, A comprehensive guide to the planning, design, construction and maintenance of small embankment reservoirs for water supply and amenity use, CIRIA Report 161;
11 Hall, M J, Hockin D L, Ellis J B’ 2000, Design of Flood Storage Reservoirs, CIRIA
12 Hewlett H W M, Boorman L A, Bramley M E, 1987, Design of reinforced grass waterways, CIRIA Report 116
13 Sewers for Adoption, a design and construction guide fro developers, 5th edition, 2001, WRC

Achieving more: Operational flood storage areas and biodiversity. xvii Final report (Appendices) - October 2009
Appendix C: Land Cover Map Habitat Definitions
Widespread Broad Habitat
type
Land Cover Map Habitat description Subclasses present FSA sites
1. Broad-leaved, mixed and yew woodland
Broad-leaved woodland in stands > 5 m high with tree-cover > 20%; or scrub < 5 m with cover > 30%. Mixed woodland is included if broadleaved trees in conifers cover > 20%. Stands ≥ 0.5 ha are mapped as separate blocks.
Broad-leaved/mixed woodland
2. Coniferous woodland
Coniferous woodland, semi-natural and plantations, with cover > 20%, and recently felled forestry. Once felled areas are colonised by rough grass, heath or scrub they take that class.
Coniferous woodland
3. Boundaries and linear features
Larger linear features such as shelter belts or motorways; smaller linear features (hedges, walls, smaller roads) are only recorded by the field survey.
None.
4. Arable and horticulture
Annual crops, recent leys, freshly ploughed land, rotational setaside, and perennial crops such as berries and orchards. Once setaside is substantially vegetated with weeds or rough grass, it is included in the Improved grassland Habitat.
Arable cereals Arable horticulture Arable non-rotational
5. Improved grassland
Improved grasslands in swards dominated by agriculturally ‘preferred’ species, generally ‘improved’ by reseeding and/or fertiliser treatment. May be used for agriculture or amenity. Fertile pastures with Juncus effusus are included. Setaside grass is included but, where possible, distinguished at the subclass level; abandoned or little-managed Improved grasslands may be confused with seminatural
Improved grassland Setaside grass
6. Neutral grassland
7. Calcareous grassland
8. Acid grassland
Acid, neutral and calcareous semi-natural swards are generally not reseeded or fertiliser-treated; they are dominated by lower productivity grasses, perhaps with many herbs. Grassland management may obscure distinctions from Improved grassland. Neutral, calcareous and acid components are distinguished at subclass level using a soil ‘acid sensitivity’ map. Pastures with Juncus effusus and with seminatural spectral-characteristics are included with acid swards.
Acid grassland Calcareous grass Neutral grass
9. Bracken The bracken Habitat is, at the height of the growing season, dominated by Pteridium aquilinum. Where images pre-date the late growing season, or where stands are dissected, bracken may
Bracken

Achieving more: Operational flood storage areas and biodiversity. xviii Final report (Appendices) - October 2009
be missed.
10. Dwarf shrub heath
Ericaceous species and gorse forming > 25% of plant cover; open and dense heaths are divided at subclass level. The Habitat includes wet and dry categories but ericaceous vegetation on peat ≥ 0.5 m deep is recorded as ‘bog’. In contrast, LCMGB 1990 used a definition based on presence of seasonal standing water.
Dense dwarf shrub heath Open dwarf shrub heath
11. Fen, marsh and swamp
Vegetation which is permanently, seasonally or periodically waterlogged. Swamps, fens and flushes are seldom extensive enough to map from satellite images. Rush pastures are more extensive. The category does not include fertile pastures with Juncus effusus.
Fen, marsh, swamp
12. Bog Bogs include ericaceous, herbaceous and mossy vegetation in areas with peat >0.5 m deep; ericaceous bogs are distinguished at subclass level. Inclusion of Ericaceous bogs contrasts with LCMGB 1990 where bogs were herbaceous or mossy in seasonal standing water.
Bog (deep peat)
13. Standing open water and canals
14. Rivers and streams
Water bodies ≥ 0.5 ha are mapped, but only the wider canals and rivers (>50 m) are shown. LCM2000 does not distinguish standing from flowing water.
Inland water
15. Montane Habitats
Prostrate dwarf heath, sedge and rush, moss heaths and snow bed communities. Limited access during field reconnaissance may limit the accuracy of distinctions.
None.
16. Inland rock Natural and man-made bare ground, including waste tips and quarries.
Inland bare ground
17. Built-up areas and gardens
Urban land, rural development, roads, railways, waste and derelict ground, including vegetated wasteland, gardens and urban trees. In LCM200, all larger areas of vegetation (≥ 0.5 ha) are identified as the appropriate cover class. Continuous urban and discontinuous suburban cover are distinguished at subclass level.
Continuous urban Suburban/rural development
18. Supra-littoral rock
19. Supra-
Supra-littoral Habitats, created by coastal processes of erosion and/or accretion, lie above mean high water spring tides; distinction used a maritime mask. Separation of rock and sediment was at subclass level, through spectral and interactive
Supra-littoral sediment

Achieving more: Operational flood storage areas and biodiversity. xix Final report (Appendices) - October 2009
littoral sediment processing.
20. Littoral rock
21. Littoral sediment
Littoral Habitats lie below mean high water spring tides in a zone defined by a maritime mask. Rocks and sediments were separated at subclass level by semi-interactive processing. Littoral rocks are generally limited in extent; sediments may be extensive. Saltmarsh is included with Littoral sediments, but as a separate subclass.
Littoral Sediment Saltmarsh
22. Inshore sublittoral sediment
Areas of sea and estuary are assumed to be inshore and with sublittoral sediment. Thus 23. Inshore sublittoral rock, 24. Offshore shelf sediment, 25. Offshore shelf rock, 26. Continental shelf slope and 27. Oceanic seas are not distinguished in LCM2000.
None.
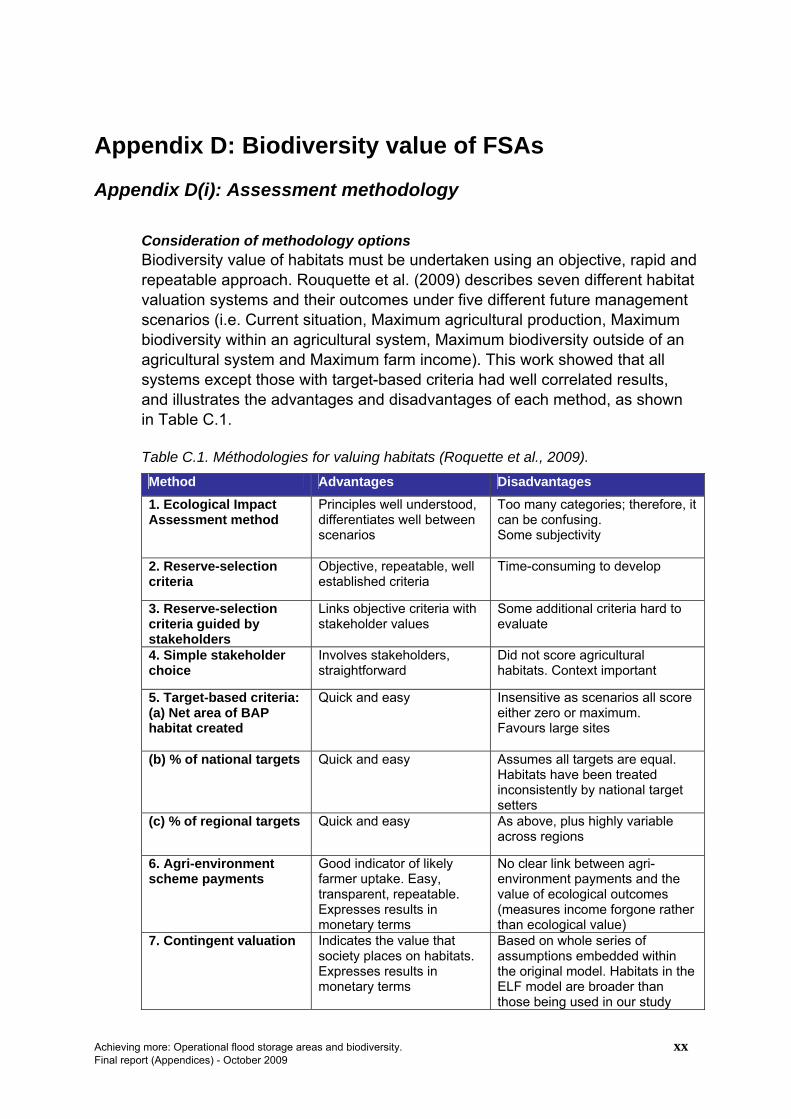
Achieving more: Operational flood storage areas and biodiversity. xx Final report (Appendices) - October 2009
Appendix D: Biodiversity value of FSAs
Appendix D(i): Assessment methodology
Consideration of methodology options Biodiversity value of habitats must be undertaken using an objective, rapid and repeatable approach. Rouquette et al. (2009) describes seven different habitat valuation systems and their outcomes under five different future management scenarios (i.e. Current situation, Maximum agricultural production, Maximum biodiversity within an agricultural system, Maximum biodiversity outside of an agricultural system and Maximum farm income). This work showed that all systems except those with target-based criteria had well correlated results, and illustrates the advantages and disadvantages of each method, as shown in Table C.1.
Table C.1. Méthodologies for valuing habitats (Roquette et al., 2009). Method Advantages Disadvantages 1. Ecological Impact Assessment method
Principles well understood, differentiates well between scenarios
Too many categories; therefore, it can be confusing. Some subjectivity
2. Reserve-selection criteria
Objective, repeatable, well established criteria
Time-consuming to develop
3. Reserve-selection criteria guided by stakeholders
Links objective criteria with stakeholder values
Some additional criteria hard to evaluate
4. Simple stakeholder choice
Involves stakeholders, straightforward
Did not score agricultural habitats. Context important
5. Target-based criteria: (a) Net area of BAP habitat created
Quick and easy Insensitive as scenarios all score either zero or maximum. Favours large sites
(b) % of national targets
Quick and easy Assumes all targets are equal. Habitats have been treated inconsistently by national target setters
(c) % of regional targets Quick and easy
As above, plus highly variable across regions
6. Agri-environment scheme payments
Good indicator of likely farmer uptake. Easy, transparent, repeatable. Expresses results in monetary terms
No clear link between agri-environment payments and the value of ecological outcomes (measures income forgone rather than ecological value)
7. Contingent valuation Indicates the value that society places on habitats. Expresses results in monetary terms
Based on whole series of assumptions embedded within the original model. Habitats in the ELF model are broader than those being used in our study
Achieving more: Operational flood storage areas and biodiversity. xxi Final report (Appendices) - October 2009
The study also indicated that the choice of method depends upon the type of valuation required, and that the outcomes of the method depend upon assumptions made.
The requirements of the current study are for:
Biodiversity value outputs Rapid valuation Repeatability/objectivity Differentiation between scenarios (to identify advantages of a fully
integrated approach) Availability of data required for valuation.
Each of the methods in Table C.1 was assessed against the project requirements:
Valuations involving stakeholders (3 and 4) were discounted due to the subjectivity of the method and time that would be involved in assessing all FASs.
Method 5 was discounted due to an inherent lack of sensitivity and inconsistencies.
Method 2 was discounted due to it being time consuming and the lack of availability of data required.
Method 6 does not provide the biodiversity value of the site, only monies forgone and is not appropriate for achieving the aims of this project.
Method 7 is based on assumptions and the outputs (value that society puts on biodiversity) are not appropriate.
This leaves method 1, the Environmental Impact Assessment method, as the most appropriate for the current study.
Selected Methodology Although the Environmental Impact Assessment method has been identified as the most appropriate for this study, it has associated disadvantages in the number of categories and some subjectivity in application. Therefore the methodology has been altered to resolve these issues and increase the suitability for this study by (a) limiting categories to international, national, UK BAP (combining with a target-based method) and lower value sites, and (b) to reduce subjectivity by using a simplified predetermined methodology and clearly stating assumptions, as provided in Table C.2.

Achieving more: Operational flood storage areas and biodiversity. xxii Final report (Appendices) - October 2009
Table C.2. Qualifying features and biodiversity values to be attributed (www.ukbap.org.uk).
Attribute Value Provisional list of habitats Assumptions SPA (including potential)
International n/a (designation - not habitat based)
Assumed to be in favourable condition*.
SAC (including candidate)
International n/a (designation - not habitat based)
Assumed to be in favourable condition*.
Ramsar (including proposed)
International n/a (designation - not habitat based)
Assumed to support same features as at designation proposal (vast majority are SSSI or European sites)
SSSI (including all national nature reserves)
National n/a (designation – not habitat based)
Assumed to be in favourable condition*.
UK BAP Priority Habitat
UK BAP Aquifer Fed Naturally Fluctuating Water Bodies Arable Field Margins Blanket Bog Blue mussel beds Calaminarian Grasslands Carbonate mounds Coastal and Floodplain Grazing Marsh Coastal saltmarsh Coastal Sand Dunes Coastal Vegetated Shingle Cold-water coral reefs Deep-sea sponge communities Estuarine rocky habitats Eutrophic Standing Waters File shell beds Fragile sponge & anthozoan communities on subtidal rocky habitats Hedgerows Horse mussel beds Inland Rock Outcrop and Scree Habitats Intertidal chalk
Following IEEM EIA Guidelines, the status as a priority habitat type does not imply any specific level of ecological value (see ** below). However the BAP habitats are all of value in terms of contributing to targets, and will therefore be valued as high but sub-national unless specifically designated.

Achieving more: Operational flood storage areas and biodiversity. xxiii Final report (Appendices) - October 2009
Attribute Value Provisional list of habitats Assumptions Intertidal mudflats Intertidal underboulder communities Limestone Pavements Lowland Beech and Yew Woodland Lowland Calcareous Grassland Lowland Dry Acid Grassland Lowland Fens Lowland Heathland Lowland Meadows Lowland Mixed Deciduous Woodland Lowland Raised Bog Machair Maerl beds Maritime Cliff and Slopes Mesotrophic Lakes Mountain Heaths and Willow Scrub Mud habitats in deep water Native Pine Woodlands Oligotrophic and Dystrophic Lakes Open Mosaic Habitats on Previously Developed Land Peat and clay exposures Ponds Purple Moor Grass and Rush Pastures Reedbeds Rivers Sabellaria alveolata reefs Sabellaria spinulosa reefs Saline lagoons Seagrass beds Seamount communities Serpulid reefs Sheltered muddy gravels Subtidal chalk Subtidal sands and gravels Tide-swept channels Traditional Orchards

Achieving more: Operational flood storage areas and biodiversity. xxiv Final report (Appendices) - October 2009
Attribute Value Provisional list of habitats Assumptions Upland Birchwoods Upland Calcareous Grassland Upland Flushes, Fens and Swamps Upland Hay Meadows Upland Heathland Upland Mixed Ashwoods Upland Oakwood Wet Woodland Wood-Pasture & Parkland
Undesignated and non-UK BAP habitat.
Lower value e.g. improved grassland, semi-improved grassland, arable.
Assumes that all land not included in UK BAP habitats dataset is currently of sub-priority habitat value.
* The designation of a site does not guarantee that the site is of international or national value, since the site may not currently be in favourable condition. However it is assumed that the site has the potential to achieve favourable condition and therefore the geographic value of the designation status.
** IEEM EIA Guidelines:
“3.26 - The purpose of Habitat Action Plans (HAPs) is to guide conservation action for the habitats concerned. That a HAP has been prepared should simply reflect the fact that the habitat concerned is in a sub-optimal state (and hence that action is required). It does not imply - and was never intended to imply - any specific level of value for the habitat. The value of any area of habitat covered by a HAP should therefore be determined on the basis of its intrinsic characteristics using the same approach as with other habitats.
3.27 - The only exception to this should be where a HAP states that all areas of a particular habitat should be protected, as is often the case for priority habitats. In such cases, ecologists may decide that it is appropriate to treat applicable areas as being important at the level of the BAP in question. For example, if a county BAP identifies an action to protect all areas of a particular habitat (where there is no similar recommendation in the UK, national or regional BAP), each area could be considered to be of county importance. It should be noted that some BAPs do not qualify their recommendations about specific habitats, for example in relation to the size of habitat areas. Some interpretation may be needed to avoid obvious anomalies, for example, it may be inappropriate to classify a small patch of reedbed within a gravel pit as of county importance just because a county BAP action proposes the protection of all reedbeds.”

Achieving more: Operational flood storage areas and biodiversity. xxv Final report (Appendices) - October 2009
Appendix D (ii) Biodiversity value of specific FSAs
The following table provides a breakdown of where specific FSAs contain habitats of international, national or UK BAP value.
Designation FSA Asset Ref Ramsar SAC SPA SSSI
UK BAP Habitats
Value
3310319901 UK BAP
3310319902 UK BAP
1.11284E+14 UK BAP
1.11274E+15 UK BAP
01103DURR0101FS UK BAP
01104WLSP0101FS UK BAP
01209WYRE0001FS UK BAP
01210SAVI0001FS UK BAP
01317DIDS0101_DIDS_FSA
UK BAP
01317MERS0203_SALE_FSA
UK BAP
01319RGOW0301_GOWY_FSA
UK BAP
01322KECK0101_KECKWICK2_FSA
UK BAP
01323ATHL0101_LILFORD_FSA
UK BAP
0310312650801B01 Stourvale Marsh
National
0310422250701CFSA1
UK BAP
0310622380704BFSA1
UK BAP
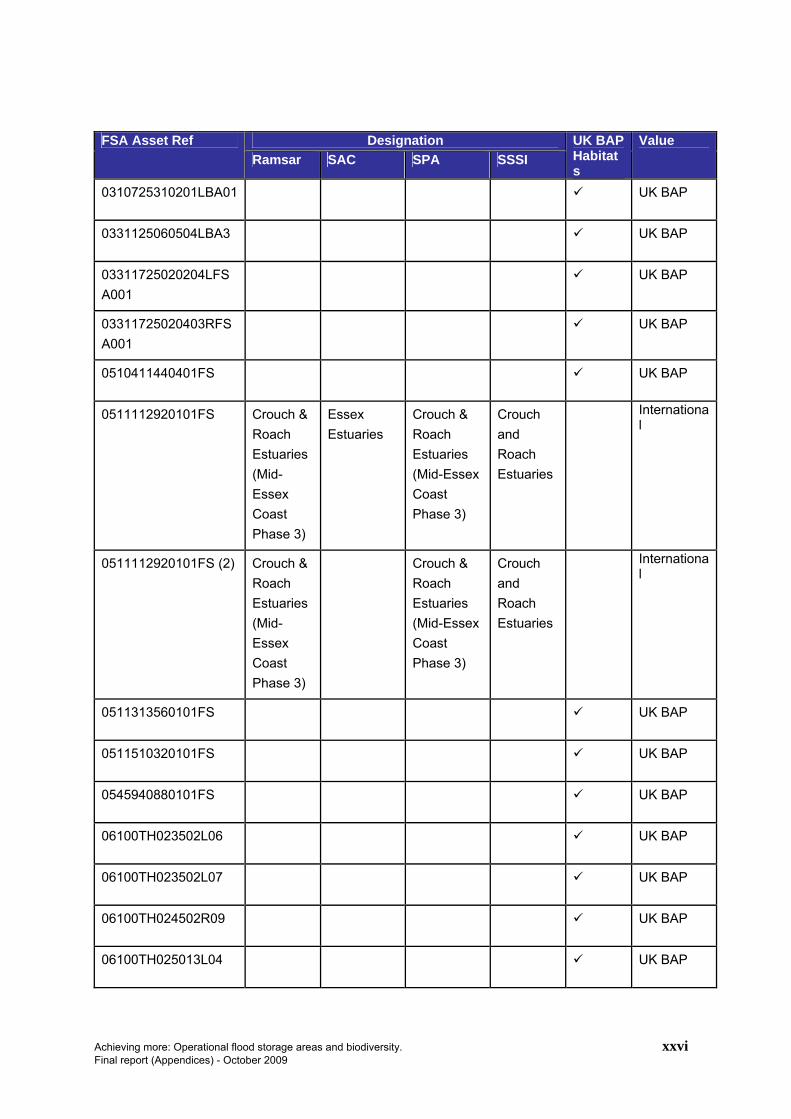
Achieving more: Operational flood storage areas and biodiversity. xxvi Final report (Appendices) - October 2009
Designation FSA Asset Ref Ramsar SAC SPA SSSI
UK BAP Habitats
Value
0310725310201LBA01 UK BAP
0331125060504LBA3 UK BAP
03311725020204LFSA001
UK BAP
03311725020403RFSA001
UK BAP
0510411440401FS UK BAP
0511112920101FS Crouch & Roach Estuaries (Mid-Essex Coast Phase 3)
Essex Estuaries
Crouch & Roach Estuaries (Mid-Essex Coast Phase 3)
Crouch and Roach Estuaries
International
0511112920101FS (2) Crouch & Roach Estuaries (Mid-Essex Coast Phase 3)
Crouch & Roach Estuaries (Mid-Essex Coast Phase 3)
Crouch and Roach Estuaries
International
0511313560101FS UK BAP
0511510320101FS UK BAP
0545940880101FS UK BAP
06100TH023502L06 UK BAP
06100TH023502L07 UK BAP
06100TH024502R09 UK BAP
06100TH025013L04 UK BAP

Achieving more: Operational flood storage areas and biodiversity. xxvii Final report (Appendices) - October 2009
Designation FSA Asset Ref Ramsar SAC SPA SSSI
UK BAP Habitats
Value
06100TH026201L05 UK BAP
06100TH026301L08 UK BAP
06100TH026401L06 UK BAP
06100TH026411R10 UK BAP
06100TH026411R16 Cotswold Water Park
National
0610303LY0101R02 UK BAP
0610303SW0102R07 UK BAP
0610707do02r01 UK BAP
0610707TU0201R01 UK BAP
0611010WI0901R11 UK BAP
0611212GL0102R02 Blenheim Park
National
0611414CH0302R03 UK BAP
0611414HI0202L02 UK BAP
0611414MB0101R02 UK BAP
0611414RA0102L02 UK BAP
0611616HI0101R05 UK BAP
0611616HI0102R03 UK BAP
0611919CU0232R02 UK BAP
0612222KE1214L01 UK BAP

Achieving more: Operational flood storage areas and biodiversity. xxviii Final report (Appendices) - October 2009
Designation FSA Asset Ref Ramsar SAC SPA SSSI
UK BAP Habitats
Value
0622828CO0302R03 UK BAP
0622828CO0502L02 Mid Colne Valley
National
0622828CO0603L07 UK BAP
0622828NY0101R03 UK BAP
0622828NY0103R03 Ruislip Woods
National
0623636CR0107R07 UK BAP
0623636YB0102R02 UK BAP
0623636YB0201R03 UK BAP
0623838ED0106R08 Bentley Priory
National
0624646LE0102L02 Lee Valley
Lee Valley Rye Meads
International
0625151SB0103L03 UK BAP
0625151SP0103R02 UK BAP
0625151ST0152L04 Lee Valley
Lee Valley Rye Meads
International
0625151ST0152L07 Lee Valley
Lee Valley Rye Meads
International
0625151ST0152R05 Lee Valley
Lee Valley Rye Meads
International
0625151ST0152R06 Lee Valley
Lee Valley Rye Meads
International
0625151ST0152R08 Lee Valley
Lee Valley Rye Meads
International

Achieving more: Operational flood storage areas and biodiversity. xxix Final report (Appendices) - October 2009
Designation FSA Asset Ref Ramsar SAC SPA SSSI
UK BAP Habitats
Value
0625151ST0304R05 Thorley Flood Pound
National
0625353HF0102R04 UK BAP
0625353ND0103R03 UK BAP
0625353ND0103R04 UK BAP
0625353TH0103R04 UK BAP
0625454CR0303R07 Epping Forest
National
0625454LO0201R09 Epping Forest
Epping Forest
International
0625555IN0101R04 Ingrebourne Marshes
National
0625555IN0102R02 Ingrebourne Marshes
National
06300TH012002R06 UK BAP
06300TH012012R07 South West London Waterbodies
South West London Waterbodies
Thorpe Park No. 1 Gravel Pit
International
06300TH012201L10 Wraysbury & Hythe End Gravel Pits
National
06300TH012202L06 South West London Waterbodi
South West London Waterbodies
Wraysbury & Hythe End Gravel
International

Achieving more: Operational flood storage areas and biodiversity. xxx Final report (Appendices) - October 2009
Designation FSA Asset Ref Ramsar SAC SPA SSSI
UK BAP Habitats
Value
es Pits
06300TH012202L08 South West London Waterbodies
South West London Waterbodies
Wraysbury No. 1 Gravel Pit
International
06300TH012802R05 UK BAP
06300TH012803R06 UK BAP
06322424BO0201R03 UK BAP
0632424BL0103L02 Thames Basin Heaths
Bramshill International
0632424BL0302L02 UK BAP
0632424BL0302L03 UK BAP
0632424BL0302L10 UK BAP
0632424BL0302R02 UK BAP
0632424BL0302R07 UK BAP
0632424BL0401R05 UK BAP
0632424BL0402L03 UK BAP
0632424BL0402L04 UK BAP
0632424BL0501R16 UK BAP
0632424BL0502R08 UK BAP
0632424BL0601R06 UK BAP
0632424BL0602L02 UK BAP

Achieving more: Operational flood storage areas and biodiversity. xxxi Final report (Appendices) - October 2009
Designation FSA Asset Ref Ramsar SAC SPA SSSI
UK BAP Habitats
Value
0632424BL0602L04 UK BAP
0632424BL0602R13 UK BAP
0632424BL0602R14 UK BAP
0632424BL0602R23 UK BAP
0632424BO0101L03 UK BAP
0632424BO0201R02 UK BAP
0632424LO0103L02 UK BAP
0632727BD0103001 Windsor Forest & Great Park
Windsor Forest & Great Park
International
06327FSA01 UK BAP
0633030MB0203R09 UK BAP
0633030WE1402R03 UK BAP
0633030WE1501 UK BAP
0633030WN0601001 UK BAP
0633232BF0101R08 UK BAP
0633232CB0102R04 UK BAP
0633232GW0202L04 UK BAP
0633232RY0204R04 Epsom & Ashtead Commons
National
0633232TI0302R04 UK BAP

Achieving more: Operational flood storage areas and biodiversity. xxxii Final report (Appendices) - October 2009
Designation FSA Asset Ref Ramsar SAC SPA SSSI
UK BAP Habitats
Value
07 304C2001101_fsa001
UK BAP
07 311A2001001_fsa002
UK BAP
07 311A3000401_fsa003
UK BAP
07128S527_FSA036 UK BAP
07128S5390102_FSA040(1)
UK BAP
07130S1800102_FSA047
UK BAP
07130S4500101_FSA030
Botley Wood & Everett’s & Mushes Copses
National
07130S6100103_FSA027
UK BAP
07130S6500102_FSA028
UK BAP
07131R030_FSA048 UK BAP
07131R2900102_FSA020
UK BAP
07133R3900203_FSA010
UK BAP
07135030R0101_FSA006
UK BAP
07135R03003_FSA041
Highcliffe to Milford Cliffs
National
07135R0300305_FSA_004
UK BAP
07135R0300401_FSA UK BAP

Achieving more: Operational flood storage areas and biodiversity. xxxiii Final report (Appendices) - October 2009
Designation FSA Asset Ref Ramsar SAC SPA SSSI
UK BAP Habitats
Value
_005
101010032FSA01 UK BAP
101010056FAS01 UK BAP
11221FSA001 Somerset Levels & Moors
Somerset Levels & Moors
Curry & May Moors
International
11223FSA001 Biddle Street, Yatton
National
11223FSA002 UK BAP
11224FSA001 Cogley Wood
National
11224FSA003 UK BAP
11225FSA001 UK BAP
11225FSA002 UK BAP
11225FSA003 Somerset Levels & Moors
Somerset Levels & Moors
Southlake Moor
International
11225FSA004 UK BAP
11225FSA005 Somerset Levels & Moors
Somerset Levels & Moors
Kings Sedgemoor
International
11225FSA006 UK BAP
11225FSA007 Somerset Levels & Moors
Somerset Levels & Moors
Wet Moor International
11225FSA008 Somerset Levels &
Somerset Levels &
Wet Moor International

Achieving more: Operational flood storage areas and biodiversity. xxxiv Final report (Appendices) - October 2009
Designation FSA Asset Ref Ramsar SAC SPA SSSI
UK BAP Habitats
Value
Moors Moors
11225FSA009 UK BAP
11225FSA010 Somerset Levels & Moors
Somerset Levels & Moors
West Moor
International
11230FSA001 UK BAP
112GF22200101CFSA01
UK BAP
112GF22200101CFSA02
UK BAP
114037101/Idless Dam
UK BAP
114053224/Tywardreath Dam
UK BAP
114053324/Treesmill Dam
UK BAP
Crowland/Cowbit Washes
Cowbit Wash
National
EA0521050601L01 Ouse Washes
Ouse Washes
Ouse Washes
Ouse Washes
International
EA0521070301L01 River Nar National
EA0521290101R01 Wicken Fen
Fenland Wicken Fen
International
EA0522010101R01 UK BAP
EA0522140201L01 UK BAP
EA113FSA00003 UK BAP
EA113FSA00006 Exe Estuary
Exe Estuary
Exe Estuary
International
EA113FSA00007 Exe Exe Exe Internationa

Achieving more: Operational flood storage areas and biodiversity. xxxv Final report (Appendices) - October 2009
Designation FSA Asset Ref Ramsar SAC SPA SSSI
UK BAP Habitats
Value
Estuary Estuary Estuary l
EA113FSA00020 UK BAP
EA113FSA00025 UK BAP
EA1231102670101R80
UK BAP
EA1231102670201L80 UK BAP
EA1231102670201R80
UK BAP
EA1231102670401L80 UK BAP
EA1231102670701L80 UK BAP
EA1231102670701R80
UK BAP
EA1231102671201L80 Fairburn & Newton Ings
National
EA1231102671201L81 Fairburn & Newton Ings
National
EA1231102671301L80 UK BAP
EA1231102671301R80
Mickletown Ings
National
EA1231102671401L80 UK BAP
EA1231102672201L80 UK BAP
EA1231102672201R81
UK BAP
EA1231102672301L80 UK BAP
EA1231102672301R8 UK BAP

Achieving more: Operational flood storage areas and biodiversity. xxxvi Final report (Appendices) - October 2009
Designation FSA Asset Ref Ramsar SAC SPA SSSI
UK BAP Habitats
Value
1
EA1231102672801L80 UK BAP
EA1231202700601R82
UK BAP
Ea1231202701402L80 UK BAP
EA1231202701502R80
UK BAP
EA1231202701502R81
UK BAP
EA1231202701601R80
UK BAP
Ea1231202701801R80
UK BAP
EA1231302520601L80 UK BAP
EA1231302520601L81 UK BAP
EA1231302520701L82 UK BAP
EA1231302520701R80
UK BAP
EA1231302520801L80 Sprotbrough Gorge
National
EA1231302520801L81 Sprotbrough Gorge
National
EA1231302520801L82 Sprotbrough Gorge
National
EA1231302520801L83 UK BAP
EA1231302520801R80
Sprotbrough Gorge
National
EA1231302520801R81
UK BAP

Achieving more: Operational flood storage areas and biodiversity. xxxvii Final report (Appendices) - October 2009
Designation FSA Asset Ref Ramsar SAC SPA SSSI
UK BAP Habitats
Value
EA1231302520901L83 UK BAP
EA1231302520901R84
UK BAP
EA1231302550101R80
UK BAP
EA1231302560101L80 Denaby Ings
National
EA1231302560101L81 UK BAP
EA1231302560101R80
UK BAP
EA1231302560201R81
UK BAP
EA1231302560201R84
UK BAP
EA1231302560201R85
UK BAP
EA1231302560301R83
UK BAP
EA1231302560401R80
UK BAP
EA1231302560501L81 UK BAP
EA1231302560501R80
UK BAP
EA1231302620201L81 UK BAP
EA1231302620201R81
UK BAP
EA1231302620201R82
UK BAP
EA1231302620201R83
UK BAP

Achieving more: Operational flood storage areas and biodiversity. xxxviii Final report (Appendices) - October 2009
Designation FSA Asset Ref Ramsar SAC SPA SSSI
UK BAP Habitats
Value
EA1231302620301R80
UK BAP
EA1231302620301R81
UK BAP
EA1231302620401L80 UK BAP
EA1231302620401R83
UK BAP
EA1231302620601L82 UK BAP
EA1231302650101R81
UK BAP
EA1231305251001R80
UK BAP
EA1232102490101L80 UK BAP
Grimsby Flood Storage Area
UK BAP
Hardingstone Dyke FSR
Upper Nene Valley Gravel Pits
National
Northampton Washlands
Upper Nene Valley Gravel Pits
National
Whittlesey Washes Nene Washes
Nene Washes
Nene Washes
Bassenhally Pit
International
Witham Washlands UK BAP

Achieving more: Operational flood storage areas and biodiversity. xxxix Final report (Appendices) - October 2009
Appendix D (iii): Associated species populations and groups
The following table shows species populations and groups that are listed as features of importance on citations for designated sites (*species of international importance only have been included for Ramsar sites).
FSA Asset Ref Designations Species Groups*
Stourvale Marsh SSSI Wetland plants Passerine birds e.g. reed bunting and sedge warbler Invertebrates including dragonflies
0310312650801B01
Puxton Marsh SSSI Fen plants Wetland plants Wading birds Passeine birds e.g. Willow tit and reed bunting
Crouch & Roach Estuaries (Mid-Essex Coast Phase 3) Ramsar Site
Wildfowl - Dark-bellied brent goose
Essex Estuaries SAC n/a Crouch & Roach Estuaries (Mid-Essex Coast Phase 3) SPA
Wildfowl - Dark-bellied brent goose Raptors – Hen harriers
0511112920101FS
Crouch & Roach Estuaries SSSI
Saltmarsh and grazing marsh plants Aquatic plants Terrestrial invertebrates including Roesel’s Bush-cricket, soldier flies, moths, shorefly, large horsefly and beetles. Aquatic/wetland invertebrates e.g. water beetle, ruddy darter dragonfly, emerald damselfly. Ground-nesting birds – e.g. skylark Terrestrial passerine birds – e.g. corn bunting Waders and wildfowl Raptors – short-eared owl, hen harrier, merlin, barn owl.
06100TH026411R16
Cotswold Water Park SSSI
Aquatic plants including bearded stonewort.
0611212GL0102R02
Blenheim Park SSSI Ancient oaks and ancient woodland plant species. Saprophytic invertebrates Wildfowl including gadwall. Waders
0622828CO0502L02
Mid Colne Valley SSSI Woodland birds Wetland birds including wildfowl, waders and kingfisher

Achieving more: Operational flood storage areas and biodiversity. xl Final report (Appendices) - October 2009
FSA Asset Ref Designations Species Groups*
Chalk grassland and chalk woodland plants Wetland plant species.
0623636CR0107R07
Ruislip Woods SSSI Woodland plants Wetland plants Heathland and acid grassland plants Woodland insects including moths, beetles and soldier flies. Woodland birds
0623838ED0106R08
Bentley Priory SSSI Meadow plants Scrub plant species including glaucous dog-rose Ancient woodland plants Wetland/emergent plants Woodland birds including woodpeckers and hawfinch
Lee Valley Ramsar Site Northern shoveler Gadwall
Lee Valley SPA Northern shoveler Gadwall Bittern
0625151ST0152R05
Rye Meads SSSI Fen and meadow plants Wildfowl and waders Other wetland birds including bearded tit and common tern.
Lee Valley Ramsar Site Northern shoveler Gadwall
Lee Valley SPA Northern shoveler Gadwall Bittern
0625151ST0152R08
Rye Meads SSSI Fen and meadow plants Wildfowl and waders Other wetland birds including bearded tit and common tern.
0625151ST0304R05
Thorley Flood Pound SSSI
Washland and grassland plants Waders, wildfowl and other ground-nesting birds
0625454CR0303R07
Epping Forest SSSI Woodland plants Wet heathland plants Wetland plants Saprophytic/rot hole woodland invertebrates Bracket fungi invertebrates Wetland/semi-aquatic invertebrates Amphibians Reptiles Bryophytes

Achieving more: Operational flood storage areas and biodiversity. xli Final report (Appendices) - October 2009
FSA Asset Ref Designations Species Groups*
Fungi Woodland birds
0625454LO0201R09
Epping Forest SSSI Woodland plants Wet heathland plants Wetland plants Saprophytic/rot hole woodland invertebrates Bracket fungi invertebrates Wetland/semi-aquatic invertebrates Amphibians Reptiles Bryophytes Fungi Woodland birds
0625454MA0102R04
Epping Forest SAC Stag beetle (terrestrial invertebrate)
0625555IN0101R04
Ingrebourne Marshes SSSI
Marsh plants Wetland invertebrates Waders and wildfowl Other birds e.g. reed bunting, reed warbler, sedge warbler, cuckoos and kingfisher
0625555IN0102R02
Ingrebourne Marshes SSSI
Marsh plants Wetland invertebrates Waders and wildfowl Other birds e.g. reed bunting, reed warbler, sedge warbler, cuckoos and kingfisher
South West London Waterbodies Ramsar Site
Northern shoveler Gadwall
South West London Waterbodies SPA
Northern shoveler Gadwall
06300TH012012R07
Thorpe Park No. 1 Gravel Pit SSSI
Wildfowl
South West London Waterbodies Ramsar Site
Northern shoveler Gadwall
South West London Waterbodies SPA
Northern shoveler Gadwall
06300TH012202L06
Wraysbury & Hythe End Gravel Pits SSSI
Wetland plants including pondweeds and trifid bur-marigold Wildfowl Wetland birds Invertebrates

Achieving more: Operational flood storage areas and biodiversity. xlii Final report (Appendices) - October 2009
FSA Asset Ref Designations Species Groups*
South West London Waterbodies Ramsar Site
Northern shoveler Gadwall
South West London Waterbodies SPA
Northern shoveler Gadwall
06300TH012202L08
Wraysbury No. 1 Gravel Pit SSSI
Wildfowl Woodland birds
Thames Basin Heaths SPA
European nightjar Woodlark Dartford warbler
0632424BL0103L02
Bramshill SSSI Wetland invertebrates including dragonflies and damselflies Woodland birds Wetland plants Heathland plants
Windsor Forest & Great Park SAC
Violet Click Beetle (terrestrial invertebrate) 0632727BD0103001
Windsor Forest & Great Park SSSI
Woodland invertebrates Fungi Acid grassland plants Wildfowl
0633232RY0204R04
Epsom & Ashtead Commons SSSI
Invertebrates Birds including grasshopper warbler and lesser whitethroat Wetland plants Wetland birds Dead wood invertebrates Purple emperor and purple hairstreak butterflies
07130S4500101_FSA030
Botley Wood & Everett's & Mushes Copses SSSI
Woodland invertebrates including butterflies, bush crickets and giant lacewing Woodland birds Woodland plants
07135R03003_FSA041
Highcliffe to Milford Cliffs SSSI
Beetles Cranefly
Somerset Levels & Moors Ramsar Site
Tundra (Bewick) swan Eurasian teal Northern lapwing
Somerset Levels & Moors SPA
Eurasian teal Tundra (Bewick) swan Golden plover Lapwing
11221FSA001
Curry & Hay Moors Meadow plants

Achieving more: Operational flood storage areas and biodiversity. xliii Final report (Appendices) - October 2009
FSA Asset Ref Designations Species Groups*
SSSI Wetland plants Wetland invertebrates including soldierflies and water beetles. Wildfowl and waders Raptors Other birds including whinchat and grasshopper warbler
11223FSA001 Biddle Street, Yatton SSSI
Aquatic plants Wetland plants Wetland invertebrates Aquatic molluscs
11224FSA001 Cogley Wood SSSI Ancient woodland plants Butterflies
Somerset Levels & Moors Ramsar Site
Tundra (Bewick) swan Eurasian teal Northern lapwing
Somerset Levels & Moors SPA
Eurasian teal Tundra (Bewick) swan Golden plover Northern lapwing
11225FSA003
Southlake Moor SSSI Wet grassland plants Wetland plants Aquatic invertebrates Molluscs Terrestrial invertebrates including soldier flies Wildfowl and waders
Somerset Levels & Moors Ramsar Site
Tundra (Bewick) swan Eurasian teal Northern lapwing
Somerset Levels & Moors SPA
Eurasian teal Tundra (Bewick) swan Golden plover Northern lapwing
11225FSA005
Kings Sedgemoor SSSI Wet grassland plants Wetland and aquatic plants Wetland invertebrates Wildfowl and waders
Somerset Levels & Moors Ramsar Site
Tundra (Bewick) swan Eurasian teal Northern lapwing
11225FSA007
Somerset Levels & Moors SPA
Eurasian teal Tundra (Bewick) swan

Achieving more: Operational flood storage areas and biodiversity. xliv Final report (Appendices) - October 2009
FSA Asset Ref Designations Species Groups*
Golden plover Northern lapwing
Wet Moor SSSI Wet grassland plants Wetland and aquatic plants Wetland and aquatic invertebrates Terrestrial beetles Wildfowl and waders Other birds including short-eared owl, whinchat and reed bunting
Somerset Levels & Moors Ramsar Site
Tundra (Bewick) swan Eurasian teal Northern lapwing
Somerset Levels & Moors SPA
Eurasian teal Tundra (Bewick) swan Golden plover Northern lapwing
11225FSA010
West Moor SSSI Wet grassland plants Wetland and aquatic plants Wetland and aquatic invertebrates Wildfowl and waders Other birds including reed bunting, sedge warbler, whinchat and yellow wagtail
11230FSA003 Nene Washes SPA Northern pintail Northern shoveler Eurasian teal Eurasian wigean Garganey Gadwall Tundra (Bewick) swan Northern lapwing
Crowland/Cowbit Washes
Cowbit Wash SSSI -
Ouse Washes Ramsar Site
Tundra (Bewick) swan Whooper swan Eurasian wigeon Gadwall Eurasian teal Northern pintail Northern shoveler
Ouse Washes SAC Spined Loach (fish)
EA0521050601L01
Ouse Washes SPA Northern pintail Northern shoveler

Achieving more: Operational flood storage areas and biodiversity. xlv Final report (Appendices) - October 2009
FSA Asset Ref Designations Species Groups*
Eurasian teal Eurasian wigeon Mallard Garganey Gadwall Pochard Tufted duck Tundra (Bewick) swan Whooper swan Mute swan Eurasian coot Black-tailed godwit Cormorant Ruff Hen harrier
Ouse Washes SSSI Wildfowl and waders Wetland and aquatic plants
EA0521070301L01
River Nar SSSI Wetland plants Riparian and aquatic plants Fish Wading birds and grasshopper warbler
Wicken Fen Ramsar Site
n/a
Fenland SAC Spined loach (fish) Great crested newt (amphibian)
EA0521290101R01
Wicken Fen SSSI Fen plants Aquatic and wetland plants Wildfowl and waders
Exe Estuary Ramsar Site
Dark-bellied brent goose
Exe Estuary SPA Dark-bellied brent goose Dunlin Oystercatcher Black-tailed godwit (Islandic race) Grey plover Slavonian grebe Avocette
EA113FSA00006
Exe Estuary SSSI Wildfowl and waders Warblers Estuarine invertebrates Wetland plants Dragonflies

Achieving more: Operational flood storage areas and biodiversity. xlvi Final report (Appendices) - October 2009
FSA Asset Ref Designations Species Groups*
EA1231102671201L80
Fairburn & Newton Ings SSSI
Wetland and aquatic plants Wildfowl Raptors Butterflies
EA1231102671301R80
Mickletown Ings SSSI Aquatic plants Wetland invertebrates (flies, beetles, brackish crustaceans, hoverflies, moths. Wildfowl Reed warbler
EA1231302520801L80
Sprotbrough Gorge SSSI
Ancient woodland plants Woodland invertebrates Wildfowl Aquatic plants Calcareous plants
EA1231302520801L82
Sprotbrough Gorge SSSI
Ancient woodland plants Woodland invertebrates Wildfowl Aquatic plants Calcareous plants
EA1231302520801R80
Sprotbrough Gorge SSSI
Ancient woodland plants Woodland invertebrates Wildfowl Aquatic plants Calcareous plants
EA1231302560101L80
Denaby Ings SSSI Wetland plants Wildfowl, waders and riparian birds Wetland invertebrates
Hardingstone Dyke FSR
Upper Nene Valley Gravel Pits SSSI
Wildfowl and waders Other riparian birds
Nene Washes Ramsar Site
Tundra (Bewick) swan
Nene Washes SAC Spined loach (fish) Nene Washes (Whittlesey) SSSI
Wetland plants Wildfowl and waders
Whittlesey Washes
Bassenhally Pit SSSI Wetland plants

Would you like to find out more about us, or about your environment? Then call us on 08708 506 506* (Mon-Fri 8-6) email [email protected] or visit our website www.environment-agency.gov.uk incident hotline 0800 80 70 60 (24hrs) floodline 0845 988 1188 * Approximate calls costs: 8p plus 6p per minute (standard landline). Please note charges will vary across telephone providers
Environment first: This publication is printed on paper made from 100 per cent previously used waste. By-products from making the pulp and paper are used for composting and fertiliser, for making cement and for generating energy. GEHO0610BSOA-E-E